Embed Size (px)
DESCRIPTION
Moving averages,envelopes & Bollinger presentation.ppt
Citation preview

Moving Averages :
1- three types of moving averages : Simple MA , Weighted MA and Exponential MA
2- MA is a trend following device or it’s a lagging indicator, NOT a leader 3- they work best when a security is trending and are ineffective when a
security moves in a trading range 4- Double Cross Over method 5- Triple Cross Over method ( 4 , 9 and 18 ) ( 5 , 10 and 20 ) 6- Moving Averages work as a support / resistance
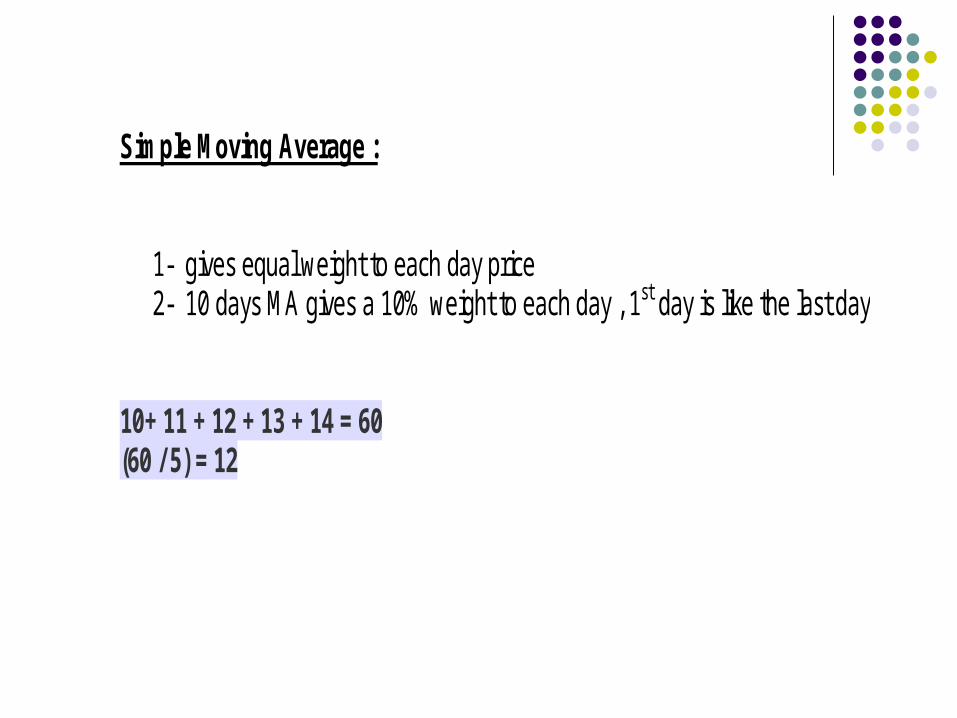
Simple Moving Average :
1- gives equal weight to each day price 2- 10 days MA gives a 10% weight to each day , 1st day is like the last day
10+ 11 + 12 + 13 + 14 = 60 (60 / 5) = 12
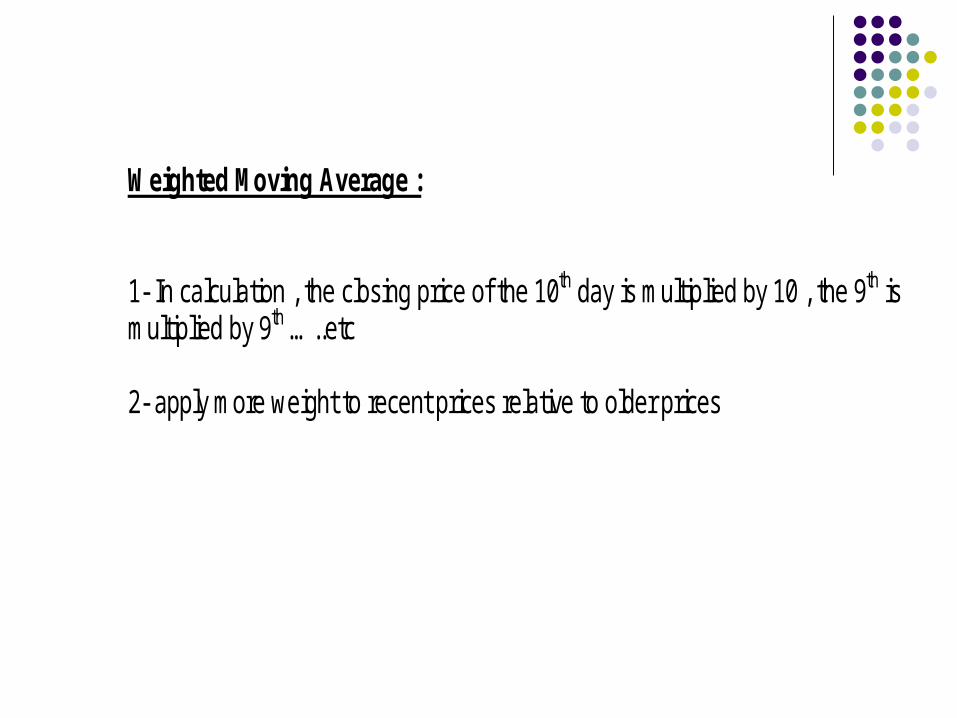
Weighted Moving Average : 1- In calculation , the closing price of the 10th day is multiplied by 10 , the 9th is multiplied by 9th …..etc 2- apply more weight to recent prices relative to older prices

Exponential Moving Average :
1- reduce the lag by applying more weight to recent prices relative to older prices
The formula for an exponential moving average is:
EMA(current) = ( (Price(current) - EMA(prev) ) x Multiplier) + EMA(prev) "Multiplier" is equal to 2 / (1 + N) where N is the specified number of periods.
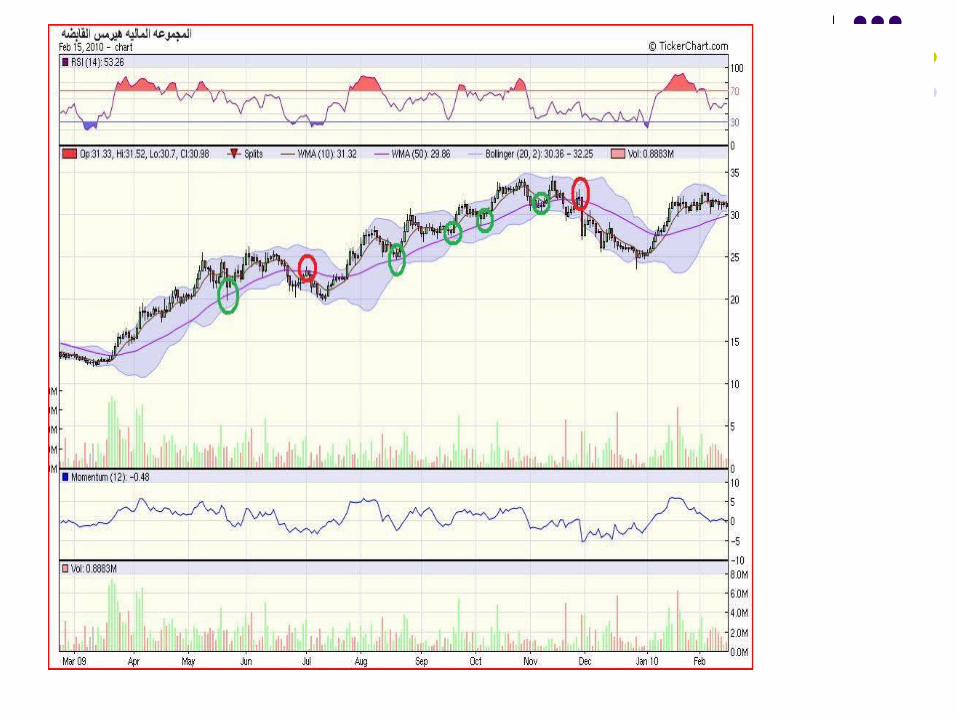
Envelope : A simple moving average line can be enhanced by surrounding the line pattern with parallel envelopes. These envelopes deviate from the the moving average line by a user-specified percentage in order to determine when prices has gotten overextended in either direction and have strayed from the moving average line by that percentage. For example, charting 3% envelopes would display an upper parallel line that is 3% above the MA line, and a lower parallel line that is 3% below the MA line

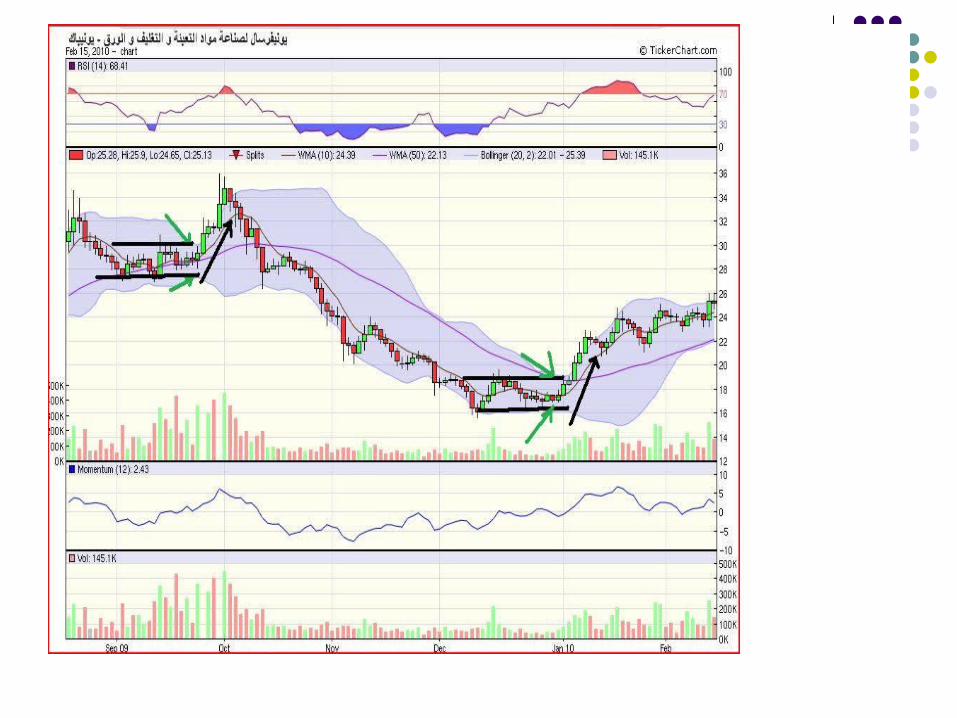
Bollinger Bands :
1- Two trading bands are placed around a moving average and two standard deviation above & below the moving average
2- Bollinger Bands serve two primary functions: To identify periods of high and low volatility To identify periods when prices are at extreme, and possibly
unsustainable levels, prices are cosidered to be overbought on the upsied when it touch the upper band & vice versa
3- Developed by John Bollinger
* Standard deviation is a statistical concept that describes how prices are dispersed around an average value


![[John a. Bollinger] Bollinger on Bollinger Bands](https://img.dokumen.tips/doc/110x75/56d6bd1d1a28ab30168cb4d0/john-a-bollinger-bollinger-on-bollinger-bands.jpg)


