Embed Size (px)
Citation preview

April 2017
Mountain Biking Economic Impact Study - Squamish
Copyright © 2017 Western Canada Mountain Bike Tourism Association

Summary: Mountain Biking in Squamish 2016
Mountain biking is a significant outdoor activity in the District of Squamish, with 25,180 riders taking over 202,000 rides in 2016. Of note, more than 20,000 riders and 99,000 rides were made by visitors from outside of the community, providing a significant boost to the local economy.
The spending of out-of-town visitors to Squamish who rode on the mountain bike trail system in 2016 totalled $10.0 million, supporting $15.6 million in economic activity in British Columbia including $13.0 million of economic activity in Squamish. These expenditures supported $4.6 million in wages and salaries in the province through the support of 89 jobs, of which 71 jobs and $3.4 million in wages and salaries were supported in Squamish. The total net economic activity (GDP) generated by visitors to the Squamish trail system in 2016 was $8.8 million for Canada as a whole; $7.3 million for British Columbia and $5.0 million for Squamish. Visitors to the Squamish trail system also supported tax revenues totalling $2.8 million when considering Canada as a whole. Visitors supported federal government tax revenues of $1.3 million with an additional $1.1 million in taxes accruing to the Province of British Columbia. Moreover, $196,000 in municipal taxes were supported in the province, of which $175,000 was in Squamish.
Mountain Biking in Squamish 2016 by the Numbers
22,820 out-of-town
riders
$9.9 million in visitor
spending directly attributable to mountain biking in Squamish
71 Squamish jobs
supported by the tourism expenditures of mountain bikers
44% of out-of-town
riders stayed overnight in Squamish
99,000 rides in
Squamish by out-of-town visitors
$3.4 million of wages and
salaries supported in Squamish
$7.3 million boost to
provincial GDP
$1.1 million in taxes
supported in British Columbia

The Mountain Bike Tourism Association (MBTA), in partnership with the Canadian Sport Tourism Alliance (CSTA) surveyed mountain bikers to gather data to prepare an economic impact study of mountain biking in the Sea to Sky Corridor, including the communities of North Vancouver, Squamish, and Pemberton. The CSTA, working with Tourism Whistler and Whistler / Blackcomb, prepared studies of the Whistler trail system, the Whistler Bike Park and Crankworx in 2015.
Together, these studies provide an update to the 2006 economic impact of mountain biking in the Sea to Sky Corridor (the results for the entire Corridor are found in a separate report). Since 2006, mountain biking has experienced pronounced growth in the region. The 2016 research clearly demonstrates that the Sea to Sky Corridor is now a world-class mountain biking destination, attracting regional, national and international mountain bikers who travel to the region specifically for riding.
This document reports the findings from surveys conducted in Squamish.
Survey data was collected via in-person intercepts at 4 primary locations in Squamish: Top of Perth, Legacy Parking lot, Alice Lake, and Half Nelson trailhead from June 11 to August 29, 2016. Interviewing shifts were staggered and covered morning, mid-day, and early evening throughout the summer on both weekdays and weekends. A total of 445 surveys were conducted.
3
Background

4
2006 2016
Share of out of town riders staying overnight
21% 44%
Average Length of Stay 3.2 nights 5.8 nights
Rider Volume Same Day Overnight
6,404* 1,702*
12,893 9,927
Tourism Spending $2.3M* $9.9M
Economic Impact (GDP, Squamish) $1.1M* $5.2M
*2006 figures adjusted to reflect full year estimates to compare to 2016 results
Comparing 2016 to 2006 • When 2016 results are compared to the equivalent data from the 2006 study, significant increases are evident.

5
Respondent Origin • The largest trail user group remains Squamish residents (unchanged from 2006 at 44%) who are referred as Local for
the remainder of the report.
• In 2006, just 10% of riders originated from outside BC. In 2016, 23% of riders live outside the province. The most notable shift is evident in US visitors, who now comprise 14% of Squamish riders, up from 4% in 2006.
44%
6%
1%
21%
5% 5%
14%
4%
44%
5%
1%
33%
3% 3% 4% 3%
District ofSquamish
Whistler Other Sea toSky
GreaterVancouver
Other BC Other Canada US International
2016 2006
*displayed by geographical region
Where is your primary place of residence?

6
US & International Origin • As noted on the previous slide, close to one-in-five riders in Squamish reside in the US or internationally. The majority of
US riders originate from just three states – Washington, Oregon, and Colorado. International visitors come from a wide range of countries, but note that the sample is very small (n=19), so results must interpreted with caution.
US Origin
State (n=61) Share (%)
Washington 44%
Oregon 15%
Colorado 10%
California 7%
Utah 7%
Wisconsin 3%
Other US 15%
International Origin
Country (n=19) Share (%)
New Zealand 37%
France 26%
Switzerland 16%
Australia 5%
UK 5%
Other 11%
What state are you from? What country are you from?

7
Riding Party Size • Respondents were asked several questions about those they were riding with (referred to as Riding Party).
• Riding party sizes were similar for out-of-town visitors and locals, with locals somewhat more likely to ride on their own, which resulted in a slightly smaller average party size (2.5 riders vs. 2.8 among visitors).
Excluding yourself, how many people are you riding with today?
30% 18%
35% 48%
17% 12%
7% 11%
11% 12%
Local (n=219) Visitor (n=215)
Average Party Size 2.5 2.8
1 2 3 4 5 or more

8
Riding Party Ages • Survey respondents were asked to provide the ages of all members of the riding party. The most common age groups
for both locals and visitors was 30 to 39 years.
• Local riding parties were slightly older than out-of-town riders, with the second most common age group being 40-49 years, while for visiting riders, it was 20-29 years.
In your group, how many people are aged: (including the respondent)
7% 10%
20% 23%
41% 37%
22% 22%
9% 7% 2% 1%
Local (n=455) Visitor (n=641)
18 and under 19 to 29 30 to 39 42 to 49 50 to 59 60 +

9
Riding Party Gender • There was a larger difference between locals and visitors in terms of gender, with substantially more local riders being
female (35%) than visiting riders (26%).
Gender distribution of party: (including the respondent)
65%
35%
Local (n=455)
74%
26%
Visitor (n=650)
Male Female

6%
47%
42%
4%
5%
42%
45%
8%
Green
Blue
Black
Double Black
Local (n=291) Visitor (n=365)
10
Skill Level • Riders were asked about the skill level of the riding group with local respondents rating themselves as slightly lower
than visitors.
• When riders were asked about the level of difficulty for future Squamish trails, they primarily chose blue or black (note riders were allowed to make 2 selections).
15%
40%
37%
6%
2%
16%
42%
34%
7%
2%
5 - Expert
4
3
2
1 - Beginner
Local (n=188) Visitor (n=244)
Reported Skill Level Future Trail Levels
On a scale of 1 to 5 with 1 meaning beginner and 5 meaning expert, how would you rate the skill level of your group?
What level of difficulty should future trails be? (Select up to two)

11
Information Sources • For local residents, previous experience was the most common source of information for riding in Squamish (89%) as
was the case for half of out-of-town riders.
• Trailforks was cited as an information source by 57% of out-of-town riders. Looking more closely at Trailforks use among visitors, the app is particularly important for riders who travelled from out-of-province.
89%
19%
11%
4% 2% 2% 1% 1%
47%
16%
57%
4%
15%
5% 8%
5%
Previousexperience
Strava Trailforks Sorcawebsite
Friends /family
Other trailapps
Printedmaps
Bike shops
Local (n=196) Visitor (n=249)
Which of the following information sources did you use to plan your ride today? (Select all that apply)
Trailforks Use Origin (n=163)
Squamish 11%
Whistler 56%
Other Sea to Sky 50%
Greater Vancouver 46%
Other BC 57%
Other Canada 70%
US 68%
International 63%

12
Overnight Stays and Accommodation Type • Visitors were asked about overnight stays. Roughly four-in-ten riders were on a day trip. This is a considerable shift
from 2006 when 79% of visitors came to Squamish for the day only.
• Overall, 61% of out-of-town riders stayed overnight as part of their trip, with the bulk of overnight visitors staying in Squamish (46%), followed by Whistler (12%).
• Similar to 2006, camping was the most popular accommodation choice for Squamish visitors, followed by hotels, and staying with friends/family. In Whistler, visitors were most likely to use short-term rentals, followed by camping, and staying with friends/family.
39%
46%
12%
1% 0%
2% Accommodation Use (n=216)
Day trip Overnight - SquamishOvernight - Whistler Overnight - North VancouverOvernight - Other Sea to Sky Overnight - Vancouver
49%
23%
14% 9%
3% 2% 1% 0%
24%
10%
17%
31%
0% 3%
7% 7%
Squamish (n=103) Whistler (n=29)
Where are you staying overnight? What kind of accommodation are you using on this trip?

13
Length of Stay in Squamish • Respondents who stayed in Squamish were asked if they spent all of their time in Squamish or if they visited other
parts of BC on their trip. Two-thirds of those who stayed in Squamish spent their entire time in the community, with an average stay of 5.8 nights. This is a considerable increase from 2006, when the average length of stay in Squamish was 3.2 nights.
• Riders who stayed in Squamish as part of a longer trip spent 3.9 nights in Squamish and 16 nights elsewhere in the province. Note the sample of riders spending only some nights in Squamish is small and caution is urged in interpreting this result.
Length of Stay in Squamish (n=99) Share (%)
All nights in Squamish 69%
Squamish Nights 5.8
Some nights in Squamish 31%
Squamish Nights 3.9
Nights elsewhere 16.1
How many nights are you away from home on this trip?

14
Overall Riding Experience • More than three-quarters of all respondents rated their overall riding experience as great, with visitors slightly more
likely to provide this assessment.
77%
17%
4%
1%
80%
16%
3%
1%
Great
Good
Fair
Fair / Poor
Local (n=186) Visitor (n=234)
Ride Experience Today
How would you rate your ride experience today?

15
Satisfaction with Aspects of the Ride • Respondents were asked about specific aspects of their Squamish riding experience.
• Locals voiced the highest satisfaction with trail maintenance and signage followed by ease of finding trailheads. They were considerably less satisfied with parking facilities compared to visitors.
• Visitors were overwhelmingly satisfied with all aspects of their Squamish riding experience, with more than eight-in-ten indicating satisfaction with each aspect of the ride experience.
43%
57%
43%
36%
41%
26%
38%
30%
12%
11%
12%
23%
4%
5%
4%
9%
1%
2%
2%
44%
49%
50%
51%
38%
34%
36%
32%
15%
14%
12%
15%
2%
2%
1% 2%
Top-2
84%
82%
83%
83%
81%
86%
66%
83%
Rating - Trail Maintenance & Signage
Rating - Ease of Finding Trailheads
Rating - Trail Conditions
Rating - Parking Facilities
Excellent Above Average Average Below Average Poor
Local (n=182-187) Visitor (n=241-244)
On a scale of 1 to 5 with 1 meaning poor and 5 meaning excellent, please rate the following:

16
Importance of Trails to Locals • Local riders were asked about the importance of the trail system in their decision to live in Squamish.
• Results suggest trails have a significant impact, with more than eight-in-ten locals saying the trails were very important (62%) or important (20%) in their decision to live in the community.
How important are/were the trails in your decision to live in Squamish?
62%
20%
11%
4%
3%
Very important
Important
Somewhat important
A little bit important
Not at all important
Importance of trails in decision to live in Squamish (n=187)

17
Net Promoter Score The Net Promoter Score (NPS) is a metric that helps organizations monitor the engagement of their customers. It reflects the likelihood that someone will recommend a product/company/place to friends, family or colleagues. In the context of the tourism industry, NPS is based on responses to the question, “How likely are you to recommend [destination] as a travel destination to a friend, family member or colleague?”
The intention to recommend a travel destination, reported by the NPS, is a proxy measure of overall satisfaction with the travel experience. Satisfaction with the travel experience and the intention to recommend greatly increase the likelihood of a return visit and advocacy.
10
9
8
7
6
5
4
3
2
1
% Promoters
% Detractors % Net
Promoters
9-10 Promoters
7-8 Passives
0-6 Detractors
Loyal enthusiasts likely to return and rave about their experience.
Marginally satisfied visitors not excited enough to tell others about their experience.
Unhappy visitors, unlikely to tell others to visit and might even damage the reputation of a
destination through negative word of mouth.
0

18
Net Promoter Score • Riders were asked how likely they were to recommend Squamish as a riding destination using a scale of 0 meaning
extremely unlikely and 10 meaning extremely likely.
• A Net Promoter Score (NPS) was calculated by subtracting the number of Detractors (rating 0-6) from the Promoters (rating 9-10).
• The Net Promoter Score for local riders was +78, rising to +84 for out-of-town riders, meaning there is considerable potential for locals and visitors to be advocates for the Squamish trail system.
How likely are you to recommend Squamish as a mountain biking destination to a friend, family member or colleague?
89%
91%
1%
2%
11%
7%
Local
Visitor
Net Promoter Score
78
84
Promoters Passives Detractors

44% 36%
44%
70%
37%
23%
24% 15%
17%
19%
14% 15%
8%
7%
10%
5% 6%
1%
2%
20%
9% 9%
6%
3% 14%
5% 9%
25%
1%
Squamish WhistlerBike Park
Whistler X-Country
North Shore Pemberton
19
Sea to Sky Rides per Year • Riders were asked about the number of times they rode in Squamish and other destinations in the Sea to Sky Corridor
in the past year.
• The average number of rides was difficult to calculate for locals as most reported more than 20 rides per year, with many indicating 3-4x per week, resulting in an average frequency of 85 rides per year. The most common riding destination outside of Squamish was Whistler cross-country trails (4.3 times) followed closely by the North Shore (4.2).
• Visitors reported the heaviest use of North Shore trails (9.2 rides on average) followed by Whistler cross country trails.
0%
58%
40%
55% 59%
1%
18%
21%
13%
21%
2%
10%
18% 11%
12%
3%
3% 7% 5%
3%
10%
6% 9% 10%
4%
85%
5% 4% 6% 2%
Squamish WhistlerBike Park
Whistler X-Country
North Shore Pemberton
Locals (n=188) Visitor (n=228)
Average Rides per
Year 85* 3.2 4.3 4.2 2.1 12 4.2 5.5 9.2 1.5
Over the last 12 months, how many days did you ride in the following locations:
None 1 to 2 3 to 5 6 to 10 10 to 20 20 +

20
Rides in Other Destinations • Respondents were asked where else they had ridden in the past year, with results closely linked to where rider reside
(e.g. Alberta riders were likely to ride in the Kootenays, etc.).
• Outside of the Sea to Sky Corridor, Squamish residents were most likely to have ridden on Vancouver Island, followed by the Thompson Okanagan, and the US. The same pattern is evident among Greater Vancouver residents.
• Interestingly, US and International riders did not visit many locations in Canada outside of the Sea to Sky Corridor.
Over the last 12 months, did you ride in any of the following areas? (select all that apply) * Small sample size
Riding Destination
Residency Vancouver
Island Thompson Okanagan
Kootenay Rockies
Cariboo Chilcotin
Coast Northern
BC Other
Canada US Inter-
national
District of Squamish 42% 36% 24% 29% 7% 16% 35% 12%
Whistler 33% 26% 19% 37% 0% 4% 22% 26%
Other Sea to Sky* 75% 0% 0% 50% 0% 0% 0% 25%
Greater Vancouver 44% 34% 25% 19% 8% 14% 41% 12%
Other BC* 65% 55% 65% 15% 10% 15% 30% 15%
Other Canada* 35% 25% 55% 10% 10% 100% 40% 20%
US 11% 9% 8% 6% 6% 8% 100% 17%
International* 18% 18% 12% 6% 0% 12% 12% 100%

21
Rider Volume Calculations • A key calculation in the economic impact assessment is determining the number of rides that took place in Squamish.
These volume estimates are for 2016 as a whole and were developed by using Trailforks data along with data collected from a trail counter that was placed on the Half Nelson Trail. With Half Nelson being a one-way trail and predominantly for mountain biking, the counter results are considered accurate.
• The overall volume was prepared by first calculating the ratio of Trailforks check-ins at Half Nelson versus the total trail count. This ratio was then multiplied by the total number of rides in the Squamish region (unique riders, 2016) from Trailforks. The final step was to break out the number of rides by the origin of riders as observed in the survey, and then divide by the reported average number of rides per year.
Residency Individual riders Rides per person in Squamish
Annual Rides in Squamish
Squamish 1,282 69.44 89,055
Whistler / S2S 1,076 13.09 14,085
Greater Vancouver 499 16.38 8,179
Other BC 1,042 6.54 6,815
Other Canada 1,806 3.77 6,815
US 3,894 5.72 22,264
International 2,685 2.54 6,815
Same day (travel back and forth from home to ride in Squamish) 11,194 3.45 38,621
Day trip (out-of-town visitors who are staying somewhere else, but made a day trip to Squamish) 1,699 5.62 9,542
Total 25,178 8.03 202,191
Visitors 22,820 4.34 99,051

22
Rider Volume (2016 versus 2006) • For reference, the table below shows the number of out-of-town riders in Squamish in 2016 versus the estimated
number of riders in the 2006 study (2006 figures adjusted to reflect full year visitation).
• The number of same day riders has doubled, while the number of riders staying overnight in Squamish has increased by nearly 600% times in the past 10 years.
12,893
9,927
6,404
1,702
Same Day Overnight
2016 2006

23
Visitor Spending – per person
• Non-resident riders were asked how much they spent in Squamish on this visit (locals were not asked about expenditures as their spending does not represent new money in the community). The average spend among all visitors is $156, with restaurants ($44) and accommodation ($32) accounting for the majority of spending.
• International and Other Canada visitors reported the highest average expenditures in Squamish ($700+), while same day visitors reported the lowest average spend ($62).
Same day Greater
Vancouver Other BC Other
Canada US* International* Total
Accommodation $0.00 $26.14 $102.73 $195.52 $98.22 $240.41 $32.36
Restaurants $29.55 $30.64 $84.40 $106.06 $70.65 $172.30 $44.33
Other Food & Bev $6.56 $42.58 $49.85 $98.81 $45.95 $96.20 $21.37
Recreation & Entertainment
$0.87 $8.58 $20.45 $16.87 $29.35 $115.32 $10.15
Bike Shops (Parts / Repairs / Bikes)
$14.21 $11.44 $44.45 $85.90 $17.51 $64.33 $20.14
Other Shopping $2.75 $5.11 $18.18 $41.11 $9.78 $26.41 $6.56
Local Transporation $8.21 $6.79 $43.48 $179.45 $29.40 $78.65 $21.13
Total excluding Transport
$62.15 $131.28 $363.55 $723.72 $300.87 $793.62 $156.05
* US and International Visitor spending has been scaled to reflect the number of nights actually spent in Squamish as respondents answered for spending on the trip as a whole. On average, US visitors spent 56% of their time in Squamish while international visitors spent 39% of their time in Squamish.
Please include the best estimate of spending for all members of your party for the entire trip to Squamish.

24
Visitor Spending – aggregate
• The number of trips was calculated for each category, which was then multiplied by the spending per trip. In total, visitors riding the Squamish trails spent over $10 million in the community.
• The group accounting for the greatest spend were same day visitors ($3 million), followed by US and International visitors ($2.1 million each).
Same day Greater
Vancouver Other BC Other
Canada US* International* Total
Visits 48,162 3,858 1,734 2,694 7,023 2,685 66,156
Accommodation $0 $100,857 $178,150 $526,705 $689,810 $645,457 $2,140,979
Restaurants $1,423,319 $118,192 $146,359 $285,707 $496,215 $462,597 $2,932,389
Other Food & Bev $315,772 $164,284 $86,450 $266,190 $322,707 $258,285 $1,413,688
Recreation & Entertainment
$41,978 $33,094 $35,472 $45,433 $206,153 $309,612 $671,742
Bike Shops (Parts / Repairs / Bikes)
$684,205 $44,125 $77,093 $231,404 $122,951 $172,726 $1,332,505
Other Shopping $132,306 $19,705 $31,531 $110,735 $68,718 $70,909 $433,904
Local Transporation $395,512 $26,198 $75,410 $483,401 $206,513 $211,169 $1,398,203
Total excluding Transport
$2,993,092 $506,454 $630,466 $1,949,576 $2,113,067 $2,130,754 $10,323,410

25
Visitor Spending – scaled by importance
• The final step was to divide by the importance of the Squamish trail system in the rider’s decision to travel to Squamish using a scale of 1 (not at all important) to 10 (very important).
• The relative importance of the trail system was then used to develop the total spending directly attributable to the Squamish trails, which reached $9.9 million in 2016.
Same day Greater
Vancouver Other BC Other
Canada US* International* Total
Importance (1-10) 10.0 9.4 9.3 9.8 9.5 8.9 9.6
Accommodation $0 $95,209 $165,145 $518,278 $653,940 $576,393 $2,008,964
Restaurants $1,423,319 $111,573 $135,675 $281,136 $470,412 $413,099 $2,835,213
Other Food & Bev $315,772 $155,084 $80,139 $261,931 $305,926 $230,648 $1,349,501
Recreation & Entertainment
$41,978 $31,241 $32,883 $44,706 $195,433 $276,484 $622,724
Bike Shops (Parts / Repairs / Bikes)
$684,205 $41,654 $71,465 $227,702 $116,558 $154,244 $1,295,829
Other Shopping $132,306 $18,601 $29,229 $108,963 $65,144 $63,322 $417,566
Local Transporation $395,512 $24,731 $69,905 $475,667 $195,774 $188,574 $1,350,163
Total excluding Transport
$2,993,092 $478,093 $584,442 $1,918,383 $2,003,188 $1,902,764 $9,879,961
On a scale of 1 to 10, how important was mountain biking in your decision to travel to Squamish?

26
Operational Spending • The Squamish Off Road Cycling Association (SORCA) conducts most of the cycling trail maintenance in Squamish, with
an annual budget of approximately $65,000. In addition, SORCA, along with other partners, funds trail construction averaging $100,000 per year over the last 5 years.

The spending of out-of-town visitors to Squamish who rode on the mountain bike trail system in 2016 totaled $10.0 million, supporting $15.6 million in economic activity in British Columbia including $13.0 million of economic activity in Squamish. These expenditures supported $4.6 million in wages and salaries in the province through the support of 89 jobs, of which 71 jobs and $3.4 million in wages and salaries were supported in Squamish.1 The total net economic activity (GDP) generated by visitors to the Squamish trail system in 2016 was $8.8 million for Canada as a whole; $7.3 million for British Columbia and $5.0 million for Squamish. Visitors to the Squamish trail system also supported tax revenues totaling $2.8 million when considering Canada as a whole. Visitors supported federal government tax revenues of $1.3 million with an additional $1.1 million in taxes accruing to the Province of British Columbia. Moreover, $196,000 in municipal taxes were supported in the province, of which $175,000 was in Squamish.
4 Jobs reported in this study refer to the number of jobs, vs. full time equivalent (i.e.: two people working half time in a job that typically features half time employment would represent two jobs or one FTE). Additionally, the direct employment effects are generally extra shifts or overtime for existing workers rather than new employment.
Squamish British
Columbia Canada
Initial Expenditure
$10,044,962 $10,044,962 $10,044,962
GDP $5,013,677 $7,253,550 $8,770,839
Wages & Salaries
$3,365,905 $4,612,931 $5,434,370
Employment 70.6 89.4 104.0
Industry Output $12,971,607 $15,551,101 $18,837,578
Total Taxes $2,045,357 $2,522,798 $2,838,627
Federal $975,930 $1,184,118 $1,341,933
Provincial $894,564 $1,142,558 $1,221,911
Municipal $174,862 $196,121 $274,783
27
Economic Impact Results

Squamish British
Columbia Canada
Initial Expenditure $10,044,962 $10,044,962 $10,044,962
Gross Domestic Product
Direct Impact $2,978,602 $3,669,368 $3,669,368
Indirect Impact $1,132,641 $1,862,086 $2,708,169
Induced Impact $902,435 $1,722,095 $2,393,301
Total Impact $5,013,677 $7,253,550 $8,770,839
Industry Output
Direct & Indirect $11,481,268 $12,798,628 $14,763,190
Induced Impact $1,362,070 $2,600,397 $3,889,068
Total Impact $12,843,338 $15,399,025 $18,652,258
Wages & Salaries
Direct Impact $2,285,942 $2,695,324 $2,695,324
Indirect Impact $724,245 $1,192,121 $1,665,031
Induced Impact $355,718 $725,487 $1,074,015
Total Impact $3,365,905 $4,612,931 $5,434,370
Employment (Full-year jobs)
Direct Impact 52.3 59.1 60.3
Indirect Impact 11.5 19.0 26.9
Induced Impact 6.8 11.3 16.8
Total Impact 70.6 89.4 104.0
Taxes (Total)
Federal $975,930 $1,184,118 $1,341,933
Provincial $894,564 $1,142,558 $1,221,911
Municipal $174,862 $196,121 $274,783
Total $2,045,357 $2,522,798 $2,838,627
Economic Impact Results - Detailed
28

How Economic Impact Modelling Works
Expenditure
Operational Expenditures
($77,000)
Visitor Expenditure
($9.9M)
Economic Multipliers
Economic Impact
GDP
Jobs
Taxes
Wages & Salaries
| 29

Expenditures
• Represents the combined spending of: • Visitors (Tourism)
• Operations
• Capital Construction
• Is the amount of money being spent in the community BEFORE the application of any economic multipliers
$
| 30
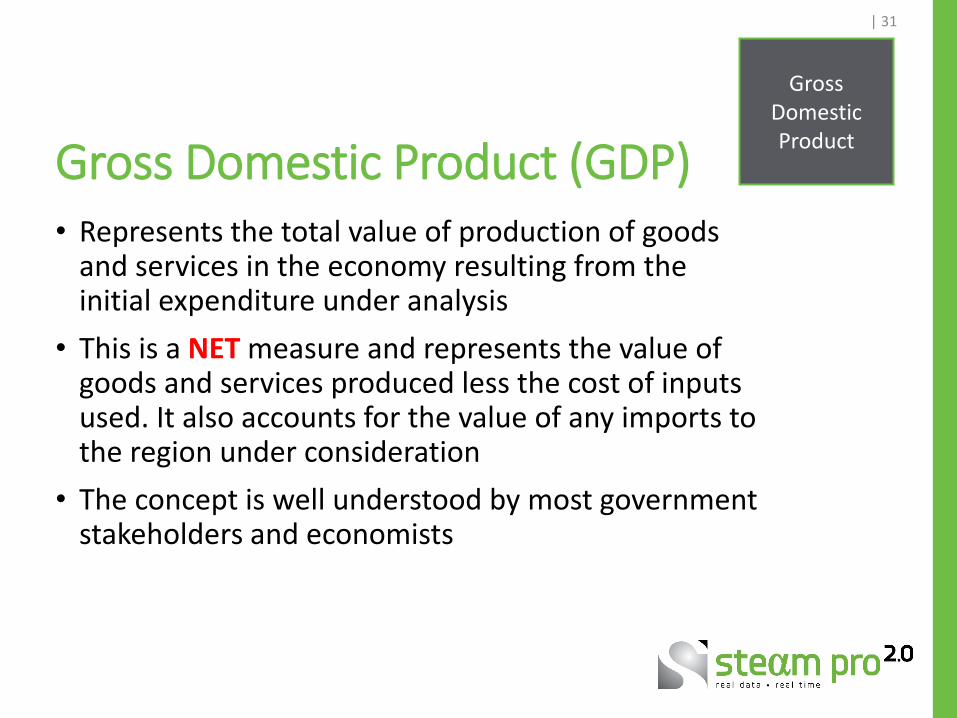
Gross Domestic Product (GDP) • Represents the total value of production of goods
and services in the economy resulting from the initial expenditure under analysis
• This is a NET measure and represents the value of goods and services produced less the cost of inputs used. It also accounts for the value of any imports to the region under consideration
• The concept is well understood by most government stakeholders and economists
Gross Domestic Product
| 31

Economic Activity This figure represent the direct, indirect and induced impacts on industry output generated by the initial tourism expenditure. It should be noted that the industry output measure represents the sum total of all economic activity that has taken place and consequently involve double counting on the part of the intermediate production phase.
Since the Gross Domestic Product (GDP) figure includes only the net total of all economic activity (i.e. considers only the value added), the industry output measure will always exceed or at least equal the value of GDP.
Economic Activity
| 32

Economics Background
Induced (Impact associated with the re-spending of wages, salaries & profits)
Indirect (Impact arising from the supply of goods & services to produce Direct)
Direct
(The impact arising from the initial expenditure)
| 33

Appendix 1: Economic Impact Methodology STEAM2.0
Background Briefly, the purpose of STEAM 2.0 is to calculate both the provincial and regional economic impacts of sport and event- based tourism. The economic impacts are calculated on the basis of capital and operating expenditures on goods, services and employee salaries, and on the basis of tourist spending within a designated tourism sector. The elements used to measure the economic impacts are Gross Domestic Product (GDP), Employment, Taxes, Industry Output and Imports. STEAM measures the direct, indirect & induced effects for each of these elements.
In order to produce economic contribution assessments that are robust and reliable, we developed specific economic contribution models at the national, provincial and metropolitan levels that make use of the most current and most detailed input-output tables and multipliers available from Statistics Canada. The approach also leverages the credibility and robustness of sector specific tax data available from Statistics Canada’s Government Revenues Attributable to Tourism (GRAT) report.
Technical Description of the Impact Methodology Used by STEAM2.0
While the economic contribution analysis will be conducted primarily at the provincial level, developing highly disaggregated provincial economic models required first the construction of a highly disaggregated national economic contribution model. The reason for this was that detailed input-output tables from Statistics Canada are only publicly available at the national level.
For STEAM 2.0 and STEAM PRO 2.0, we pioneered a solution that leveraged the detail available on an industry basis from the national model using aggregate multipliers that are available for each province and territory.
While the set of multipliers that Statistics Canada produces do not provide insights into the economic contributions attributed to specific industries operating within the economy, they do represent a known aggregate level which the overall economy can be expected to benefit by. The key to our approach is the linkage between the industry level detail (provided by the model developed from the input-output tables) with the benchmarks provided by the various multipliers.
| 34

Appendix 1: Economic Impact Methodology STEAM2.0
STEAM 2.0 and many other impact studies are based on input-output techniques. Input-output models involve the use of coefficients that are based on economic or business linkages. These linkages trace how tourist expenditures or business operations filter through the economy. In turn, the coefficients applied are then used to quantify how tourism-related activity in a particular region generates employment, taxes, income, etc. The input-output approach indicates not only the direct and indirect impact of tourism, but can also indicate the induced effect resulting from the re-spending of wages and salaries generated.
All impacts generated by the model are given at the direct impact stage (i.e. the "front line" businesses impacted by tourism expenditures), indirect impact stage (i.e. those industries which supply commodities and/or services to the "front line" businesses) and the induced impact stage (induced consumption attributable to the wages and salaries generated from both the direct and indirect impact).
The direct and indirect impact phase results are benchmarked with the corresponding direct and indirect multipliers from Statistics Canada at the national level, on an industry by industry basis.
We developed induced round effects that replicate the re-spending behavior of consumers (who benefited through wages either directly or indirectly by sport events) along income ranges. The re-spending profiles used account for different average wages that exist in specific industry sectors. Ultimately, the re-spending profiles permit the determination of distinct levels and composition of induced consumption depending upon the extent to which those industries are directly and indirectly affected by economic activity arising from hosting sports events and festivals.
After the level and composition of induced consumption is determined, the process involved treating the induced consumption spending in a separate analysis—much the same as the original sport event related expenditures were. Hence, these expenditures were simulated through the direct and indirect impact phase and treated as if they were initial expenditures.
Once again, the magnitude of the results of the induced impact phase was benchmarked against the corresponding multipliers supplied by Statistics Canada. Again, this is done to ensure that, in aggregate, the estimates align with those from Statistics Canada but at the same time the analysis also provides an industry by industry breakdown.
Taxes and employment are two key impact measures that require data sources beyond those available in the input-output model.
| 35

Appendix 1: Economic Impact Methodology STEAM2.0
Taxes Despite the fact that many of the sales tax ratios are available from the margins tables produced by Statistics Canada, additional work was required to adjust these rates based on possible changes in tax rates between 2010 (the year of the input-output tables) and 2012 (the year of the analysis). To extend the analysis to include the full range of taxes and fees impacted by sport events, we relied on statistics reported in Statistics Canada's Government Revenues Attributable to Tourism (GRAT) report. This report is particularly useful because it follows the concepts and definitions as identified in the Canadian Tourism Satellite Account (CTSA). As well, the scope of taxes covered by the GRAT is more comprehensive than what would be possible using only the input-output tables. In particular, the GRAT includes taxes on incomes (i.e., on employment earnings, corporate profits, net income of unincorporated business and government business enterprises), contributions to social insurance plans (i.e., premiums for Canada/Quebec Pension Plan, Employment Insurance and workers compensation), taxes on production and products (such as sales and property taxes), and from sales of government goods and services.
Aside from reporting on the tax collections directly attributable to tourism, the GRAT study also identifies the composition and level of taxes attributed to various industry segments of the economy. At the present time, the most recent GRAT report relates to the 2011 calendar year. The established rates calculated from GRAT were adjusted, where applicable, to reflect rate changes that occurred between 2011 and subsequent years.
To incorporate the findings from the GRAT study into our analysis, we estimated ratios that were based on the most current industry sector tax data along with the most current GDP estimates on an industry basis. The resulting tax coefficients were then used to determine tax calculations that would be based on GDP estimates stemming from the model on an industry by industry basis.
The categories of taxes that were benchmarked against the GRAT statistics include corporate taxes, contributions to social insurance plans and other taxes on production. Other taxes on production comprise property taxes, payroll taxes, capital taxes, permits and many other miscellaneous taxes covering federal, provincial and municipal levels of government. The contributions to social insurance plans include employment insurance, worker’s compensation and the Canada and Quebec pension plans.
We also went outside of the figures reported in the GRAT report to assemble income tax coefficients. This was done to capture the detail that was already available from the input-output analysis and to better align with the granular demand associated with sporting event expenditures. The source used to assemble specific income tax rates, by income range, was the Canadian Tax Foundation's most recent Finances of the Nation report. This report provide insights on taxes on incomes (i.e., on employment earnings, corporate profits, net income of unincorporated business and government business enterprises) and contributions to social insurance plans (i.e., premiums for Canada/Quebec Pension Plan, Employment Insurance and workers compensation).
| 36 CSTA | ECONOMIC IMPACT STUDY | 2016 TEST OF METAL
Appendix 1: Economic Impact Methodology STEAM2.0
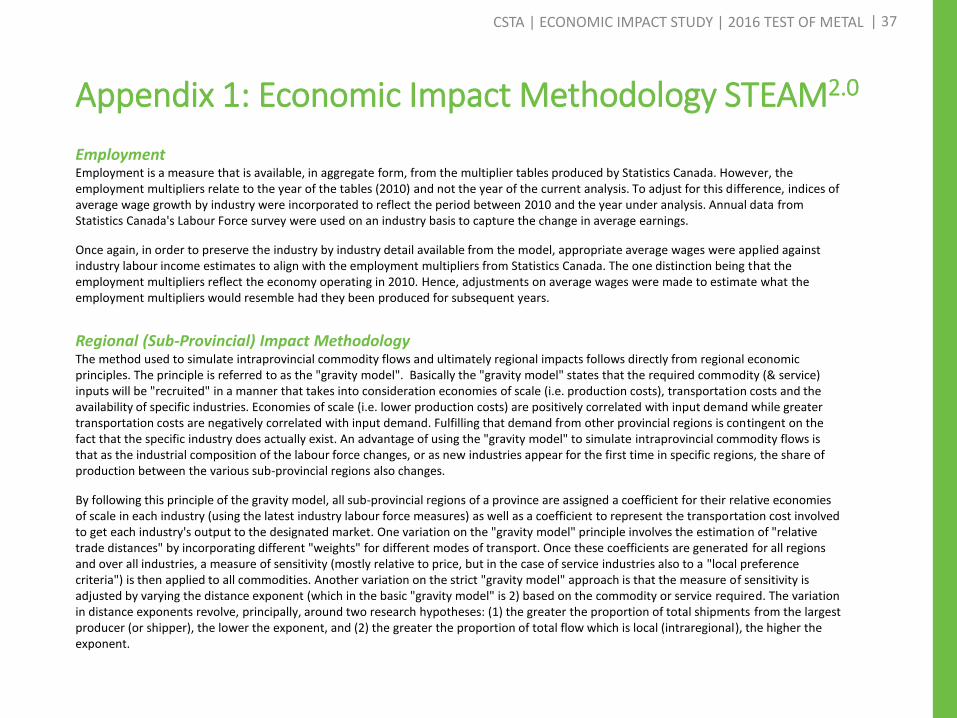
Employment Employment is a measure that is available, in aggregate form, from the multiplier tables produced by Statistics Canada. However, the employment multipliers relate to the year of the tables (2010) and not the year of the current analysis. To adjust for this difference, indices of average wage growth by industry were incorporated to reflect the period between 2010 and the year under analysis. Annual data from Statistics Canada's Labour Force survey were used on an industry basis to capture the change in average earnings.
Once again, in order to preserve the industry by industry detail available from the model, appropriate average wages were applied against industry labour income estimates to align with the employment multipliers from Statistics Canada. The one distinction being that the employment multipliers reflect the economy operating in 2010. Hence, adjustments on average wages were made to estimate what the employment multipliers would resemble had they been produced for subsequent years.
Regional (Sub-Provincial) Impact Methodology The method used to simulate intraprovincial commodity flows and ultimately regional impacts follows directly from regional economic principles. The principle is referred to as the "gravity model". Basically the "gravity model" states that the required commodity (& service) inputs will be "recruited" in a manner that takes into consideration economies of scale (i.e. production costs), transportation costs and the availability of specific industries. Economies of scale (i.e. lower production costs) are positively correlated with input demand while greater transportation costs are negatively correlated with input demand. Fulfilling that demand from other provincial regions is contingent on the fact that the specific industry does actually exist. An advantage of using the "gravity model" to simulate intraprovincial commodity flows is that as the industrial composition of the labour force changes, or as new industries appear for the first time in specific regions, the share of production between the various sub-provincial regions also changes.
By following this principle of the gravity model, all sub-provincial regions of a province are assigned a coefficient for their relative economies of scale in each industry (using the latest industry labour force measures) as well as a coefficient to represent the transportation cost involved to get each industry's output to the designated market. One variation on the "gravity model" principle involves the estimation of "relative trade distances" by incorporating different "weights" for different modes of transport. Once these coefficients are generated for all regions and over all industries, a measure of sensitivity (mostly relative to price, but in the case of service industries also to a "local preference criteria") is then applied to all commodities. Another variation on the strict "gravity model" approach is that the measure of sensitivity is adjusted by varying the distance exponent (which in the basic "gravity model" is 2) based on the commodity or service required. The variation in distance exponents revolve, principally, around two research hypotheses: (1) the greater the proportion of total shipments from the largest producer (or shipper), the lower the exponent, and (2) the greater the proportion of total flow which is local (intraregional), the higher the exponent.
| 37 CSTA | ECONOMIC IMPACT STUDY | 2016 TEST OF METAL

Appendix 2: Glossary of Terms Used by STEAM2.0
Initial Expenditure - This figure indicates the amount of initial expenditures or revenue used in the analysis. This heading indicates not only the total magnitude of the spending but also the region in which it was spent (thus establishing the "impact" region).
Direct Impact - Relates ONLY to the impact on “front-line” businesses. These are businesses that initially receive the operating revenue or tourist expenditures for the project under analysis. From a business perspective, this impact is limited only to that particular business or group of businesses involved. From a tourist spending perspective, this can include all businesses such as hotels, restaurants, retail stores, transportation carriers, attraction facilities and so forth.
Indirect Impact - Refers to the impacts resulting from all intermediate rounds of production in the supply of goods and services to industry sectors identified in the direct impact phase. An example of this would be the supply and production of bed sheets to a hotel.
Induced Impact - These impacts are generated as a result of spending by employees (in the form of consumer spending) and businesses (in the form of investment) that benefited either directly or indirectly from the initial expenditures under analysis. An example of induced consumer spending would be the impacts generated by hotel employees on typical consumer items such as groceries, shoes, cameras, etc. An example of induced business investment would be the impacts generated by the spending of retained earnings, attributable to the expenditures under analysis, on machinery and equipment.
Gross Domestic Product (GDP) - This figure represents the total value of production of goods and services in the economy resulting from the initial expenditure under analysis (valued at market prices).
• NOTE: The multiplier of Total/Initial, represents the total (direct, indirect and induced) impact on GDP for every dollar of direct GDP. This is a measure of the level of spin-off activity generated as a result of a particular project. For instance if this multiplier is 1.5 then this implies that for every dollar of GDP directly generated by “front-line” tourism businesses an additional $0.50 of GDP is generated in spin-off activity (e.g. suppliers).
• The multiplier of total/$ Expenditure, represent the total (direct, indirect and induced) impact on GDP for every dollar of expenditure (or revenue from a business perspective). This is a measure of how effective project related expenditures translate into GDP for the province (or region). Depending upon the level of expenditures, this multiplier ultimately determines the overall level of net economic activity associated with the project. To take an example, if this multiplier is 1.0, this means that for every dollar of expenditure, one dollar of total GDP is generated. The magnitude of this multiplier is influenced by the level of withdrawals, or imports, necessary to sustain both production and final demand requirements. The less capable a region or province is at fulfilling all necessary production and final demand requirements, all things being equal, the lower the eventual economic impact will be.
| 38 CSTA | ECONOMIC IMPACT STUDY | 2016 TEST OF METAL

Appendix 2: Glossary of Terms Used by STEAM2.0
GDP (at factor cost) - This figure represents the total value of production of goods and services produced by industries resulting from the factors of production. The distinction to GDP (at market prices) is that GDP (at factor cost) is less by the amount of indirect taxes plus subsidies.
Wages & Salaries - This figure represents the amount of wages and salaries generated by the initial expenditure. This information is broken down by the direct, indirect and induced impacts.
Employment - Depending upon the selection of employment units (person-years or equivalent full-year jobs) these figures represent the employment generated by the initial expenditure. These figures distinguish between the direct, indirect and induced impact. “Equivalent Full-Year Jobs”, if selected, include both part-time and full-time work in ratios consistent with the specific industries.
• NOTE: The multiplier (B) is analogous to Multiplier (B) described earlier with the exception being that employment values are represented per $1,000,000 of spending rather than per dollar of spending. This is done to alleviate the problem of comparing very small numbers that would be generated using the traditional notion of a multiplier (i.e. employment per dollar of initial expenditure).
Industry Output - These figures represent the direct & indirect and total impact (including induced impacts) on industry output generated by the initial tourism expenditure. It should be noted that the industry output measure represents the sum total of all economic activity that has taken place and consequently involve double counting on the part of the intermediate production phase. Since the Gross Domestic Product (GDP) figure includes only the net total of all economic activity (i.e. considers only the value added), the industry output measure will always exceed or at least equal the value of GDP.
Taxes - These figures represent the amount of taxes contributed to municipal, provincial and federal levels of government relating to the project under analysis. This information is broken down by the direct, indirect and induced impacts.
Imports - These figures indicate the direct, indirect and induced final demand and intermediate production requirements for imports both outside the province and internationally.
| 39 CSTA | ECONOMIC IMPACT STUDY | 2016 TEST OF METAL