Embed Size (px)
Citation preview
Morningstar, Inc. 225 W. Wacker, Drive Suite 400 Chicago, IL 60606
The authors wish to acknowledge research assistance from Matthew Gries, Morningstar researchanalyst. In addition, helpful comments within Morningstar have been received from Paul Kaplan,Xiaohua Xia, and Kathryn Allyn. We also thank René Stulz of the Ohio State University for hisexcellent insights.
©2002 Morningstar, Inc. All rights reserved.
Morningstar Research Paper
Estimating Portfolio Style:A Comparative Study of Portfolio-BasedFundamental Analysis and Returns-Based Style Analysis
John Rekenthaler, CFAPresident, Morningstar Online Advice
Michele Gambera, Ph.D.Senior Quantitative Analyst, Morningstar
Joshua Charlson, Ph.D.Managing Editor, Morningstar Online Advice
2March 2002
IntroductionInvestment style has become a prominent concept in the world of investmentmanagement. Fiduciaries who select mutual funds or money managers forretirement plans and pensions often place a high premium on consistency ofinvestment style, and even many individual investors now recognize theimportant role played by style in influencing a fund’s behavior. Yet littleacademic research has been conducted that empirically and systematicallycompares the two most common approaches to assessing a mutual fund’sinvestment style, portfolio-based fundamental style analysis and returns-basedstyle analysis. Each method has its proponents and detractors, yet fundamentalquestions about the accuracy of each approach remain open. This paper attemptsto clarify the debate over style analysis and fill in existing knowledge gaps byundertaking an empirical analysis of the accuracy of the two methods, withrespect to an actual set of open-end mutual funds. Using the database ofMorningstar, Inc., we tested the results of both methodologies in relation to allU.S. diversified equity funds for which Morningstar has complete historical datasince 1997. We find that while both portfolio-based and returns-based analysiscan be useful in certain circumstances, portfolio-based analysis is in general moreaccurate. Moreover, a key finding is that holdings-based analysis maintains itsadvantage even when older portfolio data are used; as discussed below, this resultcounters a frequent criticism of the portfolio-based approach.
Methodological Background of Portfolio-Based andReturns-Based Style AnalysisFundamental, or portfolio-based, analysis has historically been viewed as“common-sense” approach to evaluating the style composition of a mutual fund.Fundamental analysis determines a portfolio’s style by an examination of theactual underlying holdings. No elaborate methodology is required to perform theanalysis, only a consistent framework for defining the risk factors by which theindividual securities will be categorized.
Naturally, fundamental analysis produces the highest degree of accuracy whenexamining a current portfolio. The biggest drawbacks to fundamental analysis arethe timeliness and cost of the data. Whereas mutual fund holdings were onceobtainable only irregularly and with great difficulty, however, fund companiesare now required to disclose holdings at least semiannually, and several well-established third-party firms collect and analyze the data. The cost of trackingholdings for a substantial assemblage of funds remains high, however.
Given the twin issues of timeliness and cost in accumulating portfolio-based data,the investment community has long sought a cheaper, more-practical substitute.In the late 1980s, an alternative was indeed introduced. Developed by WilliamSharpe, returns-based style analysis quickly gained popularity (see Sharpe[1988]). Today, the technique has become a frequently used analytical tool forpension managers, plans sponsors, consultants, and others in the world ofinvestment management. Returns-based style analysis uses a method of
3March 2002
constrained quadratic optimization to regress an investment portfolio’s returnsagainst a set of predetermined benchmark indexes in order to determine whatSharpe called its “effective asset mix”—essentially, the asset allocation that mostclosely approximates the behavior of the fund during the period over which theregression takes place (Sharpe [1988, 1992]). The parameters of the regressionare constrained to be non-negative and to add up to 100%. Commercial softwareapplications that perform Sharpe’s return-based style analysis have made themethodology widely available. As summarized by Christopherson and Sabin[1999], returns-based style analysis “has become popular because, among otherreasons, it requires few inputs, is relatively easy to perform, and yields areasonable picture of market and style exposure at the broad-brush level.”
What remains to be addressed regarding returns-based style analysis is itsaccuracy. Controlling for investment style has come to be viewed as a criticalaspect of investment monitoring and decision-making in both the financial-planning and pension-management communities. Money managers are oftenevaluated, in part, based on how well they stay within the bounds of a giveninvestment style. In addition, investment style is often used as a proxy for risk,and the value of a such an approach depends on a correct initial assessment ofstyle. A central question, therefore, is how well each method of styleclassification actually performs the job it claims to perform. How accurately havereturns-based style analysis and portfolio-based fundamental analysis describedthe style traits of funds? At what point may returns-based style analysis beconsidered “fresher” (i.e., more timely) than portfolio-based fundamentalanalysis? Surprisingly, little empirical research has been conducted on thesecrucial questions, and none that adequately addresses them in a comparative andsystematic fashion.
Literature ReviewMost previous studies on this subject have focused on returns-based style analysisalone, rather than comparing style analysis with alternatives or examiningfundamental analysis independently. These previous investigations have madeimportant contributions to our understanding of the limitations of style analysisand ways of improving the method’s accuracy; nevertheless, they fail to offer anyempirically tested answer to the question of what degree of error can normally beexpected from style analysis, whether this level is an acceptable alternative tofundamental analysis, or when fundamental data become “too old.” Lobosco andDiBartolomeo [1997] developed a formula to measure the “confidence intervals”of various style weights and recommend using daily return data, as opposed to themore common monthly data. However, they fail to display asymptotic results forthe distributions of the estimates, thus the usefulness of the standard errors thatthey report is not clear. The authors also point out that the constrained regressorsin returns-based style analysis can be collinear, thus limiting the precision of theestimates. Buetow, Johnson and Runkle [2000] do look at aggregate mutual fundstatistics, but only with the aim of determining consistency of style exposures.The authors recommend using portfolio-specific or custom benchmarks to
4March 2002
improve the stability of results using style analysis, but they do not address theproblems of collinearity raised by Lobosco and DiBartolomeo.
Despite the lack of quantifiable comparative data, many of these studies assertbased on statistical or theoretical reasoning that returns-based style analysisserves as an adequate substitute for fundamental analysis, given the greater laborand expense involved in accumulating the portfolio data necessary to performfundamental analysis (Lieberman [1996]). Some go so far as to suggest that thedifficulty of obtaining timely portfolio data may render fundamental analysis lessreliable than style analysis (Cummisford and Lummer [1996]). A more moderateposition concedes that some level of fundamental analysis is necessary to groundthe style analysis, and that “style analysis can be used as an additional method toverify more traditional techniques, such as holdings-based analysis.”1 Yet eventhe strongest critics of style analysis, such as Christopherson, who advocatesholdings-based analysis instead, rarely offer empirical proof for their arguments.2
Some more empirical comparative studies have been conducted recently,however, although their focus and approach differ from that of the present study.Mayes, Jaye, and Thurston [2000], for instance, use discriminant analysistechniques to assess the consistency of returns-based style analysis with fundobjective categories for a reasonably large sample of funds. They find that styleanalysis correctly predicts category membership for a statistically significantpercentage of funds. The authors’ claims are complicated by the fact that theirdefinition of statistically significant includes a correlation of 15% for capitalappreciation funds, an unacceptably high error rate on a practical level, and bytheir use of traditional fund objectives, a method of categorizing mutual fundswhose reliability is questionable because of its partial reliance on a fund’s statedinvestment practice.
Kahn [1996] performs a future-oriented comparative study that is focused on thevalue of style analysis in predicting fund risk. Kahn finds that forecasts of the riskof a mutual fund based on the portfolio approach generally have a highercorrelation with future risk than do forecasts based on historical performance(i.e., returns-based analysis). This implies that the portfolio approach producesmore accurate predictions of risk.�Kahn bases his research on only a smallsample, however. Also supporting the superiority of portfolio-based analysis isthe study conducted by Chan, Chen, and Lakonishok [1999]. In the course of awide-ranging discussion of mutual fund investment styles, the authors devotesome attention to the relative merits of portfolio-based and style-based analysis(which they refer to as “characteristics-based” and “loadings-based” approaches,respectively). Although they find that in their general fund sample the twomethodologies have fairly close correlations in reading a fund’s investment style,in a smaller sample of cases where the two approaches are greatly mismatched,portfolio-based analysis shows greater accuracy in predicting future returns.
This paper extends the current literature by focusing on the comparative abilitiesof portfolio-based and returns-based style analysis in assessing current portfolio
5March 2002
styles. Our study, described in detail below, finds that while both returns-basedanalysis and fundamental analysis can in certain cases provide acceptable levelsof accuracy, in general fundamental analysis provides a greater degree ofaccuracy. Later, we discuss the practical implications of our findings for investorsand fiduciaries.
Data and MethodologyOur study began by selecting from Morningstar’s database those diversified U.S.equity funds for which we annual portfolios for a 12-31 date from 1997 through2000, and complete monthly performance data since 1995. This resulted in a totalsample of 586 funds (multiple share classes were eliminated).3
We initially established a baseline portfolio for each fund using a holdings-basedanalysis of each as of 12-31-2000. Each individual security in the portfolio wasidentified according to its appropriate style category: cash, bonds, internationalequity, or one of six style subcategories for U.S. equities assigned to acorresponding Russell Style Index from the Frank Russell Company: largegrowth, large value, mid-cap growth, mid-cap value, small growth, and smallvalue. [see Table 1] This set of data, referred to as FA 00, forms the “correct”style breakdown of the 586 funds as of 12-31-00—that is, the actual stylecomposition of the fund at that given point in time, as defined by the selectedindexes. We then ran similar portfolio-based analyses for the 586 funds as ofyear-end 1999 (FA 99), 1998 (FA 98), and 1997 (FA 97). In each instance,securities were classified according to Russell’s 12-31-00 subcategories.
Table 1. Style Categories and Corresponding Benchmark Indexes
Cash 90-day Treasury Bill
Bonds Lehman Brothers Aggregate
International Equity MSCI EAFE ND
U.S. Large Growth Russell Top 200 Growth
U.S. Large Value Russell Top 200 Value
U.S. Mid-Cap Growth Russell Mid Cap Growth
U.S. Mid-Cap Value Russell Mid Cap Value
U.S. Small Growth Russell 2000 Growth
U.S. Small Value Russell 2000 Value
Next we performed a comparative returns-based style analysis using aconstrained quadratic regression following Sharpe’s recommended method,which requires three years of monthly return data.4 The same Russell indexes thatwere used with the fundamental portfolios were chosen. These indexes limit themost commonly identified problems in index selection, multicollinearity andinsufficient coverage of asset classes. In addition, Russell indexes are frequentlyused as benchmarks for mutual fund managers, making them appropriate for thistest case. Finally, the Russell indexes (unlike, for example, the style indexes ofStandard & Poor’s), are comprehensive, thereby permitting the highest possible
6March 2002
hit rate for holdings within the individual mutual funds (that is, the percentage ofsecurities found in both the fund and the index). In cases where a stock crossedtwo style categories, its weighting was distributed according to a ratio assignedby Russell.5
Using the same sampling of 586 mutual fund portfolios, we ran style analysiscalculations for year-end 2000 (SA 00), 1999 (SA 99) 1998 (SA 98), and 1997(SA 97). Extending the study back to 1997 allows us to test the efficacy of styleanalysis on a current portfolio, its out-of-sample predictive value up to three yearsfrom the baseline portfolio, and its comparative value vis a vis fundamentalanalysis.
With four years of data in hand that show both the fundamental analysis andreturns-based analysis of a large sampling of diversified equity mutual funds, weare in a position to address the questions most important to investors; namely,how accurate is each methodology in its estimation of portfolio style traits, whatdegree of error can typically be expected, in what circumstances is each methodbest used, and how do the two methods stack up against one another? Our studyfirst examines the reliability of style-based analysis in assessing a current,holdings-based portfolio; it then analyzes the accuracy of fundamental analysiswhen using older portfolios.
ResultsAssessing the Style of Current PortfoliosOne of the basic questions an investor might ask is how well portfolio-based andreturns-based analysis evaluate the style exposure of a fund’s current portfolio.This is to some extent a loaded question, since one expects the fundamentalanalysis of a current portfolio to be the correct one (FA 00 in our study).6
Returns-based analysis, by definition, can only serve as a constrained estimate ofa portfolio’s current exposures. Nevertheless, the test is a reasonable one in thatthe output of returns-based style analyses are frequently used as proxies for afund’s current positioning. The question then becomes, since returns-based styleanalysis is an estimate, what is the error term? There is also a question to beasked of portfolio-based fundamental analysis: namely, at what rate does itsquality degrade over time? Since, on a pragmatic basis, the most current portfoliomay not always be available to conduct holdings-based analysis, it is instructiveto test a less-satisfactory alternative, a one-year-old portfolio. Thus, to answerboth questions regarding style analysis of current portfolios—the relativeaccuracy of a “current” returns-based style analysis and a year-old portfolio—we compare FA 00 with both SA 00 and FA 99.
Because the portfolios under consideration belong to diversified U.S. equityfunds, our primary interest throughout this study is in the results for the domesticstock portions of the portfolios. To assess these results, we use two differentmethods for measuring accuracy: correlation and mean absolute deviation.Correlation expresses in percentage terms the degree to which the holdings of atest portfolio match an actual baseline portfolio. For example, to compare large-
7March 2002
growth style exposure in a test portfolio of SA 2000 with a baseline portfolio ofFA 2000, we take the percentage of assets attributed to large growth in SA 2000and determine their fit with the large growth component of FA 2000, on apercentage basis. We then repeat this process for each style category. Correlationfigures offer a good first-line assessment of error, but to look at the actual impactof the setimation “error,” it is helpful to examine absolute deviation alongsidecorrelation. Absolute deviation--the unsigned difference between the stylecategory exposures of a test portfolio and the baseline portfolio--is a relevant andintuitive measure because, on a practical level, investors and consultants are morelikely to think in terms of the absolute deviation of an asset class from itsprescribed allocation than in percentage terms. A 75% correlation may lookacceptable at first, for example, but if it results in a plus-or-minus 15-percentage-point deviation from a style target of 20%, this correlation quickly becomes lessacceptable.
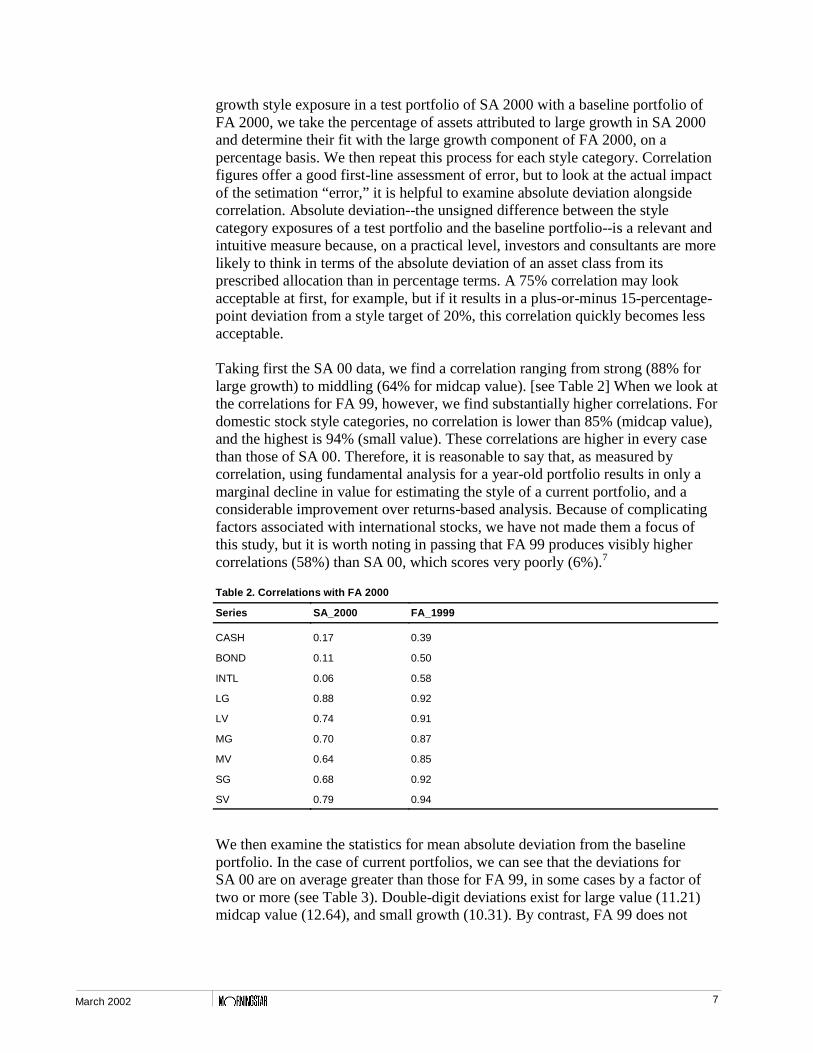
Taking first the SA 00 data, we find a correlation ranging from strong (88% forlarge growth) to middling (64% for midcap value). [see Table 2] When we look atthe correlations for FA 99, however, we find substantially higher correlations. Fordomestic stock style categories, no correlation is lower than 85% (midcap value),and the highest is 94% (small value). These correlations are higher in every casethan those of SA 00. Therefore, it is reasonable to say that, as measured bycorrelation, using fundamental analysis for a year-old portfolio results in only amarginal decline in value for estimating the style of a current portfolio, and aconsiderable improvement over returns-based analysis. Because of complicatingfactors associated with international stocks, we have not made them a focus ofthis study, but it is worth noting in passing that FA 99 produces visibly highercorrelations (58%) than SA 00, which scores very poorly (6%).7
Table 2. Correlations with FA 2000
Series SA_2000 FA_1999
CASH 0.17 0.39
BOND 0.11 0.50
INTL 0.06 0.58
LG 0.88 0.92
LV 0.74 0.91
MG 0.70 0.87
MV 0.64 0.85
SG 0.68 0.92
SV 0.79 0.94
We then examine the statistics for mean absolute deviation from the baselineportfolio. In the case of current portfolios, we can see that the deviations forSA 00 are on average greater than those for FA 99, in some cases by a factor oftwo or more (see Table 3). Double-digit deviations exist for large value (11.21)midcap value (12.64), and small growth (10.31). By contrast, FA 99 does not
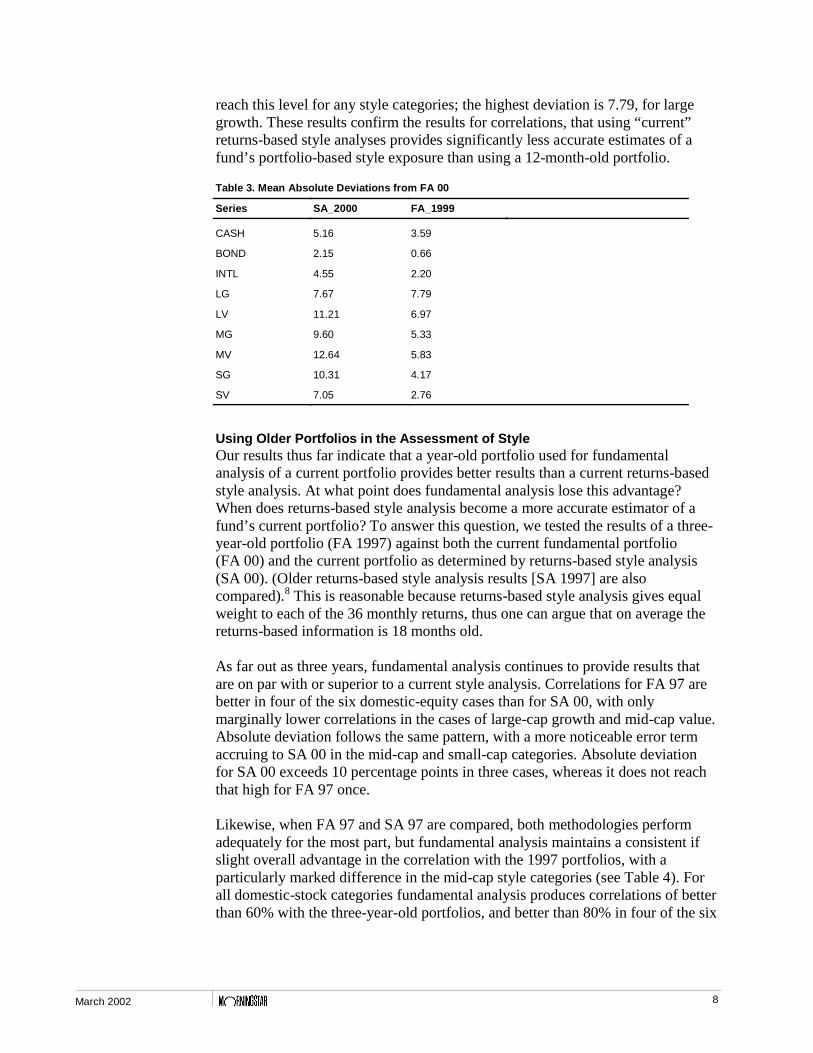
8March 2002
reach this level for any style categories; the highest deviation is 7.79, for largegrowth. These results confirm the results for correlations, that using “current”returns-based style analyses provides significantly less accurate estimates of afund’s portfolio-based style exposure than using a 12-month-old portfolio.
Table 3. Mean Absolute Deviations from FA 00
Series SA_2000 FA_1999
CASH 5.16 3.59
BOND 2.15 0.66
INTL 4.55 2.20
LG 7.67 7.79
LV 11.21 6.97
MG 9.60 5.33
MV 12.64 5.83
SG 10.31 4.17
SV 7.05 2.76
Using Older Portfolios in the Assessment of StyleOur results thus far indicate that a year-old portfolio used for fundamentalanalysis of a current portfolio provides better results than a current returns-basedstyle analysis. At what point does fundamental analysis lose this advantage?When does returns-based style analysis become a more accurate estimator of afund’s current portfolio? To answer this question, we tested the results of a three-year-old portfolio (FA 1997) against both the current fundamental portfolio(FA 00) and the current portfolio as determined by returns-based style analysis(SA 00). (Older returns-based style analysis results [SA 1997] are alsocompared).8 This is reasonable because returns-based style analysis gives equalweight to each of the 36 monthly returns, thus one can argue that on average thereturns-based information is 18 months old.
As far out as three years, fundamental analysis continues to provide results thatare on par with or superior to a current style analysis. Correlations for FA 97 arebetter in four of the six domestic-equity cases than for SA 00, with onlymarginally lower correlations in the cases of large-cap growth and mid-cap value.Absolute deviation follows the same pattern, with a more noticeable error termaccruing to SA 00 in the mid-cap and small-cap categories. Absolute deviationfor SA 00 exceeds 10 percentage points in three cases, whereas it does not reachthat high for FA 97 once.
Likewise, when FA 97 and SA 97 are compared, both methodologies performadequately for the most part, but fundamental analysis maintains a consistent ifslight overall advantage in the correlation with the 1997 portfolios, with aparticularly marked difference in the mid-cap style categories (see Table 4). Forall domestic-stock categories fundamental analysis produces correlations of betterthan 60% with the three-year-old portfolios, and better than 80% in four of the six
9March 2002
cases. Style analysis generates correlations of better than 60% in four of the sixcases (three of them higher than 70%), but in the cases of the two mid-capcategories the correlation falls to less than 40%. The mean deviations tell asimilar story.
Table 4. 1997 Correlations with and Deviations from FA 00
Series FA_1997
Corr.
SA_1997
Corr.
FA_1997
Dev.
SA_1997
Dev.
CASH 0.33 0.11 4.15 6.36
BOND 0.35 0.19 0.93 3.09
INTL 0.41 0.08 2.73 3.95
LG 0.85 0.76 7.16 9.45
LV 0.84 0.66 9.24 12.73
MG 0.71 0.38 8.20 15.26
MV 0.63 0.39 8.23 13.56
SG 0.86 0.74 5.38 11.06
SV 0.89 0.74 4.14 6.79
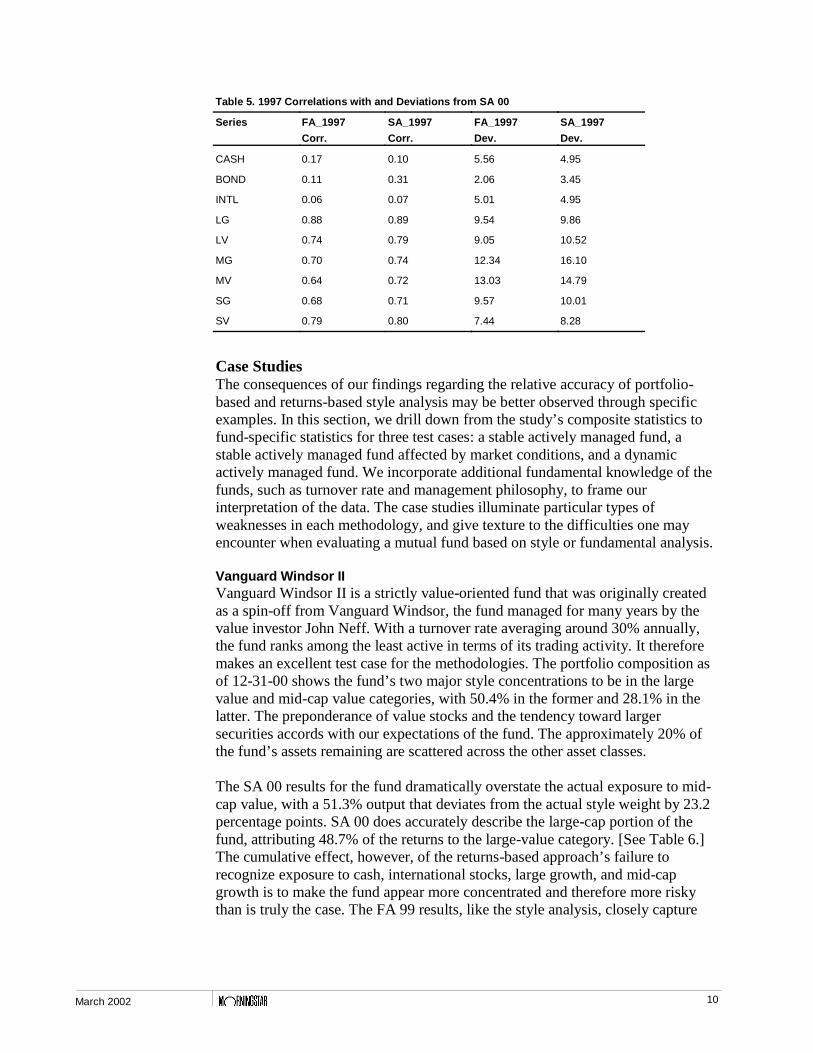
Using Returns-Based Style Analysis as a BaselineTo this point, fundamental analysis has served solely as our baseline portfolio.Thus, if the fundamental approach carries any consistent intrinsic peculiarities, itis fair to expect the fundamental analysis results of one date to approximate thoseof another date. Therefore, we also replicated our testing procedures with returns-based style analysis providing the baseline portfolio (SA 2000). Surprisingly,portfolio-based analysis maintains an advantage, though lessened, over returns-based analysis even when the latter is used as the baseline. In four of the sixdomestic-stock cases, the correlation between 2000 and 1997 for the twomethodologies is statistically quite close, within 11 percentage points of oneanother, and all are above 60%. In only one case does returns-based analysisproduce a marginally higher correlation than portfolio-based analysis. Once againin the two mid-cap examples, however, holdings-based analysis produces visiblyhigher correlations than returns-based analysis: 60% versus 42% for mid-capgrowth, and 61% versus 44% for mid-cap value. The absolute deviations showthat in the mid-cap area both methodologies depart significantly from the actualSA 97 results, with double-digit error terms for both. Yet both methodologies ingeneral perform adequate estimates even when using older portfolios or styleanalyses conducted based on earlier years of returns. The more meaningfulfinding is that fundamental analysis performs equally as well as returns-basedstyle analysis even when the latter determines the baseline portfolio; theadvantage increases when a current portfolio is determined through holdings-based analysis.
10March 2002
Table 5. 1997 Correlations with and Deviations from SA 00
Series FA_1997
Corr.
SA_1997
Corr.
FA_1997
Dev.
SA_1997
Dev.
CASH 0.17 0.10 5.56 4.95
BOND 0.11 0.31 2.06 3.45
INTL 0.06 0.07 5.01 4.95
LG 0.88 0.89 9.54 9.86
LV 0.74 0.79 9.05 10.52
MG 0.70 0.74 12.34 16.10
MV 0.64 0.72 13.03 14.79
SG 0.68 0.71 9.57 10.01
SV 0.79 0.80 7.44 8.28
Case StudiesThe consequences of our findings regarding the relative accuracy of portfolio-based and returns-based style analysis may be better observed through specificexamples. In this section, we drill down from the study’s composite statistics tofund-specific statistics for three test cases: a stable actively managed fund, astable actively managed fund affected by market conditions, and a dynamicactively managed fund. We incorporate additional fundamental knowledge of thefunds, such as turnover rate and management philosophy, to frame ourinterpretation of the data. The case studies illuminate particular types ofweaknesses in each methodology, and give texture to the difficulties one mayencounter when evaluating a mutual fund based on style or fundamental analysis.
Vanguard Windsor IIVanguard Windsor II is a strictly value-oriented fund that was originally createdas a spin-off from Vanguard Windsor, the fund managed for many years by thevalue investor John Neff. With a turnover rate averaging around 30% annually,the fund ranks among the least active in terms of its trading activity. It thereforemakes an excellent test case for the methodologies. The portfolio composition asof 12-31-00 shows the fund’s two major style concentrations to be in the largevalue and mid-cap value categories, with 50.4% in the former and 28.1% in thelatter. The preponderance of value stocks and the tendency toward largersecurities accords with our expectations of the fund. The approximately 20% ofthe fund’s assets remaining are scattered across the other asset classes.
The SA 00 results for the fund dramatically overstate the actual exposure to mid-cap value, with a 51.3% output that deviates from the actual style weight by 23.2percentage points. SA 00 does accurately describe the large-cap portion of thefund, attributing 48.7% of the returns to the large-value category. [See Table 6.]The cumulative effect, however, of the returns-based approach’s failure torecognize exposure to cash, international stocks, large growth, and mid-capgrowth is to make the fund appear more concentrated and therefore more riskythan is truly the case. The FA 99 results, like the style analysis, closely capture
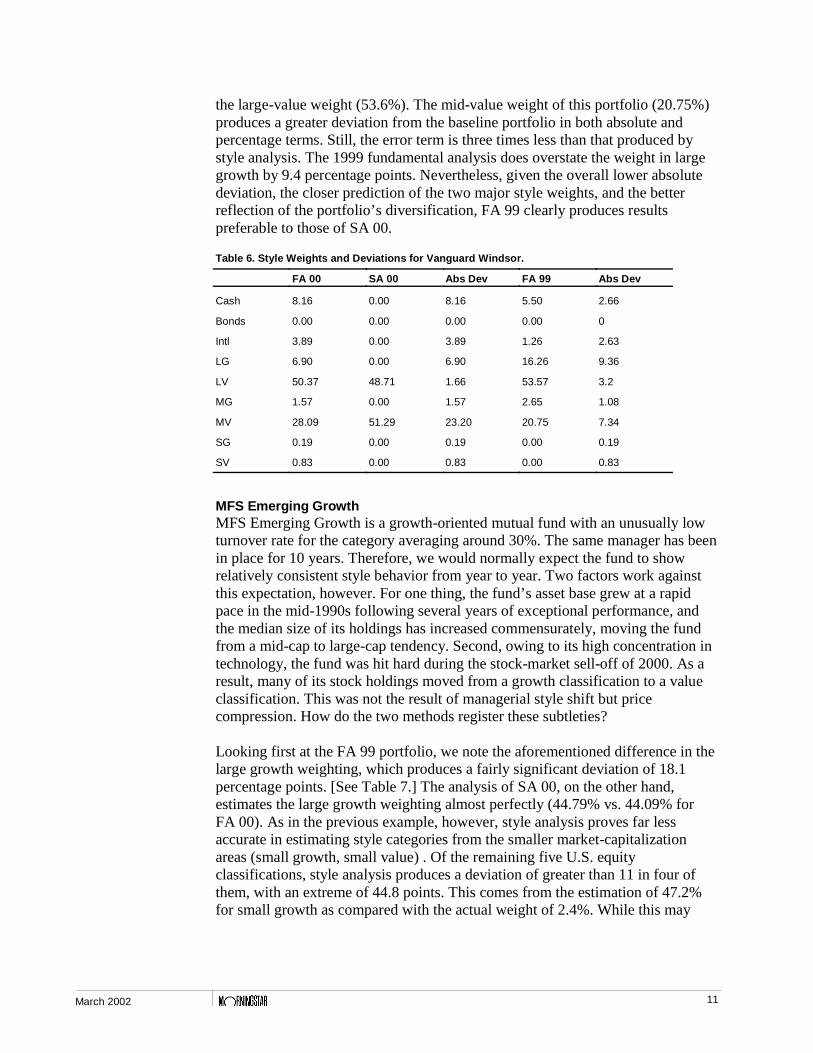
11March 2002
the large-value weight (53.6%). The mid-value weight of this portfolio (20.75%)produces a greater deviation from the baseline portfolio in both absolute andpercentage terms. Still, the error term is three times less than that produced bystyle analysis. The 1999 fundamental analysis does overstate the weight in largegrowth by 9.4 percentage points. Nevertheless, given the overall lower absolutedeviation, the closer prediction of the two major style weights, and the betterreflection of the portfolio’s diversification, FA 99 clearly produces resultspreferable to those of SA 00.
Table 6. Style Weights and Deviations for Vanguard Windsor.
FA 00 SA 00 Abs Dev FA 99 Abs Dev
Cash 8.16 0.00 8.16 5.50 2.66
Bonds 0.00 0.00 0.00 0.00 0
Intl 3.89 0.00 3.89 1.26 2.63
LG 6.90 0.00 6.90 16.26 9.36
LV 50.37 48.71 1.66 53.57 3.2
MG 1.57 0.00 1.57 2.65 1.08
MV 28.09 51.29 23.20 20.75 7.34
SG 0.19 0.00 0.19 0.00 0.19
SV 0.83 0.00 0.83 0.00 0.83
MFS Emerging GrowthMFS Emerging Growth is a growth-oriented mutual fund with an unusually lowturnover rate for the category averaging around 30%. The same manager has beenin place for 10 years. Therefore, we would normally expect the fund to showrelatively consistent style behavior from year to year. Two factors work againstthis expectation, however. For one thing, the fund’s asset base grew at a rapidpace in the mid-1990s following several years of exceptional performance, andthe median size of its holdings has increased commensurately, moving the fundfrom a mid-cap to large-cap tendency. Second, owing to its high concentration intechnology, the fund was hit hard during the stock-market sell-off of 2000. As aresult, many of its stock holdings moved from a growth classification to a valueclassification. This was not the result of managerial style shift but pricecompression. How do the two methods register these subtleties?
Looking first at the FA 99 portfolio, we note the aforementioned difference in thelarge growth weighting, which produces a fairly significant deviation of 18.1percentage points. [See Table 7.] The analysis of SA 00, on the other hand,estimates the large growth weighting almost perfectly (44.79% vs. 44.09% forFA 00). As in the previous example, however, style analysis proves far lessaccurate in estimating style categories from the smaller market-capitalizationareas (small growth, small value) . Of the remaining five U.S. equityclassifications, style analysis produces a deviation of greater than 11 in four ofthem, with an extreme of 44.8 points. This comes from the estimation of 47.2%for small growth as compared with the actual weight of 2.4%. While this may
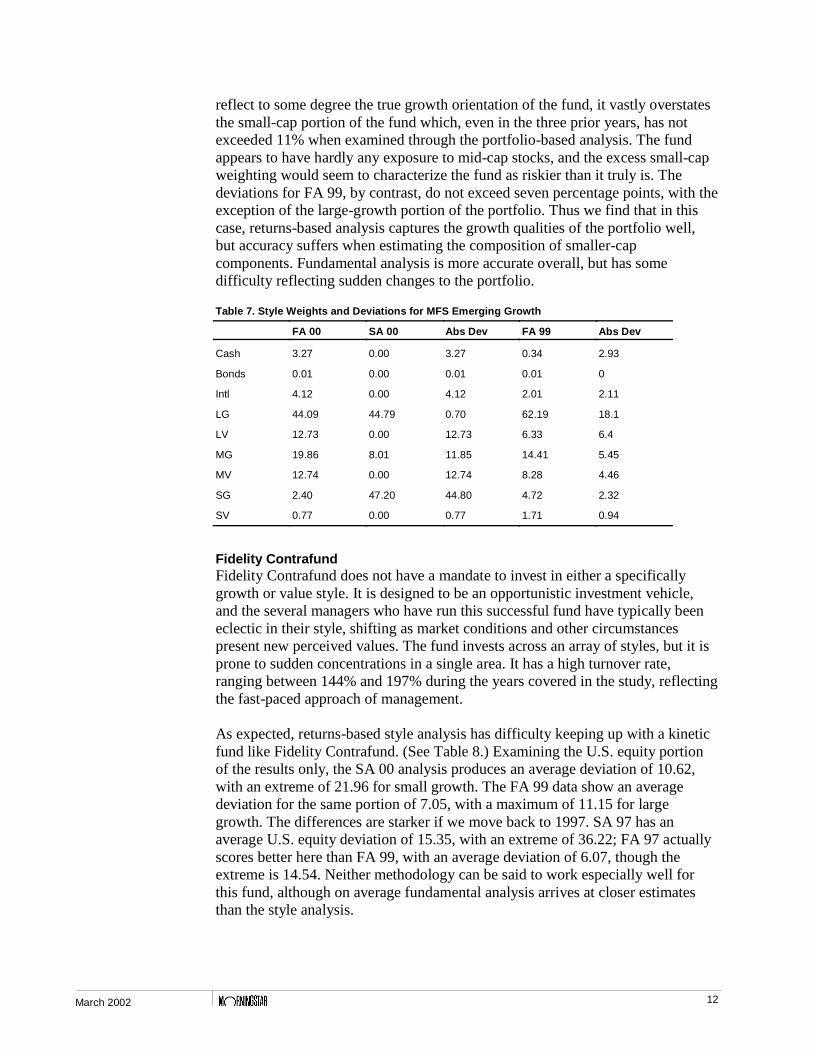
12March 2002
reflect to some degree the true growth orientation of the fund, it vastly overstatesthe small-cap portion of the fund which, even in the three prior years, has notexceeded 11% when examined through the portfolio-based analysis. The fundappears to have hardly any exposure to mid-cap stocks, and the excess small-capweighting would seem to characterize the fund as riskier than it truly is. Thedeviations for FA 99, by contrast, do not exceed seven percentage points, with theexception of the large-growth portion of the portfolio. Thus we find that in thiscase, returns-based analysis captures the growth qualities of the portfolio well,but accuracy suffers when estimating the composition of smaller-capcomponents. Fundamental analysis is more accurate overall, but has somedifficulty reflecting sudden changes to the portfolio.
Table 7. Style Weights and Deviations for MFS Emerging Growth
FA 00 SA 00 Abs Dev FA 99 Abs Dev
Cash 3.27 0.00 3.27 0.34 2.93
Bonds 0.01 0.00 0.01 0.01 0
Intl 4.12 0.00 4.12 2.01 2.11
LG 44.09 44.79 0.70 62.19 18.1
LV 12.73 0.00 12.73 6.33 6.4
MG 19.86 8.01 11.85 14.41 5.45
MV 12.74 0.00 12.74 8.28 4.46
SG 2.40 47.20 44.80 4.72 2.32
SV 0.77 0.00 0.77 1.71 0.94
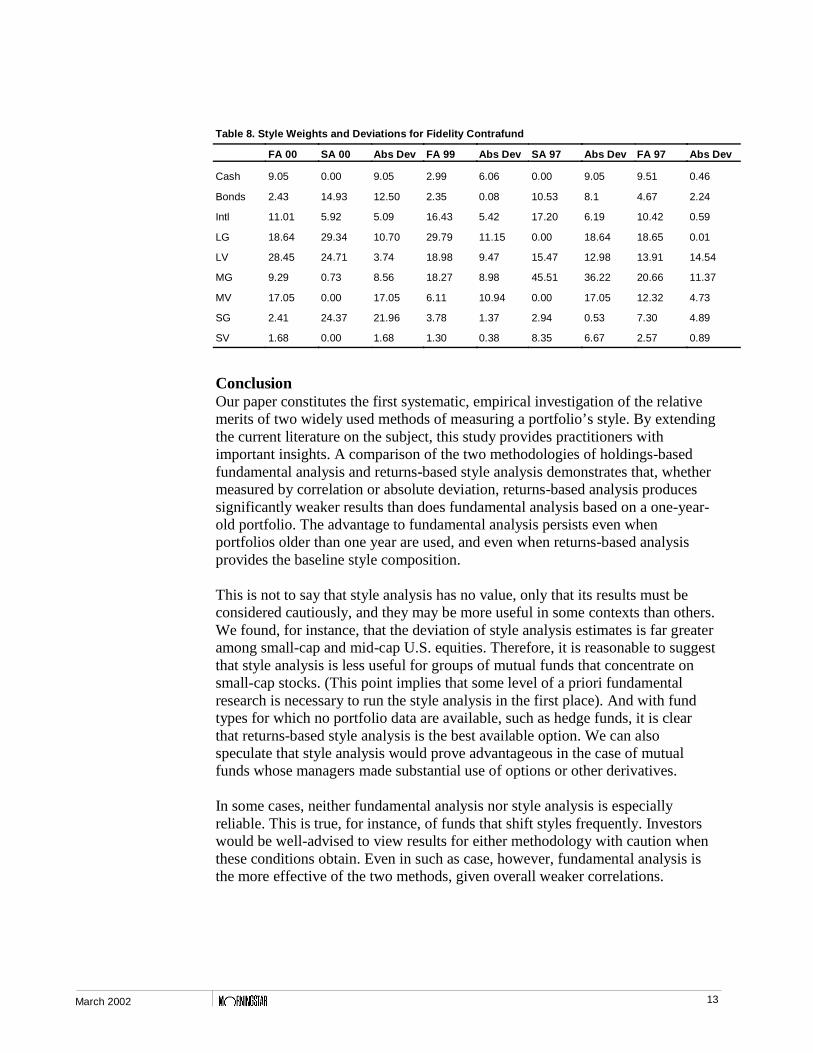
Fidelity ContrafundFidelity Contrafund does not have a mandate to invest in either a specificallygrowth or value style. It is designed to be an opportunistic investment vehicle,and the several managers who have run this successful fund have typically beeneclectic in their style, shifting as market conditions and other circumstancespresent new perceived values. The fund invests across an array of styles, but it isprone to sudden concentrations in a single area. It has a high turnover rate,ranging between 144% and 197% during the years covered in the study, reflectingthe fast-paced approach of management.
As expected, returns-based style analysis has difficulty keeping up with a kineticfund like Fidelity Contrafund. (See Table 8.) Examining the U.S. equity portionof the results only, the SA 00 analysis produces an average deviation of 10.62,with an extreme of 21.96 for small growth. The FA 99 data show an averagedeviation for the same portion of 7.05, with a maximum of 11.15 for largegrowth. The differences are starker if we move back to 1997. SA 97 has anaverage U.S. equity deviation of 15.35, with an extreme of 36.22; FA 97 actuallyscores better here than FA 99, with an average deviation of 6.07, though theextreme is 14.54. Neither methodology can be said to work especially well forthis fund, although on average fundamental analysis arrives at closer estimatesthan the style analysis.
13March 2002
Table 8. Style Weights and Deviations for Fidelity Contrafund
FA 00 SA 00 Abs Dev FA 99 Abs Dev SA 97 Abs Dev FA 97 Abs Dev
Cash 9.05 0.00 9.05 2.99 6.06 0.00 9.05 9.51 0.46
Bonds 2.43 14.93 12.50 2.35 0.08 10.53 8.1 4.67 2.24
Intl 11.01 5.92 5.09 16.43 5.42 17.20 6.19 10.42 0.59
LG 18.64 29.34 10.70 29.79 11.15 0.00 18.64 18.65 0.01
LV 28.45 24.71 3.74 18.98 9.47 15.47 12.98 13.91 14.54
MG 9.29 0.73 8.56 18.27 8.98 45.51 36.22 20.66 11.37
MV 17.05 0.00 17.05 6.11 10.94 0.00 17.05 12.32 4.73
SG 2.41 24.37 21.96 3.78 1.37 2.94 0.53 7.30 4.89
SV 1.68 0.00 1.68 1.30 0.38 8.35 6.67 2.57 0.89
ConclusionOur paper constitutes the first systematic, empirical investigation of the relativemerits of two widely used methods of measuring a portfolio’s style. By extendingthe current literature on the subject, this study provides practitioners withimportant insights. A comparison of the two methodologies of holdings-basedfundamental analysis and returns-based style analysis demonstrates that, whethermeasured by correlation or absolute deviation, returns-based analysis producessignificantly weaker results than does fundamental analysis based on a one-year-old portfolio. The advantage to fundamental analysis persists even whenportfolios older than one year are used, and even when returns-based analysisprovides the baseline style composition.
This is not to say that style analysis has no value, only that its results must beconsidered cautiously, and they may be more useful in some contexts than others.We found, for instance, that the deviation of style analysis estimates is far greateramong small-cap and mid-cap U.S. equities. Therefore, it is reasonable to suggestthat style analysis is less useful for groups of mutual funds that concentrate onsmall-cap stocks. (This point implies that some level of a priori fundamentalresearch is necessary to run the style analysis in the first place). And with fundtypes for which no portfolio data are available, such as hedge funds, it is clearthat returns-based style analysis is the best available option. We can alsospeculate that style analysis would prove advantageous in the case of mutualfunds whose managers made substantial use of options or other derivatives.
In some cases, neither fundamental analysis nor style analysis is especiallyreliable. This is true, for instance, of funds that shift styles frequently. Investorswould be well-advised to view results for either methodology with caution whenthese conditions obtain. Even in such as case, however, fundamental analysis isthe more effective of the two methods, given overall weaker correlations.
14March 2002
However, in most cases where holdings data are available, our study supports theclaim that portfolio-based fundamental analysis is the preferred methodology.Portfolio data do not need to be absolutely current to provide an acceptabledegree of predictive efficacy. A further advantage of fundamental analysis is thatonly one year’s worth of data are needed to perform an acceptable calculation, asopposed to the three years’ data needed to run returns-based style analysis. Thishas the potential of making fundamental analysis more affordable for consultantsweighing the costs of each approach, particularly when new funds are involved.
While our study does not address the question of how well the two approaches tocurrent portfolio style predict future style exposure of mutual funds--a potentiallyimportant question for those who view style as a proxy for risk--existing studies(Kahn [1986] and Chan et al. [2001]) show that fundamental analysis has greateraccuracy than returns-based analysis when analyzed from this perspective as well.Therefore, the portfolio-based approach to style analysis should be the method ofchoice in most situations. In the future, our research will address this topic of therisk implications of style exposure.
Endnotes1 Mayes et al [2000], p. 103.2 Kahn [1996] is one exception to this trend.3 Our study does not make any adjustments for selection bias, but we do not envision thatdoing so would affect the results in any meaningful way.4 For a detailed description of the methodology, see Sharpe [1988].5 Certain stocks classified by Russell into is style indexes may contain a mixture of the priceand growth characteristics associated with growth or value. In such cases, Russell weights thestock according to its combined features (e.g., 70% growth, 30% value). When weencountered cases of such stocks in our study, we distributed their market caps across theindexes based on the ratio designated by Russell.6 This may not always be the case, however, since the individual securities within a portfoliomay differ from their Russell categorization. The total assets of a company such as Microsoft,for example, may in fact be allocated 10% to cash. The difficulty and labor required to tracknet assets within this information would make it an impractical addition to the portfolio-basedmethod.7 Many foreign-based multinational companies have behavioral characteristics that duringsome periods tend to mimic those of large U.S. stocks, leading returns-based style analysis tofrequently misattribute international stock performance. Multicollinearity is clearly present,and it is possible that improved index selection could partially correct the problem. Anadditional problem is that with only a small sample of stocks, minor numerical changes instyle composition produce significant percentage shifts.8 The same data comparing current and older style analysis results could also be used, inreverse, to assess each method’s relative efficacy as an attribution measurement for a mutualfund’s past style behavior.

15March 2002
ReferencesBuetow, Gerald W., Jr., Johnson, Robert R., and Runkle, David E. "The Inconsistency ofReturn-Based Style Analysis." Journal of Portfolio Management, Spring 2000, pp. 61-77.
Chan, Louis K.C., Chen, Hsiu-Lang, and Lakonishok, Josef. "On Mutual Fund InvestmentStyles." National Bureau of Economic Research Working Paper 7215.http://www.nber.org/papers/w7215
Christopherson, Jon A. "Equity Style Classifications." Journal of Portfolio Management,Spring 1995, pp. 32-43.
Christopherson, Jon A. and Sabin, Frank C. "How Effective is Effective Mix?" RussellResearch Commentary, Jan. 1999, pp. 1-18.
Cummisford, Robert and Lummer, Scott. "Controlling the Limitations of Style Analysis."Journal of Financial Planning, Oct. 1996, pp. 70-76.
Kahn, Ronald N. "Forecasting Mutual Fund Risk: Current Holdings or Past Performance?"Barra Research Report, September 1996.
Lieberman, Diana L. "Return-Based Style Analysis: Are Quarterly Returns As Meaningful?"Journal of Investing, Fall 1996, pp. 51-55.
Lobosco, Angelo and DiBartolomeo Dan. "Approximating the Confidence Intervals forSharpe Style Weights." Financial Analysts Journal, July/August 1997, pp. 80-85.
Mayes, Timothy R., Jay, Nancy R., and Thurston, Robin. "A Returns-Based Style AnalysisExamination of Asset Classes." Journal of Financial Planning, August 2000, pp. 94-104.
Sharpe, William. "Asset Allocation: Management Style and Performance Measurement."Journal of Portfolio Management, Winter 1992, pp. 7-19.
---------. "Determining a Fund’s Effective Asset Mix." Investment Management Review,December 1988, pp. 59-69.
Morningstar, Inc. 225 W. Wacker, Drive Suite 400 Chicago, IL 60606
The authors wish to acknowledge research assistance from Matthew Gries, Morningstar researchanalyst. In addition, helpful comments within Morningstar have been received from Paul Kaplan,Xiaohua Xia, and Kathryn Allyn. We also thank René Stulz of the Ohio State University for hisexcellent insights.
©2002 Morningstar, Inc. All rights reserved.