Embed Size (px)
Citation preview

© AB InBev 2012 – All rights reserved
Morgan Stanley Consumer and Retail Conference New York City, 13th November 2012 Carlos Brito, CEO - Anheuser-Busch InBev

© AB InBev 2012 – All rights reserved
Forward looking statements There are statements in this document, such as statements that include the words or phrases “outlook”, “will likely result”, “are expected to”, “will continue”, “is anticipated”, “estimate”, “project”, “may” or similar expressions that are “forward looking statements”. These statements are subject to certain risks and uncertainties. Actual results may differ materially from those suggested by these statements due to, among others, the risks or uncertainties listed below. These forward looking statements are not guarantees of future performance. Rather, they are based on current views and assumptions and involve known and unknown risks, uncertainties and other factors, many of which are outside our control and are difficult to predict, that may cause actual results or developments to differ materially from any future results or developments expressed or implied by the forward looking statements. Factors that could cause actual results to differ materially from those contemplated by the forward looking statements include, among others: local, regional, national and international economic conditions, including the risks of a global recession or a recession in one or more of our key markets, and the impact they may have on us and our customers and our assessment of that impact; limitations on our ability to contain costs and expenses; our expectations with respect to expansion, premium growth, accretion to reported earnings, working capital improvements and investment income or cash flow projections; our ability to continue to introduce competitive new products and services on a timely, cost-effective basis; the effects of competition and consolidation in the markets in which we operate, which may be influenced by regulation, deregulation or enforcement policies; changes in consumer spending; changes in applicable laws, regulations and taxes in jurisdictions in which we operate, including the laws and regulations governing our operations, changes to tax benefit programs as well as actions or decisions of courts and regulators; changes in pricing environments; volatility in the prices of raw materials, commodities, water and energy; difficulties in maintaining relationships with employees; the monetary and interest rate policies of central banks, in particular the European Central Bank, the Board of Governors of the U.S. Federal Reserve System, the Bank of England, Banco Central do Brasil and other central banks; continued availability of financing and our ability to achieve our targeted coverage and debt levels and terms, including the risk of constraints on financing in the event of a credit rating downgrade; financial risks, such as interest rate risk, foreign exchange rate risk, commodity risk, asset price risk, equity market risk, counterparty risk, sovereign risk, liquidity risk, inflation or deflation; regional or general changes in asset valuations; greater than expected costs (including taxes) and expenses; the risk of unexpected consequences resulting from acquisitions; tax consequences of restructuring and our ability to optimize our tax rate; the outcome of pending and future litigation and governmental proceedings; changes in government policies; natural and other disasters; any inability to economically hedge certain risks; inadequate impairment provisions and loss reserves; technological changes; and our success in managing the risks involved in the foregoing. Where mentioned in the presentation, all performance measures (EBITDA, EBIT, profit, tax rate, EPS) are presented on a “normalized” basis, which means they are presented before non-recurring items. Our statements regarding financial risks, including interest rate risk, foreign exchange rate risk, commodity risk, asset price risk, equity market risk, counterparty risk, sovereign risk, inflation and deflation, are subject to uncertainty. For example, certain market and financial risk disclosures are dependent on choices about key model characteristics and assumptions and are subject to various limitations. By their nature, certain of the market or financial risk disclosures are only estimates and, as a result, actual future gains and losses could differ materially from those that have been estimated. Without prejudice to our obligations under Belgian and US law in relation to disclosure and ongoing information, we undertake no obligation to update publicly or revise any forward looking statements, whether as a result of new information, future events or otherwise.
1

© AB InBev 2012 – All rights reserved
Summary of 3Q12 Results
• Revenue +9.1% in 3Q12
• Revenue per hl +10.2% in 3Q12
US revenue per hl +5.7%
Brazil revenue per hl +18.3%
• Focus Brands +1.3% and Global Brands +5.8% in 3Q12
• EBITDA growth +10.6% in 3Q12 and + 6.9% in 9M12
• EBITDA margin +54 bps to 38.7% in 3Q12
• EPS +7.3% in 3Q12 to $1.17 and +21.6% in 9Q12 to $3.43
2 Note: EBITDA is presented on a “normalized” basis before non-recurring items.

© AB InBev 2012 – All rights reserved
Volume growth of our Focus Brands has outpaced the rest of our portfolio
1.9%
0.3%
1.4%
-0.1% 0.2%
2.7%
1.9%
4.8%
0.8%
1.8%
% volume growth
Own Beer Focus Brands
2008 2009 2010 2011 9M12
3

© AB InBev 2012 – All rights reserved
Global Brands volume +5.8% in 3Q12
4

© AB InBev 2012 – All rights reserved
US volumes
• Industry STRs (Selling Day Adjusted) + 0.3% in 9M12
• AB InBev STRs (Selling Day Adjusted) -0.2% in 9M12
5 (1) Revenue / hl figure refers to Beer only for the US © AB InBev 2012 – All rights reserved
-2.2%
-1.2%
+0.3%
-3.2%
-2.2%
-0.2%
Industry STRs ABI STRs
FY10 FY11 9M12
© AB InBev 2012 – All rights reserved 6 (1) Revenue / hl figure refers to Beer only for the US © AB InBev 2012 – All rights reserved
Marginal market share decline of
26 bps in 9M12
Drivers of volume and share:
• Bud Light family, Michelob Ultra,
Stella Artois & Shock Top
Revenue / hl +5.7% (1)
• 200 bps of brand mix
Brand and innovation investments
US – Share performance

© AB InBev 2012 – All rights reserved
Bud Light – NFL Season in full swing
7 © AB InBev 2012 – All rights reserved Note: US Volume growth and share figures are based on estimated STRs

© AB InBev 2012 – All rights reserved 8
• New 22oz bottle and 12oz bottle/18 pack
• Share of over 0.9% since launch
• Less than 50% of volume sourcing from AB brands
― Significant proportion coming from hard liquor and other beverages
© AB InBev 2012 – All rights reserved
Bud Light Platinum

© AB InBev 2012 – All rights reserved
Bud Light Lime – Lime-A-Rita
9 © AB InBev 2012 – All rights reserved
• One of the hottest brands in beer, 2nd fastest growing brand in the category
• +80% distribution in the off-trade, with estimated share in 3Q12 of over 0.4%
• Premium of +50-60%
• Initial research shows +40% of volume being sourced from hard liquor and other beverages outside of beer

© AB InBev 2012 – All rights reserved
Budweiser – MLB and Folds of Honor
10 © AB InBev 2012 – All rights reserved

© AB InBev 2012 – All rights reserved 11 © AB InBev 2012 – All rights reserved
Budweiser activations in 3Q12

Michelob Ultra volumes +7.3% in 3Q12
Note: US Volume growth and share figures are based on estimated STRs © AB InBev 2012 – All rights reserved 12
+15 bps
of share in 3Q12

© AB InBev 2012 – All rights reserved Note: US Volume growth and share figures are based on estimated STRs
Best of Belgium promotions
High-end portfolio continues to thrive
13 13 © AB InBev 2012 – All rights reserved
Stella Artois volumes +17%
in 3Q12

© AB InBev 2012 – All rights reserved
Shock Top – Scalable craft
© AB InBev 2012 – All rights reserved Note: US Volume growth figures are based on estimated STRs 14

© AB InBev 2012 – All rights reserved
Beer Brazil results – 3Q12
• Industry
Volumes +1.8% in 3Q12, +2.6% in 9M12
• AB InBev
Beer volumes +0.2% in 3Q12, and +2.3% in 9M12
Beer market share -110 bp due to timing of price increase
Beer revenue / hl growth of +18.3% (1)
Good growth in premium segment
15 (1) Revenue / hl figure applies to Beer Brazil

© AB InBev 2012 – All rights reserved © AB InBev 2012 – All rights reserved 16
Skol – New visual identity

© AB InBev 2012 – All rights reserved
Antarctica Sub Zero – Results
10,0
11,0
12,0
13,0
14,0
15,0
16,0
jan/07 jan/08 jan/09 jan/10 jan/11 jan/12
ANTARCTICA MARKET SHARE EVOLUTION
All-time
high
Source: Nielsen
• Brazil’s most important innovation in 2011 (1/3 of FY11 innovation volumes)
• Antarctica market share & brand preference are healthiest in 15 years
17 © AB InBev 2012 – All rights reserved
© AB InBev 2012 – All rights reserved
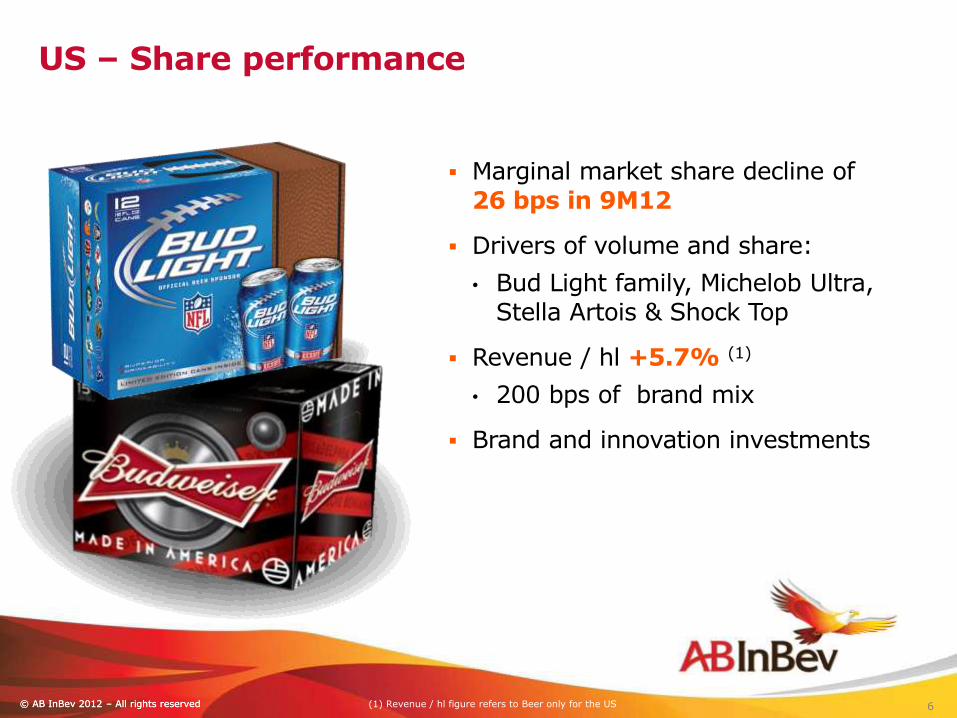
4% 4%
20% 22%
25%
30%
46%
54%
Jan Feb Mar Apr May Jun Jul Aug
Source: Company data
Production footprint - 2012
300 ml Returnable Glass Bottle (RGB) opportunity
300ml Coverage (Off trade Key accounts)
São Paulo Guarulhos Jacareí
2011
2012
Rio de Janeiro Piraí 1 Piraí 2
18

© AB InBev 2012 – All rights reserved
Route to Market innovations
Micro Events Nosso Bar
Pit stops
19

© AB InBev 2012 – All rights reserved 20 © AB InBev 2012 – All rights reserved
The premium opportunity is driven mainly by international brands
Weight within Premium volumes (%)
Source: Nielsen
Premium brand penetration (% of beer consumers)
Source: Ipsos
30% 99% 98%
91% 87% 76%
Domestic
2010 2009 2008
2%
2007
1%
2011
13% 9%
24%
International
Premium represents only ~5% of industry volumes

© AB InBev 2012 – All rights reserved
Brazil – Premium Performance
• 2 domestic & 2 international premium brands
• Budweiser expanding distribution
21
Sophistication
Key image attributes
Daily premium Successful
international brand
Self-discovery
Knowledge/ Creativity
Coolness Status Authenticity
130 – 140
135 – 145
170 – 180
190 – 200
Price Index Range

© AB InBev 2012 – All rights reserved
China results – 3Q12
• Beer Volume +2.2%
Industry performance in regional strongholds impacted by adverse weather conditions
• Focus Brands +9.2% led by Budweiser and Harbin
• Market share growth of 20 bps YTD August (1)
• Revenue/hl +10.1% (2) mainly driven by brand mix, as we continue to focus on premiumization
22
(1) Internal estimate
(2) Revenue/hl calculation for Asia Pacific Zone

© AB InBev 2012 – All rights reserved
Source: Plato Logic, May 2012
China represents 25% of the global beer market by volume, with low but rapidly growing per capita consumption
China
25%
USA
13%
Brazil
7% Other North
America
5%
Western
Europe
15%
Central &
Eastern
Europe
13%
Other Latin
America
6%
Other Asia
Pacific
10%
Africa &
Middle East
6%
17.5
23.2
35.9
40.8
47.0
66.9
78.2
2000
2005
2011F
2015F
2020F
Brazil
USA
Liters per capita
23

© AB InBev 2012 – All rights reserved
Chinese consumers have a high preference for trading up
42
49
Japan
0
26
Brazil
% of respondents
100
Europe
47
38
16
US
48
35
18
Russia
27
51
23 34
32
34
India
32
43
China
33
29
39
10
80
60
40
20
Trading up/down tendency by country
Source: BCG Global Consumer Sentiment Barometer
Trade up
Neither
Trade down
24

© AB InBev 2012 – All rights reserved
Budweiser performance
Brand health priorities
1. Expanding the “Favorite Brand” score among premium drinkers
2. Maintaining a strong position as #1 premium brand
Volume performance
2008 2009 2010 2011
© AB InBev 2012 – All rights reserved 25
100% in 3 years

© AB InBev 2012 – All rights reserved
Brand health: Top 3 Favorite brand among
18-29 year olds
Volume performance:
2009 2010 2011 2009 2010 2011 2012E
Harbin is one of our growth engines in China
43% in 2 years
22pp in 3 years
© AB InBev 2012 – All rights reserved 26

© AB InBev 2012 – All rights reserved © AB InBev 2012 – All rights reserved
Packaging
Retail Campaign
• Online video
• TV commercials
• Billboards and transportation
• Print media
• Program sponsorship
27
Harbin NBA sponsorship Season highlights
© AB InBev 2012 – All rights reserved
In summary
28
• Solid Revenue growth and Revenue per hl growth
• Strong Focus Brands and Global Brands volumes
• EBITDA growth +10.6% in 3Q12 and + 6.9% in 9M12
• EBITDA margin expansion

© AB InBev 2012 – All rights reserved
Source: Plato as of May 2012. (a) AB InBev present through a joint venture. (b) Post merger of Efes and SABMiller’s assets.
Increases our exposure to key volume growth markets
Estimated Contribution to Global Beer Volume Growth 2011-2020
42.9%
8.9%
5.3% 4.6% 4.6%
3.7% 3.7%
China Brazil India Vietnam USA Mexico Russia
AB InBev Market
Share Position
3 1 NA NA 1 1
(a)
3 (b)
29
Mexico – an additional source of growth

© AB InBev 2012 – All rights reserved
Mexico is the world’s fourth largest profit pool
The combined company will hold the #1 position in 4 of the top 5 profit pools globally
Source: Nomura Research Report on European Beverages dated May 14th, 2012 Note: Profit pool equals 2011 consolidated EBIT per market
$7.8 bn
$3.9 bn
$2.0 bn $1.7 bn $1.2 bn
U.S. Brazil Japan Mexico Canada
#1
#1
#1
#1
-
AB InBev Position
Unchanged Markets New Market Export Only
Profit Pool Size
30

© AB InBev 2012 – All rights reserved 31