Embed Size (px)
Citation preview
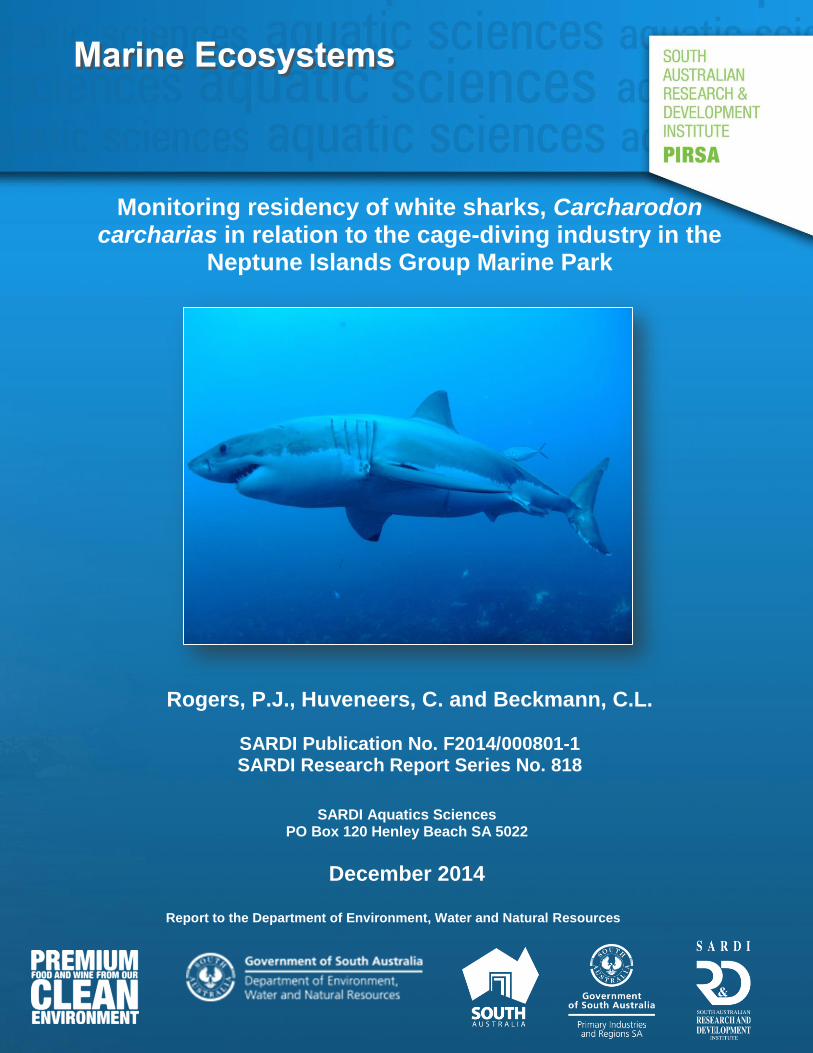
Monitoring residency of white sharks, Carcharodon carcharias in relation to the cage-diving industry in the
Neptune Islands Group Marine Park
Rogers, P.J., Huveneers, C. and Beckmann, C.L.
SARDI Publication No. F2014/000801-1 SARDI Research Report Series No. 818
SARDI Aquatics Sciences PO Box 120 Henley Beach SA 5022
December 2014
Report to the Department of Environment, Water and Natural Resources
Rogers, P.J. et al (2014) Monitoring residency of white sharks
ii
Monitoring residency of white sharks, Carcharodon carcharias in relation to the cage-diving industry in the
Neptune Islands Group Marine Park
Report to the Department of Environment, Water and Natural Resources
Rogers, P.J., Huveneers, C. and Beckmann, C.L.
SARDI Publication No. F2014/000801-1 SARDI Research Report Series No. 818
December 2014
Rogers, P.J. et al (2014) Monitoring residency of white sharks
iii
This publication may be cited as: Rogers, P. J., Huveneers, C, and Beckmann, C.L. (2014). Monitoring residency of white sharks, Carcharodon carcharias in relation to the cage-diving industry in the Neptune Islands Group Marine Park. Report to the Department of Environment, Water and Natural Resources. South Australian Research and Development Institute (Aquatic Sciences), Adelaide. SARDI Publication No. F2014/000801-1. SARDI Research Report Series No. 818. 69pp. South Australian Research and Development Institute SARDI Aquatic Sciences 2 Hamra Avenue West Beach SA 5024 Telephone: (08) 8207 5400 Facsimile: (08) 8207 5406 http://www.sardi.sa.gov.au
DISCLAIMER The authors warrant that they have taken all reasonable care in producing this report. The report has been through the SARDI internal review process, and has been formally approved for release by the Research Chief, Aquatic Sciences. Although all reasonable efforts have been made to ensure quality, SARDI does not warrant that the information in this report is free from errors or omissions. SARDI does not accept any liability for the contents of this report or for any consequences arising from its use or any reliance placed upon it. The SARDI Report Series is an Administrative Report Series which has not been reviewed outside the department and is not considered peer-reviewed literature. Material presented in these Administrative Reports may later be published in formal peer-reviewed scientific literature.
© 2014 SARDI This work is copyright. Apart from any use as permitted under the Copyright Act 1968 (Cth), no part may be reproduced by any process, electronic or otherwise, without the specific written permission of the copyright owner. Neither may information be stored electronically in any form whatsoever without such permission.
Printed in Adelaide: December 2014 SARDI Publication No. F2014/000801-1 SARDI Research Report Series No. 818 Author(s): Rogers, P.J., Huveneers, C. and Beckmann, C.L. Reviewer(s): Dobrovolskis, A. and Wiltshire, K. Approved by: Deveney, M. Sub Program Leader – Marine Pests Signed: Date: 16 December 2014 Distribution: DEWNR, SAASC Library, University of Adelaide Library, Parliamentary
Library, State Library and National Library Circulation: Public Domain
Rogers, P.J. et al (2014) Monitoring residency of white sharks
iv
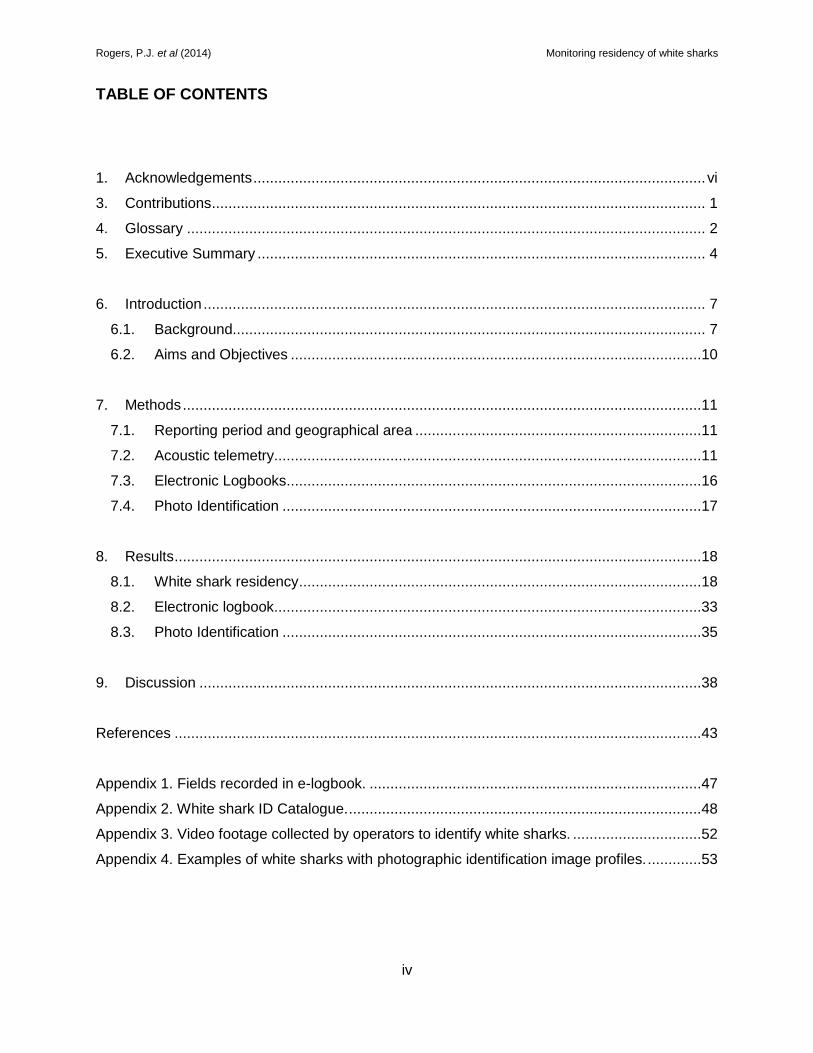
TABLE OF CONTENTS
1. Acknowledgements ............................................................................................................. vi
3. Contributions ....................................................................................................................... 1
4. Glossary ............................................................................................................................. 2
5. Executive Summary ............................................................................................................ 4
6. Introduction ......................................................................................................................... 7
6.1. Background.................................................................................................................. 7
6.2. Aims and Objectives ...................................................................................................10
7. Methods .............................................................................................................................11
7.1. Reporting period and geographical area .....................................................................11
7.2. Acoustic telemetry.......................................................................................................11
7.3. Electronic Logbooks ....................................................................................................16
7.4. Photo Identification .....................................................................................................17
8. Results ...............................................................................................................................18
8.1. White shark residency .................................................................................................18
8.2. Electronic logbook.......................................................................................................33
8.3. Photo Identification .....................................................................................................35
9. Discussion .........................................................................................................................38
References ...............................................................................................................................43
Appendix 1. Fields recorded in e-logbook. ................................................................................47
Appendix 2. White shark ID Catalogue. .....................................................................................48
Appendix 3. Video footage collected by operators to identify white sharks. ...............................52
Appendix 4. Examples of white sharks with photographic identification image profiles. .............53
Rogers, P.J. et al (2014) Monitoring residency of white sharks
v
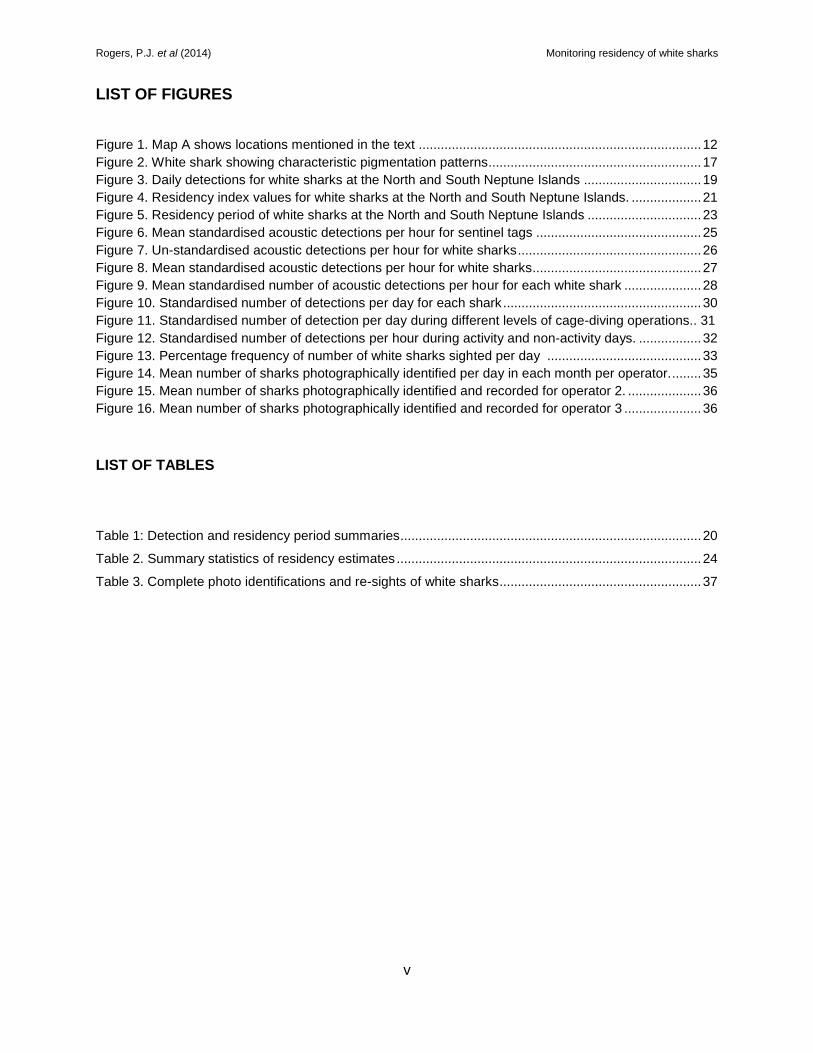
LIST OF FIGURES
Figure 1. Map A shows locations mentioned in the text ............................................................................. 12
Figure 2. White shark showing characteristic pigmentation patterns.......................................................... 17
Figure 3. Daily detections for white sharks at the North and South Neptune Islands ................................ 19
Figure 4. Residency index values for white sharks at the North and South Neptune Islands. ................... 21
Figure 5. Residency period of white sharks at the North and South Neptune Islands ............................... 23
Figure 6. Mean standardised acoustic detections per hour for sentinel tags ............................................. 25
Figure 7. Un-standardised acoustic detections per hour for white sharks .................................................. 26
Figure 8. Mean standardised acoustic detections per hour for white sharks .............................................. 27
Figure 9. Mean standardised number of acoustic detections per hour for each white shark ..................... 28
Figure 10. Standardised number of detections per day for each shark ...................................................... 30
Figure 11. Standardised number of detection per day during different levels of cage-diving operations.. 31
Figure 12. Standardised number of detections per hour during activity and non-activity days. ................. 32
Figure 13. Percentage frequency of number of white sharks sighted per day .......................................... 33
Figure 14. Mean number of sharks photographically identified per day in each month per operator......... 35
Figure 15. Mean number of sharks photographically identified and recorded for operator 2. .................... 36
Figure 16. Mean number of sharks photographically identified and recorded for operator 3 ..................... 36
LIST OF TABLES
Table 1: Detection and residency period summaries .................................................................................. 20
Table 2. Summary statistics of residency estimates ................................................................................... 24
Table 3. Complete photo identifications and re-sights of white sharks ....................................................... 37
Rogers, P.J. et al (2014) Monitoring residency of white sharks
vi
1. ACKNOWLEDGEMENTS
This project was carried out under the Department of the Environment and Natural Resources
permits Q26216-1 and Y26308-1, and PIRSA Exemption ME9902693. Tagging was undertaken
under Flinders University ethics approval E398 and PIRSA Animal Ethics Committee permit
15/14.
This project was funded by the Department of the Environment, Water and Natural Resources
and SARDI Aquatic Sciences. The authors would like to thank Adventure Bay Charters, Calypso
Star, and Rodney Fox Shark Expeditions for providing e-logbook data, images, video, and
logistical support during the deployment of acoustic tags.
During the SARDI internal review process, Mr Alex Dobrovolskis and Ms Kathryn Wiltshire
provide comments that helped to improve this report.
Rogers, P.J. et al (2014) Monitoring residency of white sharks
1
2. CONTRIBUTIONS
Formulation of project: C.H., P.R.
Funding: Primary Industries and Regions South Australia, South Australian Research and
Development Institute, Marine Innovation Southern Australia, Department of Environment,
Water and Natural Resources.
In-kind: Flinders University.
Management of project (Primary Investigator): P.R. (Feb–Dec 2014), C.H. (Sept 2013–Feb
2014).
Report preparation: P.R., C.H., C.B.
Fieldwork: C.H.
Data management: C.B.
Data provision: Acoustic data; VEMCO (Amirix).
Logbook - Rodney Fox Shark Expeditions, Calypso Charters, Adventure Bay Charters.
Video - Rodney Fox Shark Expeditions, Calypso Charters, Adventure Bay Charters.
Images - Calypso Charters, Adventure Bay Charters.
Rogers, P.J. et al (2014) Monitoring residency of white sharks
2
3. GLOSSARY
Array: Geographical area in which tagged organisms are likely to be detected by the acoustic
receivers deployed within the area.
Berley: Fish based products used to create an odour trail to attract sharks.
Decision rules: Agreed management response according to a predefined circumstance or set
of circumstances.
Detection: A set of pulses produced by transmitters, which is recognised and recorded by
acoustic receiver.
Detectability: Ability of the acoustic receiver to detect the set of pulses produced by
transmitters and to recognise it as valid. Detectability is affected by environmental conditions
and distance between receivers and transmitters.
Detected residency index (RId): Calculated by dividing the number of days a shark was
present by the total period during which sharks were detected.
False detection: When pulses from multiple transmitters are detected by a receiver at the same
time and collide, leading to a “detection” that appears valid, but was never transmitted.
Highly Migratory Species: Species which perform cyclical movements between distinct
geographical areas, some of which are coastal and oceanic regions that may represent
breeding, foraging and aggregation areas.
Receiver: Acoustic monitor deployed underwater that listens for pulses produced by acoustic
transmitters. When transmitters are within the detection range of the receivers, which varies with
transmitter power and environmental conditions but can be up to 800–1000 m, the receivers
records the identification number of the transmitter and time and date at which the pulse was
received.
Residency period: Number of days between the first and last detection of a tagged shark,
without any gaps in consecutive days of detection exceeding five days.
Residency index: Index quantifying the presence of tagged organisms by estimating the
percentage of days an organisms was detected within a specific timeframe, e.g. between
tagging and last detection. A value of 0 indicates that organisms were never detected and a
value of 1 indicates that organisms were detected every day throughout the chosen timeframe.
Rogers, P.J. et al (2014) Monitoring residency of white sharks
3
Standardised detection: Number of detections standardised to account for the variability in
detection probability.
Sentinel tags: Transmitter deployed for the purpose of monitoring temporal changes in
detection probability.
Teaser bait: Baits tethered under floats at the surface to attract sharks near boats
Transmitter: Acoustic tag deployed on organisms to monitor their movements and residency.
Transmitters produce a set of pulses every pre-determined intervals (e.g., every 2 minutes),
which can be detected by acoustic receivers.
Overall residency index (RIo): Calculated by dividing the number of days a shark was present
by the monitoring period, defined as the number of days between date of tagging and last
download.
Radio-acoustic positioning system: Radio-acoustic positioning system that consists of three
buoys deployed in a near equilateral triangle, and a shore station in line of sight. Buoys have a
multi-directional hydrophone that detects acoustic signals from transmitters. The information is
transmitted to a shore station via radio signals where the latitude and longitude of tagged
animals is estimated based on arrival times of acoustic pulses at each buoy
Rogers, P.J. et al (2014) Monitoring residency of white sharks
4
4. EXECUTIVE SUMMARY
This report provides a summary of information on the implementation and evaluation of
three methods for estimating residency of white sharks (Carcharodon carcharias) to
monitor relationships with cage-diving tourism activities at the Neptune Islands Group
Marine Park. It covers the monitoring period between September 2013 and July, 2014.
The methods implemented included acoustic telemetry, an electronic logbook (hereafter
referred to as e-logbook) and web-linked data collection application, and a photo-ID
catalogue using video and images provided by the operators.
Residency at the North and South Neptune Islands
Between 14 September 2013 and 28 February 2014, 15 white sharks ranging in size
from ~200–450 cm total length were monitored using satellite-linked acoustic telemetry
at the Neptune Islands.
Acoustically tagged white sharks exhibited individual variation in residency.
Residency periods of white sharks within the Neptune Islands (North and South
combined) ranged from <1 to 117 d (mean = 12.6 ± 22.6, s.d).
Overall residency period was 11.9 ± 23.5 d at the North Neptune Islands.
The number of residency periods ranged from 1–6 days.shark-1.
Most white sharks exhibited shorter (mean = 2.4 ± 3.6 d) residency periods at the South
Neptune Islands compared with at North Neptune Island.
Estimates of residency at the Neptune Islands in 2013–14 were similar to those reported
for 21 white sharks ranging in size from 2.8 to 4.8 m between December 2009 and April
2011 (Bruce and Bradford 2011). Those individuals had residency periods ranging from
1–92 d (mean = 21.0 ± 24.2 d) at the Neptune Islands (combined) (Bruce and Bradford
2011).
Electronic logbook
An electronic logbook (e-logbook) using iPads and the on-line Fulcrum™ application was
developed and implemented with the assistance of the operators to provide daily data on
the number of shark sightings and aspects of cage-diving operations.
The number of individual white sharks sighted by the three operators ranged from 0 to
20 sharks per day. The mean number of white sharks sighted per day during the
reporting period was 5 ± 3.5 sharks.
Rogers, P.J. et al (2014) Monitoring residency of white sharks
5
A total of 1,364 hrs of berleying was reported across the industry.
Berley used to attract white sharks to cages included mince and frozen blood from
southern bluefin tuna (Thunnus maccoyii).
Operators reported the use of 220 L of frozen tuna blood, 3,390 L of minced tuna and
5,920 L of ‘unspecified tuna berley’.
Teaser baits used at the surface comprised either portions of whole southern bluefin
tuna, or gills and entrails. A total of 100 southern bluefin tuna (~1.7 t) were used as
teaser baits. A total of 323 individual Nally™ bins of frozen bins of gills and entrails
(median wt per bin = 35.55 kg ea) were used at the surface for an estimated weight of
11.5 t.
Sound emission was reported to be used at the Neptune Islands for a total of 267 hours.
Daily durations ranged between 1–7.25 hours (mean = 4.7 ± 1.5 hrs).
Establishment of an industry-based photo-ID catalogue
A catalogue of 162 individual sharks was created from digital images submitted by two
operators. Images were obtained on 121 days between November 2013 and June 2014.
A total of 141 profiles require collection of additional left- and right-hand side images,
and/or images of multiple characteristics.
Reliable and complete photo-ID profiles were created for 21 white sharks.
The mean daily number of white sharks recorded by operators was higher in the e-
logbooks than determined from the photographs.
Preliminary results show that use of photo-ID in conjunction with satellite-linked acoustic
telemetry and e-logbook data has potential to reduce sources of uncertainty associated
with estimation of white shark residency.
Conclusions
The current SARDI program aims to evaluate acoustic telemetry data for a target of 50
white sharks by 2016. It will also integrate e-logbook and photo-ID data to estimate the
annual fluctuations and confidence bounds associated with the size of the white shark
population that visits the Neptune Islands Group Marine Park.
These steps will address the gaps in information required to undertake quantitative
assessments of impacts of cage-diving activities on white sharks that visit the Neptune
Islands Group Marine Park.
Rogers, P.J. et al (2014) Monitoring residency of white sharks
6
On the basis of the current body of knowledge of this industry, SARDI recommends that
DEWNR: 1) continues to support monitoring of residency, behaviour and associated
energetic requirements of white sharks in relation to human activities; 2) establish
industry-governmental data-sharing arrangements pertaining to the use of images for
identification and assessment of relative abundance of white sharks; 3) facilitates the
revision of management decision rules that incorporate improved behavioural indicators
in the Great White Shark Tourism Policy, and associated management documentation
for the Neptune Islands Group Marine Park.
Rogers, P.J. et al (2014) Monitoring residency of white sharks
7
5. INTRODUCTION
5.1. Background
The white shark (Carcharodon carcharias) is protected under the Fisheries Management Act
(2007) in South Australian State managed waters, and by the Australian Commonwealth
Government Environmental Protection, Biodiversity and Conservation Act (1999) in
Commonwealth waters. The species is also listed as Vulnerable under the International Union
for Conservation of Nature Red List, and under International treaties of which the Australian
Commonwealth Government is a signatory, including the Convention on International Trade in
Endangered Species, of Wild Fauna and Flora, and Convention on Conservation of Migratory
Species of Wild Animals. Australia is a signatory country to the International Memorandum of
Understanding (MOU) on the Conservation of Migratory Sharks. The white shark is listed in
Annex I of that MOU, of which the objectives include: to improve the understanding of migratory
shark populations through research, monitoring and information exchange; to ensure that
directed and non-directed fisheries for sharks are sustainable; to ensure to the extent
practicable the protection of critical habitats and migratory corridors and critical life stages of
sharks; to increase public awareness of threats to sharks and their habitats; to enhance public
participation in conservation activities; and to enhance national, regional and international
cooperation. Threats outlined in the Recovery Plan for the White Shark include the illegal trade
for jaws and other derived products, mortality during shark control activities, bycatch in fisheries
and cage-diving (Department of the Environment 2013). It is expected that cumulative human
impacts can lead to consequences for long-lived, slow growing populations with low
reproductive potential that have both migratory and residential contingents that exhibit
predictable site fidelity.
Photo-identification can be used to estimate the fidelity of a species to a given location or
region. This method relies on the premise that distinguishing markings are temporally stable
(Stevick et al. 2001), and is considered to be most reliable when multiple physical
characteristics and both sides of animals can be recorded (Domeier and Nasby-Lucas 2006).
Photo-identification has previously been used to collect data on residency (Klimley and
Anderson 1996), and movements, of white sharks (Anderson and Goldman 1996; Bonfil et al.
2005). Most studies use identifying characters such as distinguishing pigmented spots on dorsal
Rogers, P.J. et al (2014) Monitoring residency of white sharks
8
and caudal fins, gill flaps, scars and other markings (Domeier and Nasby-Lucas 2006).
Catalogues based on various combinations of images of dorsal fins, scars, and pigmentation on
lower caudal fins have been established in the eastern Pacific (73 individuals) (Domeier and
Nasby-Lucas 2006), South Africa (84 individuals) (Gubili et al. 2009), North-eastern Pacific
Ocean (130 individuals) (Chapple et al. 2011), and South Australia (76 and 306 individuals,
respectively) (Beckmann 2008; Robbins and Fox 2012a).
Elasmobranchs have well developed cognitive abilities and can associate human activities with
provisioning, which may lead to impacts on individuals and their populations (Orams 2002; Clue
et al. 2010). Shark behaviours that manifest as measurable periods of residency have been a
key focus of research and monitoring of white sharks in South Australia (SA) for over a decade
(e.g. Strong et al. 1996). Shark-related tourism has a long history and tourists have visited SA to
see white sharks at the Neptune Islands since the 1970’s. The SA white shark cage-diving
industry was valued at $6M AUD to the regional economy in 2011 (Bradford and Robbins,
2013). Licensing arrangements are managed by the Department of Environment, Water and
Natural Resources (DEWNR), and permits to discharge berley are managed by Primary
Industries and Regions SA (PIRSA) Fisheries and Aquaculture. A need to assess potential
ecosystem and population impacts of industry activities on this protected species became
increasingly important since the establishment of SA’s network of Marine Parks; the white shark
cage-diving industry operates in the Neptune Island Group Marine Park in the North Neptune
Island Sanctuary Zone (SZ).
Previous satellite and acoustic telemetry studies suggest white sharks use a broad range of
inshore coastal, continental shelf and oceanic habitats in the Great Australian Bight (Bruce et al.
2006) where they are associated with haul-outs and breeding colonies of the Australian sea lion
Neophoca cinerea and New Zealand fur seal Arctocephalus forsteri (Bruce 1992; Strong et al.
1996; Bruce et al. 2005, 2011; Bruce and Bradford 2013). Predation on these pinnipeds is a
major cause of injuries to Australian sea lion with 182 cases over 15 years being attributed to
predatory encounters at a single colony on the south coast of Kangaroo Island (Shaunghnessy
et al. 2007). Although there has been considerable investment in research on white sharks in
South Australian waters, there are still substantial gaps in available information pertaining to the
movements and habitat use in the Great Australian Bight, Spencer Gulf and Gulf St Vincent.
Rogers, P.J. et al (2014) Monitoring residency of white sharks
9
Long-term research programs based on acoustic telemetry and industry log-books provided
residency estimates at the Neptune Islands that suggested cage-diving activities impacted the
behaviour of white sharks (Bruce and Bradford 2011, 2013). Acoustic telemetry techniques have
provided a vital decade-long information base-line with which to compare the results of future
assessments of residency behaviour in relation to the cage-diving industry. White shark cage-
diving activities have also been linked to changes in site-specific behaviour over small spatial
scales (Huveneers et al. 2013). Management responses, including restrictions on numbers of
operator licenses, operator days, and berley permits have reflected uncertainty associated with
the impacts on shark behavior, and the need for ongoing assessment and development of
suitable indicators and trigger points. Currently, the white shark cage-diving operators have an
annual limit on the number of operator days (200.year-1). Two operators, hereafter referred to as
OP1 and OP2, have no limitations in terms of volumes of berley or the number of teaser baits
that can be discharged over those days. One operator (OP3) does not use berley and uses
underwater sound as an attractant. This practice has not previously been assessed.
Rogers, P.J. et al (2014) Monitoring residency of white sharks
10
5.2. Aims and Objectives
This report provides a summary of information on the implementation of three methods for
estimating residency and quantifying behavioural impacts of cage-diving activities on white
sharks at the Neptune Islands Group Marine Park. SARDI Aquatic Sciences was contracted by
DEWNR to report on the monitoring period between September 2013 and July 2014.
Specific aims of this report were to:
1) Implement and compare the suitability of three methods for assessing the residency of
white sharks that visit the Neptune Islands Group Marine Park. These included satellite-
linked acoustic telemetry, a web-linked electronic logbook (hereafter referred to as the e-
logbook), and photographic identification using digital video and photographic images
provided by the operators.
2) Develop indicators of residency of white sharks that can be compared to historical
patterns in the Neptune Islands Group Marine Park.
3) Use the methods in 1 and 2 to provide insights into the behavioural effects of cage-
diving activities, on individual white sharks that visited the Neptune Islands Group
Marine Park in the 2013–14 reporting period.
Rogers, P.J. et al (2014) Monitoring residency of white sharks
11
6. METHODS
6.1. Reporting period and geographical area
This report covers the period between 14 September 2013 and 30 June 2014. The Neptune
Islands Group is located near the approach to Spencer Gulf, ~30 nm from Port Lincoln, South
Australia, and 14 nm from the southern Australian mainland (Fig. 1). The group comprises the
North and South Neptune Islands which are ~12 km apart. In 2014, the Neptune Islands were
included within the South Australian Marine Park Network and named the Neptune Islands
Group (Ron and Valarie Taylor) Maine Park. The North Neptune Islands have a Sanctuary Zone
and a Restricted Access Zone that are within a broader Habitat Protection Zone. The South
Neptune Islands have a Restricted Access Zone that is also within a broader Habitat Protection
Zone (Neptune Islands Group (Ron and Valarie Taylor) Marine Park Management Plan
Summary 2014). Cage-diving operators anchor in two bays, Action Bay and Main Bay at the
North Neptune Islands, and in the eastern bay at the South Neptune Islands (Fig. 1).
6.2. Acoustic telemetry
Three satellite-linked VR4-Global near-real time acoustic receivers (Amirix, VEMCO Ltd.,
Halifax, Canada) were deployed within the Neptune Islands Group Marine Park using a similar
mooring system to that described by Bradford et al. (2011). VR4-Global units use an Iridium
satellite modem to remotely access detection data and send email notifications of tagged shark
detections. One VR4-Global receiver was deployed at each of the main berleying sites at the
North Neptune Islands group (Main Bay and Action Bay) and one at the South Neptune Islands
group (Fig. 1). White sharks were tagged with V16-6H acoustic transmitters programmed to
send signals at random intervals of 70–150 seconds (VEMCO Ltd., Halifax, Canada). Tags were
deployed throughout the monitoring period depending on the number of sharks reported at the
study site. Tags were tethered to a Domeier umbrella dart-tag head using a 10- to 15-cm-long
stainless wire trace (1.6 mm diameter), and implanted in the dorsal musculature of sharks using
a modified spear-gun applicator.
A
..
..
Rogers, P.J. et al (2014) Monitoring residency of white sharks
12
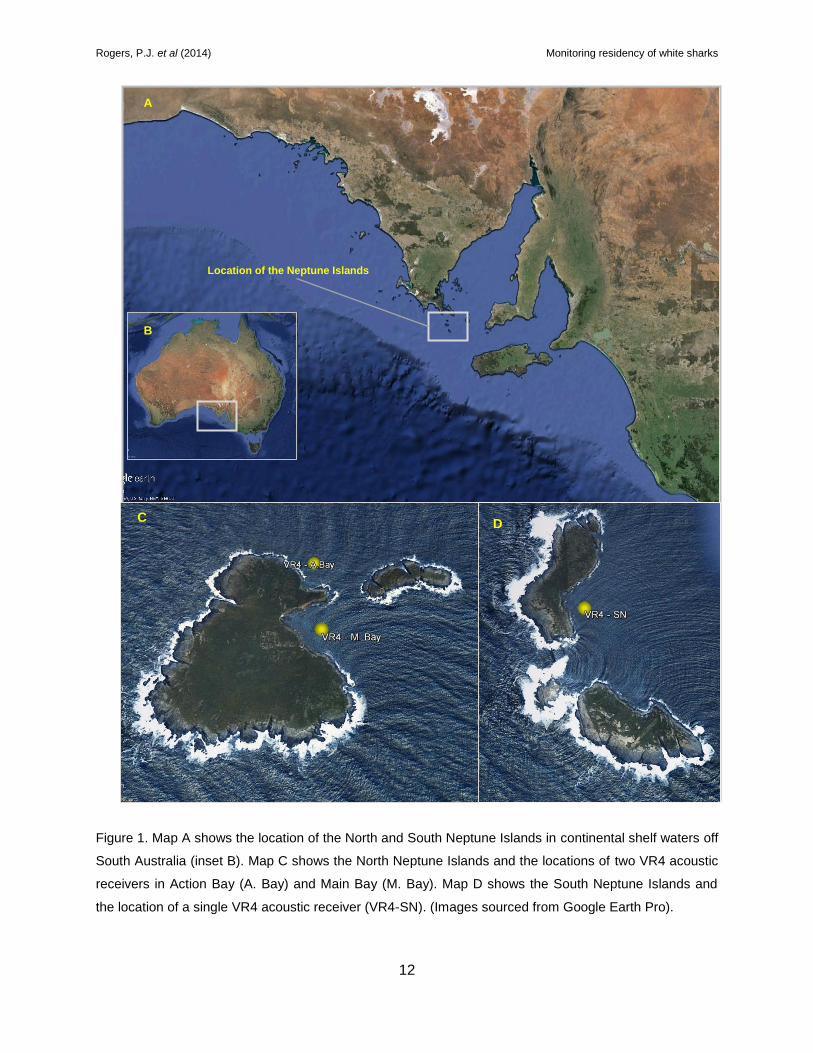
Figure 1. Map A shows the location of the North and South Neptune Islands in continental shelf waters off
South Australia (inset B). Map C shows the North Neptune Islands and the locations of two VR4 acoustic
receivers in Action Bay (A. Bay) and Main Bay (M. Bay). Map D shows the South Neptune Islands and
the location of a single VR4 acoustic receiver (VR4-SN). (Images sourced from Google Earth Pro).
A
..
..
B
..
..
Location of the Neptune Islands
C
..
..
.
D
..
..
Rogers, P.J. et al (2014) Monitoring residency of white sharks
13
Detection summary and residency index
Tagged white sharks were considered ‘present’ in the array if detected at least twice within a 24-
hour period. This eliminated the possibility of ‘false detections’ that can occur when there are
multiple acoustic tags present within range of an array of receivers (Pincock 2011). Daily
detection summaries were plotted to examine the pattern of overall presence of tagged sharks
during the study period. For each of the North and South Neptune Island sites and combined
regions, site fidelity of each tagged shark was quantified using two residency indices (RIs). The
overall residency index (RIo) was calculated by dividing the number of days a shark was present
by the monitoring period, defined as the number of days between the date of tagging and the
last download. When sharks were known to have shed their tag or died, the monitored period
was calculated based on the last day individual sharks were sighted with their tags or the date
of death. The detected residency index (RId) was calculated by dividing the number of days a
shark was present by the period during which sharks were detected. The two residency indices
were used because sharks can potentially either shed their tags or die. This can lead to under-
estimation of RIo, whereas use of RId can lead to over-estimation as this index does not account
for individuals that naturally leave the monitored sites. The use of both estimates of residency
accounted for potential biases, given that the ultimate fate of tags and tagged organisms is
unknown. A value of 0 indicated no residency and a value of 1 indicated 100% residency.
Residency periods
For each tagged white shark, the number of consecutive days that individuals were present was
calculated each time they entered the study area. A residency period was defined as the
number of days between the first and last detection of a tagged shark, without any gaps in
consecutive days of detection exceeding 5 days. A five-day period was selected on the basis of
estimated transit times between the North and South Neptune Islands (Bruce and Bradford
2013). Where sharks were not detected over periods of >5 consecutive days, individuals were
assumed to have left the Neptune Islands and any subsequent return was considered to
represent a new residency period. Residency periods were estimated according to Bruce and
Bradford (2013) to ensure findings were comparable with the historical timeseries.
Rogers, P.J. et al (2014) Monitoring residency of white sharks
14
Temporal variations in detection
The hourly temporal dynamics of shark residency were assessed for each shark by comparing
the number of detections within each location per hour. Acoustic detectability can be affected by
environmental conditions potentially biasing the probability of detecting a tagged shark in the
proximity of a receiver (Payne et al. 2010; Gjelland and Hedger 2013). Five sentinel tags were
deployed within the array for various durations to determine any temporal variation in acoustic
detectability. To account for diel patterns in the number of detections, a corrected detection
frequency for each hour was calculated for each sentinel tag using the formula of Payne et al.
(2010):
CDFb= Bb
μ
Where CDF is the corrected detection frequency for each hourly bin (b), µ is the overall mean
hourly detection frequency and B is the mean detection frequency in each 24-hour bin for the
sentinel tag. The total detection frequency of each hourly bin was divided by the CDF of the
corresponding hourly bin from the sentinel tag (Payne et al. 2010), and is thereafter referred to
as standardised number of detections. The standardised number of detections was calculated
for each shark to avoid those with the most detections biasing investigation of temporal
variation. Due to the strong diel variations in detection probability, timing of arrival and departure
could not be estimated as it might have been biased by the differences in detection probability
rather than actual arrival or departure of sharks at the Neptune Island Group.
Relationships between daily detections and cage-diving activity
The relationship between cage-diving activity and residency of white sharks was assessed by
comparing the number of detections per day between days during which at least one operator
was present (referred to as activity days) to days during which no operators were present
(referred to as non-activity days). For each tagged shark, the number of detections was
estimated for each detected day and categorised as being either from an activity or non-activity
day using information provided in the operators’ e-logbooks. For each activity and non-activity
day, the mean number of detections was calculated for each shark. The same was then
performed using a finer evaluator of cage-diving activity. Instead of comparing activity vs. non-
activity days, the mean number of detections was compared according to the number of
operators present and types of attractant used.
Rogers, P.J. et al (2014) Monitoring residency of white sharks
15
Specifically, we compared the number of detections when (1) no operators were present, (2)
one berley operator was present, (3) one sound operator was present, (4) two berley operators
were present, (5) one berley and one sound operator were present, and (6) all operators (two
berley and one sound) were present. The relation between cage-diving industry activity and
presence of sharks was also assessed by comparing the standardised number of detections for
each hour on activity and non-activity days. Assessments were performed for the North and
South Neptune Islands separately to allow comparison between the two locations.
Rogers, P.J. et al (2014) Monitoring residency of white sharks
16
6.3. Electronic Logbooks
Cage-diving operators were each issued with a mini-iPad loaded with the FulcrumTM application
to input daily electronic logbook (e-logbook) entries. Regular follow-up telephone conversations
took place between SARDI (C.B.) and white shark cage-diving operators for validation and
quality assurance purposes.
The following parameters were recorded by operators during cage-diving activity days:
Date
Anchored location
Time of arrival/departure
Berleying start/finish time
Amount and type of berley dispensed
Number of teaser baits used
Number of white sharks sighted
Appendix 1 shows the details associated with each of the parameters entered by operators
during the reporting period. The number of pieces of tuna, gills and entrails used at the surface
was used to estimate the number of teaser baits used. All estimates are considered to be
conservative as not all days were completed for all parameter fields.
Rogers, P.J. et al (2014) Monitoring residency of white sharks
17
6.4. Photo Identification
Photographs were submitted by operators OP2 and OP3 as shark sightings through the e-
logbook, or as a DVD of images for each individual trip. Photographic images were also
obtained from video operated by cage-divers. No photographs were obtained from OP1. Date
and location were recorded for each image. Photographs were analysed to determine how
many individual sharks were sighted per day by each operator. Distinguishing marks, scars, tag
locations and pigmentation patterns were compared to identify individuals as outlined in
Domeier and Nasby-Lucas (2006). Sex was determined where possible through
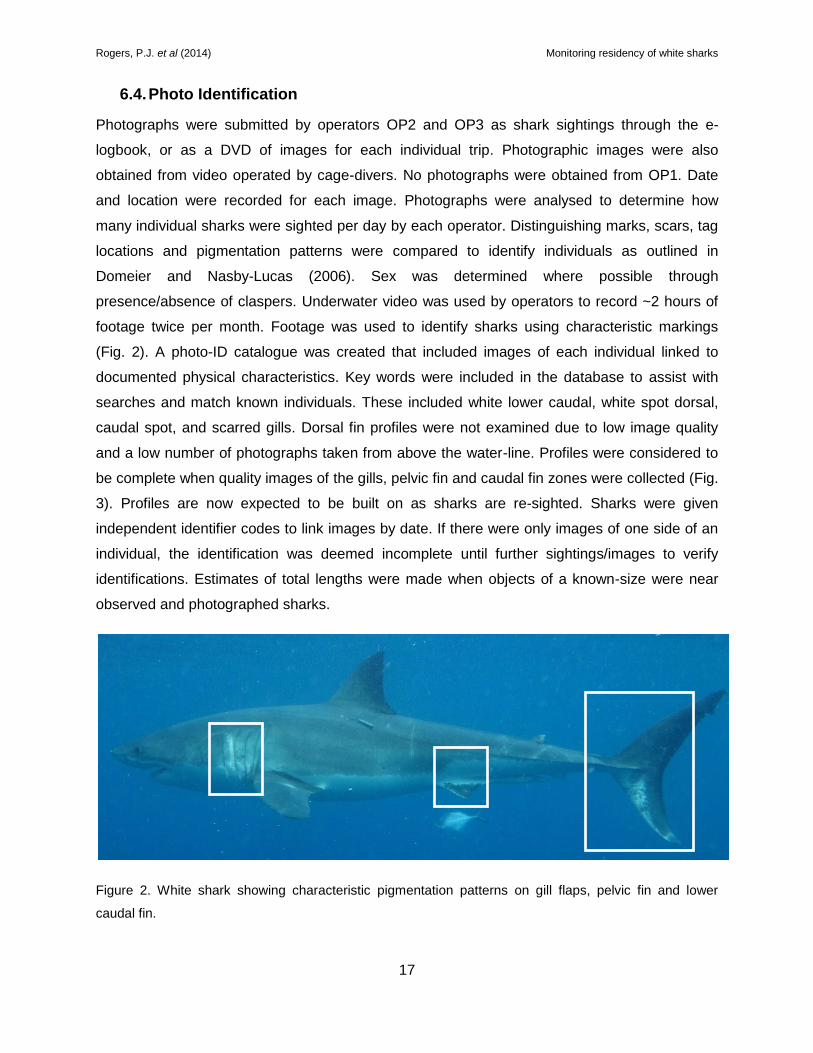
presence/absence of claspers. Underwater video was used by operators to record ~2 hours of
footage twice per month. Footage was used to identify sharks using characteristic markings
(Fig. 2). A photo-ID catalogue was created that included images of each individual linked to
documented physical characteristics. Key words were included in the database to assist with
searches and match known individuals. These included white lower caudal, white spot dorsal,
caudal spot, and scarred gills. Dorsal fin profiles were not examined due to low image quality
and a low number of photographs taken from above the water-line. Profiles were considered to
be complete when quality images of the gills, pelvic fin and caudal fin zones were collected (Fig.
3). Profiles are now expected to be built on as sharks are re-sighted. Sharks were given
independent identifier codes to link images by date. If there were only images of one side of an
individual, the identification was deemed incomplete until further sightings/images to verify
identifications. Estimates of total lengths were made when objects of a known-size were near
observed and photographed sharks.
Figure 2. White shark showing characteristic pigmentation patterns on gill flaps, pelvic fin and lower
caudal fin.
Rogers, P.J. et al (2014) Monitoring residency of white sharks
18
7. RESULTS
7.1. White shark residency
A total of 15 white sharks ranging in size from ~200 to 450 cm total length were tagged at the
Neptune Islands between 14 September 2013 and 28 February 2014. Table 1 provides a
summary of the deployment data for each tagged shark. All white sharks tagged were detected
between September 2013 and June 2014; a total of 25,217 acoustic detections were recorded
(mean = 1,681 ± 2,235 standard deviation, s.d.). Tagged white sharks were detected for periods
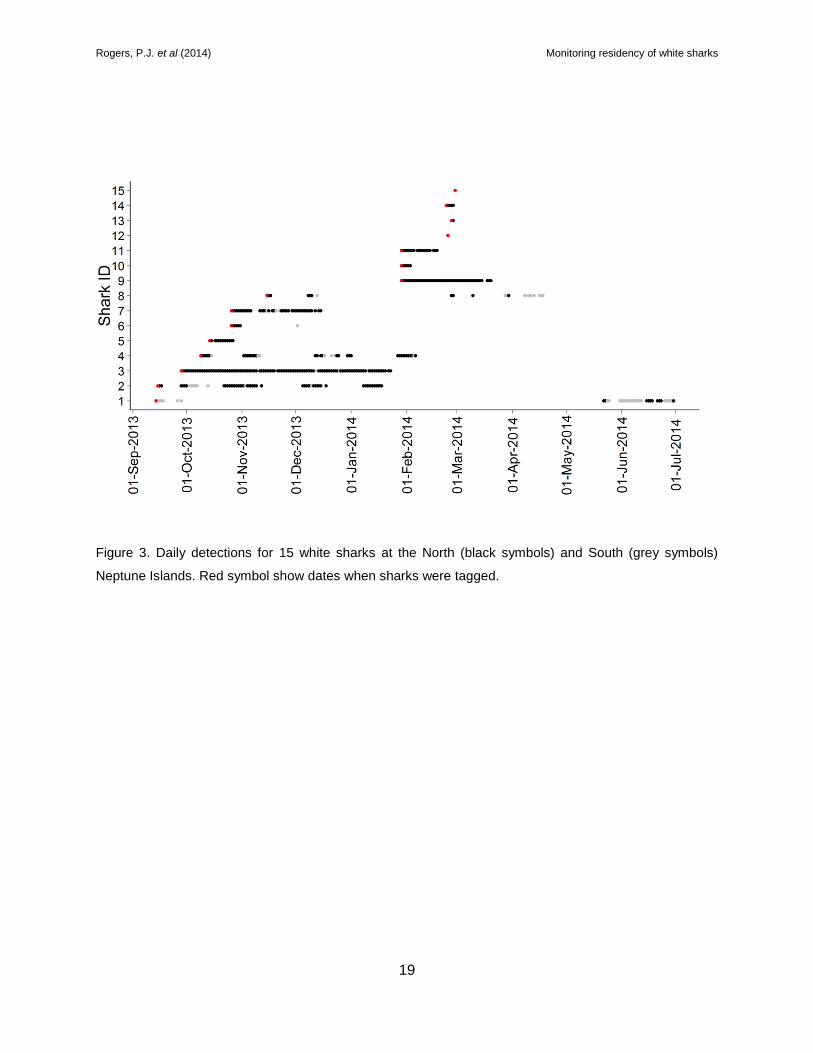
ranging between 14 and 290 days (Table 1). Several contrasting patterns of detection were
observed (Fig. 3). For example, Shark 3, 7, and 9 were detected nearly continuously at North
Neptune Island. Visual records of Shark 3 showed it shed the tag by date and so its residency
may have been underestimated. Shark 9 resided at the Neptune Islands for three month until
March 2014 (Fig. 3). It was later found stranded close to Geraldton, Western Australia on 17
July 2014 with an Australian sea lion lodged in its throat near its gills. This may have impeded
water flow through the gills and caused the death (Department of Fisheries WA 2014). Shark 2,
4, and 8 were only detected at the Neptune Islands for shorter periods but made several return
visits, while Shark 6, 12, 13, 14 and 15 were only detected for a few days each. Shark 1 and 5
were detected for short periods after tagging, with Shark 1 returning to the North and South
Neptune Islands following an eight month absence. Shark 5 did not return (Fig. 3).
Rogers, P.J. et al (2014) Monitoring residency of white sharks
19
Figure 3. Daily detections for 15 white sharks at the North (black symbols) and South (grey symbols)
Neptune Islands. Red symbol show dates when sharks were tagged.
Rogers, P.J. et al (2014) Monitoring residency of white sharks
20
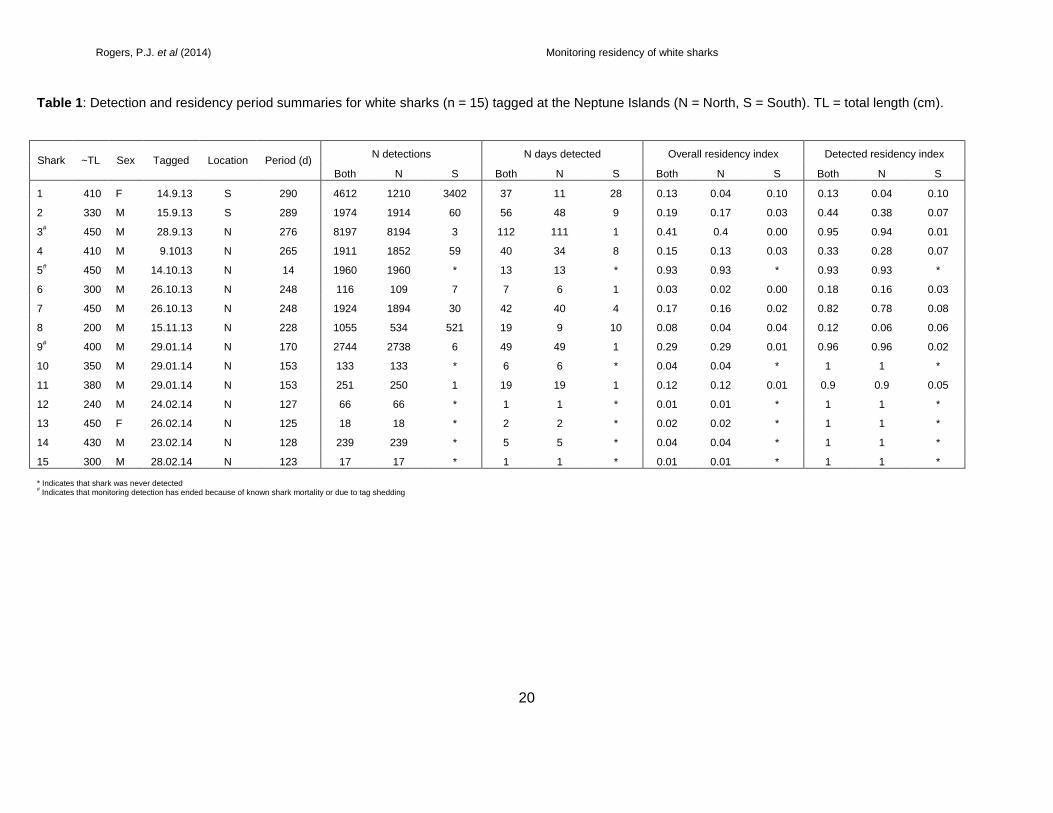
Table 1: Detection and residency period summaries for white sharks (n = 15) tagged at the Neptune Islands (N = North, S = South). TL = total length (cm).
Shark ~TL Sex Tagged Location Period (d) N detections N days detected Overall residency index Detected residency index
Both N S Both N S Both N S Both N S
1 410 F 14.9.13 S 290 4612 1210 3402 37 11 28 0.13 0.04 0.10 0.13 0.04 0.10
2 330 M 15.9.13 S 289 1974 1914 60 56 48 9 0.19 0.17 0.03 0.44 0.38 0.07
3# 450 M 28.9.13 N 276 8197 8194 3 112 111 1 0.41 0.4 0.00 0.95 0.94 0.01
4 410 M 9.1013 N 265 1911 1852 59 40 34 8 0.15 0.13 0.03 0.33 0.28 0.07
5# 450 M 14.10.13 N 14 1960 1960 * 13 13 * 0.93 0.93 * 0.93 0.93 *
6 300 M 26.10.13 N 248 116 109 7 7 6 1 0.03 0.02 0.00 0.18 0.16 0.03
7 450 M 26.10.13 N 248 1924 1894 30 42 40 4 0.17 0.16 0.02 0.82 0.78 0.08
8 200 M 15.11.13 N 228 1055 534 521 19 9 10 0.08 0.04 0.04 0.12 0.06 0.06
9# 400 M 29.01.14 N 170 2744 2738 6 49 49 1 0.29 0.29 0.01 0.96 0.96 0.02
10 350 M 29.01.14 N 153 133 133 * 6 6 * 0.04 0.04 * 1 1 *
11 380 M 29.01.14 N 153 251 250 1 19 19 1 0.12 0.12 0.01 0.9 0.9 0.05
12 240 M 24.02.14 N 127 66 66 * 1 1 * 0.01 0.01 * 1 1 *
13 450 F 26.02.14 N 125 18 18 * 2 2 * 0.02 0.02 * 1 1 *
14 430 M 23.02.14 N 128 239 239 * 5 5 * 0.04 0.04 * 1 1 *
15 300 M 28.02.14 N 123 17 17 * 1 1 * 0.01 0.01 * 1 1 *
* Indicates that shark was never detected
# Indicates that monitoring detection has ended because of known shark mortality or due to tag shedding

Rogers, P.J. et al (2014) Monitoring residency of white sharks
21
Figure 4. Residency index (overall) values for white sharks (n = 15) at the North (black bars) and South
(grey bars) Neptune Islands.
Shark 1 and 2 were tagged at the South Neptune Islands and showed different patterns of daily
detections and residency (Table 1, Fig. 3 and 4). Shark 1 was mostly detected at the South
Neptune Islands, whereas Shark 2 was mostly detected at the North Neptune Islands. This
shark underwent short duration movements to the South Neptune Islands. Five of the 13 white
sharks that were tagged at the North Neptune Islands also visited the South Neptune Islands for
short periods (Fig. 5).
The overall residency index of Shark 5 was close to one as it shed the tag after two weeks (Fig.
4). The mean overall residency index of the other white sharks was 0.12 ± 0.12. Variation
between individuals was substantial (Table 1 and 2). Two sharks had residency indices >0.25,
five were between 0.1–0.2, and the remaining seven were <0.1 (Fig. 5). Mean detected
residency index was higher at 0.72 ± 0.36 (Table 1). This was influenced by white sharks that
were only detected for a few days following tagging, and then left the Neptune Islands. After
Rogers, P.J. et al (2014) Monitoring residency of white sharks
22
excluding these sharks from the analyses, the mean detected residency index value was 0.58 (±
0.37 SD).
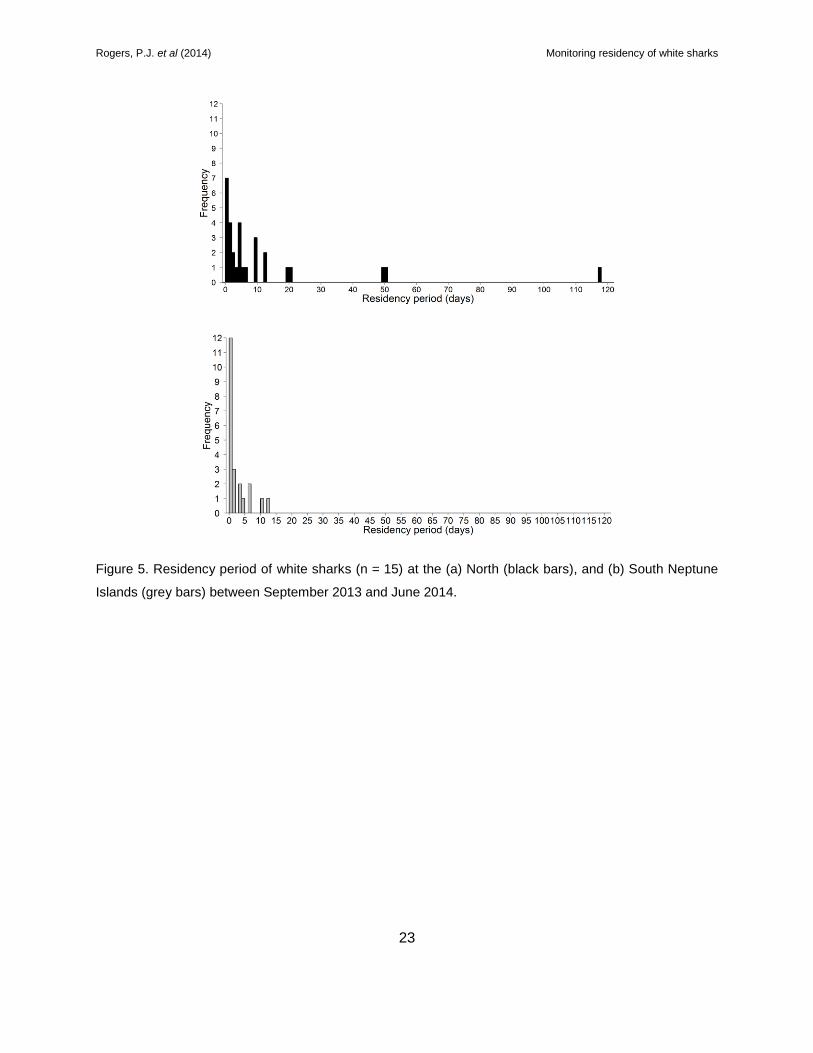
Residency periods
Residency periods exhibited by white sharks at the North and South Neptune Islands combined
ranged from <1 to 117 days (12.6 d ± 22.6; Fig. 4). Patterns varied between individuals and
locations (Table 2). At the North Neptune Islands, the overall residency period was 11.9 ± 23.5
days and the number of residency periods ranged from 1–6 per individual (Table 2). Sixty
percent of white sharks had a mean residency <5 days, and 20% had a mean residency at the
Neptune Islands of >49 days. For most individuals, residency periods were shorter at the South
Neptune Islands than at North Neptune Islands, where the overall residency period was 2.4 d ±
3.6 (Figs. 4 and 5; Table 2). However, residency periods of some individuals were greater at the
South Neptune Islands. For example, mean residency period of Shark 1 was 4.5 days (n = 5) at
the South Neptune Islands and 3.6 days (n = 3) at the North Neptune Islands, while Shark 2 had
a mean residency period of 3.8 days (n = 3) at the South Neptune Islands and one day (n = 5)
at the North Neptune Islands.
Rogers, P.J. et al (2014) Monitoring residency of white sharks
23
Figure 5. Residency period of white sharks (n = 15) at the (a) North (black bars), and (b) South Neptune
Islands (grey bars) between September 2013 and June 2014.
Rogers, P.J. et al (2014) Monitoring residency of white sharks
24
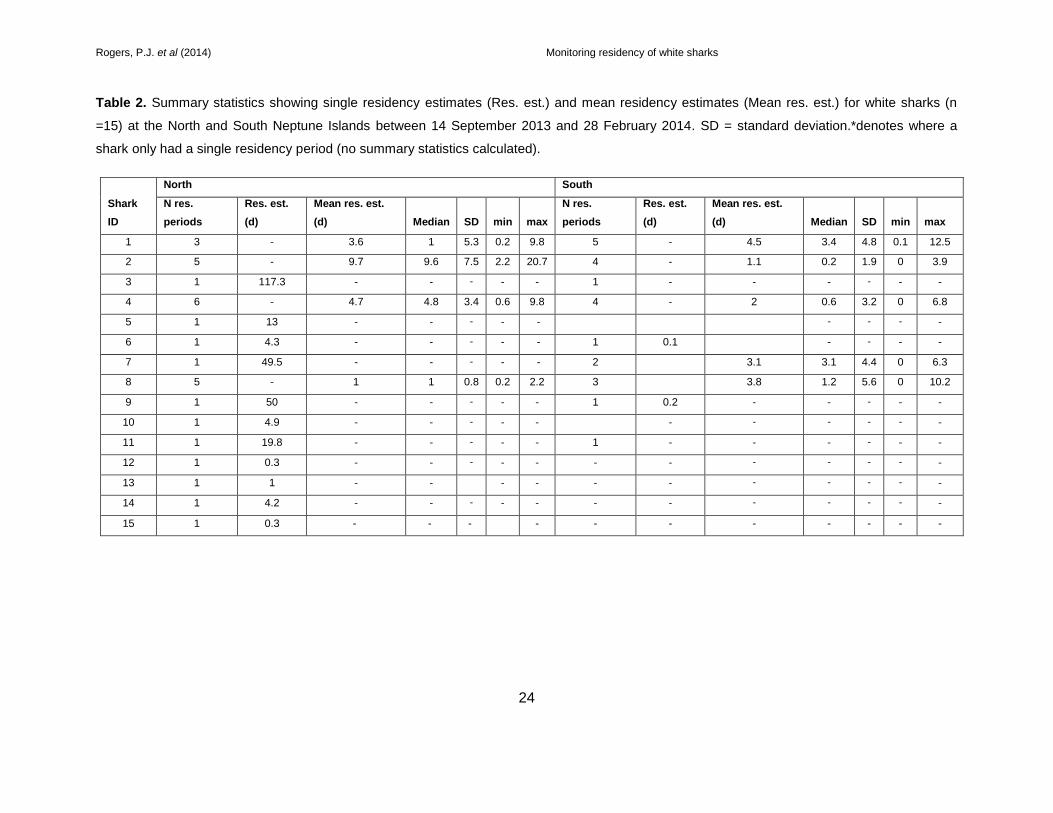
Table 2. Summary statistics showing single residency estimates (Res. est.) and mean residency estimates (Mean res. est.) for white sharks (n
=15) at the North and South Neptune Islands between 14 September 2013 and 28 February 2014. SD = standard deviation.*denotes where a
shark only had a single residency period (no summary statistics calculated).
Shark
ID
North South
N res.
periods
Res. est.
(d)
Mean res. est.
(d) Median SD min max
N res.
periods
Res. est.
(d)
Mean res. est.
(d) Median SD min max
1 3 - 3.6 1 5.3 0.2 9.8 5 - 4.5 3.4 4.8 0.1 12.5
2 5 - 9.7 9.6 7.5 2.2 20.7 4 - 1.1 0.2 1.9 0 3.9
3 1 117.3 - - - - - 1 - - - - - -
4 6 - 4.7 4.8 3.4 0.6 9.8 4 - 2 0.6 3.2 0 6.8
5 1 13 - - - - -
- - - -
6 1 4.3 - - - - - 1 0.1
- - - -
7 1 49.5 - - - - - 2
3.1 3.1 4.4 0 6.3
8 5 - 1 1 0.8 0.2 2.2 3
3.8 1.2 5.6 0 10.2
9 1 50 - - - - - 1 0.2 - - - - -
10 1 4.9 - - - - -
- - - - - -
11 1 19.8 - - - - - 1 - - - - - -
12 1 0.3 - - - - - - - - - - - -
13 1 1 - -
- - - - - - - - -
14 1 4.2 - - - - - - - - - - - -
15 1 0.3 - - - - - - - - - - -

Rogers, P.J. et al (2014) Monitoring residency of white sharks
25
Variation in detection probability based on sentinel tag data
The five stationary sentinel tags inside the range of the receivers provided data that showed a
consistent diel pattern in detection probability (Fig. 6). The highest number of detections
occurred between 8 am and 5 pm. This is consistent with findings in Gulf St Vincent, Spencer
Gulf and western Investigator Strait (Payne et al. 2010; Bryars et al. 2012; Huveneers et al.
2014). This diel pattern in detection probability was corrected to compare the number of
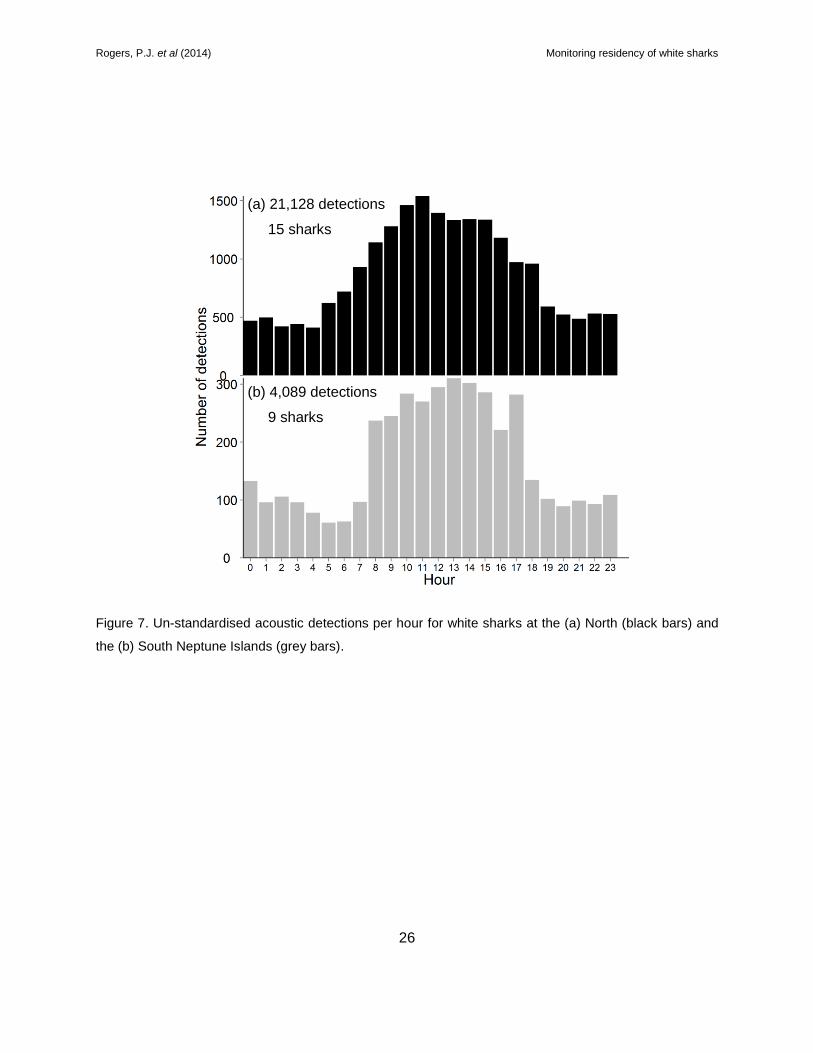
detections of white sharks over 24 hour periods. Peaks in the un-standardised acoustic
detection data for white sharks occurred at 11 am at the North Neptune Islands and 1 pm at
South Neptune Islands (Fig. 7).
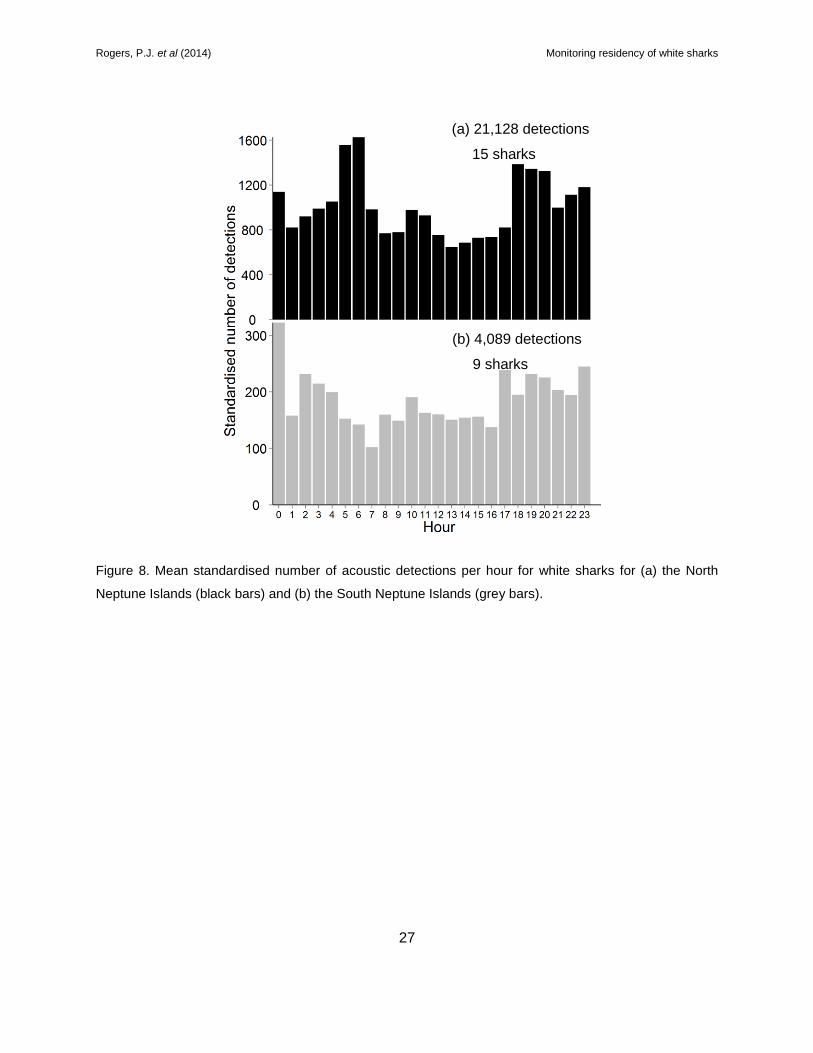
Standardisation of the white shark detection data using the stationary sentinel tag data revealed
a diel pattern with highest shark detection frequencies occurring near dawn and dusk at the
North Neptune Islands (Fig. 8), and between 5 pm and 4 am at the South Neptune Islands.
Patterns of detections throughout the day were similar across individual white sharks that were
regularly detected (>1,500 detections) (Figs. 8 and 9). Only one white shark was detected
>1,500 times at the South Neptune Islands and this individual’s tag provided a similar pattern of
detections as that provided by the sentinel tags (Fig. 9).
Figure 6. Mean standardised acoustic detections per hour for sentinel tags. Error bars represents ± 1
standard error of mean across all days.
0.00
0.50
1.00
1.50
2.00
2.50
0 1 2 3 4 5 6 7 8 9 1011121314151617181920212223
Sta
ndard
ised d
ete
ction
Hour
Rogers, P.J. et al (2014) Monitoring residency of white sharks
26
Figure 7. Un-standardised acoustic detections per hour for white sharks at the (a) North (black bars) and
the (b) South Neptune Islands (grey bars).
(b) 4,089 detections
9 sharks
(a) 21,128 detections
15 sharks
Rogers, P.J. et al (2014) Monitoring residency of white sharks
27
Figure 8. Mean standardised number of acoustic detections per hour for white sharks for (a) the North
Neptune Islands (black bars) and (b) the South Neptune Islands (grey bars).
(b) 4,089 detections
9 sharks
(a) 21,128 detections
15 sharks
Rogers, P.J. et al (2014) Monitoring residency of white sharks
28
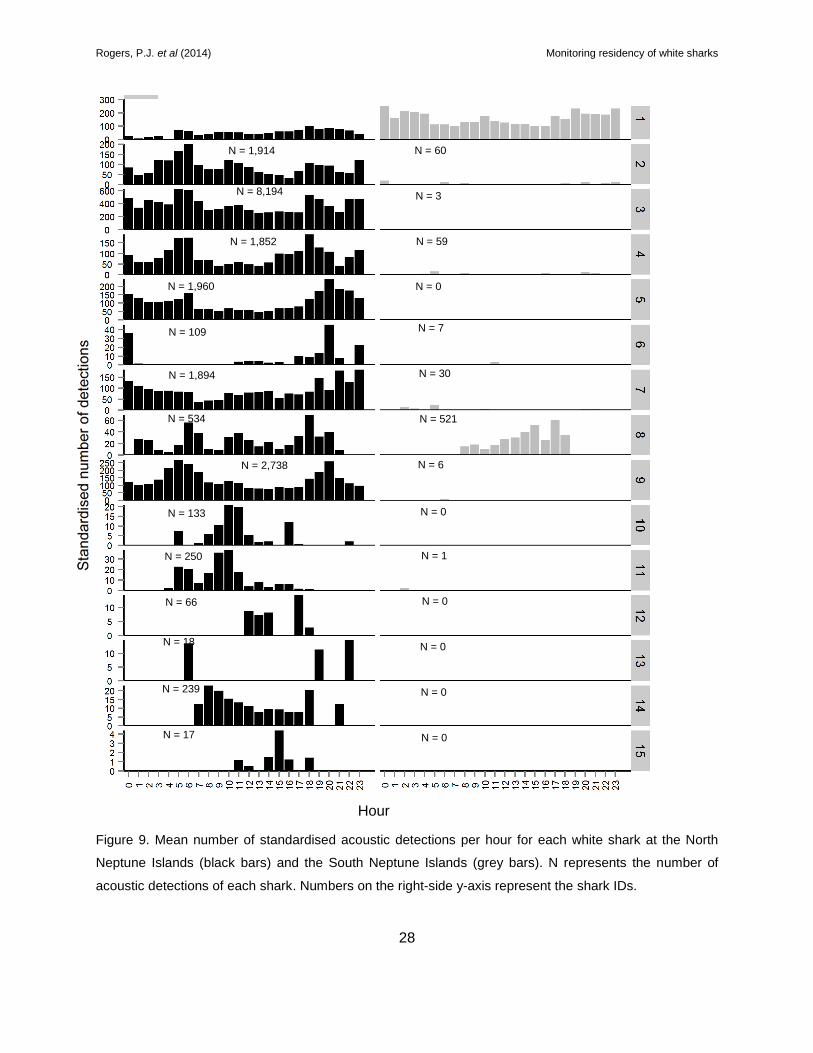
Figure 9. Mean number of standardised acoustic detections per hour for each white shark at the North
Neptune Islands (black bars) and the South Neptune Islands (grey bars). N represents the number of
acoustic detections of each shark. Numbers on the right-side y-axis represent the shark IDs.
N = 1,852
N = 18
N = 17
N = 239
N = 66
N = 534
N = 2,738
N = 250
N = 133
N = 1,894
N = 109
N = 1,960
N = 0
N = 1
N = 6
N = 521
N = 30
N = 7
N = 0
N = 0
N = 0
N = 0
N = 0
N = 59
N = 3
N = 60
N = 8,194
N = 1,914
N = 3,402 N = 1,210
Hour
Rogers, P.J. et al (2014) Monitoring residency of white sharks
29
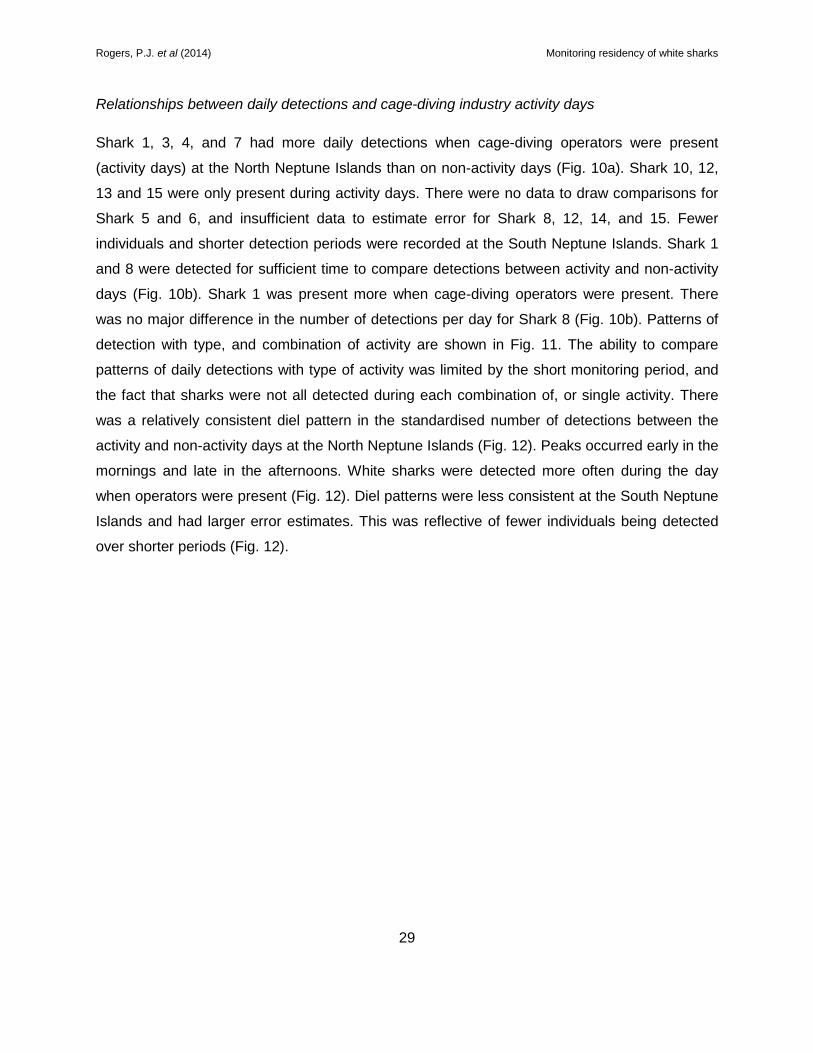
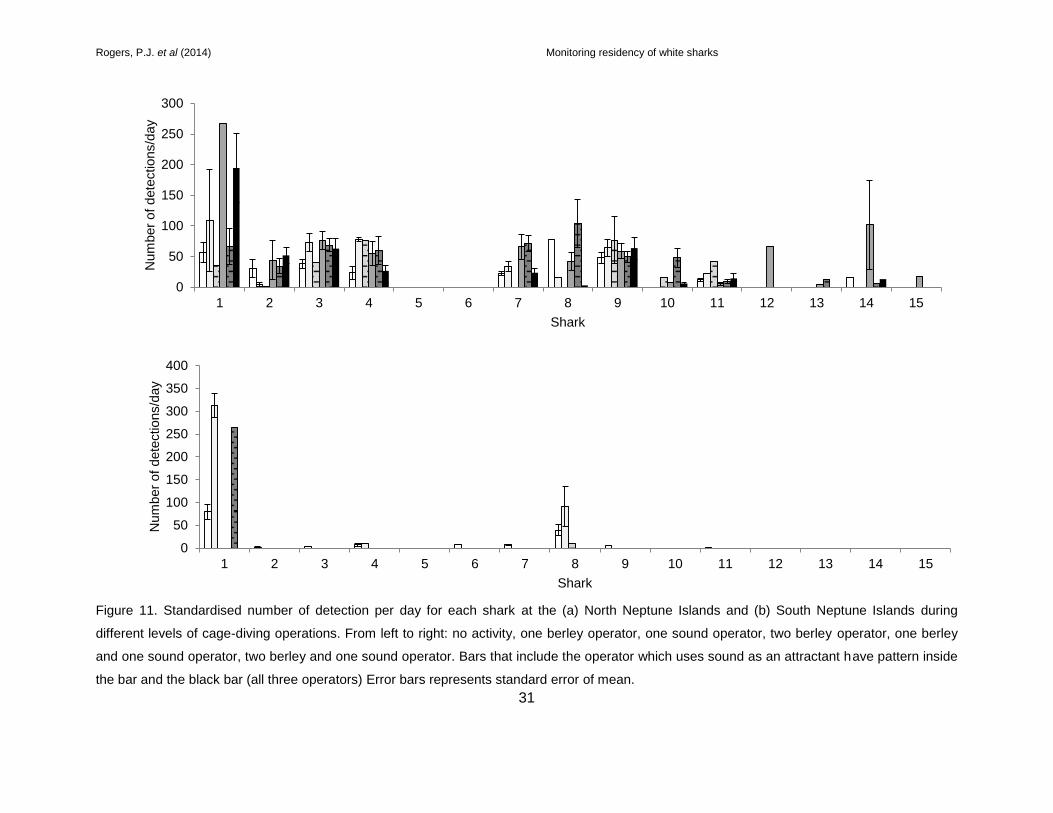
Relationships between daily detections and cage-diving industry activity days
Shark 1, 3, 4, and 7 had more daily detections when cage-diving operators were present
(activity days) at the North Neptune Islands than on non-activity days (Fig. 10a). Shark 10, 12,
13 and 15 were only present during activity days. There were no data to draw comparisons for
Shark 5 and 6, and insufficient data to estimate error for Shark 8, 12, 14, and 15. Fewer
individuals and shorter detection periods were recorded at the South Neptune Islands. Shark 1
and 8 were detected for sufficient time to compare detections between activity and non-activity
days (Fig. 10b). Shark 1 was present more when cage-diving operators were present. There
was no major difference in the number of detections per day for Shark 8 (Fig. 10b). Patterns of
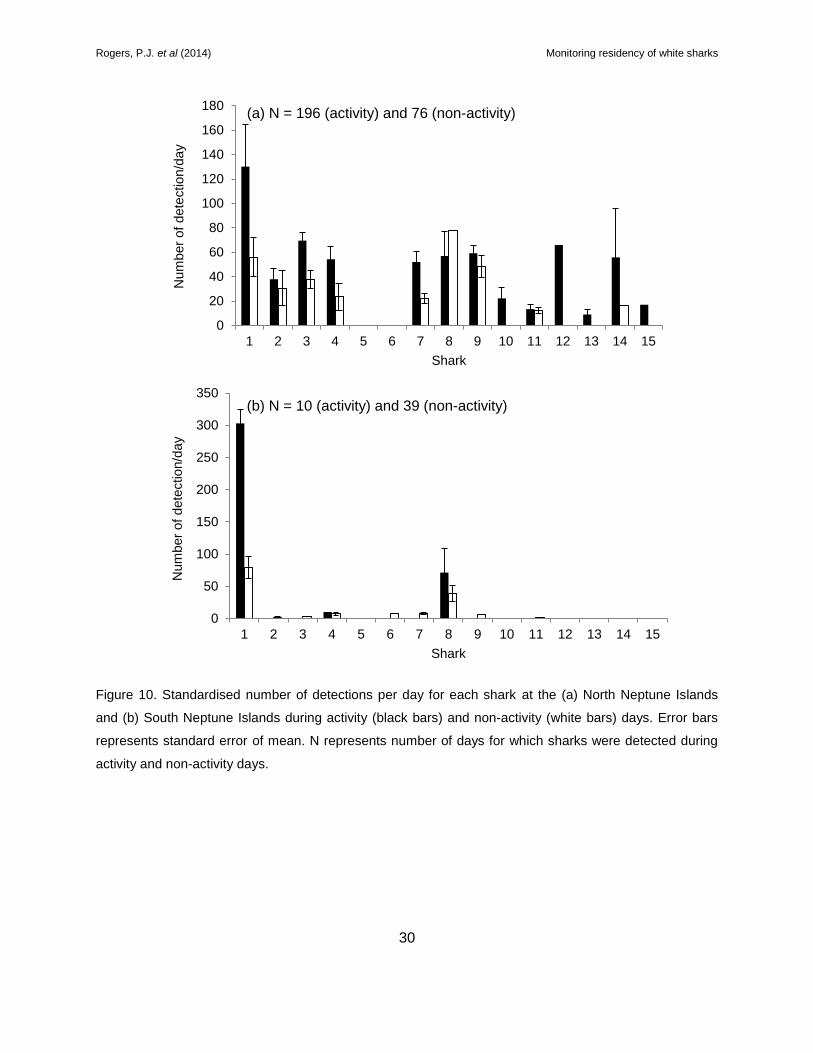
detection with type, and combination of activity are shown in Fig. 11. The ability to compare
patterns of daily detections with type of activity was limited by the short monitoring period, and
the fact that sharks were not all detected during each combination of, or single activity. There
was a relatively consistent diel pattern in the standardised number of detections between the
activity and non-activity days at the North Neptune Islands (Fig. 12). Peaks occurred early in the
mornings and late in the afternoons. White sharks were detected more often during the day
when operators were present (Fig. 12). Diel patterns were less consistent at the South Neptune
Islands and had larger error estimates. This was reflective of fewer individuals being detected
over shorter periods (Fig. 12).
Rogers, P.J. et al (2014) Monitoring residency of white sharks
30
Figure 10. Standardised number of detections per day for each shark at the (a) North Neptune Islands
and (b) South Neptune Islands during activity (black bars) and non-activity (white bars) days. Error bars
represents standard error of mean. N represents number of days for which sharks were detected during
activity and non-activity days.
0
20
40
60
80
100
120
140
160
180
1 2 3 4 5 6 7 8 9 10 11 12 13 14 15
Num
ber
of
dete
ction/d
ay
Shark
(a) N = 196 (activity) and 76 (non-activity)
0
50
100
150
200
250
300
350
1 2 3 4 5 6 7 8 9 10 11 12 13 14 15
Num
ber
of
dete
ction/d
ay
Shark
(b) N = 10 (activity) and 39 (non-activity)
Rogers, P.J. et al (2014) Monitoring residency of white sharks
31
Figure 11. Standardised number of detection per day for each shark at the (a) North Neptune Islands and (b) South Neptune Islands during
different levels of cage-diving operations. From left to right: no activity, one berley operator, one sound operator, two berley operator, one berley
and one sound operator, two berley and one sound operator. Bars that include the operator which uses sound as an attractant have pattern inside
the bar and the black bar (all three operators) Error bars represents standard error of mean.
0
50
100
150
200
250
300
1 2 3 4 5 6 7 8 9 10 11 12 13 14 15
Num
ber
of
dete
ctions/d
ay
Shark
0
50
100
150
200
250
300
350
400
1 2 3 4 5 6 7 8 9 10 11 12 13 14 15
Num
ber
of
dete
ctions/d
ay
Shark

Rogers, P.J. et al (2014) Monitoring residency of white sharks
32
Figure 12. Standardised number of detections per hour at the (a) North Neptune Islands and (b)
South Neptune Islands during activity (black bars) and non-activity (white bars) days. Error bars
represents standard error of the mean. N represents number of hours for which sharks were detected
during activity and non-activity days.
0
2
4
6
8
10
12
14
16
18
20
0 1 2 3 4 5 6 7 8 9 10 11 12 13 14 15 16 17 18 19 20 21 22 23
Num
ber
of
dete
ction/h
our
Hour
(a) N = 1,326 (activity) and 428 (non-activity)
0
5
10
15
20
25
30
35
0 1 2 3 4 5 6 7 8 9 10 11 12 13 14 15 16 17 18 19 20 21 22 23
Num
ber
of
dete
ction/h
our
Hour
(b) N = 117 (activity) and 169 (non-activity)
Rogers, P.J. et al (2014) Monitoring residency of white sharks
33
7.2. Electronic logbook
The e-logbook supported by the Fulcrum™ application was used by the white shark cage-
diving industry operators to collect data on key operating parameters during the reporting
period between 1 November 2013 and 30 June 2014.
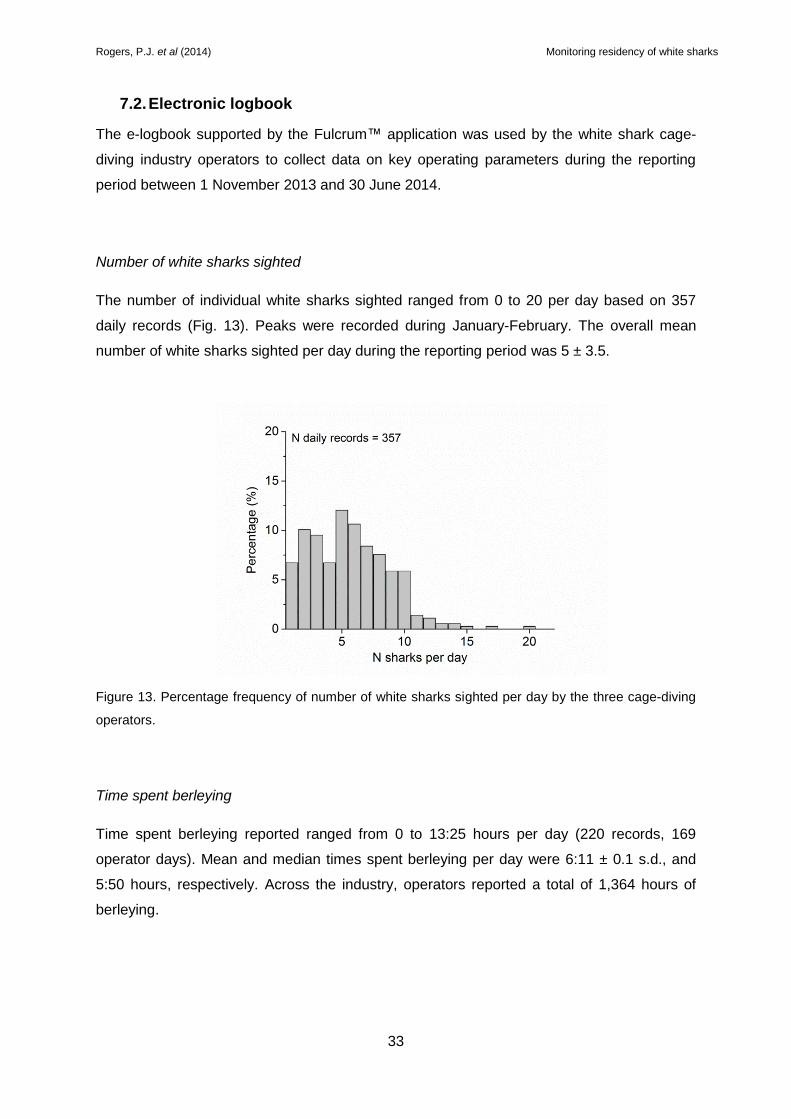
Number of white sharks sighted
The number of individual white sharks sighted ranged from 0 to 20 per day based on 357
daily records (Fig. 13). Peaks were recorded during January-February. The overall mean
number of white sharks sighted per day during the reporting period was 5 ± 3.5.
Figure 13. Percentage frequency of number of white sharks sighted per day by the three cage-diving
operators.
Time spent berleying
Time spent berleying reported ranged from 0 to 13:25 hours per day (220 records, 169
operator days). Mean and median times spent berleying per day were 6:11 ± 0.1 s.d., and
5:50 hours, respectively. Across the industry, operators reported a total of 1,364 hours of
berleying.
Rogers, P.J. et al (2014) Monitoring residency of white sharks
34
Berley input
Berley used to attract white sharks to cages at the Neptune Islands included mince and
frozen blood from southern bluefin tuna. Operators reported the use of 220 L of frozen tuna
blood, 3,390 L of minced tuna and 5,920 L of unspecified’ tuna berley. The overall total of
frozen blood, minced tuna and unspecified tuna berley was 9,530 L.
A total of 93.5 individual Nally™ bins of frozen bins of gills and entrails (median wt per bin =
35.55 kg each) were used in a bottom cage for an estimated weight of 3.33 t in 8 months.
Teaser baits
Teaser baits used at the surface comprised either portions of whole southern bluefin tuna, or
gills and entrails (stomach, intestine, liver and spleen). A total of 100 southern bluefin tuna
(~1.7 t) were used as teaser baits. A total of 323 individual Nally™ bins of frozen bins of gills
and entrails (median wt per bin = 35.55 kg each) were used at the surface for an estimated
weight of 11.5 t. (both operators pooled, n = 169 reported days/dates).
Sound usage
Sound emission was reported to be used at the Neptune Islands for a total of 267 hours. The
daily durations ranged between 1–7.25 hours (mean daily duration = 4.7 ± 1.5 hours).
Rogers, P.J. et al (2014) Monitoring residency of white sharks
35
7.3. Photo Identification
Sightings: photos vs e-logbook
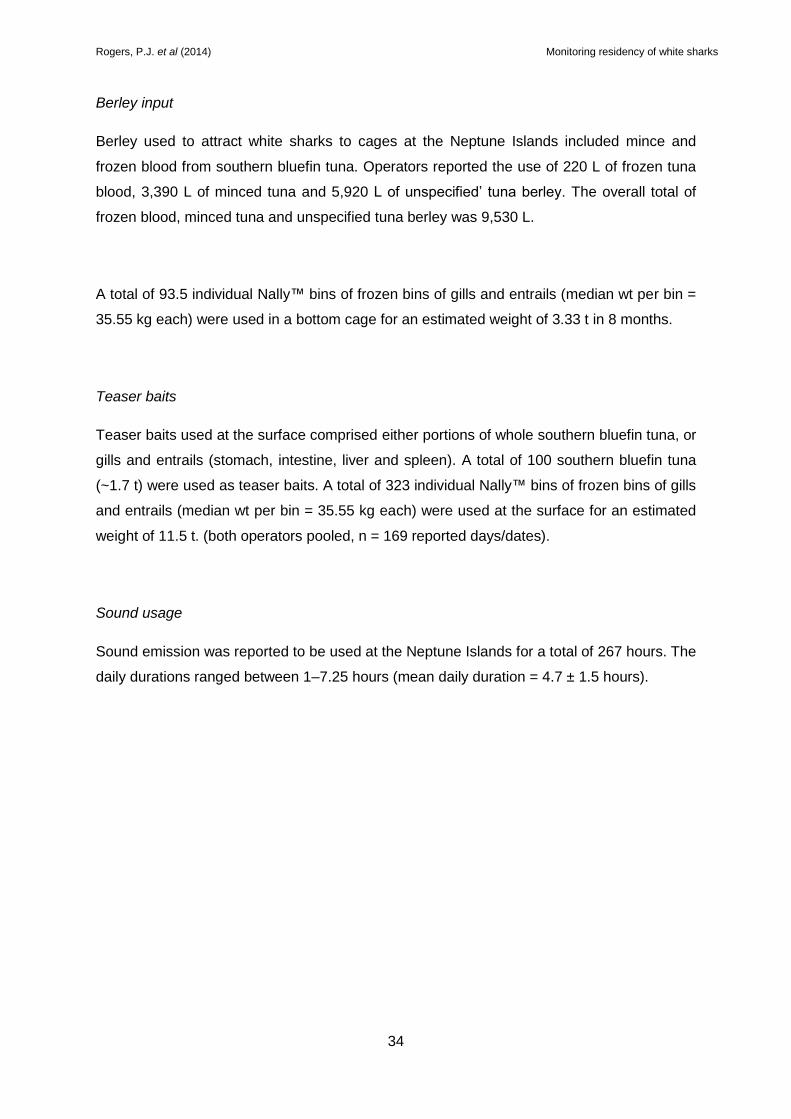
Photographs of white sharks were obtained on 121 days during November 2013 to June
2014. This included all photographs taken on 112 of 159 days in which OP2 was present
and selected photos of individual sharks recorded in the e-logbook by OP3 on 38 of 107
days where they were on site. For OP2, the highest number of individual white sharks
identified per day was in May 2014 and the lowest numbers were observed in March and
April 2014 (Fig. 14). OP3 recorded similar numbers of individual sharks across months, with
an average of two sharks per day in January, February, April and May 2014 (Fig. 14).
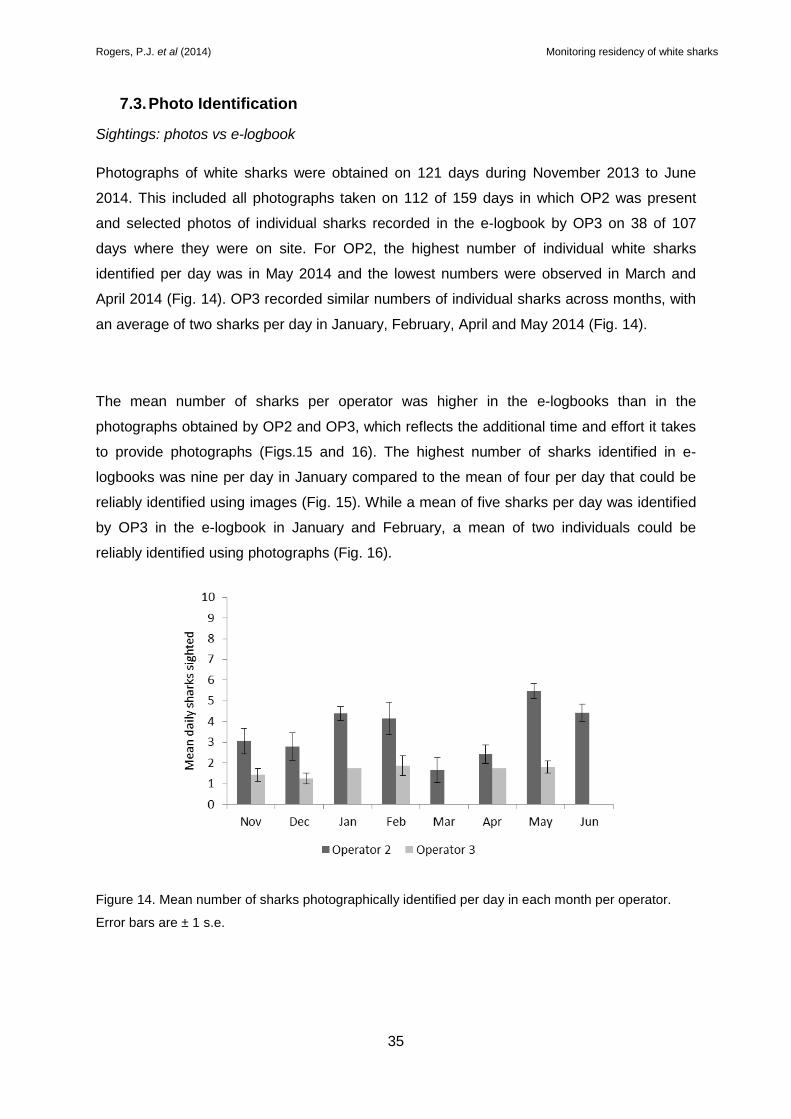
The mean number of sharks per operator was higher in the e-logbooks than in the
photographs obtained by OP2 and OP3, which reflects the additional time and effort it takes
to provide photographs (Figs.15 and 16). The highest number of sharks identified in e-
logbooks was nine per day in January compared to the mean of four per day that could be
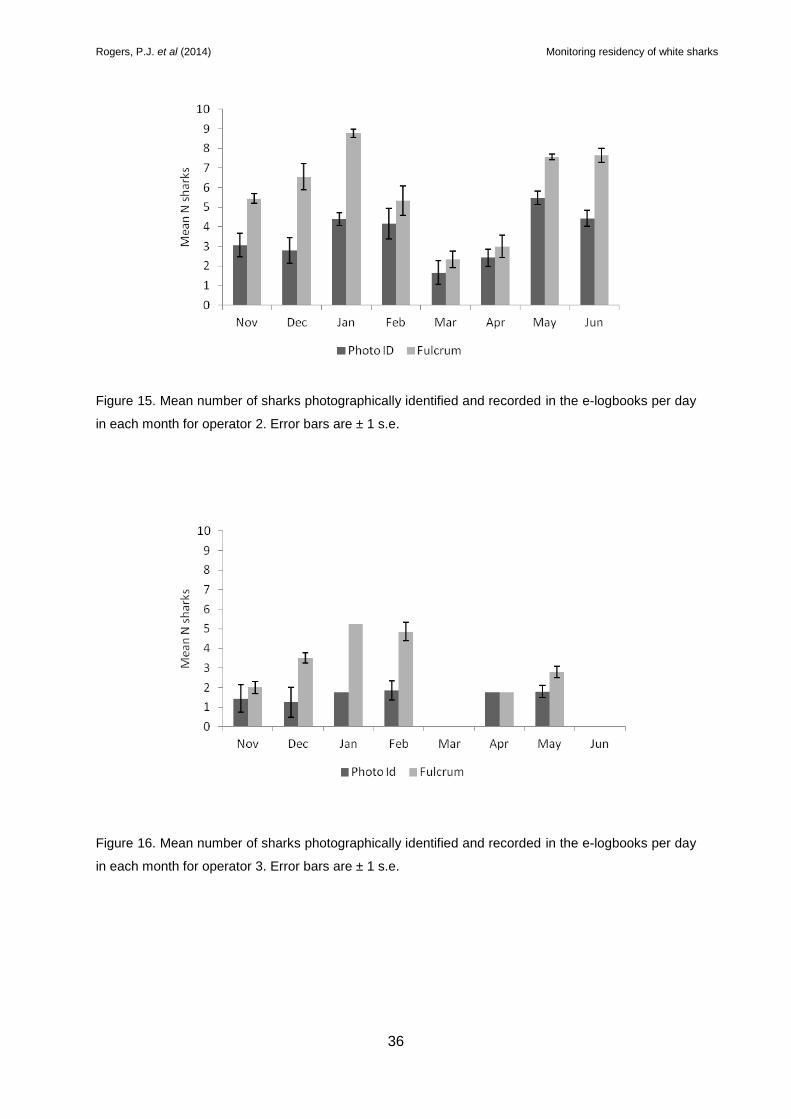
reliably identified using images (Fig. 15). While a mean of five sharks per day was identified
by OP3 in the e-logbook in January and February, a mean of two individuals could be
reliably identified using photographs (Fig. 16).
Figure 14. Mean number of sharks photographically identified per day in each month per operator.
Error bars are ± 1 s.e.
Rogers, P.J. et al (2014) Monitoring residency of white sharks
36
Figure 15. Mean number of sharks photographically identified and recorded in the e-logbooks per day
in each month for operator 2. Error bars are ± 1 s.e.
Figure 16. Mean number of sharks photographically identified and recorded in the e-logbooks per day
in each month for operator 3. Error bars are ± 1 s.e.
Rogers, P.J. et al (2014) Monitoring residency of white sharks
37
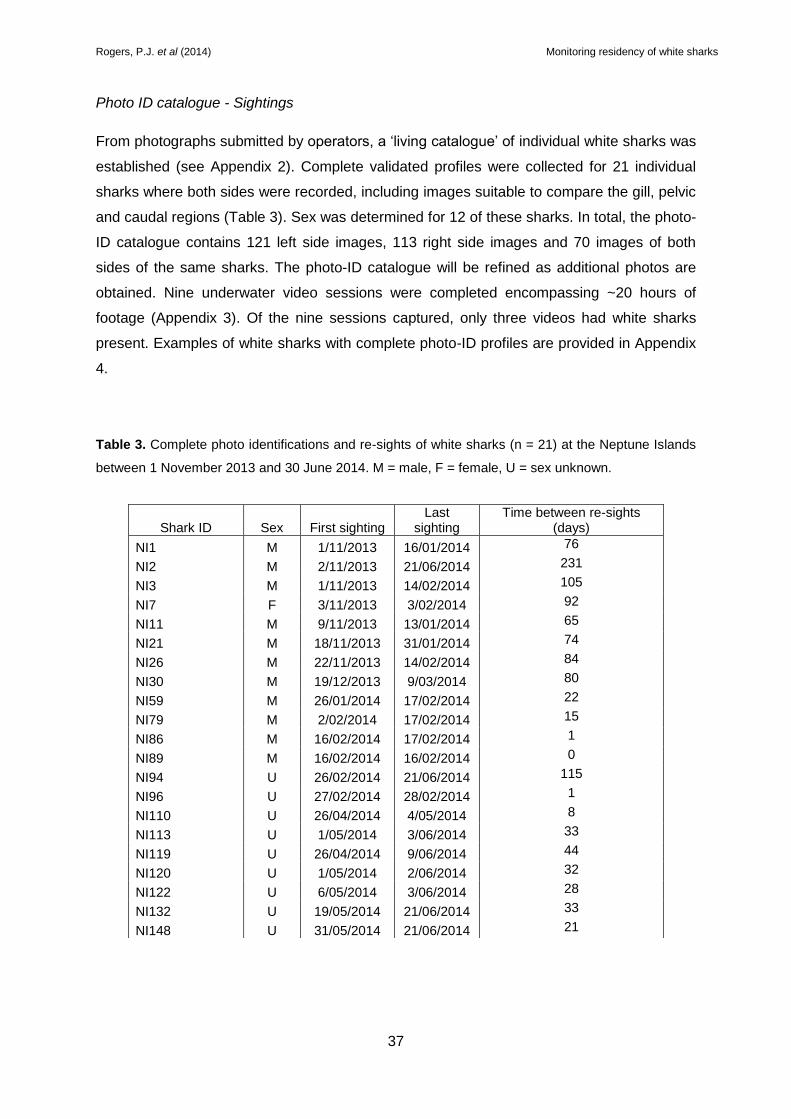
Photo ID catalogue - Sightings
From photographs submitted by operators, a ‘living catalogue’ of individual white sharks was
established (see Appendix 2). Complete validated profiles were collected for 21 individual
sharks where both sides were recorded, including images suitable to compare the gill, pelvic
and caudal regions (Table 3). Sex was determined for 12 of these sharks. In total, the photo-
ID catalogue contains 121 left side images, 113 right side images and 70 images of both
sides of the same sharks. The photo-ID catalogue will be refined as additional photos are
obtained. Nine underwater video sessions were completed encompassing ~20 hours of
footage (Appendix 3). Of the nine sessions captured, only three videos had white sharks
present. Examples of white sharks with complete photo-ID profiles are provided in Appendix
4.
Table 3. Complete photo identifications and re-sights of white sharks (n = 21) at the Neptune Islands
between 1 November 2013 and 30 June 2014. M = male, F = female, U = sex unknown.
Shark ID Sex First sighting Last
sighting Time between re-sights
(days)
NI1 M 1/11/2013 16/01/2014 76
NI2 M 2/11/2013 21/06/2014 231
NI3 M 1/11/2013 14/02/2014 105
NI7 F 3/11/2013 3/02/2014 92
NI11 M 9/11/2013 13/01/2014 65
NI21 M 18/11/2013 31/01/2014 74
NI26 M 22/11/2013 14/02/2014 84
NI30 M 19/12/2013 9/03/2014 80
NI59 M 26/01/2014 17/02/2014 22
NI79 M 2/02/2014 17/02/2014 15
NI86 M 16/02/2014 17/02/2014 1
NI89 M 16/02/2014 16/02/2014 0
NI94 U 26/02/2014 21/06/2014 115
NI96 U 27/02/2014 28/02/2014 1
NI110 U 26/04/2014 4/05/2014 8
NI113 U 1/05/2014 3/06/2014 33
NI119 U 26/04/2014 9/06/2014 44
NI120 U 1/05/2014 2/06/2014 32
NI122 U 6/05/2014 3/06/2014 28
NI132 U 19/05/2014 21/06/2014 33
NI148 U 31/05/2014 21/06/2014 21
Rogers, P.J. et al (2014) Monitoring residency of white sharks
38
8. DISCUSSION
The Department of Environment Water and Natural Resources (DEWNR) Great White Shark
Tourism Policy aims to limit potential impacts of activities associated with white shark cage-
diving in the Neptune Islands Group Marine Park. Estimates of residency of tagged white
sharks form the scientific basis of the State Government’s decision-making process for this
listed, threatened and protected species.
This report provides a summary of information on the development of three methods for
assessing the potential impacts of cage-diving activities on white sharks that use the
Neptune Islands Group Marine Park. Specifically, we provide insights into the behaviours of
white sharks that interact with cage-diving activities to varying levels, including residency
patterns for 15 individuals. We also summarise new information collected using a new web-
linked e-logbook, and an industry-based photo-ID catalogue.
Temporal comparison of acoustic telemetry-based residency estimates
During the reporting period in 2013–14, the range of residency estimates for individual white
sharks of <1 to 117 days (mean = 12.6 ± 22.6 days; n = 15 sharks) was similar (1–92 days;
mean = 21 ± 24 days; n = 21 sharks; 2.8 to 4.8 m, TL) to that reported over the period
between December 2009 and April 2011 (Bruce and Bradford 2011). The mean residency
estimate calculated for all individuals was lower (c.f. previous data), however, this
comparison should be viewed with caution due to the unequal sample sizes of sharks tagged
and the shorter period monitored to generate the preliminary data reported here for 2013–14
(8 months c.f. 16 months, Bruce and Bradford 2011).
Recent fine scale behavioural assessments of white sharks showed the timing of cage-diving
operator activities correlated with changes in the surface swimming behaviours of white
sharks at the Neptune Islands (Huveneers et al. 2013). This previous study found tagged
white sharks stayed >30 m from the operators on 21% of days they were detected, yet also
spent a significant amount of time in closer proximity. The variation in behaviour between
individual sharks was notable, highlighting the complexity of the relationships between cage-
diving activities and behaviours.
Rogers, P.J. et al (2014) Monitoring residency of white sharks
39
A substantial body of evidence collected during acoustic telemetry-based monitoring at
cage-diving sites in South Africa suggests that residency patterns of white sharks are both
complex and individually variable (Johnson and Kock 2006). Major findings of this former
study were: high cage-diving activity areas can elicit a high degree of residency; and sharks
with high levels of experience can also spend less time interacting, especially if predictability
of reward, such as through consumption of teaser baits is reduced. The weight of the
historical data suggests individuals can become habituated to combinations of exposure to
repeated visual and olfactory stimuli to industry activities that involve a level of provisioning
(Johnson and Kock 2006). Individual-level variability in response to human activities that
include provisioning for tourism purposes have also been observed in the sicklefin lemon
shark (Negaprion acutidens) (Clua et al. 2010), Caribbean reef shark (Carcharhinus perezi)
(Maljković and Côté 2011), and bull shark (Carcharhinus leucas) (Brunnschweiler and
Barnett 2013).
Relationships between daily detections and cage-diving industry activity days
During the 2013–14 monitoring period, the number of daily acoustic detections was highest
for four white sharks during cage-diving activity days at the North Neptune Islands. There
were insufficient data available to draw comparisons for the remaining tagged individuals;
some did not spend significant time at the North Neptune Islands, and only two individuals
with short detection periods were recorded at the South Neptune Islands. When cage-diving
was separated into type and combinations of activities, it was apparent that valuable
behavioural insights will be gained when sufficient data are available to perform robust
statistical comparisons. This quantitative modeling will be undertaken in the next report.
During two periods between April 2001 and March/May 2003, tagged white sharks spent
1.35 to 5.45 more time inside the Main Bay during berleying periods (Bruce et al. 2005).
Individual variation in the relationships between daily detections and cage-diving industry
berleying days was also prominent. The follow-up study found the distribution of white shark
activity was also responsive to berleying activities, and made the important point that many
monitoring studies of existing berley and teaser bait-reward-based ecotourism ventures lack
suitable control sites, and/or before data (Bruce and Bradford 2013). SARDI is currently
addressing this knowledge gap by deploying acoustic equipment at several other sites where
cage diving does not occur.
Rogers, P.J. et al (2014) Monitoring residency of white sharks
40
Electronic logbook
The number of white sharks sighted and recorded in the e-logbook peaked at 20 individuals
(OP1) in February and 12 (OP2) in January with 357 daily records logged (mean sightings
per day of 5 ± 3.5), which was higher than those reported using photo-ID. Overall, this shows
operator observational data will continue to form an important part of the process required to
estimate the magnitude of the contingent of the South-west Australian white shark
population that visits the Neptune Islands. Daily activities of the white shark cage-diving
industry include berleying and use of teaser baits comprised of portions or the gills and
entrails of southern bluefin tuna suspended under floats at the surface. The activity of using
teaser baits to enhance customer satisfaction by attracting sharks close to dive cages has
been highlighted previously as requiring further consideration (Bruce and Bradford 2011).
Over the 2013–14 reporting period, the e-logbook data allowed the estimation of the annual
output and use of berley and teaser baits. These data represent the previously missing
baseline for this industry. There is currently a lack of information regarding the potential
ecological impacts of berley input on the North Neptune Island marine ecosystem, nor is
there information regarding the potential impacts of provisioning on white sharks, bony fish
and other elasmobranchs. The current berley and teaser bait input levels require further
discussion with industry and marine resource managers, as does the degree of daily
consumption of teaser baits and potential energetic implications for visiting and semi-
resident white sharks.
Photographic identification
There are no direct estimates of the size of the South-west Australian white shark
population(s), nor is there an estimate of the size of the contingent of the population(s) that
visits and uses the Neptune Islands. Application of photo-ID for estimating relative
abundance (and residency) of white sharks based on mark-recapture methodologies relies
on the satisfaction of key assumptions. These include that individual sharks can be
distinguished through distinctive patterns, and that these individuals can be readily re-
sighted and re-identified over a range of time frames (Anderson et al. 2011; Marshall and
Piece 2012). This method has significant potential to subsequently underpin mark-recapture
based estimates of relative abundance. A previous study developed a quantitative photo-ID
system that was used to identify 76 individual white sharks between January 2006 and
December 2007 at the Neptune Islands (Beckmann 2008). While uncertainty has been
highlighted regarding temporal constancy of lower caudal markings (n = 1) (Robbins and Fox
2012b), other published studies also incorporated images of gill flaps, dorsal fins and other
Rogers, P.J. et al (2014) Monitoring residency of white sharks
41
temporally stable physical characteristics (Domeier and Nasby-Lucas 2006). Recently,
preliminary photo-ID data (images) were used to identify 306 white sharks (immature and
mature-sized) over two periods between 2001–2003 and 2009–2011 at the Neptune Islands
(Robbins and Fox 2012a). SARDI initiated development of an industry-wide photo-ID
catalogue in September 2013, and 21 sharks were identified (with 162 awaiting further
confirmation) to provide positive subsequent matches or resights based on >100 images
sets provided by two cage-diving operators. Steps are being taken to combine all existing
images with the aim of estimating the relative abundance of white sharks that visit the
Neptune Islands by 2016. The long-term aim will be the development of a Pubic National
White Shark Photo-ID Catalogue to be available on-line to log ‘new sharks’ and register
possible re-sights. This could be developed to incorporate a public portal so customers of
white shark cage-diving charters can lodge images or video for subsequent screening and
matching to the catalogue.
Conclusion
This report provides an update of residency estimates for white sharks that are currently
being monitored using satellite linked acoustic telemetry at the Neptune Islands. Over the
2014–2016 period, this research program will aim to integrate and evaluate satellite-linked
acoustic telemetry data for at least 60 white sharks, conduct detailed analyses of operator
electronic logbook data, and use photo-ID to estimate the size of the visiting component of
the South-west white shark population. This series of steps addresses some of the
significant gaps in information required to undertake robust assessments of the impacts of
cage-diving activities on the white shark population that visits the Neptune Islands Group
Marine Park, whilst also addressing key priorities in the Recovery Plan for the White Shark
and the National Plan of Action for the Conservation and Management of Sharks 2012
(Shark-plan 2).

Rogers, P.J. et al (2014) Monitoring residency of white sharks
42
On the basis of the preliminary findings of this report, and the valuable baseline data
provided by Bruce and Bradford (2011, 2013), SARDI recommends that DEWNR:
1) Establish arrangements pertaining to the provision and use of images (by individual
trip) specifically for identification and assessment of relative abundance of white
sharks that visit the Neptune Islands Group Marine Park;
2) Facilitates the development of a suite of management decision rules that incorporate
behavioural indicators and triggers for incorporation in the Great White Shark
Tourism Policy and associated management documentation for the Neptune Islands
Group Marine Park;
3) Support further research to determine the linkages and relative importance of the
Neptune Islands Group as a stop-off point during broad-scale movement and
migratory phases;
4) Continues to support monitoring of residency, interactive behavior and associated
energetic requirements of white sharks (e.g. Semmens et al. 2013) in relation to
shark tourism activities.
Rogers, P.J. et al (2014) Monitoring residency of white sharks
43
REFERENCES
Anderson, S. D., Chapple, T. K., Jorgensen, S. J., Klimley, A. P., Block, B. A. (2011).
Long-term individual identification and site fidelity of white sharks, Carcharodon
carcharias, off California using dorsal fins. Marine Biology 158, 1233–1237.
Anderson, S. D., Goldman, K. J. (1996) Photographic Evidence of White Shark Movement in
California Waters. California Fish and Game 82, 182–186.
Beckmann, C. (2008). Using photographic identification to determine the behavioural
ecology of the great white shark (Carcharodon carcharias). Honours Thesis. School
of Biological Sciences. Flinders University. 86 pp.
Bonfil, R., Meÿer, M., Scholl, M. C., Johnson, R., et al. (2005). Transoceanic migration,
spatial dynamics and population linkages of white sharks. Science 310, 100–103.
Bradford, R. W, Bruce, B. D, McAuley, R. B., Robinson, G. (2011). An Evaluation of Passive
Acoustic Monitoring Using Satellite Communication Technology for Near Real-Time
Detection of Tagged Animals in a Marine Setting. The Open Fish Science Journal 4,
10–20.
Bradford, R., Robbins, R. (2013). A Rapid Assessment Technique to Assist Management of
the White Shark (Carcharodon carcharias) Cage Dive Industry, South Australia. The
Open Fish Science Journal 03/2013; 6:13-18. DOI:
10.2174/1874401X01306010013.
Bruce B. D. (1992). Preliminary observations on the biology of the white shark, Carcharodon
carcharias, in South Australian waters. Australian Journal of Marine and Freshwater
Research 43, 1–11.
Bruce, B. D., Stevens, J. D., Bradford, R. W. (2005). Site fidelity, residence times and home
range patterns of white sharks around pinniped colonies. CSIRO Final Report to the
Australian Government Department of the Environment and Heritage. 45 pp.
Bruce, B. D., Stevens, J.D., Malcolm, H. (2006). Movements and swimming behaviour of
white sharks (Carcharodon carcharias) in Australian waters. Marine Biology 150,
161−172.
Bruce, B. D., Bradford, R. W. (2011). The effects of berleying on the distribution and
behaviour of white sharks, Carcharodon carcharias, at the Neptune Islands, South
Australia. Final Report to the Department of Environment and Natural Resources,
South Australia, 50 pp.
Rogers, P.J. et al (2014) Monitoring residency of white sharks
44
Bruce, B. D., Bradford, R. W. (2013). The effects of shark cage-diving operations on the
behaviour and movements of white sharks, Carcharodon carcharias, at the Neptune
Islands, South Australia. Marine Biology 160, 889–907.
Brunnschweiler, J. M., Barnett, A. (2013). Opportunistic visitors: longterm behavioural
response of bull sharks to food provisioning in Fiji. PLoS ONE 8:e58522.
Bryars, S., Rogers, P., Huveneers, C., Payne, N., Smith, I., McDonald, B. (2012) Small
home range in southern Australia’s largest resident reef fish, the western blue
groper (Achoerodus gouldii): implications for adequacy of no-take marine protected
areas. Marine and Freshwater Research 63, 552–563.
Chapple, T. K., Jorgensen, S. J., Anderson, S. D., Kanive, P. E., Klimley, A. P., Botsford, L.
W., Block, B. A. (2011). A first estimate of white shark, Carcharodon carcharias,
abundance off Central California. Biology Letters 7, 581–583.
CITES (2004). Convention of International Trade in Endangered Species of Wild Fauna and
Flora - Appendix II Listing of the White Shark (revision 1). [Online]. Available from:
http://www.environment.gov.au/coasts/publications/pubs/great-white-cites-
appendix2-english.pdf.
Clua, E., Buray, N., Legendre, P., Mourier, J., Planes, S. (2010). Behavioural response of
sicklefin lemon sharks Negaprion acutidens to underwater feeding for ecotourism
purposes. Marine Ecology Progress Series 414, 257–266.
Department of the Environment (2013). Recovery Plan for the White Shark (Carcharodon
carcharias). http://www.environment.gov.au/resource/recovery-plan-white-shark-
carcharodon-carcharias.
Department of Fisheries Western Australia (2014). http://www.fish.wa.gov.au/About-
Us/Media-releases/Pages/Investigation-concluded-into-death-of-White-shark.aspx
Domeier, M. L., Nasby-Lucas, N. (2006). Annual resightings of photographically identified
white sharks (Carcharadon carcharias) at an eastern Pacific aggregation site.
Marine Biology 150, 977–984.
Fisheries Management Act
(2007).http://www.legislation.sa.gov.au/LZ/C/A/FISHERIES%20MANAGEMENT%2
0ACT%202007.aspx
Rogers, P.J. et al (2014) Monitoring residency of white sharks
45
Gjelland, K., Hedger, R. (2013). Environmental influence on transmitter detection probability
in biotelemetry: developing a general model of acoustic transmission. Methods in
Ecology and Evolution 4, 665–674.
Gubili, C., Johnson, R., Gennari, E., Oosthuizen, W., Kotze, D., Meyer, M., Sims., D, Jones,
C., Noble, L. (2009). Concordance of genetic and fin photo identification in the great
white shark, Carcharodon carcharias off Mossel Bay, South Africa. Marine Biology,
156, 2199–2207. doi:10.1007/s00227-009-1233-y.
Huveneers, C, Rogers, P. J., Beckmann, C., Semmens, J. M., Bruce, B. D., Seuront, L.
(2013). The effects of cage-diving activities on the fine-scale swimming behaviour
and space use of white shark. Marine Biology DOI 10.1007/s00227-013-2277-6.
Huveneers, C. H., Rogers, P. J., Drew, M. (2014). Monitoring shark species of conservation
concern within the Adelaide metropolitan and Gulf St Vincent regions. Final Report
to the Adelaide and Mount Lofty Ranges Natural Resources Management Board.
SARDI Aquatic Sciences, Adelaide. SARDI Publication Number/ F2013/000716-1.
SARDI Research Report Series No. 754. 89 pp.
IUCN (2014) Red List of Threatened Species (Year Assessed: 2005-10-01). Carcharodon
carcharias http://www.iucnredlist.org/details/3855/0
Johnson, R., A Kock. 2006. South Africa’s White Shark cage-diving industry - is their cause
for concern? In Nel DC & Peschak TP (eds) Finding a balance: White shark
conservation and recreational safety in the inshore waters of Cape Town, South
Africa; proceedings of a specialist workshop. WWF South Africa Report Series -
2006/Marine/001.
Klimley, A. P., Anderson, S. D. (1996). Residency patterns of white sharks at the South
Farallon Islands, California. In: Klimley AP, Ainley DG (eds) Great white sharks: the
biology of Carcharodon carcharias. Academic, San Diego, pp 365–373.
Marshall, A. D., S. I. Pierce (2012). The use and abuse of photographic identification in
sharks and rays. Journal of Fish Biology 80, 1361–1379.
Maljković, A., Côté, I. (2011) Effects of tourism-related provisioning on the trophic signatures
and movement patterns of an apex predator, the Caribbean reef shark. Biological
Conservation 144, 859–865.
Neptune Islands Group Ron and Valarie Taylor Marine Park Marine Park (2014).
Management Plan Summary. 4 pp.
Rogers, P.J. et al (2014) Monitoring residency of white sharks
46
Orams, M. B. (2002). Feeding wildlife as a tourism attraction: a review of issues and
impacts. Tourism Management 23, 281–293.
Payne, N., Gillanders, B. M., Webber, D., Semmens, J. M. (2010). "Interpreting diel activity
patterns from acoustic telemetry: the need for controls." Marine Ecology Progress
Series 419, 295–301.
Pincock, D. G. (2011). "False detections: what they are and how to remove them from
detection data." DOC-004691 Version 02, April 13, 2011.
Robbins, R., Fox, A., (2012a). Use of the photographic identification of white sharks
(Carcharodon carcharias) to determine seasonal abundance and site fidelity
patterns, at the Neptune Islands, South Australia. Final Report to the Norman
Wettenhall Foundation. Fox Shark Research Foundation. 22 pp.
Robbins, R., Fox, A. (2012b). Further evidence of pigmentation change in white sharks,
Carcharodon carcharias. Marine and Freshwater Research 63, 1215–1217.
Semmens, J. M., Payne, N. L., Huveneers, C., Sims, D. W., and Bruce, B. D. (2013).
Feeding requirements of white sharks may be higher than originally thought.
Scientific Reports, 3, 1471. 4 pp. doi:10.1038/srep01471.
Shark-plan 2 (2012) National Plan of Action for the Conservation and Management of
Sharks http://www.agriculture.gov.au/fisheries/environment/sharks/sharkplan2
Shaunghnessy, P. D., Dennis, T. E., and Beris, M. (2007). Predation on Australian sea lions
Neophoca cinerea by white sharks Carcharodon carcharias in South Australia.
Australian Mammology 29, 69–76.
Stevick, P. T., Palsboll, Per. J., Smith, T. D., Bravington, M. V., Hammond, P. S. (2001).
Errors in identification using natural markings: rates, sources, and effects on
capture-recapture estimates of abundance. Canadian Journal of Fisheries and
Aquatic Sciences 58, 1861–1870.
Strong, W. R., Jr, Bruce, B. D., Nelson, D. R., Murphy, R. D. (1996). Population dynamics of
white sharks in Spencer Gulf, South Australia. In: Klimley, A.P. & D.G. Ainley, eds.
Great White Sharks: the Biology of Carcharodon carcharias. Page(s) 401–414.
United States of America: Academic Press.
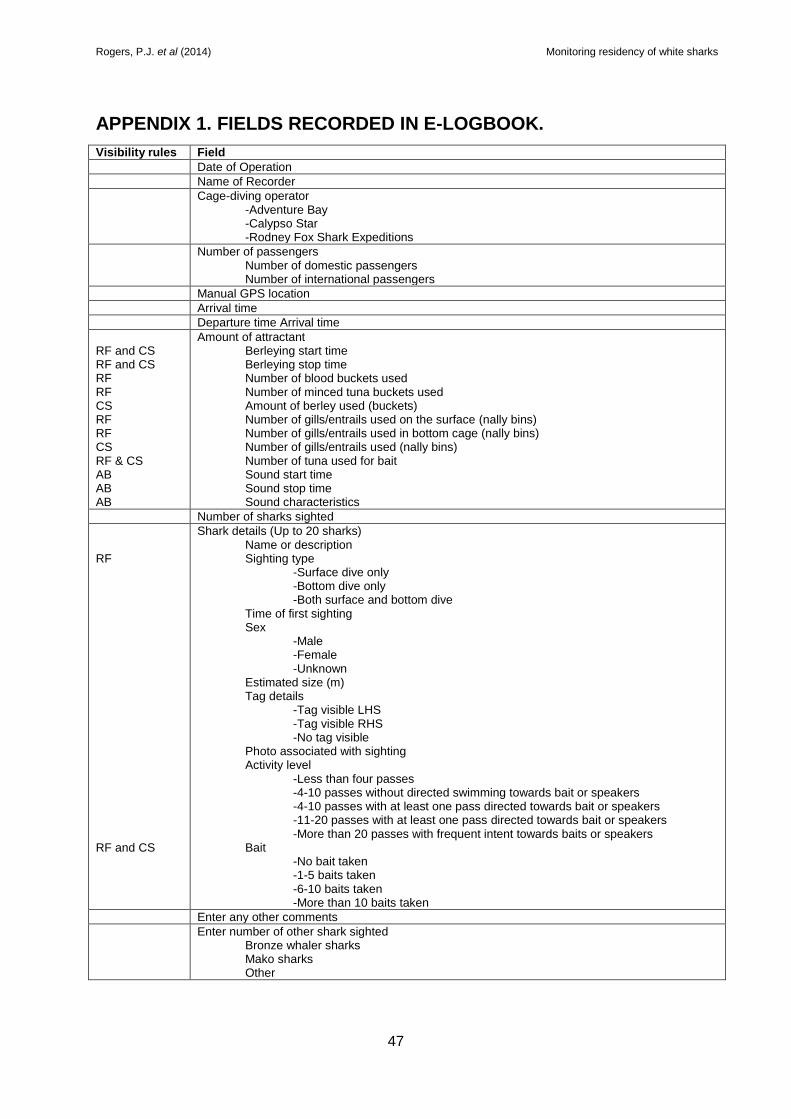
Rogers, P.J. et al (2014) Monitoring residency of white sharks
47
APPENDIX 1. FIELDS RECORDED IN E-LOGBOOK.
Visibility rules Field
Date of Operation
Name of Recorder
Cage-diving operator -Adventure Bay -Calypso Star -Rodney Fox Shark Expeditions
Number of passengers Number of domestic passengers Number of international passengers
Manual GPS location
Arrival time
Departure time Arrival time
RF and CS RF and CS RF RF CS RF RF CS RF & CS AB AB AB
Amount of attractant Berleying start time Berleying stop time Number of blood buckets used Number of minced tuna buckets used Amount of berley used (buckets) Number of gills/entrails used on the surface (nally bins) Number of gills/entrails used in bottom cage (nally bins) Number of gills/entrails used (nally bins) Number of tuna used for bait Sound start time Sound stop time Sound characteristics
Number of sharks sighted
RF RF and CS
Shark details (Up to 20 sharks) Name or description Sighting type
-Surface dive only -Bottom dive only -Both surface and bottom dive
Time of first sighting Sex
-Male -Female -Unknown
Estimated size (m) Tag details
-Tag visible LHS -Tag visible RHS -No tag visible
Photo associated with sighting Activity level
-Less than four passes -4-10 passes without directed swimming towards bait or speakers -4-10 passes with at least one pass directed towards bait or speakers -11-20 passes with at least one pass directed towards bait or speakers -More than 20 passes with frequent intent towards baits or speakers
Bait -No bait taken -1-5 baits taken -6-10 baits taken -More than 10 baits taken
Enter any other comments
Enter number of other shark sighted Bronze whaler sharks Mako sharks Other
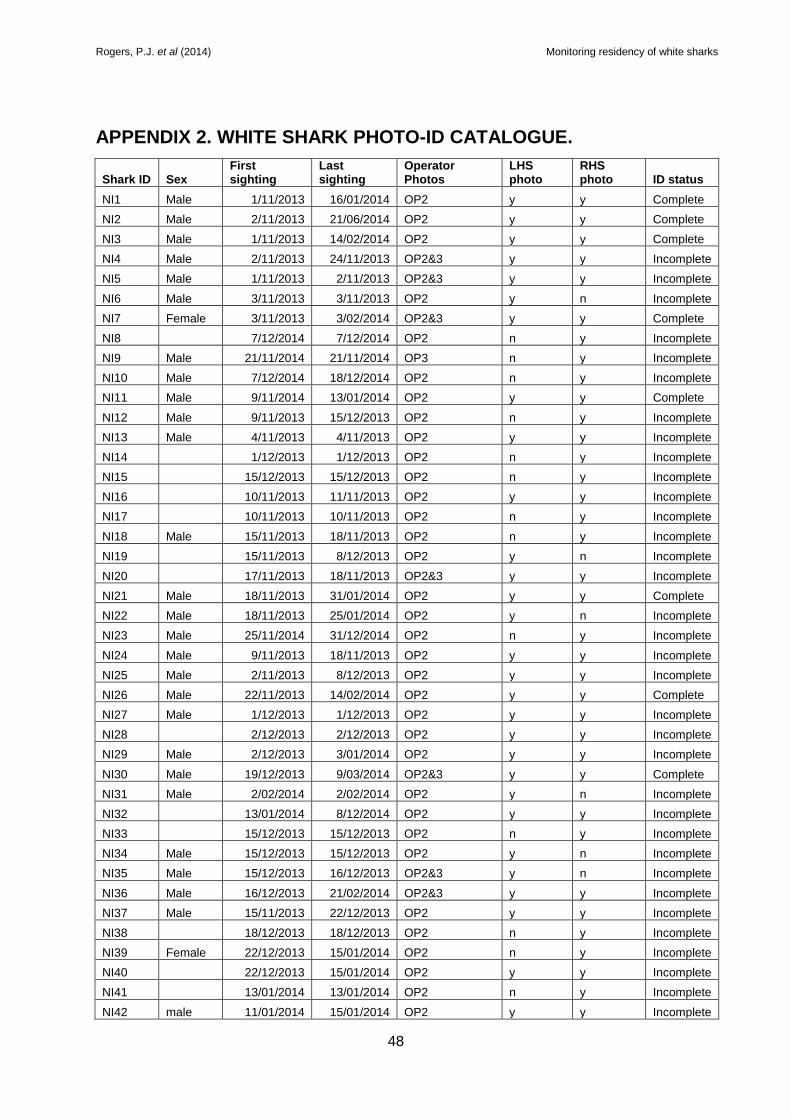
Rogers, P.J. et al (2014) Monitoring residency of white sharks
48
APPENDIX 2. WHITE SHARK PHOTO-ID CATALOGUE.
Shark ID Sex First sighting
Last sighting
Operator Photos
LHS photo
RHS photo ID status
NI1 Male 1/11/2013 16/01/2014 OP2 y y Complete
NI2 Male 2/11/2013 21/06/2014 OP2 y y Complete
NI3 Male 1/11/2013 14/02/2014 OP2 y y Complete
NI4 Male 2/11/2013 24/11/2013 OP2&3 y y Incomplete
NI5 Male 1/11/2013 2/11/2013 OP2&3 y y Incomplete
NI6 Male 3/11/2013 3/11/2013 OP2 y n Incomplete
NI7 Female 3/11/2013 3/02/2014 OP2&3 y y Complete
NI8
7/12/2014 7/12/2014 OP2 n y Incomplete
NI9 Male 21/11/2014 21/11/2014 OP3 n y Incomplete
NI10 Male 7/12/2014 18/12/2014 OP2 n y Incomplete
NI11 Male 9/11/2014 13/01/2014 OP2 y y Complete
NI12 Male 9/11/2013 15/12/2013 OP2 n y Incomplete
NI13 Male 4/11/2013 4/11/2013 OP2 y y Incomplete
NI14
1/12/2013 1/12/2013 OP2 n y Incomplete
NI15
15/12/2013 15/12/2013 OP2 n y Incomplete
NI16
10/11/2013 11/11/2013 OP2 y y Incomplete
NI17
10/11/2013 10/11/2013 OP2 n y Incomplete
NI18 Male 15/11/2013 18/11/2013 OP2 n y Incomplete
NI19
15/11/2013 8/12/2013 OP2 y n Incomplete
NI20
17/11/2013 18/11/2013 OP2&3 y y Incomplete
NI21 Male 18/11/2013 31/01/2014 OP2 y y Complete
NI22 Male 18/11/2013 25/01/2014 OP2 y n Incomplete
NI23 Male 25/11/2014 31/12/2014 OP2 n y Incomplete
NI24 Male 9/11/2013 18/11/2013 OP2 y y Incomplete
NI25 Male 2/11/2013 8/12/2013 OP2 y y Incomplete
NI26 Male 22/11/2013 14/02/2014 OP2 y y Complete
NI27 Male 1/12/2013 1/12/2013 OP2 y y Incomplete
NI28
2/12/2013 2/12/2013 OP2 y y Incomplete
NI29 Male 2/12/2013 3/01/2014 OP2 y y Incomplete
NI30 Male 19/12/2013 9/03/2014 OP2&3 y y Complete
NI31 Male 2/02/2014 2/02/2014 OP2 y n Incomplete
NI32
13/01/2014 8/12/2014 OP2 y y Incomplete
NI33
15/12/2013 15/12/2013 OP2 n y Incomplete
NI34 Male 15/12/2013 15/12/2013 OP2 y n Incomplete
NI35 Male 15/12/2013 16/12/2013 OP2&3 y n Incomplete
NI36 Male 16/12/2013 21/02/2014 OP2&3 y y Incomplete
NI37 Male 15/11/2013 22/12/2013 OP2 y y Incomplete
NI38
18/12/2013 18/12/2013 OP2 n y Incomplete
NI39 Female 22/12/2013 15/01/2014 OP2 n y Incomplete
NI40
22/12/2013 15/01/2014 OP2 y y Incomplete
NI41
13/01/2014 13/01/2014 OP2 n y Incomplete
NI42 male 11/01/2014 15/01/2014 OP2 y y Incomplete
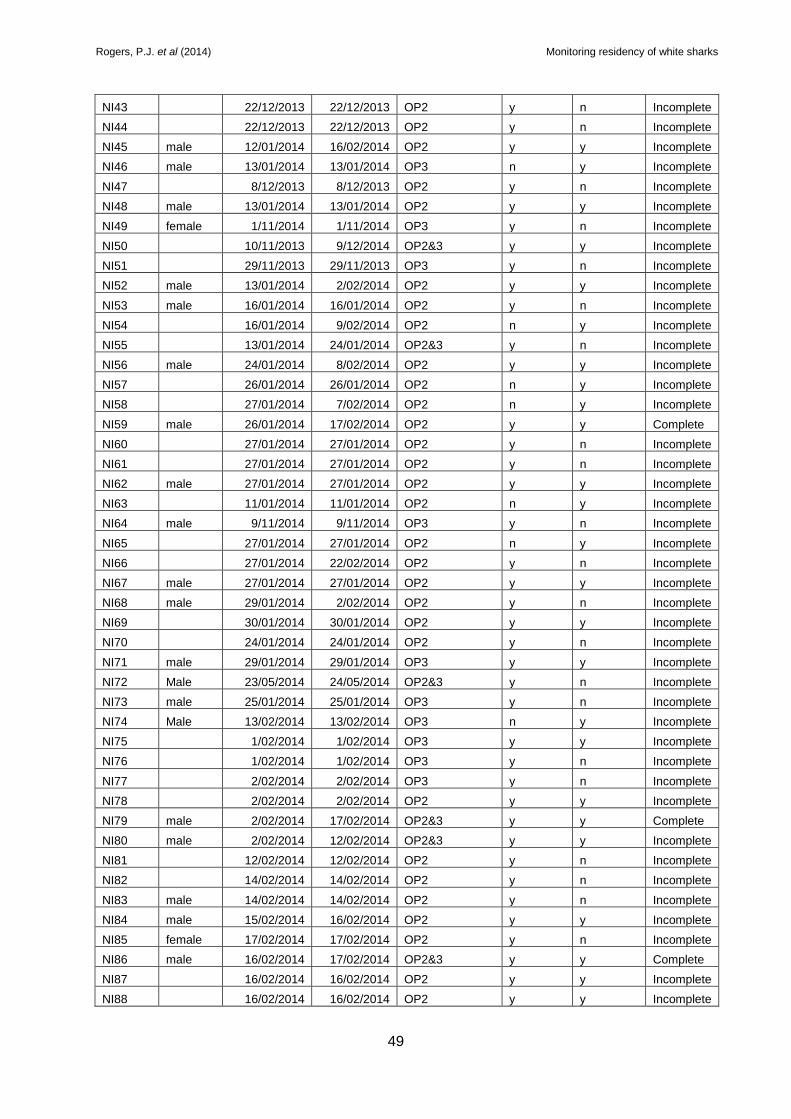
Rogers, P.J. et al (2014) Monitoring residency of white sharks
49
NI43
22/12/2013 22/12/2013 OP2 y n Incomplete
NI44
22/12/2013 22/12/2013 OP2 y n Incomplete
NI45 male 12/01/2014 16/02/2014 OP2 y y Incomplete
NI46 male 13/01/2014 13/01/2014 OP3 n y Incomplete
NI47
8/12/2013 8/12/2013 OP2 y n Incomplete
NI48 male 13/01/2014 13/01/2014 OP2 y y Incomplete
NI49 female 1/11/2014 1/11/2014 OP3 y n Incomplete
NI50
10/11/2013 9/12/2014 OP2&3 y y Incomplete
NI51
29/11/2013 29/11/2013 OP3 y n Incomplete
NI52 male 13/01/2014 2/02/2014 OP2 y y Incomplete
NI53 male 16/01/2014 16/01/2014 OP2 y n Incomplete
NI54
16/01/2014 9/02/2014 OP2 n y Incomplete
NI55
13/01/2014 24/01/2014 OP2&3 y n Incomplete
NI56 male 24/01/2014 8/02/2014 OP2 y y Incomplete
NI57
26/01/2014 26/01/2014 OP2 n y Incomplete
NI58
27/01/2014 7/02/2014 OP2 n y Incomplete
NI59 male 26/01/2014 17/02/2014 OP2 y y Complete
NI60
27/01/2014 27/01/2014 OP2 y n Incomplete
NI61
27/01/2014 27/01/2014 OP2 y n Incomplete
NI62 male 27/01/2014 27/01/2014 OP2 y y Incomplete
NI63
11/01/2014 11/01/2014 OP2 n y Incomplete
NI64 male 9/11/2014 9/11/2014 OP3 y n Incomplete
NI65
27/01/2014 27/01/2014 OP2 n y Incomplete
NI66
27/01/2014 22/02/2014 OP2 y n Incomplete
NI67 male 27/01/2014 27/01/2014 OP2 y y Incomplete
NI68 male 29/01/2014 2/02/2014 OP2 y n Incomplete
NI69
30/01/2014 30/01/2014 OP2 y y Incomplete
NI70
24/01/2014 24/01/2014 OP2 y n Incomplete
NI71 male 29/01/2014 29/01/2014 OP3 y y Incomplete
NI72 Male 23/05/2014 24/05/2014 OP2&3 y n Incomplete
NI73 male 25/01/2014 25/01/2014 OP3 y n Incomplete
NI74 Male 13/02/2014 13/02/2014 OP3 n y Incomplete
NI75
1/02/2014 1/02/2014 OP3 y y Incomplete
NI76
1/02/2014 1/02/2014 OP3 y n Incomplete
NI77
2/02/2014 2/02/2014 OP3 y n Incomplete
NI78
2/02/2014 2/02/2014 OP2 y y Incomplete
NI79 male 2/02/2014 17/02/2014 OP2&3 y y Complete
NI80 male 2/02/2014 12/02/2014 OP2&3 y y Incomplete
NI81
12/02/2014 12/02/2014 OP2 y n Incomplete
NI82
14/02/2014 14/02/2014 OP2 y n Incomplete
NI83 male 14/02/2014 14/02/2014 OP2 y n Incomplete
NI84 male 15/02/2014 16/02/2014 OP2 y y Incomplete
NI85 female 17/02/2014 17/02/2014 OP2 y n Incomplete
NI86 male 16/02/2014 17/02/2014 OP2&3 y y Complete
NI87
16/02/2014 16/02/2014 OP2 y y Incomplete
NI88
16/02/2014 16/02/2014 OP2 y y Incomplete
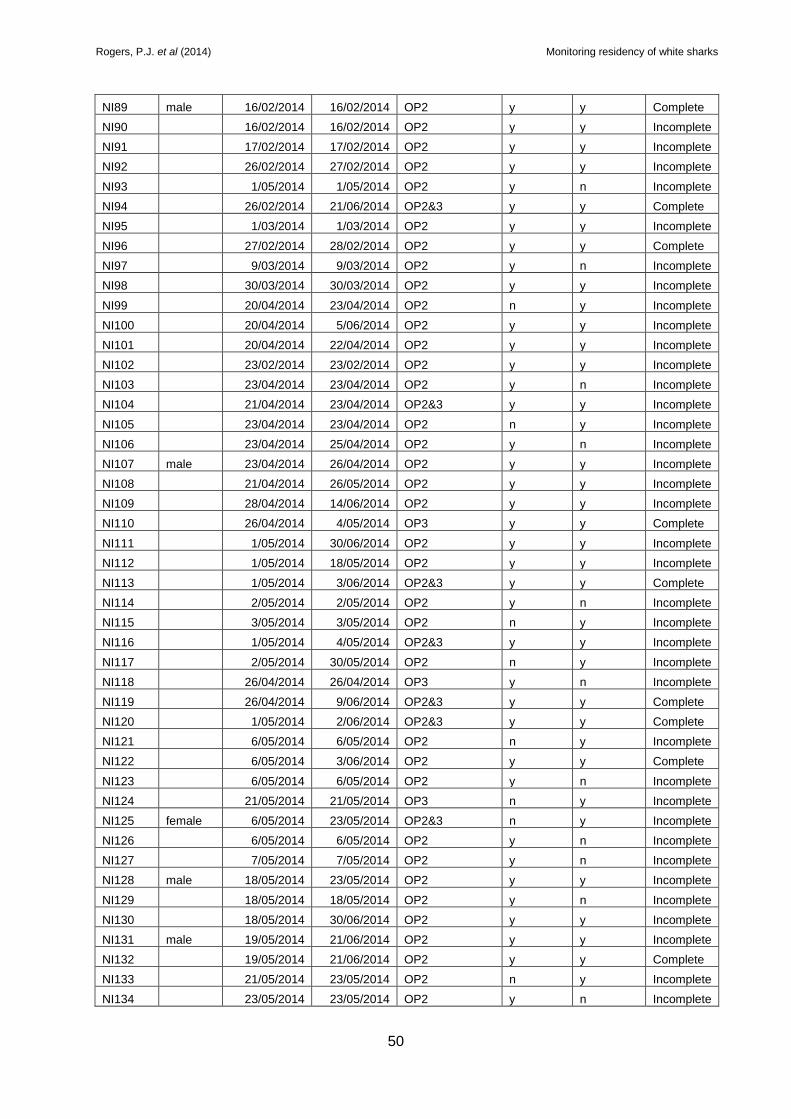
Rogers, P.J. et al (2014) Monitoring residency of white sharks
50
NI89 male 16/02/2014 16/02/2014 OP2 y y Complete
NI90
16/02/2014 16/02/2014 OP2 y y Incomplete
NI91
17/02/2014 17/02/2014 OP2 y y Incomplete
NI92
26/02/2014 27/02/2014 OP2 y y Incomplete
NI93
1/05/2014 1/05/2014 OP2 y n Incomplete
NI94
26/02/2014 21/06/2014 OP2&3 y y Complete
NI95
1/03/2014 1/03/2014 OP2 y y Incomplete
NI96
27/02/2014 28/02/2014 OP2 y y Complete
NI97
9/03/2014 9/03/2014 OP2 y n Incomplete
NI98
30/03/2014 30/03/2014 OP2 y y Incomplete
NI99
20/04/2014 23/04/2014 OP2 n y Incomplete
NI100
20/04/2014 5/06/2014 OP2 y y Incomplete
NI101
20/04/2014 22/04/2014 OP2 y y Incomplete
NI102
23/02/2014 23/02/2014 OP2 y y Incomplete
NI103
23/04/2014 23/04/2014 OP2 y n Incomplete
NI104
21/04/2014 23/04/2014 OP2&3 y y Incomplete
NI105
23/04/2014 23/04/2014 OP2 n y Incomplete
NI106
23/04/2014 25/04/2014 OP2 y n Incomplete
NI107 male 23/04/2014 26/04/2014 OP2 y y Incomplete
NI108
21/04/2014 26/05/2014 OP2 y y Incomplete
NI109
28/04/2014 14/06/2014 OP2 y y Incomplete
NI110
26/04/2014 4/05/2014 OP3 y y Complete
NI111
1/05/2014 30/06/2014 OP2 y y Incomplete
NI112
1/05/2014 18/05/2014 OP2 y y Incomplete
NI113
1/05/2014 3/06/2014 OP2&3 y y Complete
NI114
2/05/2014 2/05/2014 OP2 y n Incomplete
NI115
3/05/2014 3/05/2014 OP2 n y Incomplete
NI116
1/05/2014 4/05/2014 OP2&3 y y Incomplete
NI117
2/05/2014 30/05/2014 OP2 n y Incomplete
NI118
26/04/2014 26/04/2014 OP3 y n Incomplete
NI119
26/04/2014 9/06/2014 OP2&3 y y Complete
NI120
1/05/2014 2/06/2014 OP2&3 y y Complete
NI121
6/05/2014 6/05/2014 OP2 n y Incomplete
NI122
6/05/2014 3/06/2014 OP2 y y Complete
NI123
6/05/2014 6/05/2014 OP2 y n Incomplete
NI124
21/05/2014 21/05/2014 OP3 n y Incomplete
NI125 female 6/05/2014 23/05/2014 OP2&3 n y Incomplete
NI126
6/05/2014 6/05/2014 OP2 y n Incomplete
NI127
7/05/2014 7/05/2014 OP2 y n Incomplete
NI128 male 18/05/2014 23/05/2014 OP2 y y Incomplete
NI129
18/05/2014 18/05/2014 OP2 y n Incomplete
NI130
18/05/2014 30/06/2014 OP2 y y Incomplete
NI131 male 19/05/2014 21/06/2014 OP2 y y Incomplete
NI132
19/05/2014 21/06/2014 OP2 y y Complete
NI133
21/05/2014 23/05/2014 OP2 n y Incomplete
NI134
23/05/2014 23/05/2014 OP2 y n Incomplete
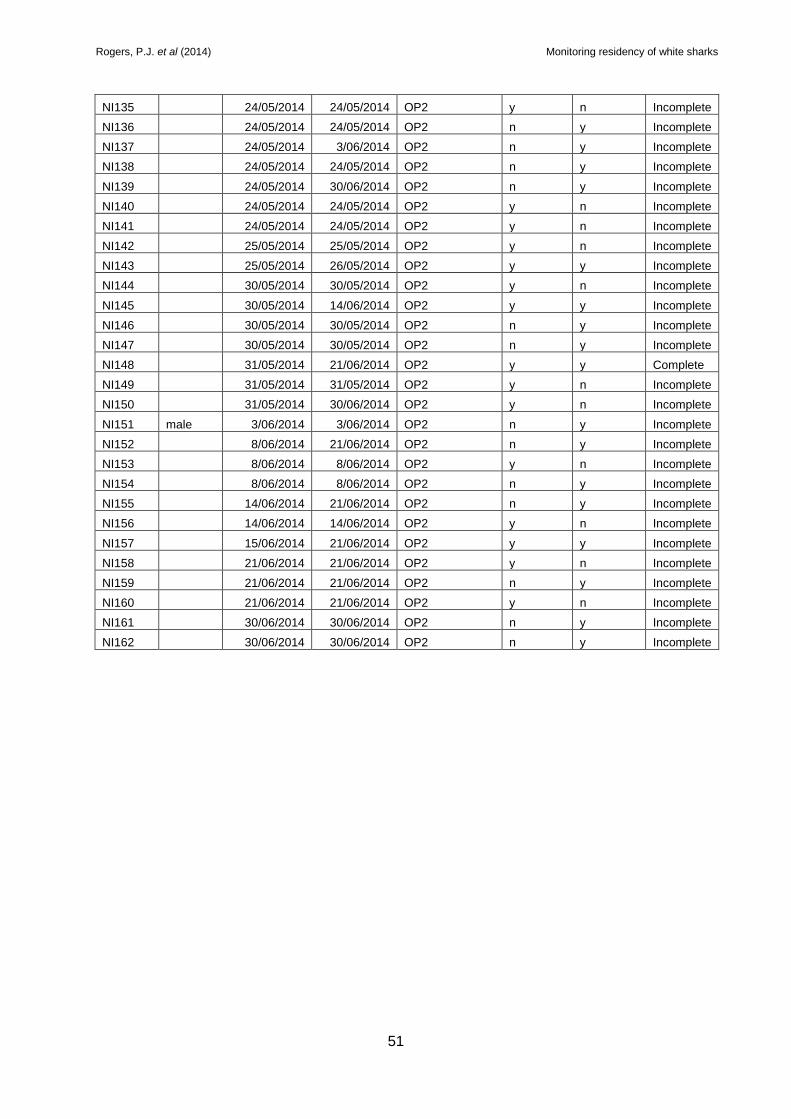
Rogers, P.J. et al (2014) Monitoring residency of white sharks
51
NI135
24/05/2014 24/05/2014 OP2 y n Incomplete
NI136
24/05/2014 24/05/2014 OP2 n y Incomplete
NI137
24/05/2014 3/06/2014 OP2 n y Incomplete
NI138
24/05/2014 24/05/2014 OP2 n y Incomplete
NI139
24/05/2014 30/06/2014 OP2 n y Incomplete
NI140
24/05/2014 24/05/2014 OP2 y n Incomplete
NI141
24/05/2014 24/05/2014 OP2 y n Incomplete
NI142
25/05/2014 25/05/2014 OP2 y n Incomplete
NI143
25/05/2014 26/05/2014 OP2 y y Incomplete
NI144
30/05/2014 30/05/2014 OP2 y n Incomplete
NI145
30/05/2014 14/06/2014 OP2 y y Incomplete
NI146
30/05/2014 30/05/2014 OP2 n y Incomplete
NI147
30/05/2014 30/05/2014 OP2 n y Incomplete
NI148
31/05/2014 21/06/2014 OP2 y y Complete
NI149
31/05/2014 31/05/2014 OP2 y n Incomplete
NI150
31/05/2014 30/06/2014 OP2 y n Incomplete
NI151 male 3/06/2014 3/06/2014 OP2 n y Incomplete
NI152
8/06/2014 21/06/2014 OP2 n y Incomplete
NI153
8/06/2014 8/06/2014 OP2 y n Incomplete
NI154
8/06/2014 8/06/2014 OP2 n y Incomplete
NI155
14/06/2014 21/06/2014 OP2 n y Incomplete
NI156
14/06/2014 14/06/2014 OP2 y n Incomplete
NI157
15/06/2014 21/06/2014 OP2 y y Incomplete
NI158
21/06/2014 21/06/2014 OP2 y n Incomplete
NI159
21/06/2014 21/06/2014 OP2 n y Incomplete
NI160
21/06/2014 21/06/2014 OP2 y n Incomplete
NI161
30/06/2014 30/06/2014 OP2 n y Incomplete
NI162
30/06/2014 30/06/2014 OP2 n y Incomplete
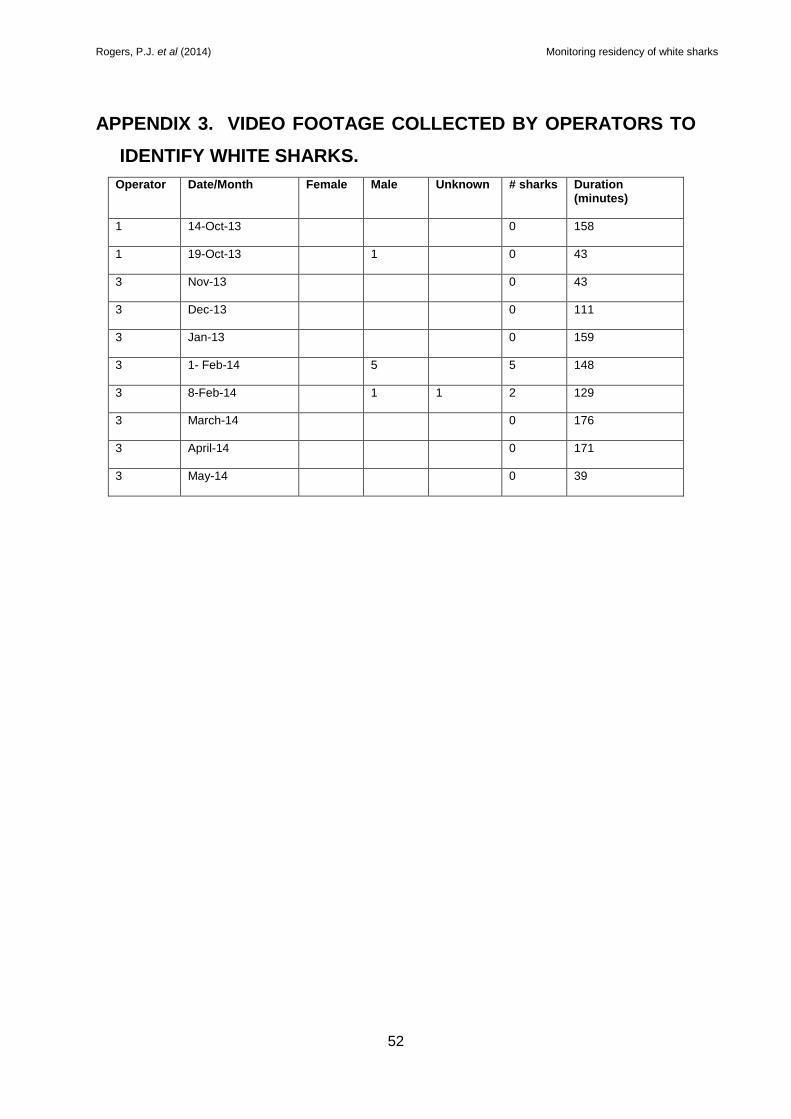
Rogers, P.J. et al (2014) Monitoring residency of white sharks
52
APPENDIX 3. VIDEO FOOTAGE COLLECTED BY OPERATORS TO
IDENTIFY WHITE SHARKS.
Operator Date/Month Female Male Unknown # sharks Duration (minutes)
1 14-Oct-13 0 158
1 19-Oct-13 1 0 43
3 Nov-13 0 43
3 Dec-13 0 111
3 Jan-13 0 159
3 1- Feb-14 5 5 148
3 8-Feb-14 1 1 2 129
3 March-14 0 176
3 April-14 0 171
3 May-14 0 39
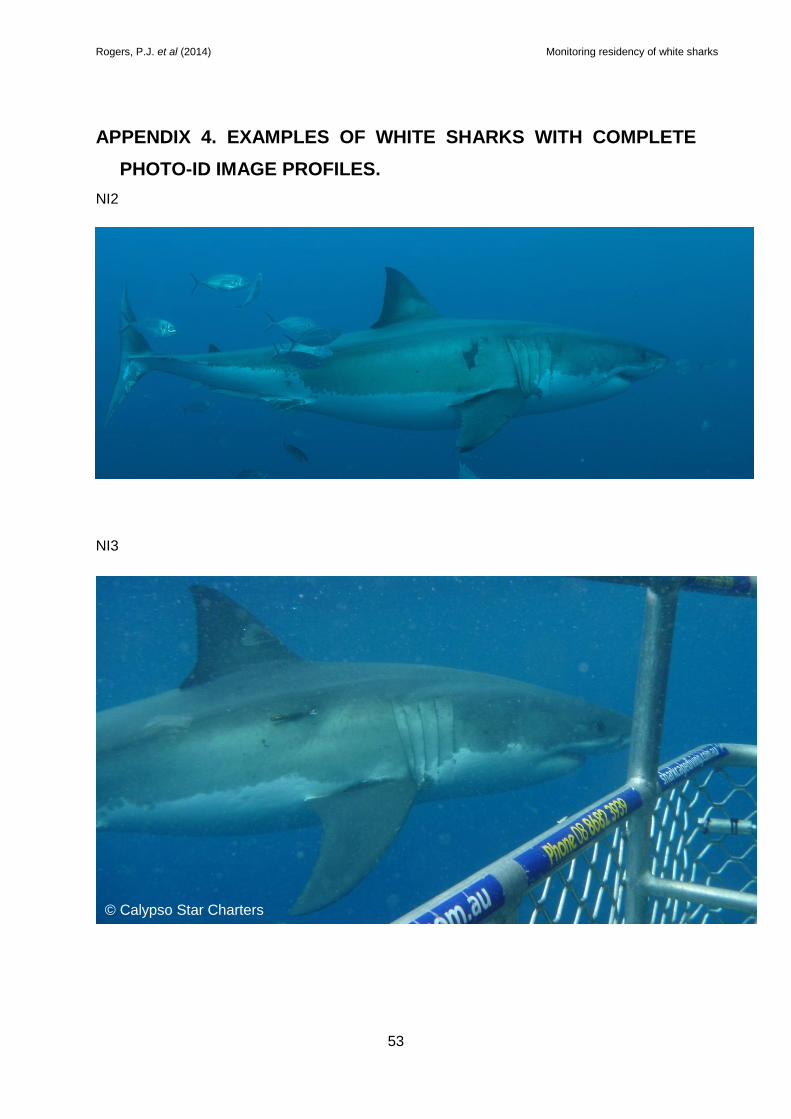
Rogers, P.J. et al (2014) Monitoring residency of white sharks
53
APPENDIX 4. EXAMPLES OF WHITE SHARKS WITH COMPLETE
PHOTO-ID IMAGE PROFILES.
NI2
NI3
© Rodney Fox Shark Expeditions
© Calypso Star Charters
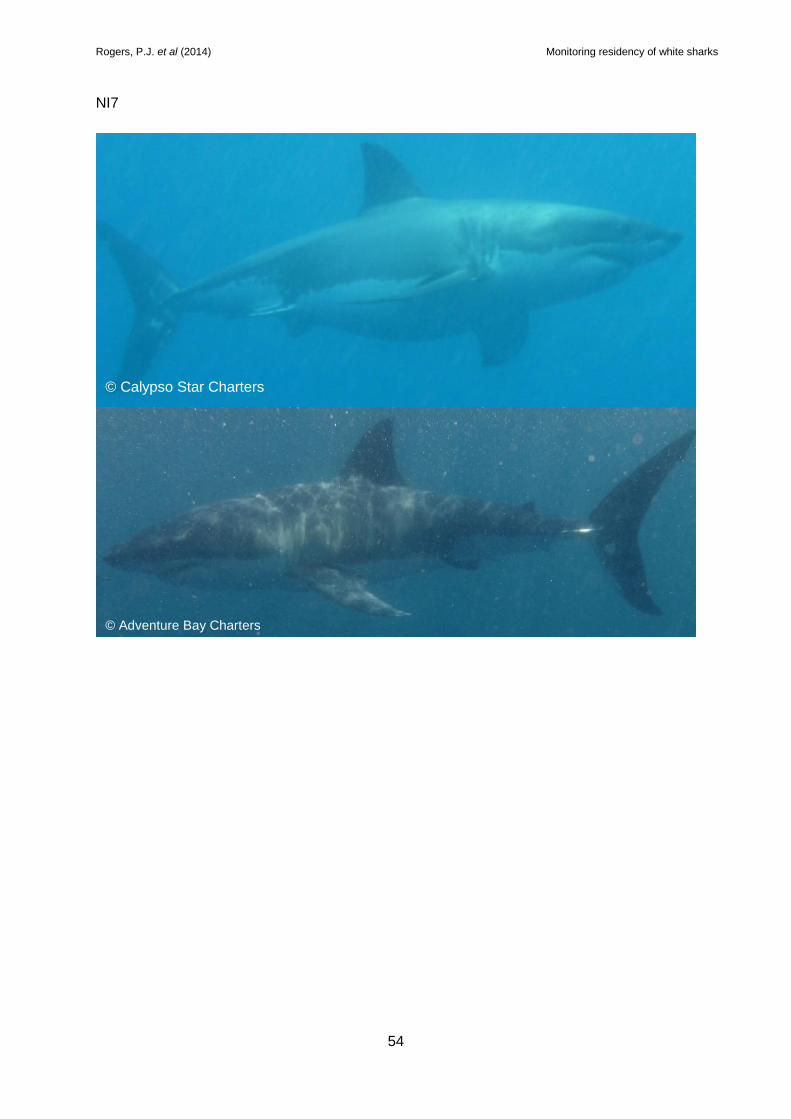
Rogers, P.J. et al (2014) Monitoring residency of white sharks
54
NI7
© Calypso Star Charters
© Adventure Bay Charters
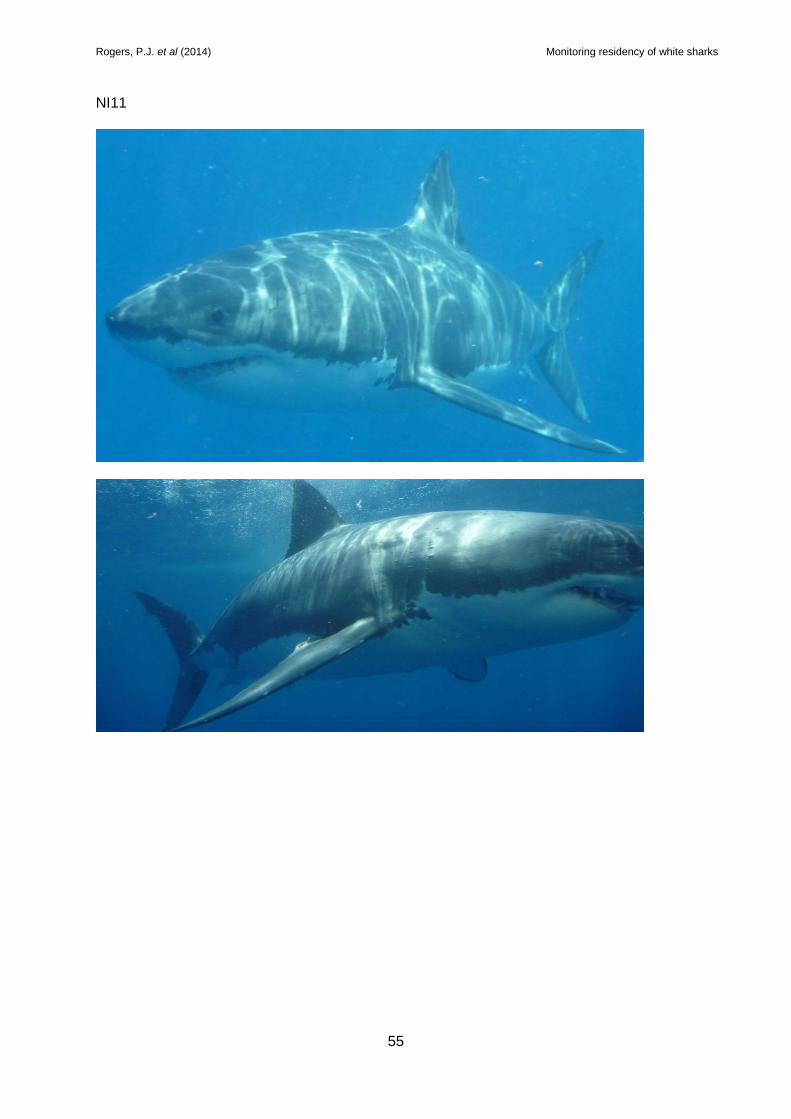
Rogers, P.J. et al (2014) Monitoring residency of white sharks
55
NI11
© Calypso Star Charters
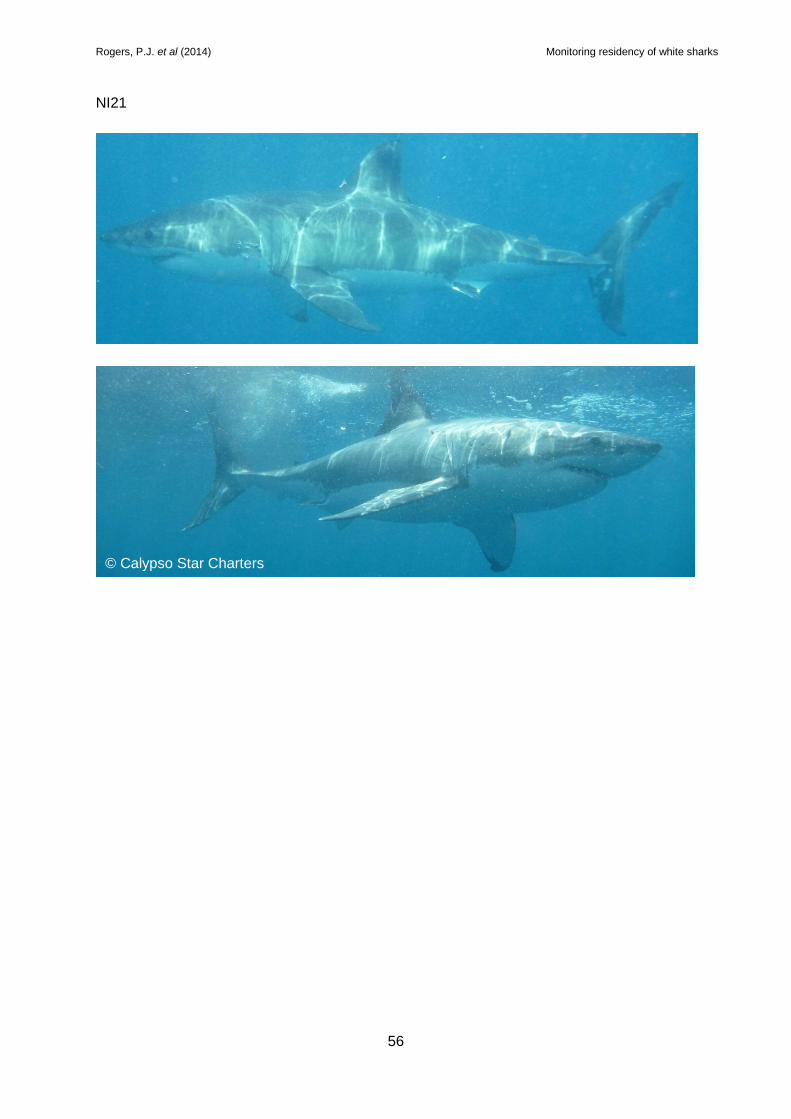
Rogers, P.J. et al (2014) Monitoring residency of white sharks
56
NI21
© Calypso Star Charters
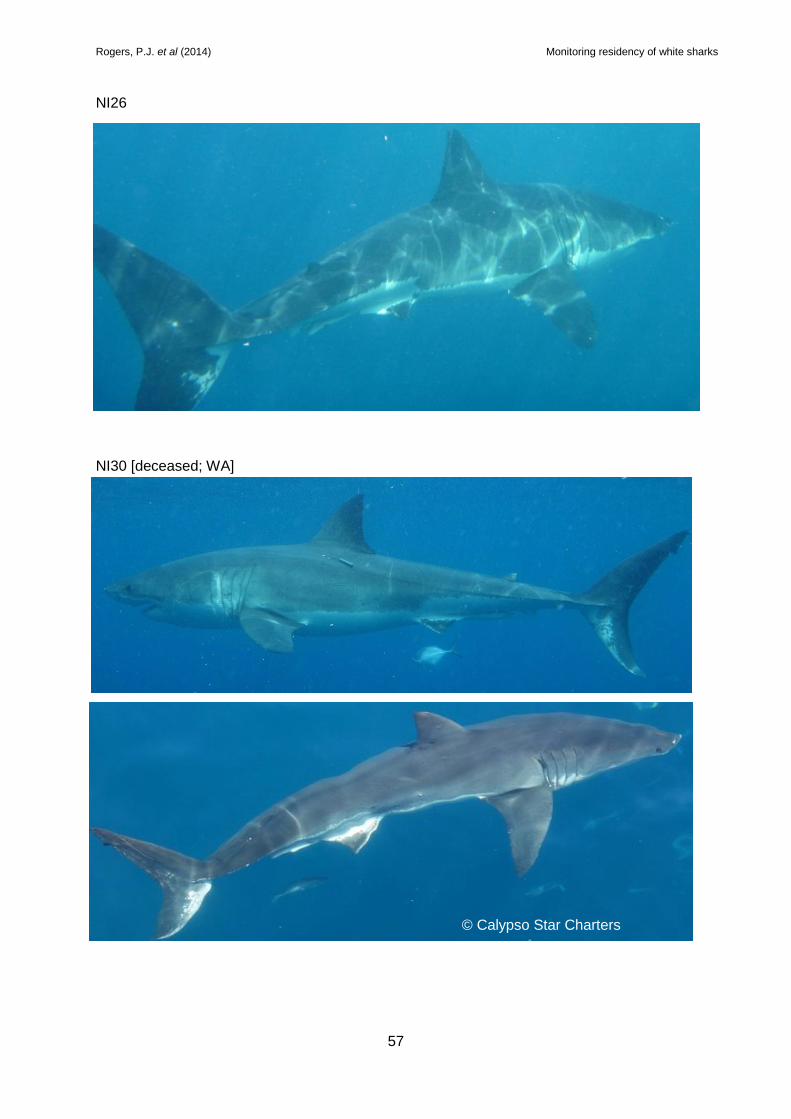
Rogers, P.J. et al (2014) Monitoring residency of white sharks
57
NI26
NI30 [deceased; WA]
© Calypso Star Charters
© Calypso Star Charters
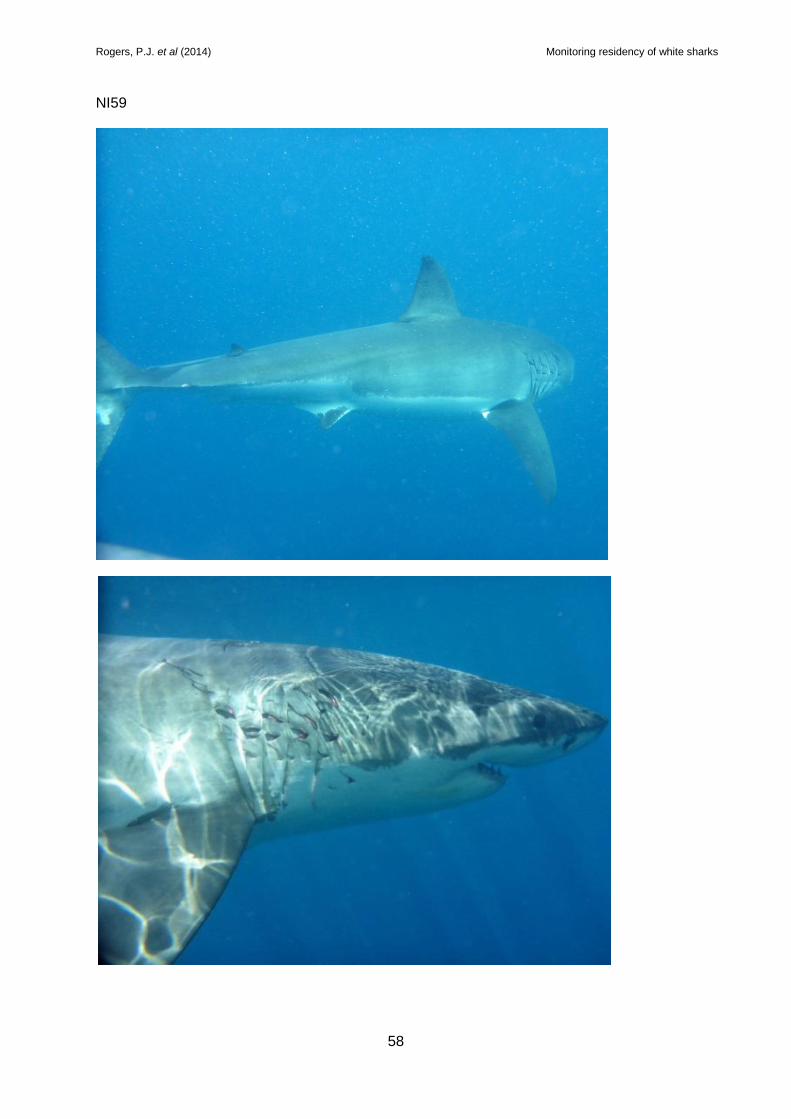
Rogers, P.J. et al (2014) Monitoring residency of white sharks
58
NI59
© Calypso Star Charters
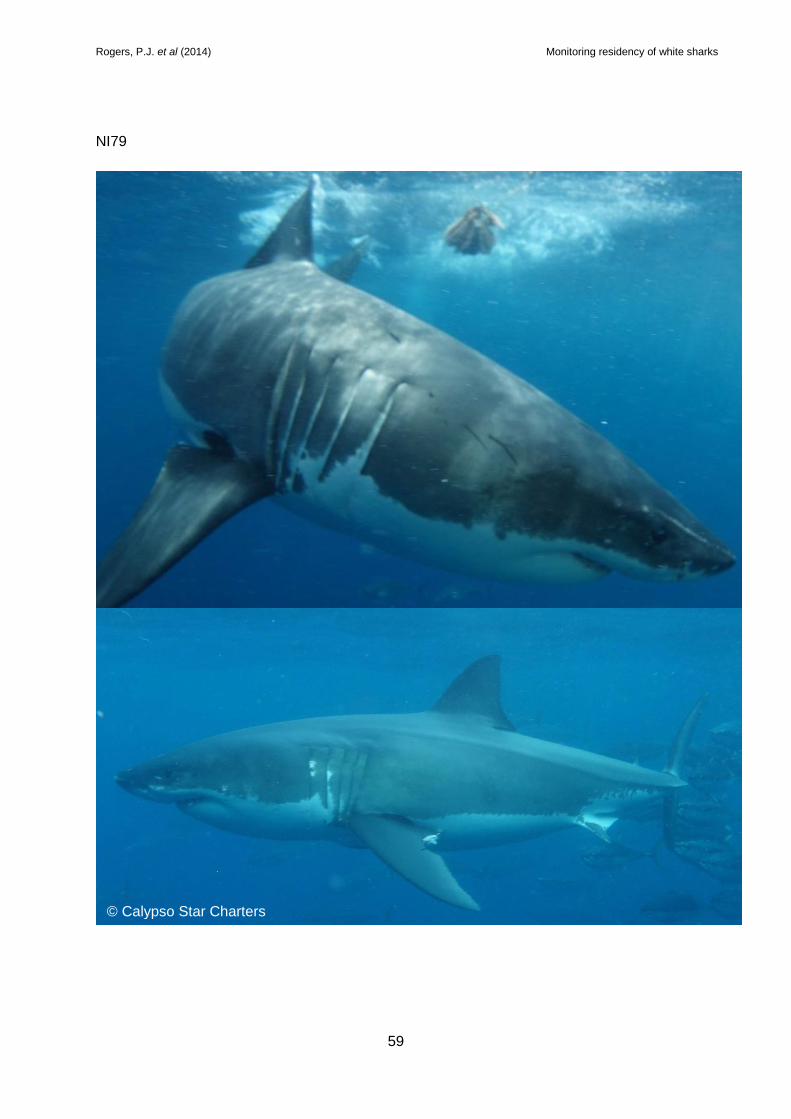
Rogers, P.J. et al (2014) Monitoring residency of white sharks
59
NI79
© Calypso Star Charters
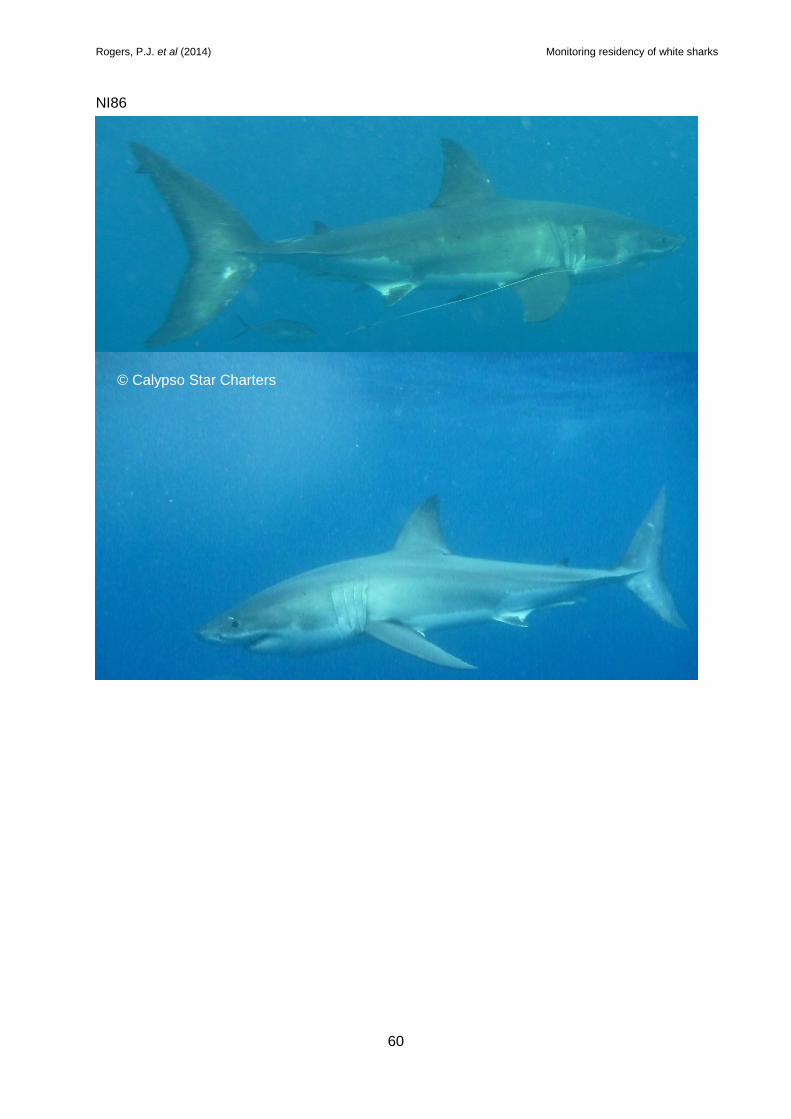
Rogers, P.J. et al (2014) Monitoring residency of white sharks
60
NI86
© Calypso Star Charters
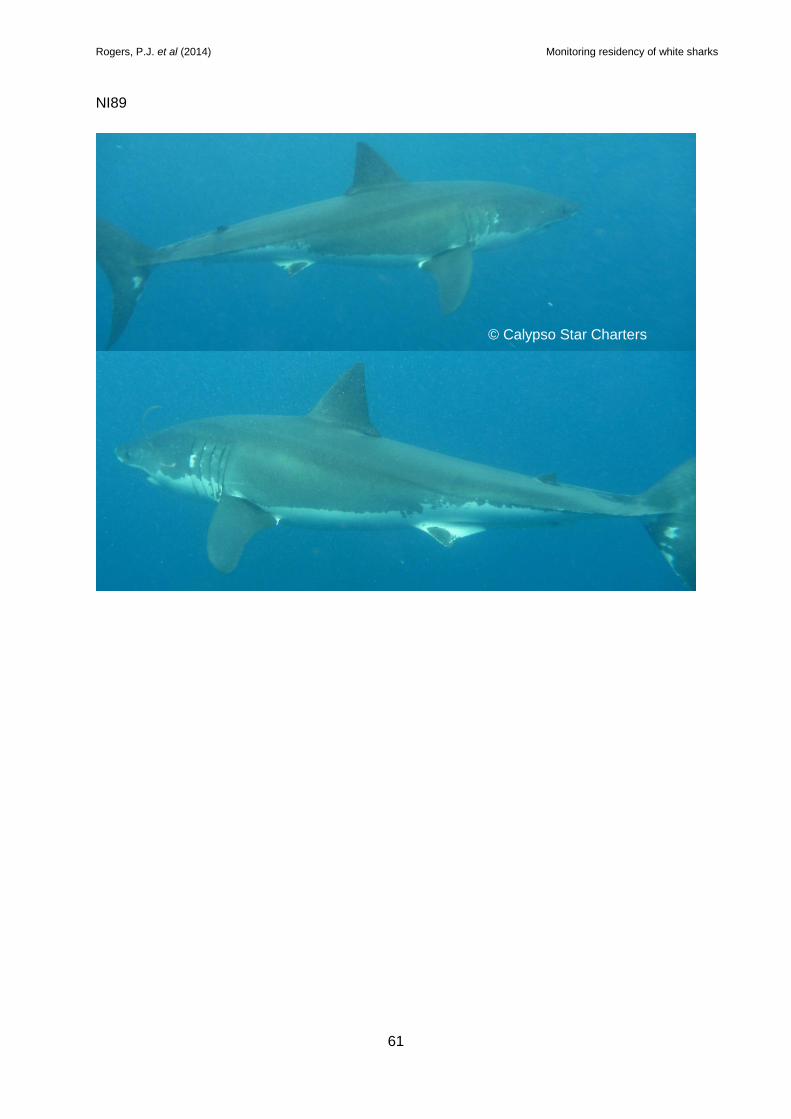
Rogers, P.J. et al (2014) Monitoring residency of white sharks
61
NI89
© Calypso Star Charters
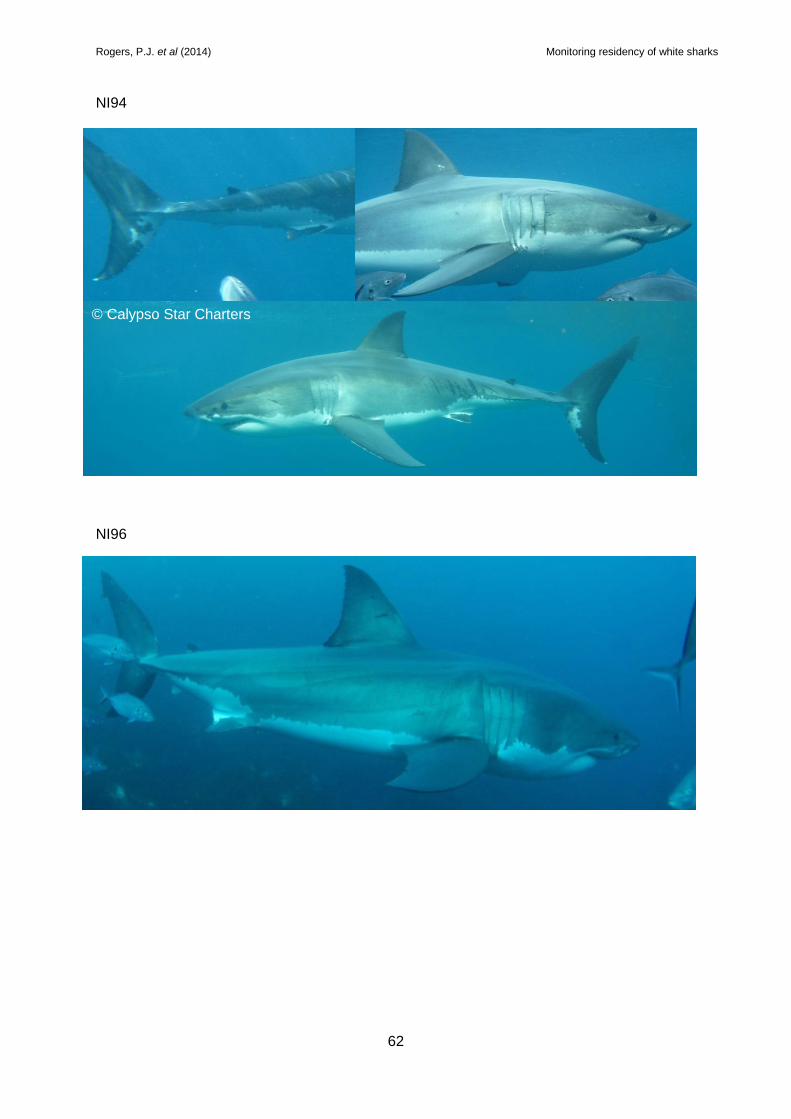
Rogers, P.J. et al (2014) Monitoring residency of white sharks
62
NI94
NI96
© Calypso Star Charters
© Rodney Fox Shark Expeditions
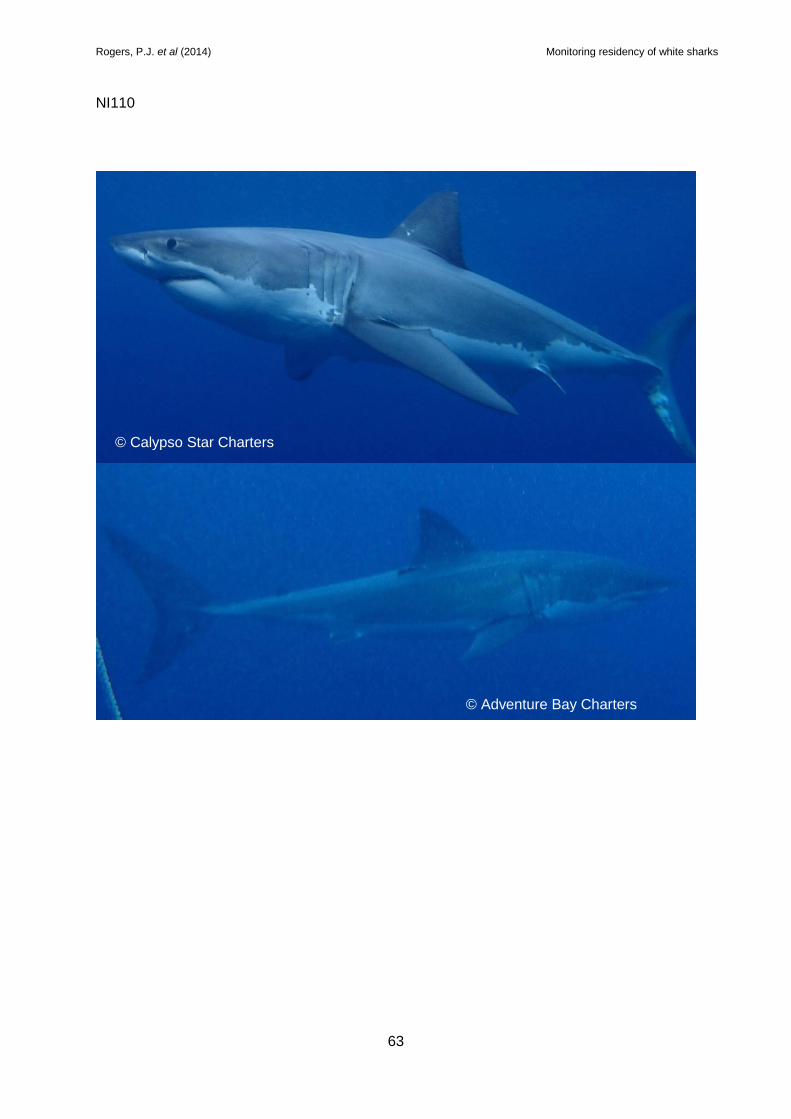
Rogers, P.J. et al (2014) Monitoring residency of white sharks
63
NI110
© Calypso Star Charters
© Adventure Bay Charters
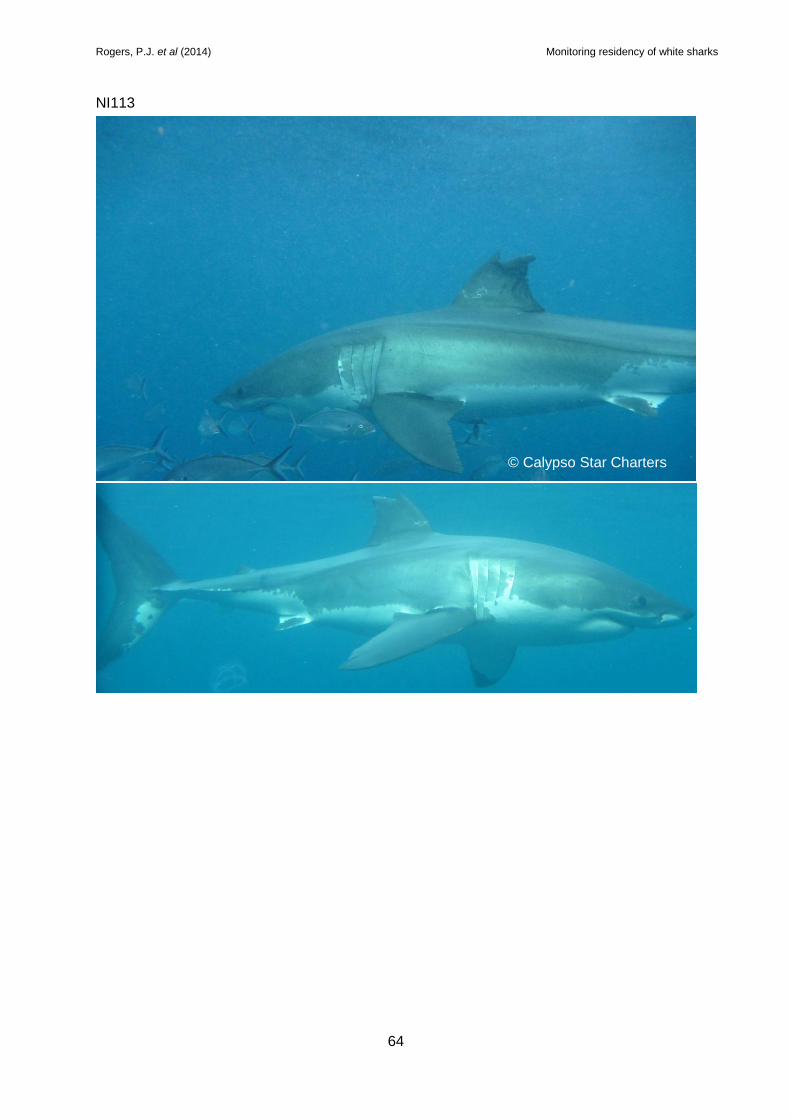
Rogers, P.J. et al (2014) Monitoring residency of white sharks
64
NI113
© Calypso Star Charters
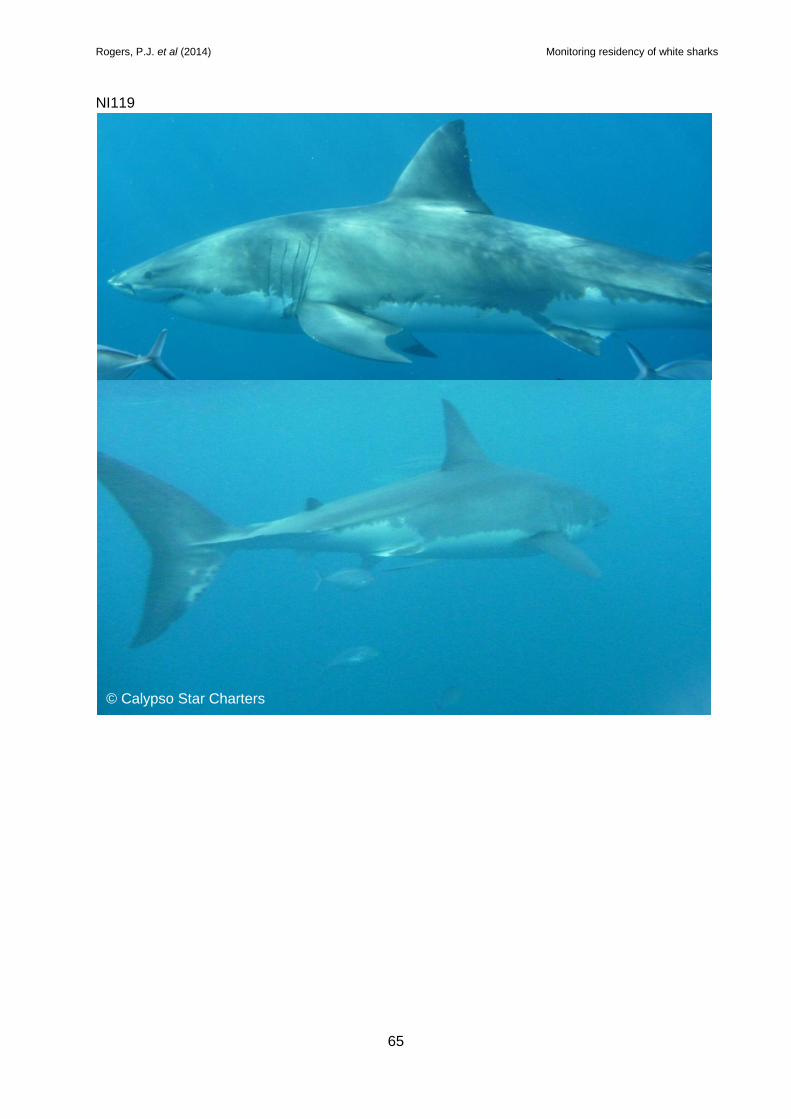
Rogers, P.J. et al (2014) Monitoring residency of white sharks
65
NI119
© Calypso Star Charters
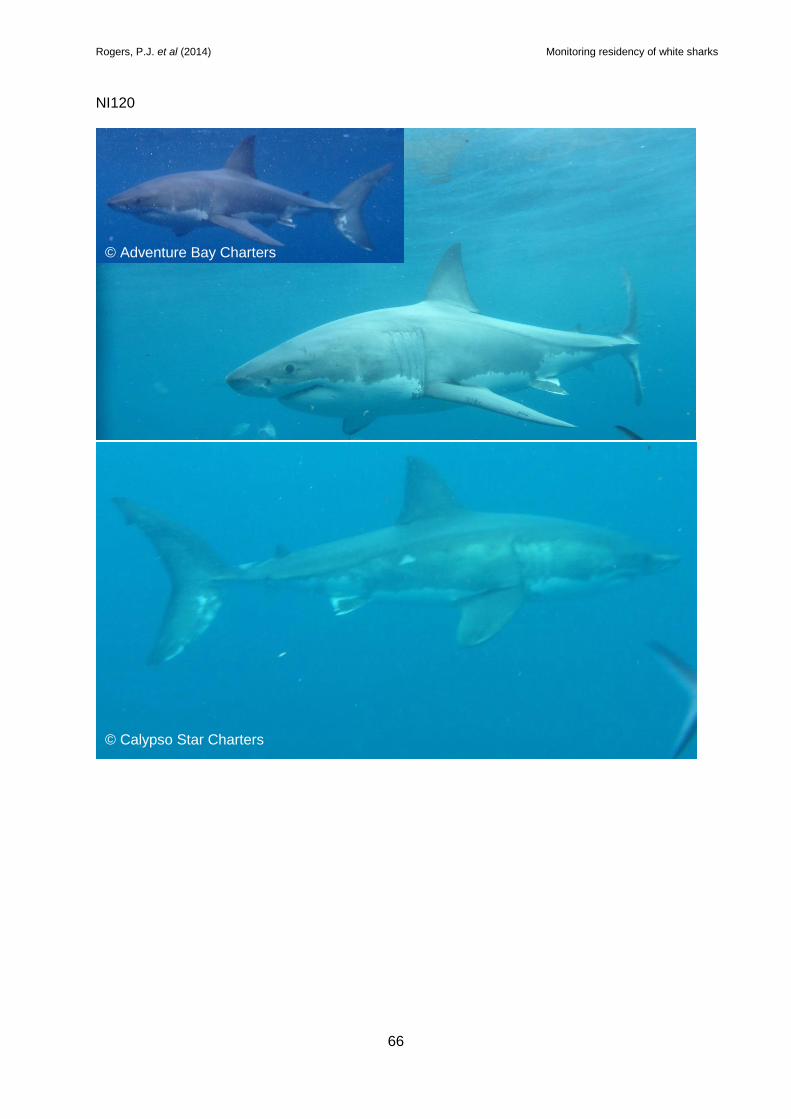
Rogers, P.J. et al (2014) Monitoring residency of white sharks
66
NI120
© Calypso Star Charters
© Adventure Bay Charters
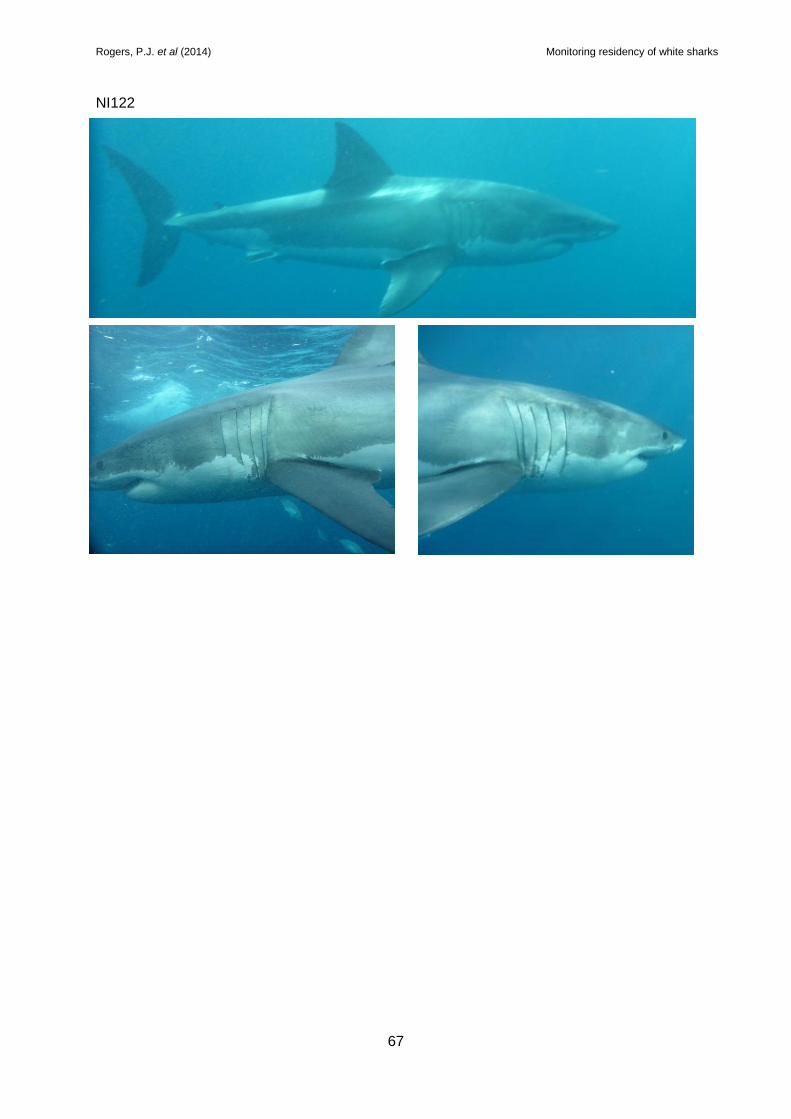
Rogers, P.J. et al (2014) Monitoring residency of white sharks
67
NI122
© Calypso Star Charters
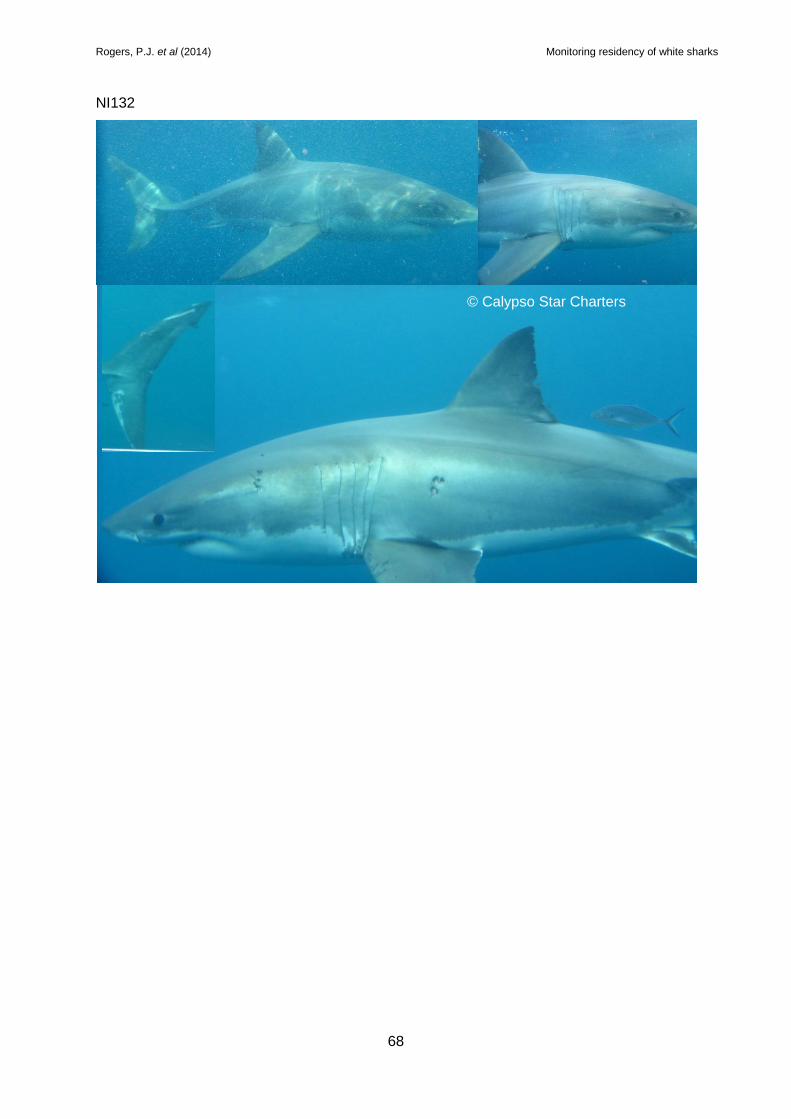
Rogers, P.J. et al (2014) Monitoring residency of white sharks
68
NI132
© Calypso Star Charters
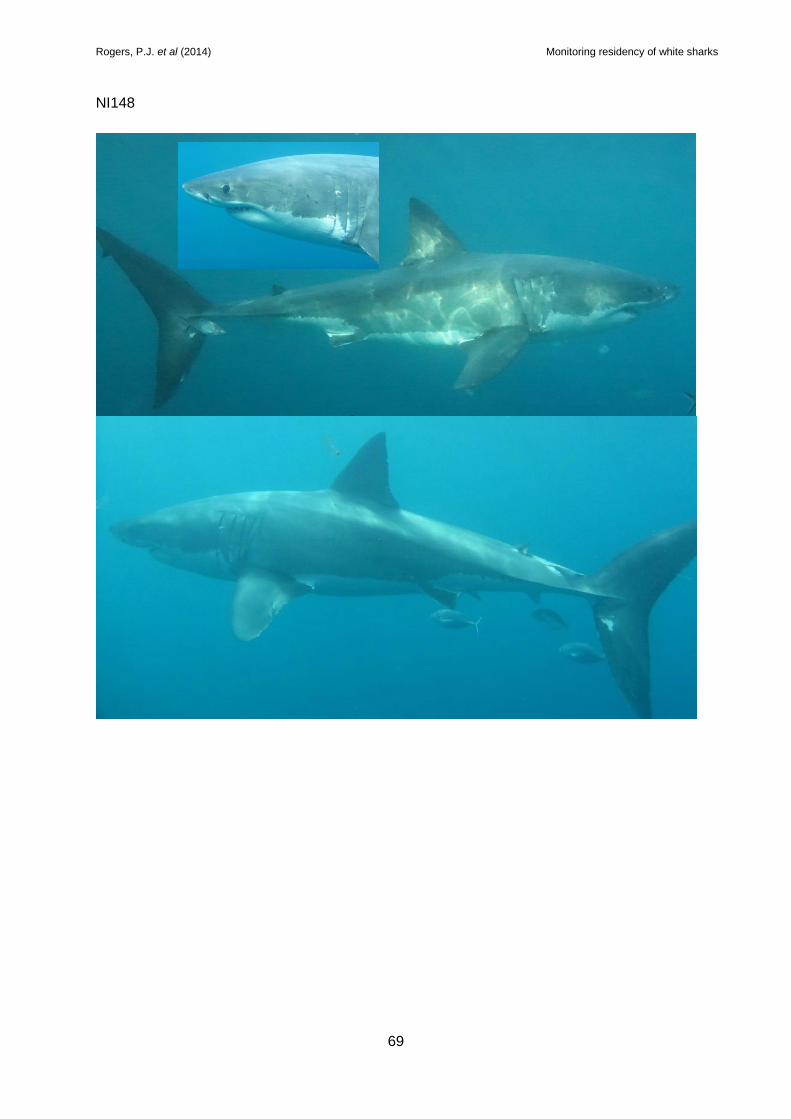
Rogers, P.J. et al (2014) Monitoring residency of white sharks
69
NI148