Embed Size (px)
Citation preview

No 03/1203 Edition: AIRAC 1203
Monitoring Report: AIRAC 1313 12 December 2013 - 08 January 2014

EUROPEAN ORGANISATION FOR SAFETY OF AIR NAVIGATION
European Route Network Improvement Plan
(ERNIP) Implementation Monitoring
Monitoring Report: AIRAC 1313
12 December 2013 – 08 January 2014
NETWORK MANAGER DIRECTORATE
E U R O C O N T R O L

Left blank intentionally
European Route Network Improvement Plan (ERNIP) – Implementation Monitoring Monitoring Report AIRAC 1313 (12 December 2013 - 08 January 2014)
TABLE OF CONTENT TABLE OF CONTENT .................................................................................................................... 1 1. INTRODUCTION ............................................................................................................... 3
1.1 SUMMARY ........................................................................................................................ 3 1.2 EVOLUTIONS TOWARDS THE ACHIEVEMENT OF THE EUROPEAN TARGET............ 3 1.3 AIRSPACE DESIGN DEVELOPMENT AND IMPLEMENTATION MONITORING ............. 4 1.4 EXTERNAL DOCUMENT RELEASE................................................................................. 4
2. LIST OF PROPOSALS IMPLEMENTED AIRAC 1313 (12 DECEMBER 2013) ................ 5 2.1 SUMMARY OF MAJOR PROJECTS IMPLEMENTED ON 12 DECEMBER 2013 ............. 5
3. EVOLUTION OF PERFORMANCE INDICATORS ............................................................ 6 3.1 AIRSPACE DESIGN INDICATOR EVOLUTION ................................................................ 6 3.2 FLIGHT PLANNING INDICATOR EVOLUTION ................................................................ 6 3.3 ROUTE AVAILABILITY INDICATOR EVOLUTION............................................................ 6 3.4 FLIGHT EFFICIENCY EVOLUTION PER AIRAC CYCLE ................................................. 7
3.4.1 EVOLUTION OF RTE-DES AND RTE-FPL INDICATORS ........................................... 8 3.4.2 BENEFITS AND ASSESSMENT OF RTE-DES AND RTE-FPL EVOLUTIONS ........... 8 3.4.3 BENEFITS AND ASSESSMENT OF RTE-RAD EVOLUTIONS ................................... 9
3.5 AIRSPACE CHANGES EVOLUTION .............................................................................. 11 3.6 FREE ROUTE AIRSPACE EVOLUTION ......................................................................... 11 3.7 ASM PERFORMANCE ASSESSMENT FOR 2013 ......................................................... 12
3.7.1 CDR OVERVIEW....................................................................................................... 12 3.7.2 FUA PERFORMANCE INDICATORS (RoCA, RAI, RAU) .......................................... 13
3.8 TRAFFIC EVOLUTION ................................................................................................... 16 3.8.1 CDR UTILISATION .................................................................................................... 17
4. NETWORK MANAGER CONTRIBUTION TO FLIGHT EFFICIENCY IMPROVEMENTS 19 4.1 FLIGHT EFFICIENCY EVOLUTION ASSESSMENT ....................................................... 19 4.2 INCREASED CDR AVAILABILITY AND UTILISATION ASSESSMENT .......................... 20 4.3 TOTAL BENEFITS FOR FLIGHT EFFICIENCY IMPROVEMENTS ................................. 20
ANNEX A: DETAILED LIST OF PROJECTS IMPLEMENTED 14 NOVEMBER 2013 .................. 23 ANNEX B: ACRONYMS AND TERMINOLOGY ........................................................................... 31
- 1 -

European Route Network Improvement Plan (ERNIP) – Implementation Monitoring Monitoring Report AIRAC 1313 (12 December 2013 - 08 January 2014)
Left blank intentionally
- 2 -
European Route Network Improvement Plan (ERNIP) – Implementation Monitoring Monitoring Report AIRAC 1313 (12 December 2013 - 08 January 2014)
1. INTRODUCTION
1.1 SUMMARY This Report updates on the evolution of the environment indicators1 listed in the Network Manager Performance Plan and informs on the progress achieved to further improve airspace design and utilisation flight efficiency based on the improvement proposals implemented during the relevant AIRAC cycle.
This edition focuses on AIRAC 1313 (12 DECEMBER 2013). The methodology used for assessing flight efficiency is included in WP9 of RNDSG/64. This document can be consulted on: https://extranet.eurocontrol.int/ftp/?t=4df773eea3ffaea31e3d1768150125b3
1.2 EVOLUTIONS TOWARDS THE ACHIEVEMENT OF THE EUROPEAN TARGET
The Performance Scheme for air navigation services and network functions includes an environment/ flight efficiency Key Performance area: Average horizontal en-route flight efficiency:
• the average horizontal en-route flight efficiency indicator is the difference between the length of the “en-route” part of the trajectory and the optimum trajectory which, in average, is the great circle.
• “en-route” is defined as the distance flown outside a circle of 40 NM around the airport. • the flights considered for the purpose of this indicator are:
o all commercial IFR flights within European airspace; o where a flight departs or arrives outside the European airspace, only that part inside the
European airspace is considered; o circular flights and flights with a great circle distance shorter than 80NM between
terminal areas are excluded. Environment target 2012 - 2014: For the performance reference period starting on 1st January 2012 and ending on 31st December 2014, the European Union-wide and EUROCONTROL performance target will be as follows: Reduction of 0,75 percentage points of the average horizontal en-route flight efficiency indicator in 2014 as compared to the situation in 2009. Objectives:
• Develop and support the deployment of 500 airspace changes in 2012 – 2014. • Support the implementation of Free Route Airspace in 25 ACCs by 2014. • Increase annually the number of CDRs by 5% (FUA). • Increase annually the CDR1/2 availability and usage by an average of 5% (FUA). • Reduce the route unavailability (in time and quantity) by 10% in 2013 and 2014 (FUA). • Reduction of vertical flight inefficiency by 5% in 2014.
Note: The FUA indicators (bullet 3-5) are reported quarterly. Flight efficiency (bullet 6) is reported only twice per yea.
1 FPL: Flight Plan data provided by NM systems; SAAM analysis performed by NM. DES/RAD: Traffic demand provided by NM systems; airspace environment data, profile calculations and SAAM analysis provided by NM.
- 3 -
European Route Network Improvement Plan (ERNIP) – Implementation Monitoring Monitoring Report AIRAC 1313 (12 December 2013 - 08 January 2014)
1.3 AIRSPACE DESIGN DEVELOPMENT AND IMPLEMENTATION MONITORING The Network Manager coordinates the following activities to achieve the required improvement in flight efficiency: Enhancing European en-route airspace design through annual improvements of European ATS
route network, high priority being given to: • Implementation of a coherent package of annual improvements and shorter routes; • Improving efficiency for the most penalised city pairs; • Implementation of additional Conditional Routes for main traffic flows; • Supporting initial implementation of free route airspace.
Improving airspace utilisation and route network availability through: • Actively supporting and involving aircraft operators and the computer flight plan service
providers in flight plan quality improvements; • Gradually applying route availability restrictions only where and when required; • Improving the use and availability of civil/military airspace structures.
Efficient Terminal Manoeuvring Area (TMA) design and utilisation through: • Implementing advanced navigation capabilities; • Implementing Continuous Descent Operations (CDO), improved arrival/departure routes,
optimised departure profiles, etc. Improving awareness of performance.
1.4 EXTERNAL DOCUMENT RELEASE The latest AIRAC report is available on the EUROCONTROL Airspace design website under the sub section ERNIP, ERNIP Implementation Monitoring: http://www.eurocontrol.int/articles/airspace-design as well as on the EUROCONTROL Network Operations Monitoring and Reporting website under European Route Network Improvement Plan - Monitoring Report: http://www.eurocontrol.int/articles/network-operations-monitoring-and-reporting The full list of monitoring reports is available on the EUROCONTROL Media & Info Centre website: http://www.eurocontrol.int/publications?title=&field_term_publication_type_tid=205&year[value][yea
r]=
A copy of the AIRAC Report of the European Route Network Improvement Plan is also available via the restricted EUROCONTROL OneSky Online websites for access by other interested members of the RNDSG, ASMSG and NETOPS (see ref sub-sections under main section "LIBRARY"): https://ost.eurocontrol.int/sites/NETOPS/SitePages/Home.aspx https://ost.eurocontrol.int/sites/RNDSG/SitePages/Home.aspx https://ost.eurocontrol.int/sites/ASM-SG/SitePages/Home.aspx
- 4 -
European Route Network Improvement Plan (ERNIP) – Implementation Monitoring Monitoring Report AIRAC 1313 (12 December 2013 - 08 January 2014)
2. LIST OF PROPOSALS IMPLEMENTED AIRAC 1313 (12 DECEMBER 2013)
2.1 SUMMARY OF MAJOR PROJECTS IMPLEMENTED ON 12 DECEMBER 2013 During the AIRAC cycle 22 (twenty-three) airspace improvement packages co-ordinated at network level have been implemented. Beside of several ATS route network improvements the list below provides an overview of the major improvement measures implemented on 12 December 2013:
France: - Paris Point Merge TP for Paris TMA arrivals from the north-west. - Free Route Airspace France/ FRAF, Step 1c (40 Night DCTs within Brest Acc,
Bordeaux ACC, Aix ACC and Reims ACC.
Germany: - Continuous Decent Operation/ CDO inbound Nuernberg airport. - Munich ACC sector re-organisation (INSEL II project, including new sectors STA,
ZUG and FUE from GND to FL315).
Germany / Maastricht UAC: - Free Route Airspace Maastricht and Karlsruhe/ FRAMaK (further expansion and
harmonisation through additional cross border DCTs).
Greece: - Several Night ATS Routes.
Italy:
- Free Route Airspace Italy/ FAIR-IT, Phase 1 (Night Free Route + new DCTs plus extension of availability to Weekend H24 within Milano, Roma and Brindisi UIR).
Maastricht UAC:
- Dynamic sector configuration within Maastricht UAC Hanover Sector Group.
Portugal: - Lisbon ACC west sector re-organisation.
Turkey:
- Adaptation of RAD restrictions LT2017, LT2070 and LT2056
A detailed list of all improvement measures implemented on 12 December 2013 is attached in Annex A. The list is an extract of the European Route Network Improvement Plan database accessible via: https://extranet.eurocontrol.int/http://prisme-web.hq.corp.eurocontrol.int/ernip_database/Index.action A description of the airspace changes and improvements together with an orientation map due for implementation on the relevant AIRAC cycle is provided in the RNDSG Airspace Improvements Synopsis (RAIS).
- 5 -
European Route Network Improvement Plan (ERNIP) – Implementation Monitoring Monitoring Report AIRAC 1313 (12 December 2013 - 08 January 2014)
3. EVOLUTION OF PERFORMANCE INDICATORS
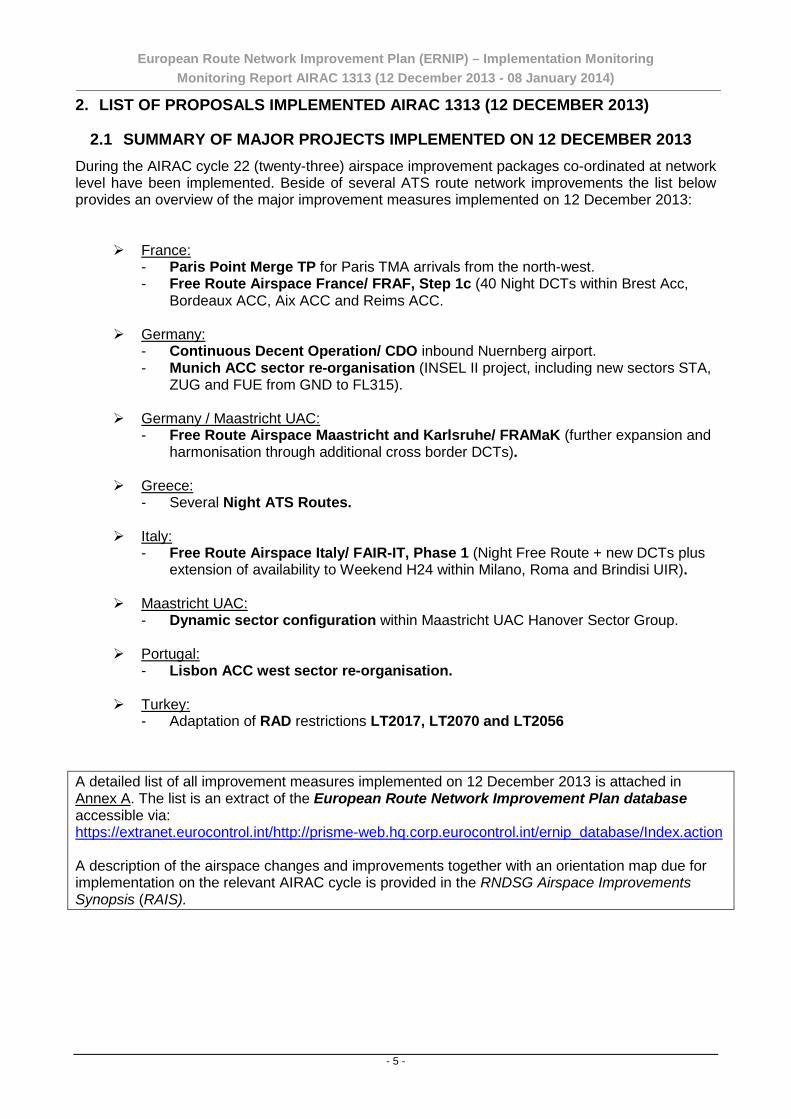
3.1 AIRSPACE DESIGN INDICATOR EVOLUTION The graph below shows the yearly evolution of the airspace design flight efficiency (RTE-DES2) over the period 2007 - 2013 and the evolution until 08 January 2014.
RTE-DES
3,53%3,54%3,45%3,22%3,04%2,96%2,80%2,64%
2%
3%
4%
5%
6%
2007 2008 2009 2010 2011 2012 2013 2014
Figure 1 : Airspace Design indicator evolution
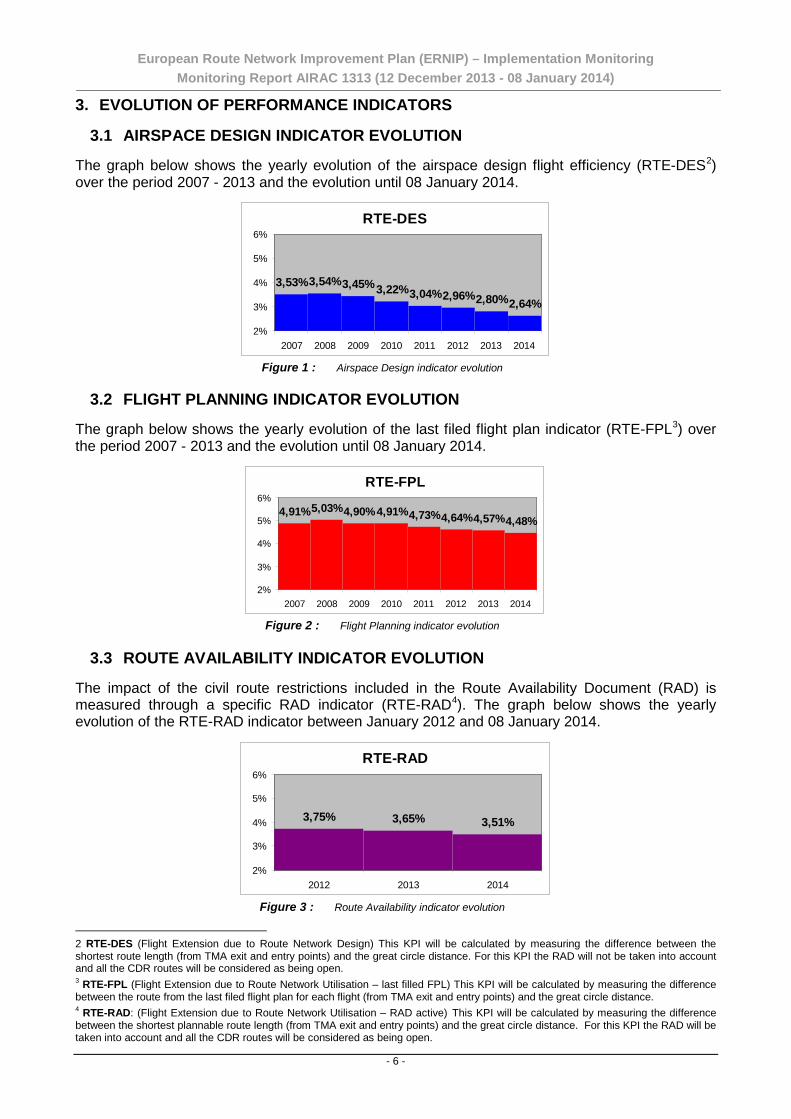
3.2 FLIGHT PLANNING INDICATOR EVOLUTION The graph below shows the yearly evolution of the last filed flight plan indicator (RTE-FPL3) over the period 2007 - 2013 and the evolution until 08 January 2014.
RTE-FPL
4,91%5,03%4,90%4,91%4,73%4,64%4,57%4,48%
2%
3%
4%
5%
6%
2007 2008 2009 2010 2011 2012 2013 2014
Figure 2 : Flight Planning indicator evolution
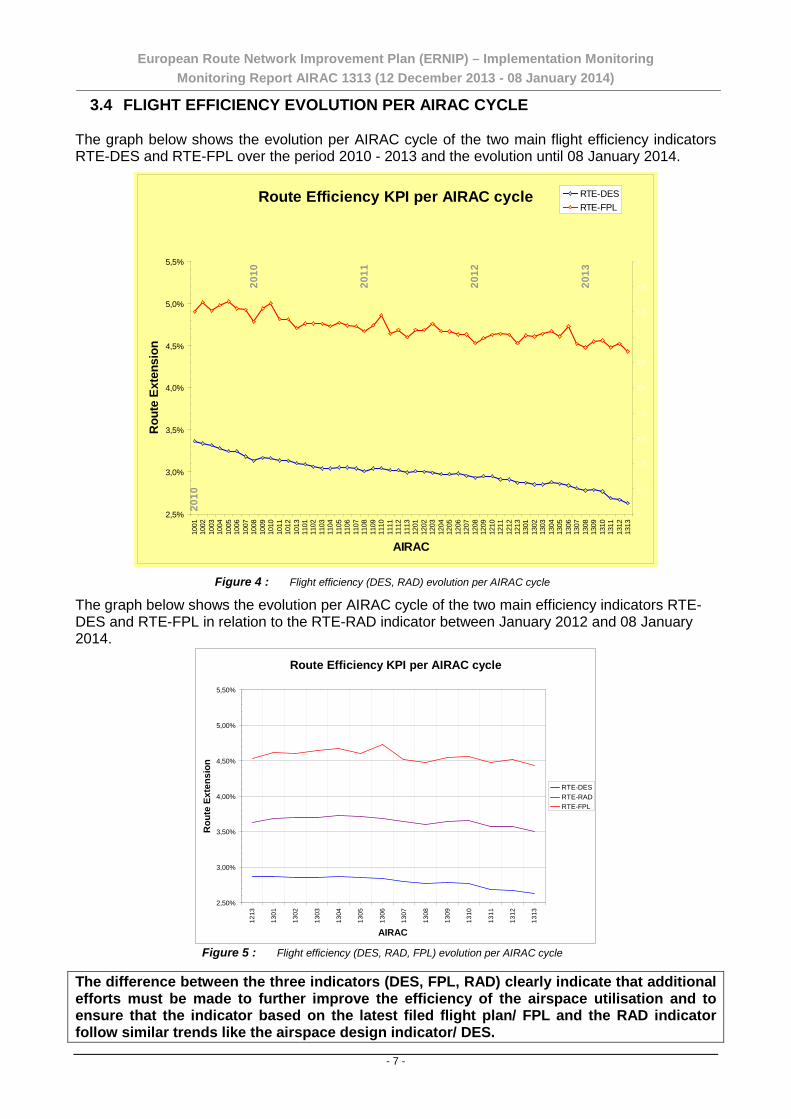
3.3 ROUTE AVAILABILITY INDICATOR EVOLUTION The impact of the civil route restrictions included in the Route Availability Document (RAD) is measured through a specific RAD indicator (RTE-RAD4). The graph below shows the yearly evolution of the RTE-RAD indicator between January 2012 and 08 January 2014.
RTE-RAD
3,75% 3,65% 3,51%
2%
3%
4%
5%
6%
2012 2013 2014
Figure 3 : Route Availability indicator evolution
2 RTE-DES (Flight Extension due to Route Network Design) This KPI will be calculated by measuring the difference between the shortest route length (from TMA exit and entry points) and the great circle distance. For this KPI the RAD will not be taken into account and all the CDR routes will be considered as being open. 3 RTE-FPL (Flight Extension due to Route Network Utilisation – last filled FPL) This KPI will be calculated by measuring the difference between the route from the last filed flight plan for each flight (from TMA exit and entry points) and the great circle distance. 4 RTE-RAD: (Flight Extension due to Route Network Utilisation – RAD active) This KPI will be calculated by measuring the difference between the shortest plannable route length (from TMA exit and entry points) and the great circle distance. For this KPI the RAD will be taken into account and all the CDR routes will be considered as being open.
- 6 -
European Route Network Improvement Plan (ERNIP) – Implementation Monitoring Monitoring Report AIRAC 1313 (12 December 2013 - 08 January 2014)
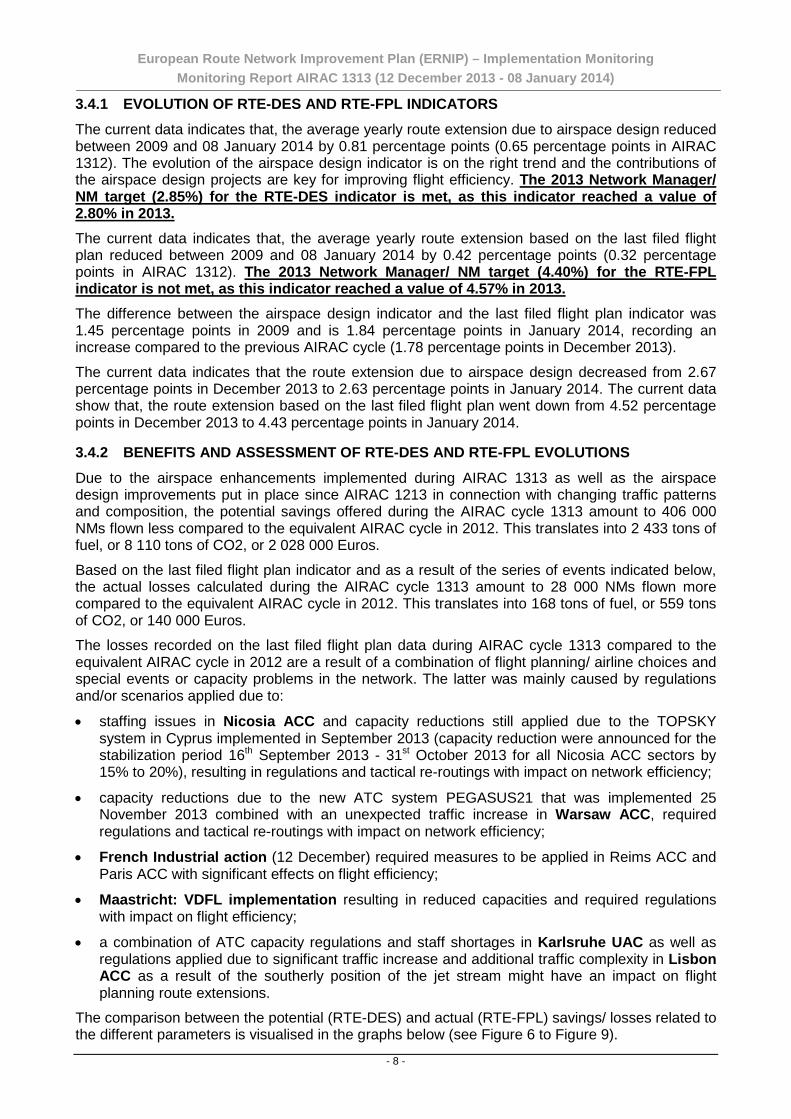
3.4 FLIGHT EFFICIENCY EVOLUTION PER AIRAC CYCLE The graph below shows the evolution per AIRAC cycle of the two main flight efficiency indicators RTE-DES and RTE-FPL over the period 2010 - 2013 and the evolution until 08 January 2014.
Route Efficiency KPI per AIRAC cycle
2012
2010
2010
2011
2013
2,5%
3,0%
3,5%
4,0%
4,5%
5,0%
5,5%
1001
1002
1003
1004
1005
1006
1007
1008
1009
1010
1011
1012
1013
1101
1102
1103
1104
1105
1106
1107
1108
1109
1110
1111
1112
1113
1201
1202
1203
1204
1205
1206
1207
1208
1209
1210
1211
1212
1213
1301
1302
1303
1304
1305
1306
1307
1308
1309
1310
1311
1312
1313
AIRAC
Rou
te E
xten
sion
0
0,1
0,2
0,3
0,4
0,5
0,6
0,7
0,8
0,9
1
RTE-DESRTE-FPL
Figure 4 : Flight efficiency (DES, RAD) evolution per AIRAC cycle
The graph below shows the evolution per AIRAC cycle of the two main efficiency indicators RTE-DES and RTE-FPL in relation to the RTE-RAD indicator between January 2012 and 08 January 2014.
Route Efficiency KPI per AIRAC cycle
2,50%
3,00%
3,50%
4,00%
4,50%
5,00%
5,50%
1213
1301
1302
1303
1304
1305
1306
1307
1308
1309
1310
1311
1312
1313
AIRAC
Rou
te E
xten
sion
RTE-DESRTE-RADRTE-FPL
Figure 5 : Flight efficiency (DES, RAD, FPL) evolution per AIRAC cycle
The difference between the three indicators (DES, FPL, RAD) clearly indicate that additional efforts must be made to further improve the efficiency of the airspace utilisation and to ensure that the indicator based on the latest filed flight plan/ FPL and the RAD indicator follow similar trends like the airspace design indicator/ DES.
- 7 -
European Route Network Improvement Plan (ERNIP) – Implementation Monitoring Monitoring Report AIRAC 1313 (12 December 2013 - 08 January 2014)
3.4.1 EVOLUTION OF RTE-DES AND RTE-FPL INDICATORS The current data indicates that, the average yearly route extension due to airspace design reduced between 2009 and 08 January 2014 by 0.81 percentage points (0.65 percentage points in AIRAC 1312). The evolution of the airspace design indicator is on the right trend and the contributions of the airspace design projects are key for improving flight efficiency. The 2013 Network Manager/ NM target (2.85%) for the RTE-DES indicator is met, as this indicator reached a value of 2.80% in 2013. The current data indicates that, the average yearly route extension based on the last filed flight plan reduced between 2009 and 08 January 2014 by 0.42 percentage points (0.32 percentage points in AIRAC 1312). The 2013 Network Manager/ NM target (4.40%) for the RTE-FPL indicator is not met, as this indicator reached a value of 4.57% in 2013. The difference between the airspace design indicator and the last filed flight plan indicator was 1.45 percentage points in 2009 and is 1.84 percentage points in January 2014, recording an increase compared to the previous AIRAC cycle (1.78 percentage points in December 2013).
The current data indicates that the route extension due to airspace design decreased from 2.67 percentage points in December 2013 to 2.63 percentage points in January 2014. The current data show that, the route extension based on the last filed flight plan went down from 4.52 percentage points in December 2013 to 4.43 percentage points in January 2014.
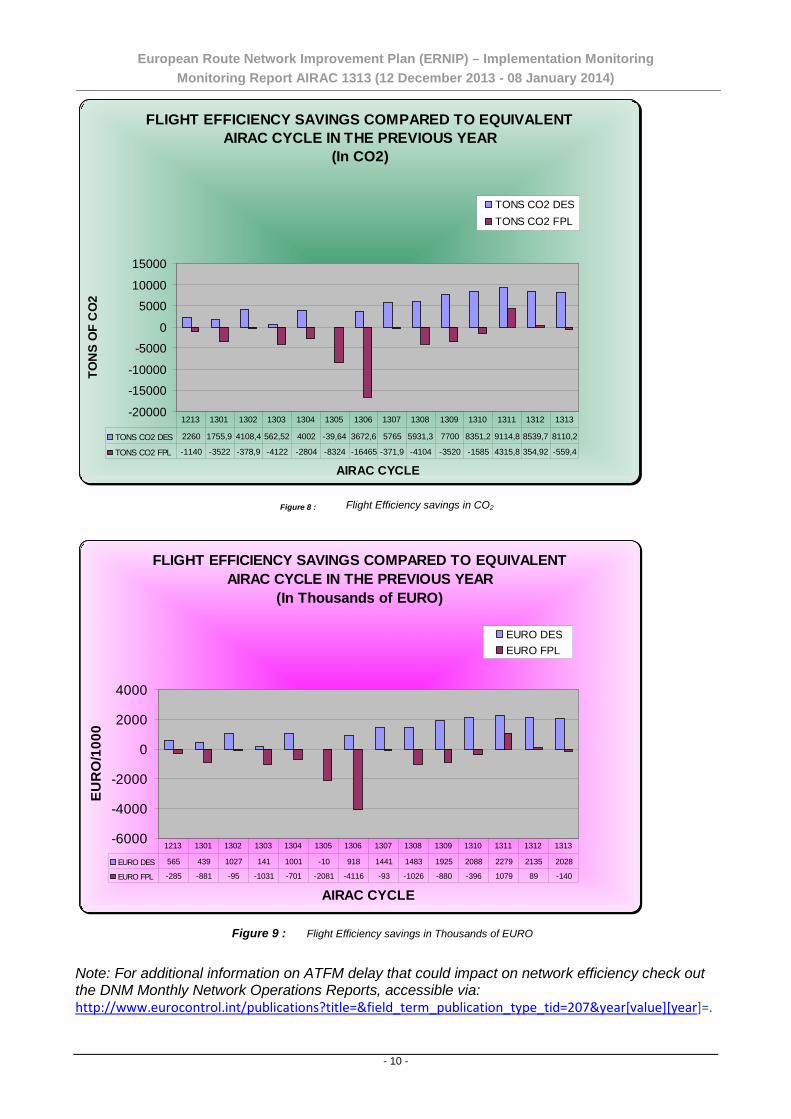
3.4.2 BENEFITS AND ASSESSMENT OF RTE-DES AND RTE-FPL EVOLUTIONS Due to the airspace enhancements implemented during AIRAC 1313 as well as the airspace design improvements put in place since AIRAC 1213 in connection with changing traffic patterns and composition, the potential savings offered during the AIRAC cycle 1313 amount to 406 000 NMs flown less compared to the equivalent AIRAC cycle in 2012. This translates into 2 433 tons of fuel, or 8 110 tons of CO2, or 2 028 000 Euros.
Based on the last filed flight plan indicator and as a result of the series of events indicated below, the actual losses calculated during the AIRAC cycle 1313 amount to 28 000 NMs flown more compared to the equivalent AIRAC cycle in 2012. This translates into 168 tons of fuel, or 559 tons of CO2, or 140 000 Euros.
The losses recorded on the last filed flight plan data during AIRAC cycle 1313 compared to the equivalent AIRAC cycle in 2012 are a result of a combination of flight planning/ airline choices and special events or capacity problems in the network. The latter was mainly caused by regulations and/or scenarios applied due to:
• staffing issues in Nicosia ACC and capacity reductions still applied due to the TOPSKY system in Cyprus implemented in September 2013 (capacity reduction were announced for the stabilization period 16th September 2013 - 31st October 2013 for all Nicosia ACC sectors by 15% to 20%), resulting in regulations and tactical re-routings with impact on network efficiency;
• capacity reductions due to the new ATC system PEGASUS21 that was implemented 25 November 2013 combined with an unexpected traffic increase in Warsaw ACC, required regulations and tactical re-routings with impact on network efficiency;
• French Industrial action (12 December) required measures to be applied in Reims ACC and Paris ACC with significant effects on flight efficiency;
• Maastricht: VDFL implementation resulting in reduced capacities and required regulations with impact on flight efficiency;
• a combination of ATC capacity regulations and staff shortages in Karlsruhe UAC as well as regulations applied due to significant traffic increase and additional traffic complexity in Lisbon ACC as a result of the southerly position of the jet stream might have an impact on flight planning route extensions.
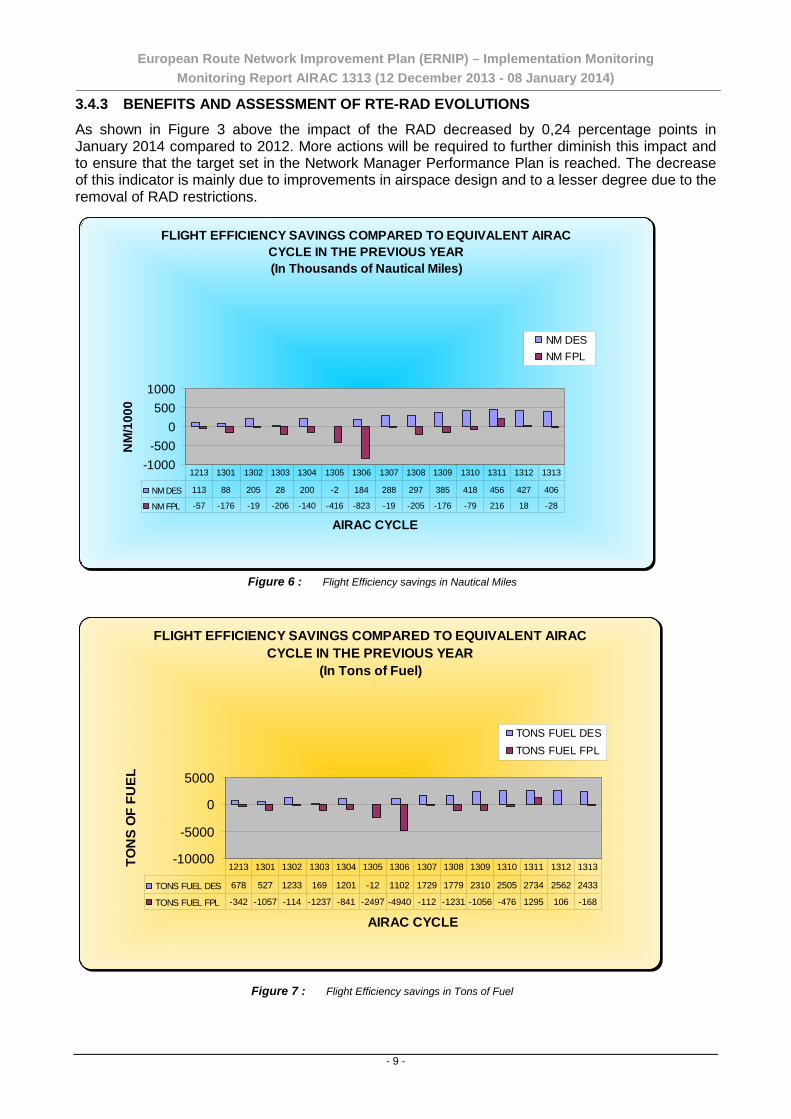
The comparison between the potential (RTE-DES) and actual (RTE-FPL) savings/ losses related to the different parameters is visualised in the graphs below (see Figure 6 to Figure 9).
- 8 -
European Route Network Improvement Plan (ERNIP) – Implementation Monitoring Monitoring Report AIRAC 1313 (12 December 2013 - 08 January 2014)
3.4.3 BENEFITS AND ASSESSMENT OF RTE-RAD EVOLUTIONS As shown in Figure 3 above the impact of the RAD decreased by 0,24 percentage points in January 2014 compared to 2012. More actions will be required to further diminish this impact and to ensure that the target set in the Network Manager Performance Plan is reached. The decrease of this indicator is mainly due to improvements in airspace design and to a lesser degree due to the removal of RAD restrictions.
FLIGHT EFFICIENCY SAVINGS COMPARED TO EQUIVALENT AIRAC CYCLE IN THE PREVIOUS YEAR(In Thousands of Nautical Miles)
-1000-500
0500
1000
AIRAC CYCLE
NM
/100
0
NM DESNM FPL
NM DES 113 88 205 28 200 -2 184 288 297 385 418 456 427 406
NM FPL -57 -176 -19 -206 -140 -416 -823 -19 -205 -176 -79 216 18 -28
1213 1301 1302 1303 1304 1305 1306 1307 1308 1309 1310 1311 1312 1313
Figure 6 : Flight Efficiency savings in Nautical Miles
FLIGHT EFFICIENCY SAVINGS COMPARED TO EQUIVALENT AIRAC CYCLE IN THE PREVIOUS YEAR
(In Tons of Fuel)
-10000
-5000
0
5000
AIRAC CYCLE
TON
S O
F FU
EL
TONS FUEL DESTONS FUEL FPL
TONS FUEL DES 678 527 1233 169 1201 -12 1102 1729 1779 2310 2505 2734 2562 2433
TONS FUEL FPL -342 -1057 -114 -1237 -841 -2497 -4940 -112 -1231 -1056 -476 1295 106 -168
1213 1301 1302 1303 1304 1305 1306 1307 1308 1309 1310 1311 1312 1313
Figure 7 : Flight Efficiency savings in Tons of Fuel
- 9 -
European Route Network Improvement Plan (ERNIP) – Implementation Monitoring Monitoring Report AIRAC 1313 (12 December 2013 - 08 January 2014)
FLIGHT EFFICIENCY SAVINGS COMPARED TO EQUIVALENT AIRAC CYCLE IN THE PREVIOUS YEAR
(In CO2)
-20000
-15000
-10000
-5000
0
5000
10000
15000
AIRAC CYCLE
TON
S O
F C
O2
TONS CO2 DESTONS CO2 FPL
TONS CO2 DES 2260 1755,9 4108,4 562,52 4002 -39,64 3672,6 5765 5931,3 7700 8351,2 9114,8 8539,7 8110,2
TONS CO2 FPL -1140 -3522 -378,9 -4122 -2804 -8324 -16465 -371,9 -4104 -3520 -1585 4315,8 354,92 -559,4
1213 1301 1302 1303 1304 1305 1306 1307 1308 1309 1310 1311 1312 1313
Figure 8 : Flight Efficiency savings in CO2
FLIGHT EFFICIENCY SAVINGS COMPARED TO EQUIVALENT AIRAC CYCLE IN THE PREVIOUS YEAR
(In Thousands of EURO)
-6000
-4000
-2000
0
2000
4000
AIRAC CYCLE
EUR
O/1
000
EURO DESEURO FPL
EURO DES 565 439 1027 141 1001 -10 918 1441 1483 1925 2088 2279 2135 2028
EURO FPL -285 -881 -95 -1031 -701 -2081 -4116 -93 -1026 -880 -396 1079 89 -140
1213 1301 1302 1303 1304 1305 1306 1307 1308 1309 1310 1311 1312 1313
Figure 9 : Flight Efficiency savings in Thousands of EURO
Note: For additional information on ATFM delay that could impact on network efficiency check out the DNM Monthly Network Operations Reports, accessible via: http://www.eurocontrol.int/publications?title=&field_term_publication_type_tid=207&year[value][year]=.
- 10 -
European Route Network Improvement Plan (ERNIP) – Implementation Monitoring Monitoring Report AIRAC 1313 (12 December 2013 - 08 January 2014)
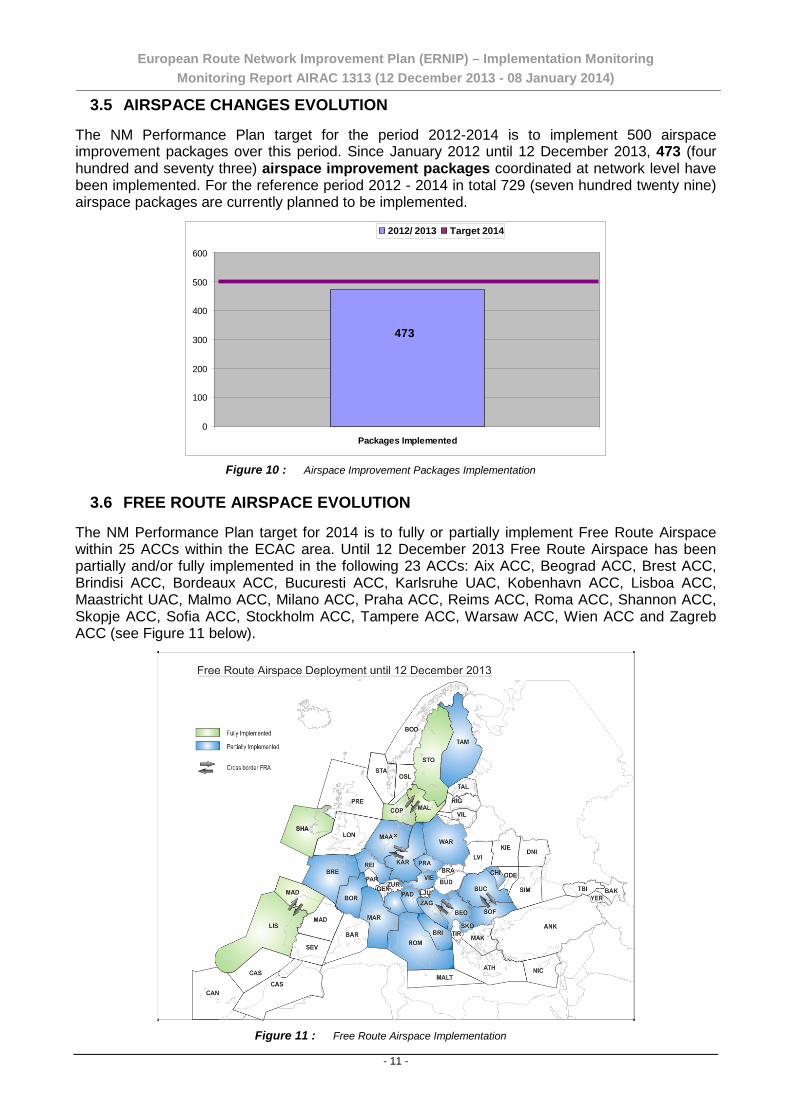
3.5 AIRSPACE CHANGES EVOLUTION The NM Performance Plan target for the period 2012-2014 is to implement 500 airspace improvement packages over this period. Since January 2012 until 12 December 2013, 473 (four hundred and seventy three) airspace improvement packages coordinated at network level have been implemented. For the reference period 2012 - 2014 in total 729 (seven hundred twenty nine) airspace packages are currently planned to be implemented.
0
100
200
300
400
500
600
Packages Implemented
2012/ 2013 Target 2014
473
Figure 10 : Airspace Improvement Packages Implementation
3.6 FREE ROUTE AIRSPACE EVOLUTION
The NM Performance Plan target for 2014 is to fully or partially implement Free Route Airspace within 25 ACCs within the ECAC area. Until 12 December 2013 Free Route Airspace has been partially and/or fully implemented in the following 23 ACCs: Aix ACC, Beograd ACC, Brest ACC, Brindisi ACC, Bordeaux ACC, Bucuresti ACC, Karlsruhe UAC, Kobenhavn ACC, Lisboa ACC, Maastricht UAC, Malmo ACC, Milano ACC, Praha ACC, Reims ACC, Roma ACC, Shannon ACC, Skopje ACC, Sofia ACC, Stockholm ACC, Tampere ACC, Warsaw ACC, Wien ACC and Zagreb ACC (see Figure 11 below).
Figure 11 : Free Route Airspace Implementation
- 11 -
European Route Network Improvement Plan (ERNIP) – Implementation Monitoring Monitoring Report AIRAC 1313 (12 December 2013 - 08 January 2014)
3.7 ASM PERFORMANCE ASSESSMENT FOR 2013 The ASM performance analysis for the year 2013 is based on the major FUA KPIs as they are described in detail in Section 7 of the ERNIP Part 3 - ASM Handbook. For the analysis two classes of indicators are considered:
• indicators to highlight the effectiveness of ASM process in terms of airspace made available for airspace users;
• indicators to focus on the utilisation of available airspace which give the measure of how the airspace users react to the airspace made available.
The FUA indicators are calculated separately for two CDR basic categories: CDR1 and CDR2. The difference from the methodology used so far consists in integrating the CDR1/2 routes in one of the basic categories. The reason is that a CDR1/2 route is either CDR1 or CDR2 at a certain moment. Therefore, the snapshot of the network at any time will contain CDR1 and CDR2 routes. Following this approach the measurement and calculation of FUA KPIs becomes more realistic.
The aggregation of values for the entire year 2013 has been carried out using daily measurements of the indicators. This way it was possible to differentiate the status of each CDR1/2 route, when it is CDR1 and when CDR2 and using the appropriate metrics.
The main ASM indicator to assess the airspace made available during the ASM process is the Rate of CDR Availability (RoCA) and represents (in %) the ratio of the total CDR segment opening, whatever the category may be, to the total time during a given period. The higher this indicator is the longer the airspace (route) is made available for civil use.
The airspace utilisation is measured by the Rate of Aircraft Interested (RAI) and Rate of Actual Use of CDR (RAU). The first indicator gives a measure of the CDR potential of being used in flight planning (flights which could flight-plan on an available CDR), while the second one indicates the actual uptake of the CDRs (flights which flew on a CDR).
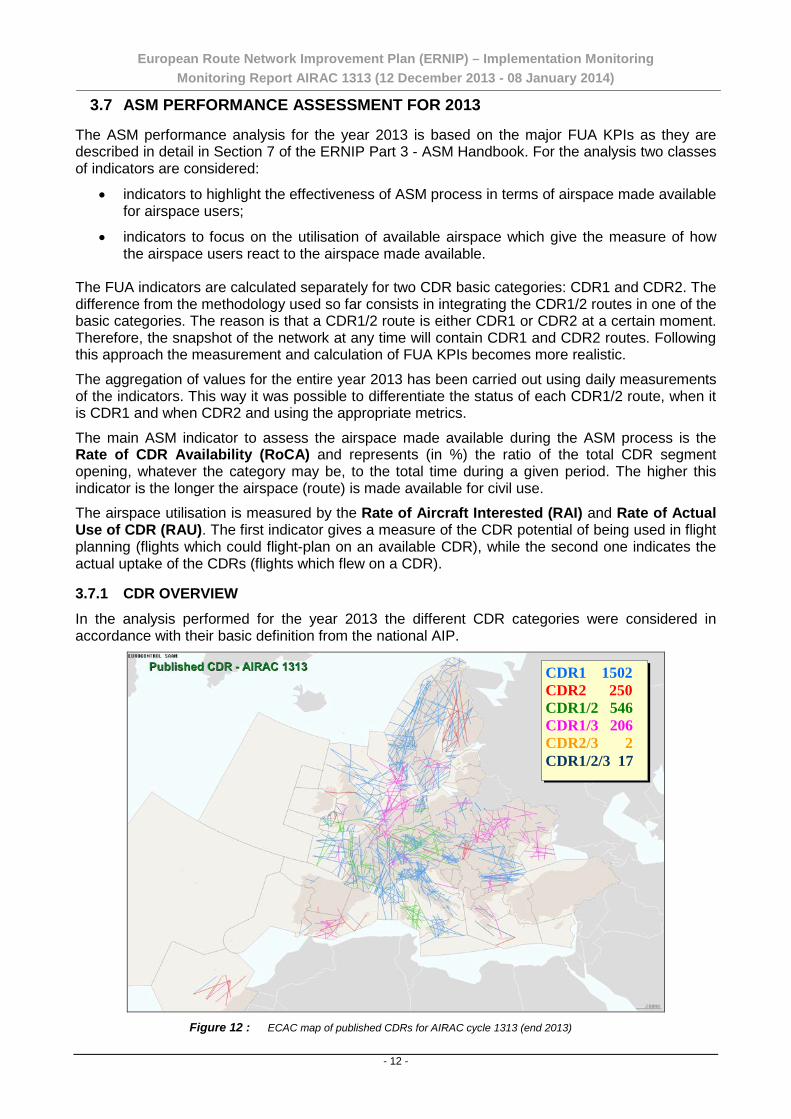
3.7.1 CDR OVERVIEW In the analysis performed for the year 2013 the different CDR categories were considered in accordance with their basic definition from the national AIP.
CDR1 1502 CDR2 250 CDR1/2 546 CDR1/3 206 CDR2/3 2 CDR1/2/3 17
Figure 12 : ECAC map of published CDRs for AIRAC cycle 1313 (end 2013)
- 12 -
European Route Network Improvement Plan (ERNIP) – Implementation Monitoring Monitoring Report AIRAC 1313 (12 December 2013 - 08 January 2014)
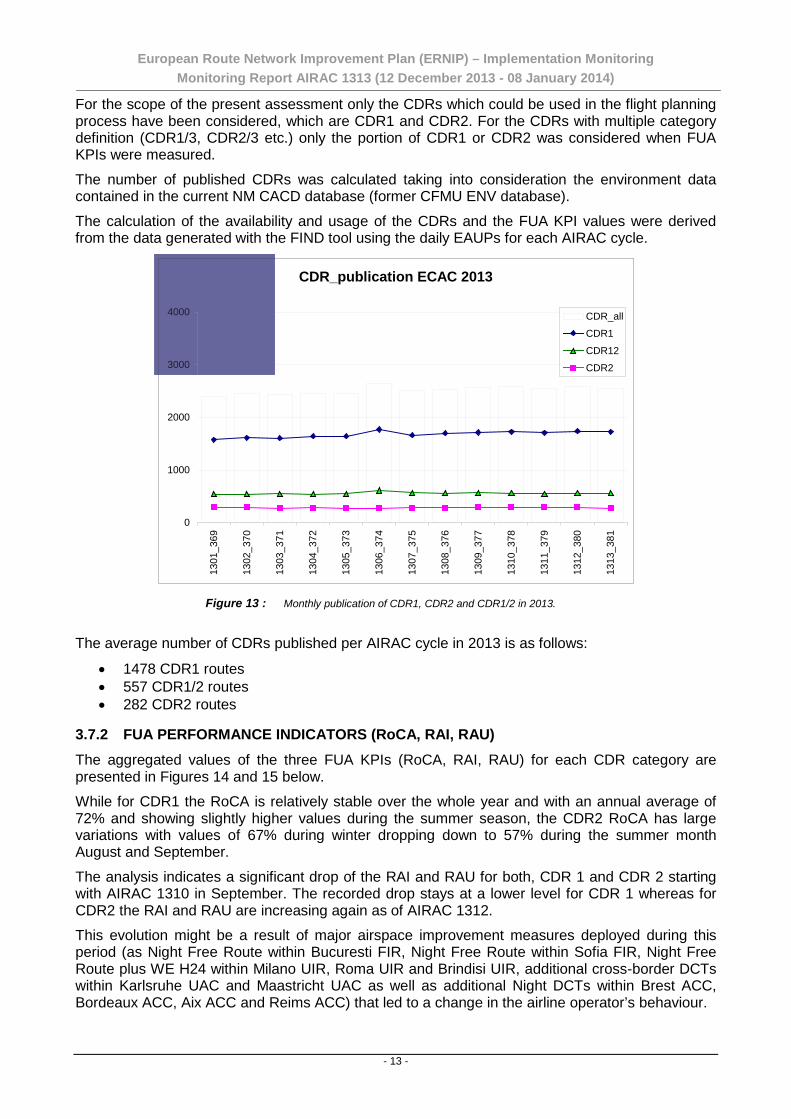
For the scope of the present assessment only the CDRs which could be used in the flight planning process have been considered, which are CDR1 and CDR2. For the CDRs with multiple category definition (CDR1/3, CDR2/3 etc.) only the portion of CDR1 or CDR2 was considered when FUA KPIs were measured.
The number of published CDRs was calculated taking into consideration the environment data contained in the current NM CACD database (former CFMU ENV database).
The calculation of the availability and usage of the CDRs and the FUA KPI values were derived from the data generated with the FIND tool using the daily EAUPs for each AIRAC cycle.
CDR_publication ECAC 2013
0
1000
2000
3000
4000
1301
_369
1302
_370
1303
_371
1304
_372
1305
_373
1306
_374
1307
_375
1308
_376
1309
_377
1310
_378
1311
_379
1312
_380
1313
_381
CDR_all
CDR1
CDR12
CDR2
Figure 13 : Monthly publication of CDR1, CDR2 and CDR1/2 in 2013.
The average number of CDRs published per AIRAC cycle in 2013 is as follows:
• 1478 CDR1 routes • 557 CDR1/2 routes • 282 CDR2 routes
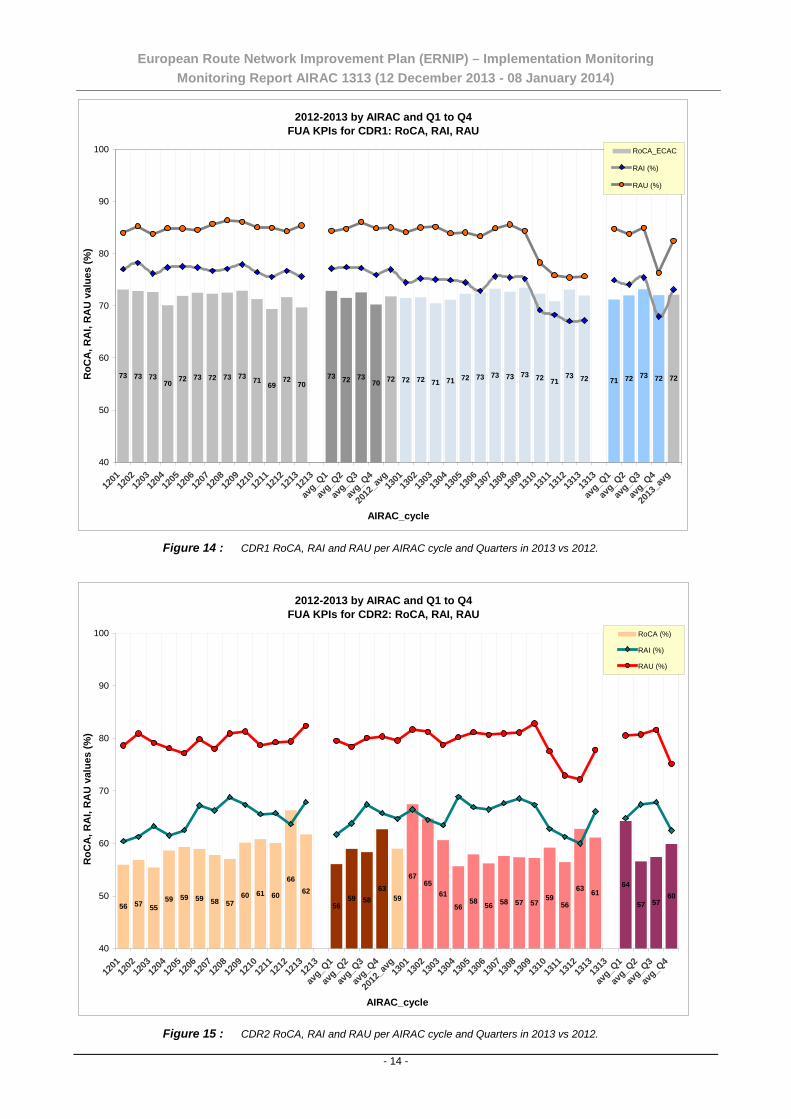
3.7.2 FUA PERFORMANCE INDICATORS (RoCA, RAI, RAU) The aggregated values of the three FUA KPIs (RoCA, RAI, RAU) for each CDR category are presented in Figures 14 and 15 below.
While for CDR1 the RoCA is relatively stable over the whole year and with an annual average of 72% and showing slightly higher values during the summer season, the CDR2 RoCA has large variations with values of 67% during winter dropping down to 57% during the summer month August and September.
The analysis indicates a significant drop of the RAI and RAU for both, CDR 1 and CDR 2 starting with AIRAC 1310 in September. The recorded drop stays at a lower level for CDR 1 whereas for CDR2 the RAI and RAU are increasing again as of AIRAC 1312.
This evolution might be a result of major airspace improvement measures deployed during this period (as Night Free Route within Bucuresti FIR, Night Free Route within Sofia FIR, Night Free Route plus WE H24 within Milano UIR, Roma UIR and Brindisi UIR, additional cross-border DCTs within Karlsruhe UAC and Maastricht UAC as well as additional Night DCTs within Brest ACC, Bordeaux ACC, Aix ACC and Reims ACC) that led to a change in the airline operator’s behaviour.
- 13 -
European Route Network Improvement Plan (ERNIP) – Implementation Monitoring Monitoring Report AIRAC 1313 (12 December 2013 - 08 January 2014)
2012-2013 by AIRAC and Q1 to Q4 FUA KPIs for CDR1: RoCA, RAI, RAU
73 73 7370 72 73 72 73 73 71 69
7270
73 72 7370 72 72 72 71 71 72 73 73 73 73 72 71
73 72 71 72 73 72 72
40
50
60
70
80
90
100
1201
1202
1203
1204
1205
1206
1207
1208
1209
1210
1211
1212
1213
1213
avg_Q
1
avg_Q
2
avg_Q
3
avg_Q
4
2012
_avg
1301
1302
1303
1304
1305
1306
1307
1308
1309
1310
1311
1312
1313
1313
avg_Q
1
avg_Q
2
avg_Q
3
avg_Q
4
2013
_avg
AIRAC_cycle
RoC
A, R
AI,
RA
U v
alue
s (%
)
RoCA_ECAC
RAI (%)
RAU (%)
Figure 14 : CDR1 RoCA, RAI and RAU per AIRAC cycle and Quarters in 2013 vs 2012.
2012-2013 by AIRAC and Q1 to Q4 FUA KPIs for CDR2: RoCA, RAI, RAU
56 57 5559 59 59 58 57
60 61 60
6662
5659 58
6359
6765
61
5658 56 58 57 57
5956
63 6164
57 5760
40
50
60
70
80
90
100
1201
1202
1203
1204
1205
1206
1207
1208
1209
1210
1211
1212
1213
1213
avg_Q
1
avg_Q
2
avg_Q
3
avg_Q
4
2012
_avg
1301
1302
1303
1304
1305
1306
1307
1308
1309
1310
1311
1312
1313
1313
avg_Q
1
avg_Q
2
avg_Q
3
avg_Q
4
AIRAC_cycle
RoC
A, R
AI,
RA
U v
alue
s (%
)
RoCA (%)
RAI (%)
RAU (%)
Figure 15 : CDR2 RoCA, RAI and RAU per AIRAC cycle and Quarters in 2013 vs 2012.
- 14 -
European Route Network Improvement Plan (ERNIP) – Implementation Monitoring Monitoring Report AIRAC 1313 (12 December 2013 - 08 January 2014)
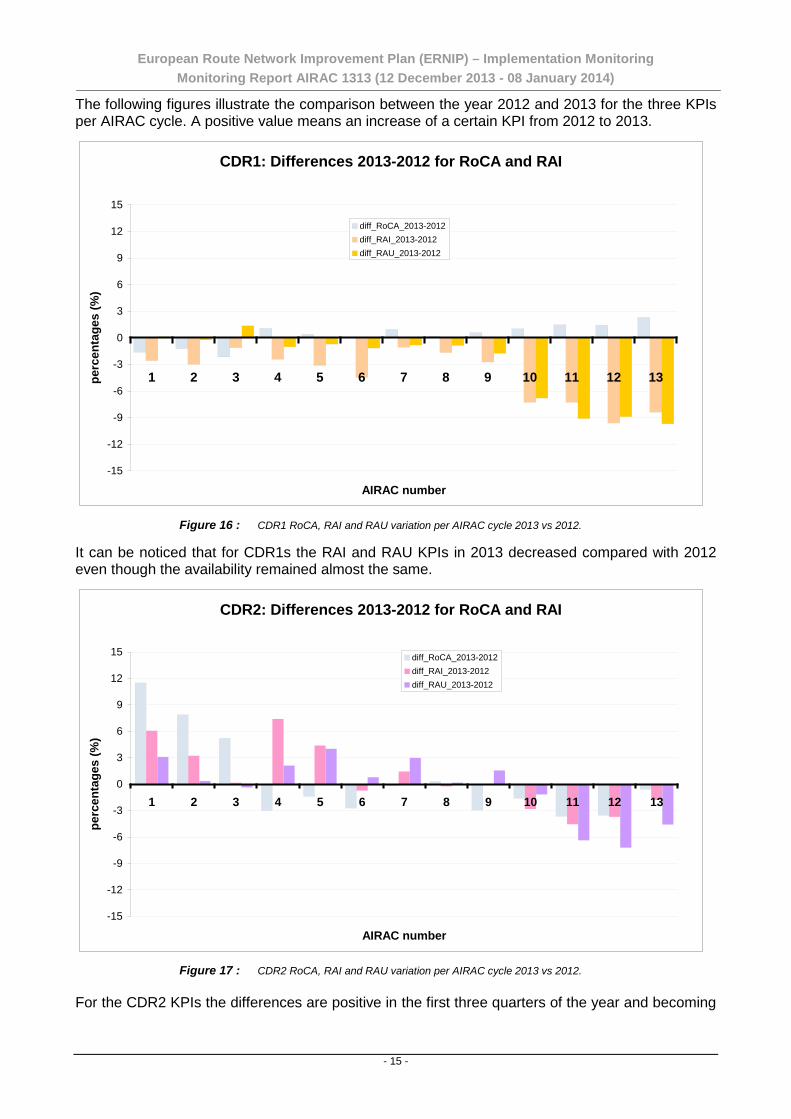
The following figures illustrate the comparison between the year 2012 and 2013 for the three KPIs per AIRAC cycle. A positive value means an increase of a certain KPI from 2012 to 2013.
CDR1: Differences 2013-2012 for RoCA and RAI
-15
-12
-9
-6
-3
0
3
6
9
12
15
1 2 3 4 5 6 7 8 9 10 11 12 13
AIRAC number
perc
enta
ges
(%)
diff_RoCA_2013-2012diff_RAI_2013-2012diff_RAU_2013-2012
Figure 16 : CDR1 RoCA, RAI and RAU variation per AIRAC cycle 2013 vs 2012.
It can be noticed that for CDR1s the RAI and RAU KPIs in 2013 decreased compared with 2012 even though the availability remained almost the same.
CDR2: Differences 2013-2012 for RoCA and RAI
-15
-12
-9
-6
-3
0
3
6
9
12
15
1 2 3 4 5 6 7 8 9 10 11 12 13
AIRAC number
perc
enta
ges
(%)
diff_RoCA_2013-2012diff_RAI_2013-2012diff_RAU_2013-2012
Figure 17 : CDR2 RoCA, RAI and RAU variation per AIRAC cycle 2013 vs 2012.
For the CDR2 KPIs the differences are positive in the first three quarters of the year and becoming
- 15 -
European Route Network Improvement Plan (ERNIP) – Implementation Monitoring Monitoring Report AIRAC 1313 (12 December 2013 - 08 January 2014)
negative in Q4 when the significant decrease in RAI and RAU values is visible in Figures 15 and 17 above.
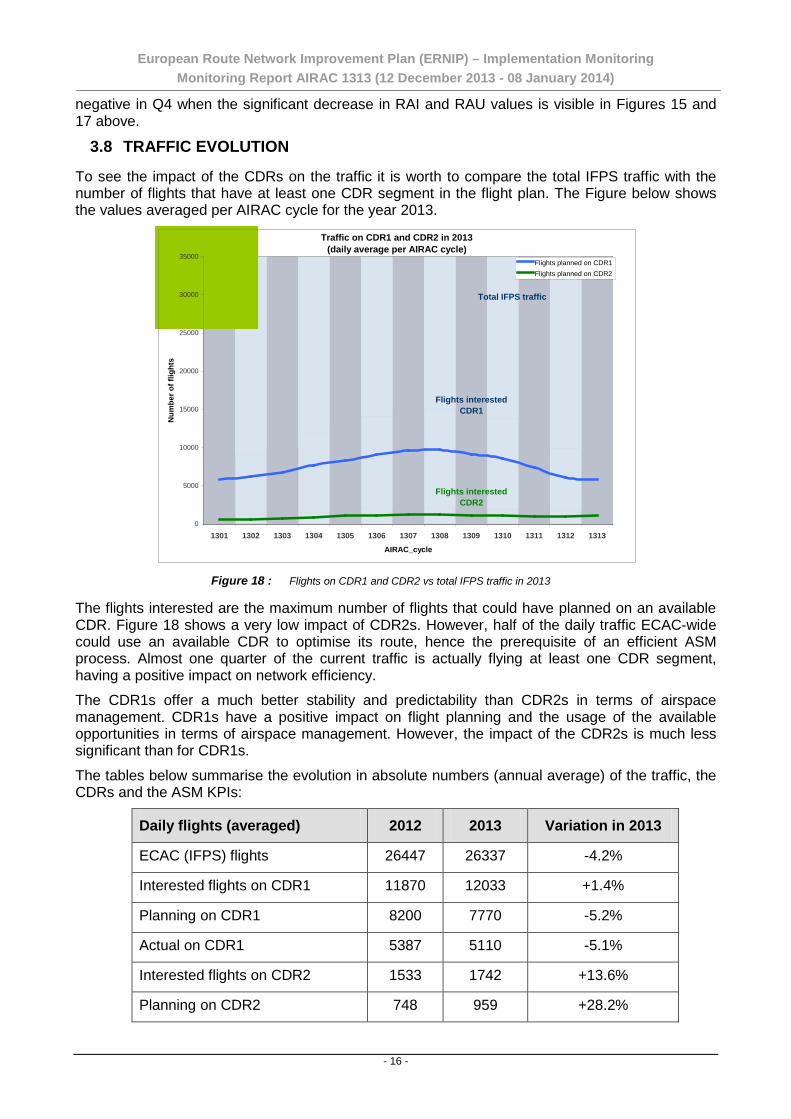
3.8 TRAFFIC EVOLUTION To see the impact of the CDRs on the traffic it is worth to compare the total IFPS traffic with the number of flights that have at least one CDR segment in the flight plan. The Figure below shows the values averaged per AIRAC cycle for the year 2013.
Traffic on CDR1 and CDR2 in 2013 (daily average per AIRAC cycle)
Total IFPS traffic
Flights interested CDR1
Flights interested CDR2
0
5000
10000
15000
20000
25000
30000
35000
1301 1302 1303 1304 1305 1306 1307 1308 1309 1310 1311 1312 1313
AIRAC_cycle
Num
ber o
f flig
hts
Flights planned on CDR1Flights planned on CDR2
Figure 18 : Flights on CDR1 and CDR2 vs total IFPS traffic in 2013
The flights interested are the maximum number of flights that could have planned on an available CDR. Figure 18 shows a very low impact of CDR2s. However, half of the daily traffic ECAC-wide could use an available CDR to optimise its route, hence the prerequisite of an efficient ASM process. Almost one quarter of the current traffic is actually flying at least one CDR segment, having a positive impact on network efficiency.
The CDR1s offer a much better stability and predictability than CDR2s in terms of airspace management. CDR1s have a positive impact on flight planning and the usage of the available opportunities in terms of airspace management. However, the impact of the CDR2s is much less significant than for CDR1s.
The tables below summarise the evolution in absolute numbers (annual average) of the traffic, the CDRs and the ASM KPIs:
Daily flights (averaged) 2012 2013 Variation in 2013
ECAC (IFPS) flights 26447 26337 -4.2%
Interested flights on CDR1 11870 12033 +1.4%
Planning on CDR1 8200 7770 -5.2%
Actual on CDR1 5387 5110 -5.1%
Interested flights on CDR2 1533 1742 +13.6%
Planning on CDR2 748 959 +28.2%
- 16 -
European Route Network Improvement Plan (ERNIP) – Implementation Monitoring Monitoring Report AIRAC 1313 (12 December 2013 - 08 January 2014)
Actual on CDR2 451 549 +21.7% Figure 19 : Traffic evolution
This table in Figure 19 above compares the number of flights planning and flying CDR1 and CDR2 segments in 2013 vs. 2012. A significant increase in planning on CDR2 is recorded that might be a consequence of the flight efficiency/ FE improvement campaign (described in chapter 4 of this report), including the increasing awareness of the shortest route available.
CDR routes (segments) 2012 2013 Variation in 2013
CDR1 published 1693 1678 -0.9%
CDR1 used for planning 1011 999 -1.2%
CDR1 actually flown 953 945 -0.8%
CDR2 published 757 840 +11%
CDR2 used for planning 175 170 -2.9%
CDR2 actually flown 168 161 -4.2% Figure 20 : CDR number evolution
The table in Figure 20 above is an illustration of the evolution of the CDR number and their uptake for planning and actual usage. Noticeable is the increased number of CDR2 segments in 2013; however the total number of CDR2 segments used for planning is slightly lower leading to the conclusion that the traffic concentrates on almost the same CDR2 segments as in the previous year.
FUA KPIs (annual average) 2012 2013 Variation in 2013
CDR1 RoCA (%) 71.8 72.1 +0.4%
CDR1 RAI (%) 77.0 73.1 -5%
CDR1 RAU (%) 85.2 82.5 -3%
CDR2 RoCA (%) 59.2 59.5 +0.6%
CDR2 RAI (%) 64.7 65.7 +1.4%
CDR2 RAU (%) 79.5 79.5 0% Figure 21 : ASM KPIs variation
The table in Figure 21 above shows a decrease of the RAI and RAU values for CDR1s. In contrary for CDR2s a small increase is observed based on the increased number of CDR2s published (+11%) and an increase of the number of flights interested in a CDR2 (+13.6%).
3.8.1 CDR UTILISATION The indicators characterising the utilisation of the available CDRs are represented by Rate of Aircraft Interested (RAI) for the flights planning on available CDRs and Actual Rate of Usage of available CDRs (RAU) for the uptake. The Figures below illustrate the annual averaged values for RAI and RAU indicators.
- 17 -
European Route Network Improvement Plan (ERNIP) – Implementation Monitoring Monitoring Report AIRAC 1313 (12 December 2013 - 08 January 2014)
Rate of Aircraft Interested 2013 CDR1
NOT on CDR126.9%
Planning on CDR173.1%
Rate of Aircraft Interested 2013 CDR2
NOT on CDR234.3%
Planning on CDR265.7%
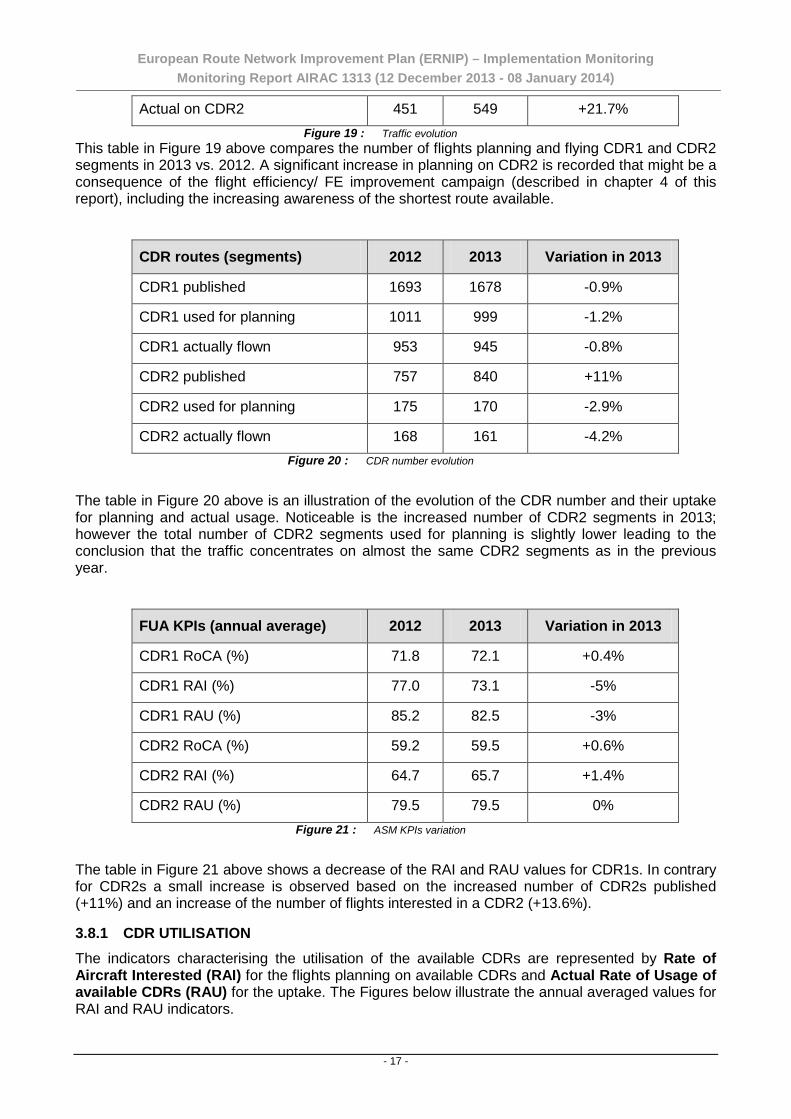
Figure 22 : RAI for CDR1 and CDR2 averaged for the entire year 2013.
The graph above shows the percentage of the flights averaged for the year 2013 that have planned to use at least one CDR1 or CDR2 out of the total number of flights that could have used at least a CDR in their flight plans. There is still a gap between the options offered by CDRs availability and the actual flight planning activity: 26.9% of flights which could have planned on an available CDR1 missed this opportunity. The same, 34.3% of the interested flights missed to fill in a flight plan on a CDR2.
Rate of Actual Use 2013 CDR1
NOT on CDR117.5%
Flying on CDR182.5%
Rate of Actual Use 2013 CDR2
Flying on CDR279.5%
NOT on CDR220.5%
Figure 23 : RAU for CDR1 and CDR2 averaged for the entire year 2013.
The figure above represents the percentage of flights which actually flew on a CDR. There were 17.5% of the flights which could have used the opportunity of flying an available CDR1 (and 20.5% for CDR2) but didn’t, either because they did not plan or due to ATC intervention.
The analysis points out that there are flights which did not plan on an available CDR but actually flew on it. In case of CDR1s there was a percentage of 9.4% of the flights (26.9% not planning minus 17.5% not flying) which even though they did not plan to fly on an available CDR1, finally flew on a CDR1. Same applies for CDR2 where a percentage of 13.8% of the interested flights did not plan on an available CDR2 but flew on it. The reason might be either a tactical intervention or a last minute change of route.
Part of this gap is covered by ATC and last minute change of route – but both solutions are reducing the predictability factor which has a negative impact on capacity.
- 18 -
European Route Network Improvement Plan (ERNIP) – Implementation Monitoring Monitoring Report AIRAC 1313 (12 December 2013 - 08 January 2014)
4. NETWORK MANAGER CONTRIBUTION TO FLIGHT EFFICIENCY IMPROVEMENTS
4.1 FLIGHT EFFICIENCY EVOLUTION ASSESSMENT
The NM flight efficiency (FE) initiative focuses on the improvement of flight planning quality. From AIRAC 1305 to AIRAC 1311 it involved only the invalid flight plans affecting 5% of the total traffic in Europe. Those flights were manually corrected and where possible, improvement proposals are made for shorter route options. Since AIRAC 1312 the valid flight plans are included as well, re-processed using the Group Re-routing Tool at regular intervals during the day in order to detect and suggest better route opportunities for the remaining 95% of the flights. Re-routing propositions are offered to the airline operators by phone or AFTN/SITA message after the flight plan was filed.
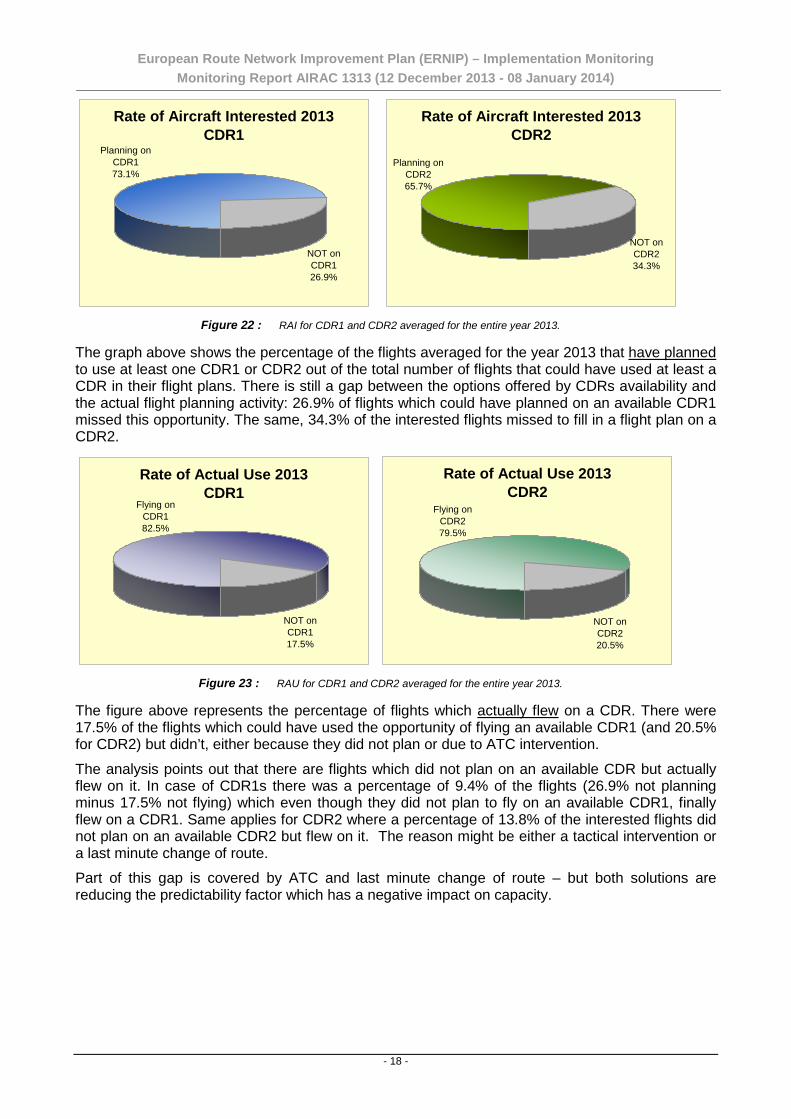
Figure 12 below illustrates the difference between the potential savings identified during AIRAC 1313 of 47 343 NM in total being offered to the airspace users on the day of operations versus the total amount of 16 494 NM effectively saved through the accepted proposals.
Note: The variations in savings are actually depending on the amount of flight plans manually treated in the IFPS units as well as staff resources to be dedicated to the flight efficiency task.
Flight Efficiency Distance proposed V.S Distance realised
17033
1270
4258
12355
8512
94438283
2683
0
2000
4000
6000
8000
10000
12000
14000
16000
18000
Wee
k 51
Wee
k 52
Wee
k 1
Dis
tanc
e (N
M)
Distance proposed Distance realised
Wee
k 2
Flight Efficiency Distance proposed V.S Distance realised
17033
1270
4258
12355
8512
94438283
2683
0
2000
4000
6000
8000
10000
12000
14000
16000
18000
Wee
k 51
Wee
k 52
Wee
k 1
Dis
tanc
e (N
M)
Distance proposed Distance realised
Wee
k 2
Figure 24 : AIRAC overview distance proposed versus distance realised
The acceptance rate by the flight plan originator to the re-routing propositions is increasing in absolute value with more airline operators being aware of the process. However, the ratio between the amount of re-route proposals sent versus the amount of re-route proposals accepted seems to decrease (61% for AIRAC 1311, 77% for AIRAC 1310 and 81% for AIRAC 1309) due to the significant increase of re-route proposals sent since AIRAC 1312 (including the valid flight plan data) but recording the same or slightly higher level of acceptance with an average level of 35% for AIRAC cycle 1313 (33% for AIRAC 1312).
The effort to improve the quality of flight planning has to be much stronger in order to result in net savings. Therefore the Network Manager started progressively to treat the valid flight plan database as well to identify further potential improvements in flight planning on the remaining 95% of the traffic for various flows and city pairs, taking into account the latest network situation.
- 19 -
European Route Network Improvement Plan (ERNIP) – Implementation Monitoring Monitoring Report AIRAC 1313 (12 December 2013 - 08 January 2014)
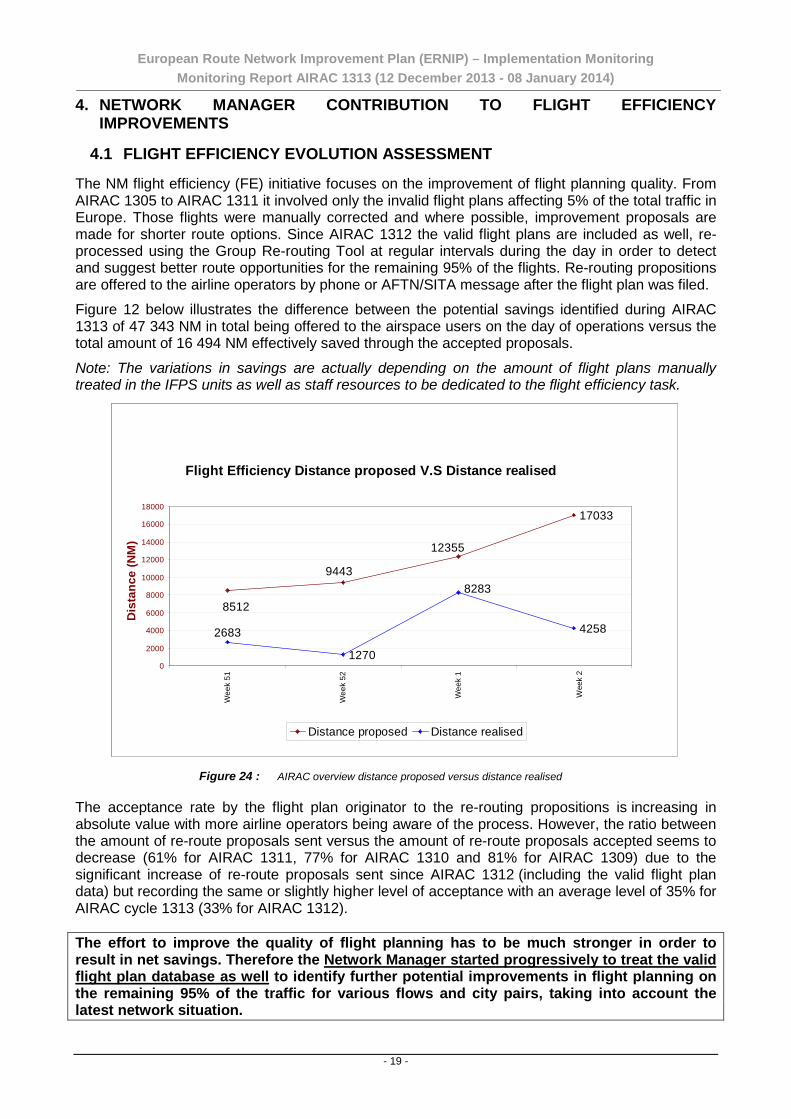
4.2 INCREASED CDR AVAILABILITY AND UTILISATION ASSESSMENT Since the start of the flight efficiency initiative in May 2013 the NM network impact assessment additionally works on the improvement of CDR availability and its utilisation. On D-1 the military liaison officer/ MILO looks to the Airspace Use Plan/ AUP in order to identify potential traffic/demand that could benefit from a CDR opening. The traffic identified is validated with the Aircraft Operator Liaison Officer/ AOLO who initiates a co-ordination with the flight plan originator. A re-route proposal is generated after a second x-check on the day itself/D-day.
FE CDR weekly savings
0
1225
0
2268
12500440
0500
1000150020002500
Wee
k51
Wee
k52
Wee
k1
Wee
k2
Dist
ance
(NM
)
Distance Potential Distance Realized
Figure 25 : CDR utilisation savings
The NM initiatives to improve the utilization of CDR routes during AIRAC cycle 1313 identified a potential saving of around 3 493 NM less to be flown (4361 NM in AIRAC 1312, 4 923 NM in AIRAC 1311, 5 200 NM in AIRAC 1310 and 12 051 NM in AIRAC 1309). This AIRAC cycle covers only 2 weeks because the MILO (Military Liaison Officer) position was not active during the Christmas period (week 52 of 2013 and week 1 in 2014).
Due to a low acceptance of the re-route proposals by the airline operators and the fact that the network assessment reports show significantly less flights that could benefit from additional CDR availability the average actual uptake by the airline operators is only 18% (same in AIRAC 1312, 10% in AIRAC 1311, 26% in AIRAC 1310, 20,6% in AIRAC 1309 and 33% in AIARC 1308), representing 565 NM effective gain (See Figure 13 above). One reason for the low rate of potential flights that could benefit from additional CDR opportunities might be the change from repetitive flight planning/ RPL to automatic flight planning systems, calculating the best route available while taking into account all flight-relevant information and thus improving the quality of flight planning significantly.
AIRAC 1313 has seen a further decrease in flights for potential opportunities. There is still an unused potential of shorter rote options available through CDRs that could contribute to further improve flight efficiency, if airline operators would be ready and prepared to flight plan on conditional routes/CDRs.
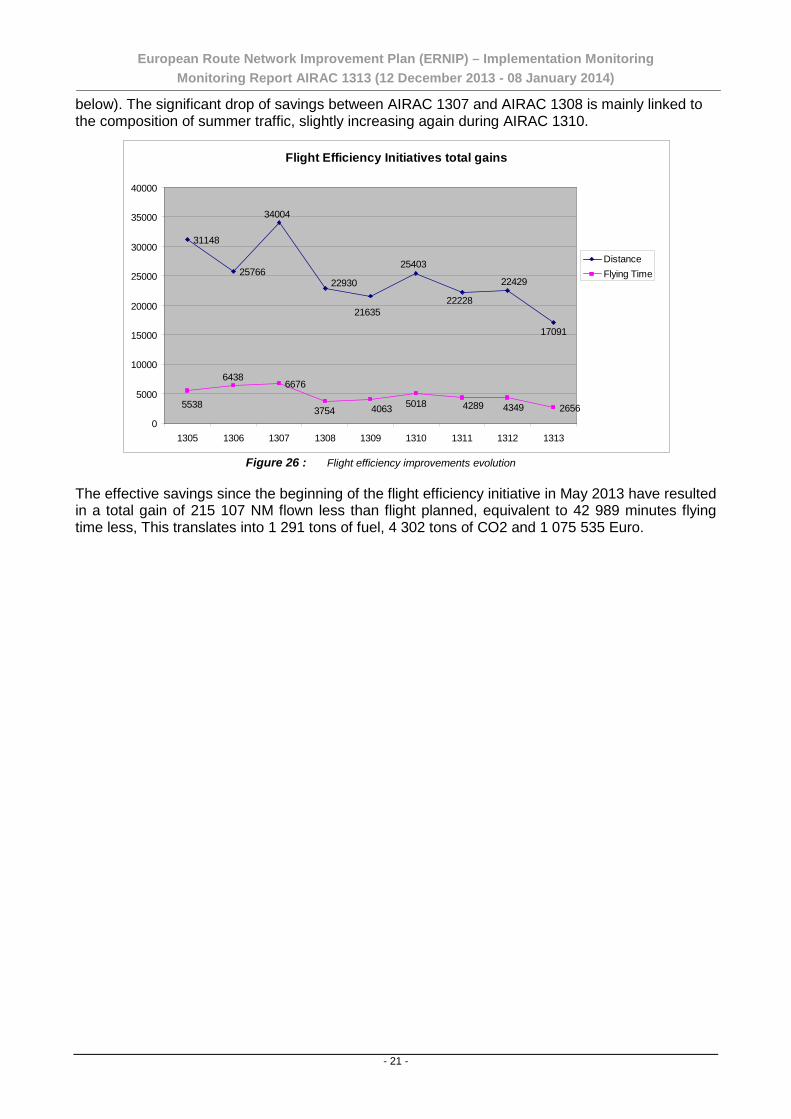
4.3 TOTAL BENEFITS FOR FLIGHT EFFICIENCY IMPROVEMENTS The graph below shows the evolution of the flight efficiency improvements over the last nine AIRAC cycles until 8 January 2014. Due to the flight efficiency initiative the savings achieved through re-filing of shorter route options during AIRAC 1313 amount to 17 091 NMs flown less (including CDR availability & utilisation), equivalent to 2 656 minutes flying time less (see Figure 14
- 20 -
European Route Network Improvement Plan (ERNIP) – Implementation Monitoring Monitoring Report AIRAC 1313 (12 December 2013 - 08 January 2014)
below). The significant drop of savings between AIRAC 1307 and AIRAC 1308 is mainly linked to the composition of summer traffic, slightly increasing again during AIRAC 1310.
Flight Efficiency Initiatives total gains
31148
25766
6676
2656
17091
22429
22228
34004
25403
21635
22930
434942893754
6438
5538 501840630
5000
10000
15000
20000
25000
30000
35000
40000
1305 1306 1307 1308 1309 1310 1311 1312 1313
DistanceFlying Time
Figure 26 : Flight efficiency improvements evolution
The effective savings since the beginning of the flight efficiency initiative in May 2013 have resulted in a total gain of 215 107 NM flown less than flight planned, equivalent to 42 989 minutes flying time less, This translates into 1 291 tons of fuel, 4 302 tons of CO2 and 1 075 535 Euro.
- 21 -

European Route Network Improvement Plan (ERNIP) – Implementation Monitoring Monitoring Report AIRAC 1313 (12 December 2013 - 08 January 2014)
Left blank intentionally
- 22 -
European Route Network Improvement Plan (ERNIP) – Implementation Monitoring Monitoring Report AIRAC 1313 (12 December 2013 - 08 January 2014)
ANNEX A: DETAILED LIST OF PROJECTS IMPLEMENTED 14 NOVEMBER 2013 The following table presents detailed information about each of the improvement proposals developed within the RNDSG and implemented 14 November 2013. The description of the proposals is based on the information available from different sources (e.g. AOs, ANSPs and EUROCONTROL). For the correctness and verification of the relevant aeronautical information consult official State AIP publication. The data from this document should not be used for operational purposes. The table includes:
Proposal ID number: A reference number to identify each proposal allowing to trace at which RNDSG it was initiated.
Project Name: Dedicated Name and Phase/ Step of the improvement project.
Description: A detailed description of the planned improvement proposal.
Objective: A brief description of the purpose of the enhancement measure.
Implementation Status: The implementation status defined as Proposed, Planned, Confirmed or Implemented.
Project Group: The Functional Airspace Block Group (FAB), Regional Focus Group (RFG), Sub-Group (SG) or any other Project Group(s) involved directly or indirectly by the proposed enhancement measure.
Project Category: The nature of the proposed enhancement measure defined through Project Categories referring to:
o Airspace Structure; o ATC Sectors; o ATS Routes; o CDRs: o Civil/Military Airspace; o DCTs; o Free Route Airspace; o Night Routes; o PBN; o RAD; o Route Redesignation; o TMA.
States and Organisations: The States and/or Organisations involved directly or indirectly by the proposed enhancement measure.
Originator(s): The States and/or Organisations who have originated the proposal.
Comments: The conditions and/or pre-requisites which have to be met in order to implement the proposal or any other relevant comment(s).
Note: The list of implemented changes for this AIRAC cycle does not claim to be complete.
- 23 -
European Route Network Improvement Plan (ERNIP) – Implementation Monitoring Monitoring Report AIRAC 1313 (12 December 2013 - 08 January 2014)
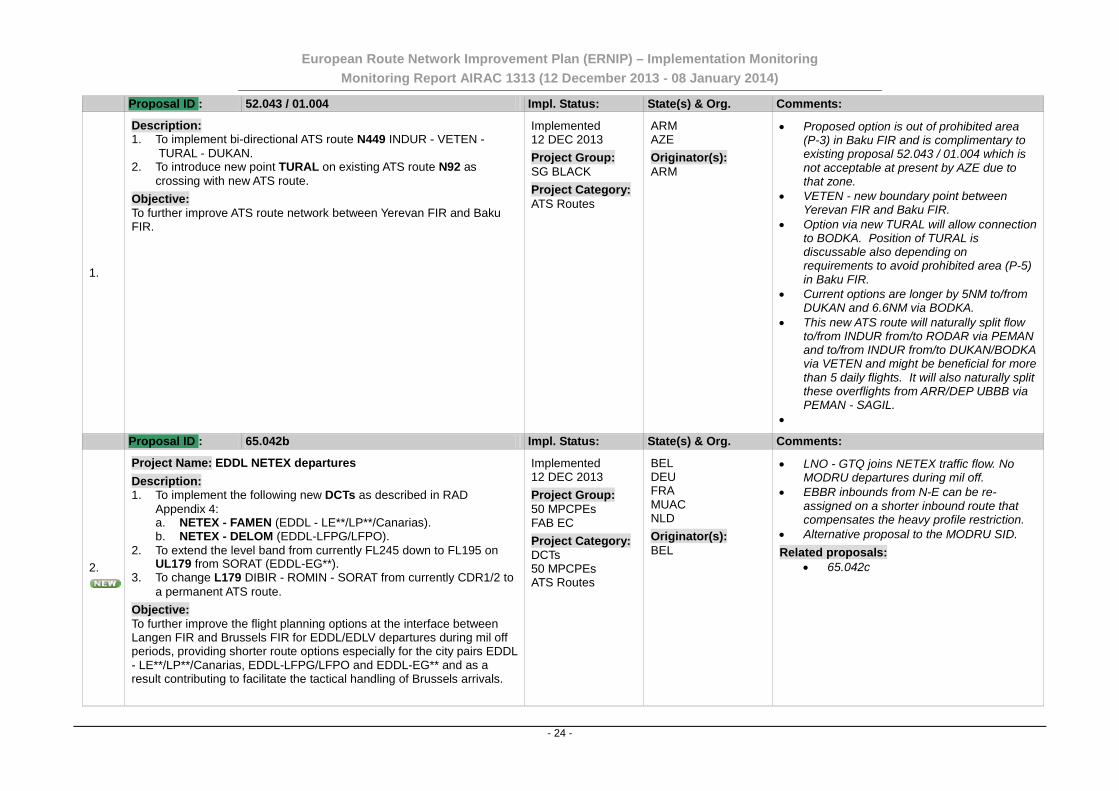
Proposal ID : 52.043 / 01.004 Impl. Status: State(s) & Org. Comments:
1.
Description: 1. To implement bi-directional ATS route N449 INDUR - VETEN -
TURAL - DUKAN. 2. To introduce new point TURAL on existing ATS route N92 as
crossing with new ATS route.
Objective: To further improve ATS route network between Yerevan FIR and Baku FIR.
Implemented 12 DEC 2013
Project Group: SG BLACK
Project Category: ATS Routes
ARM AZE
Originator(s): ARM
• Proposed option is out of prohibited area (P-3) in Baku FIR and is complimentary to existing proposal 52.043 / 01.004 which is not acceptable at present by AZE due to that zone.
• VETEN - new boundary point between Yerevan FIR and Baku FIR.
• Option via new TURAL will allow connection to BODKA. Position of TURAL is discussable also depending on requirements to avoid prohibited area (P-5) in Baku FIR.
• Current options are longer by 5NM to/from DUKAN and 6.6NM via BODKA.
• This new ATS route will naturally split flow to/from INDUR from/to RODAR via PEMAN and to/from INDUR from/to DUKAN/BODKA via VETEN and might be beneficial for more than 5 daily flights. It will also naturally split these overflights from ARR/DEP UBBB via PEMAN - SAGIL.
•
Proposal ID : 65.042b Impl. Status: State(s) & Org. Comments:
2.
Project Name: EDDL NETEX departures
Description: 1. To implement the following new DCTs as described in RAD
Appendix 4: a. NETEX - FAMEN (EDDL - LE**/LP**/Canarias). b. NETEX - DELOM (EDDL-LFPG/LFPO).
2. To extend the level band from currently FL245 down to FL195 on UL179 from SORAT (EDDL-EG**).
3. To change L179 DIBIR - ROMIN - SORAT from currently CDR1/2 to a permanent ATS route.
Objective: To further improve the flight planning options at the interface between Langen FIR and Brussels FIR for EDDL/EDLV departures during mil off periods, providing shorter route options especially for the city pairs EDDL - LE**/LP**/Canarias, EDDL-LFPG/LFPO and EDDL-EG** and as a result contributing to facilitate the tactical handling of Brussels arrivals.
Implemented 12 DEC 2013
Project Group: 50 MPCPEs FAB EC
Project Category: DCTs 50 MPCPEs ATS Routes
BEL DEU FRA MUAC NLD
Originator(s): BEL
• LNO - GTQ joins NETEX traffic flow. No MODRU departures during mil off.
• EBBR inbounds from N-E can be re-assigned on a shorter inbound route that compensates the heavy profile restriction.
• Alternative proposal to the MODRU SID.
Related proposals: • 65.042c
- 24 -
European Route Network Improvement Plan (ERNIP) – Implementation Monitoring Monitoring Report AIRAC 1313 (12 December 2013 - 08 January 2014)
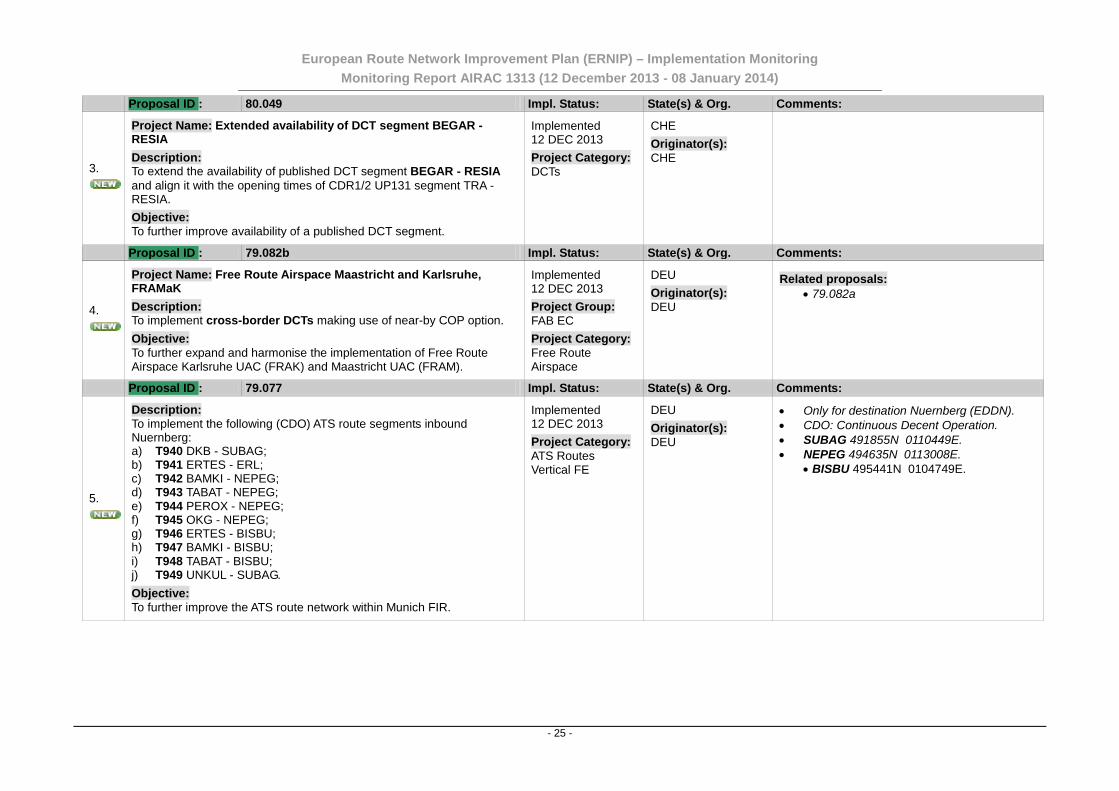
Proposal ID : 80.049 Impl. Status: State(s) & Org. Comments:
3.
Project Name: Extended availability of DCT segment BEGAR - RESIA
Description: To extend the availability of published DCT segment BEGAR - RESIA and align it with the opening times of CDR1/2 UP131 segment TRA - RESIA.
Objective: To further improve availability of a published DCT segment.
Implemented 12 DEC 2013
Project Category: DCTs
CHE
Originator(s): CHE
Proposal ID : 79.082b Impl. Status: State(s) & Org. Comments:
4.
Project Name: Free Route Airspace Maastricht and Karlsruhe, FRAMaK
Description: To implement cross-border DCTs making use of near-by COP option.
Objective: To further expand and harmonise the implementation of Free Route Airspace Karlsruhe UAC (FRAK) and Maastricht UAC (FRAM).
Implemented 12 DEC 2013
Project Group: FAB EC
Project Category: Free Route Airspace
DEU
Originator(s): DEU
Related proposals: • 79.082a
Proposal ID : 79.077 Impl. Status: State(s) & Org. Comments:
5.
Description: To implement the following (CDO) ATS route segments inbound Nuernberg: a) T940 DKB - SUBAG; b) T941 ERTES - ERL; c) T942 BAMKI - NEPEG; d) T943 TABAT - NEPEG; e) T944 PEROX - NEPEG; f) T945 OKG - NEPEG; g) T946 ERTES - BISBU; h) T947 BAMKI - BISBU; i) T948 TABAT - BISBU; j) T949 UNKUL - SUBAG.
Objective: To further improve the ATS route network within Munich FIR.
Implemented 12 DEC 2013
Project Category: ATS Routes Vertical FE
DEU
Originator(s): DEU
• Only for destination Nuernberg (EDDN). • CDO: Continuous Decent Operation. • SUBAG 491855N 0110449E. • NEPEG 494635N 0113008E.
• BISBU 495441N 0104749E.
- 25 -
European Route Network Improvement Plan (ERNIP) – Implementation Monitoring Monitoring Report AIRAC 1313 (12 December 2013 - 08 January 2014)
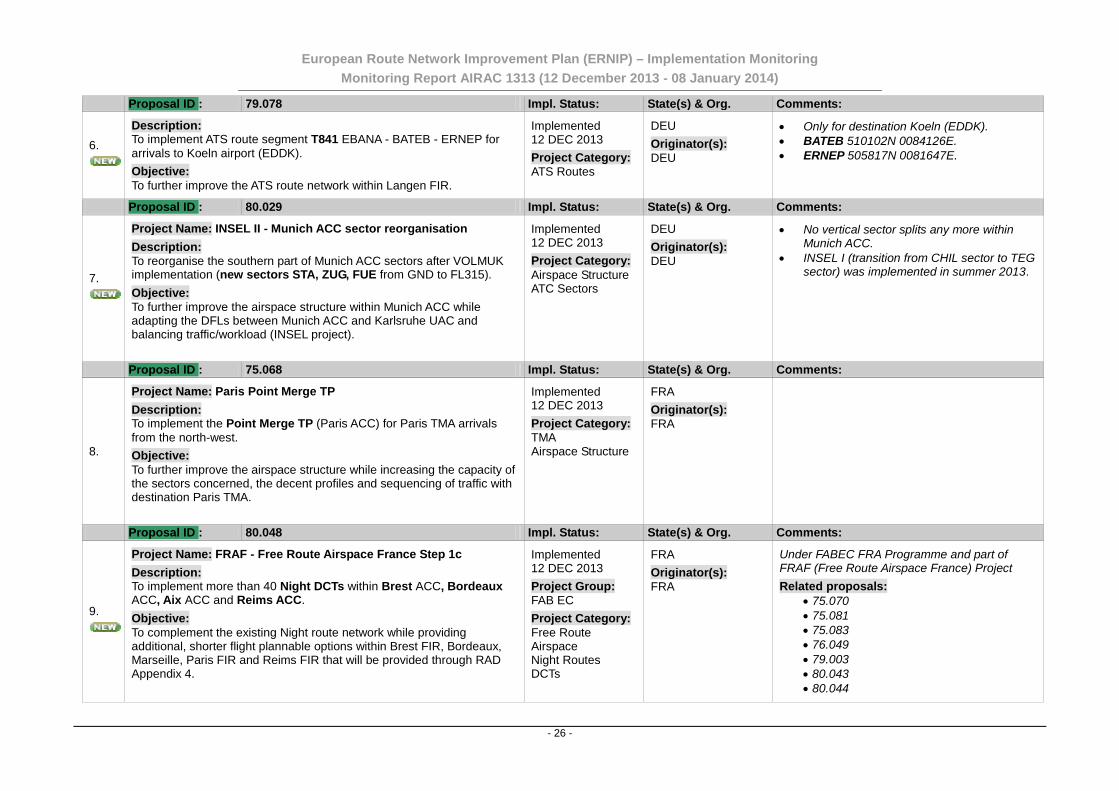
Proposal ID : 79.078 Impl. Status: State(s) & Org. Comments:
6.
Description: To implement ATS route segment T841 EBANA - BATEB - ERNEP for arrivals to Koeln airport (EDDK).
Objective: To further improve the ATS route network within Langen FIR.
Implemented 12 DEC 2013
Project Category: ATS Routes
DEU
Originator(s): DEU
• Only for destination Koeln (EDDK). • BATEB 510102N 0084126E. • ERNEP 505817N 0081647E.
Proposal ID : 80.029 Impl. Status: State(s) & Org. Comments:
7.
Project Name: INSEL II - Munich ACC sector reorganisation
Description: To reorganise the southern part of Munich ACC sectors after VOLMUK implementation (new sectors STA, ZUG, FUE from GND to FL315).
Objective: To further improve the airspace structure within Munich ACC while adapting the DFLs between Munich ACC and Karlsruhe UAC and balancing traffic/workload (INSEL project).
Implemented 12 DEC 2013
Project Category: Airspace Structure ATC Sectors
DEU
Originator(s): DEU
• No vertical sector splits any more within Munich ACC.
• INSEL I (transition from CHIL sector to TEG sector) was implemented in summer 2013.
Proposal ID : 75.068 Impl. Status: State(s) & Org. Comments:
8.
Project Name: Paris Point Merge TP
Description: To implement the Point Merge TP (Paris ACC) for Paris TMA arrivals from the north-west.
Objective: To further improve the airspace structure while increasing the capacity of the sectors concerned, the decent profiles and sequencing of traffic with destination Paris TMA.
Implemented 12 DEC 2013
Project Category: TMA Airspace Structure
FRA
Originator(s): FRA
Proposal ID : 80.048 Impl. Status: State(s) & Org. Comments:
9.
Project Name: FRAF - Free Route Airspace France Step 1c
Description: To implement more than 40 Night DCTs within Brest ACC, Bordeaux ACC, Aix ACC and Reims ACC.
Objective: To complement the existing Night route network while providing additional, shorter flight plannable options within Brest FIR, Bordeaux, Marseille, Paris FIR and Reims FIR that will be provided through RAD Appendix 4.
Implemented 12 DEC 2013
Project Group: FAB EC
Project Category: Free Route Airspace Night Routes DCTs
FRA
Originator(s): FRA
Under FABEC FRA Programme and part of FRAF (Free Route Airspace France) Project
Related proposals: • 75.070 • 75.081 • 75.083 • 76.049 • 79.003 • 80.043 • 80.044
- 26 -
European Route Network Improvement Plan (ERNIP) – Implementation Monitoring Monitoring Report AIRAC 1313 (12 December 2013 - 08 January 2014)
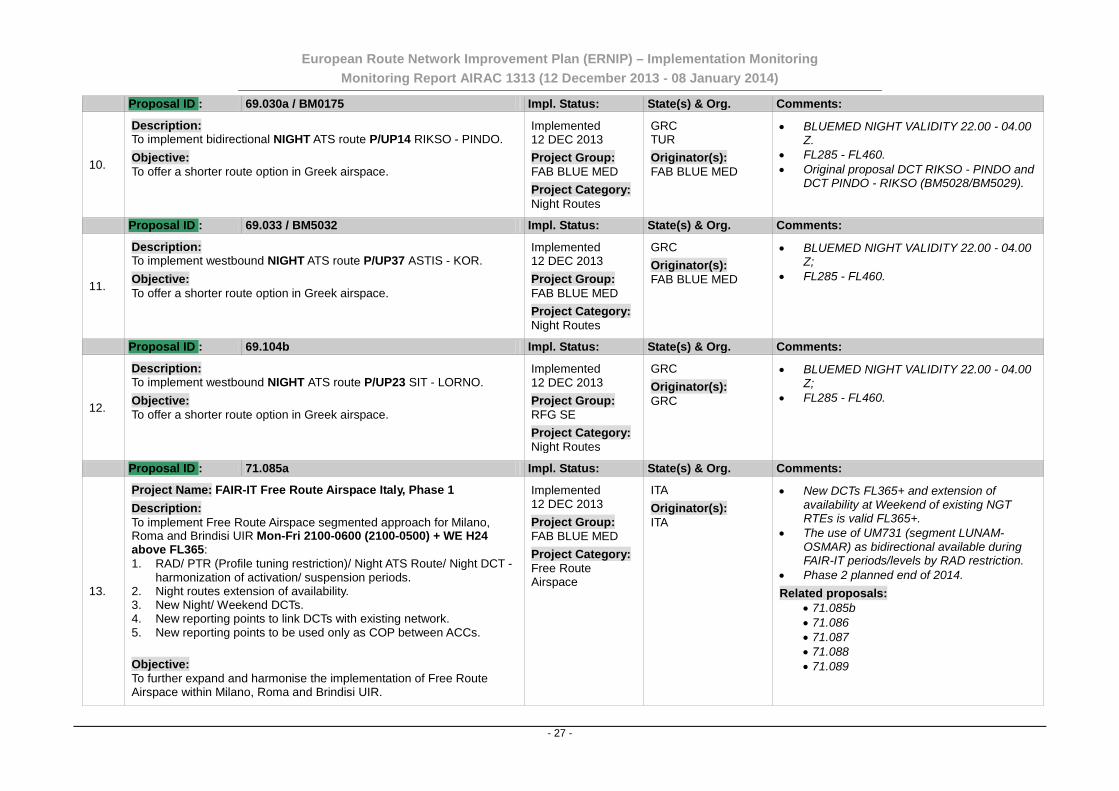
Proposal ID : 69.030a / BM0175 Impl. Status: State(s) & Org. Comments:
10.
Description: To implement bidirectional NIGHT ATS route P/UP14 RIKSO - PINDO.
Objective: To offer a shorter route option in Greek airspace.
Implemented 12 DEC 2013
Project Group: FAB BLUE MED
Project Category: Night Routes
GRC TUR
Originator(s): FAB BLUE MED
• BLUEMED NIGHT VALIDITY 22.00 - 04.00 Z.
• FL285 - FL460. • Original proposal DCT RIKSO - PINDO and
DCT PINDO - RIKSO (BM5028/BM5029).
Proposal ID : 69.033 / BM5032 Impl. Status: State(s) & Org. Comments:
11.
Description: To implement westbound NIGHT ATS route P/UP37 ASTIS - KOR.
Objective: To offer a shorter route option in Greek airspace.
Implemented 12 DEC 2013
Project Group: FAB BLUE MED
Project Category: Night Routes
GRC
Originator(s): FAB BLUE MED
• BLUEMED NIGHT VALIDITY 22.00 - 04.00 Z;
• FL285 - FL460.
Proposal ID : 69.104b Impl. Status: State(s) & Org. Comments:
12.
Description: To implement westbound NIGHT ATS route P/UP23 SIT - LORNO.
Objective: To offer a shorter route option in Greek airspace.
Implemented 12 DEC 2013
Project Group: RFG SE
Project Category: Night Routes
GRC
Originator(s): GRC
• BLUEMED NIGHT VALIDITY 22.00 - 04.00 Z;
• FL285 - FL460.
Proposal ID : 71.085a Impl. Status: State(s) & Org. Comments:
13.
Project Name: FAIR-IT Free Route Airspace Italy, Phase 1
Description: To implement Free Route Airspace segmented approach for Milano, Roma and Brindisi UIR Mon-Fri 2100-0600 (2100-0500) + WE H24 above FL365: 1. RAD/ PTR (Profile tuning restriction)/ Night ATS Route/ Night DCT -
harmonization of activation/ suspension periods. 2. Night routes extension of availability. 3. New Night/ Weekend DCTs. 4. New reporting points to link DCTs with existing network. 5. New reporting points to be used only as COP between ACCs.
Objective: To further expand and harmonise the implementation of Free Route Airspace within Milano, Roma and Brindisi UIR.
Implemented 12 DEC 2013
Project Group: FAB BLUE MED
Project Category: Free Route Airspace
ITA
Originator(s): ITA
• New DCTs FL365+ and extension of availability at Weekend of existing NGT RTEs is valid FL365+.
• The use of UM731 (segment LUNAM-OSMAR) as bidirectional available during FAIR-IT periods/levels by RAD restriction.
• Phase 2 planned end of 2014.
Related proposals: • 71.085b • 71.086 • 71.087 • 71.088 • 71.089
- 27 -
European Route Network Improvement Plan (ERNIP) – Implementation Monitoring Monitoring Report AIRAC 1313 (12 December 2013 - 08 January 2014)
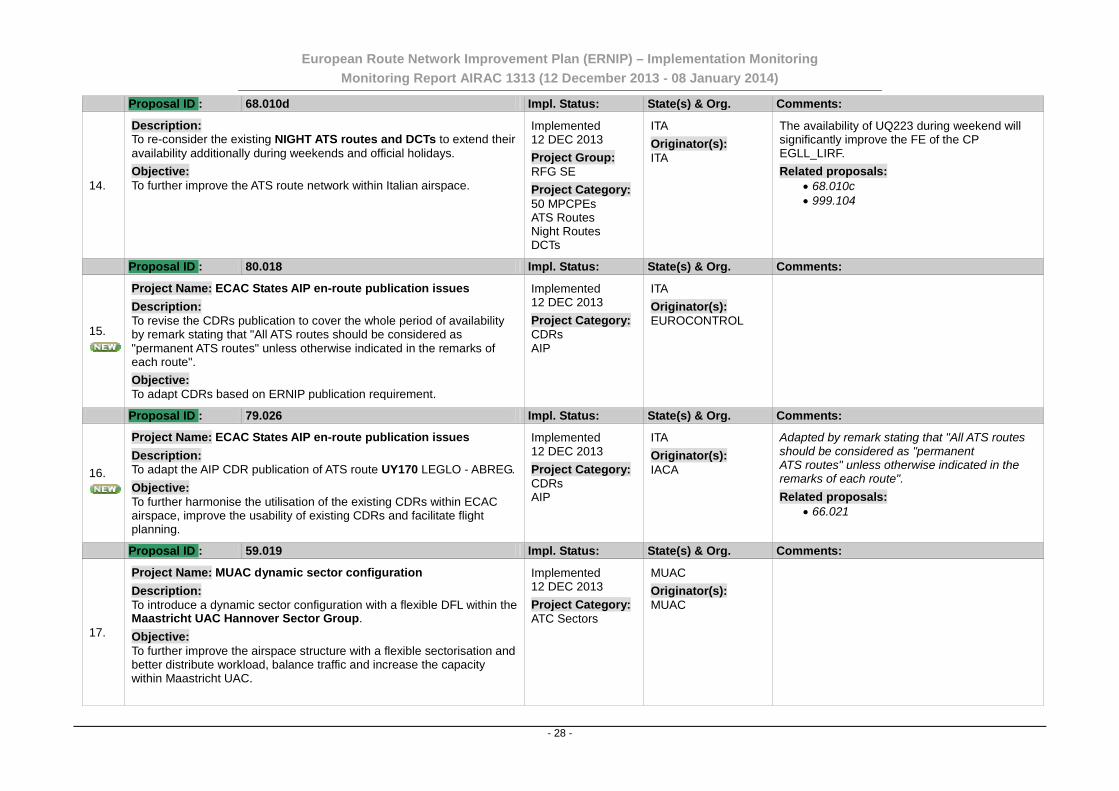
Proposal ID : 68.010d Impl. Status: State(s) & Org. Comments:
14.
Description: To re-consider the existing NIGHT ATS routes and DCTs to extend their availability additionally during weekends and official holidays.
Objective: To further improve the ATS route network within Italian airspace.
Implemented 12 DEC 2013
Project Group: RFG SE
Project Category: 50 MPCPEs ATS Routes Night Routes DCTs
ITA
Originator(s): ITA
The availability of UQ223 during weekend will significantly improve the FE of the CP EGLL_LIRF.
Related proposals: • 68.010c • 999.104
Proposal ID : 80.018 Impl. Status: State(s) & Org. Comments:
15.
Project Name: ECAC States AIP en-route publication issues
Description: To revise the CDRs publication to cover the whole period of availability by remark stating that "All ATS routes should be considered as "permanent ATS routes" unless otherwise indicated in the remarks of each route".
Objective: To adapt CDRs based on ERNIP publication requirement.
Implemented 12 DEC 2013
Project Category: CDRs AIP
ITA
Originator(s): EUROCONTROL
Proposal ID : 79.026 Impl. Status: State(s) & Org. Comments:
16.
Project Name: ECAC States AIP en-route publication issues
Description: To adapt the AIP CDR publication of ATS route UY170 LEGLO - ABREG.
Objective: To further harmonise the utilisation of the existing CDRs within ECAC airspace, improve the usability of existing CDRs and facilitate flight planning.
Implemented 12 DEC 2013
Project Category: CDRs AIP
ITA
Originator(s): IACA
Adapted by remark stating that "All ATS routes should be considered as "permanent ATS routes" unless otherwise indicated in the remarks of each route".
Related proposals: • 66.021
Proposal ID : 59.019 Impl. Status: State(s) & Org. Comments:
17.
Project Name: MUAC dynamic sector configuration
Description: To introduce a dynamic sector configuration with a flexible DFL within the Maastricht UAC Hannover Sector Group.
Objective: To further improve the airspace structure with a flexible sectorisation and better distribute workload, balance traffic and increase the capacity within Maastricht UAC.
Implemented 12 DEC 2013
Project Category: ATC Sectors
MUAC
Originator(s): MUAC
- 28 -
European Route Network Improvement Plan (ERNIP) – Implementation Monitoring Monitoring Report AIRAC 1313 (12 December 2013 - 08 January 2014)
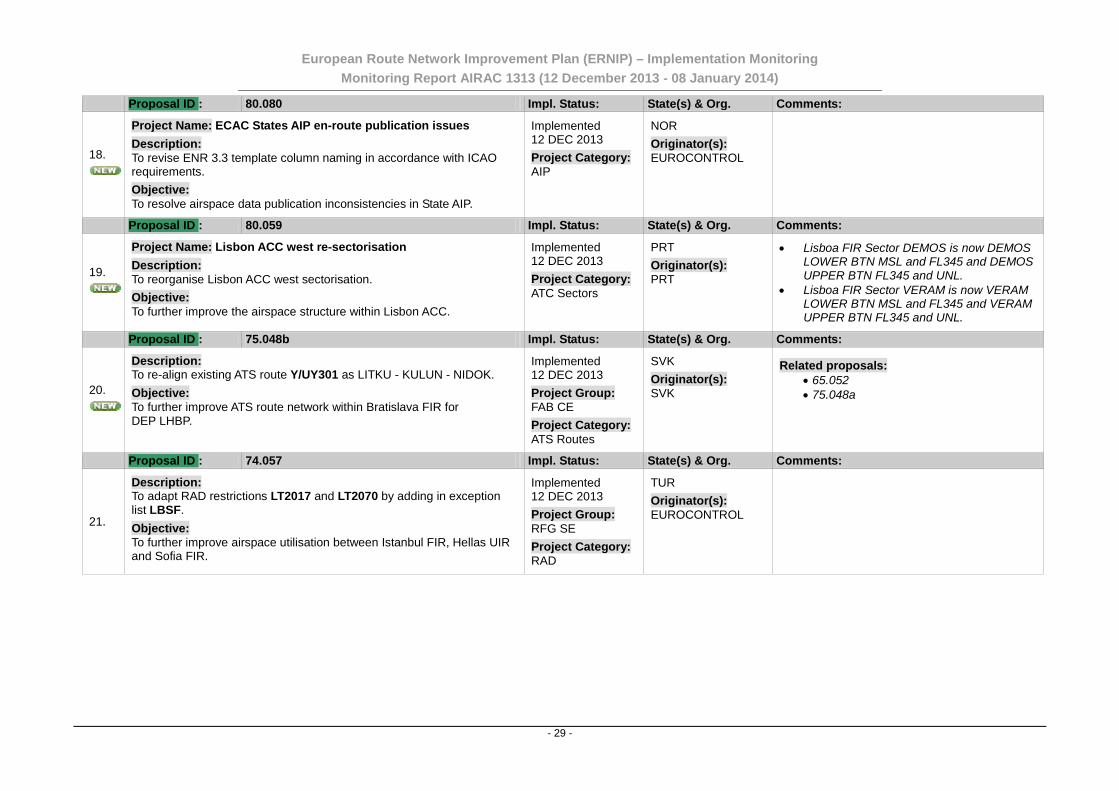
Proposal ID : 80.080 Impl. Status: State(s) & Org. Comments:
18.
Project Name: ECAC States AIP en-route publication issues
Description: To revise ENR 3.3 template column naming in accordance with ICAO requirements.
Objective: To resolve airspace data publication inconsistencies in State AIP.
Implemented 12 DEC 2013
Project Category: AIP
NOR
Originator(s): EUROCONTROL
Proposal ID : 80.059 Impl. Status: State(s) & Org. Comments:
19.
Project Name: Lisbon ACC west re-sectorisation
Description: To reorganise Lisbon ACC west sectorisation.
Objective: To further improve the airspace structure within Lisbon ACC.
Implemented 12 DEC 2013
Project Category: ATC Sectors
PRT
Originator(s): PRT
• Lisboa FIR Sector DEMOS is now DEMOS LOWER BTN MSL and FL345 and DEMOS UPPER BTN FL345 and UNL.
• Lisboa FIR Sector VERAM is now VERAM LOWER BTN MSL and FL345 and VERAM UPPER BTN FL345 and UNL.
Proposal ID : 75.048b Impl. Status: State(s) & Org. Comments:
20.
Description: To re-align existing ATS route Y/UY301 as LITKU - KULUN - NIDOK.
Objective: To further improve ATS route network within Bratislava FIR for DEP LHBP.
Implemented 12 DEC 2013
Project Group: FAB CE
Project Category: ATS Routes
SVK
Originator(s): SVK
Related proposals: • 65.052 • 75.048a
Proposal ID : 74.057 Impl. Status: State(s) & Org. Comments:
21.
Description: To adapt RAD restrictions LT2017 and LT2070 by adding in exception list LBSF.
Objective: To further improve airspace utilisation between Istanbul FIR, Hellas UIR and Sofia FIR.
Implemented 12 DEC 2013
Project Group: RFG SE
Project Category: RAD
TUR
Originator(s): EUROCONTROL
- 29 -
European Route Network Improvement Plan (ERNIP) – Implementation Monitoring Monitoring Report AIRAC 1313 (12 December 2013 - 08 January 2014)
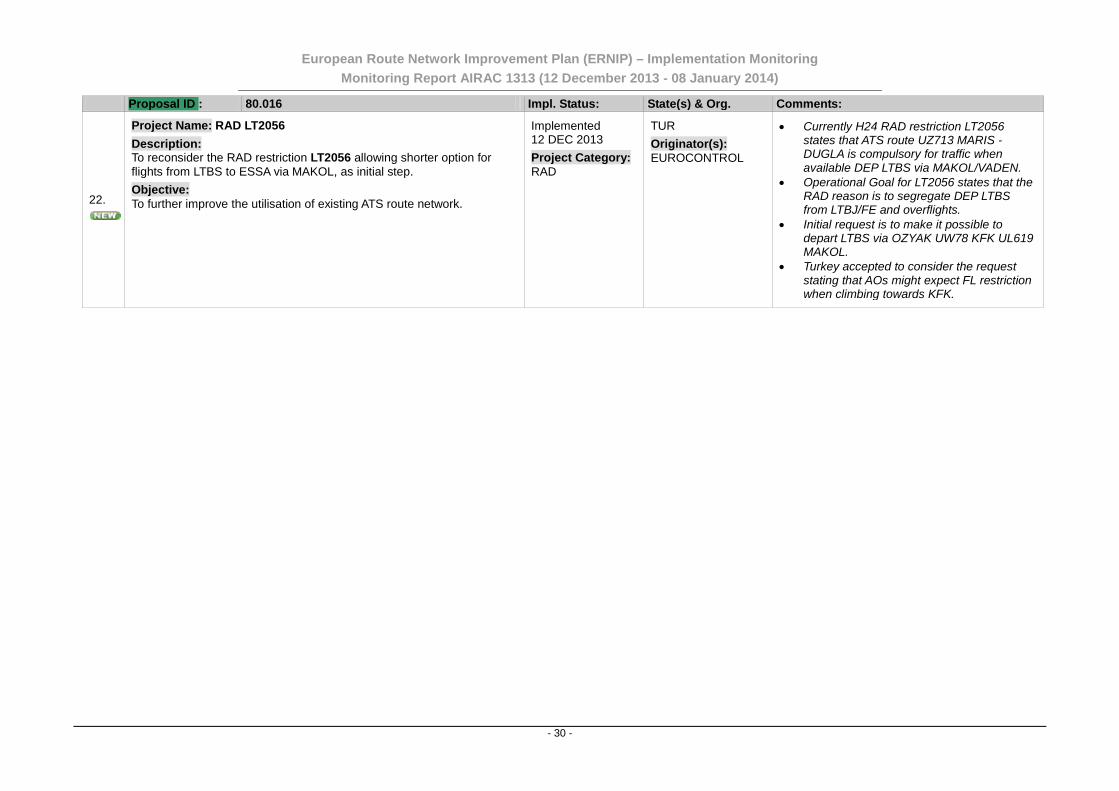
Proposal ID : 80.016 Impl. Status: State(s) & Org. Comments:
22.
Project Name: RAD LT2056
Description: To reconsider the RAD restriction LT2056 allowing shorter option for flights from LTBS to ESSA via MAKOL, as initial step.
Objective: To further improve the utilisation of existing ATS route network.
Implemented 12 DEC 2013
Project Category: RAD
TUR
Originator(s): EUROCONTROL
• Currently H24 RAD restriction LT2056 states that ATS route UZ713 MARIS - DUGLA is compulsory for traffic when available DEP LTBS via MAKOL/VADEN.
• Operational Goal for LT2056 states that the RAD reason is to segregate DEP LTBS from LTBJ/FE and overflights.
• Initial request is to make it possible to depart LTBS via OZYAK UW78 KFK UL619 MAKOL.
• Turkey accepted to consider the request stating that AOs might expect FL restriction when climbing towards KFK.
- 30 -
European Route Network Improvement Plan (ERNIP) – Implementation Monitoring Monitoring Report AIRAC 1313 (12 December 2013 - 08 January 2014)
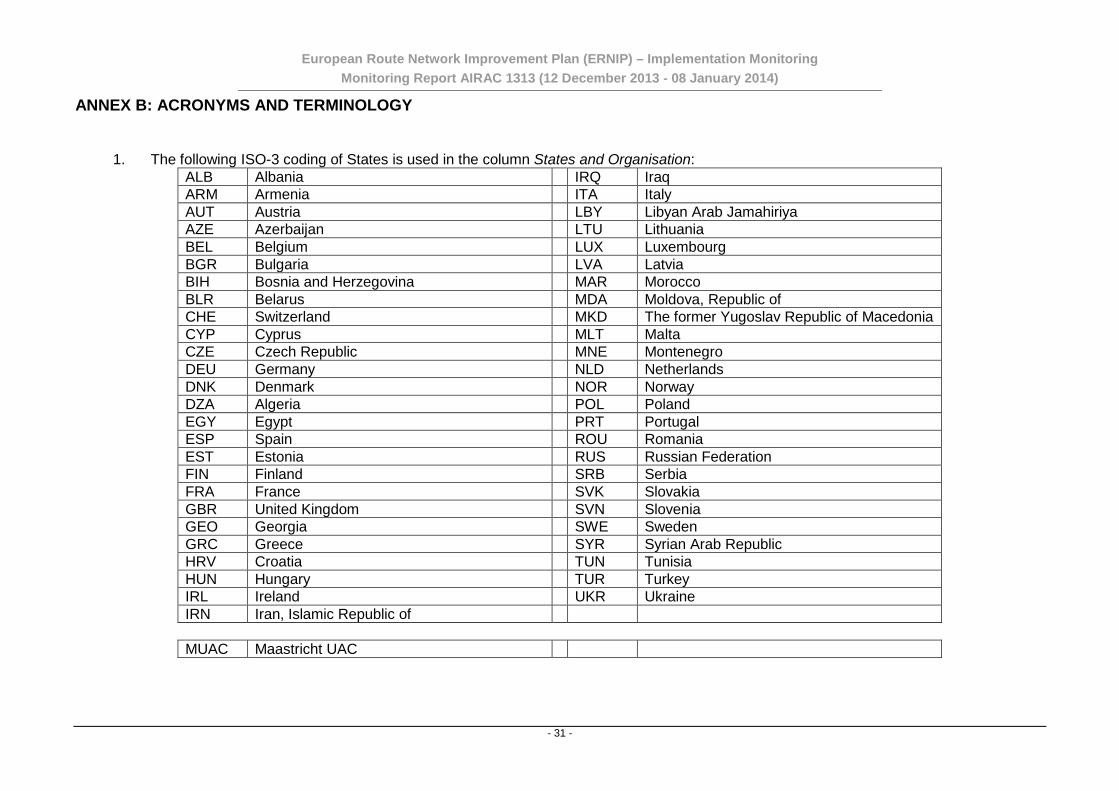
ANNEX B: ACRONYMS AND TERMINOLOGY
1. The following ISO-3 coding of States is used in the column States and Organisation: ALB Albania IRQ Iraq ARM Armenia ITA Italy AUT Austria LBY Libyan Arab Jamahiriya AZE Azerbaijan LTU Lithuania BEL Belgium LUX Luxembourg BGR Bulgaria LVA Latvia BIH Bosnia and Herzegovina MAR Morocco BLR Belarus MDA Moldova, Republic of CHE Switzerland MKD The former Yugoslav Republic of Macedonia CYP Cyprus MLT Malta CZE Czech Republic MNE Montenegro DEU Germany NLD Netherlands DNK Denmark NOR Norway DZA Algeria POL Poland EGY Egypt PRT Portugal ESP Spain ROU Romania EST Estonia RUS Russian Federation FIN Finland SRB Serbia FRA France SVK Slovakia GBR United Kingdom SVN Slovenia GEO Georgia SWE Sweden GRC Greece SYR Syrian Arab Republic HRV Croatia TUN Tunisia HUN Hungary TUR Turkey IRL Ireland UKR Ukraine IRN Iran, Islamic Republic of
MUAC Maastricht UAC
- 31 -
European Route Network Improvement Plan (ERNIP) – Implementation Monitoring Monitoring Report AIRAC 1313 (12 December 2013 - 08 January 2014)
2. BLUMED FAB, DANUBE FAB and FAB CE proposals referenced in proposal number box are coded with a unique identification number abbreviated as BM or DN or CE, respectively, following by four digits (XXXX) (example BM0001 or DN0001 or CE0001).
3. The content of each proposal is an indication of State’s intention to implement the relevant airspace improvement but don't represent a copy of any official publication. For the correctness and verification of the relevant aeronautical information consult official State AIP publication. The data from this document should not be used for operational purposes.
- 32 -

European Route Network Improvement Plan (ERNIP) – Implementation Monitoring Monitoring Report AIRAC 1313 (12 December 2013 - 08 January 2014)
- 33 -