Embed Size (px)
Citation preview

Monitoring mitNagios (IPMI-Plugin)Werner FischerTechnology Specialist Thomas-Krenn.AG
Thomas-Krenn Trainings-Road-Show November 2009Berlin – Köln – Frankfurt – Stuttgart – Wien
Seite 2/18
Agenda
1) Nagios Grundlagen
2) IPMI Grundlagen
3) Nagios IPMI Sensor Monitoring Plugin
4) Live Demo

Seite 3/18
1) Nagios Grundlagen
• Warum Monitoring?
– zeitnahe Benachrichtigung
– Erkennung drohenderProbleme
– Gesamtüberblicküber das Netzwerk
– vereinfachte Fehlersuche
– Erkennung vonlangfristigen Trends
– Datensammlung fürSLA Überwachung
Foto: Hanseat / aboutpixel.de
Foto: Konstantin Gastmann / aboutpixel.de

Seite 4/18
1) Nagios Grundlagen
• Nagios Überblick
– Überwachungssystemfür Devices und Dienste
– Open Source (GPLv2)
– Aktives Polling durchgeplante Abfragen
– Webinterface für Präsentationund Reporting
– Flexibles Benachrichtigungs-system

Seite 5/18
1) Nagios Grundlagen
• Nagios Grundaufbau
Nagios Daemon
– zentrales Framework
– Konfiguration
– Webinterface
– Benachrichtigungen
Nagios Plugins
– Überwachungsaufgabe
– StatusmeldunungOK, WARNING,CRITICAL
– Zusatzinfos: Performancedaten

Seite 6/18
1) Nagios Grundlagen
• Mögliche Überwachungen
– Netzdienste• alle gängigen Dienste wie
DNS, FTP, HTTP, LDAP,
SMTP, SSH, ...
• TCP und UDP Ports
– Betriebssysteme• CPU, Memory, Disk
Auslastung
• Prozesse und Dienste
– Hardware• IPMI
• SNMP
• Umweltmonitoring
– Weiteres• Eigene Plugins (z.B.
Shellskript, Perl, Java,
Python, .NET, usw.)

Seite 7/18
2) IPMI Grundlagen
• Intelligent Platform Management Interface
– Überwachung der Hardware(System-Temperaturen, Lüfter, Spannungen, etc.)
– Steuerung der Hardware(Ein/Aus-Schalten des Servers)
– Dokumentation(System Event Log)
• IPMI Aufbau
– BMC (Baseboard Management Controller)
– Sensoren (Sensor Data Record Repository, SDR)
– Field Replaceable Unit (FRU) Information

Seite 8/18
2) IPMI Grundlagen
• IPMI Implementierung
– IPMI Chips sind teilweise mit einer zusätzlichenKVM over IP Funktionalität implementiert(Stichwort „Full Remote Management“)
– Beispiel: Winbond WPCM450 Chip bei Supermicro Boards
Seite 9/18
2) IPMI Grundlagen
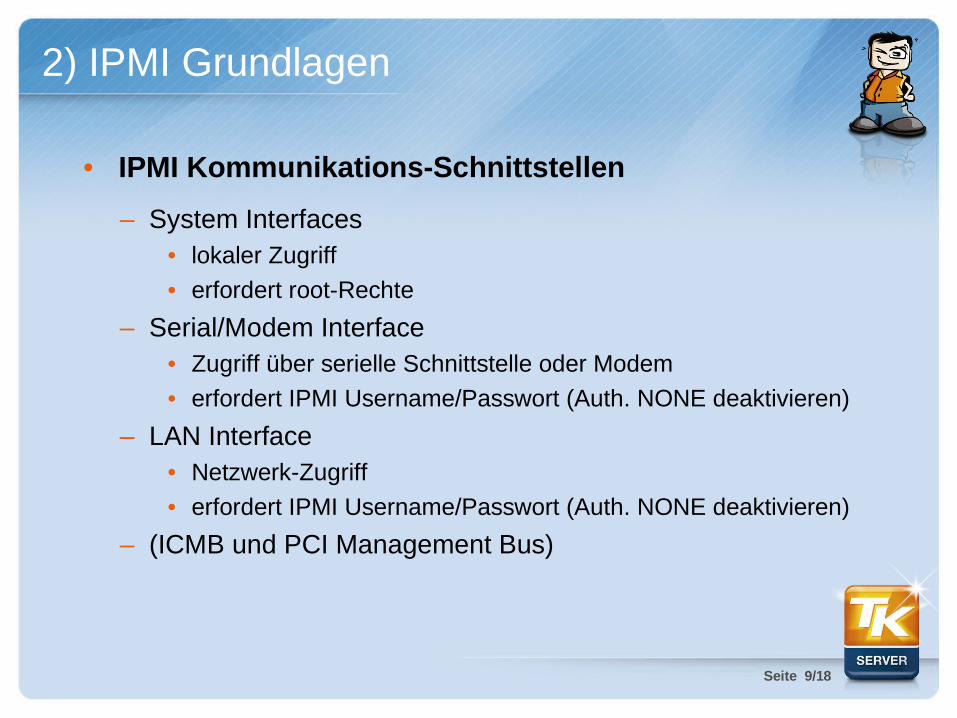
• IPMI Kommunikations-Schnittstellen
– System Interfaces• lokaler Zugriff
• erfordert root-Rechte
– Serial/Modem Interface• Zugriff über serielle Schnittstelle oder Modem
• erfordert IPMI Username/Passwort (Auth. NONE deaktivieren)
– LAN Interface• Netzwerk-Zugriff
• erfordert IPMI Username/Passwort (Auth. NONE deaktivieren)
– (ICMB und PCI Management Bus)

Seite 10/18
2) IPMI Grundlagen
• Cannel Privilege Levels
• Level 'User' für Nagios-Abfrage verwenden
Privilege Level Beschreibung
Callback Niedrigster Privilege Level.Erlaubt nur die Initiierung eines Callbacks.
User Nur IPMI 'begin' Kommandos (Abfragen von Sensoren) sind erlaubt.Veränderung der BMC Konfiguration, Schreiben von Daten zum BMC, Ausführen von Resets/Power-On/Power-Off) sind hier nicht möglich.
Operator Alle BMC Kommandos bis auf jene zur Änderung der Out-Of-Band Interfaces sind erlaubt.
Administrator Alle BMC Kommandos sind erlaubt.

Seite 11/18
2) IPMI Grundlagen
• IPMI Konfiguration LAN Interface[root@sr2500 ~]# ipmitool lan print 1Set in Progress : Set CompleteAuth Type Support : NONE MD5 PASSWORD Auth Type Enable : Callback : : User : : Operator : : Admin : MD5 : OEM : IP Address Source : Static AddressIP Address : 192.168.1.211Subnet Mask : 255.255.255.0MAC Address : 00:0e:0c:ea:92:a2SNMP Community String : IP Header : TTL=0x40 Flags=0x40 Precedence=0x00 TOS=0x10BMC ARP Control : ARP Responses Enabled, Gratuitous ARP DisabledGratituous ARP Intrvl : 2.0 secondsDefault Gateway IP : 192.168.1.254Default Gateway MAC : 00:0e:0c:aa:8e:13Backup Gateway IP : 0.0.0.0Backup Gateway MAC : 00:00:00:00:00:00RMCP+ Cipher Suites : NoneCipher Suite Priv Max : XXXXXXXXXXXXXXX : X=Cipher Suite Unused : c=CALLBACK : u=USER : o=OPERATOR : a=ADMIN : O=OEM[root@sr2500 ~]#
[root@sr2500 ~]# ipmitool lan print 1Set in Progress : Set CompleteAuth Type Support : NONE MD5 PASSWORD Auth Type Enable : Callback : : User : : Operator : : Admin : MD5 : OEM : IP Address Source : Static AddressIP Address : 192.168.1.211Subnet Mask : 255.255.255.0MAC Address : 00:0e:0c:ea:92:a2SNMP Community String : IP Header : TTL=0x40 Flags=0x40 Precedence=0x00 TOS=0x10BMC ARP Control : ARP Responses Enabled, Gratuitous ARP DisabledGratituous ARP Intrvl : 2.0 secondsDefault Gateway IP : 192.168.1.254Default Gateway MAC : 00:0e:0c:aa:8e:13Backup Gateway IP : 0.0.0.0Backup Gateway MAC : 00:00:00:00:00:00RMCP+ Cipher Suites : NoneCipher Suite Priv Max : XXXXXXXXXXXXXXX : X=Cipher Suite Unused : c=CALLBACK : u=USER : o=OPERATOR : a=ADMIN : O=OEM[root@sr2500 ~]#

Seite 12/18
2) IPMI Grundlagen
• Abfragebeispiel mit ipmitool (1/3)[root@testserver ~]# ipmitool sdr type Fan Fan 1 | 50h | ok | 29.1 | 7955 RPMFan 2 | 51h | ok | 29.2 | 8858 RPMFan 3 | 52h | ok | 29.3 | 7826 RPMFan 4 | 53h | ok | 29.4 | 8858 RPMFan 5 | 54h | ok | 29.5 | 10168 RPMFan 6 | 55h | ok | 29.6 | 9424 RPMFan 1 Present | 60h | ok | 29.1 | Device PresentFan 2 Present | 61h | ok | 29.2 | Device PresentFan 3 Present | 62h | ok | 29.3 | Device PresentFan 4 Present | 63h | ok | 29.4 | Device PresentFan 5 Present | 64h | ok | 29.5 | Device PresentFan 6 Present | 65h | ok | 29.6 | Device PresentFan Redundancy | 6Fh | ok | 29.1 | Fully Redundant[root@testserver ~]#
[root@testserver ~]# ipmitool sdr type Fan Fan 1 | 50h | ok | 29.1 | 7955 RPMFan 2 | 51h | ok | 29.2 | 8858 RPMFan 3 | 52h | ok | 29.3 | 7826 RPMFan 4 | 53h | ok | 29.4 | 8858 RPMFan 5 | 54h | ok | 29.5 | 10168 RPMFan 6 | 55h | ok | 29.6 | 9424 RPMFan 1 Present | 60h | ok | 29.1 | Device PresentFan 2 Present | 61h | ok | 29.2 | Device PresentFan 3 Present | 62h | ok | 29.3 | Device PresentFan 4 Present | 63h | ok | 29.4 | Device PresentFan 5 Present | 64h | ok | 29.5 | Device PresentFan 6 Present | 65h | ok | 29.6 | Device PresentFan Redundancy | 6Fh | ok | 29.1 | Fully Redundant[root@testserver ~]#

Seite 13/18
2) IPMI Grundlagen
• Abfragebeispiel mit ipmitool (2/3)[root@testserver ~]# ipmitool sdr type OtherPS1 +12V Power | 7Ch | ok | 10.1 | 80 WattsPS2 +12V Power | 7Dh | ok | 10.2 | 104 Watts[root@testserver ~]# ipmitool sdr type Other vSensor ID : PS1 +12V Power (0x7c) Entity ID : 10.1 (Power Supply) Sensor Type (Analog) : Other Sensor Reading : 80 (+/ 6) Watts Status : ok Nominal Reading : 372.000 Normal Minimum : 100.000 Normal Maximum : 744.000 Upper critical : 840.000 Upper noncritical : 792.000 Positive Hysteresis : 8.000 Negative Hysteresis : 8.000 Minimum sensor range : Unspecified Maximum sensor range : Unspecified Event Message Control : Perthreshold Readable Thresholds : unc ucr Settable Thresholds : unc ucr Threshold Read Mask : unc ucr Assertion Events : Assertions Enabled : unc+ ucr+ Deassertions Enabled : unc+ ucr+ [...][root@testserver ~]#
[root@testserver ~]# ipmitool sdr type OtherPS1 +12V Power | 7Ch | ok | 10.1 | 80 WattsPS2 +12V Power | 7Dh | ok | 10.2 | 104 Watts[root@testserver ~]# ipmitool sdr type Other vSensor ID : PS1 +12V Power (0x7c) Entity ID : 10.1 (Power Supply) Sensor Type (Analog) : Other Sensor Reading : 80 (+/ 6) Watts Status : ok Nominal Reading : 372.000 Normal Minimum : 100.000 Normal Maximum : 744.000 Upper critical : 840.000 Upper noncritical : 792.000 Positive Hysteresis : 8.000 Negative Hysteresis : 8.000 Minimum sensor range : Unspecified Maximum sensor range : Unspecified Event Message Control : Perthreshold Readable Thresholds : unc ucr Settable Thresholds : unc ucr Threshold Read Mask : unc ucr Assertion Events : Assertions Enabled : unc+ ucr+ Deassertions Enabled : unc+ ucr+ [...][root@testserver ~]#
Seite 14/18
2) IPMI Grundlagen
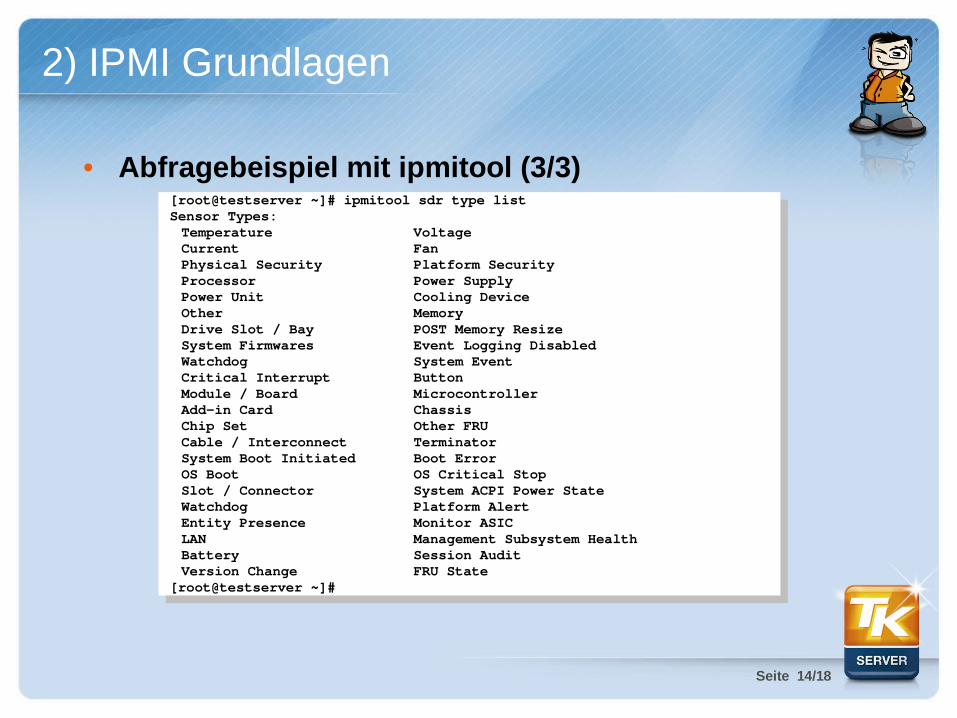
• Abfragebeispiel mit ipmitool (3/3)[root@testserver ~]# ipmitool sdr type listSensor Types:Temperature Voltage Current Fan Physical Security Platform Security Processor Power Supply Power Unit Cooling Device Other Memory Drive Slot / Bay POST Memory Resize System Firmwares Event Logging Disabled Watchdog System Event Critical Interrupt Button Module / Board Microcontroller Addin Card Chassis Chip Set Other FRU Cable / Interconnect Terminator System Boot Initiated Boot Error OS Boot OS Critical Stop Slot / Connector System ACPI Power State Watchdog Platform Alert Entity Presence Monitor ASIC LAN Management Subsystem HealthBattery Session Audit Version Change FRU State
[root@testserver ~]#
[root@testserver ~]# ipmitool sdr type listSensor Types:Temperature Voltage Current Fan Physical Security Platform Security Processor Power Supply Power Unit Cooling Device Other Memory Drive Slot / Bay POST Memory Resize System Firmwares Event Logging Disabled Watchdog System Event Critical Interrupt Button Module / Board Microcontroller Addin Card Chassis Chip Set Other FRU Cable / Interconnect Terminator System Boot Initiated Boot Error OS Boot OS Critical Stop Slot / Connector System ACPI Power State Watchdog Platform Alert Entity Presence Monitor ASIC LAN Management Subsystem HealthBattery Session Audit Version Change FRU State
[root@testserver ~]#
Seite 15/18
3) Nagios IPMI Sensor Monitoring Plugin
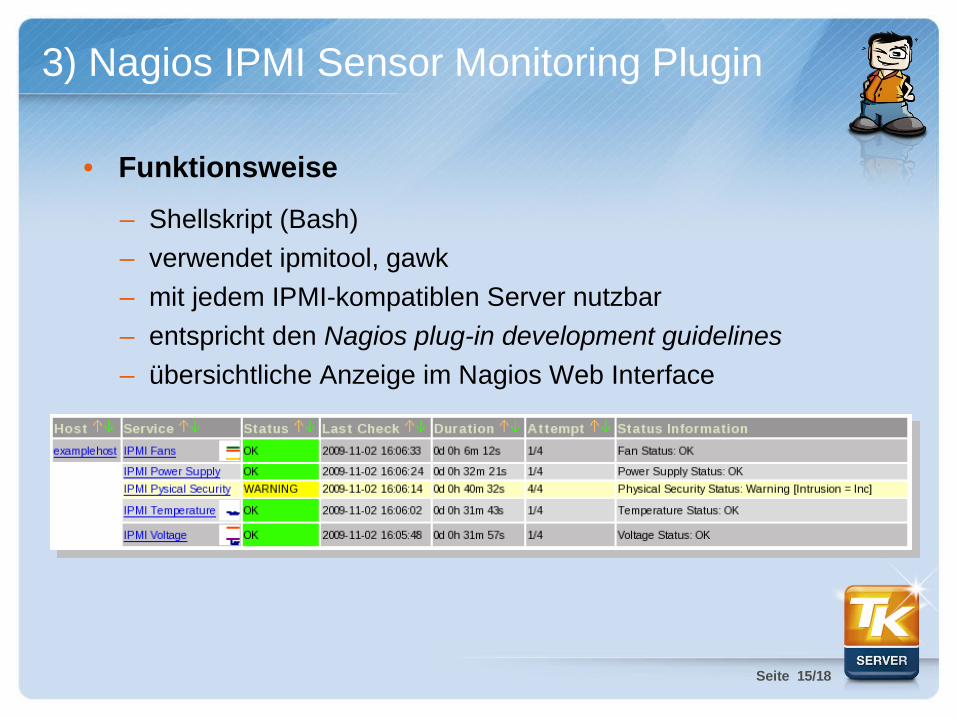
• Funktionsweise
– Shellskript (Bash)
– verwendet ipmitool, gawk
– mit jedem IPMI-kompatiblen Server nutzbar
– entspricht den Nagios plug-in development guidelines
– übersichtliche Anzeige im Nagios Web Interface
Seite 16/18
3) Nagios IPMI Sensor Monitoring Plugin
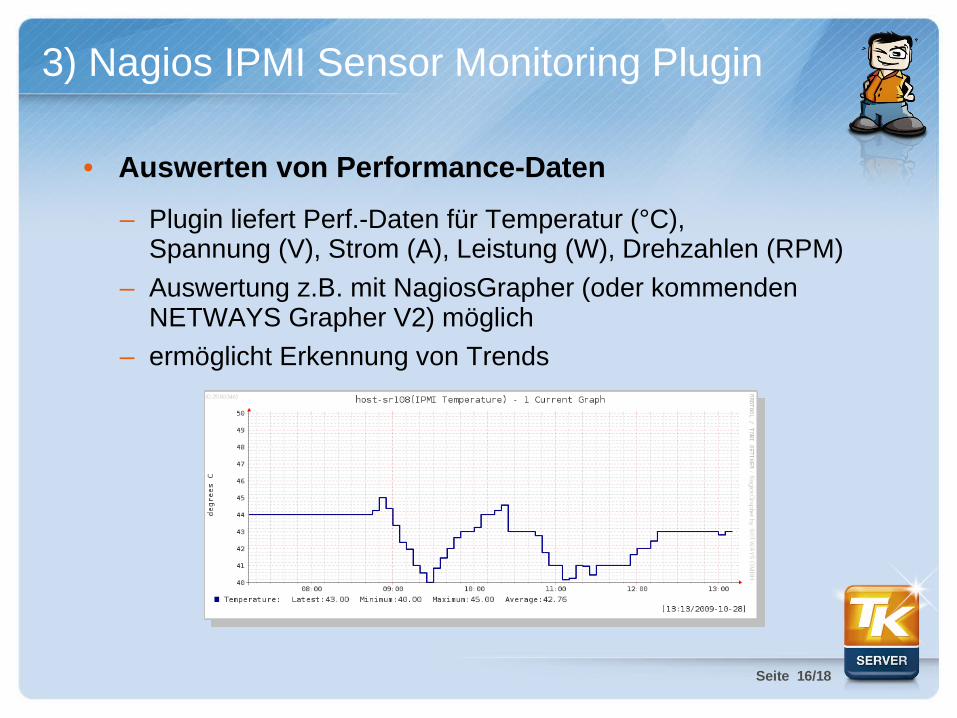
• Auswerten von Performance-Daten
– Plugin liefert Perf.-Daten für Temperatur (°C),Spannung (V), Strom (A), Leistung (W), Drehzahlen (RPM)
– Auswertung z.B. mit NagiosGrapher (oder kommenden NETWAYS Grapher V2) möglich
– ermöglicht Erkennung von Trends

Seite 17/18
3) Nagios IPMI Sensor Monitoring Plugin
• Lizenz und Entwicklung
– Open Source, GPLv3
– Entwicklung durch Thomas-Krenn.AG
– Beratung durch NETWAYS GmbH (Michael Streb)
– bereits erste Beiträge durch die Community:• localhost.patch für lokales Abfragen (NRPE)
• Tests auf weiterer Hardware: IBM, HP, Dell, Sun, ...
– Mailingliste geplant
– Download und Infos:www.thomas-krenn.com/de/wiki/
IPMI_Sensor_Monitoring_Plugin
Seite 18/18
4) Live Demo
• zeigt den konkreten Einsatz von
– Nagios 3.0.6 unter Debian Lenny
– IPMI Sensor Monitoring Plugin• überwacht SR108 Low Noise Server
(mit Supermicro X8DT3-F Mainboard)


![Nagios core vs. nagios xi presentation power point.pptx [diperbaiki]](https://img.dokumen.tips/doc/110x75/58a44c4b1a28ab55068b48bb/nagios-core-vs-nagios-xi-presentation-power-pointpptx-diperbaiki.jpg)
