Embed Size (px)
Citation preview

Monitoring Coal Mine Seismicity with an Automated Wireless Digital Strong-Motion Network
Peter Swanson, Research Geophysicist NIOSH - Spokane Research Laboratory
Spokane, WA
Collin Stewart, Technical Services Bowie Resources LLC
Paonia, CO
Wendell Koontz, Senior Mine Geologist Mountain Coal Company
Somerset, CO
ABSTRACT
A seismic monitoring network has been installed in western Colorado (USA) in the vicinity of three underground coal mines to (i) distinguish and characterize seismic activity as either mining related or naturally occurring, (ii) implement a real-time event monitoring and notification tool, and (iii) collect data for use in research studies aimed at quantifying impacts from mining-related and natural seismicity. These potential impacts include dynamic rock mass failures such as coal bumps as well as strong shaking in the vicinity of critical structures such as impoundment dams, reservoirs, mine seals, mine openings, and steep slopes. Examples of two damaging seismic events are presented and the mining and geologic factors attending these dynamic failures are described.
BACKGROUND
Seismicity is a common feature of underground mining in geologic environments containing brittle rocks. Seismic events are transient releases of elastic energy that result in seismic waves being recorded at a distance. Processes that produce seismic events include fracturing of strata during caving, crushing of pillars, slip on bedding plane interfaces, joints and faults, shear-rupture, rock falls and blasting. Therefore, seismicity is expected at all mining operations, at some scale, since the operation involves breakage and removal of material. Experience in western U.S. coal mines shows that the largest dynamic failures can produce seismic events with magnitudes in the range of 2-3 with infrequent occurrences up to 4+ (1). Frequently, events with magnitudes up to 2 to 3 occur without any noticeable impact to mining operations or without even an awareness that such an event has occurred. Such events may occur in old workings or in the inaccessible gob areas of current workings where large-scale ground movements attend caving and subsidence.
North Fork Valley area (CO) coal companies Bowie Resources LLC and Mountain Coal Company have joined together with NIOSH to develop a digital seismic monitoring network to collect background data on mining-related seismic activity and to implement a real-time hazard monitoring tool. In addition to the mine-safety technology transfer activity, NIOSH is participating in this project to gather data for use in its mine safety research program. Data collected with this network is being used to (i) identify and characterize dynamic failure mechanisms of potentially hazardous rock mass failures (e.g. coal bumps), (ii) assess the
usefulness of seismic monitoring as an indicator of mine design performance, and (iii) determine empirical relations between levels of ground shaking, seismic event magnitude, and distance to the seismic sources. The latter can be used to help evaluate the potential responses of surface and underground structures to shaking and identify minimum distances between the seismic activity and these structures to keep levels of shaking below key damage thresholds.
This paper describes the seismic network, its features for user access to data, and then gives two examples of seismic events resulting in some damage to mine workings.
Setting
The North Fork Valley (NFV) longwall coal mines are located in the rugged canyon-mesa terrain of western Colorado (Figure 1). Vertical relief over the span of a single mine is as much as ~ 1 km (3300 ft). The major geologic units present are representative of the Upper Cretaceous Mesa Verde Formation and include six coal seams with thickness from 2 to 6 m (6 ft to 20 ft). Bowie and West Elk longwalls are currently operating in the B seam where overburden extends up to ~ 0.7 km (2400 ft). Competent sandstone units are present with variable thickness and distance above and below the B seam. Yearly production from all NFV coal mines exceeds 17 million tons per year.
NORTH FORK VALLEY SEISMIC NETWORK
Seismic stations
Two groups of five triaxial strong-motion seismometers were centered around the current and/or future workings of the Bowie and West Elk mines (Figure 2) providing coverage of an area of approximately 250 square kilometers (100 sq. miles). Strong-motion seismographs, or accelerographs, are specifically designed to measure ground motions near seismic sources that are strong enough to potentially impact the integrity of engineered structures. With the nominal 24-bit resolution of the internal data recorders (Figure 3; Kinemetrics Altus K2 with internal EpiSensor), background vibrations in the micro-g (10-6) range can be resolved. A fourth channel records an additional co-located 1-Hz moving-coil (L4-C) seismometer, providing higher sensitivity to smaller and/or more distant seismic events. The data recorders

are configured to (i) continuously stream data at 100 samples per second, and (ii) locally trigger and save event data to compact flash cards providing backup in case of telemetry failure. Time synchronization is achieved at each digitizing and recording unit using GPS receivers.
Station sites were selected to provide suitable azimuthal coverage of the mining areas, a workable telemetry path, concealment from view, and, wherever possible, access to bedrock. Separate instrument and power vaults were installed by digging shallow holes and installing vertically-oriented corrugated steel culverts with locking lids. In the instrument vault, a flat concrete floor was poured onto exposed bedrock, onto which the strong-motion seismometer is bolted. Remote power sources were constructed with photovoltaic panels and deep-cycle batteries. Installation of the initial five stations at Bowie was completed in October 2005 with addition of West Elk stations in 2006. Automation of event processing began in May 2007. Figure 1. Location of North Fork Valley mining region.
Figure 2. NFV seismic monitoring network. Stations north and south of the North Fork River are centered on Bowie
and West Elk workings, respectively.
Figure 3. Self-contained strong-motion recording unit.
1 Mention of specific products or manufacturers does not imply endorsement by the National Institute of Occupational Safety and Health.
Data communications
License-free 900-MHz spread-spectrum radios equipped with 10dB directional Yagi antennas are used to communicate with, and transfer data from, the strong-motion seismometers. The ten remote instrument sites are connected in four separate radio subnets operating in a bandwidth-sharing time-division multiple-access (TDMA) mode. Radio interference issues have been experienced periodically with other nearby 900-MHz data-comm networks that are used for ventilation and methane drainage drillhole monitoring. The interference has been mitigated by appropriate antenna selection, positioning and RF power level adjustments.
Continuous digital seismic waveform data is sent from each station to a central in-town site equipped with a DSL Internet connection (Figure 4). A dedicated server demultiplexes the serial data from each radio subnet and converts it to TCP/IP data streams. The serial/IP data network allows complete control over the instruments from distant Internet-connected user locations.
Figure 4. Serial-IP communications network.
The initial data acquisition arrangement transmitted data directly across the Internet for processing at remote locations. Reliability of this method was discovered to be, in part, a function of the ISP choice. Subsequently, as a guard against Internet-related impacts to the time-critical data processing streams, the seismic waveform data collection and processing were moved to the radio reception site and then mirrored, with suitable buffering times, to remote locations.
Data Pr ocessing
A large portion of the software for data collection, processing, analysis and display is based on the U.S. Geological Survey’s (USGS) Earthworm system (2). The freely available, open-source, software is configured to automatically detect, process, archive and analyze seismic events from numerous types of seismic sensors and make the raw data and processed results available over a computer network and the Internet.
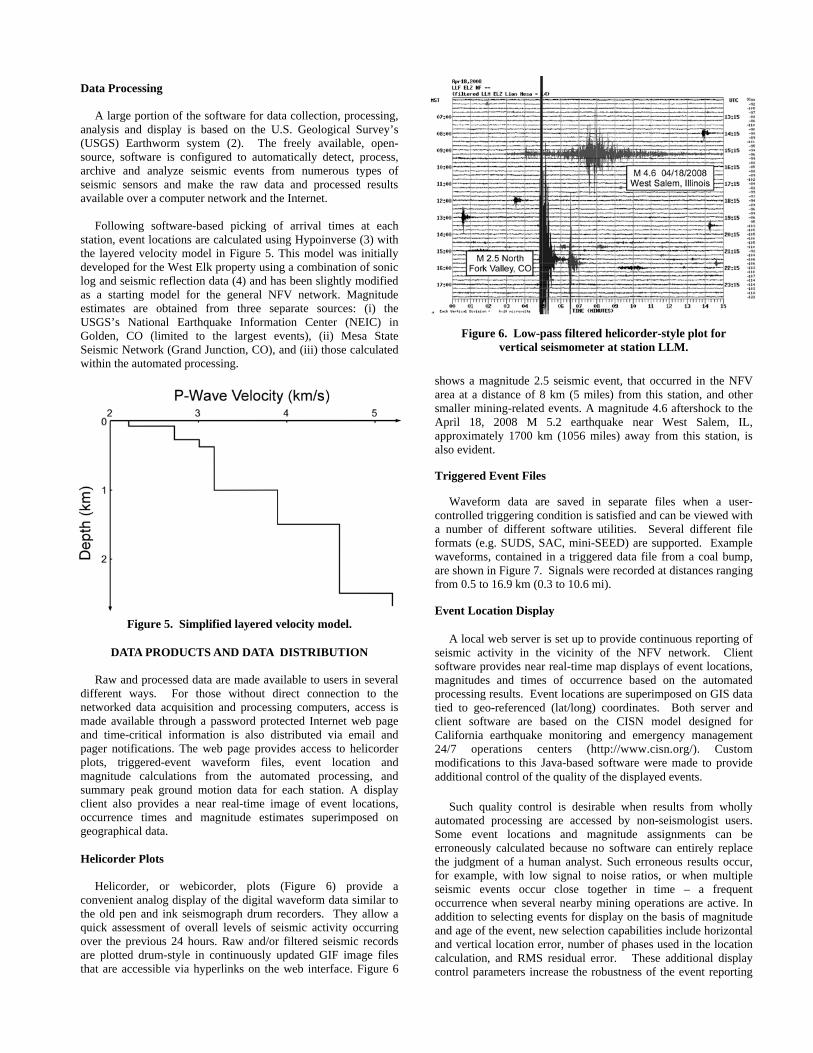
Following software-based picking of arrival times at each station, event locations are calculated using Hypoinverse (3) with the layered velocity model in Figure 5. This model was initially developed for the West Elk property using a combination of sonic log and seismic reflection data (4) and has been slightly modified as a starting model for the general NFV network. Magnitude estimates are obtained from three separate sources: (i) the USGS’s National Earthquake Information Center (NEIC) in Golden, CO (limited to the largest events), (ii) Mesa State Seismic Network (Grand Junction, CO), and (iii) those calculated within the automated processing.
Figure 5. Simplified layered velocity model.
DATA PRODUCTS AND DATA DISTRIBUTION
Raw and processed data are made available to users in several different ways. For those without direct connection to the networked data acquisition and processing computers, access is made available through a password protected Internet web page and time-critical information is also distributed via email and pager notifications. The web page provides access to helicorder plots, triggered-event waveform files, event location and magnitude calculations from the automated processing, and summary peak ground motion data for each station. A display client also provides a near real-time image of event locations, occurrence times and magnitude estimates superimposed on geographical data.
Helicorder Plots
Helicorder, or webicorder, plots (Figure 6) provide a convenient analog display of the digital waveform data similar to the old pen and ink seismograph drum recorders. They allow a quick assessment of overall levels of seismic activity occurring over the previous 24 hours. Raw and/or filtered seismic records are plotted drum-style in continuously updated GIF image files that are accessible via hyperlinks on the web interface. Figure 6
shows a magnitude 2.5 seismic event, that occurred in the NFV area at a distance of 8 km (5 miles) from this station, and other smaller mining-related events. A magnitude 4.6 aftershock to the April 18, 2008 M 5.2 earthquake near West Salem, IL, approximately 1700 km (1056 miles) away from this station, is also evident.
Figure 6. Low-pass filtered helicorder-style plot for vertical seismometer at station LLM.
Triggered Event Files
Waveform data are saved in separate files when a user-controlled triggering condition is satisfied and can be viewed with a number of different software utilities. Several different file formats (e.g. SUDS, SAC, mini-SEED) are supported. Example waveforms, contained in a triggered data file from a coal bump, are shown in Figure 7. Signals were recorded at distances ranging from 0.5 to 16.9 km (0.3 to 10.6 mi).
Event Location Display
A local web server is set up to provide continuous reporting of seismic activity in the vicinity of the NFV network. Client software provides near real-time map displays of event locations, magnitudes and times of occurrence based on the automated processing results. Event locations are superimposed on GIS data tied to geo-referenced (lat/long) coordinates. Both server and client software are based on the CISN model designed for California earthquake monitoring and emergency management 24/7 operations centers (http://www.cisn.org/). Custom modifications to this Java-based software were made to provide additional control of the quality of the displayed events.
Such quality control is desirable when results from wholly automated processing are accessed by non-seismologist users. Some event locations and magnitude assignments can be erroneously calculated because no software can entirely replace the judgment of a human analyst. Such erroneous results occur, for example, with low signal to noise ratios, or when multiple seismic events occur close together in time – a frequent occurrence when several nearby mining operations are active. In addition to selecting events for display on the basis of magnitude and age of the event, new selection capabilities include horizontal and vertical location error, number of phases used in the location calculation, and RMS residual error. These additional display control parameters increase the robustness of the event reporting

and reduce the display of poorly constrained events when operating under wholly automated processing conditions.
Figure 7. Triggered waveform file for a coal bump (M 2.9) observed on vertical component velocity seismograms.
Email and Pager Notifications
Email and paging provides timely notice of events of special interest. Emails are used to notify users when specified levels of acceleration are met or exceeded at a given station. This notice can be used to prompt inspection of critical structures or initiate other actions. In practice, it has been found useful, as a simple awareness measure, to set the threshold lower than any critical, or actionable, level in order to generate a stream of email that is proportional to the rate of large-event seismic activity. This also provides periodic confirmation that the notification system is working as intended.
When one is not readily reachable by email, a second system email module is used to send messages to a nationwide paging service. In addition to acceleration thresholds, additional criteria for this type of notification are satisfied when an event with a
minimum magnitude occurs within a certain distance of a given station. Individual users can customize their own notification criteria by specifying values for acceleration threshold, minimum magnitude, distance from stations and station names.
RESULTS AND DISCUSSION
Local Network Results vs USGS/NEIC Locations
Event locations of a few of the largest events calculated by the USGS/NEIC are compared with local NFV network results. Figure 8 shows locations of six events, occurring between May and Nov. 2007, with magnitudes ranging between 2.5 and 3.4. NEIC locations were calculated using data from available regional network stations and a generic global earth velocity model (5). Event locations based on the local network data coincide closely with areas of mining activity underway at those times. The average difference between the two calculated locations is 12.2 km (3.7 mi).
Figure 8. Comparison of event locations reported by NEIC/USGS (filled squares) with those calculated using
local NFV network data (circles).
Figure 8 also shows locations of eight naturally occurring earthquakes near Mt. Lamborn, one of several post-Laramide volcanic remnants in the area. With magnitudes ranging between 1.5 and 2.4, these events were too small to be reported by the NEIC. They occurred between Oct 19, 2007 and Jan 15, 2008 and continue to occur periodically in this area at an estimated depth of ~ 4 km (2.5 mi).
Mining-Induced Events vs Natural Earthquakes
The events near Mt. Lamborn (Figure 8) provide an opportunity to contrast seismic signatures of mining-related events with naturally occurring earthquakes. By comparing signals at identical seismic stations, the influences of any differing instrument characteristics and local siting conditions are eliminated. Examples of three-component triaxial acceleration waveform data (vertical, north, east) recorded at station WTM are shown in Figure 9 for a mining-related event and a natural earthquake. The upper three traces were produced by a magnitude 2.2 non-damaging event in the vicinity of the longwall at West Elk (Jan. 26, 2008,15:36 UTC) and the lower three traces, recorded at the same station, were produced by an event near Mt. Lamborn (Jan 13, 13:05 UTC) with magnitude 2.4. The distances between the sources and station WTM for these two events are approximately 14 and 19 km, respectively. Similar results are

observed when comparing the other Mt. Lamborn earthquakes to other mining-induced events recorded at these same distances.
Several notable differences in waveform character are obvious from Figure 9. The Mt. Lamborn event exhibits a classic earthquake signature with abrupt P-wave arrival on the vertical component Z, followed by a sharp, later arriving, S-wave pulse on the horizontal components N and E. It clearly illustrates why arrival times of P waves are typically picked on the vertical component and S waves are picked on the horizontals. The waveform signature of the mining-related event appears quite different: (i) the demarcation of P and S phases is not nearly as well defined, (ii) there appear to be several additional phases present, or complexity that is absent in the earthquake seismogram, (iii) the duration of shaking of the mining event appears to be longer despite the slightly smaller magnitude (2.2. vs 2.4) and (iv) the frequency content across the entire waveform is lower for the mining event than for the natural earthquake.
Comparison of Figure 9 with Figure 7 suggests that much of the difference in waveform character between these two events may be attributable to propagation path effects.
Figure 9. Comparison of triaxial acceleration data observed for mining-related seismic event (top 3 traces) and naturally
occurring earthquake (bottom 3 traces) recorded at station WTM.
Wave Propagation Path Effects
The strong influence of propagation distance on waveform character is evident in the increasing elongation of the signals in Figure 7 as recording distance increases from station MFB (0.5 km) to SEF (16.9 km). This effect is also seen with the M 4.6 Illinois earthquake in the helicorder record (Figure 6). Typical rupture times for an earthquake of this size are measured in seconds, yet it produced a 10+ minute long signal at 1700 km distance. As the distance between source and receiver grows,
there is an increasing number of different paths of variable lengths that waves can travel to reach the receiver; the different travel times along the different paths is one reason why the signal duration increases with distance traveled. Another factor is the existence of several different types of waves that travel at different speeds (P, S, surface waves, trapped modes, etc) so they arrive increasingly separated in time as distance increases. Even a station immediately adjacent to a seismic source can expect to see seismic signals last considerably longer than the duration of the dynamic process that produced the elastic waves as waves reflect off of different interfaces and reverberate within and between different layers. This is an important point to consider when using information from seismic waves as part of a forensic accident analysis. The length of the observed seismogram should not be directly interpreted as the duration of the dynamic process that gave rise to the seismic waves; the duration is a strong function of wave propagation path effects.
The calculated depths of the Mt. Lamborn events are approximately 4 km (2.5 mi) whereas the depths of most mining-related events are thought to be restricted to the upper ~1 km (0.6 mi) or so. Consequently, waves from these natural events (Figure 9) spent only a small fraction of their propagation time in the complex, rapidly varying, attenuating, low-velocity structure of the upper 1 km. Waves from the mining-induced events spend a much greater proportion, if not 100 %, of their propagation times within this near-surface region and this may account for a lot of the difference in visual appearance. However, as described later, there are also important notable differences in the manner in which seismic waves are generated by these two types of sources.
Distribution of Seismic Activity
More than 10,000 events with magnitudes ranging between 0 and 3.4 were detected, recorded and automatically processed during the period May 2007 – March 2008 (Figure 10). In addition to the Mt. Lamborn events, the few (~6) other naturally occurring earthquakes which were processed were located well outside the NFV array. Figure 10 shows all automatically located NFV events without regard to the size of location error. Some of the scattered events lying outside the main mining areas have large location errors and some may be well-located events that are associated with old mine workings. A few of these scattered events are known to be unsuccessful attempts by the system to locate sources of thunder. The automatic processing, without human intervention, is largely successful in placing events into the appropriate mine and allows resolution according to specific working area (i.e. longwall vs development sections, etc). The clustering of events to the east of the Bowie stations on the north side of the valley are from a third NFV area longwall coal mine.
As an example on the scale of an individual longwall panel, event locations located during one month of B-seam longwall retreat mining at the Bowie mine are shown in Figure 11. The variation in seismic activity with mining of this panel was quite significant. Activity strongly increased as the depth of cover rose above 460 m (1500 ft) and stress interactions occurred with the previously mined D seam 90 m (300 ft) above.
Damaging Seismic Events
Experience in the NFV, as well as other mining regions, shows that seismic activity is affected by the presence of thick strong roof and floor strata, high overburden, and geologic anomalies. These factors are commonly encountered in western underground

coal mines and, in the right combination, can create conditions conducive to coal bumps (6; 7).
Two damaging seismic events, or coal bumps, are described that occurred under high overburden with comparatively strong brittle strata in the roof and floor. Faults were present in both cases. The faults, as with other geologic anomalies, make it difficult to anticipate the structural response through numerical modeling, or even empirical experience, because the spatial extent and physical characteristics of the anomalies are generally, or even completely, unknown.
Figure 10. Calculated seismic event locations (May 2007 -Mar 2008) as determined by automated processing.
Figure 11. Automatically processed event locations (~2600) during one month of longwall retreat under 460 m (1500 ft) of
overburden and multiseam mining conditions.
Independent of their possible role in initiating dynamic failures, faults can generally affect both stress and structural stability. Stress is affected because suitably oriented faults can provide a low-compliance deformation, or slip, boundary. Movement, or deformation, along zones of faulting means that stresses, particularly abutment loads which were expected in a uniform elastic medium to be shed to the surrounding rock mass away from the active mining area, are instead concentrated closer to working areas. Secondly, faults, particularly steeply dipping faults, reduce load-bearing capacity of pillars, solid blocks of coal and other strata subjected to mining-induced stress. Finally, faults, either directly or by rendering stiff load transferring strata ineffective, also reduce load system stiffness which serves to
enhance unstable failure modes (8). Any or all of these effects of faulting may have played some role in creating conditions leading to these dynamic failures, but the relative contribution of each role has not been determined.
In the first example, development of a 5-entry east-west submains was in progress on the Bowie B seam. Overburden is approximately 530 m (1750 ft) and the base of the 30 m (100 ft) thick “C” sandstone starts 27 m (90 ft) above the B seam. The submains had just finished crossing under the old D-seam north-south mains 90 m (300 ft) above when a magnitude 2.9 seismic event (Figure 7), the largest in a series of three events, produced the distribution of damage shown in Figure 12. Damage consisted of floor heave and pillar spallation where the spalls occurred preferentially on north-facing ribs. The heaviest damage was centered not at the development faces but in an area of steeply dipping northwest-striking faults more than 150 m (500 ft) outby. At the time, development faces did not exhibit signs of heavy loading. None of the faults displayed evidence of fresh macroscopic slip movement.
Figure 12. Distribution of floor heave and rib spall attending M 2.9 coal bump during B-seam submains development.
Prior to mining the B-seam, two- and three-dimensional stress analyses were performed using MULSIMTI and FLAC (9) with a focus on stress transfer from old D seam workings onto the B seam. None of the numerical models indicated any significant failure was to be expected in this area, even when reducing the strength of the B-seam coal due to the presence of the faults. However, the modeling did anticipate crushing of pillars in old D-seam workings under high cover. Analysis of the largest events that have occurred during mining of the Bowie B seam over the past year (Swanson and Collins, in progress) suggest that many of the larger events are occurring 300 ft above on pillars left in the mains and gateroads of the mined-out D seam. With the existing sparse seismic array, vertical resolution of calculated event locations is insufficient to distinguish between events occurring on the B or D seams. A dynamic trigger from nearby failure in the D seam workings above, or slip on known nearby fault structures, is being examined as a possible initiating event that may have elevated stresses dynamically to the point of failure. However, the role of stress and material property variation due to known and unknown complexities in the geologic and mining environment can not be completely discounted.
As a second example, a bump occurred with a magnitude 1.9 seismic event at West Elk that affected headgate pillars adjacent to the longwall gob (Figure 13). Overburden ranged from 730 m

(2400 ft) at the east end of the panel end to 425 m (1400 ft) over the face. Competent sandstone units of up to 60 m (200 ft) thickness are located 12-15 m (40-50 ft) above and below the B seam. Several discrete steeply dipping faults trend northeast in a zone that intersects the headgate in the middle of the damaged pillar zone. These faults are part of a consistently oriented fault set that periodically intersects the workings in this part of the mine. Although pillar spall was the dominant mode of failure, floor heave and roof failure were also present to a lesser extent. Two rows of support cans along the length of the middle headgate entry provided a space that was largely sheltered from the damage (Figure 14) and mine operations were not significantly affected by this event.
Figure 13. Gateroad pillar damage produced during M 1.9 seismic event.
Figure 14. Response of can-supported gateroad entry to floor heave, and pillar and roof damage
produced by M 1.9 coal bump.
Seismic signals from a triaxial accelerometer that was temporarily deployed on the surface above this panel at a three-dimensional distance of 860 m (2800 ft) from the headgate damage zone are shown in Figure 15. Temporary stations are deployed to specifically capture strong-motion accelerations from large events that occur when mining under deep cover. This data is being collected at West Elk and Bowie to develop empirical relations between seismic magnitude, distance from the seismic source, and level of shaking. Initial results from these studies have been used to support stability analyses of at least one critical structure, with resulting impact on the regulatory decision-making process.
Figure 15. Ground acceleration produced by M 1.9 coal bump at a distance of 860 m (2800 ft).
Fault Slip and First Motions
Seismic events can be categorized as shear-like or implosional on the basis of the directions of the initial movement of the ground at each station (i.e. direction of P-wave first motion). Implosional events, which reflect incremental closure of mine openings, are characterized by first motions that move toward the source at all of the stations in a well-distributed seismic network (in the case of vertical sensors above a mine, the directions of first motion would all be down). Events with a strong shearing component, similar to most natural earthquakes (e.g. Figure 9), exhibit a mixture of first motions that move both toward and away from the source (or up and down on vertical sensors).
While some mining-related seismic events in the NFV exhibit the mixed polarity (up and down) first-motion patterns that accompany a significant component of shear slip motion, the vast majority of events, including the above-described bumps, display first motions that move toward the seismic source at all stations. In other words, the seismic signatures appear implosional and not shear like. This does not mean there was no co-seismic deformation along the fault(s) for the two damaging events, but the absence of the shear-slip first-motion pattern suggests that the contribution of fault slip was less than that of closure of the mine openings. Other coal mine seismic networks of this scale in the western U.S. report similar observations of implosional first-motion patterns (e.g. 98% of events reported in (1)). The implosional elastic-wave radiation pattern is another likely reason the waveforms for the mining-induced seismic event of Figure 7 differ from that of the natural earthquake.

A mixture of shear slip and volume decrease may be present in these events but it is not well resolved using first motion analyses. A description of dynamic ground movements using seismic moment tensor analysis (10), which can provide such information, is underway but insufficiently developed for the present paper. Moment tensor analysis shows that events with pure shear slip are usually located at a distance well out into the solid rock mass rather than adjacent to a working face (11). For events that display a mixture of implosive and shear failure, the moment tensor components representing the strike of the shearing plane tend to align parallel to the nearby face direction.
SUMMARY
Bowie Resources LLC, Mountain Coal Company and NIOSH have cooperated on a joint project to develop a digital wireless seismic monitoring network to collect background data on mining -related seismic activity in western Colorado and to implement a hazard monitoring tool. The ten station strong-motion array provides real-time monitoring capability using wireless serial and IP communications networks. Data collected with this network is being used to (i) identify and characterize dynamic failure mechanisms of potentially hazardous rock mass failures, (ii) assess the usefulness of seismic monitoring as an indicator of mine design performance, and (iii) determine empirical relations between levels of ground shaking, seismic event magnitude, and distance to the seismic sources.
REFERENCES
1. Arabasz, W., S. Nava, M. McCarter, K. Pankow, J. Pechmann, J. Ake, and A. McGarr, Coal-mining seismicity and ground-shaking hazard: A case study in the Trail Mountain area, Emery County, Utah, Bull. Seism. Soc. Am., v. 95, no. 1, 2005, pp. 18-30.
2. Earle, P., A. Bittenbinder, B. Bogaert, and C. Johnson, Tune to the worm: Seismic network operation using the USGS Earthworm system, in Observations and Research Facilities for European Seismology, Orfeus Newsletter, vol. 5, no.1, March 2003.
3. Klein, F., User’s guide to HYPOINVERSE-2000. A Fortran Program to Solve for Earthquake Locations and Magnitudes, USGS Open-File Report 02-171, vers. 1, 2002, 123 pp.
4. Swanson, P., and W. Koontz, Measurement and Analysis of Mining-Induced Seismic Ground Motion in the Vicinity of the West Elk Coal Mine, Somerset, CO (abstract), Seism. Res. Lett, v. 77, no.2, 2006, p. 318.
5. Presgrave, B., USGS/NEIC, personal communication, 2007.
6. Iannacchione, A, and J. Zelanko, Occurrence and Remediation of Coal Mine Bumps: A Historical Review, Paper in Proceedings of Workshop on Mechanics and Mitigation of Violent Failure in Coal and Hard-Rock Mines, U.S. Bur. of Mines Spec. Publ. 01-95, Post Falls, ID, 1995, pp. 231-242.
7. Agapito, J., and R. Goodrich, Five Stress Factors Conducive to Bumps in Utah, USA, Coal Mines, Proc. 19th Intl. Conf. on Ground Control in Mining, Morgantown, WV, 2000.
8. Zipf, R. K. Pillar, Design to Prevent Collapse of Room-and-Pillar Mines, Ch. 59 in Underground Mining Methods: Engineering Fundamentals and International Case Studies, W. Hustrulid and R. Bullock, Ed., Society for Mining, Metallurgy and Exploration, Littleton, CO, 2001, pp. 493-511.
9. Maleki, H., C. Stewart, and R. Stone, Three-Seam Stress Analyses at Bowie Mines, Colorado, Proc. 26th Intl. Conf. on Ground Control in Mining, Morgantown, WV, 2007, pp. 29-37.
10. McGarr, A. and J. Fletcher, Moment Tensor Inversion of Ground Motion from Mining-Induced Earthquakes, Trail Mountain, Utah, Bull. Seism. Soc. Am., v. 95, no. 1, 2005, pp. 48-57.
11. McGarr, A., Observations Concerning Diverse Mechanisms for Mining-Induced Earthquakes, in Rockbursts and Seismicity in Mines, in Controlling Seismic Risk, Proc. of 6th Intl. Symp. on Rockburst and Seismicity in Mines, 2005, pp. 107-111.