Embed Size (px)
Citation preview

A decline in oil rates consolidated Monitoring and assessment of the proportion of oiled Common
Guillemots in The Netherlands
winter 2018/19
C.J. Camphuysen 2019
Royal Netherlands Institute for Sea Research (NIOZ) and the Dutch Seabird Group (NZG/NSO)

Commissioners contact details:
Ministry of Infrastructure and the Environment (I&M),
P.O. Box 5023 | 2600 GA | Delft, The Netherlands.
Contact: Mervyn Roos, RWS-CIV [email protected]
RWS Centrale Informatievoorziening BM 19.29
Author's contact details:
Royal Netherlands Institute for Sea Research and the Dutch Seabird Group,
P.O. Box 59 | 1790 AB | Den Burg, Texel, The Netherlands.
Contact: Dr Kees (C.J.) Camphuysen, senior researcher, E-mail [email protected]
+31 222 369488
Citation:
Camphuysen C.J. (2019). A decline in oil rates consolidated: Monitoring and assessment of the
proportion of oiled Common Guillemots in The Netherlands: winter 2018/19. NIOZ Report, RWS Centrale Informatievoorziening BM 19.29, Dec 2019. Royal Netherlands Institute for Sea
Research, Texel.
Front cover: Great Black-backed Gull as a scavenger feeding on a wrecked Common Guillemot on Terschelling in February 2019 (photo courtesy Jacob J. de Vries). Scavengers tend to destruct the evidence needed to assess oil rates and only sufficiently intact carcasses were used to estimate the proportion of stranded birds that is contaminated with oil

Summary - This is the annual update for OSPAR of the beached bird survey (BBS) results in The Netherlands winter 2018/19. The Dutch BBS provides data for OSPAR area’s 8, 9 and 10, but data from Belgian and German colleagues will have to be merged to arrive at the final values for these areas. For the Dutch North Sea region, significant declines in oil rates were reported over a 60 year study period, but most notably in recent decades (~2005 to present). In recent seasons, consistently low oil rates are found in all species, and this includes the target species Common Guillemot Uria aalge, even though some hic-ups occurred in some species mostly as a result of small sample size.
In winter 2018/19, a seabird wreck occurred, mostly affecting Common Guillemots, and the proportion of oiled individuals was very low indeed. A small oil slick was seen and monitored in the March-April period off Texel, but the number of casualties remained very low. Numbers of Northern Gannets washing ashore were rather large in the last seasons, but oil did not play a role in this mortality. For coastal birds, oil pollution is history; oil rates are consistently around zero percent for a considerable series of years.
The sample size for Common Guillemots was larger than in most recent years and sufficient for OSPAR subregions covered in this study bordering the North Sea, just a bit too small for the interior Wadden Sea. The oil-rate (percentage of oiled Common Guillemots of all complete Common Guillemots found dead) reached a very low value of only 5.3% (n=433) for the North Sea coast of OSPAR areas 8 and 9 combined. This current figure, despite the large number of carcasses reported, is the second lowest value ever measured within The Netherlands and it consolidates the sharp drop in oil-rates that occurred after 2015. The five-year running mean in (Dutch) national Common Guillemot oil rates (over 2014/15-2018/19) arrived at 10.9 ± 12.1% (OSPAR 8-9) which is a further confirmation of a rapid decline. The results obtained over the last decade(s) suggest a continuation of low oil rates in Common Guillemots in Dutch waters. The OSPAR target of 20% over periods of at least 5 years for 2020 has evidently been exceeded and that for 2030 (now ~11%) has nearly been reached.
Het afnemend percentage olieslachtoffers geconsolideerd: jaarlijkse vaststelling van het percentage met olie besmeurde Zeekoeten in Nederland, winter 2018/19
Samenvatting - Dit is de jaarlijkse weergave voor OSPAR van de resultaten van systematische strandtellingen langs de Nederlandse kust, met een verslag over het seizoen 2018/19. Middels deze tellingen verzorgt Nederland haar bijdragen voor de OSPAR deelgebieden 8, 9, en 10. Om een compleet beeld te krijgen voor deze deelgebieden zullen Belgische en Duitse gegevens moeten worden toegevoegd en gecombineerd. In deze rapportage worden alleen de Nederlandse gegevens besproken. Voor de Nederlandse Noordzeekust kon de lange termijn afname in oliebevuilingspercentages bij de Zeekoeten worden bevestigd en alle laatste seizoenen hebben bijzonder lage waarden laten zien. Over 2018/19 werd langs de Noordzeekust een niveau van slechts 5.3% olieslachtoffers gevonden (n= 433). Het meerjarig gemiddelde is inmiddels op een niveau van 11% beland, waarmee de doelstellingen van OSPAR voor 2020 overschreden en die voor 2030 bijna bereikt zijn.

Introduction
The Marine Strategy Framework Directive now demands an indicator for oil pollution, in order to evaluate the effectiveness of measures to reduce chronic oil pollution (Commission Decision of 2010, Chapter 8.2, Effects of contaminants, EU 2010). The usefulness of beached bird surveys to monitor levels of chronic marine oil pollution had been demonstrated in the late 1990s (Camphuysen & Heubeck 2001), but the information need for the monitoring and assessment of oil fouling of seabirds was established much later, and first in OSPAR in the form of an Ecological Quality Objective (EcoQO). In the legal Dutch Kader Richtlijn Marien document (page 78; “Vervuilende stoffen”; Anon. 2012), the EcoQO indicator is explicitly implemented. In the EcoQOs for the North Sea, “the Proportion of oiled Common Guillemots among those found dead or dying on beaches” was subsequently listed Under Issue 4 (Seabirds), EcoQO element (f). The “Oiled Guillemot EcoQO”, as agreed by the 5th North Sea Conference, was defined as: “The proportion of such birds should be 10% or less of the total found dead or dying, in all areas of the North Sea” (Anon. 2002), later refined to target mean proportions of 20% in 2020 and 10% in 2030 over periods of at least 5 years (Anon. 2012).
This is the annual update for The Netherlands for winter 2018/19. The emphasis of this study is on Common Guillemots, as usually and as required, but the same details are provided for also several other pelagic species (the Northern Fulmar Fulmarus glacialis, the Northern Gannet Morus bassanus, the Black-legged Kittiwake Rissa tridactyla and the Razorbill Alca torda) and three coastal species the Common Eider Somateria mollissima, the Herring Gull Larus argentatus, and the Great Black-backed Gull Larus marinus). The first group is meant to evaluate trends in chronic oil pollution at greater distances from the nearest coast, the second group would reflect the occurrence of nearshore oil pollution. Densities span the entire 60 years period (winter 1959/60 – winter 2019/20), whereas the analysis of oil rates spans a period of 42 years (winter 1977/78 to 2019/20).
Oil-rates (% oiled) of Common Guillemots are provided for the Dutch contributions to OSPAR areas 8, 9, and 10, and for the Dutch North Sea coast as a whole (areas 8 and 9 combined). Raw data are provided in Appendices, also for the more characteristic and commoner species of seabirds found in 2018/19 and included in this report. Given the nature of the underlying database (historical data can be merged with earlier published material whenever they emerge to enlarge earlier sample sizes), the exact values may deviate slightly from earlier publications.

Observer effort
In winter 2018/19, beached bird survey reports were received from A de Groot (3), Ad van den Berge (3), Addy Glas (1), Adriaan Dijksen (1), Adriaan Vos (1), Adriana Faber (2), Agnès Bimmel- Korstanje (1), Alie van Nijendaal-Postma (1), Alma de Groot (5), Alwin van Lubeck (1), Anko Fokkens (1), Anne Schoteldraaijer (1), Anne Schumacher (1), Annelies Marijnis (1), Arie Twigt (2), Arien Slagt (1), Arjan de Jong (1), Arnoud Heikens (2), Aron Sinke (1), Arthur Van Roey (2), Axel Garritsen (1), B.J.H.M. Possen (1), Bart Vastenhouw (2), Ben Kruijsen (1), Bernard Lucas (1), Bernd-Jan Bulsink (1), Boris Buecher (1), Carl Zuhorn (16), Casper Zuyderduyn (1), Chris Tiesinga (1), Christophe Reijman (2), CJ Camphuysen (7), Cock Dekker (1), Coen van Nieuwamerongen (1), Conny & Peter Das (2), D Veenendaal (13), D Vlugt (1), Daphne van Voorst (1), Dennis Dooper (1), Dht Gul (via MF Leopold) (1), Dick Hoek (1), Dick Slaa (1), Dook Vlugt (1), Edwin De Weerd (6), Erik de Waard (1), Erik van Dijk (1), Ernst-Jan van Haaften (1), F Arts (2), F Arts & Carlien Nijdam (1), F Janssens (3), Ferry van Jaarsveld (2), Fokke van der Weij (2), Frank Bloklander (1), Frans Lokker (1), Frans Nillesen (1), Fred Visscher (1), Freddy Van Damme (1), Geert Van den Heuvel (1), Ger Meesters (1), Gerard Westerhuis (4), Gerben Mensink (2), Gerben Mensink & Marnix Jonker (1), Gerben Oosterhuis (1), Germen Lont (3), Gerrie Hesp (1), Griet Nijs (1), Guus Lange (2), Han Goudappel (1), Hanna Haring (1), Hanno Steenbergen (1), Hans Sanders (1), Hans Semeins (1), Hans van Kersbergen (1), Hans van Oosterhout (2), Harm Jan Kiewiet (1), Harry K (1), Hennie Stienstra (1), Henri Bouwmeester (3), Herman Marinus (1), Hogeland Terschelling (1), Huub Verbeek (1), Isabelle Bossuyt (1), Ivan Leroy (1), J de Vries (1), J Krol (2), J Stuart plus Jeugdvogelclub (1), J ten Horn (4), J.van Dillen-Staal (2), JA van Franeker (7), Jaap Faber (1), Jaco Walhout (1), Jacob de Vries (5), Jacos Jes (2), Jan Bert Kanon (1), Jan Bos (2), Jan Koreneef (1), Jan Lok (1), Jeroen van der Zwan (1), Jeroen Veeken (1), Joaquim Pontes (1), Joey Braat (1), johan beek (1), Johan Bos (3), Johan E (1), Johan van der Vegt (1), Jonas Bergmans (1), Jonne Veldboom (1), Joop van Eerbeek (1), Joop Verkamman (1), J ten Horn S Ersoy LdeMonte ADekinga (1), Karel Boey (1), Karin van den Berg (1), Kees Kraaijeveld (1), Klaas Ophoff (1), Klaas Schepers (1), Koert Scholten (1), L Roozen (1), L vd Graaff (2), Larissa Bakker (1), Lenn van de Zande (1), Leon Kelder (7), Lieke Peper (1), Liesbeth Missel (1), Louis H. Zandbergen (5), Louis Schramme (2), Luc De Backer (1), Luc Elshout (1), Luca Giussani (1), Lucette Robertson-Proot (5), Luuk de Haan (1), M Klootwijk (1), M Klootwijk M Aspeslagh (1), M Smit Ecomare (2), Maarten Sluijter (1), Marc Hofman (1), Marc Nollet (1), Marc van der Kolk (1), Marcel Klootwijk (1), Marcel Ruijs (1), Marcel van Rooijen (1), Marchel Stienstra (1), Marco Leloux (1), Marijke Barhorst (1), Marnix Jonker (1), Martijn Bunskoek (1), Matthijs van Eerden (1), Maurice Knijnsberg (1), Menko Vlaardingerbroek (1), Merijn Maltha (3), MF Leopold (2), MF Leopold M Baptist (1), M den Boer (1), Michiel Muller (3), Mick Peerdeman (2), Nel Bekema (4), Niels Eimers (1), Onno Werkman (2), P de Boer (1), Patrick Agterberg (2), Patrick Snoeken (2), Paul van Eik (1), Peter Esselink (1), Peter Hoppenbrouwers (1), Peter Keune (1), Peter Rigterink (1), Peter Schaft (1), Peter van Brandwijk (1), Peter van Horssen (3), Piet Admiraal (1), Piet Gravestein (1), Piet Spoorenberg (2), Pieter Drenth (1), Pieter

Herremans (1), Pieter van Franeker (1), Pim Wolf (1), R.T.Z. NL (Archief J. vd.Hiele) (4), Remco Wester (5), René van Loo (2), René Vos (2), Renée Lejeune (1), Rik Wever (1), Rinse van der Vliet (1), Rinus van 't Hof (3), Rob Martens (1), Rob v Dorland (1), Rob Westerduijn (1), Robbin van Dijk (2), Roel Oost (1), Ruben Cornelisse (1), Rutger Rotscheid (1), Ruud Costers (1), Ruud van Beusekom (1), S Kühn (3), S Kühn & M van Veelen (1), S Kühn J ten Horn (3), S van den Berg-Blok T deBoer HBouma (3), S vd Berg-Blok H Bouma T de Boer (2), Sara Poppelaars (2), Saskia Verberne (1), Shirley O'Brien (3), Siep Luinenburg (1), Sjouke Scholten (4), Stefan Vogelzang (1), Sven Prins (2), T de Boer (1), T. Buren (2), TAW Schreurs (5), Ted van der Knaap (1), Theo Kiewiet (2), Theo M Kiewiet (1), Theunis Banga (1), Thijs Glastra (2), Thomas Ras (1), Thomas van der Es (1), Timothy Drane (1), Tom Damm (1), Tom Schrier (1), Tom van Spanje (2), Trienke de Haan (1), Valérie Goethals (1), Vasco van der Boon (3), W. van Gelder (3), Walter Van Spaendonk (1), Ward van Buul (1), Wijndeldt Boelema (1), Willem Bruul (2), Willie Smeenk (1), Willy Hebbink (1), Wim van Yperen (1), WMR data wrecksampling (17), WMR data wrecksampling Ecomare (1), Wouter Teunissen (1), Y Hermes (4), Yvan Cauwenberg (1), and Zeezoogdierenhulp Kop van Goeree (9).
Total observer effort comprised 410 reports of stranded wildlife which reflected ~1065km surveyed between 1 November 2018 and 30 April 2019 (Table 1).
Table 1. Beached surveys (n counts) and overall coverage (km surveyed) in winter (Nov-Apr) over the last 60 years. The effort in black was used for the analysis of trends in oiling. All effort was used to assess fluctuations in densities over the entire period.
Winter Counts Km surveyed Winter Counts Km surveyed Winter Counts Km surveyed 1959/60 7 43 1979/80 88 721 1999/00 350 1979 1960/61 38 452 1980/81 313 2125 2000/01 316 1730 1961/62 17 41 1981/82 287 1968 2001/02 397 1969 1962/63 48 145 1982/83 388 3126 2002/03 370 1869 1963/64 19 92 1983/84 336 2448 2003/04 262 1310 1964/65 7 28 1984/85 298 1869 2004/05 299 1499 1965/66 28 300 1985/86 287 1833 2005/06 241 1250 1966/67 19 164 1986/87 189 1420 2006/07 270 1109 1967/68 30 322 1987/88 207 1839 2007/08 246 934 1968/69 23 541 1988/89 231 1671 2008/09 204 921 1969/70 60 832 1989/90 237 1506 2009/10 164 776 1970/71 21 510 1990/91 215 1406 2010/11 126 685 1971/72 25 605 1991/92 164 1208 2011/12 310 1030 1972/73 19 465 1992/93 147 1182 2012/13 124 463 1973/74 30 138 1993/94 167 1128 2013/14 164 555 1974/75 49 393 1994/95 130 923 2014/15 150 481 1975/76 35 255 1995/96 138 956 2015/16 169 528 1976/77 20 244 1996/97 121 833 2016/17 301 529 1977/78 49 408 1997/98 141 953 2017/18 312 482 1978/79 93 579 1998/99 318 1795 2018/19 410 1065
637 6555 4402 30910 5185 21164Counts Km surveyed
Totals 10224 58628

Results
Numbers of pelagic seabirds washing ashore
The Common Guillemot is the indicator species for as far as oil contamination on European beaches is concerned, but it is always useful to evaluate the results in the context of other species of the open seas: the pelagic seabirds. The long term fluctuations in densities are shown in Fig. 1, and it can be seen that the densities in winter 2018/19 were higher than in most other recent years: the result of a wreck of guillemots that occurred in January 2019 and that lasted until well in February. Oil rates are expectedly low during wrecks, for most of the mortality is ‘food driven’ (the result of starvation of the birds involved). The size of the wreck was fairly small, certainly in comparison with numbers washing ashore in the 1980s and 1990s, when oil pollution was more widespread, but when the decline in oil rates became visible because the amount of oil on individual carcasses was already declining. Many birds involved in these wrecks were only slightly contaminated with oil. Nowadays, given low or given large numbers, the majority of the guillemots washing ashore does not show any oil in the feathers.
Guillemots, Razorbills and Black-legged Kittiwakes share particular resources within the North Sea ecosystem and can often be seen feeding in the same or in similar habitats, if not even in close association. Given the numbers of Common Guillemots found, higher-than-average numbers of Razorbills and kittiwakes would not have been surprising. This was not the case, however. While in the 1980s and during a wreck in 2011/12 these three species often co-occurred, only densities of Common Guillemots were above average in 2018/19.
More aerial pelagic seabirds, the Northern Fulmar and the Norther Gannet, less prone to oil contamination simply as a result of their lifestyle, tend to have much lower densities than the three species mentioned earlier. Numbers of gannets washing ashore tend to be fairly consistent, whereas densities of Northern Fulmar may fluctuate more widely, sometimes as a result of influxes of birds from elsewhere (e.g. from Arctic regions) into the North Sea. The famous fulmar-wreck of 1962 is still a ones-in-a-lifetime event, despite some irruptions in other years. In recent years, numbers of Northern Gannets washing ashore were rather high, not so much in 2018/19, but seemingly elevated in three to four subsequent seasons, for reasons that are unknown. Evidently, mineral oil played only a minor role in this, if any role at all.
Numbers of coastal seabirds washing ashore
For nearshore seabirds, winter 2018/19 was not a particular season in any respect. Overseeing the long-term fluctuations in recorded densities, particular mortality events were documented in Common Eiders as well as in the two large gull species. Serious oil-related events all date back to the 1960s, while some other and more recent mortality events were food- or disease rather than oil related. It should be noted that an important modern source of information for recent bird strandings (https://waarneming.nl) is a poor source for strandings data of commoner species such as Herring Gulls and Greater Black-backed Gulls, so that some strandings may have been overlooked. Yet, there is no evidence for oil-related mortality in any of the species shown in Fig. 2, let alone other coastal species and the trend of partly black (i.e. oiled) bars to predominantly pale grey (i.e. unoiled) bars is evident in all species depicted.

Fig. 1. Densities (n km-1) of some pelagic seabirds washing ashore in winter, 1959/60-2018/19 (provisional data for 2019/20) in The Netherlands
0
0.2
0.4
0.6
0.8
1
1.2
1.4
1.6
1.8
2 1
959/
60 1
960/
61 1
961/
62 1
962/
63 1
963/
64 1
964/
65 1
965/
66 1
966/
67 1
967/
68 1
968/
69 1
969/
70 1
970/
71 1
971/
72 1
972/
73 1
973/
74 1
974/
75 1
975/
76 1
976/
77 1
977/
78 1
978/
79 1
979/
80 1
980/
81 1
981/
82 1
982/
83 1
983/
84 1
984/
85 1
985/
86 1
986/
87 1
987/
88 1
988/
89 1
989/
90 1
990/
91 1
991/
92 1
992/
93 1
993/
94 1
994/
95 1
995/
96 1
996/
97 1
997/
98 1
998/
99 1
999/
00 2
000/
01 2
001/
02 2
002/
03 2
003/
04 2
004/
05 2
005/
06 2
006/
07 2
007/
08 2
008/
09 2
009/
10 2
010/
11 2
011/
12 2
012/
13 2
013/
14 2
014/
15 2
015/
16 2
016/
17 2
017/
18 2
018/
19 2
019/
20
Common Guillemot winter density (n km-1), 1960-2020
Oiled Unoiled
0
0.1
0.2
0.3
0.4
0.5
0.6
0.7
0.8
0.9
1
195
9/60
196
0/61
196
1/62
196
2/63
196
3/64
196
4/65
196
5/66
196
6/67
196
7/68
196
8/69
196
9/70
197
0/71
197
1/72
197
2/73
197
3/74
197
4/75
197
5/76
197
6/77
197
7/78
197
8/79
197
9/80
198
0/81
198
1/82
198
2/83
198
3/84
198
4/85
198
5/86
198
6/87
198
7/88
198
8/89
198
9/90
199
0/91
199
1/92
199
2/93
199
3/94
199
4/95
199
5/96
199
6/97
199
7/98
199
8/99
199
9/00
200
0/01
200
1/02
200
2/03
200
3/04
200
4/05
200
5/06
200
6/07
200
7/08
200
8/09
200
9/10
201
0/11
201
1/12
201
2/13
201
3/14
201
4/15
201
5/16
201
6/17
201
7/18
201
8/19
201
9/20
Razorbill winter density (n km-1), 1960-2020
Oiled Unoiled
0
0.2
0.4
0.6
0.8
1
1.2
1.4
1.6
1.8
2
195
9/60
196
0/61
196
1/62
196
2/63
196
3/64
196
4/65
196
5/66
196
6/67
196
7/68
196
8/69
196
9/70
197
0/71
197
1/72
197
2/73
197
3/74
197
4/75
197
5/76
197
6/77
197
7/78
197
8/79
197
9/80
198
0/81
198
1/82
198
2/83
198
3/84
198
4/85
198
5/86
198
6/87
198
7/88
198
8/89
198
9/90
199
0/91
199
1/92
199
2/93
199
3/94
199
4/95
199
5/96
199
6/97
199
7/98
199
8/99
199
9/00
200
0/01
200
1/02
200
2/03
200
3/04
200
4/05
200
5/06
200
6/07
200
7/08
200
8/09
200
9/10
201
0/11
201
1/12
201
2/13
201
3/14
201
4/15
201
5/16
201
6/17
201
7/18
201
8/19
201
9/20
Northern Fulmar winter density (n km-1), 1960-2020
Oiled Unoiled
0
0.2
0.4
0.6
0.8
1
1.2
195
9/60
196
0/61
196
1/62
196
2/63
196
3/64
196
4/65
196
5/66
196
6/67
196
7/68
196
8/69
196
9/70
197
0/71
197
1/72
197
2/73
197
3/74
197
4/75
197
5/76
197
6/77
197
7/78
197
8/79
197
9/80
198
0/81
198
1/82
198
2/83
198
3/84
198
4/85
198
5/86
198
6/87
198
7/88
198
8/89
198
9/90
199
0/91
199
1/92
199
2/93
199
3/94
199
4/95
199
5/96
199
6/97
199
7/98
199
8/99
199
9/00
200
0/01
200
1/02
200
2/03
200
3/04
200
4/05
200
5/06
200
6/07
200
7/08
200
8/09
200
9/10
201
0/11
201
1/12
201
2/13
201
3/14
201
4/15
201
5/16
201
6/17
201
7/18
201
8/19
201
9/20
Black-legged Kittiwake winter density (n km-1), 1960-2020
Oiled Unoiled
0
0.05
0.1
0.15
0.2
0.25
0.3
195
9/60
196
0/61
196
1/62
196
2/63
196
3/64
196
4/65
196
5/66
196
6/67
196
7/68
196
8/69
196
9/70
197
0/71
197
1/72
197
2/73
197
3/74
197
4/75
197
5/76
197
6/77
197
7/78
197
8/79
197
9/80
198
0/81
198
1/82
198
2/83
198
3/84
198
4/85
198
5/86
198
6/87
198
7/88
198
8/89
198
9/90
199
0/91
199
1/92
199
2/93
199
3/94
199
4/95
199
5/96
199
6/97
199
7/98
199
8/99
199
9/00
200
0/01
200
1/02
200
2/03
200
3/04
200
4/05
200
5/06
200
6/07
200
7/08
200
8/09
200
9/10
201
0/11
201
1/12
201
2/13
201
3/14
201
4/15
201
5/16
201
6/17
201
7/18
201
8/19
201
9/20
Northern Gannet winter density (n km-1), 1960-2020
Oiled Unoiled

Fig. 2. Densities (n km-1) of some nearshore seabirds washing ashore in winter, 1959/60-2018/19 (provisional data for 2019/20) in The Netherlands.
Oil rates updated
For the analysis, only intact carcasses were selected, since only these were considered fit for purpose: to assess the fraction of birds washing ashore that was, or was not, contaminated with mineral oil. The values produced are all tabulated in the Appendix, whereas the proportions and a long-term running mean and a logit-transformed presentation of the oil rates allowing a linear regression to examine the trends are shown in this chapter.
A warning beforehand, is that the logit transformation is impossible for any values equal to 100% or 0% (e.g. all birds oiled, or none of the birds oiled), for a logit transformation would lead to +∞ or -∞ respectively. In cases where 0% of the birds found were oiled, the outcome was therefore transformed to logit -2 (e.g. ~1% oiled), as a more reliable and workable quesstimate of the actual oil rate to be used in the regression analysis. The problem of ‘no oil’ is increasingly common in recent years, now that chronic oil pollution is really pushed back.
0
1
2
3
4
5
6 1
959/
60 1
960/
61 1
961/
62 1
962/
63 1
963/
64 1
964/
65 1
965/
66 1
966/
67 1
967/
68 1
968/
69 1
969/
70 1
970/
71 1
971/
72 1
972/
73 1
973/
74 1
974/
75 1
975/
76 1
976/
77 1
977/
78 1
978/
79 1
979/
80 1
980/
81 1
981/
82 1
982/
83 1
983/
84 1
984/
85 1
985/
86 1
986/
87 1
987/
88 1
988/
89 1
989/
90 1
990/
91 1
991/
92 1
992/
93 1
993/
94 1
994/
95 1
995/
96 1
996/
97 1
997/
98 1
998/
99 1
999/
00 2
000/
01 2
001/
02 2
002/
03 2
003/
04 2
004/
05 2
005/
06 2
006/
07 2
007/
08 2
008/
09 2
009/
10 2
010/
11 2
011/
12 2
012/
13 2
013/
14 2
014/
15 2
015/
16 2
016/
17 2
017/
18 2
018/
19 2
019/
20
Common Eider winter density (n km-1), 1960-2020
Oiled Unoiled
0
0.1
0.2
0.3
0.4
0.5
0.6
0.7
0.8
0.9
1
195
9/60
196
0/61
196
1/62
196
2/63
196
3/64
196
4/65
196
5/66
196
6/67
196
7/68
196
8/69
196
9/70
197
0/71
197
1/72
197
2/73
197
3/74
197
4/75
197
5/76
197
6/77
197
7/78
197
8/79
197
9/80
198
0/81
198
1/82
198
2/83
198
3/84
198
4/85
198
5/86
198
6/87
198
7/88
198
8/89
198
9/90
199
0/91
199
1/92
199
2/93
199
3/94
199
4/95
199
5/96
199
6/97
199
7/98
199
8/99
199
9/00
200
0/01
200
1/02
200
2/03
200
3/04
200
4/05
200
5/06
200
6/07
200
7/08
200
8/09
200
9/10
201
0/11
201
1/12
201
2/13
201
3/14
201
4/15
201
5/16
201
6/17
201
7/18
201
8/19
201
9/20
Herring Gull winter density (n km-1), 1960-2020Oiled Unoiled
0
0.1
0.2
0.3
0.4
0.5
0.6
195
9/60
196
0/61
196
1/62
196
2/63
196
3/64
196
4/65
196
5/66
196
6/67
196
7/68
196
8/69
196
9/70
197
0/71
197
1/72
197
2/73
197
3/74
197
4/75
197
5/76
197
6/77
197
7/78
197
8/79
197
9/80
198
0/81
198
1/82
198
2/83
198
3/84
198
4/85
198
5/86
198
6/87
198
7/88
198
8/89
198
9/90
199
0/91
199
1/92
199
2/93
199
3/94
199
4/95
199
5/96
199
6/97
199
7/98
199
8/99
199
9/00
200
0/01
200
1/02
200
2/03
200
3/04
200
4/05
200
5/06
200
6/07
200
7/08
200
8/09
200
9/10
201
0/11
201
1/12
201
2/13
201
3/14
201
4/15
201
5/16
201
6/17
201
7/18
201
8/19
201
9/20
Great Black-backed Gull winter density (n km-1), 1960-2020
Oiled Unoiled

Fig. 3 Proportions oiled and 5-year running mean in oil rates (top panel) and a significant decline in logit-transformed oil rates in Common Guillemots, 1977/78-2018/19.
The significant decline in oil rates in Common Guillemots continued, and in winter 2018/19 the second lowest value (5.3% oiled, n= 433) was reached (Fig. 3). The five-year running mean (10.9 ± 12.1%) is about what has to be achieved by 2030 according to OSPAR and well exceeded expectations for 2020.
For the other pelagic seabirds (Fig. 4) highly similar trends and patterns were found, although the data were slightly more erratic in species such as Northern Gannet, in which the sample size was often fairly small. Oil rates in recent years were often nihil (0%), something that never occurred prior to 2008. Oil rates (incl 5-year running means) tend on average to be lower in the aerial species than in the more sensitive auks, but the difference is small (Table 2).
0
10
20
30
40
50
60
70
80
90
100 1
977/
78 1
978/
79 1
979/
80 1
980/
81 1
981/
82 1
982/
83 1
983/
84 1
984/
85 1
985/
86 1
986/
87 1
987/
88 1
988/
89 1
989/
90 1
990/
91 1
991/
92 1
992/
93 1
993/
94 1
994/
95 1
995/
96 1
996/
97 1
997/
98 1
998/
99 1
999/
00 2
000/
01 2
001/
02 2
002/
03 2
003/
04 2
004/
05 2
005/
06 2
006/
07 2
007/
08 2
008/
09 2
009/
10 2
010/
11 2
011/
12 2
012/
13 2
013/
14 2
014/
15 2
015/
16 2
016/
17 2
017/
18 2
018/
19
Common Guillemot, national oil-rate (%) 1976/77-2018/19
y = -0.0424x + 1.2595R² = 0.9128
-2
-1.5
-1
-0.5
0
0.5
1
1.5
2
197
7/78
197
8/79
197
9/80
198
0/81
198
1/82
198
2/83
198
3/84
198
4/85
198
5/86
198
6/87
198
7/88
198
8/89
198
9/90
199
0/91
199
1/92
199
2/93
199
3/94
199
4/95
199
5/96
199
6/97
199
7/98
199
8/99
199
9/00
200
0/01
200
1/02
200
2/03
200
3/04
200
4/05
200
5/06
200
6/07
200
7/08
200
8/09
200
9/10
201
0/11
201
1/12
201
2/13
201
3/14
201
4/15
201
5/16
201
6/17
201
7/18
201
8/19
Common Guillemot, North Sea coast oil rate (OSPAR 8+9), logit transformed
logit oil rate North Sea coast 5-year running mean Linear (5-year running mean)

Fig. 4 Proportions oiled and 5-year running mean in oil rates (top panels) and a significant declines in logit-transformed oil rates in the four commoner pelagic species: Northern Fulmar, Northern Gannet, Black-legged Kittiwake, and Razorbill, 1977/78-2018/19.
Table 2 Proportions oiled and 5-year running means (±SD) in pelagic seabirds in 2018/19. () = small sample.
Species Oiled (%) n= Mean
SD
Common Guillemot 5.3 433 10.8 ± 12.1 Razorbill 16.7 30 6.5 ± 7.2 Northern Fulmar (10.0) 20 2.0 ± 4.5 Northern Gannet (10.0) 20 5.1 ± 7.2 Black-legged Kittiwake 10.7 28 4.3 ± 5.3
0
10
20
30
40
50
60
70
80
90
100 1
977/
78 1
978/
79 1
979/
80 1
980/
81 1
981/
82 1
982/
83 1
983/
84 1
984/
85 1
985/
86 1
986/
87 1
987/
88 1
988/
89 1
989/
90 1
990/
91 1
991/
92 1
992/
93 1
993/
94 1
994/
95 1
995/
96 1
996/
97 1
997/
98 1
998/
99 1
999/
00 2
000/
01 2
001/
02 2
002/
03 2
003/
04 2
004/
05 2
005/
06 2
006/
07 2
007/
08 2
008/
09 2
009/
10 2
010/
11 2
011/
12 2
012/
13 2
013/
14 2
014/
15 2
015/
16 2
016/
17 2
017/
18 2
018/
19
Northern Fulmar, national oil-rate (%) 1976/77-2018/19
0
10
20
30
40
50
60
70
80
90
100
197
7/78
197
8/79
197
9/80
198
0/81
198
1/82
198
2/83
198
3/84
198
4/85
198
5/86
198
6/87
198
7/88
198
8/89
198
9/90
199
0/91
199
1/92
199
2/93
199
3/94
199
4/95
199
5/96
199
6/97
199
7/98
199
8/99
199
9/00
200
0/01
200
1/02
200
2/03
200
3/04
200
4/05
200
5/06
200
6/07
200
7/08
200
8/09
200
9/10
201
0/11
201
1/12
201
2/13
201
3/14
201
4/15
201
5/16
201
6/17
201
7/18
201
8/19
Northern Gannet, national oil-rate (%) 1976/77-2018/19
0
10
20
30
40
50
60
70
80
90
100
197
7/78
197
8/79
197
9/80
198
0/81
198
1/82
198
2/83
198
3/84
198
4/85
198
5/86
198
6/87
198
7/88
198
8/89
198
9/90
199
0/91
199
1/92
199
2/93
199
3/94
199
4/95
199
5/96
199
6/97
199
7/98
199
8/99
199
9/00
200
0/01
200
1/02
200
2/03
200
3/04
200
4/05
200
5/06
200
6/07
200
7/08
200
8/09
200
9/10
201
0/11
201
1/12
201
2/13
201
3/14
201
4/15
201
5/16
201
6/17
201
7/18
201
8/19
Black-legged Kittiwake, national oil-rate (%) 1976/77-2018/19
0
10
20
30
40
50
60
70
80
90
100
197
7/78
197
8/79
197
9/80
198
0/81
198
1/82
198
2/83
198
3/84
198
4/85
198
5/86
198
6/87
198
7/88
198
8/89
198
9/90
199
0/91
199
1/92
199
2/93
199
3/94
199
4/95
199
5/96
199
6/97
199
7/98
199
8/99
199
9/00
200
0/01
200
1/02
200
2/03
200
3/04
200
4/05
200
5/06
200
6/07
200
7/08
200
8/09
200
9/10
201
0/11
201
1/12
201
2/13
201
3/14
201
4/15
201
5/16
201
6/17
201
7/18
201
8/19
Razorbill, national oil-rate (%) 1976/77-2018/19
y = -0.0614x + 0.9312R² = 0.8759
-2
-1.5
-1
-0.5
0
0.5
1
1.5
2
197
7/78
197
8/79
197
9/80
198
0/81
198
1/82
198
2/83
198
3/84
198
4/85
198
5/86
198
6/87
198
7/88
198
8/89
198
9/90
199
0/91
199
1/92
199
2/93
199
3/94
199
4/95
199
5/96
199
6/97
199
7/98
199
8/99
199
9/00
200
0/01
200
1/02
200
2/03
200
3/04
200
4/05
200
5/06
200
6/07
200
7/08
200
8/09
200
9/10
201
0/11
201
1/12
201
2/13
201
3/14
201
4/15
201
5/16
201
6/17
201
7/18
201
8/19
Northern Fulmar, North Sea coast oil rate (OSPAR 8+9), logit transformed
logit oil rate North Sea coast 5-year running mean Linear (5-year running mean)
y = -0.0523x + 0.7296R² = 0.6976
-2
-1.5
-1
-0.5
0
0.5
1
1.5
2 1
977/
78 1
978/
79 1
979/
80 1
980/
81 1
981/
82 1
982/
83 1
983/
84 1
984/
85 1
985/
86 1
986/
87 1
987/
88 1
988/
89 1
989/
90 1
990/
91 1
991/
92 1
992/
93 1
993/
94 1
994/
95 1
995/
96 1
996/
97 1
997/
98 1
998/
99 1
999/
00 2
000/
01 2
001/
02 2
002/
03 2
003/
04 2
004/
05 2
005/
06 2
006/
07 2
007/
08 2
008/
09 2
009/
10 2
010/
11 2
011/
12 2
012/
13 2
013/
14 2
014/
15 2
015/
16 2
016/
17 2
017/
18 2
018/
19
Northern Gannet, North Sea coast oil rate (OSPAR 8+9), logit transformed
logit oil rate North Sea coast 5-year running mean Linear (5-year running mean)
y = -0.0497x + 1.07R² = 0.8807
-2
-1.5
-1
-0.5
0
0.5
1
1.5
197
7/78
197
8/79
197
9/80
198
0/81
198
1/82
198
2/83
198
3/84
198
4/85
198
5/86
198
6/87
198
7/88
198
8/89
198
9/90
199
0/91
199
1/92
199
2/93
199
3/94
199
4/95
199
5/96
199
6/97
199
7/98
199
8/99
199
9/00
200
0/01
200
1/02
200
2/03
200
3/04
200
4/05
200
5/06
200
6/07
200
7/08
200
8/09
200
9/10
201
0/11
201
1/12
201
2/13
201
3/14
201
4/15
201
5/16
201
6/17
201
7/18
201
8/19
Black-legged Kittiwake, North Sea coast oil rate (OSPAR 8+9), logit transformed
logit oil rate North Sea coast 5-year running mean Linear (5-year running mean)
y = -0.0677x + 1.6961R² = 0.8884
-2
-1.5
-1
-0.5
0
0.5
1
1.5
2
197
7/78
197
8/79
197
9/80
198
0/81
198
1/82
198
2/83
198
3/84
198
4/85
198
5/86
198
6/87
198
7/88
198
8/89
198
9/90
199
0/91
199
1/92
199
2/93
199
3/94
199
4/95
199
5/96
199
6/97
199
7/98
199
8/99
199
9/00
200
0/01
200
1/02
200
2/03
200
3/04
200
4/05
200
5/06
200
6/07
200
7/08
200
8/09
200
9/10
201
0/11
201
1/12
201
2/13
201
3/14
201
4/15
201
5/16
201
6/17
201
7/18
201
8/19
Razorbill, North Sea coast oil rate (OSPAR 8+9), logit transformed
logit oil rate North Sea coast 5-year running mean Linear (5-year running mean)

Fig. 5 Proportions oiled and 5-year running mean in oil rates (left panels) and declines in logit-transformed oil rates (right panels) in three coastal species: Common Eider, Herring Gull, and Great Black-backed Gull, 1977/78-2018/19.
For the more coastal species, a trend analysis is in fact pointless in recent years, for the oil rates are essential nihil with occasional casualties every now and then. For these species, in this part of the world, chronic oil pollution is no longer an issue of concern, even though an accidental spill could still kill thousands of birds on a single occasion. Oil rates equalling 0% (depicted as logit -2 on the right panels) predominate in recent years.
Discussion
In winter 2018/19, oil rates were again very low, signaling a further improvement in marine ecosystems for as far as chronic oil pollution is concerned. The 5-year running (arithmetic) mean oil rate in Common Guillemots for North Sea coasts in OSPAR areas 8 and 9 combined was until recently the only trend that was still linear, but the latest results indicate an acceleration of the decline in oil rates in the southern Bight. The decline is similar in all OSPAR
0
10
20
30
40
50
60
70
80
90
100 1
977/
78
197
8/79
197
9/80
198
0/81
198
1/82
198
2/83
198
3/84
198
4/85
198
5/86
198
6/87
198
7/88
198
8/89
198
9/90
199
0/91
199
1/92
199
2/93
199
3/94
199
4/95
199
5/96
199
6/97
199
7/98
199
8/99
199
9/00
200
0/01
200
1/02
200
2/03
200
3/04
200
4/05
200
5/06
200
6/07
200
7/08
200
8/09
200
9/10
201
0/11
201
1/12
201
2/13
201
3/14
201
4/15
201
5/16
201
6/17
201
7/18
201
8/19
Common Eider, national oil-rate (%) 1976/77-2018/19
y = -0.0636x + 0.5326R² = 0.9507
-2
-1.5
-1
-0.5
0
0.5
1
1.5
2
197
7/78
197
8/79
197
9/80
198
0/81
198
1/82
198
2/83
198
3/84
198
4/85
198
5/86
198
6/87
198
7/88
198
8/89
198
9/90
199
0/91
199
1/92
199
2/93
199
3/94
199
4/95
199
5/96
199
6/97
199
7/98
199
8/99
199
9/00
200
0/01
200
1/02
200
2/03
200
3/04
200
4/05
200
5/06
200
6/07
200
7/08
200
8/09
200
9/10
201
0/11
201
1/12
201
2/13
201
3/14
201
4/15
201
5/16
201
6/17
201
7/18
201
8/19
Common Eider, North Sea coast oil rate (OSPAR 8+9), logit transformed
logit oil rate North Sea coast 5-year running mean Linear (5-year running mean)
0
10
20
30
40
50
60
70
80
90
100
197
7/78
197
8/79
197
9/80
198
0/81
198
1/82
198
2/83
198
3/84
198
4/85
198
5/86
198
6/87
198
7/88
198
8/89
198
9/90
199
0/91
199
1/92
199
2/93
199
3/94
199
4/95
199
5/96
199
6/97
199
7/98
199
8/99
199
9/00
200
0/01
200
1/02
200
2/03
200
3/04
200
4/05
200
5/06
200
6/07
200
7/08
200
8/09
200
9/10
201
0/11
201
1/12
201
2/13
201
3/14
201
4/15
201
5/16
201
6/17
201
7/18
201
8/19
Herring Gull, national oil-rate (%) 1976/77-2018/19
y = -0.0499x + 0.3135R² = 0.9144
-2
-1.5
-1
-0.5
0
0.5
1
1.5
2
197
7/78
197
8/79
197
9/80
198
0/81
198
1/82
198
2/83
198
3/84
198
4/85
198
5/86
198
6/87
198
7/88
198
8/89
198
9/90
199
0/91
199
1/92
199
2/93
199
3/94
199
4/95
199
5/96
199
6/97
199
7/98
199
8/99
199
9/00
200
0/01
200
1/02
200
2/03
200
3/04
200
4/05
200
5/06
200
6/07
200
7/08
200
8/09
200
9/10
201
0/11
201
1/12
201
2/13
201
3/14
201
4/15
201
5/16
201
6/17
201
7/18
201
8/19
Herring Gull, North Sea coast oil rate (OSPAR 8+9), logit transformed
logit oil rate North Sea coast 5-year running mean Linear (5-year running mean)
0
10
20
30
40
50
60
70
80
90
100
197
7/78
197
8/79
197
9/80
198
0/81
198
1/82
198
2/83
198
3/84
198
4/85
198
5/86
198
6/87
198
7/88
198
8/89
198
9/90
199
0/91
199
1/92
199
2/93
199
3/94
199
4/95
199
5/96
199
6/97
199
7/98
199
8/99
199
9/00
200
0/01
200
1/02
200
2/03
200
3/04
200
4/05
200
5/06
200
6/07
200
7/08
200
8/09
200
9/10
201
0/11
201
1/12
201
2/13
201
3/14
201
4/15
201
5/16
201
6/17
201
7/18
201
8/19
Great Black-backed Gull, national oil-rate (%) 1976/77-2018/19
y = -0.0594x + 0.5327R² = 0.883
-2
-1.5
-1
-0.5
0
0.5
1
1.5
2
197
7/78
197
8/79
197
9/80
198
0/81
198
1/82
198
2/83
198
3/84
198
4/85
198
5/86
198
6/87
198
7/88
198
8/89
198
9/90
199
0/91
199
1/92
199
2/93
199
3/94
199
4/95
199
5/96
199
6/97
199
7/98
199
8/99
199
9/00
200
0/01
200
1/02
200
2/03
200
3/04
200
4/05
200
5/06
200
6/07
200
7/08
200
8/09
200
9/10
201
0/11
201
1/12
201
2/13
201
3/14
201
4/15
201
5/16
201
6/17
201
7/18
201
8/19
Great Black-backed Gull, North Sea coast oil rate (OSPAR 8+9), logit transformed
logit oil rate North Sea coast 5-year running mean Linear (5-year running mean)

regions covered by The Netherlands. With the current oil rates, the fairly conservative OSPAR target (20% oiled by 2020) has been exceeded and the better target (10% in 2010) has in fact almost been reached.
As said in the previous report, beached bird surveys are a vital part of both the Oiled-Guillemot EcoQO as well as for the plastic particle monitoring conducted by using Northern Fulmar carcasses around the North Sea (Van Franeker & SNS Fulmar Study Group). More and more people prefer to post their findings directly online on internet as a way of rapid communication and data storage. Therefore, to complete the overview over strandings in The Netherlands, more opportunistic reports from www.waarneming.nl, and especially those reports that include clear photographic material were screened for double counts and identification errors, even to the sample size of stranded Common Guillemots and several other seabirds didn’t need to be enhanced. It is now foreseen that the waarneming.nl applications will be modified such that systematic beached bird surveys are better accommodated.
The Dutch data collected for OSPAR regions 8 and 9 must be seen as contributions to the data set. An international co-ordinator, or OSPAR itself, will have to combine Dutch, Belgian and German data for these areas in order to arrive at OSPAR area specific oil rates for Common Guillemots in the southeastern North Sea.
References
Anonymous 2002. Bergen Declaration. Ministerial declaration Fifth International Conference on the Protection of the North Sea, 20-21 March 2002, Bergen, Norway.
Anonymous 2012. Mariene Strategie voor het Nederlandse deel van de Noordzee 2012-2020, Deel 1. Rapport, Ministeries I&M en ELI, ‘s Gravenhage, The Netherlands.
Camphuysen C.J. 1989. Beached Bird Surveys in the Netherlands 1915-1988; Seabird Mortality in the southern North Sea since the early days of Oil Pollution. Techn. Rapport Vogelbescherming 1, Werkgroep Noordzee, Amsterdam 322pp.
Camphuysen C.J. 1995. Olieslachtoffers langs de Nederlandse kust als indicatoren van de vervuiling van de zee met olie. Sula 9(special issue): 1-90, I-XX.
Camphuysen C.J. 2003. Olieslachtoffers op de Nederlandse kust, 2002/2003: een trendbreuk in gevonden oliebevuilingspercentages. CSR Consultancy report 2003.01, Oosterend, Texel, 23pp.
Camphuysen C.J. 2010. Declines in oil-rates of stranded birds in the North Sea highlight spatial patterns in reductions of chronic oil pollution. Mar. Poll. Bull. 60: 1299-1306.
Camphuysen C.J. & Heubeck M. 2001. Marine oil pollution and beached bird surveys: the development of a sensitive monitoring instrument. Environmental Pollution 112: 443-461.

Camphuysen C.J. & Meer J. van der 1996. Recent trends in oiled seabirds. Ad Hoc working group on Monitoring, Oslo and Paris Convention for the Prevention of Marine Pollution, Environmental Assessment and Monitoring Committee (ASMO) . MON 1995 summary record: 20-48, Copenhagen.
Camphuysen C.J. & B. Vollaard 2015. Oil pollution in the Dutch sector of the North Sea. In: Carpenter A. (ed.) Oil Pollution in the North Sea. Handbook of Environmental Chemistry, Springer-Verlag, Berlin, Heidelberg, New York.
EU 2010. Commision Decision of 1 september 2010 on criteria and methodological standards on good environmental status of marine waters, Document nr 2010/477/EU.

Appendices
The tables below show raw data underlying the graphs in this report, except the long-term trends in densities. Shown are the oil rates (%), in parentheses when the sample size was <25 intact carcasses in a given winter and/or area, and the sample size (n), for each of the OSPAR regions (8-10) and for the North Sea coast as a whole (8+9).
(1) Common Guillemot Subregion 8 Subregion 9 subregion 10 National (8+9) ratio n= ratio n= ratio n= ration n= mean 1977/78 96.3 82 ( 100.0 ) 23 1977/78 96.2 105 1978/79 83.9 93 91.3 46 1978/79 86.3 139 1979/80 94.1 118 85.9 64 ( 66.7 ) 3 1979/80 91.2 182 1980/81 90.4 3061 96.0 448 91.8 233 1980/81 91.1 3509 91.2 1981/82 86.8 675 95.5 202 92.2 115 1981/82 88.8 877 90.7 1982/83 87.6 2494 95.6 1449 91.9 434 1982/83 90.5 3943 89.6 1983/84 87.4 1625 95.2 660 77.9 163 1983/84 89.6 2285 90.3 1984/85 77.1 855 89.5 474 87.2 47 1984/85 81.5 1329 88.3 1985/86 78.3 803 90.2 378 81.1 159 1985/86 82.1 1181 86.5 1986/87 89.7 107 96.1 51 ( 88.2 ) 17 1986/87 91.8 158 87.1 1987/88 96.1 1177 92.7 288 78.3 83 1987/88 95.4 1465 88.1 1988/89 73.0 1224 82.7 248 49.6 133 1988/89 74.6 1472 85.1 1989/90 79.5 1266 76.6 158 73.5 83 1989/90 79.1 1424 84.6 1990/91 83.9 1861 85.4 144 42.9 35 1990/91 84.0 2005 85.0 1991/92 88.9 522 92.2 268 ( 100.0 ) 6 1991/92 90.0 790 84.6 1992/93 41.4 794 28.7 150 40.7 123 1992/93 39.4 944 73.4 1993/94 60.8 559 56.4 179 52.8 106 1993/94 59.8 738 70.5 1994/95 69.1 246 75.8 124 71.1 83 1994/95 71.4 370 68.9 1995/96 58.6 111 62.3 61 ( 57.1 ) 7 1995/96 59.9 172 64.1 1996/97 84.2 146 77.5 71 ( 66.7 ) 6 1996/97 82.0 217 62.5 1997/98 69.5 285 64.6 144 ( 61.9 ) 21 1997/98 67.8 429 68.2 1998/99 43.3 1054 51.5 631 24.1 411 1998/99 46.4 1685 65.5 1999/00 78.7 675 76.8 310 60.4 149 1999/00 78.1 985 66.8 2000/01 48.1 108 63.5 197 42.9 49 2000/01 58.0 305 66.5 2001/02 62.6 340 55.0 320 50.7 138 2001/02 58.9 660 61.8 2002/03 95.9 1992 58.9 314 46.8 77 2002/03 90.9 2306 66.5 2003/04 83.7 141 69.3 215 45.9 61 2003/04 75.0 356 72.2 2004/05 61.5 265 39.7 312 42.7 103 2004/05 49.7 577 66.5 2005/06 53.7 82 56.8 132 47.9 71 2005/06 55.6 214 66.0 2006/07 28.4 356 23.5 153 13.2 76 2006/07 26.9 509 59.6 2007/08 ( 50.0 ) 18 48.8 43 ( 35.0 ) 20 2007/08 49.2 61 51.3 2008/09 ( 86.4 ) 22 76.5 68 ( 66.7 ) 9 2008/09 78.9 90 52.1 2009/10 ( 23.1 ) 13 34.8 23 ( 66.7 ) 9 2009/10 30.6 36 48.2 2010/11 ( 55.6 ) 9 37.5 24 ( ) 0 2010/11 42.4 33 45.6 2011/12 29.2 106 27.5 91 0.0 28 2011/12 28.4 197 45.9 2012/13 3.6 28 18.5 27 ( 33.3 ) 3 2012/13 10.9 55 38.2 2013/14 ( 0.0 ) 16 53.5 43 ( 12.5 ) 16 2013/14 39.0 59 30.3 2014/15 ( 55.6 ) 18 ( 10.5 ) 19 ( ) 0 2014/15 32.4 37 30.6 2015/16 ( 10.5 ) 19 2.5 122 4.0 25 2015/16 3.5 141 22.9 2016/17 2.7 37 10.0 30 ( 16.7 ) 6 2016/17 6.0 67 18.4 2017/18 0.0 26 13.3 30 ( 0.0 ) 20 2017/18 7.1 56 17.6 2018/19 9.8 51 4.7 382 ( 0.0 ) 15 2018/19 5.3 433 10.9
10.9 5yr mean 12.1 SD

(2) Razorbill Subregion 8 Subregion 9 subregion 10 National (8+9) ratio n= ratio n= ratio n= ratio n= 1977/78 92.6 27 ( 100.0 ) 23 1977/78 68.0 50 1978/79 84.0 25 ( 88.2 ) 17 1978/79 85.7 42 1979/80 96.8 31 ( 80.0 ) 10 ( 0.0 ) 0 1979/80 92.7 41 1980/81 96.2 496 100.0 77 88.5 26 1980/81 96.7 573 85.8 1981/82 94.8 77 96.7 30 ( 100.0 ) 19 1981/82 95.3 107 87.7 1982/83 84.7 1299 85.9 311 85.8 141 1982/83 84.9 1610 91.1 1983/84 92.9 547 91.9 37 96.8 31 1983/84 92.8 584 92.5 1984/85 90.1 71 93.3 45 ( 100.0 ) 2 1984/85 91.4 116 92.2 1985/86 87.4 127 93.5 46 ( 100.0 ) 4 1985/86 89.0 173 90.7 1986/87 ( 88.2 ) 17 ( 100.0 ) 6 ( 0.0 ) 0 1986/87 91.3 23 89.9 1987/88 94.3 175 75.4 61 ( 85.0 ) 20 1987/88 89.4 236 90.8 1988/89 87.5 152 88.9 36 ( 81.8 ) 11 1988/89 87.8 188 89.8 1989/90 72.0 690 60.6 66 48.0 25 1989/90 71.0 756 85.7 1990/91 79.3 174 76.5 34 ( 100.0 ) 2 1990/91 78.8 208 83.7 1991/92 97.6 42 96.3 27 ( 100.0 ) 6 1991/92 97.1 69 84.8 1992/93 72.9 59 ( 37.5 ) 8 ( 33.3 ) 6 1992/93 68.7 67 80.7 1993/94 83.7 49 ( 66.7 ) 15 ( 0.0 ) 2 1993/94 79.7 64 79.1 1994/95 77.4 53 79.3 29 ( 73.3 ) 15 1994/95 78.0 82 80.5 1995/96 28.9 121 30.4 46 ( 25.0 ) 4 1995/96 29.3 167 70.6 1996/97 62.5 24 75.0 16 ( 33.3 ) 3 1996/97 67.5 40 64.6 1997/98 58.4 77 55.2 29 ( 100.0 ) 2 1997/98 57.5 106 62.4 1998/99 71.4 77 61.4 57 ( 55.6 ) 18 1998/99 67.2 134 59.9 1999/00 75.7 259 73.3 86 ( 53.8 ) 13 1999/00 75.1 345 59.3 2000/01 ( 70.0 ) 10 77.8 18 ( 50.0 ) 2 2000/01 75.0 28 68.5 2001/02 58.4 77 55.3 38 ( 33.3 ) 18 2001/02 57.4 115 66.4 2002/03 87.8 841 38.2 178 ( 26.1 ) 23 2002/03 79.1 1019 70.7 2003/04 45.6 57 63.3 49 ( 66.7 ) 6 2003/04 53.8 106 68.1 2004/05 34.8 135 22.9 118 ( 13.0 ) 23 2004/05 29.2 253 58.9 2005/06 50.0 24 55.8 52 91.4 35 2005/06 53.9 76 54.7 2006/07 25.5 145 16.0 50 ( 22.2 ) 18 2006/07 23.1 195 47.8 2007/08 ( 16.7 ) 6 ( 14.3 ) 7 ( 0.0 ) 4 2007/08 15.4 13 35.1 2008/09 ( 60.0 ) 5 ( 50.0 ) 6 ( ) 0 2008/09 54.5 11 35.2 2009/10 ( 25.0 ) 8 ( 0.0 ) 3 ( 100.0 ) 1 2009/10 18.2 11 33.0 2010/11 ( 0.0 ) 4 ( 33.3 ) 3 ( ) 0 2010/11 14.3 7 25.1 2011/12 1.9 209 4.1 145 0.0 36 2011/12 2.8 354 21.0 2012/13 ) 0.0 ) 10 ( 20.0 ) 5 ( 0.0 ) 1 2012/13 6.7 15 19.3 2013/14 ) 0.0 ) 10 ( 0.0 ) 7 ( 0.0 ) 2 2013/14 0.0 17 8.4 2014/15 ( ) 0 ( 0.0 ) 7 ( ) 0 2014/15 0.0 7 4.8 2015/16 ( 0.0 ) 2 ( 5.0 ) 20 ( 0.0 ) 5 2015/16 4.5 22 2.8 2016/17 ( 0.0 ) 4 ( 0.0 ) 5 ( 0.0 ) 0 2016/17 0.0 9 2.2 2017/18 ( 11.1 ) 9 ( 11.1 ) 9 ( 0.0 ) 20 2017/18 11.1 18 3.1 2018/19 ( 0.0 ) 2 17.9 28 ( 0.0 ) 15 2018/19 16.7 30 6.5
6.5 5yr average 7.3 SD
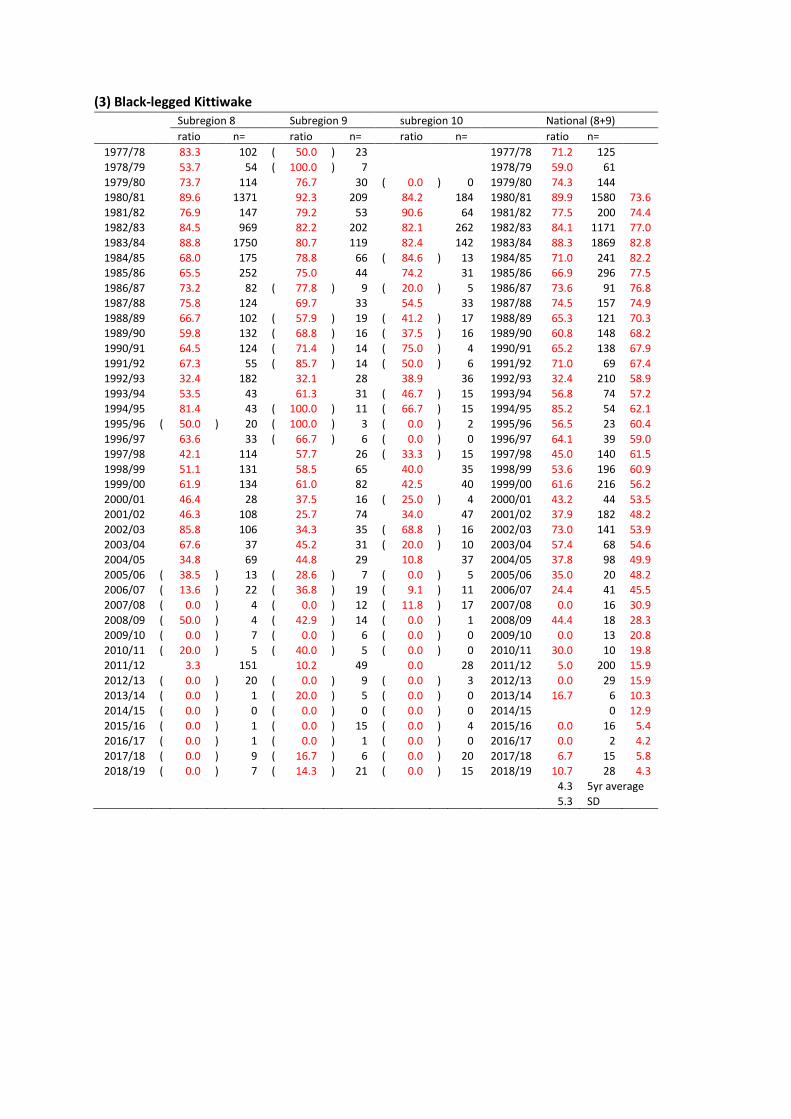
(3) Black-legged Kittiwake Subregion 8 Subregion 9 subregion 10 National (8+9) ratio n= ratio n= ratio n= ratio n= 1977/78 83.3 102 ( 50.0 ) 23 1977/78 71.2 125 1978/79 53.7 54 ( 100.0 ) 7 1978/79 59.0 61 1979/80 73.7 114 76.7 30 ( 0.0 ) 0 1979/80 74.3 144 1980/81 89.6 1371 92.3 209 84.2 184 1980/81 89.9 1580 73.6 1981/82 76.9 147 79.2 53 90.6 64 1981/82 77.5 200 74.4 1982/83 84.5 969 82.2 202 82.1 262 1982/83 84.1 1171 77.0 1983/84 88.8 1750 80.7 119 82.4 142 1983/84 88.3 1869 82.8 1984/85 68.0 175 78.8 66 ( 84.6 ) 13 1984/85 71.0 241 82.2 1985/86 65.5 252 75.0 44 74.2 31 1985/86 66.9 296 77.5 1986/87 73.2 82 ( 77.8 ) 9 ( 20.0 ) 5 1986/87 73.6 91 76.8 1987/88 75.8 124 69.7 33 54.5 33 1987/88 74.5 157 74.9 1988/89 66.7 102 ( 57.9 ) 19 ( 41.2 ) 17 1988/89 65.3 121 70.3 1989/90 59.8 132 ( 68.8 ) 16 ( 37.5 ) 16 1989/90 60.8 148 68.2 1990/91 64.5 124 ( 71.4 ) 14 ( 75.0 ) 4 1990/91 65.2 138 67.9 1991/92 67.3 55 ( 85.7 ) 14 ( 50.0 ) 6 1991/92 71.0 69 67.4 1992/93 32.4 182 32.1 28 38.9 36 1992/93 32.4 210 58.9 1993/94 53.5 43 61.3 31 ( 46.7 ) 15 1993/94 56.8 74 57.2 1994/95 81.4 43 ( 100.0 ) 11 ( 66.7 ) 15 1994/95 85.2 54 62.1 1995/96 ( 50.0 ) 20 ( 100.0 ) 3 ( 0.0 ) 2 1995/96 56.5 23 60.4 1996/97 63.6 33 ( 66.7 ) 6 ( 0.0 ) 0 1996/97 64.1 39 59.0 1997/98 42.1 114 57.7 26 ( 33.3 ) 15 1997/98 45.0 140 61.5 1998/99 51.1 131 58.5 65 40.0 35 1998/99 53.6 196 60.9 1999/00 61.9 134 61.0 82 42.5 40 1999/00 61.6 216 56.2 2000/01 46.4 28 37.5 16 ( 25.0 ) 4 2000/01 43.2 44 53.5 2001/02 46.3 108 25.7 74 34.0 47 2001/02 37.9 182 48.2 2002/03 85.8 106 34.3 35 ( 68.8 ) 16 2002/03 73.0 141 53.9 2003/04 67.6 37 45.2 31 ( 20.0 ) 10 2003/04 57.4 68 54.6 2004/05 34.8 69 44.8 29 10.8 37 2004/05 37.8 98 49.9 2005/06 ( 38.5 ) 13 ( 28.6 ) 7 ( 0.0 ) 5 2005/06 35.0 20 48.2 2006/07 ( 13.6 ) 22 ( 36.8 ) 19 ( 9.1 ) 11 2006/07 24.4 41 45.5 2007/08 ( 0.0 ) 4 ( 0.0 ) 12 ( 11.8 ) 17 2007/08 0.0 16 30.9 2008/09 ( 50.0 ) 4 ( 42.9 ) 14 ( 0.0 ) 1 2008/09 44.4 18 28.3 2009/10 ( 0.0 ) 7 ( 0.0 ) 6 ( 0.0 ) 0 2009/10 0.0 13 20.8 2010/11 ( 20.0 ) 5 ( 40.0 ) 5 ( 0.0 ) 0 2010/11 30.0 10 19.8 2011/12 3.3 151 10.2 49 0.0 28 2011/12 5.0 200 15.9 2012/13 ( 0.0 ) 20 ( 0.0 ) 9 ( 0.0 ) 3 2012/13 0.0 29 15.9 2013/14 ( 0.0 ) 1 ( 20.0 ) 5 ( 0.0 ) 0 2013/14 16.7 6 10.3 2014/15 ( 0.0 ) 0 ( 0.0 ) 0 ( 0.0 ) 0 2014/15 0 12.9 2015/16 ( 0.0 ) 1 ( 0.0 ) 15 ( 0.0 ) 4 2015/16 0.0 16 5.4 2016/17 ( 0.0 ) 1 ( 0.0 ) 1 ( 0.0 ) 0 2016/17 0.0 2 4.2 2017/18 ( 0.0 ) 9 ( 16.7 ) 6 ( 0.0 ) 20 2017/18 6.7 15 5.8 2018/19 ( 0.0 ) 7 ( 14.3 ) 21 ( 0.0 ) 15 2018/19 10.7 28 4.3
4.3 5yr average 5.3 SD

(4) Northern Fulmar Subregion 8 Subregion 9 subregion 10 National (8+9) ratio n= ratio n= ratio n= ratio n= 1977/78 76.0 25 ( 60.0 ) 23 0 1977/78 45.8 48 1978/79 58.8 34 ( 75.0 ) 8 0 1978/79 61.9 42 1979/80 59.3 27 ( 33.3 ) 9 ( ) 0 1979/80 52.8 36 1980/81 81.6 256 67.2 58 84.2 38 1980/81 79.0 314 59.9 1981/82 61.5 52 ( 36.8 ) 19 ( 65.2 ) 23 1981/82 54.9 71 58.9 1982/83 72.4 58 ( 65.0 ) 20 ( 66.7 ) 12 1982/83 70.5 78 63.8 1983/84 81.1 169 ( 75.0 ) 16 ( 66.7 ) 15 1983/84 80.5 185 67.5 1984/85 ( 66.7 ) 24 ( 66.7 ) 18 ( 100.0 ) 1 1984/85 66.7 42 70.3 1985/86 43.8 80 53.3 30 ( 37.5 ) 8 1985/86 46.4 110 63.8 1986/87 ( 22.2 ) 9 ( 50.0 ) 6 ( 0.0 ) 1 1986/87 33.3 15 59.5 1987/88 63.9 166 46.8 77 35.7 28 1987/88 58.4 243 57.1 1988/89 61.0 82 68.4 38 ( 25.0 ) 16 1988/89 63.3 120 53.6 1989/90 50.0 34 ( 66.7 ) 6 ( 0.0 ) 1 1989/90 52.5 40 50.8 1990/91 ( 36.4 ) 11 ( ) 0 ( ) 0 1990/91 36.4 11 48.8 1991/92 63.6 44 78.8 52 ( 33.3 ) 6 1991/92 71.9 96 56.5 1992/93 40.7 27 ( 12.5 ) 8 ( 33.3 ) 12 1992/93 34.3 35 51.7 1993/94 ( 33.3 ) 12 ( 66.7 ) 9 ( 50.0 ) 2 1993/94 47.6 21 48.5 1994/95 ( 57.1 ) 21 ( 30.8 ) 13 ( 63.6 ) 11 1994/95 47.1 34 47.4 1995/96 ( 50.0 ) 12 ( 25.0 ) 8 ( 100.0 ) 1 1995/96 40.0 20 48.2 1996/97 ( 38.5 ) 13 ( 66.7 ) 6 ( ) 0 1996/97 47.4 19 43.3 1997/98 29.0 31 19.4 31 ( 0.0 ) 2 1997/98 24.2 62 41.2 1998/99 26.3 399 42.1 247 29.9 97 1998/99 32.4 646 38.2 1999/00 43.5 69 43.9 57 ( 53.8 ) 13 1999/00 43.7 126 37.5 2000/01 ( 12.5 ) 16 22.2 27 ( 0.0 ) 4 2000/01 18.6 43 33.2 2001/02 21.3 244 30.8 78 25.0 28 2001/02 23.6 322 28.5 2002/03 67.9 28 ( 12.5 ) 24 ( 0.0 ) 4 2002/03 42.3 52 32.1 2003/04 18.4 103 10.6 161 3.6 28 2003/04 13.6 264 28.4 2004/05 14.7 34 15.0 40 ( 16.7 ) 18 2004/05 14.9 74 22.6 2005/06 4.2 24 ( 15.0 ) 20 ( 0.0 ) 4 2005/06 9.1 44 20.7 2006/07 12.0 25 ( 0.0 ) 10 ( 0.0 ) 10 2006/07 8.6 35 17.7 2007/08 ( 0.0 ) 5 ( 20.0 ) 20 ( 7.7 ) 13 2007/08 16.0 25 12.4 2008/09 ( 7.4 ) 27 10.9 55 ( 0.0 ) 7 2008/09 9.8 82 11.7 2009/10 ( 33.3 ) 3 ( 6.3 ) 16 ( 33.3 ) 3 2009/10 10.5 19 10.8 2010/11 ( 0.0 ) 4 ( 0.0 ) 5 ( ) 0 2010/11 0.0 9 9.0 2011/12 3.8 78 1.9 52 ( 0.0 ) 13 2011/12 3.1 130 7.9 2012/13 ( 0.0 ) 2 ( 0.0 ) 3 ( ) 0 2012/13 0.0 5 4.7 2013/14 ( 0.0 ) 2 ( ) 0 ( 0.0 ) 1 2013/14 0.0 2 2.7 2014/15 ( 0.0 ) 0 ( 0.0 ) 2 ( ) 0 2014/15 0.0 2 0.6 2015/16 ( 0.0 ) 3 ( 0.0 ) 10 ( ) 0 2015/16 0.0 13 0.6 2016/17 ( 0.0 ) 11 ( 0.0 ) 13 ( 0.0 ) 3 2016/17 0.0 24 0.0 2017/18 ( 0.0 ) 9 ( 0.0 ) 2 ( 0.0 ) 20 2017/18 0.0 11 0.0 2018/19 ( 0.0 ) 4 ( 12.5 ) 16 ( 0.0 ) 15 2018/19 10.0 20 2.0
2.0 5yr average 4.5 SD

(5) Northern Gannet Subregion 8 Subregion 9 subregion 10 National (8+9) ratio n= ratio n= ratio n= ratio n= 1977/78 ( 50.0 ) 12 ( 66.7 ) 23 1977/78 28.6 35 1978/79 ( 30.0 ) 20 ( 50.0 ) 4 1978/79 33.3 24 1979/80 ( 54.2 ) 24 ( 14.3 ) 7 ( ) 0 1979/80 45.2 31 1980/81 45.3 86 26.9 26 ( 25.0 ) 8 1980/81 41.1 112 37.0 1981/82 57.4 47 ( 45.5 ) 22 ( 42.9 ) 14 1981/82 53.6 69 40.4 1982/83 82.2 90 ( 69.6 ) 23 ( 63.6 ) 11 1982/83 79.6 113 50.6 1983/84 51.5 66 ( 66.7 ) 12 ( 54.5 ) 11 1983/84 53.8 78 54.7 1984/85 69.2 26 ( 53.8 ) 13 ( 100.0 ) 2 1984/85 64.1 39 58.5 1985/86 27.4 62 ( 30.0 ) 20 ( 50.0 ) 10 1985/86 28.0 82 55.9 1986/87 ( 61.1 ) 18 ( 50.0 ) 6 ( 0.0 ) 1 1986/87 58.3 24 56.8 1987/88 17.8 73 4.7 43 ( 5.3 ) 19 1987/88 12.9 116 43.5 1988/89 22.0 41 ( 33.3 ) 18 ( 20.0 ) 15 1988/89 25.4 59 37.8 1989/90 69.1 55 ( 80.0 ) 10 ( 66.7 ) 3 1989/90 70.8 65 39.1 1990/91 85.7 49 ( 100.0 ) 6 ( 100.0 ) 1 1990/91 87.3 55 50.9 1991/92 56.8 37 ( 52.2 ) 23 ( 0.0 ) 6 1991/92 55.0 60 50.3 1992/93 60.0 40 ( 22.2 ) 9 ( 11.1 ) 9 1992/93 53.1 49 58.3 1993/94 72.4 29 ( 70.0 ) 10 ( 75.0 ) 4 1993/94 71.8 39 67.6 1994/95 66.7 27 ( 40.0 ) 15 ( 55.6 ) 9 1994/95 57.1 42 64.9 1995/96 ( 40.0 ) 10 ( 25.0 ) 8 ( ) 0 1995/96 33.3 18 54.1 1996/97 ( 60.0 ) 20 ( 71.4 ) 7 ( ) 0 1996/97 63.0 27 55.7 1997/98 31.3 32 13.8 29 ( 0.0 ) 2 1997/98 23.0 61 49.6 1998/99 9.3 324 12.8 164 10.5 76 1998/99 10.5 488 37.4 1999/00 38.1 63 38.5 52 ( 33.3 ) 9 1999/00 38.3 115 33.6 2000/01 ( 26.3 ) 19 46.2 39 ( 20.0 ) 5 2000/01 39.7 58 34.9 2001/02 4.0 200 8.5 59 ( 0.0 ) 21 2001/02 5.0 259 23.3 2002/03 74.3 35 ( 12.5 ) 24 ( 0.0 ) 4 2002/03 49.2 59 28.5 2003/04 3.4 87 4.6 151 0.0 27 2003/04 4.2 238 27.3 2004/05 19.4 36 24.4 45 ( 6.3 ) 16 2004/05 22.2 81 24.1 2005/06 ( 4.2 ) 24 ( 19.0 ) 21 ( 50.0 ) 8 2005/06 11.1 45 18.3 2006/07 21.4 28 ( 9.1 ) 11 ( 16.7 ) 12 2006/07 17.9 39 20.9 2007/08 ( 28.6 ) 7 38.5 26 ( 14.3 ) 14 2007/08 36.4 33 18.4 2008/09 3.8 ) 26 7.5 53 ( 0.0 ) 7 2008/09 6.3 79 18.8 2009/10 ( 33.3 ) 3 ( 11.8 ) 17 ( 0.0 ) 2 2009/10 15.0 20 17.4 2010/11 ( 0.0 ) 4 ( 0.0 ) 5 ( ) 0 2010/11 0.0 9 15.1 2011/12 2.6 77 1.9 52 ( 0.0 ) 13 2011/12 2.3 129 12.0 2012/13 ( 0.0 ) 2 ( 0.0 ) 3 ( ) 0 2012/13 0.0 5 4.7 2013/14 ( 0.0 ) 2 ( ) 0 ( 0.0 ) 1 2013/14 0.0 2 3.5 2014/15 ( ) 0 ( 0.0 ) 2 ( ) 0 2014/15 0.0 2 0.5 2015/16 ( 0.0 ) 3 ( 0.0 ) 10 ( ) 0 2015/16 0.0 13 0.5 2016/17 ( 0.0 ) 11 ( 0.0 ) 13 ( 0.0 ) 3 2016/17 0.0 24 0.0 2017/18 ( 10.0 ) 10 ( 33.3 ) 3 ( 50.0 ) 20 2017/18 15.4 13 3.1 2018/19 ( 0.0 ) 4 ( 12.5 ) 16 ( 0.0 ) 15 2018/19 10.0 20 5.1
5.1 5yr average 7.2 SD

(6) Common Eider Subregion 8 Subregion 9 subregion 10 National (8+9) ratio n= ratio n= ratio n= ratio n= 1977/78 ( 71.4 ) 14 ( 75.0 ) 23 1977/78 35.1 37 1978/79 ( 53.3 ) 15 27.6 29 1978/79 36.4 44 1979/80 ( 71.4 ) 7 54.8 31 ( 25.0 ) 4 1979/80 57.9 38 1980/81 ( 76.2 ) 21 69.6 56 39.3 61 1980/81 71.4 77 50.2 1981/82 ( 36.4 ) 22 44.0 50 37.0 119 1981/82 41.7 72 48.5 1982/83 47.1 34 58.0 169 41.3 392 1982/83 56.2 203 52.7 1983/84 57.7 52 17.2 122 17.7 379 1983/84 29.3 174 51.3 1984/85 22.9 96 15.7 287 14.3 509 1984/85 17.5 383 43.2 1985/86 ( 50.0 ) 8 15.9 107 5.7 211 1985/86 18.3 115 32.6 1986/87 62.9 35 78.6 355 75.3 174 1986/87 77.2 390 39.7 1987/88 99.5 555 52.8 322 17.3 237 1987/88 82.3 877 44.9 1988/89 40.0 50 45.8 216 10.9 523 1988/89 44.7 266 48.0 1989/90 ( 87.5 ) 8 16.2 68 17.7 209 1989/90 23.7 76 49.2 1990/91 11.0 429 2.0 204 2.0 200 1990/91 8.1 633 47.2 1991/92 36.8 261 7.6 340 ( 13.5 ) 6 1991/92 20.3 601 35.8 1992/93 34.1 123 8.5 153 2.3 343 1992/93 19.9 276 23.3 1993/94 28.6 28 3.4 58 12.0 108 1993/94 11.6 86 16.7 1994/95 29.3 41 6.1 66 8.1 533 1994/95 15.0 107 15.0 1995/96 4.6 108 9.0 178 ( 4.1 ) 121 1995/96 7.3 286 14.8 1996/97 9.7 31 25.9 81 ( 4.4 ) 206 1996/97 21.4 112 15.1 1997/98 18.5 27 3.8 78 ( 9.5 ) 105 1997/98 7.6 105 12.6 1998/99 ( 6.3 ) 16 29.1 55 11.1 171 1998/99 23.9 71 15.1 1999/00 20.2 455 4.7 1631 3.4 4982 1999/00 8.1 2086 13.7 2000/01 6.6 91 1.9 377 0.2 965 2000/01 2.8 468 12.8 2001/02 1.5 323 3.9 613 1.6 2723 2001/02 3.1 936 9.1 2002/03 73.7 57 4.3 232 1.1 474 2002/03 18.0 289 11.2 2003/04 ( 20.0 ) 10 4.2 71 1.4 209 2003/04 6.2 81 7.6 2004/05 ( 0.0 ) 14 2.9 170 1.7 480 2004/05 2.7 184 6.6 2005/06 ( 16.7 ) 12 4.0 101 1.5 267 2005/06 5.3 113 7.1 2006/07 ( 0.0 ) 4 0.0 38 1.5 130 2006/07 0.0 42 6.4 2007/08 ( ) 0 4.2 24 0.0 59 2007/08 4.2 24 3.7 2008/09 ( 0.0 ) 1 1.5 67 0.0 82 2008/09 1.5 68 2.7 2009/10 ( ) 0 0.0 51 2.8 71 2009/10 0.0 51 2.2 2010/11 ( 0.0 ) 3 ( 0.0 ) 16 ( ) 0 2010/11 0.0 19 1.1 2011/12 ( 0.0 ) 6 0.9 112 0.0 61 2011/12 0.8 118 1.3 2012/13 ( ) 0 ( 0.0 ) 5 ( 0.0 ) 5 2012/13 0.0 5 0.5 2013/14 ( ) 0 ( 0.0 ) 9 ( 0.0 ) 6 2013/14 0.0 9 0.2 2014/15 ( ) 0 ( 0.0 ) 5 ( ) 0 2014/15 0.0 5 0.2 2015/16 ( ) 0 ( 0.0 ) 7 ( 0.0 ) 14 2015/16 0.0 7 0.2 2016/17 ( ) 0 ( 0.0 ) 11 ( 0.0 ) 7 2016/17 0.0 11 0.0 2017/18 ( ) 0 ( 0.0 ) 3 ( 0.0 ) 20 2017/18 0.0 3 0.0 2018/19 ( 0.0 ) 2 ( 0.0 ) 0 ( 0.0 ) 15 2018/19 0.0 2 0.0
0.0 5yr average 0.0 SD

(7) Herring Gull Subregion 8 Subregion 9 subregion 10 National (8+9) ratio n= ratio n= ratio n= ratio n= 1977/78 68.8 64 ( 71.4 ) 23 0.0 3 1977/78 56.3 87 1978/79 38.9 211 ( 36.8 ) 19 1978/79 38.7 230 1979/80 32.0 122 18.4 38 ( 0.0 ) 4 1979/80 28.8 160 1980/81 73.7 350 63.6 88 25.0 40 1980/81 71.7 438 48.9 1981/82 52.1 257 27.4 84 13.2 121 1981/82 46.0 341 48.3 1982/83 61.2 237 61.7 60 20.1 134 1982/83 61.3 297 49.3 1983/84 46.4 412 47.4 38 12.3 162 1983/84 46.4 450 50.8 1984/85 31.3 224 26.8 82 17.4 144 1984/85 30.1 306 51.1 1985/86 23.2 181 14.7 95 10.9 119 1985/86 20.3 276 40.8 1986/87 37.2 113 21.0 81 ( 9.3 ) 75 1986/87 30.4 194 37.7 1987/88 47.2 106 37.0 46 5.2 116 1987/88 44.1 152 34.3 1988/89 24.7 174 19.6 56 5.1 137 1988/89 23.5 230 29.7 1989/90 21.4 215 ( 26.1 ) 23 8.2 49 1989/90 21.8 238 28.0 1990/91 14.2 169 ( 60.0 ) 5 0.0 9 1990/91 15.5 174 27.1 1991/92 25.7 105 ( 50.0 ) 20 ( 0.0 ) 6 1991/92 29.6 125 26.9 1992/93 10.5 105 10.0 30 9.7 72 1992/93 10.4 135 20.2 1993/94 30.4 92 ( 46.2 ) 13 0.0 24 1993/94 32.4 105 21.9 1994/95 31.4 70 8.0 50 6.8 73 1994/95 21.7 120 21.9 1995/96 9.6 83 11.1 36 ( 0.0 ) 54 1995/96 10.1 119 20.8 1996/97 6.3 64 12.9 31 ( 0.0 ) 29 1996/97 8.4 95 16.6 1997/98 8.6 81 ( 17.4 ) 23 ( 5.0 ) 20 1997/98 10.6 104 16.6 1998/99 17.6 102 28.0 25 12.5 40 1998/99 19.7 127 14.1 1999/00 17.9 84 25.7 35 9.1 44 1999/00 20.2 119 13.8 2000/01 5.0 40 2.2 46 0.0 99 2000/01 3.5 86 12.5 2001/02 2.7 74 9.4 32 3.6 166 2001/02 4.7 106 11.7 2002/03 41.2 51 6.7 45 0.7 135 2002/03 25.0 96 14.6 2003/04 ( 16.7 ) 24 14.3 28 0.0 74 2003/04 15.4 52 13.8 2004/05 10.8 37 0.0 25 2.2 91 2004/05 6.5 62 11.0 2005/06 ( 7.1 ) 14 ( 5.3 ) 19 3.4 116 2005/06 6.1 33 11.5 2006/07 ( 0.0 ) 10 ( 5.9 ) 17 0.0 63 2006/07 3.7 27 11.3 2007/08 ( 0.0 ) 6 ( 0.0 ) 8 ( 0.0 ) 47 2007/08 0.0 14 6.3 2008/09 ( 0.0 ) 13 3.8 26 ( 0.0 ) 61 2008/09 2.6 39 3.8 2009/10 ( 0.0 ) 7 2.3 44 ( 0.0 ) 40 2009/10 2.0 51 2.9 2010/11 ( 0.0 ) 11 0.0 18 ( ) 0 2010/11 0.0 29 1.6 2011/12 0.0 26 0.0 30 0.0 37 2011/12 0.0 56 0.9 2012/13 ( 28.6 ) 7 ( 0.0 ) 7 ( 0.0 ) 8 2012/13 14.3 14 3.8 2013/14 ( 0.0 ) 3 ( 0.0 ) 14 ( 12.5 ) 8 2013/14 0.0 17 3.2 2014/15 ( 0.0 ) 5 ( 0.0 ) 6 ( ) 0 2014/15 0.0 11 2.9 2015/16 ( 0.0 ) 2 ( 0.0 ) 21 0.0 25 2015/16 0.0 23 2.9 2016/17 ( ) 0 0.0 37 ( 0.0 ) 15 2016/17 0.0 37 2.9 2017/18 ( 0.0 ) 2 0.0 42 ( 0.0 ) 20 2017/18 0.0 44 0.0 2018/19 ( 0.0 ) 1 ( 11.8 ) 17 ( 0.0 ) 15 2018/19 11.1 18 2.2 2.2 5yr average 5.0 SD

(8) Great Black-backed Gull Subregion 8 Subregion 9 subregion 10 National (8+9)
ratio n= ratio n= ratio n= ratio n= 1977/78 59.3 27 ( 0.0 ) 23 ( 0.0 ) 2 1977/78 32.0 50 1978/79 38.1 63 ( 18.2 ) 11 1978/79 35.1 74 1979/80 31.6 38 ( 12.5 ) 8 ( 0.0 ) 1 1979/80 28.3 46 1980/81 73.7 95 ( 54.2 ) 24 ( 50.0 ) 6 1980/81 69.7 119 41.3 1981/82 66.3 95 26.5 34 35.7 28 1981/82 55.8 129 44.2 1982/83 66.2 77 ( 73.7 ) 19 39.6 48 1982/83 67.7 96 51.3 1983/84 62.3 77 ( 53.3 ) 15 11.3 53 1983/84 60.9 92 56.5 1984/85 19.4 36 ( 13.3 ) 15 ( 12.5 ) 8 1984/85 17.6 51 54.4 1985/86 34.5 29 ( 6.3 ) 16 12.1 33 1985/86 24.4 45 45.3 1986/87 14.8 27 ( 60.0 ) 15 ( 0.0 ) 11 1986/87 31.0 42 40.3 1987/88 42.9 7 ( 61.1 ) 18 ( 15.0 ) 20 1987/88 56.0 25 38.0 1988/89 38.5 13 ( 25.0 ) 8 ( 4.8 ) 21 1988/89 33.3 21 32.5 1989/90 18.2 22 ( 28.6 ) 7 ( 25.0 ) 4 1989/90 20.7 29 33.1 1990/91 17.9 28 ( 25.0 ) 4 ( 0.0 ) 2 1990/91 18.8 32 31.9 1991/92 22.5 40 ( 33.3 ) 3 ( 0.0 ) 6 1991/92 23.3 43 30.4 1992/93 30.8 13 ( 0.0 ) 3 ( 0.0 ) 17 1992/93 25.0 16 24.2 1993/94 25.0 8 ( 33.3 ) 6 ( 0.0 ) 6 1993/94 28.6 14 23.3 1994/95 15.4 13 ( 25.0 ) 12 ( 12.5 ) 8 1994/95 20.0 25 23.1 1995/96 7.1 14 ( 0.0 ) 7 ( 0.0 ) 5 1995/96 4.8 21 20.3 1996/97 33.3 6 ( 14.3 ) 7 ( 0.0 ) 11 1996/97 23.1 13 20.3 1997/98 18.2 11 ( 28.6 ) 7 ( 0.0 ) 10 1997/98 22.2 18 19.7 1998/99 29.6 27 ( 29.4 ) 17 0.0 28 1998/99 29.5 44 19.9 1999/00 7.7 13 ( 18.2 ) 11 11.8 34 1999/00 12.5 24 18.4 2000/01 0 ( 11.1 ) 18 ( 0.0 ) 23 2000/01 11.1 18 19.7 2001/02 8.3 12 ( 11.1 ) 9 0.0 30 2001/02 9.5 21 17.0 2002/03 50.0 8 ( 6.7 ) 15 ( 9.5 ) 21 2002/03 21.7 23 16.9 2003/04 25.0 8 ( 14.3 ) 14 ( 0.0 ) 24 2003/04 18.2 22 14.6 2004/05 23.1 13 ( 30.0 ) 10 ( 0.0 ) 15 2004/05 26.1 23 17.3 2005/06 0.0 7 ( 0.0 ) 10 ( 0.0 ) 18 2005/06 0.0 17 15.1 2006/07 0.0 4 ( 0.0 ) 15 ( 0.0 ) 24 2006/07 0.0 19 13.2 2007/08 ( ) 0 ( 0.0 ) 3 ( 0.0 ) 15 2007/08 0.0 3 8.9 2008/09 ( 0.0 ) 6 ( 0.0 ) 11 ( 0.0 ) 9 2008/09 0.0 17 5.2 2009/10 ( 0.0 ) 5 ( 0.0 ) 14 ( 0.0 ) 7 2009/10 0.0 19 0.0 2010/11 ( 0.0 ) 2 ( 0.0 ) 5 ( ) 0 2010/11 0.0 7 0.0 2011/12 8.3 24 ( 5.3 ) 19 ( 0.0 ) 18 2011/12 7.0 43 1.4 2012/13 0.0 3 ( 0.0 ) 5 ( 0.0 ) 4 2012/13 0.0 8 1.4 2013/14 ( 0.0 ) 4 ( 0.0 ) 2 ( 0.0 ) 3 2013/14 0.0 6 1.4 2014/15 ( 0.0 ) 3 ( 0.0 ) 4 ( ) 0 2014/15 0.0 7 1.4 2015/16 ( 0.0 ) 2 ( 0.0 ) 12 ( 0.0 ) 2 2015/16 0.0 14 1.4 2016/17 0.0 2 0.0 36 ( 0.0 ) 13 2016/17 0.0 38 0.0 2017/18 0.0 2 ( 0.0 ) 3 ( 0.0 ) 20 2017/18 0.0 5 0.0 2018/19 0.0 7 ( 0.0 ) 8 ( 0.0 ) 15 2018/19 0.0 15 0.0
0.0 5yr average 0.0 SD