Embed Size (px)
Citation preview
Journal of Analytical and Applied Pyrolysis, 20 (1991) 197-227 Elsevier Science Publishers B.V., Amsterdam
197
Molecular archaeology: analysis of charred (food) remains from prehistoric pottery by pyrolysis-gas chromatography/mass spectrometry
T.F.M. Oudemans a,b** and J.J. Boon a
a Unit for Mass Spectrometty of Macromolecular Systems, FOM Institute for Atomic and Molecular Physics, Kruislaan 407, 1098 SJ Amsterdam (The Netherlank)
b Institute for Prehistory Leyden, Postbus 9515, 2300 RA Leyden (The Netherlands)
(Received September 17, 1990; accepted in final form December 20, 1990)
ABSTRACT
The suitability of analytical pyrolysis techniques for the chemical characterisation of amorphous (charred) organic residues obtained from prehistoric pottery was studied. No chemical preparation of the sample was needed and the analysis was performed on very small samples (20-30 pg). Curie-point pyrolysis mass spectrometry and Curie-point pyrolysis gas chromatography were used for rapid characterisation of 33 residue-samples obtained from the outside (5) and inside (28) of different types of pottery from the native Roman settlement at Uitgeest-Groot Dorregeest (Netherlands). Discriminant analysis of the data shows several groups of residues of different chemical composition. Four representative residue samples were selected for more detailed analysis by Curie-point pyrolysis-gas chromatography/mass spectrometry. Many bio-organic moieties were detected in the residues situated on the inside of pots including fatty acids and characteristic markers for proteins and polysaccharides. Since no indications could be found to assume severe post-depositional changes in chemical composition, it is clear that the composition of the residues is a reflection of the original use in prehistoric times. The refractory nature of the charred (food) residues causes the preserva- tion of the bio-organic characteristics. Other classes of compounds, such as polycyclic aromatic hydrocarbons, were detected in residues from the outside and were interpreted as
smoke condensates from open cooking fires. A regular alkane/alkene pattern found in many residues and in the ceramic material of the pot sherd is interpreted as the pyrolysis product of an aliphatic network that has been formed from foodstuffs under high temperature condi- tions during cooking.
Archaeology; Curie-point pyrolysis; gas chromatography; mass spectrometry; organic food residues; prehistoric pottery; pyrolysis.
INTRODUCTION
Amorphous organic (food) remains on pottery from archaeological sites have been noted and studied chemically by archaeologists since the end of
0165-2370/91/$03.50 Q 1991 Elsevier Science Publishers B.V.
198
the last century. A bibliography was published by RottlZnder and Schlichtherle in 1980 [l]. These early studies remained incidental and limited to special cases such as wine and beer residues, oils and ointments. No systematic approach was ever undertaken until the early 1970s when more detailed archaeological questions could be addressed due to the improve- ments in analytical instrumentation. The application of analytical chemistry to the study of organic residues on pottery has, since then, expanded and is concentrated mainly on fatty substances soluble in organic solvents [2-121. The samples are prepared by selective chemical methods which focus on the analysis of only a specific part of the original material. A second complicat- ing factor is the limited availability of archaeological samples. The use of Curie-point pyrolysis in combination with mass spectrometric techniques helps to overcome these problems because a very small sample (20-30 pg) can be analysed directly in its solid state without any preparation apart from grinding. A strong point of these techniques is the capacity to analyse a complex mixture of compounds almost without discriminating effects (al- though the conversion of the sample into analysable volatiles is not quantita- tive). Though the interpretational problems for archaeology are not directly solved by using CuPy-MS and CuPy-CC/MS, it does become possible to compare very different samples directly with one another on a molecular level. Organic residues, pottery fragments and soil samples can all be analysed and compared to get more detailed information about the presence of different compounds. It should be noted that pyrolysis techniques have not been used, so far, to study food remains from archaeological pottery. Wright and Wheals [13] have applied filament Py-MS for its capacities to analyse polymeric materials in their study of natural gums, resins and waxes from Egyptian mummy cases.
The archaeological importance of chemical studies of amorphous residues on pottery lies in the discovery of information on the natural resources used by people in prehistoric times and on the techniques applied to prepare food, dyes, oils and paints. Such studies may also reveal information about the actual use of pottery and as such become an important factor in the determination of the relationship between form, function (actual use) and production technology of pottery.
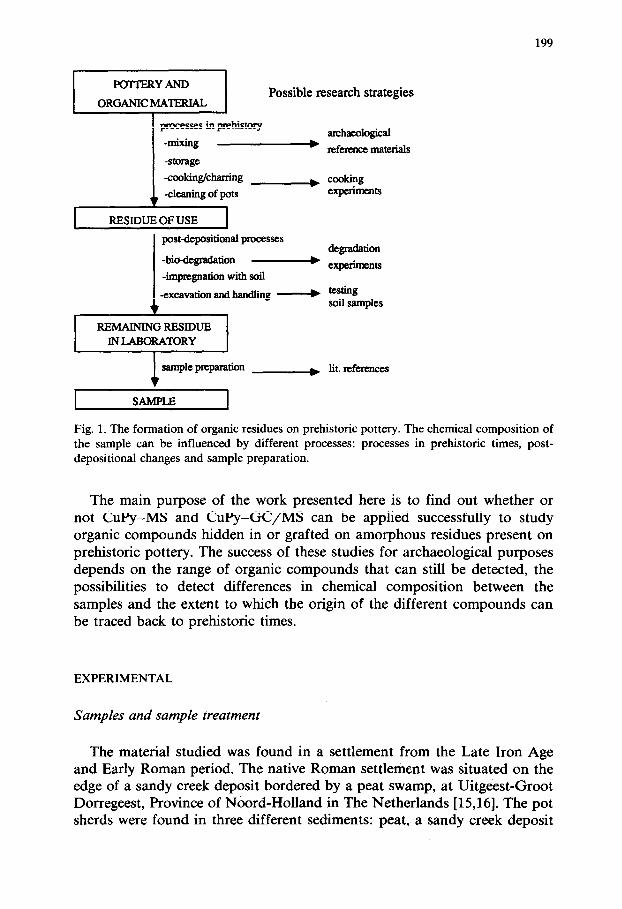
Figure 1 summarises the many changes archaeological materials have undergone with time. The residues can be seen as the remainder of a series of formation steps such as processes in prehistoric times (including heating, cooking, mixing, charring, storage or fermentation), processes after use (post-depositional processes including mechanical wear, bio-degradation, impregnation with soil or leaching of original compounds into the surround- ing sediment) and finally handling by archaeologists (including washing, scrubbing, wrapping in paper or plastics and contamination with greasy fingers, ink, glue or dust). The interpretation of chemical results may, therefore, remain very difficult [14].
199
POTERYAND
ORGANIC MATERIAL Possible research strategies
processes in prehistory
-mixing arellaeological
- reference materlals -storage
-cooldng/charrlng ) cooking
-cleaning of pots experiments
I RESIDUE OF USE
post-&positional processes &gradation
-biodegradation - experkxrts -lrnpre.gnatlon with soil
1 -excavation and handling -& testing soil samples
1 sample preparation ht. references )
I SAMPLE I
Fig. 1. The formation of organic residues on prehistoric pottery. The chemical composition of the sample can be influenced by different processes: processes in prehistoric times, post- depositional changes and sample preparation.
The main purpose of the work presented here is to find out whether or not CuPy-MS and CuPy-GC/MS can be applied successfully to study organic compounds hidden in or grafted on amorphous residues present on prehistoric pottery. The success of these studies for archaeological purposes depends on the range of organic compounds that can still be detected, the possibilities to detect differences in chemical composition between the samples and the extent to which the origin of the different compounds can be traced back to prehistoric times.
EXPERIMENTAL
Samples and sample treatment
The material studied was found in a settlement from the Late Iron Age and Early Roman period. The native Roman settlement was situated on the edge of a sandy creek deposit bordered by a peat swamp, at Uitgeest-Groot Dorregeest, Province of Noord-Holland in The Netherlands [l&16]. The pot sherds were found in three different sediments: peat, a sandy creek deposit
200
TABLE 1
Experimental and archaeological samples for GC/MS analysis (pot types after Abbink [17])
No. Sample Description Sediment Pot Sample
type location
1 Experiment Flour, protein and fat heated for5minat100°C - - -
2 Experiment Flour, protein and fat heated for 125 min at 250 o C - - -
3 Residue Brown, 0.2 cm Humic clay IIb Inside 4 Residue Cream coloured, < 0.1 cm Sand Sherd Inside 5 Residue Brown/black, 0.2 cm Sand Sherd Inside 6 Residue Black, 0.2 cm Humic clay Ib Outside 7 Ceramic Grey fired clay Sand Sherd -
and in humic clay fillings (e.g. filled up prehistoric water wells or a filled up natural creek).
The organic residues, situated on different pots, were of different colour and appearance (Table 1). The residues were mostly charred, dark brown or black crusts (on the inside of pots), but some were white or cream coloured
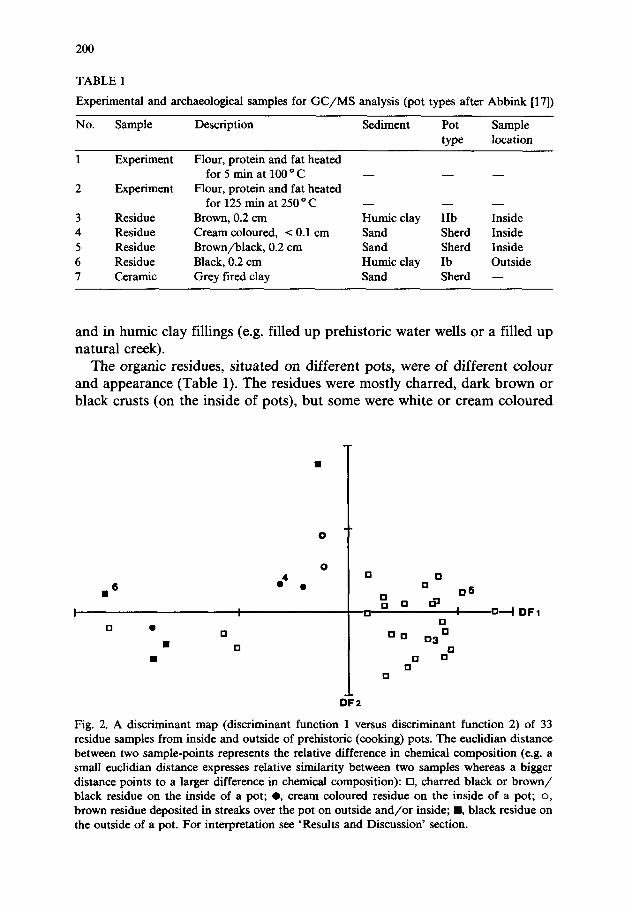
Fig. 2. A discriminant map (discriminant function 1 versus discriminant function 2) of 33 residue samples from inside and outside of prehistoric (cooking) pots. The euclidian distance between two sample-points represents the relative difference in chemical composition (e.g. a small euclidian distance expresses relative similarity between two samples whereas a bigger distance points to a larger difference in chemical composition): 0, charred black or brown/ black residue on the inside of a pot; 0, cream coloured residue on the inside of a pot; o, brown residue deposited in streaks over the pot on outside and/or inside; n , black residue on the outside of a pot. For interpretation see ‘Results and Discussion’ section.
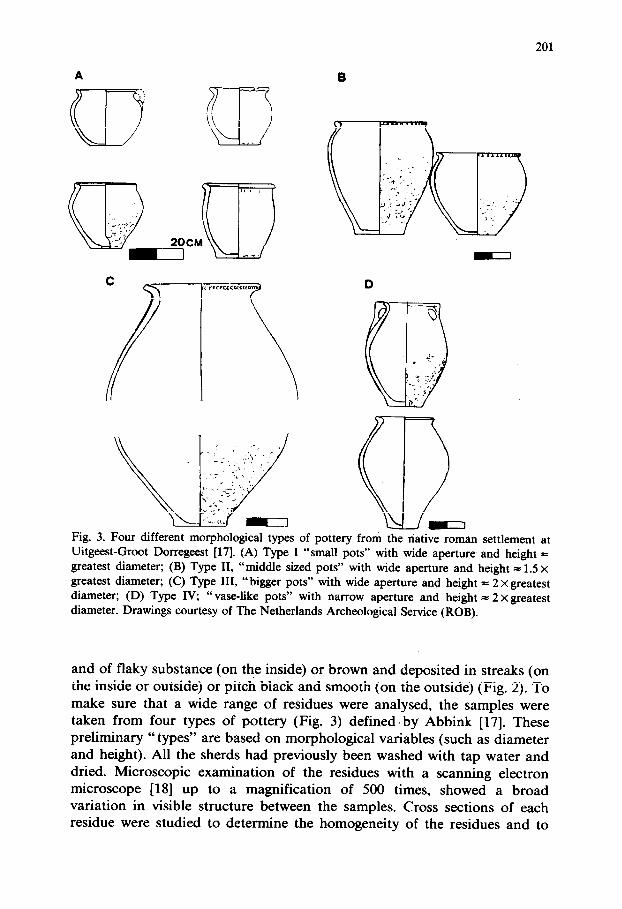
Q? Fig. 3. Four different morphological types of pottery from the native roman settlement at Uitgeest-Groot Dorregeest [17]. (A) Type I “small pots” with wide aperture and height = greatest diameter; (B) Type II, “middle sized pots” with wide aperture and height = 1.5 x greatest diameter; (C) Type III, “bigger pots” with wide aperture and height = 2Xgreatest diameter; (D) Type IV; “vase-like pots” with narrow aperture and height = 2 ~greatest diameter. Drawings courtesy of The Netherlands Archeological Service (ROB).
and of flaky substance (on the inside) or brown and deposited in streaks (on the inside or outside) or pitch black and smooth (on the outside) (Fig. 2). To make sure that a wide range of residues were analysed, the samples were taken from four types of pottery (Fig. 3) defined’by Abbink [17]. These preliminary “types” are based on morphological variables (such as diameter and height). All the sherds had previously been washed with tap water and dried. Microscopic examination of the residues with a scanning electron microscope [18] up to a magnification of 500 times, showed a broad variation in visible structure between the samples. Cross sections of each residue were studied to determine the homogeneity of the residues and to
202
make sure only one layer was sampled. The residues presented here show no visible division in layers, so it is assumed that they represent the last use of the vessel. The samples were scraped from the pottery with a sterile scalpel. To prevent contamination with organic soil material, the top layer of the residue was first removed before the actual sample was taken. Thirty three samples were analysed by pyrolysis mass spectrometry and twenty eight by pyrolysis-gas chromatography. Four archaeological residue-samples of dif- ferent chemical composition were selected for pyrolysis-gas chromatogra- phy/mass spectrometry analysis (Table 1, Fig. 2).
The pot sherd material (ceramic) was also sampled and analysed. The sample was taken after removal of the residues and 1 mm of the pottery wall (to prevent mixing with the residue).
Soil samples were analysed for comparison. The two samples available from the peat around the site had been kept in a dry state for about a year prior ‘to analysis.
Controlled cooking experiments were done to get information about the chemical composition of different charred materials. Series of samples were taken from mixtures of recent foodstuffs that had been heated for various lengths of time.
Of all the samples about 100 pg was ground with a small glass mortar and pestle after which a suspension was made in about 50 ~1 ultrapure water (Millipore Q” grade).
Analytical methods and instrumentation
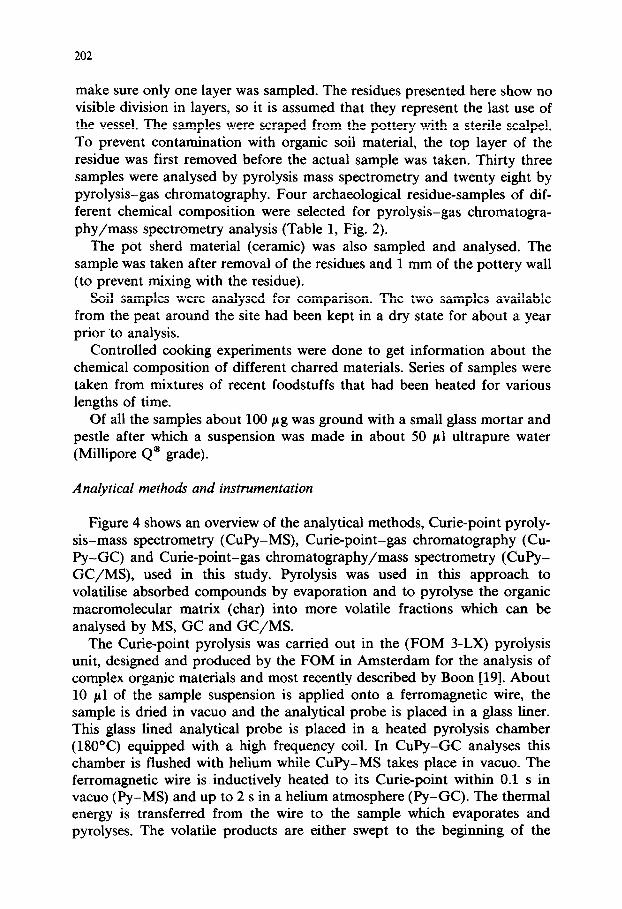
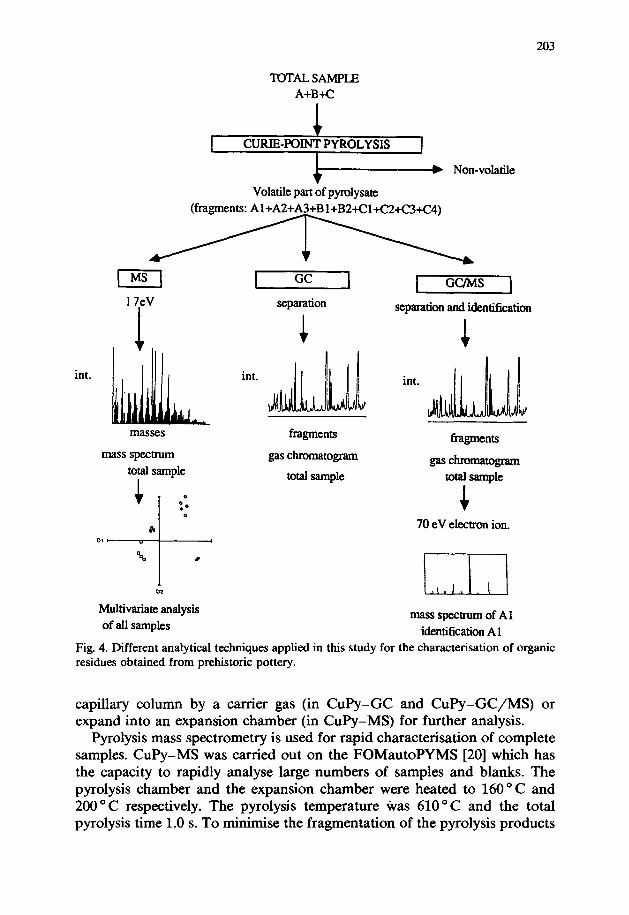
Figure 4 shows an overview of the analytical methods, Curie-point pyroly- sis-mass spectrometry (CuPy-MS), Curie-point-gas chromatography (Cu- Py-GC) and Curie-point-gas chromatography/mass spectrometry (CuPy- GC/MS), used in this study. Pyrolysis was used in this approach to volatilise absorbed compounds by evaporation and to pyrolyse the organic macromolecular matrix (char) into more volatile fractions which can be analysed by MS, GC and GC/MS.
The Curie-point pyrolysis was carried out in the (FOM 3-LX) pyrolysis unit, designed and produced by the FOM in Amsterdam for the analysis of complex organic materials and most recently described by Boon [19]. About 10 ~1 of the sample suspension is applied onto a ferromagnetic wire, the sample is dried in vacua and the analytical probe is placed in a glass liner. This glass lined analytical probe is placed in a heated pyrolysis chamber (180°C) equipped with a high frequency coil. In CuPy-GC analyses this chamber is flushed with helium while CuPy-MS takes place in vacua. The ferromagnetic wire is inductively heated to its Curie-point within 0.1 s in vacua &-MS) and up to 2 s in a helium atmosphere (Py-GC). The thermal energy is transferred from the wire to the sample which evaporates and pyrolyses. The volatile products are either swept to the beginning of the
203
TOTAL SAMPLE A+B+C
I I GUMS 1
Volatile part of pyrolysate
17eV
int.
masses
mass spectrum
total sample
c 0 “.o 0
--l--
+ 0,
=.a I c
01
Multivariate analysis
of all samples
separation
c separation and identification
int. int.
i k
fragments
gas chromatogmm
total sample
fragments
gas chmmatoglam
total sample
c
70 eV electron ion.
I,/._. I
mass spectrum of Al
identification A 1
Fig. 4. Different analytical techniques applied in this study for the characterisation of organic residues obtained from prehistoric pottery.
capillary column by a carrier gas (in CuPy-GC and CuPy-GC/MS) or expand into an expansion chamber (in CuPy-MS) for further analysis.
Pyrolysis mass spectrometry is used for rapid characterisation of complete samples. CuPy-MS was carried out on the FOMautoPYMS [20] which has the capacity to rapidly analyse large numbers of samples and blanks. The pyrolysis chamber and the expansion chamber were heated to 160°C and 200” C respectively. The pyrolysis temperature was 610” C and the total pyrolysis time 1.0 s. To minimise the fragmentation of the pyrolysis products
204
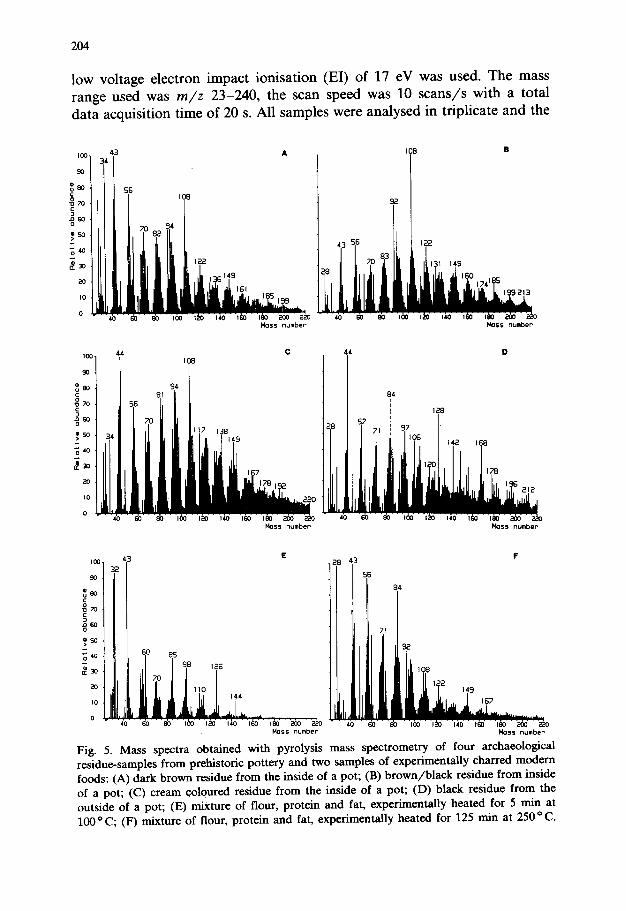
low voltage electron impact ionisation (EI) of 17 eV was used. The mass range used was m/z 23-240, the scan speed was 10 scans/s with a total data acquisition time of 20 s. All samples were analysed in triplicate and the
34
!
56
A
E F
Mass number l4as.s number
Fig. 5. Mass spectra obtained with pyrolysis mass spectrometry of four archaeological residue-samples from prehistoric pottery and two samples of experimentally charred modem foods: (A) dark brown residue from the inside of a pot; (B) brown/black residue from inside of a pot; (C) cream coloured residue from the inside of a pot; (D) black residue from the outside of a pot; (E) mixture of flour, protein and fat, experimentally heated for 5 min at 100 o C; (F) mixture of flour, protein and fat, experimentally heated for 125 mm at 250 o C.
205
CuPy-MS data shown (Fig. 5) are averaged spectra over the total pyrolysis period and of all three samples analysed. This kind of “fingerprinting” analysis is very suitable for comparative studies of samples using multi- variate analysis, but does not give much information about the nature of the individual components in the spectra because the spectra are cumulative. Multivariate analysis was performed using the FOMpyroMAP package for CuPy-MS data [20] (Fig. 2). Pyrolysis-gas chromatography and pyrolysis- gas chromatography/mass spectrometry are used to further identify the mixture of the pyrolysate by separation and identification of the different compounds involved.
The Curie-point pyrolysis-gas chromatography was performed with a Carlo Erba 4200 gas chromatograph equipped with a flame ionisation detector (FID). The column used was a 50 m CP Sil 5 CB fused silica capillary column (inner diameter 0.32 mm, film thickness 1.2 pm). Both injector and detector were kept at 280 o C. The GC oven was kept at 30 o C during pyrolysis and was subsequently programmed to 300 o C at 6 o C/min. The data were recorded with a Nelson 760 interface and an Olivetti M28 PC loaded with Model 2600 Chromatography Software from Nelson Analytical.
Curie-point pyrolysis-gas chromatography/mass spectrometry was done on a Packard 438-S gas chromatograph and a JEOL DX-303 double focuss- ing mass spectrometer equipped with the JEOL data system DA-5000. CuPy-GC/MS was done under the same chromatographic conditions and on the same column as the Py-GC work. The GC column ended directly in the ion source of the mass spectrometer. Compounds were ionised at 70 eV electron impact voltage and the acceleration voltage was 3 kV. Scan speed of the mass spectrometer was 1 scan/set over a mass range of m/z 20-1000. Mass calibration was carried out using PFK. In both CuPy-GC and CuPy-GC/MS helium was used as carrier gas.
RESULTS AND DISCUSSION
Survey with CuPy-MS and CuPy-GC/MS
The results of the CuPy-MS analyses of the total set of 33 residue samples (see also Fig. 5) show clear qualitative differences in chemical composition of the residues. With the use of a disciminant analysis (part of the FOMpyroMAP package) [20] it was possible to quantify these relative differences. Figure 2 shows the total data set, divided in roughly three groups of samples, in a discriminant map (discriminant function (DF) 1 versus DF 2). In this figure the distance between two samples represents the relative difference in chemical composition of these samples. One group of samples on the right side (determined by the DFl -t ) shows protein char- acteristics and free fatty acids, another group on the far left hand side
206
(determined by the DFl - ) shows many markers for polynuclear aromatic hydrocarbons (PAHs), alkanes and alkenes. A less clearly defined group of samples is present in the centre. The DF2 -I- axis expresses mainly markers for sulphur containing compounds. The results of a CuPy-GC survey of 28 of these samples confirm this classification.
Based on this preliminary interpretation four samples were selected for more detailed analysis with CuPy-GC/MS (Table 1).
Identification individual cornpout& with CuPy-GC/ MS
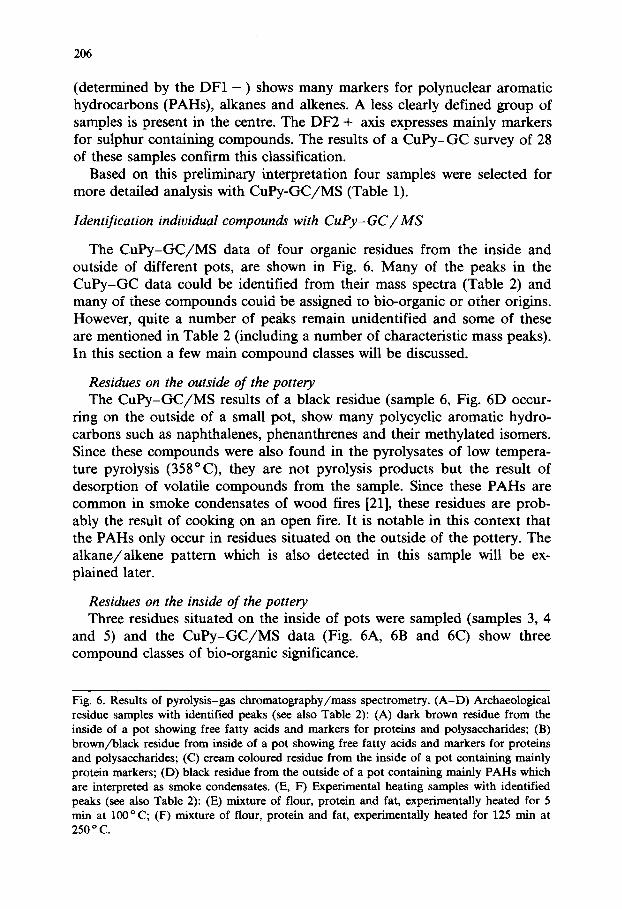
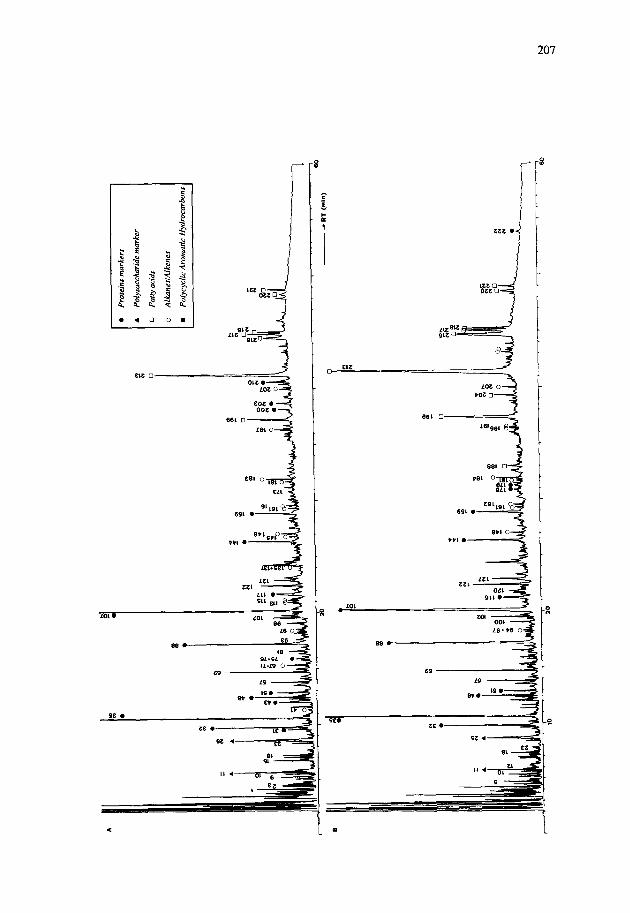
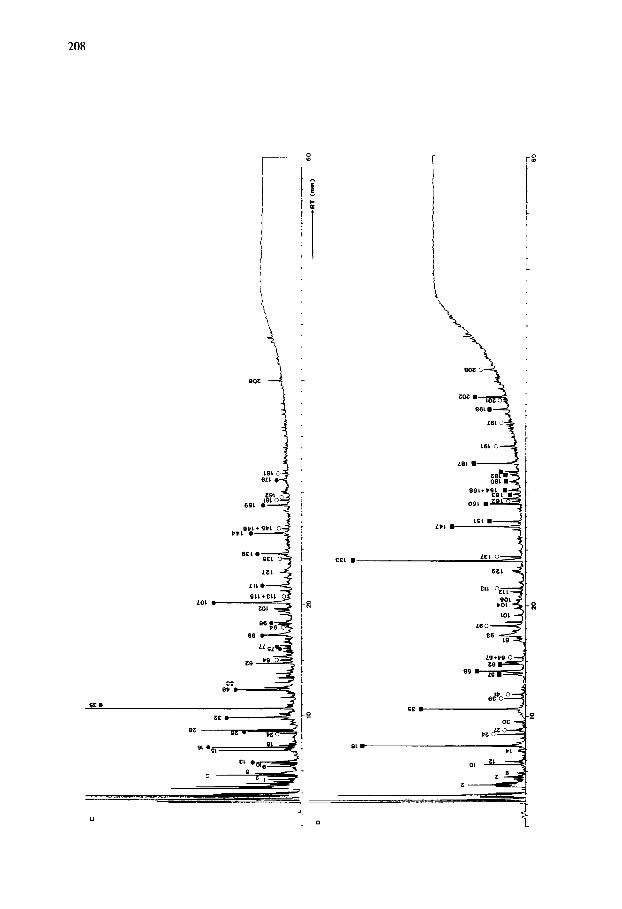
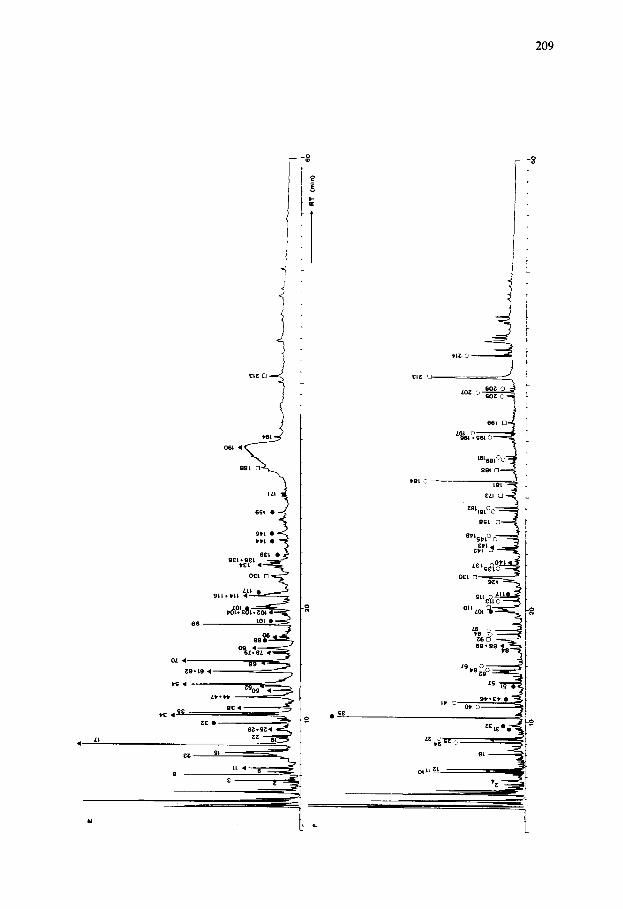
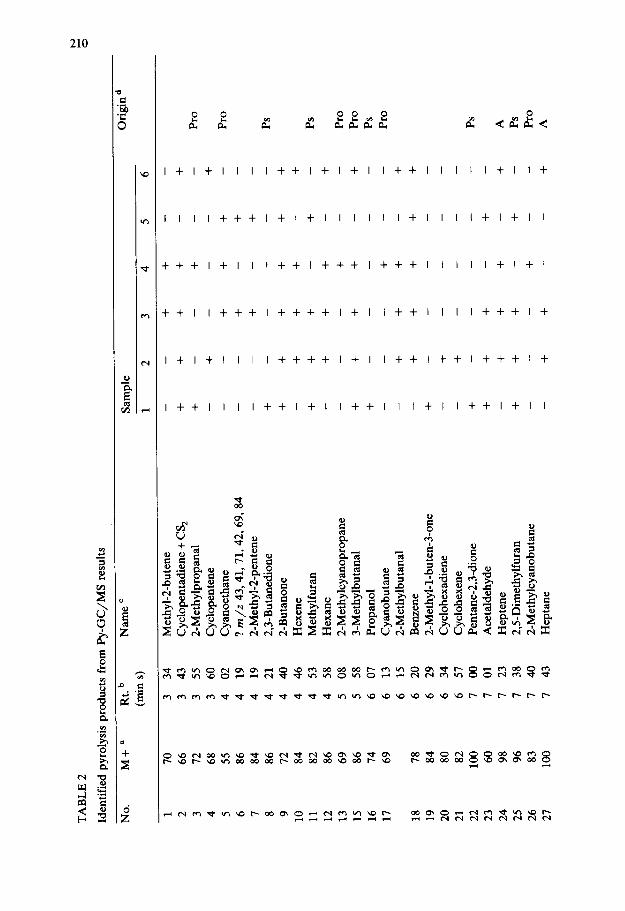
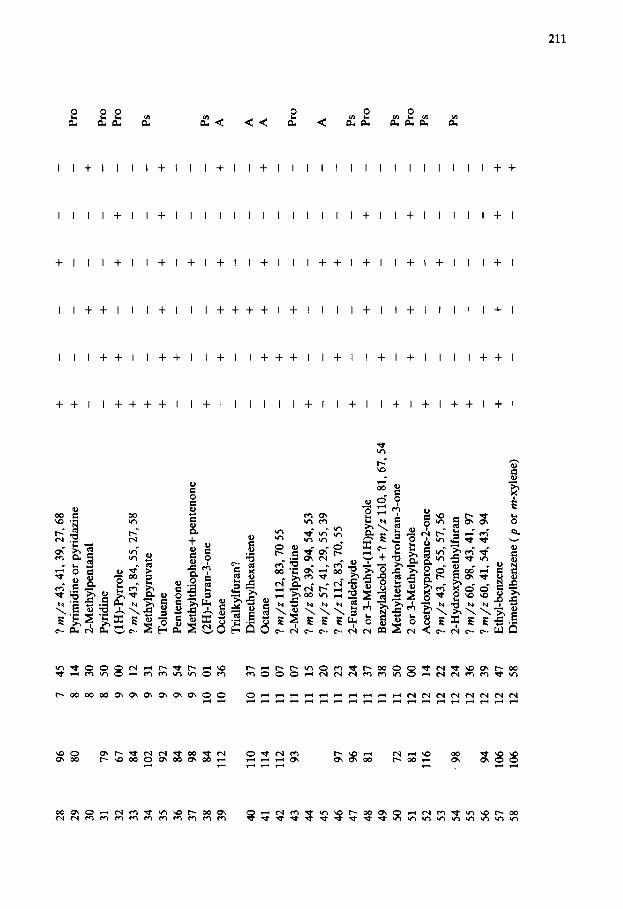
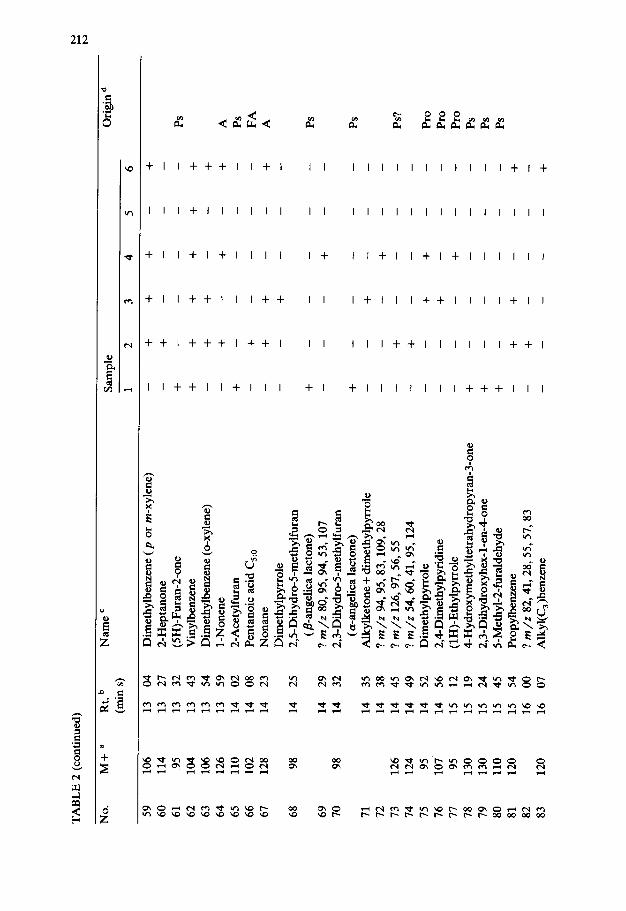
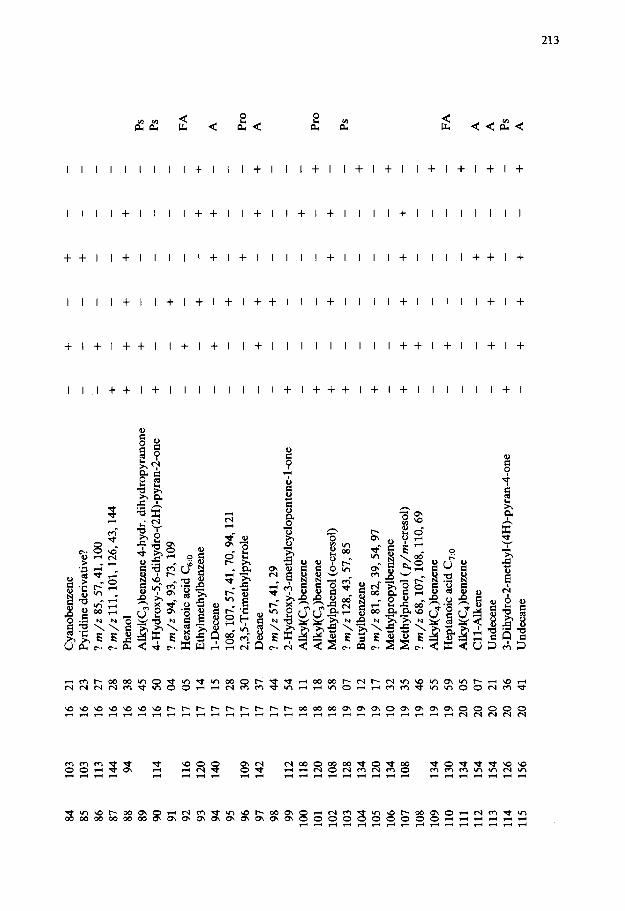
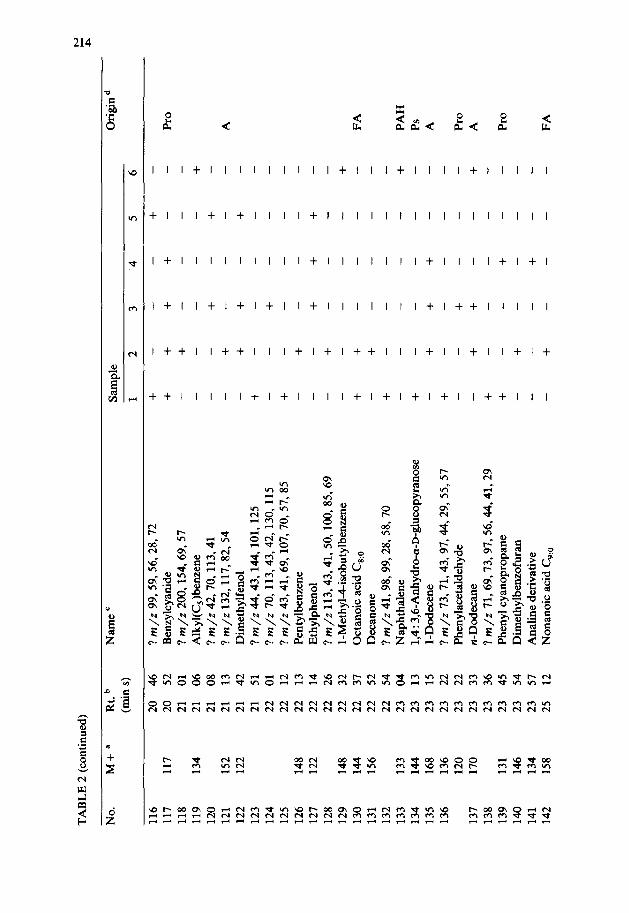
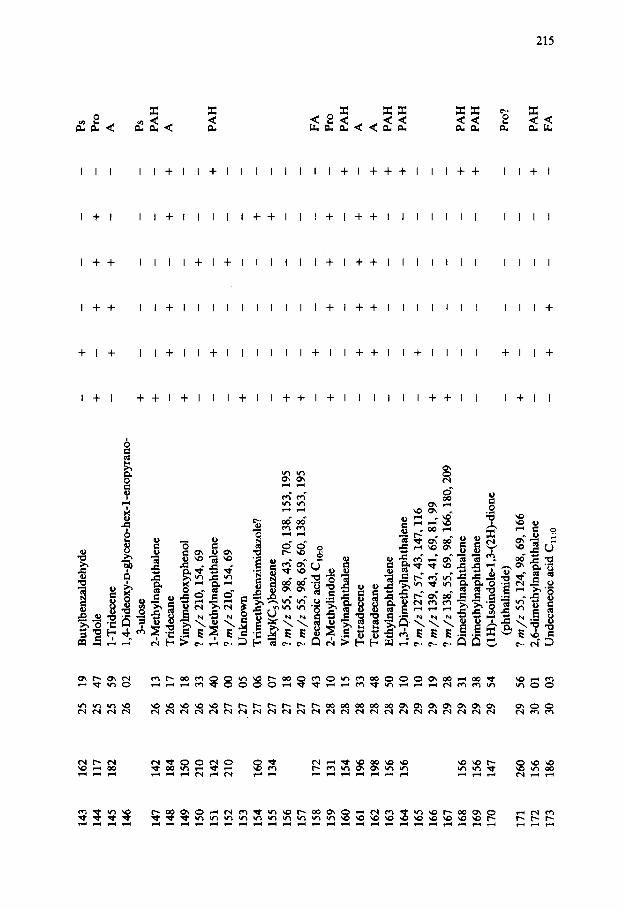
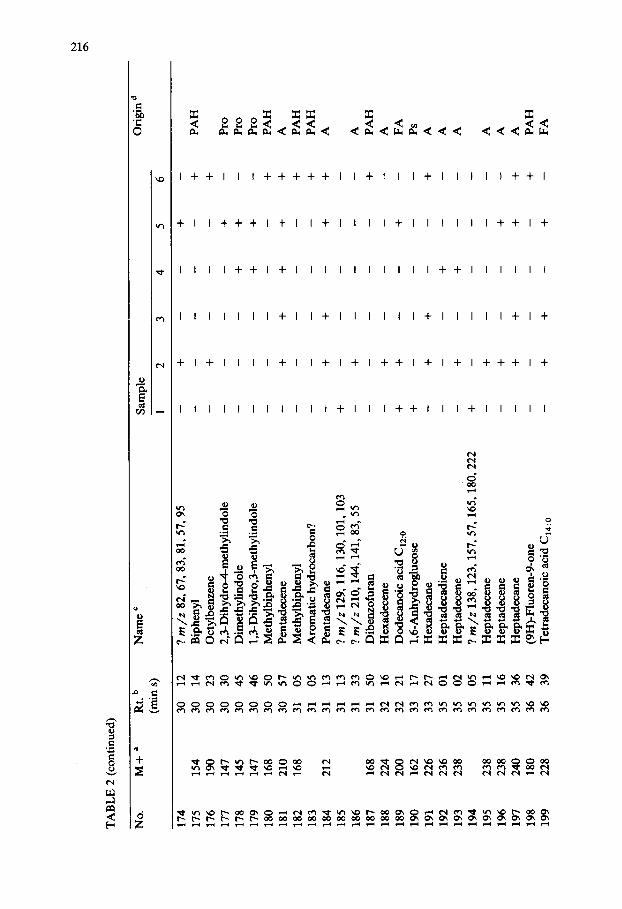
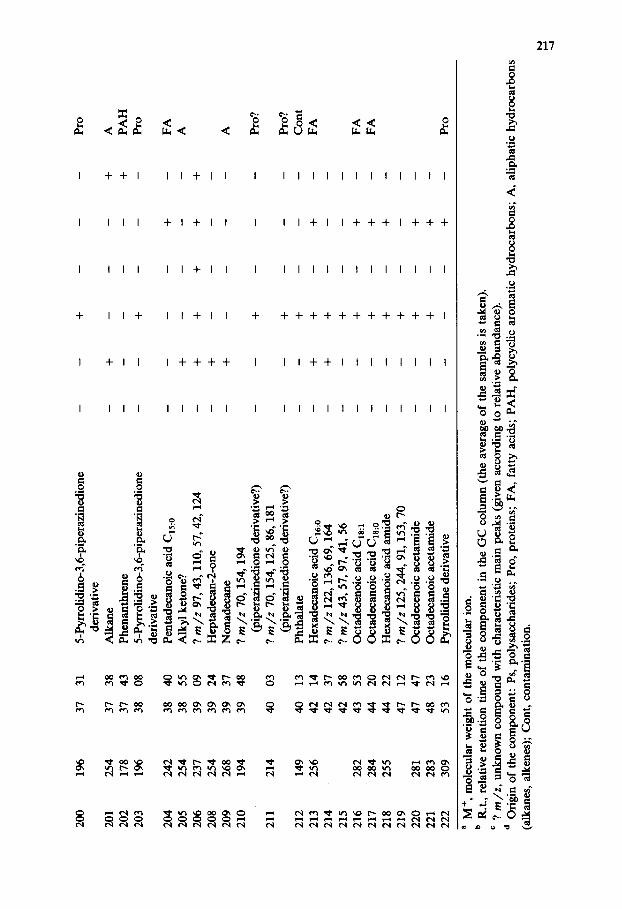
The CuPy-GC/MS data of four organic residues from the inside and outside of different pots, are shown in Fig. 6. Many of the peaks in the CuPy-GC data could be identified from their mass spectra (Table 2) and many of these compounds could be assigned to bio-organic or other origins. However, quite a number of peaks remain unidentified and some of these are mentioned in Table 2 (including a number of characteristic mass peaks). In this section a few main compound classes will be discussed.
Residues on the outside of the pottery The CuPy-GC/MS results of a black residue (sample 6, Fig. 6D occur-
ring on the outside of a small pot, show many polycyclic aromatic hydro- carbons such as naphthalenes, phenanthrenes and their methylated isomers. Since these compounds were also found in the pyrolysates of low tempera- ture pyrolysis (358OC), they are not pyrolysis products but the result of desorption of volatile compounds from the sample. Since these PAHs are common in smoke condensates of wood fires [21], these residues are prob- ably the result of cooking on an open fire. It is notable in this context that the PAHs only occur in residues situated on the outside of the pottery. The alkane/alkene pattern which is also detected in this sample will be ex- plained later.
Residues on the inside of the pottery Three residues situated on the inside of pots were sampled (samples 3, 4
and 5) and the CuPy-GC/MS data (Fig. 6A, 6B and 6C) show three compound classes of bio-organic significance.
Fig. 6. Results of pyrolysis-gas chromatography/mass spectrometry. (A-D) Archaeological residue samples with identified peaks (see also Table 2): (A) dark brown residue from the inside of a pot showing free fatty acids and markers for proteins and polysaccharides; (B) brown/black residue from inside of a pot showing free fatty acids and markers for proteins and polysaccharides; (C) cream coloured residue from the inside of a pot containing mainly protein markers; (D) black residue from the outside of a pot containing mainly PAHs which are interpreted as smoke condensates. (E, F) Experimental heating samples with identified peaks (see also Table 2): (E) mixture of flour, protein and fat, experimentally heated for 5 min at 100°C; (F) mixture of flour, protein and fat, experimentally heated for 125 min at 250 Q C.
207
208
r- r0
EC, .
209
c
l *
TA
BLE
2
Iden
tifi
ed p
yrol
ysis
pro
duct
s fr
om P
y-G
C/M
S re
sult
s
No.
M
+”
Nam
e ’
2
Sam
ple
O
rigi
n d
1 2
3 4
5 6
1 2 3 4 5 6 7 8 9 10
11
12
13
15
16
17
18
19
20
21
22
23
24
25
26
27
70
3 34
M
eth
yl-2
-bu
ten
e 66
3
43
Cyc
lop
enta
die
ne
+ C
S,
72
3 55
2-
Met
hyl
pro
pan
al
68
3 60
C
yclo
pen
ten
e 55
4
02
Cya
noe
than
e 86
4
19
? m
/z
43,4
1,71
,42,
69,8
4 84
4
19
2-M
eth
yl-2
-pen
ten
e 86
4
21
2,3-
Bu
tan
edio
ne
72
4 40
2-
Bu
tan
one
84
4 46
H
exen
e 82
4
53
Met
hylf
uran
86
4
58
Hex
ane
69
5 08
2-
Met
hylc
yano
prop
ane
86
5 58
3-
Met
hyl
bu
tan
al
74
6 07
Pr
opan
ol
69
6 13
C
yano
buta
ne
6 15
2-
Met
hyl
bu
tan
al
78
6 20
B
enze
ne
84
6 29
2-
Met
hyl
-1-b
ute
n-3
-on
e 80
6
34
Cyc
loh
exad
ien
e 82
6
57
Cyc
loh
exen
e 10
0 7
00
Pen
tan
e-2,
3-d
ion
e 60
7
01
Ace
tald
ehyd
e 98
7
23
Hep
ten
e 96
7
38
2,5-
Dim
ethy
lfur
an
83
7 40
2-
Met
hyl
cyan
obu
tan
e 10
0 7
43
Hep
tan
e
- + +
- - - +
+
- +
+
-
- +
- + - - _ - +
+ +
+
- +
- +
+
- + +
- +
+
+
- +
+
+
- - +
+
+ - +
+
+ i- - +
- - + +
- - - +
+
+
- +
+ +
+
- +
- - +
+
- + +
+
- + +
+
- - - - + - +
-
- - - +
+ +
- +
- + - - - - - - +
- - - +
+
- -
- +
- +
- - - - +
+
- + - +
- - +
+
- - - - - +
- - +
Pro
Pro
Ps
Ps Pro
Pro
Ps
Pro
Ps
A
Ps
Pro
A
28
29
30
31
32
33
34
35
36
37
38
39
40
41
42
43
44
45
46
47
48
49
50
51
52
53
54
55
56
57
58
96
80
79
67
84
102 92
84
98
84
11
2
110
114
112 93
97
96
81
72
81
116 98
94
106
106
7 45
8
14
8 30
8
50
9 00
9
12
9 31
9
37
9 54
9
57
10
01
10
36
10
37
11
01
11
07
11
07
11
15
11
20
11
23
11
24
11
37
11
38
11
50
12
00
12
14
12
22
12
24
12
36
12
39
12
47
12
58
? m
/z
43,4
1,39
,27,
68
+
-
Pyri
mid
ine
or p
yrid
azin
e -I
- -
2-M
ethy
lpen
tana
l -
-
Pyri
dine
-
+
(1 H
)-Py
rrol
e +
+
? m
/r
43,8
4,55
,27,
58
+
-
Met
hylp
yruv
ate
+
-
Tol
uene
+
+
Pent
enon
e -
+
Met
hylth
ioph
ene
+ p
ente
none
-
-
(2H
)-Fu
ran-
3-on
e +
-
Oct
ene
- +
Tri
alky
lfur
an?
- -
Dim
ethy
lhex
adie
ne
- -
Oct
ane
+
? m
/r
112,
83,7
0 55
-
i-
2-M
ethy
lpyr
idin
e -
+
? m
/z
82,3
9,94
,54,
53
+
-
? m
/z
57,4
1,29
,55,
39
-
? m
/z
112,
83,7
0,55
-
+
2-Fu
rald
ehyd
e +
-
2 or
3-M
ethy
l-(l
H)p
yrro
le
- -
Ben
zyla
lcoh
ol
+ ?
m/z
11
0,81
,67,
54
- +
Met
hylte
trah
ydro
fura
n-3-
one
+
-
2 or
3-M
ethy
lpyr
role
-
+
Ace
tylo
xypr
opan
e-2-
one
+
-
? m
/z
43,7
0,55
,57,
56
- -
2-H
ydro
xym
ethy
lfur
an
+
-
? m
/z
60,9
8,43
,41,
97
+
-
? m
/z
60,4
1,54
,43,
94
- +
Eth
yl-b
enze
ne
+
+
Dim
ethy
lben
zene
( p
or
m-x
ylen
e)
- -
- +
-
-
+
- +
-
- +
- -
-
+
+
- -
- +
-
-
+
+
+
- +
-
+
+
- -
+
- -
- -
+
- +
-
-
+
+
- - -
+
+
- -
+
- -
- -
- -
+
+
-
- - - - - - - - - - - +
- +
- - - - +
-
- - Pr
o +
-
Pro
- Pr
o - -
PS
+
- - PS
+
A
- -
A
+
A
- Pr
o -
A
- - PS
-
Pro
- - PS
-
Pro
- Ps
- -
Ps
- - +
+
TA
BLE
2
(con
tinu
ed)
c:
w
No.
M
+ a
Nam
e ’
Sam
ple
O
rigi
n d
1 2
3 4
5 6
59
106
13
04
60
114
13
27
61
95
13
32
62
104
13
43
63
106
13
54
64
126
13
59
65
110
14
02
66
102
14
08
67
128
14
23
68
98
14
25
69
70
98
14
29
14
32
71
72
73
74
75
76
77
78
79
80
81
82
83
126
124 95
10
7 95
130
130
110
120
120
14
35
14
38
14
45
14
49
14
52
14
56
15
12
15
19
15
24
15
45
15
54
16
00
16
07
Dim
ethy
lben
zene
( p
or
m-x
ylen
e)
2-H
epta
non
e (S
H)-
Fura
n-2-
one
Vin
ylb
enze
ne
Dim
ethy
lben
zene
(o-
xyle
ne)
I-
Non
ene
2-A
cety
lfu
ran
P
enta
noi
c ac
id C
s:O
N
onan
e D
imet
hylp
yrro
le
2,5-
Dih
ydro
-5-m
ethy
lfur
an
( /3-
ange
lica
lac
ton
e)
? m
/z
80,9
5,94
,53,
107
2,3-
Dih
ydro
-5-m
ethy
lfur
an
(a-a
nge
lica
la
cton
e)
Alk
ylke
tone
+ d
imet
hylp
yrro
le
? m
/z
94,9
5,83
,109
,28
? m
/z
126,
97,5
6,55
?
m/z
54
,60,
41,9
5,12
4 D
imet
hylp
yrro
le
2,rl
Dim
ethy
lpyr
idin
e (1
H)-
Ethy
lpyr
role
4-
Hyd
roxy
met
hylt
etra
hydr
opyr
an-3
-one
2,
3-D
ihyd
roxy
hex
-1-e
n-4
-on
e 5-
Met
hyl
-2-f
ura
ldeh
yde
Prop
ylbe
ruen
e ?
m/z
82
,41,
28,5
5,57
,83
Alk
yl(C
,)ben
zen
e
- - +
+
- - +
- - - +
- +
- - - - - - +
+
+
- - -
+
+
- +
+
+
- +
+
- - - - - - +
+
- - - - - - +
+
-
+
- - +
+
- - - +
+
- - - +
- - +
+
- - - +
- -
+
- - +
+
- - - - - +
- - +
- - +
- +
- - - - - -
- - +
- - - - - - - - - - - - - - - - - - - - -
+
- - +
+
+
- +
- - - - - - - - - - - - - - +
- +
Ps
A
Ps
FA
A
Ps
Ps
Ps?
Pro
pro Pro
Ps
Ps
Ps
84
103
16
21
Cya
nob
enze
ne
85
103
16
23
Pyri
dine
der
ivat
ive?
86
11
3 16
27
?
m/z
85
,57,
41,1
00
87
144
16
28
? m
/z
111,
101,
126,
43,1
44
88
94
16
38
Phen
ol
89
16
45
Alk
yl(C
,)ben
zen
e 4-
hydr
. di
hydr
opyr
anon
e 90
11
4 16
50
4-
Hyd
roxy
-5,6
-dih
ydro
-(2H
)-py
ran-
2-on
e 91
17
04
?
m/z
94
,93,
73,1
09
92
116
17
05
Hex
anoi
c ac
id G
:, 93
12
0 17
14
Et
hyhn
ethy
lben
zene
94
14
0 17
15
1-
Dec
ene
95
17
28
108,
107
, 57
,41,
70
, 94
, 12
1 96
10
9 17
30
2,
3,5_
Tri
met
hyl
pyr
role
97
14
2 17
37
D
ecan
e 98
17
44
?
m/z
57
,41,
29
99
112
17
54
2-H
ydro
xy-3
-met
hylc
yclo
pent
ene-
l-on
e 10
0 11
8 18
11
A
lkyl
(C,)b
enze
ne
101
120
18
18
Alk
yl(C
,)ben
zen
e 10
2 10
8 18
58
M
ethy
lphe
nol
(o-c
reso
l)
103
128
19
07
? m
/z
128,
43,5
7,85
10
4 13
4 19
12
B
uty
lben
zen
e 10
5 12
0 19
17
?
m/z
81
,82,
39,5
4,97
10
6 13
4 10
32
M
ethy
lpro
pylb
enze
ne
107
108
19
35
Met
hylp
heno
l ( p
/m-c
reso
l)
108
19
46
? m
/z
68,1
07,1
08,1
10,6
9 10
9 13
4 19
55
A
lkyl
(C,)b
enze
ne
110
130
19
59
Hep
tano
ic
acid
C,:,
11
1 13
4 20
05
A
lkyl
(C,)b
enze
ne
112
154
20
07
Cll
-Alk
ene
113
154
20
21
Un
dec
ene
114
126
20
36
3-D
ihyd
ro-2
-met
hyl-
(4H
)-py
ran-
4-on
e 11
5 15
6 20
41
U
nd
ecan
e
- +
-
+
- -
- -
- +
-
- -
+
- -
- +
-
- -
-
+
+
+
+
+
- +
-
- -
+
- -
- -
- -
+
- -
- +
-
- -
- -
+
- +
-
+
- +
+
-
- +
-
- -
- +
-
- +
+
-
+
- -
+
- -
+
- -
- -
- -
- -
+
+
- -
- -
+
- +
+
+
+
-
- -
- -
- -
- +
-
- -
- -
- -
-
+
+
+
+
+
- +
-
- -
- -
- -
- -
+
- -
- -
- -
- -
- -
- +
-
- +
+
+
-
+
- -
- -
+
+
+
-
- -
Ps
Ps
FA
A
Pro
A
Pro
Ps
FA
A
A
Ps
A
TA
BLE
2
(con
tinu
ed)
No.
M
+”
Rt.b
N
ame
’ S
amp
le
Ori
gin
d (m
m s
) 1
2 3
4 5
6
116
117
118
119
120
121
122
123
124
125
126
127
128
129
130
131
132
133
134
135
136
137
138
139
140
141
142
117
134
152
122
148
122
148
144
156
133
144
168
136
120
170
131
146
134
158
20
46
20
52
21
01
21
06
21
08
21
13
21
42
21
51
22
01
22
12
22
13
22
14
22
26
22
32
22
37
22
52
22
54
23
04
23
13
23
15
23
22
23
22
23
33
23
36
23
45
23
54
23
57
25
12
? m
/z
99,5
9,56
,28,
72
+ B
enzy
lcya
nid
e ?
m/r
20
0,15
4,69
,57
Alk
yl(C
,)ben
zen
e ?
m/z
42
,70,
113,
41
? m
/z
132,
117,
82,5
4 D
imet
hylf
enol
?
m/z
44
,43,
144,
101,
125
? m
/z
70,1
13,4
3,42
,130
,115
?
m/z
43
,41,
69,1
07,7
0,57
,85
Pen
tylb
enze
ne
Ethy
lphe
nol
? m
/z
113,
43,4
1,50
,100
,85,
69
1-M
eth
yl-4
-iso
bu
tylb
enze
ne
Oct
anoi
c ac
id C
,:,
Dec
anon
e ?
m/z
41
,98,
99,2
8,58
,70
Nap
hth
alen
e 1,
4 : 3
,6-A
nhyd
ro-a
-D-g
luco
pyra
nose
I-
Dod
ecen
e ?
m/z
73
,71,
43,9
7,44
,29,
55,5
7 P
hen
ylac
etal
deh
yde
n-D
odec
ane
? m
/z
71,6
9,73
,97,
56,4
4,41
,29
Phen
yl c
yano
prop
ane
Dim
ethy
lben
zofu
ran
An
alin
e d
eriv
ativ
e .
. N
onan
otc
actd
C,:,
+
- - - - +
- +
- + - +
- - + +
- -
- +
+
- - + +
- - - +
- +
- + +
- - - +
- - + - - +
- +
+
- - + +
- +
- - +
- - - - - - - +
- +
+ - - -
- +
- - - - - - +
- - - - - - +
- - - +
- +
-
+ - - - +
- +
- - - - +
- - - - - - - - - - - - - -
- - - +
- - - - - - - - - +
- - - +
- - - - +
- - - - -
Pro
A
PA
PAH
PS
A
Pro
A
Pro
PA
143
144
145
146
147
148
149
150
151
152
153
154
155
156
157
158
159
160
161
162
163
164
165
166
167
168
169
170
171
260
29
56
172
156
30
01
173
186
30
03
162
117
182
142
184
150
210
142
210
160
134
172
131
154
196
198
156
156
156
156
147
25
19
25
47
25
59
26
02
26
13
26
17
26
18
26
33
26
40
27
00
,27
05
27
06
27
07
27
18
27
40
27
43
28
10
28
15
28
33
28
48
28
50
29
10
29
10
29
19
29
28
29
31
29
38
29
54
But
ylbe
nxal
dehy
de
Indo
le
1-T
ride
cene
l&
Did
eoxy
-D-g
lyce
ro-h
ex-l
-eno
pyra
no-
3-ul
ose
2-M
ethy
lnap
htha
lene
T
ride
cane
V
inyl
met
hoxy
phen
ol
? m
/z
210,
154,
69
1-M
ethy
lnap
htha
lene
?
m/z
21
0,15
4,69
U
nkno
wn
Tri
met
hylb
enzi
mid
axol
e?
alky
l(C
, )b
enxe
ne
? m
/z
55,9
8,43
,70,
138,
153,
195
? m
/z
55,9
8,69
,60,
138,
153,
195
Dec
anoi
c ac
id C
,,:,
2-M
ethy
lindo
le
Vin
ylna
phth
alen
e T
etra
dece
ne
Tet
rade
cane
E
thyl
naph
thal
ene
1,3D
imet
hyln
apht
hale
ne
? m
/z
127,
57,4
3,14
7,11
6 ?
m/z
13
9,43
,41,
69,8
1,99
?
m/z
13
8,55
,69,
98,1
66,1
80,2
09
Dim
ethy
lnap
htha
lene
D
imet
hyln
apht
hale
ne
(1 H
)-Is
oind
ole-
1,3-
(2H
)-di
one
(pht
halim
ide)
?
m/z
55
,124
,98,
69,1
66
2,6_
dim
ethy
lnap
htha
Iene
U
ndec
aneo
ic
acid
C,,
:a
- +
-
- -
-
+
- +
+
+
-
- +
+
+
-
-
+
- -
- -
_ +
-
- -
- -
- +
+
-
+
+
+
- -
- -
- -
- -
+
- -
+
- -
- +
-
- -
+
- -
+
- -
- -
- -
- -
+
-
- +
-
- -
-
+
- +
+
- +
-
- -
- -
- +
-
+
+
+
+
- -
+
+
+
+
+
- -
- -
+
- -
- -
+
- +
-
- -
- +
-
- -
- _
+
- -
- -
- -
- -
- +
-
- -
- -
+
- +
-
- -
- +
-
- -
- -
- -
- -
+
- +
+
-
- -
Ps
Pro
A
Ps
PA
H
A
PA
H
FA
P
ro
PA
H
A
A
PA
H
PA
H
PA
H
PA
H
Pro
?
PA
H
FA
TA
BLE
2
(con
tinu
ed)
No.
M
+a
Rt.
b N
ame
’ S
am
Dle
O
rigi
n d
(min
s)
1 2
3 4
5 6
174
30
12
? m
/z
82,6
7,83
,81,
57,9
5 17
5 15
4 30
14
B
iphe
nyl
176
190
30
23
Oct
ylb
enze
ne
177
147
30
30
2,3-
Dih
ydro
-4-m
ethy
lind
ole
178
145
30
45
Dim
ethy
lind
ole
179
147
30
46
1,3-
Dih
ydro
,3-m
ethy
lind
ole
180
168
30
50
Met
hylb
iphe
nyl
181
210
30
57
Pen
tad
ecen
e 18
2 16
8 31
05
M
ethy
lbip
heny
l 18
3 31
05
A
rom
atic
hy
droc
arbo
n?
184
212
31
13
Pen
tad
ecan
e 18
5 31
13
?
m/z
12
9,11
6,13
0,10
1,10
3 18
6 31
33
?
m/z
21
0,14
4,14
1,83
,55
187
168
31
50
Dib
enzo
fura
n 18
8 22
4 32
16
H
exad
ecen
e 18
9 20
0 32
21
D
odec
anoi
c ac
id C
,,:,
190
162
33
17
1,dA
nhyd
rogh
tcos
e 19
1 22
6 33
27
H
exad
ecan
e 19
2 23
6 35
01
H
epta
dec
adie
ne
193
238
35
02
Hep
tad
ecen
e 19
4 35
05
?
m/z
13
8,12
3,15
7,57
,165
,180
,222
19
5 23
8 35
11
H
epta
dec
ene
196
238
35
16
Hep
tad
ecen
e 19
7 24
0 35
36
H
epta
dec
ane
198
180
36
42
(9H
)-Ph
tore
n-Pa
ne
199
228
36
39
Tet
rad
ecan
oic
acid
C,,
: o
- - - - + - - - +
+
+
+
- - +
- - +
+
- +
+
- +
- +
- +
+
+
- +
- - - - - +
- - +
- - - - - +
- - - - - +
- +
- - - - +
+
- +
- - - - - - - - - +
+ - - - - - -
+
- -
+
- +
+
-
+
- +
-
- +
+
+
-
+
- +
+
+
-
- - -
+
- +
- -
- -
+
- -
- - -
-
+
- +
+
-
+
+
-
PAH
Pro
Pro
Pro
PAH
A
PA
H
PAH
A
A
PAH
A
P
A
Ps
A
A
A
A
A
A
PAH
P
A
200
196
37
31
201
254
37
38
202
178
37
43
203
196
38
08
204
242
38
40
205
254
38
55
206
237
39
09
208
254
39
24
209
268
39
37
210
194
39
48
211
214
40
03
212
213
214
215
216
217
218
219
220
221
222
149
256
282
284
255
281
283
309
40
13
42
14
42
37
42
58
43
53
44
20
44
22
47
12
47
47
48
23
53
16
5-Py
rroh
dino
-3,6
-pip
eraz
ined
ione
d
eriv
ativ
e A
lkan
e P
hen
anth
ren
e 5-
Pyrr
olid
ino-
3,6-
pipe
razi
nedi
one
der
ivat
ive
Pen
tad
ecan
oic
acid
Cls
ZO
A
lkyl
ket
one?
?
m/z
97
,43,
110,
57,4
2,12
4 H
epta
dec
an-2
-on
e N
onad
ecan
e ?
m/r
70
,154
,194
(p
iper
axin
edio
ne
der
ivat
ive?
) ?
m/z
70
,154
,125
,86,
181
(pip
erax
ined
ion
e d
eriv
ativ
e?)
Ph
thal
ate
Hex
adec
anoi
c ac
id C
,,:,
? m
/z
122,
136,
69,1
64
? m
/z
43,5
7,97
,41,
56
Ck
tad
ecen
oic
acid
Crs
:r
Gct
adec
anoi
c ac
id C
,,:,
Hex
adec
anoi
c ac
id a
mid
e ?
m/z
12
5,24
4,91
,153
,70
Ck
tad
ecen
oic
a&am
ide
Oct
adec
anoi
c ac
etam
ide
Pyrr
olid
ine
der
ivat
ive
- - - - - - - - - - - -
’ M
+, m
olec
ula
r w
eigh
t of
th
e m
olec
ula
r io
n.
b R
.t.,
rela
tive
ret
enti
on t
ime
of t
he
com
pone
nt
in t
he
GC
col
umn
(th
e av
erag
e of
th
e sa
mp
les
is t
aken
). ’
? m
/z,
unkn
own
com
poun
d w
ith
char
acte
rist
ic
mai
n p
eak
s (g
iven
acc
ordi
ng
to r
elat
ive
abu
nd
ance
). d
Ori
gin
of t
he
com
pone
nt:
Ps,
pol
ysac
char
ides
; Pr
o, p
rote
ins;
FA
, fa
tty
acid
s;
PAH
, po
lycy
clic
ar
omat
ic
hydr
ocar
bons
; A
, al
iph
atic
hyd
roca
rbon
s (a
lkan
es,
alk
enes
); C
ont,
cont
amin
atio
n.
+
- - +
+
+
+
- - +
+
- - - -
+
- - +
- - +
- - +
+
+
+
+
+
+
+
+
+
+
+
-
- - - - - + - - - - - - - - - - - - -
- - - +
+
- - - + - - +
+
+
- +
+
+
+ +
- - - +
- - - - - - - - - - - - - - -
Pro
A
PAH
Pr
o
FA
A
A
Pro?
Pro?
C
ont
FA
FA
FA
Pro
218
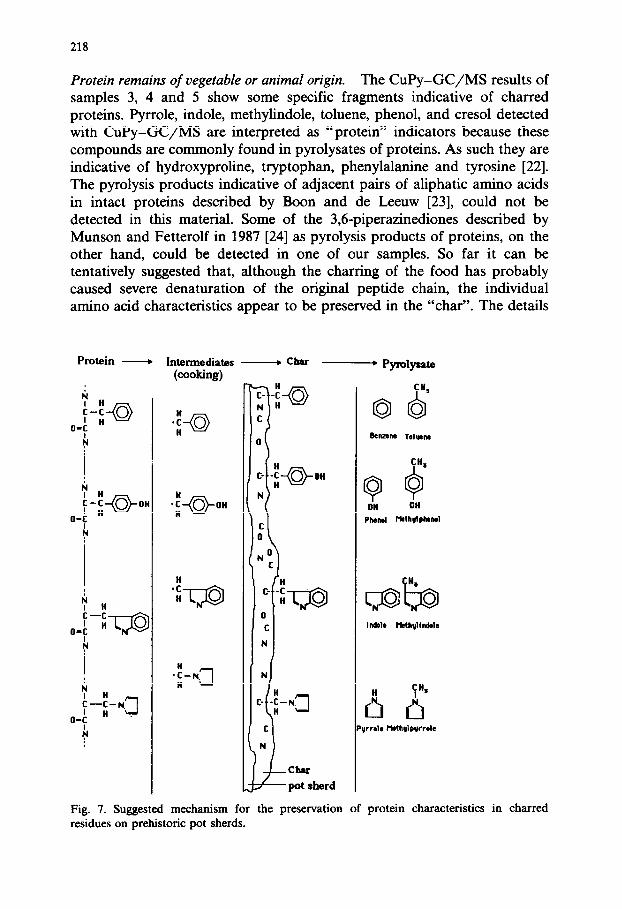
Protein remains of vegetable or animal origin. The CuPy-GC/MS results of samples 3, 4 and 5 show some specific fragments indicative of charred proteins. Pyrrole, indole, methylindole, toluene, phenol, and cresol detected with CuPy-GC/MS are interpreted as “protein” indicators because these compounds are commonly found in pyrolysates of proteins. As such they are indicative of hydroxyproline, tryptophan, phenylalanine and tyrosine [22]. The pyrolysis products indicative of adjacent pairs of aliphatic amino acids in intact proteins described by Boon and de Leeuw [23], could not be detected in this material. Some of the 3,6_piperazinediones described by Munson and Fetterolf in 1987 [24] as pyrolysis products of proteins, on the other hand, could be detected in one of our samples. So far it can be tentatively suggested that, although the charring of the food has probably caused severe denaturation of the original peptide chain, the individual amino acid characteristics appear to be preserved in the “char”. The details
Pmtein - Intermediates -char - Pymlysate (cooking)
t ChU
pot sherd
Fig. 7. Suggested mechanism for the preservation of protein characteristics in charred residues on prehistoric pot sherds.
219
of this preservation process are not clear at all and will be the subject of further experimentation with standard compounds. It is suggested here that a radical reaction (Fig. 7) causes the specific amino acid side chains to be linked chemically to (or to get “embedded” in) the forming char. About two thousand years later, flash pyrolysis releases these characteristics again.
Protein markers occur mostly in samples in combination with free fatty acids and polysaccharide markers. In sample 4 (Figs. 5C and 6C), however, they occur only in combination with inorganic compounds, i.e. carbonates (evidenced by m/z 44 and 28 from CO, in the CuPy-MS spectrum).
Remains of polysaccharides. In the past it has been stated by archaeological chemists [12] that polysaccharides are unlikely to ever survive charring because their natural structure is destroyed at temperatures around 190 o C. However, the work of Julien et al., presented during this symposium [25], has shown that low temperature chars of cellulose still retain “sugar” characteristics. Sugar markers, i.e. methylfuran and dimethylfuran, were detected in samples 3 and 5. These markers are rather unspecific and cannot give any indication of the original type of polysaccharide.
The possibility of an archaeological origin is shown by the fact that charring experiments with modem food (samples 1 and 2) also render these markers in Curie-point pyrolysates. Apparently some polysaccharide char- acteristics remain preserved in low temperature chars (possibly in the form of dehydrated oligosaccharides and melanoidins). Increasing the tempera- ture during charring will reduce the recognisability of the remaining prod- ucts.
No simple assumptions can be made, since it is not clear whether the polysaccharide markers originate from charred materials or from oligosac- charides that have impregnated the residues from the surrounding soil. Peat samples from the same area (Assendelver Polders) have rendered a broad range of sugars from polysaccharides [26]. The majority of these sugars were derived from the remains of vascular plants and occur in the form of bio-polymers that are non-soluble in water. At this stage it is not possible to exclude that some water soluble saccharides derived from plants or bacterial cell walls have impregnated the archaeological material. Analysis of the water soluble fraction of archaeological residues and their surrounding soil will clarify this point.
Remains of lipids.
Free fatty acids and fatty amides. A number of straight chain saturated fatty acids (C,,, Ciz, Ci4, Ci5, Ci6, C,, and C18:0), one mono-unsaturated fatty acid (Ci& and three fatty amides (C,,:,, C,,:, and C,,:,) were detected in samples 3 and 5. Since free fatty acids also occur in the CuPy-GC analyses of low temperature pyrolysis (358” C), it is clear that
these compounds evaporate from the sample. It should be noted that free fatty acids and fatty amides are often observed in combination with protein markers and sometimes with markers for polysaccharides (Figs. 6A and 6B).
The presence of free fatty acids in residues on pottery and in the ceramic of the pottery from prehistoric times has been proven before by other researchers who isolated the fatty acids (and sometimes salts of fatty acids) with various extraction methods [5,9,10,12,27]. Though the presence of these free fatty acids is commonly accepted to be the result of hydrolysis of vegetable or animal fats after deposition [28], the distribution found in some of the organic residues in the pots may have been determined by additional bio-degradation processes, thus obscuring the original lipid signature of archaeological samples. It is for this reason that the identification of original foodstuffs based on the relative distribution of free fatty acids in an archaeological sample is a difficult process. More work should be directed at unravelling the chemical changes that might have taken place after deposi- tion of the organic remains in or on the ground.
Mono-, di- or triacylglycerides could not have been detected with the pyrolysis techniques utilised, but recent work on extractable lipids analysed according to Evershed [29], has shown their presence in small amounts [HI.
The fatty amides can be produced by heating fatty acids with amines to a temperature of 200°C [30]. It is not clear whether this formation happened during the preparation of food in prehistoric times or occurs during the pyrolysis phase of the analysis.
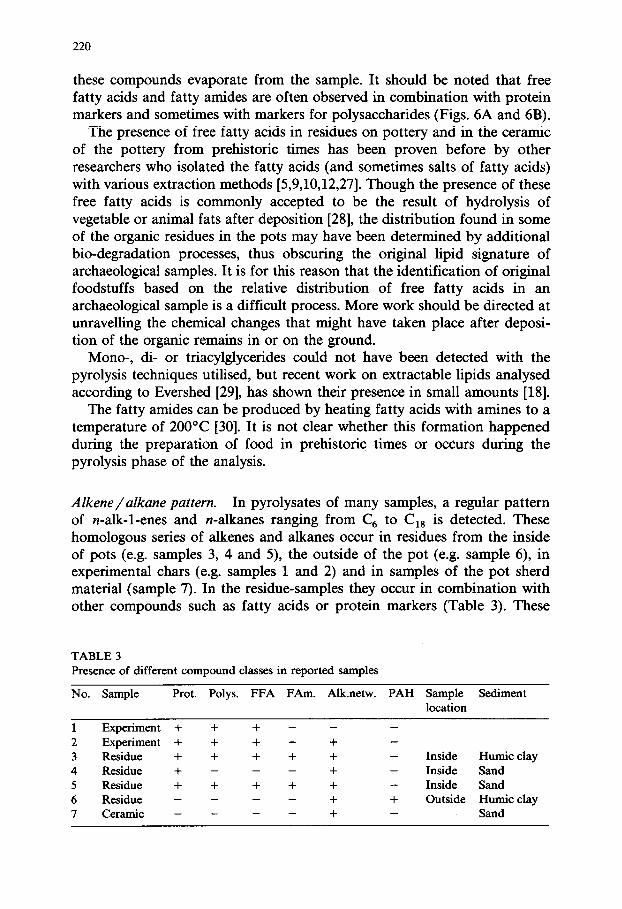
Alkene/ alkane pattern. In pyrolysates of many samples, a regular pattern of n-alk-l-enes and n-alkanes ranging from C, to C,, is detected. These homologous series of alkenes and alkanes occur in residues from the inside of pots (e.g. samples 3, 4 and 5), the outside of the pot (e.g. sample 6), in experimental chars (e.g. samples 1 and 2) and in samples of the pot sherd material (sample 7). In the residue-samples they occur in combination with other compounds such as fatty acids or protein markers (Table 3). These
TABLE 3 Presence of different compound classes in reported samples
No. Sample Prot. Polys. FFA FAm. Alk.netw. PAH Sample Sediment location
1 Experiment + + + - - -
2 Experiment + + + - + 3 Residue + + + + + - Inside Humic clay 4 Residue + - - - + - Inside Sand 5 Residue + + + + + Inside Sand 6 Residue - - - - + + Outside Humic clay 7 Ceramic - - - - + - Sand
221
straight chain alkane and alkene patterns have been reported before in the pyrolysates of the cuticles of modern and fossil plants [31-331, of the rootlets of Ericaceae and ericaceae peat [34], and in pyrolysates of coals from an early phase of coal diagenesis [35]. The pattern was interpreted as the pyrolysate of a highly aliphatic biopolymer thought to be present in the cuticles of plants and claimed to be very resistant to bio-degradation. The same pattern can be found when polyethylene is pyrolysed. The most important difference with the pattern observed in our samples is the chain length distribution. The occurrence of this pattern in the pyrolysates of prehistoric (food) residues may be caused by pyrolysis of an aliphatic network created by radical polymerisation in the residues and in the wall of the pot under high temperature conditions during cooking. This aliphatic compound is likely to be formed from food components.
The mechanism of formation of alkene/alkane patterns during pyrolysis is not entirely clear but Hartgers et al. [36] have suggested a mechanism which explains the formation of the alkenes and alkanes as product of H-radical transfer with primary and secondary alkyl radicals that were created during pyrolysis of silicon bound hydrocarbons. It is plausible that a similar mechanism is at work during pyrolysis of the aliphatic material described above. According to this model pyrolysis of long chain aliphatic components that are bound to some larger structure will result in homolo- gous series of alkenes and alkanes leading up to the C number of the longest chain minus one.
Shed&sky [37] reported, during this symposium, the formation of similar alkene/alkane patterns from Py-MS data of salts of fatty acids. This origin might play a role in some of the prehistoric residue samples. The presence of salts from fatty acids will be checked by aid washing in future studies.
Charring experiments (e.g. samples 1 and 2) show the same alkene/alkane pattern after pyrolysis (Fig. 5F), and as such supports the possible origin of the aliphatic compounds. The presence of fats seems a pre-requisite since charring experiments with only water, flour and albumin do not give this alkene/alkane pattern. More heating experiments, possibly in the presence of a clay surface similar to the archaeological pots, should be done to study the origin and circumstances needed to create the possible aliphatic pre- cursors of this pattern that is grafted on the char.
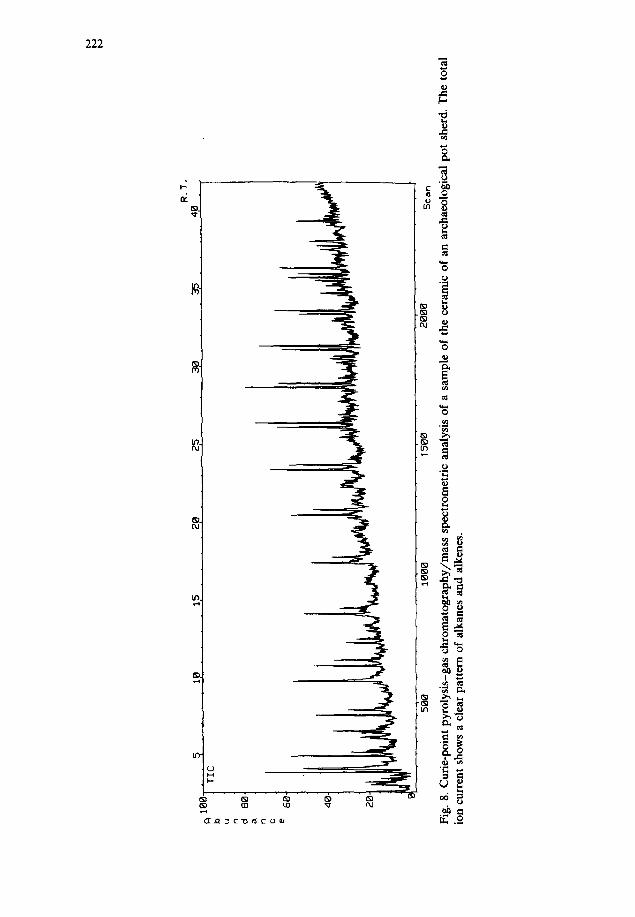
Potsherd material The ceramic from several pot sherds was analysed by CuPy-GC and the
results show a pattern of straight chain n-alk-1-enes and n-alkanes ranging up to C,, (e.g. sample 7). In the ceramic samples these compounds form the majority of the organic fraction (Fig. 8 shows the TIC of the CuPy-GC/MS analysis of sample 7). It is possible that the higher temperature reached in the wall of the pot during cooking and charring led to the formation of aliphatic network polymers from lipids that were absorbed in the sherd
b
TIC
u 2 a ” c = 60
80 1
40
20
500
1000
15
00
z000
S
CW
l
Fig.
8.
Cur
ie-p
oint
py
roly
sis-
gas
chro
mat
ogra
phy/
mas
s sp
ectr
omet
ric
anal
ysis
of
a
sam
ple
of
the
cera
mic
of
an
ar
chae
olog
ical
po
t sh
erd.
T
he
tota
l io
n cu
rren
t sh
ows
a cl
ear
patte
rn
of
alka
nes
and
alke
nes.
223
when the pot was in use. Attempts will be made to isolate this substance from the pot sherd for more detailed spectroscopic and mass spectrometric analysis.
Heating experiments Experimental heating and charring of modem foods was performed (e.g.
samples 1 and 2) to obtain more information about the changes in composi- tion of different materials before and after charring (Figs. 6E and 6F). The results obtained with CuPy-MS and CuPy-GC/MS confirmed the fact that many characteristics of polysaccharides and proteins and fatty acids can still be found in the experimentally carbonised materials. The results from these heating experiments show many of the components which are also detected in the archaeological material. These experiments illustrated the need for more molecular information on chars and on chemical processes that take place during charring of bio-materials.
Soil samples Dried peat samples from the site have been analysed and show the type of
pattern (polysaccharide markers, lignin markers and high molecular weight lipid markers) which is typical for peat samples in the west of The Nether- lands [34]. Though the total pyrolysis product profile from the peat samples is very different from those of the archaeological samples, it cannot be excluded that the surrounding soil matrix partly determines the remaining chemical composition of the residues. Contamination with soil particles and ground water or specific degradation processes could have an effect on the chemistry of the residues. It is therefore useful to determine the relationship between the chemical composition of the analysed residues and the type of sediment around the sherds. A study of this relationship by CuPy-MS failed to show a direct correlation [38]. Also, the large difference between soil, charry residue and pot sherd composition suggest that contamination is very limited in the archeological site at Uitgeest-Groot Dorregeest. More detailed studies will be performed to determine the possible transport of compounds from soil to archaeological sample or vice versa.
Contaminating materials In pyrolysates of many samples markers for plasticizers (m/z 149, 167)
were found (Figs. 5C and SD). These markers probably originate from the plastic bags in which the pottery has been kept for over a year, prior to analysis.
Chemical data as evidence for usage of pottery in prehistoric times
The CuPy-MS and CuPy-GC/MS results show clear differences in the chemical composition of the residues (Table 3). The chemical composition of
224
samples scraped from prehistoric pots does not give direct information about the original use because the sample is the result of a series of formation processes that took place in time (Fig. 1) such as processes in prehistory (cooking, mixing, storage, cleaning of pots), post-depositional processes (bio-degradation, impregnation of soil or ground water, leaching), excavation and handling by archaeologists and sample preparation. In order to deduce information about prehistoric use of the pottery, all of these processes need to be addressed to determine their influence on the chemical composition of the residues.
Handling by archaeologists Excavation and handling of pottery has resulted in contamination of the
samples, for example, with plasticizers from packaging materials. It is also possible that other cases of contamination took place during washing, drying and handling that are not easy to recognise (contamination with dust, paper from drying of pottery on newspaper and fats from archaeologists’ hands). When dealing with archaeological materials it is preferable to freeze (-20°C) the samples within 24 h after excavation to prevent any recent bacterial degradation. Unfortunately, the material reported here was not treated with all these precautions. Despite this drawback, the degree of detectable contamination appears to be low. We think that this is caused by the refractory nature of the char and by the encapsulation and grafting of the compounds inside. the macromolecular structure of the char. One needs to take into account that working with washed pot sherds means that all soft and soluble materials are removed during washing.
Bio-degradation Bio-degadation on and in the ground has a strong selective effect on
preservation of different biological materials. Fresh foods especially are vulnerable to biological attack for digestibility of foods goes hand in hand with sensitivity to bio-degradation [39]. Only rarely will the remains of food preparation or “ home-chemistry” be preserved as a residue on broken pottery. Very specific circumstances like an anaerobic climate, aridity, extremely low temperatures, charring, carbonisation or the presence of preserving chemicals (such as waxes, resins, tannins, acids, alkalis, metal oxides or salt), are needed to preserve foods in an archaeological context [40]. The residues that archaeologists find on pottery should therefore not be seen as representing all uses of pottery but rather as very rare cases that have survived for a specific reason. The residues represented here are all clearly the result of charring (with the exception of three light coloured residues, e.g. sample 4). This process reduces the microbial degradation (and possibly also the impregnability for water) in such a way that many traces of bio-organic compounds are still present.
225
No indications could be found for extensive contamination with soil or ground water. The chemical composition of the residues therefore represents processes that took place in prehistoric times.
Processes in prehistory Many processes in prehistory will have had an obscuring effect on the
evidence of the last usage. Multiple use of a pot for different functions, for instance, can complicate interpretation of results. Visual inspection of the chars under the scanning electron microscope showed the absence of layers in the residues. For the native Roman settlement in Uitgeest one can assume therefore that people did not cook or prepare anything in “dirty” pots. The residues can thus be considered as to represent the last usage of the pot.
The “cooking” temperature also has its effect on the chemical composi- tion of the residue. Although the charring has a positive effect on the preservation of the residue, the denaturation also has a negative effect on the possibilities for identification of the original material. The heating tempera- ture and heating time play a role in the chemical composition of the final residue. More controlled heating and charring experiments will be done to understand how the original bio-material is modified and preserved.
Mixing of materials is something one has to take for granted in most food preparation and “home-chemistry” applied by prehistoric people.
The position on the pot also determines the chemical composition of the residue that one might find. The black residues on the outside of the pot have distinctively different chemical composition and origin from those on the inside.
For the determination of the original use of a pot, it is important to show that differences in chemical composition are correlated to archaeological variables such as pot morphology [38]. Although the original materials cannot (yet) be deduced, it is evident that the chemical analysis of organic residues on prehistoric pottery can present us with new independent infor- mation to support a functional division of prehistoric pottery.
CONCLUSIONS
Pyrolysis mass spectrometric techniques are useful for the chemical char- acterisation of organic residues on archaeological pottery. The use of CuPy- MS, CuPy-GC and CuPy-GC/MS has resulted in the detection of many organic moieties in the (carbonised) residues including characteristic markers for proteins and polysaccharides and other compounds such as fatty acids, polycyclic aromatic hydrocarbons and aliphatic polymers. The existence of clear differences in chemical composition between the residues is demon- strated. The chemical variation seems to be related to the position of the residue in/on the pot and the colour of the residue. The results of analyses
226
of peat samples of the surrounding matrix are in no way similar to the results from the residues. Though more work is being done on the various possible preserving/degrading effects of the soil, no indications have so far been found to assume that the chemical difference between residues is a post-depositional artefact. It has therefore become clear that the chemical composition of residues on pottery is a reflection of the original use in prehistoric times and as such can become a useful variable in the discussion about form, function and production technology of prehistoric pottery.
ACKNOWLEDGEMENTS
We gratefully acknowledge the Netherlands Foundation for Archaeologi- cal Research (ARCHON) for the financial support of one of our authors (T.F.M. Oudemans). This work is part of the research program of the Institute for Prehistory Leyden and the Institute for Fundamental Research of Matter (FOM) with financial support from the Netherlands Organisation for Scientific Research (NWO). We also thank A. Tom, B. Brandt-de Boer and G.B. Eijkel at the FOM-AMOLF for their technical assistance and A.A. Abbink for her stimulating support in starting this research and supplying the necessary archaeological samples. The drawings in Fig. 3 were done by the Netherlands Archaeological Service (ROB).
REFERENCES
1 R.C.A. Rottlander and H. Schlichtherle, Archaeo-Physica (Beihefte der Bonner Jahrbticher), 7 (1980) 61.
2 J. Condamin, F. Formenti, M.O. Metais, M. Michel. and P. Blond, Archawmetry, 18 (1979) 195.
3 J. Evans and L. Biek, in M.G. Spratling et al. (Eds.), Proc. 16th Int. Symp. on Archaeometry and Archaeological Prospection, Edinburgh, 1976, National Museum of Antiquities of Scotland, Edinburgh, 1980, p. 90.
4 C. Heron and A.M. Pollard, in E.A. Slater and J.O. Tate (Eds.), Science and Archaeology, Proc. Conf. on Applications of Scientific Techniques to Archaeology, Glasgow, Septem- ber, 1987, BAR British Ser. 196, Oxford, 1988, p. 429.
5 H.E. Hill and J. Evans, in E.A. Slater and J.O. Tate (I%.), Science and Archaeology, Proc. Conf. on Applications of Scientific Techniques to Archaeology, Glasgow, Septem- ber, 1987, BAR British Ser. 196, Oxford, 1988, p. 449.
6 H.E. Hill and J. Evans, in D.R. Harris and G.C. Hillman (Eds.), Foraging and Farming, Unwin Hyman, London, 1989, p. 418.
7 E.D. Morgan, C. Comford, D.R.J. Pollock and P. Isaacson, Sci. Archaeol., 10 (1973) 9. 8 E.D. Morgan, L. Titus, R.J. Small and C. Edwards, Archaeometry, 26 (1984) 43. 9 M. Patrick, A.J. de Koning and A.B. Smith, Archawmetry, 27 (1985) 231.
10 R.C.A. Rottlander and H. Schlichtherle, Archaw-Physica (Beihefte der Bonner Jahrbticher), 10 (1979) 260.
221
11 R.C.A. Rottllnder and M. Bliime, Archaeo-Physica (Beihefte der Bonner Jahrbiicher), 7 (1980) 70.
12 R.A.C. Rotthinder and H. Schlichtherle, Naturwissenschaften, 70 (1983) 33. 13 M.M. Wright and B.B. Wheals, J. Anal. Appl. Pyrolysis, 11 (1987) 195. 14 J.S. Mills and R. White, The Organic Chemistry of Museum Objects, Butterworths,
London, 1987, p. 134. 15 P.J. Woltering, Holland, 14 (1982) 193. 16 P.J. Woltering, Holland, 15 (1983) 199. 17 A.A. Abbink, Dissertation, in preparation. 18 T.F.M. Oudemans, unpublished results. 19 J.J. Boon, in A. Chesson and E.R. 0rskov (Eds.), Physiochemical Characterisation of
Plant Residues for Industrial and Feed Use, Elsevier, London, 1989, p. 28. 20 J.J. Boon, A. Tom, B. Brandt-de Boer, G.B. Eijkel, P.G. Kistemaker, F.J.M. Notten and
F.H.M. Mikx, Anal. Chim. Acta, 163 (1984) 193. 21 A.I. Medalia, D. Rivin and D.S. Sanders, Sci. Total Environ., 31 (1983) 1. 22 H.L.C. Meuzelaar, J. Haverkamp and F.D. Hileman, Pyrolysis Mass Spectrometry of
Recent and Fossil Biomaterials, Elsevier, Amsterdam, 1982, p. 109. 23 J.J. Boon and J.W. de Leeuw, J. Anal. Appl. Pyrolysis, 11 (1987) 313. 24 T.O. Munson and D.D. Fetterolf, J. Anal. Appl. Pyrolysis, 11 (1987) 15. 25 S. Julien, E. Chornet, P.K. Tiwari and R.P. Overend, J. Anal. Appl. Pyrolysis, 19 (1991)
81. 26 M.E.C. Moers, J.W. de Leeuw, J.J. Boon, D. van Smeerdijk and F. Hans-Hans, in M.E.C.
Moers (Ed.), Occurrence and fate of carbohydrates in recent and ancient sediments from different environments of deposition, Dissertation, Technical University, Delft, The Netherlands, 1989, p. 89.
27 S. Needham and J. Evans, Oxford J. Archaeol., 6 (1987) 21. 28 L.E. Den Dooren de Jong, Anthonie van Leeuwenhoek; J. Microbial. Serol., 27 (1961)
337. 29 R.P. Evershed, Archaeometry, 32 (1990) 139. 30 J. Davidek, J. Velisek and J. Pokomy, Chemical changes during food processing, Develop-
ments in Food Science Vol. 21, Elsevier, Amsterdam, 1990, p. 183. 31 H.G. Schlegel, General Microbiology, Cambridge University Press, Cambridge, 1986, p.
587. 32 M. Nip, E.W. Tegelaar, J.W. de Leeuw, P.A. Schenck and P.J. Holloway, Naturwis-
senschaften, 73 (1986) 579. 33 M. Nip, E.W. Tegelaar, H. Brinkhuis, J.W. de Leeuw, P.A. Schenck and P.J. Holloway,
Org. Geochem., 10 (1986) 769. 34 D.G. van Smeerdijk and J.J. Boon, J. Anal. Appl. Pyrolysis, 11 (1987) 377. 35 P.J.J. Tromp, J.A. Moulijn and J.J. Boon, in Y. Yiirum (Ed.), New Trends in Coal
Science, Kluwer, 1988, p. 241. 36 W.A. Hartgers, J.S. Sinninghe Damstt and J.W. de Leeuw, J. Anal. Appl. Pyrolysis, 20
(1991) 141. 37 A.M. Shedrinsky, R.E. Stone and N.S. Baer, J. Anal. Appl. Pyrolysis, 20 (1991) 229. 38 T.F.M. Oudemans, Master’s Thesis, University of Leyden, 1989. 39 M.F. Luck and A. Goldblith, J. Food. Technol., 12 (1977) 441. 40 V.A. Carbone and B.C. Keel, in R.I. Gilbert, Jr. and J.H. Mielke (Eds.), The Analysis of
Prehistoric Diets, Academic Press, Orlando, 1985, p. 2.