Embed Size (px)
Citation preview
Modular Accident Analysis Program (MAAP) – MELCOR Crosswalk
Phase 1 Study
3002004449

Modular Accident Analysis Program (MAAP) – MELCOR Crosswalk
Phase 1 Study
3002004449
Technical Update, November 2014
EPRI Project Manager
R. Wachowiak
All or a portion of the requirements of the EPRI Nuclear Quality Assurance Program apply to this product.
ELECTRIC POWER RESEARCH INSTITUTE 3420 Hillview Avenue, Palo Alto, California 94304-1338 � PO Box 10412, Palo Alto, California 94303-0813 � USA
800.313.3774 � 650.855.2121 � [email protected] � www.epri.com
DISCLAIMER OF WARRANTIES AND LIMITATION OF LIABILITIES THIS DOCUMENT WAS PREPARED BY THE ORGANIZATION(S) NAMED BELOW AS AN ACCOUNT OF WORK SPONSORED OR COSPONSORED BY THE ELECTRIC POWER RESEARCH INSTITUTE, INC. (EPRI). NEITHER EPRI, ANY MEMBER OF EPRI, ANY COSPONSOR, THE ORGANIZATION(S) BELOW, NOR ANY PERSON ACTING ON BEHALF OF ANY OF THEM:
(A) MAKES ANY WARRANTY OR REPRESENTATION WHATSOEVER, EXPRESS OR IMPLIED, (I) WITH RESPECT TO THE USE OF ANY INFORMATION, APPARATUS, METHOD, PROCESS, OR SIMILAR ITEM DISCLOSED IN THIS DOCUMENT, INCLUDING MERCHANTABILITY AND FITNESS FOR A PARTICULAR PURPOSE, OR (II) THAT SUCH USE DOES NOT INFRINGE ON OR INTERFERE WITH PRIVATELY OWNED RIGHTS, INCLUDING ANY PARTY'S INTELLECTUAL PROPERTY, OR (III) THAT THIS DOCUMENT IS SUITABLE TO ANY PARTICULAR USER'S CIRCUMSTANCE; OR
(B) ASSUMES RESPONSIBILITY FOR ANY DAMAGES OR OTHER LIABILITY WHATSOEVER (INCLUDING ANY CONSEQUENTIAL DAMAGES, EVEN IF EPRI OR ANY EPRI REPRESENTATIVE HAS BEEN ADVISED OF THE POSSIBILITY OF SUCH DAMAGES) RESULTING FROM YOUR SELECTION OR USE OF THIS DOCUMENT OR ANY INFORMATION, APPARATUS, METHOD, PROCESS, OR SIMILAR ITEM DISCLOSED IN THIS DOCUMENT.
REFERENCE HEREIN TO ANY SPECIFIC COMMERCIAL PRODUCT, PROCESS, OR SERVICE BY ITS TRADE NAME, TRADEMARK, MANUFACTURER, OR OTHERWISE, DOES NOT NECESSARILY CONSTITUTE OR IMPLY ITS ENDORSEMENT, RECOMMENDATION, OR FAVORING BY EPRI.
THE FOLLOWING ORGANIZATIONS, UNDER CONTRACT TO EPRI, PREPARED THIS REPORT:
ERIN Engineering and Research, Inc.
Sandia National Laboratory Operated for the U.S. Department of Energy
THE TECHNICAL CONTENTS OF THIS PRODUCT WERE NOT PREPARED IN ACCORDANCE WITH THE EPRI QUALITY PROGRAM MANUAL THAT FULFILLS THE REQUIREMENTS OF 10 CFR 50, APPENDIX B. THIS PRODUCT IS NOT SUBJECT TO THE REQUIREMENTS OF 10 CFR PART 21.
This is an EPRI Technical Update report. A Technical Update report is intended as an informal report of continuing research, a meeting, or a topical study. It is not a final EPRI technical report.
NOTE For further information about EPRI, call the EPRI Customer Assistance Center at 800.313.3774 or e-mail [email protected].
Electric Power Research Institute, EPRI, and TOGETHER…SHAPING THE FUTURE OF ELECTRICITY are registered service marks of the Electric Power Research Institute, Inc.
Copyright © 2014 Electric Power Research Institute, Inc. All rights reserved.

ACKNOWLEDGMENTS The following organizations, under contract to the Electric Power Research Institute (EPRI), prepared this report:
ERIN Engineering and Research, Inc. 158 W. Gay St., Suite 400 West Chester, PA 19380
Principal Investigators D. Luxat J. Hanophy
The following organizations, under contract to the United States Department of Energy: Office of Nuclear Energy (DOE-NE) prepared this report:
Sandia National Laboratory Operated for the U.S. Department of Energy 1515 Eubank SE Albuquerque, New Mexico 87123
Principal Investigator D. Kalanich
This report describes research sponsored by EPRI and the DOE-NE. This report was prepared with significant contributions from individuals who attended a “MAAP-MELCOR Crosswalk Meeting”, held October 29-30, 2013. The contributions of the following individuals are acknowledged by EPRI and DOE-NE:
Sud Basu, NRC Mike Corradini, UW-Madison James Corson, NRC Tom Elicson, ERIN Engineering and Research, Inc. Hossein Esmaili, NRC/RES Mitch Farmer, Argonne National Laboratory Ed Fuller, NRC Jeff Gabor, ERIN Engineering and Research, Inc. Randall Gauntt, Sandia National Laboratory Larry Humphries, Sandia National Laboratory Richard Lee, NRC/RES Sung Jin Lee, Fauske & Associates, LLC Allen Notafrancesco, NRC/RES Chan Y. Paik, Fauske & Associates, LLC Martin Plys, Fauske & Associates, LLC Robert Sanders, AREVA Rick Wachowiak, EPRI Quan Zhou, Fauske & Associates, LLC
This publication is a corporate document that should be cited in the literature in the following manner:
Modular Accident Analysis Program (MAAP) – MELCOR Crosswalk: Phase 1 Study. EPRI, Palo Alto, CA: 2014. 3002004449.
iii

ABSTRACT Analytical investigations of the Fukushima Daiichi three core melt events are critical in developing plans for decommissioning the damaged units. As part of the Department of Energy: Office of Nuclear Energy (DOE-NE) initiative to investigate the Fukushima Daiichi events, MELTSPREAD and CORQUENCH codes were applied to assess the status of ex-vessel core debris at Unit 1. This unit is believed to have experienced significant ex-vessel melt relocation due to the long period without reactor pressure vessel (RPV) water injection.
EPRI’s Modular Accident Analysis Program Version 5 (MAAP5) and Sandia National Laboratories’ MELCOR code simulations provided necessary inputs to the MELTSPREAD and CORQUENCH analyses. The debris discharge transients obtained from the MAAP5 and MELCOR Unit 1 simulations provided the basis for the enhanced ex-vessel analysis. It was realized early in this process, however, that the discharge transients simulated by MAAP5 and MELCOR differed significantly in the following ways:
• RPV pressure at the time of the RPV lower head breach • The fraction and temperature of molten material relocating into containment • The rate of core debris relocation into containment
This report—a joint effort between EPRI and the DOE-NE—documents work performed as a consequence of these differences between MAAP5 and MELCOR observed in the Fukushima Daiichi Unit 1 enhanced ex-vessel analysis. The work reflects discussion at an industry-level meeting presenting the initial comparison of MAAP5 and MELCOR.
This study is a comparative assessment of how the two codes modeled in-vessel core melt progression, from onset of core damage to breach of the RPV lower head. The objective of this comparative assessment is identification of the principal modeling decisions in the two codes leading to the identified simulation differences.
Keywords Fukushima Daiichi Decommissioning MAAP5 code MELCOR code Core melt Debris discharge transients Ex-vessel analysis
v

ABBREVIATIONS AND ACRONYMS
ADS Automatic Depressurization System
BAF Bottom of Active Fuel
BWR Boiling Water Reactor
CRD Control Rod Drive
CRGT Control Rod Guide Tube
DOE-NE Department of Energy: Office of Nuclear Energy
EOP Emergency Operating Procedure
EPRI Electric Power Research Institute
MAAP Modular Accident Analysis Program
MCP Main Coolant Pump
MELCOR Methods of Estimation of Leakages and Consequences of Releases
MSIV Main Steam Isolation Valve
MSL Main Steam Line
PRA Probabilistic Risk Assessment
PWR Pressurized Water Reactor
RCIC Reactor Core Isolation Cooling system
RCS Reactor Coolant System
RPV Reactor Pressure Vessel
SAMGs Severe Accident Management Guidelines
SOARCA State-of-the-Art Reactor Consequence Analysis
SRV Safety Relief Valve
TAF Top of Active Fuel
TBR Technical Basis Report
TMI Three Mile Island
vii

CONTENTS 1 INTRODUCTION .................................................................................................................... 1-1
1.1 Study Purpose................................................................................................................ 1-1 1.2 Background .................................................................................................................... 1-2 1.3 Objectives and Scope .................................................................................................... 1-5 1.4 Report Structure ............................................................................................................. 1-5
2 MAAP5 AND MELCOR CODE-TO-CODE BENCHMARKING SCENARIO AND PLANT MODEL ...................................................................................................................................... 2-1
2.1 Introduction .................................................................................................................... 2-1 2.2 Plant Representation ...................................................................................................... 2-2 2.3 Summary of Plant Model Parameters ............................................................................ 2-4 2.4 Scenario Assumptions ................................................................................................... 2-8
3 COMPARISON METHODOLOGY .......................................................................................... 3-1 3.1 Introduction .................................................................................................................... 3-1 3.2 Overall In-Vessel Core Damage Progression ................................................................ 3-3 3.3 Overall RPV Thermal Hydraulic Response .................................................................... 3-5 3.4 Reactor Core Degradation ............................................................................................. 3-6 3.5 Core Damage Progression at and After Core Debris Slumping to Lower Plenum ......... 3-7
3.5.1 Challenge to Core Plate Integrity .......................................................................... 3-8 3.5.2 Sideward relocation through Shroud and Jet Pumps ............................................ 3-9 3.5.3 Core Debris Slumping to Lower Plenum ............................................................... 3-9 3.5.4 RPV Lower Head Breach .................................................................................... 3-10
4 MAAP AND MELCOR SIMULATION RESULTS ................................................................... 4-1 4.1 Introduction .................................................................................................................... 4-1 4.2 Comparison of Key Event Timing Simulation ................................................................. 4-1 4.3 Simulation of Overall Plant Response ............................................................................ 4-3
4.3.1 Simulation of Overall Core Energy Balance .......................................................... 4-3 4.3.2 Simulation of Overall RPV Thermal Hydraulic Response ..................................... 4-5 4.3.3 Simulation of Overall Containment Response ...................................................... 4-8
4.4 Simulation of Core Degradation ..................................................................................... 4-9 4.4.1 Early Phase of Core Degradation ......................................................................... 4-9 4.4.2 Loss of Core Geometry ....................................................................................... 4-10
4.5 Simulation of RPV Lower Head Breach ....................................................................... 4-12 4.5.1 Debris Relocation to Lower Plenum .................................................................... 4-12 4.5.2 Lower Plenum Debris Dynamics ......................................................................... 4-15
5 CODE-TO-CODE COMPARISON CONCLUSIONS............................................................... 5-1 5.1 Introduction .................................................................................................................... 5-1 5.2 Onset of Core Oxidation ................................................................................................. 5-1
5.2.1 Key Modeling Differences ..................................................................................... 5-1 5.2.2 Impact of Modeling Differences on Simulation Results ......................................... 5-2
ix
5.3 Initial Core Melting ......................................................................................................... 5-2 5.3.1 Key Modeling Differences ..................................................................................... 5-3 5.3.2 Impact of Modeling Differences on Simulation Results ......................................... 5-3
5.4 Progression of Core Melting inside Core Region ........................................................... 5-3 5.4.1 Key Modeling Differences ..................................................................................... 5-3 5.4.2 Impact of Modeling Differences on Simulation Results ......................................... 5-5
5.5 Development of Challenge to RPV Integrity prior to RPV Lower Head Breach ............. 5-7 5.5.1 Key Modeling Differences ..................................................................................... 5-7 5.5.2 Impact of Modeling Differences on Simulation Results ......................................... 5-9
5.6 Recommendations for Further Study ........................................................................... 5-10 5.6.1 Comparison of Lower Plenum Response ............................................................ 5-11 5.6.2 Simulation of Recovery Actions .......................................................................... 5-11 5.6.3 Ex-Vessel Core Melt Progression ....................................................................... 5-12 5.6.4 Comparison of Radiological Consequences ....................................................... 5-12 5.6.5 Comparison of Simulation Sensitivities and Uncertainties .................................. 5-13 5.6.6 Simulation of the TMI-2 Event ............................................................................. 5-14
5.7 Summary of In-Vessel Core Degradation Modeling Differences Identified in this Study .................................................................................................................................. 5-14
6 REFERENCES ....................................................................................................................... 6-1
A SIMULATION OF OVERALL PLANT AND PLANT SYSTEM RESPONSE ........................ A-1 A.1 Introduction ................................................................................................................... A-1 A.2 Simulation of Overall Energy Balance .......................................................................... A-1 A.3 Simulation of Bulk RPV Response ............................................................................... A-4
A.3.1 Overall RPV Pressure and Temperature Transient ............................................. A-4 A.3.2 RPV Water Level Transient ................................................................................. A-9 A.3.3 Feedwater System Response ............................................................................ A-11 A.3.4 Isolation Condenser System Response ............................................................. A-12
A.4 Simulation of Bulk Containment Response ................................................................ A-13 A.4.1 Containment Pressure Transient ....................................................................... A-13 A.4.2 Suppression Pool Bulk Temperature Transient ................................................. A-16
B MAAP AND MELCOR SIMULATION OF CORE MELT PROGRESSION ........................... B-1 B.1 Introduction ................................................................................................................... B-1 B.2 Overview of MAAP5 and MELCOR Abstractions of Core Degradation ........................ B-1
B.2.1 MAAP5 Degraded Core Components and Morphologies .................................... B-3 B.2.2 MELCOR Degraded Core Components and Morphologies ................................. B-4
B.3 MAAP5 and MELCOR Modeling of Core Failure Modes .............................................. B-7 B.3.1 Degradation of Control Blade Structure ............................................................... B-7 B.3.2 Fuel Canister Failure ........................................................................................... B-8 B.3.3 Fuel Clad Melting ................................................................................................. B-9 B.3.4 Fuel Melting ....................................................................................................... B-12 B.3.5 Fuel Cladding Rupture ....................................................................................... B-13
x
B.3.6 Degradation of Fuel Assembly Structures ......................................................... B-14 B.4 MAAP5 and MELCOR Modeling of Core Debris Transport/Relocation ...................... B-19
B.4.1 Initial Phases of Core Debris Transport ............................................................. B-19 B.4.2 Late Phase Molten Material Transport ............................................................... B-33
B.5 MAAP5 and MELCOR Core Degradation Simulation Results .................................... B-37 B.5.1 Overall Core Melting Transient .......................................................................... B-37 B.5.2 Overall Core Geometry and Impact on Heat Transfer ....................................... B-39
B.6 Comparison of MAAP5 and MELCOR Simulation of Core Failure Mechanisms ........ B-48 B.6.1 Degradation of Control Blade Structure ............................................................. B-48 B.6.2 Degradation Fuel Canister Structures ............................................................... B-51 B.6.3 Degradation of Fuel Assemblies ........................................................................ B-54
B.7 Summary of Key Modeling and Simulation Differences .............................................. B-59 B.8 References ................................................................................................................. B-60
C MAAP5 AND MELCOR SIMULATION OF RPV LOWER PLENUM DEBRIS DYNAMICS AND LOWER HEAD BREACH ................................................................................................ C-1
C.1 Introduction ................................................................................................................... C-1 C.2 MAAP5 and MELCOR Modeling of RPV Lower Plenum Debris ................................... C-2
C.2.1 Modeling of RPV Lower Plenum Debris .............................................................. C-2 C.2.2 MAAP5 and MELCOR Modeling of RPV Lower Head Breach Mechanisms ..... C-12
C.3 MAAP5 and MELCOR Simulation of RPV Lower Plenum Response ......................... C-12 C.3.1 MAAP5 and MELCOR Simulation of RPV Lower Plenum Debris Behavior ...... C-12 C.3.2 MAAP5 and MELCOR Simulation of RPV Lower Head Breach ........................ C-19
C.4 References ................................................................................................................. C-21
D MAAP5 AND MELCOR SIMULATION OF IN-VESSEL HYDROGEN GENERATION ........ D-1 D.1 Introduction ................................................................................................................... D-1 D.2 MAAP5 and MELCOR Modeling of In-Vessel Hydrogen Generation ........................... D-2
D.2.1 Oxidation Reaction Modeling ............................................................................... D-2 D.2.2 Modeling of Oxidation Reaction Area during Core Melt Progression prior to Core Slumping ....................................................................................................................... D-3 D.2.3 Modeling of Hydrogen Generation during and after Core Slumping .................... D-4
D.3 Comparison of MAAP5 and MELCOR Simulation Results for Hydrogen Generation .. D-6 D.4 References ................................................................................................................. D-21
xi

LIST OF FIGURES Figure 2-1 Illustration of MAAP5 Core Region Nodalization ...................................................... 2-2 Figure 2-2 Illustration of MELCOR Core Nodalization ............................................................... 2-3 Figure 3-1 Illustration of TMI-2 Degraded Core Morphology ..................................................... 3-1 Figure 3-2 Illustration of Possible Core Debris Relocation Pathways into Lower Plenum ......... 3-8 Figure 4-1 MAAP5 and MELCOR Simulation of Decay and Chemical Heat Transport from
Core/Core Debris ................................................................................................................. 4-4 Figure 4-2 Illustration of Different Flow Geometries through a Degraded Reactor Core ......... 4-12 Figure A-1 Comparison of System Energy Balance ................................................................. A-3 Figure A-2 Comparison of RPV Pressure Transient Simulations ............................................. A-6 Figure A-3 Comparison of RPV Steam Dome Temperature Transient Simulations ................. A-8 Figure A-4 Comparison of RPV Water Level Transient Simulations ....................................... A-10 Figure A-5 Feedwater Flow Rate ............................................................................................ A-11 Figure A-6 Comparison of Simulated Feedwater Injection into RPV ...................................... A-12 Figure A-7 Comparison of Simulated Isolation Condenser Heat Removal ............................. A-13 Figure A-8 Comparison of Drywell Pressure Transient ........................................................... A-14 Figure A-9 Comparison of Suppression Pool Temperature Transient .................................... A-17 Figure B-1 Illustration of Fuel-Clad Interaction ....................................................................... B-12 Figure B-2 Illustration of Collapsed Fuel Assembly Debris (Fuel Pin Configuration) .............. B-14 Figure B-3 Variation of MAAP5 Fuel Assembly Time-to-Failure Model with Larson-Miller
Parameter ......................................................................................................................... B-16 Figure B-4 Comparison of MAAP5 and MELCOR Crosswalk Analysis Time-to-Failure
Models............................................................................................................................... B-19 Figure B-5 Illustration of how Candling of Fuel Material Reduces Heat Transfer Surface Area
to Volume Ratio................................................................................................................. B-20 Figure B-6 MAAP5 Candling Debris Freezing Modeling—Variation of Crust Growth
Constant ............................................................................................................................ B-23 Figure B-7 Illustration of MAAP5 Types 1, 2 and 3 Core Geometry—Standing Fuel Pin
Configuration, Collapsed Fuel Pin Configuration and Thickened Fuel Pin Configuration . B-23 Figure B-8 MAAP5 Calculation of Effective Hydraulic Diameter as a Function of Node
Porosity (in thickened fuel pin configuration) .................................................................... B-24 Figure B-9 Illustration of MAAP5 Type 4 Degraded Core Geometry—Blocked Degraded
Core Configuration ............................................................................................................ B-24 Figure B-10 MAAP5 Variation of Core Node Flow Area with Porosity (relative to initial flow
area) .................................................................................................................................. B-26 Figure B-11 MAAP5 Model Variation of Core Node Heat Transfer Surface Area with
Porosity (relative to initial heat transfer surface area) ....................................................... B-27 Figure B-12 Illustration of Molten Debris Spreading to Side Crust Boundaries ...................... B-34 Figure B-13 Illustration of Distribution of Molten Material bounded by Downward-, Sideward-
and Upward-Facing Crusts ............................................................................................... B-35 Figure B-14 Illustrative Calculation of Downward-, Upward- and Sideward Heat Fluxes from
Molten Debris Pool ............................................................................................................ B-36 Figure B-15 Comparison of Simulated Core Melting Transient .............................................. B-38 Figure B-16 Different Core Debris Configurations Illustrating Loss of Heat Transfer Surface
Area to Core Volume ......................................................................................................... B-39 Figure B-17 Illustration of how Candling of Fuel Material Reduces Heat Transfer Surface
Area to Volume Ratio ........................................................................................................ B-40 Figure B-18 Comparison of Minimum Vertical Flow Area through Fuel Assemblies across the
Radial Extent of Core ........................................................................................................ B-41
xiii
Figure B-19 Distribution of Active Fuel Region Fuel Temperatures at Different Times from MAAP5 Simulation ............................................................................................................ B-43
Figure B-20 Distribution of Active Fuel Region Fuel Temperatures at Different Times from MELCOR Simulation ......................................................................................................... B-44
Figure B-21 Core Geometry Distribution with Active Fuel Region from MAAP5 Simulation ... B-45 Figure B-22 Distribution of Active Fuel Region Fuel Temperatures to End of MAAP5
Simulation ......................................................................................................................... B-46 Figure B-23 Distribution of Active Fuel Region Fuel Temperatures to End of MELCOR
Simulation ......................................................................................................................... B-47 Figure B-24 Comparison of Simulated Control Blade Temperatures ...................................... B-49 Figure B-25 Comparison of Fraction of Intact Control Blade Mass ......................................... B-50 Figure B-26 Comparison of Simulated Fuel Canister Temperatures ...................................... B-52 Figure B-27 Comparison of Intact Fuel Canister Mass ........................................................... B-53 Figure B-28 Comparison of Intact Fuel Cladding Temperature Transient .............................. B-55 Figure B-29 Comparison of Fuel Temperature Transient ....................................................... B-57 Figure B-30 Comparison of Fraction of Intact Fuel Mass ....................................................... B-58 Figure C-1 Illustration of MAAP5 Modeling of Downward and Sideward Debris Relocation
Pathways from the Core Region to the Lower Plenum ....................................................... C-3 Figure C-2 Illustration of MAAP5 Modeling of Debris Relocation to Lower Plenum ................. C-4 Figure C-3 MAAP5 Representation of Lower Plenum Debris Bed ............................................ C-6 Figure C-4 Illustration of MAAP5 Treatment of Temperature Profile in Solid Debris Bed for
Conduction Heat Transfer Calculations .............................................................................. C-8 Figure C-5 Comparison of Debris Mass Distribution ............................................................... C-13 Figure C-6 Comparison of Molten Pool Mass in RPV ............................................................. C-15 Figure C-7 Distribution of Debris between Lower Plenum Debris Constituents ...................... C-17 Figure C-8 Comparison of Lower Plenum Debris Temperatures ............................................ C-19 Figure C-9 Comparison of RPV Lower Head Inner Surface Temperatures ............................ C-20 Figure D-1 Illustration of MAAP5 Treatment of Debris Stream Particulation and Interactions
with Lower Plenum Water ................................................................................................... D-5 Figure D-2 MAAP5 Modeling of Entrained Particulate Debris Oxidation during Slumping to
Lower Plenum ..................................................................................................................... D-5 Figure D-3 Onset of Hydrogen Generation ............................................................................... D-7 Figure D-4 In-Vessel Hydrogen Generation Transient by Core Radial Ring........................... D-10 Figure D-5 Distribution of Active Fuel Region Fuel Temperatures at Different Times from
MAAP5 SImulation ............................................................................................................ D-14 Figure D-6 Core Geometry Distribution within Active Fuel Region from MAAP5 Simulation .. D-15 Figure D-7 Comparison of Intact Fuel Canister Mass ............................................................. D-16 Figure D-8 Cumulative SRV Mass Flow from RPV ................................................................. D-17 Figure D-9 Distribution of Active Fuel Region Fuel Temperatures at Different Times from
MELCOR Simulation ......................................................................................................... D-18 Figure D-10 Comparison of Minimum Vertical Flow Area through Fuel Assemblies across
the Radial Extent of the Core ............................................................................................ D-19
xiv

LIST OF TABLES Table 2-1 Summary of Key Plant Model Parameters ................................................................. 2-4 Table 2-2 Summary of Assumed Isolation Condenser Operation .............................................. 2-8 Table 4-1 Summary of Key Event Timings ................................................................................ 4-2 Table 5-1 Summary of Identified Modeling Differences ........................................................... 5-15 Table B-1 MAAP5 Fuel Assembly Collapse Modeling – Time-at-Temperature Approach ...... B-15 Table B-2 MELCOR Time-to-Failure Model for Crosswalk Analysis ....................................... B-17
xv

1 INTRODUCTION 1.1 Study Purpose As part of the Department of Energy: Office of Nuclear Energy (DOE-NE) initiative to investigate the Fukushima Daiichi event, MELTSPREAD and CORQUENCH were applied to assessing the status of ex-vessel core debris at Unit 1 [8]. This unit is believed to have experienced significant ex-vessel core debris relocation due to the long period without RPV water injection.
There is, however, limited information available to assess the status of core debris inside the Fukushima Daiichi Unit 1 containment. Analytical methods, thus, provide the potential for a refined understanding of the ex-vessel status of the core debris. In particular, understanding of:
• The timeframe over which the ex-vessel debris was quenched • The degree of spreading of debris over the drywell floor and the potential for melt attack of
the drywell shell • The extent of reactor pedestal, reactor pedestal sump, and drywell floor concrete erosion
This type of information can aid in the effort to decommission the damaged Fukushima Daiichi units.
MAAP5 [6] and MELCOR [7] simulations are used to provide necessary inputs to the MELTSPREAD and CORQUENCH analyses [8], which require debris discharge transients following RPV lower head breach. This information is generated by MAAP and MELCOR analyses. The transients from the MAAP5 [6] and MELCOR [7] Unit 1 simulations were thus used as the basis for the enhanced ex-vessel analysis study [8].
Both MAAP5 and MELCOR have been successfully applied to represent the overall thermal hydraulic response of the RPV and containment. This behavior is primarily influenced by overall mass and energy balance considerations. During the MELTSPREAD and CORQUENCH analyses, it was realized, however, that the MAAP5 and MELCOR simulated core melt discharge transients from the RPV lower head are quite different. Despite both codes being benchmarked against similar fuel melt experiments, these tests are not at reactor scale. The extrapolation of these test in the development of these different code models has resulted in divergences when simulating conditions at reactor scale.
The following characteristics of the debris pour into containment represent the most significant differences observed between MAAP5 and MELCOR.
• RPV pressure at time of RPV lower head breach • The fraction and temperature of molten material relocating into containment • The rate of core debris relocation into containment
1-1
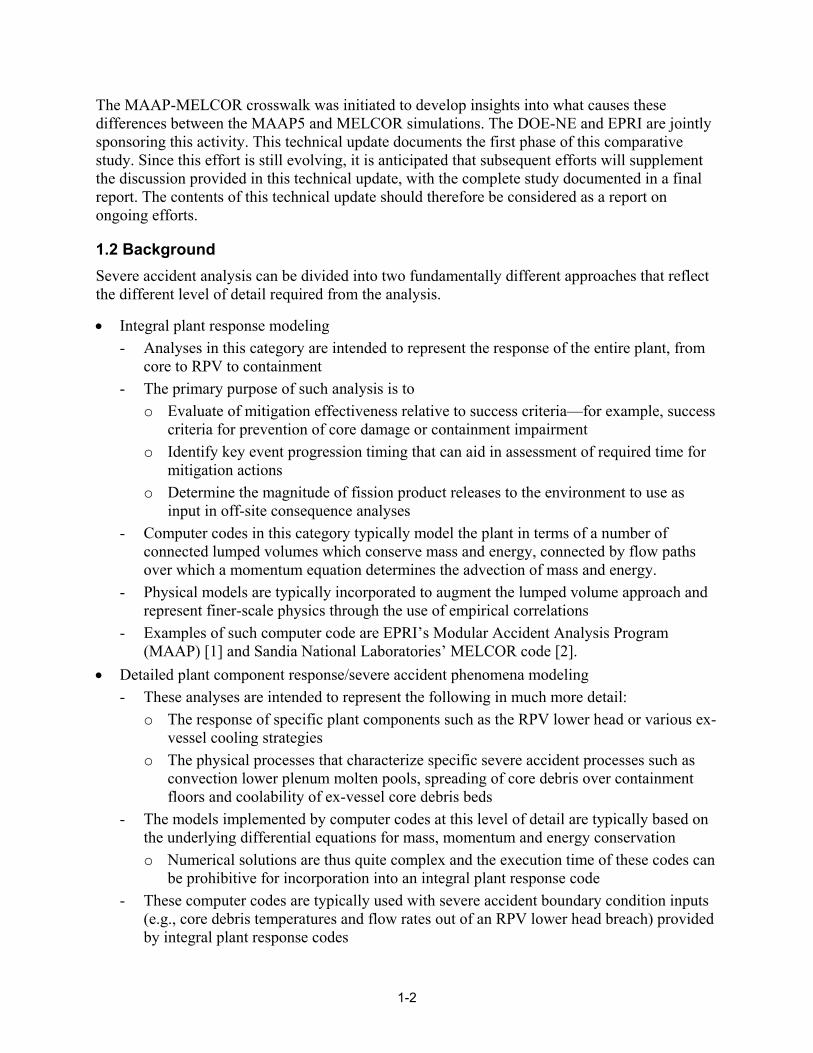
The MAAP-MELCOR crosswalk was initiated to develop insights into what causes these differences between the MAAP5 and MELCOR simulations. The DOE-NE and EPRI are jointly sponsoring this activity. This technical update documents the first phase of this comparative study. Since this effort is still evolving, it is anticipated that subsequent efforts will supplement the discussion provided in this technical update, with the complete study documented in a final report. The contents of this technical update should therefore be considered as a report on ongoing efforts.
1.2 Background Severe accident analysis can be divided into two fundamentally different approaches that reflect the different level of detail required from the analysis.
• Integral plant response modeling - Analyses in this category are intended to represent the response of the entire plant, from
core to RPV to containment - The primary purpose of such analysis is to
o Evaluate of mitigation effectiveness relative to success criteria—for example, success criteria for prevention of core damage or containment impairment
o Identify key event progression timing that can aid in assessment of required time for mitigation actions
o Determine the magnitude of fission product releases to the environment to use as input in off-site consequence analyses
- Computer codes in this category typically model the plant in terms of a number of connected lumped volumes which conserve mass and energy, connected by flow paths over which a momentum equation determines the advection of mass and energy.
- Physical models are typically incorporated to augment the lumped volume approach and represent finer-scale physics through the use of empirical correlations
- Examples of such computer code are EPRI’s Modular Accident Analysis Program (MAAP) [1] and Sandia National Laboratories’ MELCOR code [2].
• Detailed plant component response/severe accident phenomena modeling - These analyses are intended to represent the following in much more detail:
o The response of specific plant components such as the RPV lower head or various ex-vessel cooling strategies
o The physical processes that characterize specific severe accident processes such as convection lower plenum molten pools, spreading of core debris over containment floors and coolability of ex-vessel core debris beds
- The models implemented by computer codes at this level of detail are typically based on the underlying differential equations for mass, momentum and energy conservation o Numerical solutions are thus quite complex and the execution time of these codes can
be prohibitive for incorporation into an integral plant response code - These computer codes are typically used with severe accident boundary condition inputs
(e.g., core debris temperatures and flow rates out of an RPV lower head breach) provided by integral plant response codes
1-2
- Examples of computer codes in this category are MELTSPREAD [3, 4] and CORQUENCH [5]
MAAP and MELCOR are both codes that have received extensive application to integral plant response analysis. They are supported by an extensive validation base and have recently been successfully applied to the investigation of the three core damage events at Fukushima Daiichi [6, 7]. These types of analytical investigations of the Fukushima Daiichi events are currently being employed to aid in the development of plans for decommissioning the damaged units.
While MAAP5 and MELCOR have both represented the overall plant response observed at the three damaged Fukushima Daiichi units, calculations of detailed core damage configurations have differed. As noted in Section 1.1, these types of differences were first encountered in attempts to calculate ex-vessel core debris relocation and quenching using the more mechanistic modeling implemented in the MELTSPREAD and CORQUENCH computer codes [8].
The following discussion provides additional background regarding the nature of these differences.
The RPV pressure at time of lower head breach is related to the potential differences in the representative Unit 1 accident scenario identified by the two codes.
• The MELCOR simulations found high temperatures in the Main Steam Lines (MSLs), which could cause creep rupture of an MSL at high RPV pressure
• This resulted in the depressurization of the RPV around T+5 hours1, about 5 to 10 hours prior to RPV lower head breach in the MELCOR simulations
• The MAAP5 simulations identified that RPV depressurization was possible at Unit 1 prior to RPV lower head breach
• While this could represent the observed RPV and drywell pressure measurements, these data were sufficiently sparse during the first 10 hours of the event so that analyses were not conclusive
• A high pressure scenario (i.e., the RPV was at a high pressure at the time of RPV lower head breach) could represent the observed RPV and drywell pressures, although not as well
• MAAP5 analyses also identified relatively low temperatures in the MSLs and associated SRV bodies
• A thermally-induced failure of an MSL, prior to lower head breach, was not identified by MAAP5 analyses
• The primary scenario that could have caused such RPV depressurization was extensive failure in-core instruments (e.g., Transverse In-Core Probes (TIPs), although evidence to support RPV depressurization in this manner is not definitive
1 Throughout this report, the following notation is employed to denote time from initiation event. Thus, “T+X hours” should be read as X hours have elapsed since the time of the initiating event. For the Fukushima Daiichi Unit 1 event, which is the basis for the stylized sequence used in this study, the time of the initiating event corresponds to the time of the earthquake on March 11, 2011 at 14:46 JST.
1-3

• Two MAAP5 analyses were thus used in the enhanced ex-vessel analyses [8]—with RPV depressurization prior to and at RPV lower head breach
The depressurization of the RPV prior to lower head breach had previously been identified in the MELCOR State-of-the-Art Reactor Consequence Analysis (SOARCA) study [9]. In this previous SOARCA study, the following mechanisms for RPV depressurization prior to lower head breach were identified
• Stochastic seizure open of a cycling SRV • Thermally-induced seizure open of a cycling SRV (thermal expansion of the SRV stem body
resulting in the valve becoming stuck in the open position) • Creep-to-failure of a high temperature MSL
The Peach Bottom SOARCA study identified that thermally-induced seizure of a cycling SRV was a plausible mechanism by which RPV depressurization could occur prior to lower head breach [9].
Further analysis conducted as part of the Peach Bottom SOARCA Uncertainty Analysis study [11] identified MSL creep rupture as an equally plausible scenario. These failure modes arise in MELCOR simulations due to the very high temperatures simulated to occur in the MSLs following the onset of core degradation.
MAAP5 simulations for a BWR, however, have never identified very high temperatures occurring in the MSL following core damage for a BWR.
The low pressure MAAP5 simulated pour has the characteristics
• Approximately 100% of the original core mass relocated into containment as molten debris—this is principally determined by the melt relocation model from the core to the lower plenum
• The temperature of the debris is about 100 K to 200 K above the melting point of core debris (i.e., it is superheated)2
• All of this debris relocated into containment over a time of about 5 s
The MELCOR simulated pour, by contrast, has the characteristics
• Approximately 100% of the original core mass relocated into containment with the fraction of debris relocating as solid debris at 56%
• The temperature of the debris ranged from 1850 K to 2100 K (average of 1975 K) • All of this debris relocates into containment over a time a little above 1 hour (4030 s)
The debris that pours into containment is significantly different. MELCOR is characterized by a largely solid, low temperature pour of debris over a long time frame. By contrast, the MAAP5 debris pour occurs almost instantaneously with the debris at very high temperature. This is likely
2 The degree of superheating can be somewhat lower for different accident sequences. More rapid failure of the RPV lower head has been found in some accident sequences to result in average debris temperatures of 2400 K to 2500 K.
1-4

due to the MAAP modeling of a crust formed on the RPV wall as a result of the debris-to-wall heat transfer. This crust material is attached to the lower plenum structures and remains in the vessel following vessel failure.
As a result, MELCOR-type debris will spread very slowly within the reactor pedestal and drywell floors – the debris has very high viscosity. MAAP5-type debris will spread rapidly throughout the reactor pedestal and drywell.
The MAAP5-type debris thus poses a more significant hazard to the drywell liner as it relocates very quickly and at high temperatures. This has significant safety consequences. In the absence of water on the drywell floor, there is a reasonable likelihood that the drywell liner will melt shortly after lower head breach, impairing containment.
It is important to note that these simulations are typical of MAAP5 and MELCOR simulated debris pours into containment. For example, similarly low temperature debris was observed in the Peach Bottom SOARCA study [9].
The consequences of modeling differences between MAAP and MELCOR have been observed for some period of time. This has principally focused on the different amounts of in-vessel hydrogen generation simulated by the two codes. It is typical for MELCOR simulations to have approximately twice the amount of in-vessel hydrogen generation when compared with comparable MAAP simulations. This difference applies to both MAAP4 and MAAP5.
1.3 Objectives and Scope This technical update documents work that was performed as a consequence of the differences between MAAP5 and MELCOR observed in the Fukushima Daiichi Unit 1 enhanced ex-vessel analysis [8]. The work reflects discussion during an industry-level meeting presenting the initial comparison of MAAP5 and MELCOR. The discussion held at this industry meeting is referred to as the crosswalk.
This report is the product of a joint effort between EPRI and the DOE-NE. The project was conceived with the goal of developing insights into which aspects of MAAP5 and MELCOR modeling result in divergent simulations of in-vessel core melt progression.
This study is a comparative assessment of how the two codes modeled in-vessel core melt progression, from onset of core damage to breach of the RPV lower head. The objective of this comparative assessment is the identification of the principal modeling assumptions in the two codes leading to the identified simulation differences.
1.4 Report Structure This report is structured into the following sections and appendices.
• Section 2 describes the scenario and associated assumptions simulated as well as the plant model used as part of this MAAP5 and MELCOR comparative study
• Section 3 describes the methodology applied in this code-to-code comparison, identifying aspects of accident progression and associated metrics relevant to the study
• Section 4 provides a summary of the MAAP5 and MELCOR simulation results for the scenario and plant model considered in this study
1-5
• Section 5 presents the key conclusions from this code-to-code comparison study • Appendix A presents the MAAP5 and MELCOR simulation results of the overall plant
response, focusing on the types of parameters that are most readily available to plant personnel in the event of an accident, such as: - RPV pressure and water level transients - System performance characteristics such as feedwater injection - Drywell and wetwell pressure transients - Suppression pool bulk temperature transient
• Appendix B provides a detailed description of the following: - The models MAAP5 and MELCOR have implemented to simulate core melt progression
prior to core slump - The simulation results obtained for the code-to-code comparison scenario that are most
illustrative of how each code represents the degraded core prior to core slump • Appendix C describes the core melt progression following core slump, identifying:
- The models MAAP5 and MELCOR have implemented to represent degraded core in the lower plenum and the associated challenges to RPV lower head integrity
- The simulation results for the comparison scenario, illustrating the condition of core debris in the lower plenum and the modeling of RPV lower head response
• Appendix D describes how in-vessel core melt progression is related to hydrogen generation with an identification of: - The models MAAP5 and MELCOR implement to determine the in-vessel hydrogen
generation transient - The simulation results for the transient generation of in-vessel hydrogen
1-6
2 MAAP5 AND MELCOR CODE-TO-CODE BENCHMARKING SCENARIO AND PLANT MODEL 2.1 Introduction This section summarizes the severe accident scenario and plant model used as the basis for comparing MAAP5 and MELCOR simulations.
As noted above, the focus of this study is on in-vessel core melt progression to the point of RPV lower head breach. The following quantities have been identified from the Fukushima Daiichi MAAP5 [6] and MELCOR [7] simulations as representing key differences between the two code simulations. These differences have been noted since the Peach Bottom SOARCA study [9]. They are generally considered to be significant differences because of their effect on RPV and containment integrity.
• Gas temperatures in the RPV MSLs • Hydrogen generation prior to core slumping into the RPV lower plenum • How material accumulates in the core • How relocation to the lower plenum is modeled • The modes of RPV failure that are included in the analysis • Properties of the debris relocating out of the RPV lower plenum following lower head breach
These accident progression features are not specific to any one type of event sequence; they primarily reflect the modeling of severe accident phenomena.
As such, this comparative study is based on a relatively simple scenario with limited mitigation. This facilitates evaluation of MAAP5 and MELCOR core melt progression simulations. In this manner, complications are avoided that relate to complicated event bifurcations. These have the potential to obscure the impact of differences in how MAAP5 and MELCOR represent the underlying physics.
The specific unmitigated scenario chosen is a stylized version of the Fukushima Daiichi Unit 1 event. Detailed evaluation of code simulations of this scenario is timely—the results from these codes are of particular value to Japanese efforts to develop decommissioning plans.
This section is organized as follows:
• Section 2.2 presents a summary of the plant representation used for the MAAP5 and MELCOR simulations - The primary focus of this section is how the core and lower RPV are represented
• Section 2.3 summarizes the boundary conditions assumed for the plant model, such as the mass of different core structures and operation of different plant systems
• Section 2.4 presents the assumptions that define the simulated accident scenario
2-1
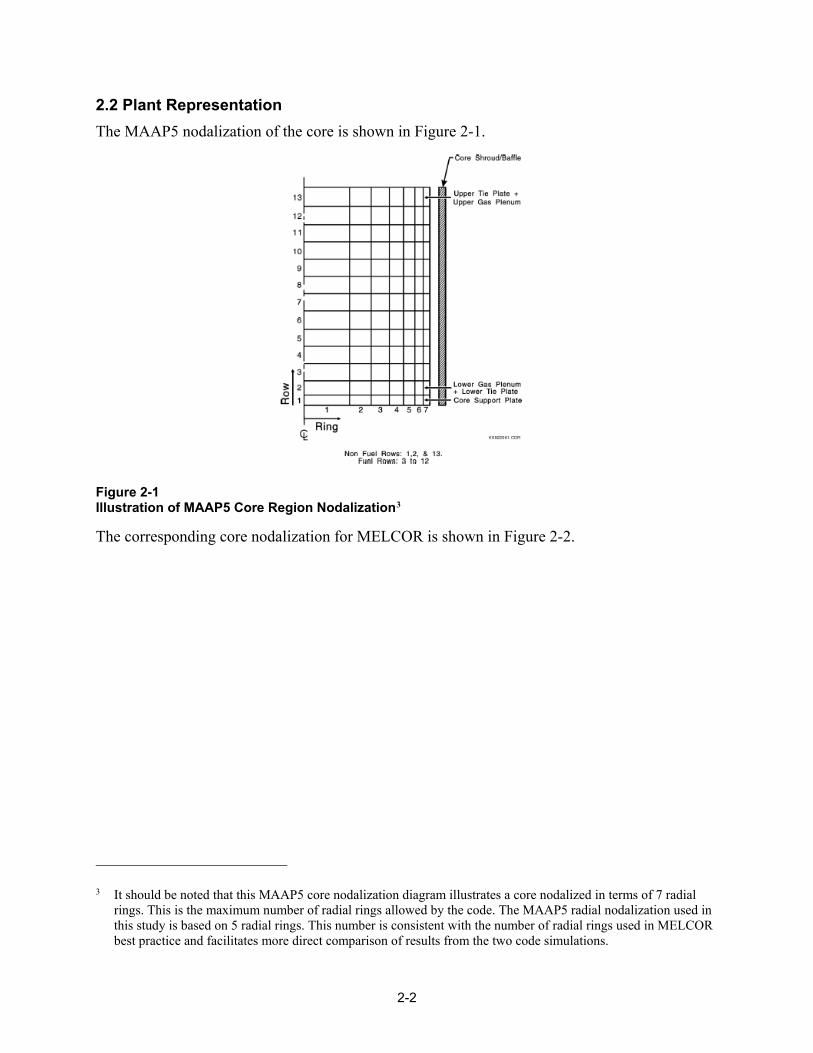
2.2 Plant Representation The MAAP5 nodalization of the core is shown in Figure 2-1.
Figure 2-1 Illustration of MAAP5 Core Region Nodalization3
The corresponding core nodalization for MELCOR is shown in Figure 2-2.
3 It should be noted that this MAAP5 core nodalization diagram illustrates a core nodalized in terms of 7 radial rings. This is the maximum number of radial rings allowed by the code. The MAAP5 radial nodalization used in this study is based on 5 radial rings. This number is consistent with the number of radial rings used in MELCOR best practice and facilitates more direct comparison of results from the two code simulations.
2-2
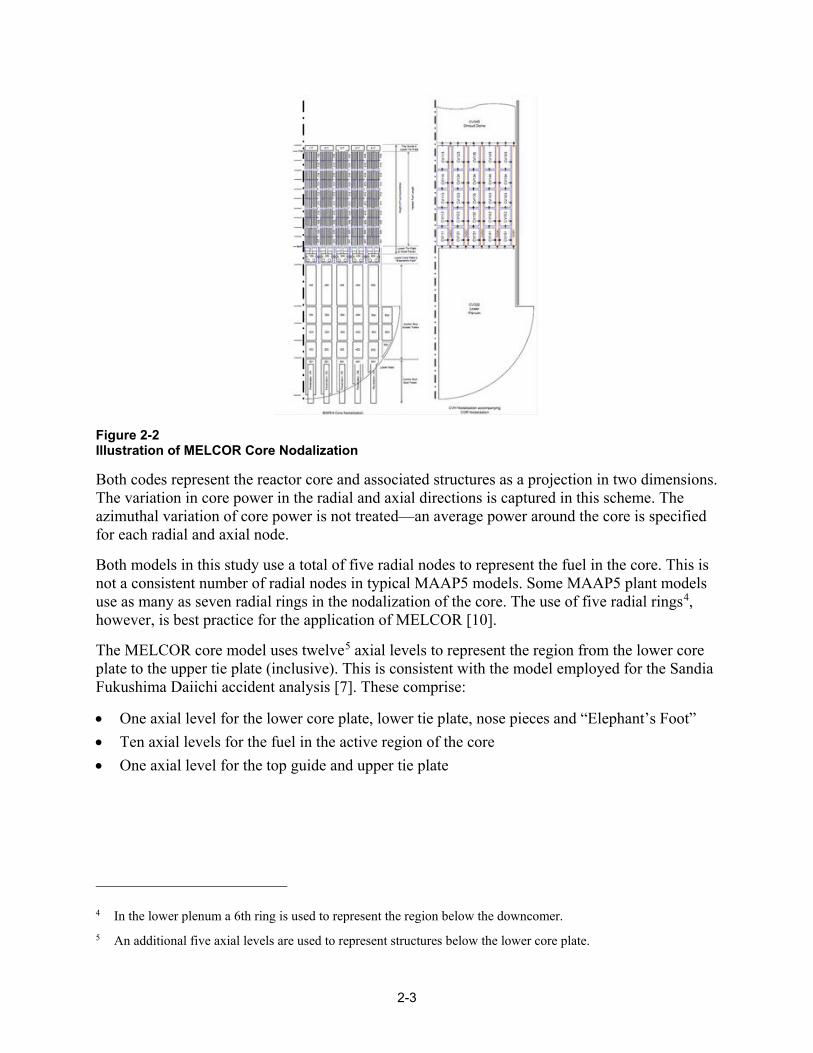
Figure 2-2 Illustration of MELCOR Core Nodalization
Both codes represent the reactor core and associated structures as a projection in two dimensions. The variation in core power in the radial and axial directions is captured in this scheme. The azimuthal variation of core power is not treated—an average power around the core is specified for each radial and axial node.
Both models in this study use a total of five radial nodes to represent the fuel in the core. This is not a consistent number of radial nodes in typical MAAP5 models. Some MAAP5 plant models use as many as seven radial rings in the nodalization of the core. The use of five radial rings4, however, is best practice for the application of MELCOR [10].
The MELCOR core model uses twelve5 axial levels to represent the region from the lower core plate to the upper tie plate (inclusive). This is consistent with the model employed for the Sandia Fukushima Daiichi accident analysis [7]. These comprise:
• One axial level for the lower core plate, lower tie plate, nose pieces and “Elephant’s Foot” • Ten axial levels for the fuel in the active region of the core • One axial level for the top guide and upper tie plate
4 In the lower plenum a 6th ring is used to represent the region below the downcomer. 5 An additional five axial levels are used to represent structures below the lower core plate.
2-3
The MAAP5 core model has a different number of axial levels. This is the primary area where the two plant models differ with respect to core nodalization.
• One axial level for the core support plate • One axial level for the structures above the core support plate to the bottom of the active
region of the fuel assemblies the non-active bottom of the fuel assemblies • Thirty axial levels for the fuel in the active region of the core • One axial level for the top guide and upper tie plate
The MAAP5 model uses the same number of axial levels to represent the lower and upper core structures outside the active region. A larger number of levels, however, are used to represent the fuel in the active region of the core. Typical MAAP5 plant models often use a larger number of levels to represent the fuel in the active region. It is not uncommon for MAAP5 plant models to use in excess of 30 nodes to represent the fuel in the active core region. To address this difference, a sensitivity analysis is conducted with MAAP5 to assess the impact of reducing the number of levels in the active core region to five (the number of levels assumed in the MELCOR model).
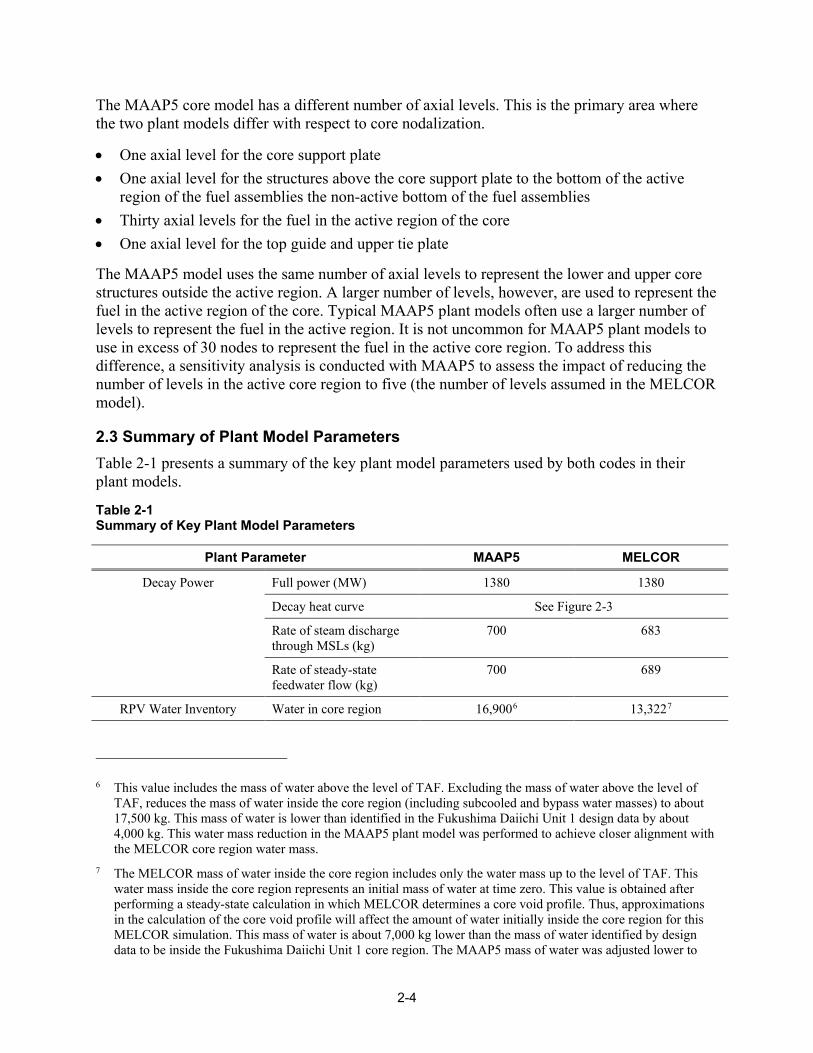
2.3 Summary of Plant Model Parameters Table 2-1 presents a summary of the key plant model parameters used by both codes in their plant models.
Table 2-1 Summary of Key Plant Model Parameters
Plant Parameter MAAP5 MELCOR
Decay Power Full power (MW) 1380 1380
Decay heat curve See Figure 2-3
Rate of steam discharge through MSLs (kg)
700 683
Rate of steady-state feedwater flow (kg)
700 689
RPV Water Inventory Water in core region 16,9006 13,3227
6 This value includes the mass of water above the level of TAF. Excluding the mass of water above the level of TAF, reduces the mass of water inside the core region (including subcooled and bypass water masses) to about 17,500 kg. This mass of water is lower than identified in the Fukushima Daiichi Unit 1 design data by about 4,000 kg. This water mass reduction in the MAAP5 plant model was performed to achieve closer alignment with the MELCOR core region water mass.
7 The MELCOR mass of water inside the core region includes only the water mass up to the level of TAF. This water mass inside the core region represents an initial mass of water at time zero. This value is obtained after performing a steady-state calculation in which MELCOR determines a core void profile. Thus, approximations in the calculation of the core void profile will affect the amount of water initially inside the core region for this MELCOR simulation. This mass of water is about 7,000 kg lower than the mass of water identified by design data to be inside the Fukushima Daiichi Unit 1 core region. The MAAP5 mass of water was adjusted lower to
2-4
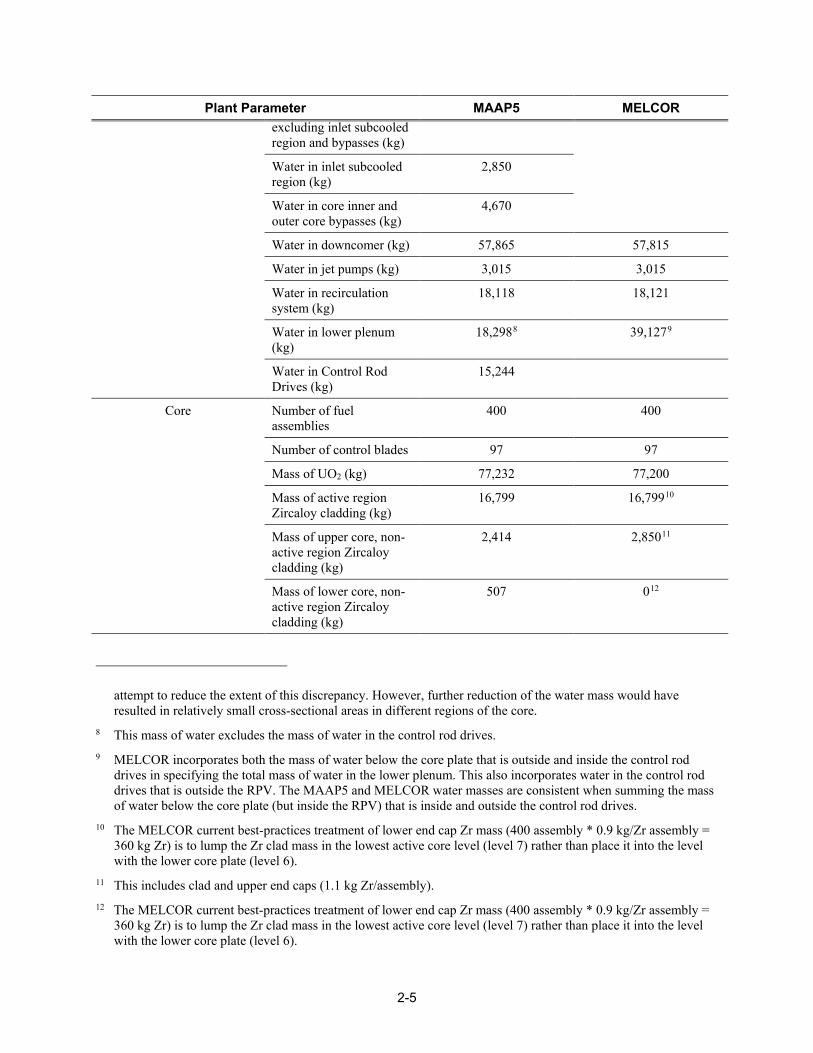
Plant Parameter MAAP5 MELCOR excluding inlet subcooled region and bypasses (kg)
Water in inlet subcooled region (kg)
2,850
Water in core inner and outer core bypasses (kg)
4,670
Water in downcomer (kg) 57,865 57,815
Water in jet pumps (kg) 3,015 3,015
Water in recirculation system (kg)
18,118 18,121
Water in lower plenum (kg)
18,2988 39,1279
Water in Control Rod Drives (kg)
15,244
Core Number of fuel assemblies
400 400
Number of control blades 97 97
Mass of UO2 (kg) 77,232 77,200
Mass of active region Zircaloy cladding (kg)
16,799 16,79910
Mass of upper core, non-active region Zircaloy cladding (kg)
2,414 2,85011
Mass of lower core, non-active region Zircaloy cladding (kg)
507 012
attempt to reduce the extent of this discrepancy. However, further reduction of the water mass would have resulted in relatively small cross-sectional areas in different regions of the core.
8 This mass of water excludes the mass of water in the control rod drives. 9 MELCOR incorporates both the mass of water below the core plate that is outside and inside the control rod
drives in specifying the total mass of water in the lower plenum. This also incorporates water in the control rod drives that is outside the RPV. The MAAP5 and MELCOR water masses are consistent when summing the mass of water below the core plate (but inside the RPV) that is inside and outside the control rod drives.
10 The MELCOR current best-practices treatment of lower end cap Zr mass (400 assembly * 0.9 kg/Zr assembly = 360 kg Zr) is to lump the Zr clad mass in the lowest active core level (level 7) rather than place it into the level with the lower core plate (level 6).
11 This includes clad and upper end caps (1.1 kg Zr/assembly). 12 The MELCOR current best-practices treatment of lower end cap Zr mass (400 assembly * 0.9 kg/Zr assembly =
360 kg Zr) is to lump the Zr clad mass in the lowest active core level (level 7) rather than place it into the level with the lower core plate (level 6).
2-5
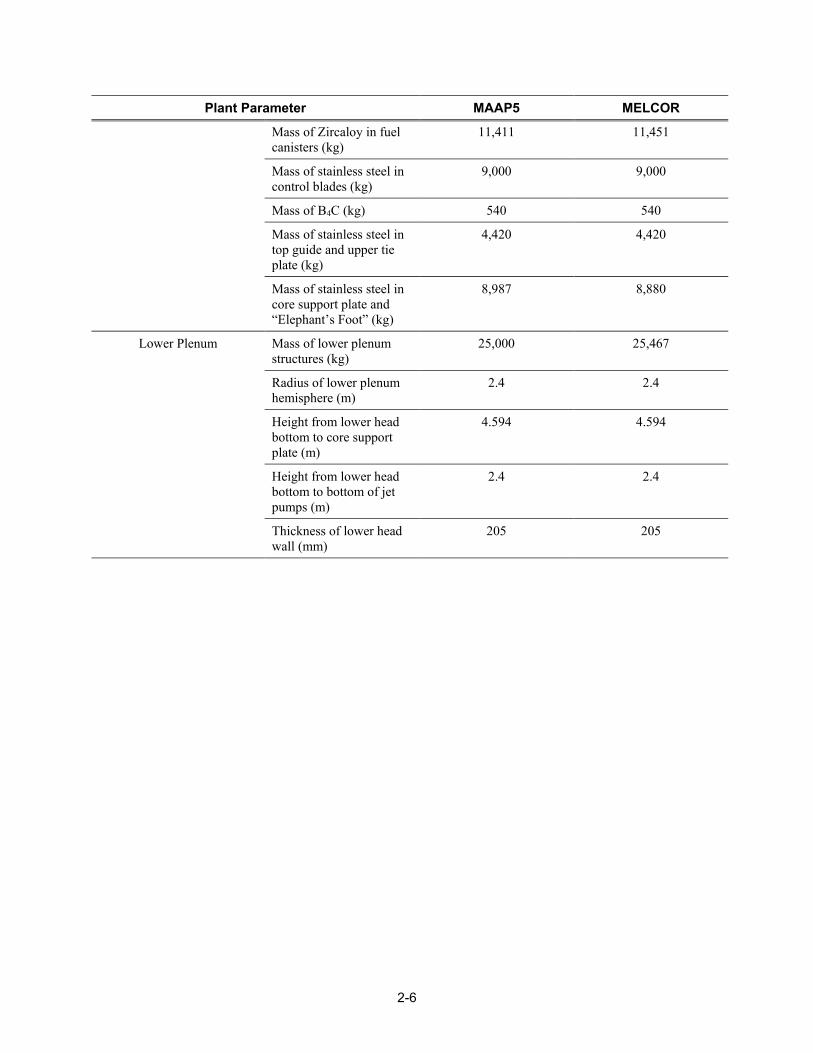
Plant Parameter MAAP5 MELCOR
Mass of Zircaloy in fuel canisters (kg)
11,411 11,451
Mass of stainless steel in control blades (kg)
9,000 9,000
Mass of B4C (kg) 540 540
Mass of stainless steel in top guide and upper tie plate (kg)
4,420 4,420
Mass of stainless steel in core support plate and “Elephant’s Foot” (kg)
8,987 8,880
Lower Plenum Mass of lower plenum structures (kg)
25,000 25,467
Radius of lower plenum hemisphere (m)
2.4 2.4
Height from lower head bottom to core support plate (m)
4.594 4.594
Height from lower head bottom to bottom of jet pumps (m)
2.4 2.4
Thickness of lower head wall (mm)
205 205
2-6

Figure 2-3 Decay Heat Curve used by MAAP5 and MELCOR13
13 Note that the same decay heat curve is used for both the MAAP5 and MELCOR simulations.
2-7

2.4 Scenario Assumptions The following are a list of assumptions that define the event scenario simulated by MAAP5 and MELCOR.
• MSIV operation - MSIV closure signal at T+52.5 s - MSIV open area reducing from fully open to fully closed over a 3 s interval from the time
of the closure signal • CRD flow
- At reactor scram it is assumed that the CRD injection flow ceases • Feedwater system
- The feedwater system is assumed to inject for the first 60 s following the initiating event - The feedwater injection transient is an imposed boundary condition - the detailed
injection transient is presented in Appendix A.3.3 - The specific enthalpy of feedwater is assumed to be 792 kJ/kg
• Isolation condenser heat removal is assumed to be constant with pressure at 42.4 MW per train - The periods of Isolation Condenser operation are shown in Table 2-2
• SRV seizure is assumed to occur at T+7 hours - All discharge through the seized SRV is assumed to go into the suppression pool
Table 2-2 Summary of Assumed Isolation Condenser Operation
Time Isolation Condenser Operation Starts
[s]
Time Isolation Condenser Operation Ceases
[s] Number of Isolation
Condenser Trains Operated
360 1020 2
1860 1980 1
2280 2400 1
2760 2880 1
2-8
3 COMPARISON METHODOLOGY 3.1 Introduction Severe accident analysis codes like MAAP5 and MELCOR have been developed with information from numerous separate effects tests. In the area of core damage progression, the range of experimental tests is more limited. A number of tests have been performed that provide insights into core melt progression at the level of single fuel assemblies. VERCORS [20] and Phébus [21] are examples of these tests.
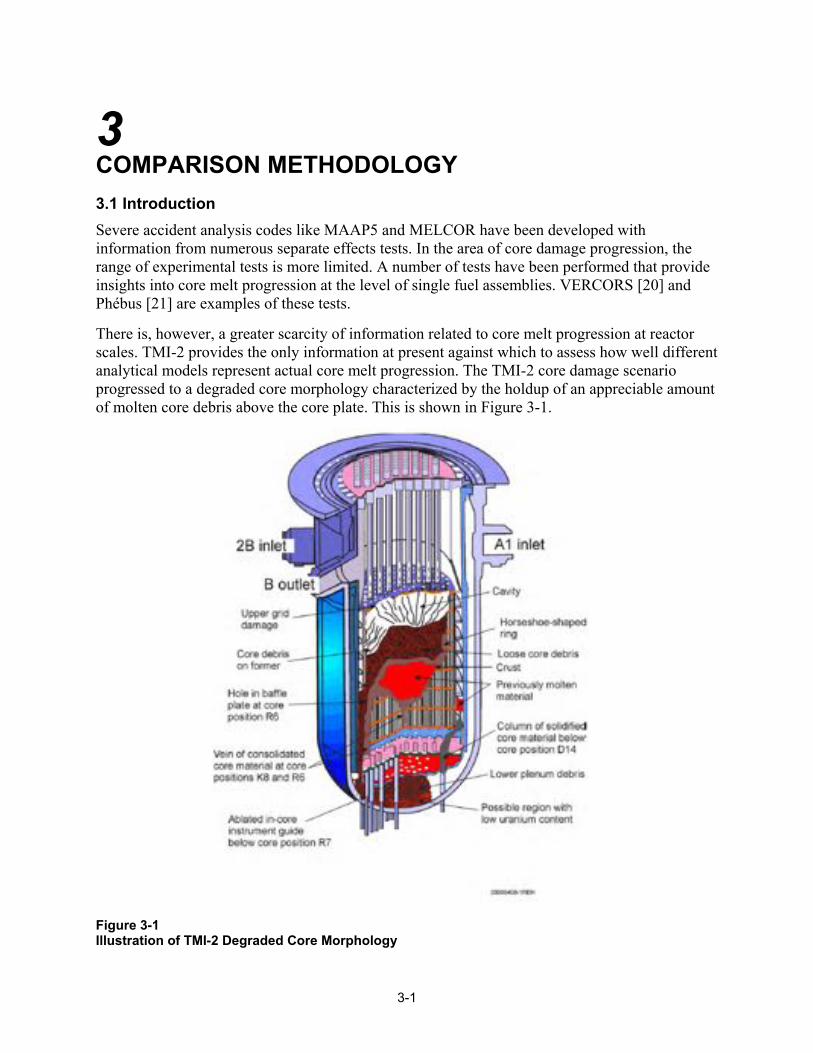
There is, however, a greater scarcity of information related to core melt progression at reactor scales. TMI-2 provides the only information at present against which to assess how well different analytical models represent actual core melt progression. The TMI-2 core damage scenario progressed to a degraded core morphology characterized by the holdup of an appreciable amount of molten core debris above the core plate. This is shown in Figure 3-1.
Figure 3-1 Illustration of TMI-2 Degraded Core Morphology
3-1

The holdup of molten core debris above the core plate indicated a scenario in which downward relocation of degraded core materials on to the core plate was impeded by debris blockages. The formation of the molten pool above the core plate, however, resulted in sideward relocation of molten material toward the periphery of the core. This ultimately promoted the relocation of molten core debris into the water baffle region, the lower core support assembly and RPV lower plenum.
While TMI-2 provides a significant amount of data to understand reactor scale core melt progression, it is important to recognize ways in which this event may not completely represent all core melt progression scenarios.
• The accident transient at TMI-2 was different from a typical boil-down as considered in the accident scenario simulated in this study - The rapid reflood of the RPV at TMI-2 upon restart of the Main Coolant Pumps (MCPs)
resulted in core melt progression occurring under water14 - Although the core had degraded by this point, the water level in the RPV was rapidly
restored - This rate of water injection was well in excess of that required to remove decay heat
without the injected water boiling (i.e., a flow rate that can remove all the decay heat sensibly)
- Water injection into the RPV was continued such that the core never uncovered again15 • Water injection at such a rapid rate would have resulted in effective heat removal from core
debris in contact with water - This had the effect of maintaining relatively stable crusts around the debris surfaces in
contact with the water - Core degradation that occurred prior to the restart of the MCPs, however, reduced the
heat transfer surface area from the core - Thus, core melting started prior to water injection being restored - The effect of water injection on stabilizing the degraded core, promoting holdup of
molten debris bed within the core region, is a feature of the TMI-2 event that is distinct from the unmitigated boil-down scenario considered in this study
- The effect of water injection on holdup of core debris above the core plate is a feature of the TMI-2 event that must be considered
The accident scenario simulated in this study, based on Fukushima Daiichi Unit 1, no water injectio is assumed to occur until many hours after the estimated time of core uncovery. Under
14 During the TMI-2 event, the MCPs were restarted in an attempt to restore forced convection cooling. The operators were not able to conclude that sequential attempts to restart MCPs 1A, 2A and 1B, respectively, were effective. At 174 minutes into the accident, MCP 2B was restarted. Flow was induced in the B loop for a brief period of time between 3 s and 9 s. An appreciable volume of water was added to the downcomer due to this brief MCP operation. into the event. They operated only for a brief period of time.
15 Following the restart of MCP 2B, High Pressure Injection (HPI) flow was initiated about 195 minutes into the accident.
3-2
these conditions the potential for continued downward relocation of core debris to the lower plate, rather than mid-core crust formation cannot be discounted. There is no reactor scale information available at present that allows assessment of scenario-dependent differences on core melt progression.
Thus, application of severe accident computer codes to the Fukushima Daiichi core melt events require extrapolation of separate effect experiments and the reactor scale TMI-2 event. The global behavior (e.g., RPV water level, RPV pressure and containment pressure) can be reasonably well approximated based on overall energy balances. However, the simulation of detailed core debris morphology cannot be uniquely resolved at present based on available information.
How MAAP5 and MELCOR have extrapolated available experimental and reactor scale event data will influence other accident characteristics—those that are more directly related to core debris morphology. An important example of such a characteristic is the amount of hydrogen generated in-vessel, which depends on the surface area of core metals exposed to the RPV steam environment.
This section is organized as follows.
• Section 3.2 presents the signatures of overall accident progression used for comparison of MAAP5 and MELCOR simulations in this study - This comparison primarily focuses on key event timings of relevance to the transition
between distinct plant damage conditions • Section 3.3 presents the key features of plant system behavior of relevance to this accident
scenario that are compared between the MAAP5 and MELCOR studies • Section 3.4 presents the methodology followed for assessing the overall simulation of RPV
thermal hydraulic response • Section 3.5 discusses the framework applied for contrasting the MAAP5 and MELCOR
simulations of core melt progression prior to core slumping • Section 3.6 outlines the approach adopted for comparing the MAAP5 and MELCOR
simulation of core debris dynamics and RPV lower head response following core slumping
3.2 Overall In-Vessel Core Damage Progression The following parameters provide a representation of overall in-vessel core melt progression. These capture the timing of transition between distinct core damage states as well as the severity of core damage within different states.
The following distinct damage states are relevant for characterizing overall core damage in a BWR (as well as PWRs).
• Core-OX – Onset of core oxidation • Core-MELT – Onset of core melting and relocation of core debris out of original fuel pin
configuration • InVessel-SLUMP – Slumping of core debris into the lower plenum • InVessel-LHF – Heat up and failure of the RPV lower head
3-3

While these are distinct damage states of analytical relevance, particularly for a code comparison study, they are not directly applicable to accident management evaluations. For example, the EPRI SAMG TBR only considers in-vessel core damage states [13].
• OX – core oxidation without gross relocation out of the coolable fuel bundle/assembly configuration
• BD – badly damaged core with sufficient relocation of core debris out of the fuel bundle/assembly configuration to challenge the coolability of the core debris
It is not possible to distinctly resolve the in-vessel status of the core beyond these categories during a real event. It is important to note that the set of instrumentation in a typical reactor is not designed to uniquely identify core status. This task is relatively difficult to perform directly, as evidenced by the Fukushima Daiichi event [6, 7].
The timings of transitions between these different core damage states are important to the evaluation of overall accident progression. The ability to simulate accident progression timing is relevant, for example, to providing insights that can inform accident management. Knowledge of timing provides a first indication regarding the efficacy of different accident management strategies. Thus, this component of overall accident progression simulation is perhaps the most relevant to the development of accident management strategies.
The overall timing of core melt progression can be characterized in terms of the following parameters:
• Core oxidation onset • Core melting commencement • First failure of fuel assemblies due to loss of structural integrity16 • Release of fission products to the Reactor Coolant System (RCS) • Possible release of fission products to the containment • Possible release of fission products outside of the containment • First and potentially subsequent relocations of significant masses of core materials to the
lower plenum • Formation of molten debris pools in the lower plenum • Initial RPV lower head breach • Gross relocation of core debris into containment (if this differs from the timing of the RPV
lower head failure)17
16 This captures the time at which fuel assemblies have been exposed to excessive temperature, causing structural failure. This failure mode is distinct from the melting of core structures, which, however, can contribute to their structural weakening.
17 This represents the point at which the majority of core debris is no longer in the RPV. In this study, this is assumed to correspond to relocation of at least 50% of the core mass into containment.
3-4
3.3 Overall RPV Thermal Hydraulic Response Prior to the onset of core damage, simulation of thermal hydraulic behavior in the RPV is necessary to capture the point at which core integrity is first challenged (i.e., the point at which core oxidation commences). Beyond the onset of core damage, the thermal hydraulic response of the RPV determines features of accident progression. In this phase, the principal components of accident progression are related to thermal hydraulic conditions in the RPV are:
• Temperatures in the RPV steam dome and MSLs - The severe temperature transient experienced following the onset of core damage will
drive temperatures in the RPV steam dome and MSLs - For sufficiently extreme temperature transients, the potential exists for the MSLs to
experience creep - Structural failure of one of the MSLs will cause RPV depressurization prior to RPV
lower head breach, which would enhance flow out of the RPV into containment • RPV pressure and associated flows out of the RPV into containment
- Fission product transport into containment can vary significantly based on the RPV pressure history following the onset of core damage
Thus, the simulation of RPV thermal hydraulic response has a critical effect on the predicted release of fission products into containment. While not directly of relevance to core status, the characterization of fission product release is ultimately influenced by the RPV thermal hydraulic state.
The following parameters characterize the overall mass and energy transport within the RPV:
• RPV pressure • RPV water level • RPV water mass • Energy removal by Isolation Condenser • Feedwater injection transient • Mass and energy flow rate of steam through MSL • Mass and energy flow rate of steam through the SRV • Integrated mass and energy flow of steam through the SRV • Flow rate of hydrogen through the SRV • Integrated mass and energy flow of hydrogen through the SRV • The flow rate of high temperature steam and hydrogen through a failure site in the RPV
pressure boundary to the containment18
18 For the purposes of this study, this failure path has been artificially suppressed in the MAAP5 simulations. MELCOR does not model such a failure path as part of its best practices [10].
3-5
3.4 Reactor Core Degradation Section 3.3 discussed the metrics identified for the comparison of MAAP5 and MELCOR simulations of overall severe accident progression. These metrics represents signatures of the overall progression of a severe accident, from initial onset of core damage to the point of RPV lower head breach. This section presents the types of metrics that are applied for the evaluation of how more detailed features of reactor core degradation are simulated.
As in the discussion of Section 3.3, the evaluation of core degradation simulations is presented in terms of a set of core damage states. The parameters of relevance to the description of evolving degradation within and transition between core damage states are as follows.
• Core-OX - Peak cladding/core temperature
o This parameter is critical in severe accident computer models since the exothermic oxidation reactions are thermally activated
o In PRAs, the occurrence of peak core temperatures above 1255 K (1800°F) is used to identify the occurrence of conditions that would support the onset of core oxidation—simulations of this parameter thus impacts the evaluation of success criteria in PRAs19
- In-vessel mass of hydrogen generated o Prior to formation of significant debris (particulate and molten debris), the generation
of hydrogen will be governed primarily by correlations used to estimate the rate of exothermic reaction
o The fuel cladding temperature is an additional parameter that is an input to such oxidation rate correlations
o This parameter therefore evaluates the degree to which simulation of cladding temperature and oxidation reaction rate agree between two code simulations
• Core-MELT - Debris formation transient
o Total debris (not molten) o Total mass of molten material within the core region o These parameters capture how two simulations represent the formation and relocation
of debris within the core region o The amount of molten debris re-freezing as it relocates (candles) downward through
the core will be reflected in the molten debris transient - Initial onset of loss of core structure integrity
o Core structural components affected, which include stainless steel, Inconel, B4C, Zircaloy and UO2
o Location of core structural component
19 Success criteria refer to the set of conditions required to classify different prevention or mitigation strategies as successful within PRA logic as successful.
3-6
o Failure mode and over-temperature o This reflects the regions of the core first susceptible to structure degradation
- Debris formation by level in reactor core (across all radial rings) - Dissolution of control blade materials
o Debris formation o Single component melting o Eutectic formation
- Dissolution of fuel channel canisters o Cumulative mass of degraded fuel canister material o The onset temperature for degradation of fuel channel canisters o Single component melting o Eutectic formation
- Fuel cladding degradation o Mechanical failure o Single component melting o Eutectic formation
- Degradation of fuel assemblies o Debris formation o Single component melting
3.5 Core Damage Progression at and After Core Debris Slumping to Lower Plenum Section 3.4 presented the parameters considered in evaluating the simulation of reactor core degradation. This evaluation is restricted to the phase of the severe accident prior to core slumping to the lower plenum.
This section addresses the parameters of relevance to comparing simulation results once core debris has begun to slump into the lower plenum. As in the discussion of Section 3.5, the evaluation of core degradation within the lower plenum is presented in terms of the same core damage states identified in Section 3.3.
Integral severe accident analysis codes have been implemented with different models for the slumping of core debris into the lower plenum. These different models reflect identified debris relocation pathways. The manner in which the different models are invoked can be simulation-dependent, dependent on user-modeling choices.
The primary pathways for core debris slumping into the lower plenum are:
• Molten material drainage through openings in the core plate • Mechanical failure of the core plate due to transfer of the core load to the plate and its
support structure • Melt-through of the shroud, relocation of core debris into the downcomer region, subsequent
melt-through of the jet pumps with drainage of molten debris into the lower plenum
3-7

Comparison of MAAP5 and MELCOR simulation of core debris relocation through the core plate is discussed further in Section 3.5.1, below.
Section 3.5.2 summarizes the metrics considered in this study related to core debris sideward relocation through the shroud and jet pumps. The metrics considered in this regard are intended to aid in assessing how sideward relocation through core shroud and jet pumps would modify the overall accident progression.
An illustration of the different core debris relocation pathways from the core region to the lower plenum is presented in Figure 3-2.
Figure 3-2 Illustration of Possible Core Debris Relocation Pathways into Lower Plenum
3.5.1 Challenge to Core Plate Integrity The melting of control blades and fuel canisters will result in the downward relocation of molten metals. Some of this molten material can flow into the lower plenum before plugging open flow areas through the core plate.
The potential for molten metal relocation through the core plate, and into the lower plenum, was first identified as part of experimental studies conducted at Sandia National Laboratories [14]. These experiments, called XR2-1, were designed to assess how molten debris would flow through the lower core structures in a BWR. They were conducted for scenarios in which no water was present in the core region, such as would be expected following an ADS. Such conditions have been identified as relatively dominant in PRAs, where failure of ADS is a component of a number of dominant sequences.
These experiments identified the potential for molten metals to flow through a BWR core support plate, with relatively limited freezing of the debris. As a result, these experiments indicate that relocation of metallic debris into the lower plenum could occur once control blade and fuel canister structures begin to fail. It is important to note that these structures are susceptible to early melting because of low temperature eutectic interactions between B4C and stainless steel as well as stainless steel and Zr [15].
3-8
The flow of core debris through, combined with the challenge to the integrity of, the core plate is investigated in this study using the following calculated conditions.
• Melt flow through the core plate - The cumulative mass of core debris is a direct measure of the magnitude of melt flow
through the core plate, relative to other lower plenum relocation pathways • Thermal challenge to the integrity of the core plate
- The thermal transient in the core plate results from accumulation of debris on the core plate
- The temperature of the core plate from the onset of core damage provides a direct measure of the extent to which two code simulations represent its thermal loading
• Mechanical challenge to core plate integrity - In addition to the thermal loading of the core plate, relocation of core debris on top of it
results in the transfer of load from the CRD tubes to the plate and support structure - The stress in the plate can result in its yielding - The thermal loading of the plate tends to reduce the yield stress of the core plate - Simple analytical stress relationships are used to evaluate core plate integrity
3.5.2 Sideward relocation through Shroud and Jet Pumps MELCOR does not model the relocation of debris through the shroud and jet pumps. This is a possible failure mode in the MAAP5 model. This modeling difference could become an important source of deviation in the two code simulations.
3.5.3 Core Debris Slumping to Lower Plenum Hold-up on guide tubes is represented in MELCOR simulations. This is not represented in MAAP5. Debris is assumed to relocate directly into the lower plenum before interacting with lower plenum structures.
• Total mass of core debris within core region - A reduction of the total mass of debris within the core region corresponds to the onset of
core slumping to the lower plenum - The potential for slumping to begin can also be inferred from the mass of core debris
resting on the core support plate together with the temperature of the plate - These, however, provide less direct signatures and are not considered in assessing the
overall progression of core damage • Mass of debris in lower plenum
- The total mass of debris in the lower plenum characterizes the extent to which debris slumps out of the core region
- The potential for hold-up of debris in the core region is important for later phases of a severe accident—the heat source in the RPV can contribute to additional fission product revaporization off RPV surfaces as well as prolonged heating of the drywell cylinder and head regions
3-9
• Mass of water in lower plenum - The mass of water in the lower plenum during and after core slumping influences the
time at which lower plenum debris decay heat will begin to be dissipated through the lower head wall
- The availability of water is influenced by the modeling of core melt slumping into the lower plenum (i.e., the extent to which water is flashed during the initial relocation of core debris)
- The time at which a thermal challenge to the lower head wall commences is sensitive to the length of time over which water remains in the lower plenum
• Mass of molten debris in lower plenum - The mass of molten debris in the lower plenum during and after core slumping provides a
signature of the extent to which the time to thermal challenge of the RPV lower head wall can develop
- Simulation differences at this stage indicate that subsequent evolution of RPV lower head wall thermal challenge will be influenced by heat transfer conduction limitations
• Ratio of molten to total mass of debris in lower plenum - This parameter is similar to the total mass of molten debris in the lower plenum - However, it provides a more direct means to assess the correlation between debris
melting and development of a thermal challenge to the lower head wall integrity • Cumulative fraction of core debris that slumps into the lower plenum • Core debris relocation mode into the lower plenum • Criteria triggering relocation of core debris into the lower plenum • Temperature of core debris slumping into the lower plenum • Rate of core debris slumping into the lower plenum • Distribution of debris between molten material and particulate material in the lower plenum
3.5.4 RPV Lower Head Breach The following are used as metrics to compare the two codes with respect to:
• Total mass of debris in lower plenum - The mass of debris in the lower plenum can affect the potential for lower head failure due
to the mechanical load imposed on the vessel wall - The heat flux passing through the lower head wall in contact with core debris is also
influenced by the amount of core debris in the lower plenum (i.e., the total decay heat in the lower plenum is proportional to the mass of slumped core debris)
• Total mass of molten debris in the lower plenum - The through-wall heat flux is influenced by the amount of molten lower plenum debris,
as greater magnitude of decay heat can be rejected through the lower head wall due to internal convection in the molten pool
3-10
• Temperature of lower head wall - The ability of the lower head wall to resist the mechanical load of core debris is
influenced by its temperature - The heat flux from the core debris through the lower head wall will cause it to heatup—
the magnitude of heatup being determined by the magnitude of the heat flux relative to the amount that is dissipated into the containment atmosphere at the outside surface of the lower head wall
- For conditions where the lower head wall is not submerged in water, heat transfer is limited so that higher through-wall temperatures will develop as more heat flux is rejected from core debris into the lower head wall
- The temperature transient in the lower head wall affects the potential for creep of the lower head wall to commence
• The timing of RPV lower head breach • The mode of RPV lower head breach, which includes the various ways in which the lower
head penetrations could result in a failure site of the lower head • The RPV lower head temperature transient • The fraction of core debris that relocates out of the RPV into containment • The temperature of the debris relocating from the RPV into containment
3-11

4 MAAP AND MELCOR SIMULATION RESULTS 4.1 Introduction This section presents a summary of the key results obtained from the MAAP5 and MELCOR simulations. The information presented in this section is not intended to provide an in-depth review of the MAAP5 and MELCOR simulation results for the stylized comparison sequence. Rather, the information presented in this section is intended to illustrate how the two codes represent the overall progression of the accident. This includes information related to:
• Key event timing related to overall in-vessel core melt progression • Thermal hydraulic response of the RPV • Reactor core degradation dynamics • Slumping of core debris to lower plenum • Development of thermal-mechanical challenge to the RPV lower head
This section is organized as follows.
• Section 4.2 summarizes MAAP5 and MELCOR results on key event timing for the stylized severe accident scenario of this study
• Section 4.3 presents how MAAP5 and MELCOR simulate the overall energy balance - i.e., where is the decay and chemical heat generated in the core transported
• Section 4.4 summarizes the key features of reactor core degradation identified in the MAAP5 and MELCOR simulations
• Section 4.5 gives results related to slumping of core debris into the lower plenum and the conditions each code simulate as leading to RPV lower head breach
4.2 Comparison of Key Event Timing Simulation Severe accident event timings form a critical set of parameters derived from severe accident simulations. These parameters are incorporated in numerous downstream uses of severe accident simulations.
Accident management procedures and guidelines, for example, can utilize general timing information to determine the timeliness of different actions. For example, MAAP4 has recently been utilized to determine likely ranges of operation times for RCIC in support of different FLEX strategies [16]. Of interest in these types of simulations are such accident progression characteristics such as when containment conditions reach a state that would impair continued operation of the RCIC system.
Other applications involve the evaluation of likelihoods of different operator interventions crediting in PRAs. Timing information can be a critical input to such evaluations. The time by which particular interventions are required will influence the probability of such an action. The success of such actions pertains to prevention or mitigation of a particular event in a severe
4-1
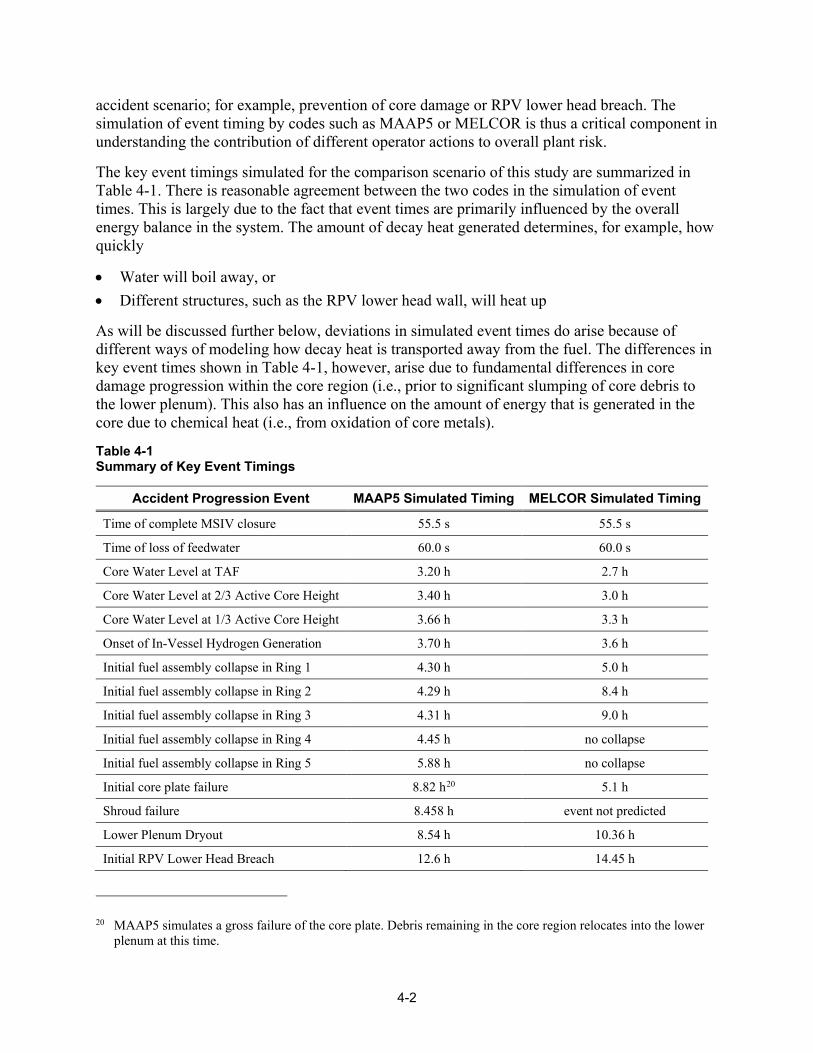
accident scenario; for example, prevention of core damage or RPV lower head breach. The simulation of event timing by codes such as MAAP5 or MELCOR is thus a critical component in understanding the contribution of different operator actions to overall plant risk.
The key event timings simulated for the comparison scenario of this study are summarized in Table 4-1. There is reasonable agreement between the two codes in the simulation of event times. This is largely due to the fact that event times are primarily influenced by the overall energy balance in the system. The amount of decay heat generated determines, for example, how quickly
• Water will boil away, or • Different structures, such as the RPV lower head wall, will heat up
As will be discussed further below, deviations in simulated event times do arise because of different ways of modeling how decay heat is transported away from the fuel. The differences in key event times shown in Table 4-1, however, arise due to fundamental differences in core damage progression within the core region (i.e., prior to significant slumping of core debris to the lower plenum). This also has an influence on the amount of energy that is generated in the core due to chemical heat (i.e., from oxidation of core metals).
Table 4-1 Summary of Key Event Timings
Accident Progression Event MAAP5 Simulated Timing MELCOR Simulated Timing
Time of complete MSIV closure 55.5 s 55.5 s
Time of loss of feedwater 60.0 s 60.0 s
Core Water Level at TAF 3.20 h 2.7 h
Core Water Level at 2/3 Active Core Height 3.40 h 3.0 h
Core Water Level at 1/3 Active Core Height 3.66 h 3.3 h
Onset of In-Vessel Hydrogen Generation 3.70 h 3.6 h
Initial fuel assembly collapse in Ring 1 4.30 h 5.0 h
Initial fuel assembly collapse in Ring 2 4.29 h 8.4 h
Initial fuel assembly collapse in Ring 3 4.31 h 9.0 h
Initial fuel assembly collapse in Ring 4 4.45 h no collapse
Initial fuel assembly collapse in Ring 5 5.88 h no collapse
Initial core plate failure 8.82 h20 5.1 h
Shroud failure 8.458 h event not predicted
Lower Plenum Dryout 8.54 h 10.36 h
Initial RPV Lower Head Breach 12.6 h 14.45 h
20 MAAP5 simulates a gross failure of the core plate. Debris remaining in the core region relocates into the lower plenum at this time.
4-2
4.3 Simulation of Overall Plant Response Appendix A presents how MAAP5 and MELCOR simulate the overall plant response in further detail. The areas considered in this evaluation are
• Overall core energy balance (Appendix A.2) • RPV pressure and temperature transients (Appendix A.3) • Containment pressure and wetwell temperature transients (Appendix A.4)
Simulation of the RPV and containment thermal hydraulic behavior is relevant to assessing criteria that determine the potential for containment impairment to occur. For example, the containment overpressure is a calculated quantity used to assess the potential for a containment to become impaired due to static overpressure.
As presented in further detail in Appendix A, the RPV and containment thermal hydraulic responses are not significantly different between the two codes. Both show similar long-term trends. There are periods, however, when noticeable differences do arise. This is primarily during the period of in-vessel core damage progression (i.e., prior to lower head breach).
The following discussion highlights some of these key differences between the two code calculations. Sections 4.4 and 4.5 present some key conclusions from this study about the how the differences in calculated core damage progression influence the differences noted below in Sections 4.3.1, 4.3.2 and 4.3.3.
4.3.1 Simulation of Overall Core Energy Balance The first indication of distinctly different models for an in-vessel degraded core appears in the overall core energy balance. This section summarizes how the MAAP5 and MELCOR calculated energy balances differ considerably. Further discussion is provided in Appendix A.2.
Figure 4-1 shows the overall core energy balance derived from the MAAP5 and MELCOR simulations performed for this study. The key result in this figure is the greatly different amounts of heat transfer from a degraded core to RPV fluids (i.e., steam and hydrogen) calculated by MAAP5 and MELCOR.
• MELCOR calculates that nearly all of the decay and chemical heat generated within the core material is rejected to gas in the RPV - This is likely due to how MELCOR models the heat transfer surface area from a
degraded core, as discussed further in Appendix B.4.1 and Appendix B.5 - In the MELCOR model, the heat transfer surface area from a degraded core is assumed to
remain high as long as debris is in the form of particulates (see Appendix B.4.1.2) • By contrast, the MAAP5 simulation results shown in Figure 4-1 illustrate how an appreciable
fraction of decay and chemical heat remains in the core materials - Prior to the occurrence of significant core degradation (i.e., before about T+4 hours in the
MAAP5 simulation), almost all the decay heat is rejected to RPV fluids (with some heat being rejected to RPV structures)
- Following the onset of significant core degradation around T+4 hours, a notably smaller fraction of core decay heat is rejected into RPV fluids
4-3
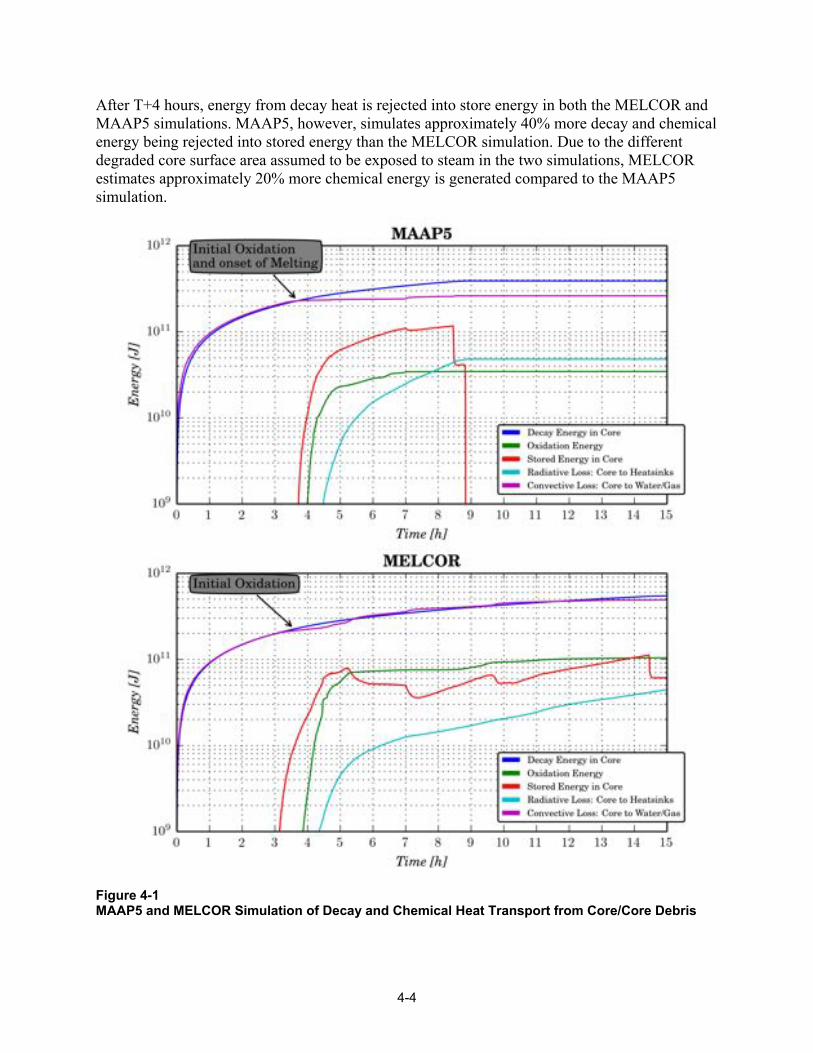
After T+4 hours, energy from decay heat is rejected into store energy in both the MELCOR and MAAP5 simulations. MAAP5, however, simulates approximately 40% more decay and chemical energy being rejected into stored energy than the MELCOR simulation. Due to the different degraded core surface area assumed to be exposed to steam in the two simulations, MELCOR estimates approximately 20% more chemical energy is generated compared to the MAAP5 simulation.
Figure 4-1 MAAP5 and MELCOR Simulation of Decay and Chemical Heat Transport from Core/Core Debris
4-4
The underlying reason for this distinctly different representation of heat transfer away from the core is how the two codes represent degraded core geometries. As discussed further in Appendix B.4.1 and Appendix B.5, the two codes model heat transfer from particulate debris beds in a fundamentally different manner.
• MAAP5 allows molten debris to relocate into open volume in particulate debris beds - This has the effect of reducing the porosity and effective heat transfer surface area in a
particulate debris bed • MELCOR idealizes particulate debris beds as consisting of fixed-diameter particulate spheres
- Molten debris that freezes when it relocates into a particulate debris bed is assumed to increase the volume of these fixed-diameter particulate spheres
- As a result, the heat transfer surface area in a particulate debris bed does not degrade in the same way as represented in the MAAP5 simulation21
4.3.2 Simulation of Overall RPV Thermal Hydraulic Response The bulk RPV response is discussed in further detail in Appendix A.3. The RPV pressure, steam dome temperature and water level transients are discussed in Appendices A.3.1, A.3.2 and A.3.3, respectively.
The simulated RPV pressures are overall quite comparable.
• Both simulations exhibit a similar decrease in RPV pressure during the first hour of the event when the Isolation Condenser operated (see Table 2-2 for the Isolation Condenser operation simulated)
• After the first hour of the event, the RPV pressure is controlled at the SRV cycling setpoint • Both simulations identify a period of reduced SRV cycling around T+4 hours when the in-
shroud water level drops below BAF and the rate of steaming from the core decreases - This corresponds to a decrease in the amount of energy being rejected to RPV fluids at
this time for both simulations • A similar depressurization of the RPV is simulated at T+7 hours when a single SRV is
assumed to seize open22 • Repressurization of the RPV is only found subsequently for brief periods of time that
correspond to relocation of fuel debris from the core-region into the lower plenum
21 This MELCOR modeling abstraction is intended to capture inhomogeneity around a core radial ring. In MAAP5 and MELCOR simulations, this inhomogeneity is not captured directly because the average fuel properties are represented in the nodalized core. The MELCOR modeling assumes that this inhomogeneity results in flow pathways remaining open through the core. 22 As identified in the TMI-2 event, failure of in-core instrument penetrations can occur following the onset of core degradation. Melting of these penetrations can occur at the top of the core due to high core temperatures. Failure of these penetrations is another means by which RPV depressurization could occur following the onset of core damage. The TMI-2 event highlights the importance and likelihood of this mode of initial breach of the RPV pressure boundary [17].
4-5
The following features represent notable differences between the simulated RPV pressures. These differences are noted in Appendix A.3.1 and can also be found in Figure A-2.
• Following onset of significant core degradation, MAAP5 exhibits a more pronounced reduction in SRV cycling - This reflects the significant change in where core decay heat is rejected as shown in
Figure 4-1 o In the MAAP5 simulation, after T+4 hours, core decay heat is primarily being
rejected into stored energy of the core materials (i.e., melting of core debris) o By contrast, in the MELCOR simulation, there is a short period between T+4 hours
and T+4.2 hours, when not all core decay heat is rejected to RPV gases - Beyond T+4.2 hours, renewed SRV cycling occurs in the MELCOR simulation
o This reflects not only rejection of decay into RPV gases, but also significant oxidation of core metals with the associated generation of large amounts of hydrogen and chemical energy
o By contrast, less numerous SRV cycles are required in the MAAP5 simulation to maintain the RPV pressure from exceeding the SRV cycling setpoint
o The differences in SRV mass flow can be seen, for example, in Figure D-8 of Appendix D, which provides the cumulative SRV mass flow
o Simulation of different in-core hydrogen generation magnitudes is summarized in Section 4.4 and discussed in more detail in Appendix D (see, for example, Figure D-3 and Figure D-4)
• Repressurization of the RPV after the SRV is assumed to seize open (at T+7 hours) is different between the two codes because of distinct core slumping - This occurs between about T+8 hours and T+10 hours in the MELCOR simulation
o This reflects the more incoherent slumping of core debris from the third and fourth radial rings into the lower plenum
- This occurs at about T+10 hours in the MAAP5 simulation and gives rise to about a 30 minute period RPV repressurization o This corresponds to almost the entire core relocating into the lower plenum upon core
plate failure at T+10 hours23 - The RPV steam dome temperature simulated by both codes is relatively similar, below
about 600 K, until about T+3 hours The differences identified in the simulated RPV pressure transients are also reflected in other characteristics of the RPV thermal hydraulic state. The following deviations are observed for the RPV steam dome temperature and water level transients.
• RPV steam dome temperature (see Appendix A.3.1 and Figure A-3)
23 Enhancements to modeling of the core plate failure model in MAAP5.03 result in somewhat more incoherent relocation of core debris into the lower plenum. Core plate failure in MAAP5.03 can occur at individual radial rings. In MAAP5.02, failure of the entire core plate is represented instead.
4-6

- Prior to about T+3 hours, similar RPV steam dome temperatures are simulated by the two codes, with the following exceptions o MELCOR exhibits an earlier heatup of the RPV steam dome due to water level
reaching TAF approximately 15 minutes earlier than in the MAAP5 simulation o The increase in RPV steam dome temperature begins after T+3 hours in the
MELCOR simulation and after T+3.25 hours in the MAAP5 simulation - Despite the different times at which RPV steam dome temperatures first start to increase
in the two simulations, they both increase to about 700 K during the boil-off period o The MELCOR simulated RPV steam dome temperature reaches 700 K by about
T+4 hours o The MAAP5 simulated RPV steam dome temperature reaches 680 K by about
T+4.2 hours - Once significant core degradation and hydrogen generation starts in the two simulations
(after T+4 hours), more significant deviation of RPV steam dome temperature is found o At T+4.5 hours, MELCOR simulations a rapid rise in the steam dome temperature to
about 1100 K, which corresponds to a very rapid increase in hydrogen generation (see Appendix D and, for example, Figure D-3)
o In the MAAP5 simulation, the steam dome temperature never exceeds 1000 K, with the maximum temperature reached at the time of core slumping to the lower plenum
- The MELCOR simulation thus indicates a potential for either MSL creep rupture or thermal seizure of an SRV, as first discussed in the Peach Bottom SOARCA study [9] o The very high temperatures identified in the MELCOR simulation reflect the
continued rejection of decay and chemical energy to RPV gases (see Figure 4-1) o In the MELCOR model, this is due to steam flowing through the core and not natural
circulation flows between the core region and RPV steam dome24 - The MAAP5 simulation does not indicate a potential for either MSL creep rupture or
thermal seizure of an SRV o As shown in Figure 4-1, the onset of core degradation causes an appreciable reduction
in heat transfer to RPV gases and thus less rejection of decay and chemical energy to the RPV steam dome
• RPV water level (see Appendix A.3.2 and Figure A-4) - The RPV water level begins to decline just after T+1 hour in both simulations (see
Appendix A.3.2) - The MELCOR simulation of the RPV water level decrease exhibits a more rapid
approach to TAF than the MAAP5 simulation (see Appendix A.3.2)25 o This is the result of slightly different initial in-core water masses
24 It should be noted that steam flows through the core are established by two events in these MELCOR simulations: SRV opening and hot debris relocation into lower plenum water. 25 The different RPV water level transients during this period are attributed to the lower initial core-region mass of water in the MELCOR simulation.
4-7
- The principal different in RPV water level simulation, however, occurs after about T+3.5 hours o MELCOR simulates a continued reduction in the downcomer water level after it
reaches the top of the jet pumps o MAAP5 simulates an essentially constant downcomer water level from the time that
it reaches the top of the jet pumps until about T+6 hours26 o Heat transfer from high temperature debris to RPV gases in the MELCOR simulation
maintains through-shroud wall heat flux and continued depletion of downcomer water o By contrast, in the MAAP5 simulation, it is necessary for high temperature debris to
migrate radially to enhance through-shroud wall heat transfer The behavior of RPV steam dome temperature and water level thus reflects the key difference between MAAP5 and MELCOR simulation of degraded cores. As discussed further in Appendix B.4.1
• The MELCOR representation of heat transfer surface area in a particulate debris bed facilitates continued heat rejection to RPV gases
• By contrast, the MAAP5 modeling of a degraded core allows molten debris to “fill-in” void in a particulate debris bed, decreasing the available heat transfer surface area
4.3.3 Simulation of Overall Containment Response The containment response is discussed in further detail in Appendix A.4. The drywell and wetwell pressures are discussed in Appendix A.4.1. The wetwell water and gas space temperature transients are discussed in Appendix A.4.2.
The following are key features for this simulated accident transient.
• Both codes simulate similar drywell pressurization transients prior to the onset of core damage around T+3 hours
• Beyond about T+3.5 hours, the simulated drywell pressurization transients begin to diverge - MELCOR simulates greater pressurization of containment following the onset of
significant hydrogen generation than MAAP5 - This is attributable to the larger mass of hydrogen generated during core melt progression
in the MELCOR simulation o The additional 400 kg of hydrogen generated in the MELCOR simulation (see
Section 4.4 and Appendix D) is the primary cause27 - The MELCOR simulation exhibits an approximately 10 K higher temperature in the
suppression pool following the onset of core damage relative to MAAP5
26 This is consistent with the time that peripheral high temperature debris formation enhances through-shroud wall heat transfer. This is discussed further in Appendix B.7.
27 Based on the ideal gas law, displacement of 100 kg of hydrogen into the drywell will increase containment pressure by about 30 kPa. An additional, 400 kg of hydrogen displaced into the containment gas space results in 120 kPa added pressure. This accounts for the approximately 100 kPa difference in pressure between the MAAP5 and MELCOR simulations.
4-8

o The additional energy dissipated from the core debris, reflected in the enhanced RPV steam dome temperature, is the primary cause of this difference
o The higher suppression pool temperature is a secondary factor driving the higher drywell pressure observed in the MELCOR simulation
• The final pressures in the containment, at T+15 hours, are similar (see Figure A-8) - Both MAAP5 and MELCOR simulate the pressure at this time to be about 400 kPa(a) - This is due to the earlier relocation of core debris into containment in the MAAP5
simulation o Table 4-1 indicates that the RPV lower head breach occurs about 1.5 hours earlier in
the MAAP5 simulation - The additional hydrogen generated in the MAAP5 simulation following RPV lower head
breach accounts for the similar pressurization of containment o Ex-vessel core melt progression is beyond the scope of this report and will be studied
as part of a second phase o It is important, however, to note that previous studies have found MAAP5 and
MELCOR simulate similar cumulative hydrogen generation for events progressing to RPV lower head breach [6, 7]
o This point reinforces how in-vessel core melt progression represents a principal point of divergence in the two computer code models
4.4 Simulation of Core Degradation Appendix B provides a detailed description of the MAAP5 and MELCOR simulation results for reactor core degradation, prior to core slumping. These results should be considered generic and representative of the type of core degradation simulated by the two codes for unmitigated severe accident scenarios. Similar core melt progression is seen in other studies [6, 7, 9].
4.4.1 Early Phase of Core Degradation The early phase of core degradation, prior to significant amounts of debris formation and relocation, are similar between the two codes.
• The heatup of the Zircaloy fuel cladding and canister material results in onset of the Zr-steam exothermic oxidation reaction (Appendix D.3 and Figure D-3)
• In both simulations, the onset of this reaction corresponds to the fuel cladding and canister material exceeding a temperature of 1200 K (Appendix D.2.1, Appendix D.3)
• The rate of hydrogen generation is reasonably similar between the two simulations (Appendix D.3 and Figure D-3)
• Both codes represent the failure of control blades based on the same eutectic interaction temperature (1500 K) - Appendix B.6.1 and Figure B-24 identify the reasonably good agreement for prediction
of control blade failure due to eutectic interaction just after T+4 hours
4-9
4.4.2 Loss of Core Geometry The agreement between the two code simulations identified above is not found once conditions for loss of core geometry are achieved; i.e., once core materials begin relocating out of their original geometry.
In this MAAP5 simulation, the melting of core debris in the central region of the core results in a downward flow of molten debris. As it freezes on colder surfaces of the core at these lower elevations, debris begins to accumulate in the initially open flow channel. With sufficient melting of debris, these open areas in the lower region of the reactor will become filled-in (i.e., blocked to continued upward flow) in the MAAP5 simulation. Axial flow of steam becomes degraded, as discussed further in Appendix B.5.2 (see also Figure B-18).
The accumulation of core debris in initially open core flow channels also occurs due to the collapse of overheated fuel assemblies. The MAAP5 simulation also incorporates models that treat the “collapse” of fuel assemblies due to exposure to high temperature conditions for a prolonged time. This is usually termed a “time-at-temperature” failure of fuel assemblies. Fuel assembly collapse results in the formation of particulate debris beds, with particles assumed to have the size of fuel pins.
Interaction between steam and hot Zircaloy is thus limited in the MAAP5 simulations due to formation of flow blockages.
• The MAAP5 simulations show that the open flow area in the reactor core decreases to below about 10%28
• The formation of molten debris in the central region of the core results in progressive relocation of molten debris sideward
• The blockage of the reactor core proceeds from the center to the periphery of the core; i.e., from the region with the highest powered fuel assemblies to the region with the lowest powered fuel assemblies
• This occurs through spreading of molten debris as side crusts fail and enhanced sideward heat fluxes melt neighboring fuel assemblies/debris
By contrast, the amount of flow area that remains open in a flow channel does not decrease as significantly in the MELCOR simulations. The results presented in Appendix B.5.2 (Figure B-18) indicate that the fraction of open flow area remains above about 60% of the initial open flow area through a ring in the nodalized reactor core. Thus, the available area for steam and noncondensable gases to continue to flow upward through the reactor is dramatically different in the MELCOR simulation when compared with the MAAP5 simulation.
As discussed in Appendix D.3, this has the consequence of promoting much more significant in-vessel hydrogen generation in the MELCOR simulation, relative to the MAAP5 simulation. About 400 kg of additional hydrogen are generated in the MELCOR simulation. Importantly,
28 At this open flow area fraction, the MAAP5 simulation assumes that a flow channel is “blocked” to continued upward flow.
4-10

MELCOR simulates continued hydrogen generation from the peripheral fuel assemblies, beyond the time at which MAAP predicts steam flow through these fuel assemblies has become blocked.
Thus, the different manner in which blockages in the reactor core are treated in the two codes drives fundamentally different simulation of core oxidation. The generation of hydrogen is consistent and comparable between the two codes prior to appreciable disruption of the initial core geometry. Appendix B.5.2 provides further discussion of this point, which highlights the different treatment of flow through particulate debris beds as a key point of modeling divergence between the two codes.
In the MELCOR simulation, the candling of debris can result in accumulation of debris into initially open flow channels. Following the collapse of fuel assemblies, however, MELCOR represents the resulting debris bed geometry as a largely particulate debris bed. This debris bed is assumed to have flow geometry similar to a bed of spherical particles having a diameter of 1 cm in the core regions at and above the lower core plate, and a diameter of 2 mm in the core regions below the lower core plate. The associated heat transfer surface area for this type of debris bed is proportional to the volume of particulate debris.
By contrast, the particulate debris bed that forms in the MAAP5 simulation is assumed to have flow and heat transfer surface areas that decrease with increasing particulate mass. That is, the accumulation of more debris in the particulate debris bed is assumed to occupy only open volume. As a result, the open volume of the particulate debris bed decreases with increasing amounts of debris. Furthermore, the available heat transfer surface area also decreases with the decrease in open flow area in the debris bed.
This key modeling difference between the two computer codes has the following effects.
• MELCOR simulations assume that the heat transfer surface area tends to increase with the volume of debris forming a particulate debris bed - A greater amount of gas thus flows through particulate debris, facilitating a much larger
rejection of heat from the core debris to the gas in the RPV - This allows for continued interaction of steam with overheated core metals, which drives
significant in-vessel hydrogen generation (in excess of 800 kg of hydrogen) • The degradation of heat transfer surface area in the MAAP5 simulation results in less gas
flowing through the debris - A significant reduction in the amount of core heat rejected to gas in the RPV is simulated - As a result, significant impedance of continued hydrogen generation occurs in the
MAAP5 simulation once core debris begins to form
4-11

These key differences in the treatment of flow through degraded core are illustrated in Figure 4-2.
MAAP5 MELCOR
Figure 4-2 Illustration of Different Flow Geometries through a Degraded Reactor Core
4.5 Simulation of RPV Lower Head Breach Appendix C presents a detailed discussion of the behavior of core debris in the lower plenum, including the conditions simulated in both codes leading to RPV lower head breach. The following reflect the key results identified from this study.
It is important to note, however, that these results do not entirely reflect model differences associated with different lower plenum physical processes. The differences in the nature of the degraded core inside the core-region dominate the differences in lower plenum debris modeling. Further investigation is needed to fully resolve the lower plenum differences.
The results presented below are provided for completeness.
4.5.1 Debris Relocation to Lower Plenum Appendix C.3.1 provides a number of simulation results that provide insights into how the two codes simulate debris slumping into the lower plenum. The divergence between the two codes early in the event is relatively minor, until core melting commences. This is discussed above in Section 4.4. The significant differences that arise in core degradation within the core region result in gross differences between the two simulations of core debris slumping.
The following represent key areas of difference between the two simulations regarding the simulation of core debris slumping to the lower plenum. This discussion is based on details provided in Appendix C.3.1.
MAAP5 simulates very rapid relocation of debris into the lower plenum. Over an approximately half hour period, starting at T+8.5 hours, MAAP5 simulates all core debris relocating out of the
4-12
core region and into the lower plenum (see, for example, Figure C-5). This is influenced by the following factors.
• MAAP5 simulates the holdup of a large fraction of core debris above the core plate before initial shroud, and subsequent core plate, failure - Approximately 80% of the initial core mass is debris in the MAAP5 simulation (see, for
example, Figure C-5) - Fuel assemblies fail in all radial rings in the MAAP5 simulation, even the most peripheral
(see, for example, Table 4-1) o The time of latest fuel assembly collapse is at T+5.88 hours and corresponds to the
most peripheral ring of fuel assemblies (ring 5) - Prior to initial shroud failure, no debris is identified as relocating into the lower plenum
in this MAAP5 simulation29 • Core plate failure in this version of MAAP5 is assumed to result in a large opening that
affects debris in all radial rings30 - The initial failure area grows rapidly due to the flow through it of molten core debris (at
temperatures in excess of 2500 K, as shown in Appendix B.6.3, for example) - A proportion of 50% of the core debris relocating through the failed core plate is molten,
which results in a rapid increase in the assumed initial area of the core plate failure By contrast, MELCOR simulates a relatively gradual relocation of core debris. Unlike the MAAP5 simulation, significantly smaller amounts of core debris are held-up inside the core region. The debris that remains in the core region is also at a much lower temperature, with much of the debris being in the form of solid particulates. The MELCOR simulation of debris slumping to the lower plenum has the following features.
• The initial relocation of debris is primarily in the form of a small amount of molten core metals - Approximately 3% of the initial total core mass relocates initially (see Figure C-5) - This relocation event occurs just after T+4 hours, approximately 30 minutes after the
onset of core oxidation, corresponding to the time at which control blades start failing (see, for example, Figure B-25)
29 Enhancements to MAAP5 after version 5.02 calculate the extent of early molten debris slumping into the lower plenum through open flow paths in the core plate. The holdup of debris above the core plate is not appreciably altered by these enhancements to the code. Thus, these results should be considered reasonably reflective of how MAAP5 in general models slumping of core debris to the lower plenum.
30 Enhancements to MAAP5, after version 5.02, can estimate a more gradual failure of the plate. This calculation assumes that different core plate rings can fail at different times by treating the thermal-mechanical loading of each ring individually. This refined calculation can lead to a reduction in the rate of core debris slumping, with slumping occurring over a longer time than the 30 minute timeframe indicated by the MAAP5 simulation in this study. The dramatically different masses of held-up core debris, however, can still lead to significantly larger rates of core debris slumping in later versions of MAAP5 when compared to the MELCOR results presented in this study.
4-13
• Additional debris relocates into the lower plenum upon initial core plate failure at T+5.1 hours - Approximately 3% of the initial core mass relocates at this time - The relocating debris is a roughly equal mix of particulate and molten debris, as shown in
Figure C-5 and Figure C-6 • The initial core plate failure allows debris formed in the core region after to gradually
relocate into the lower plenum over a 3 hour period - The majority of this relocation, involving approximately 6% of the initial core mass,
occurs prior to T+6 hours • Additional slumping of core debris into the lower plenum occurs in a number of discrete
jumps after T+8 hours, until the time of RPV lower head failure at T+14.45 hours - These events correspond to periods of enhanced core oxidation, primarily affecting the
peripheral fuel assemblies (see, for example, Appendix D.3 and Figure D-4) • In addition to distinctly different holdup of core debris, MELCOR also simulates appreciably
less core material forming debris than MAAP5 - In the MELCOR simulation, approximately 50% of the initial core mass remains intact
by the time of RPV lower head breach (see, for example, Figure C-5) - As noted in Table 4-1, fuel assembly collapse in rings 2 and 3 only occurs at T+8.4 hours
and T+9 hours, respectively31 In addition to the debris relocation transients summarized above, the consequences of debris relocation are not comparable between the MAAP5 and MELCOR simulations. In particular, the thermal challenge to the RPV lower head wall due to relocation of hot (potentially molten) debris into the lower plenum is quite distinct in these two simulations.
Appendix C.3.2 discusses the thermal response of the RPV lower head wall in more detail, specifically Figure C-9. The relevant features identified in Appendix C.3.2 are as follows.
• For the MAAP5 simulation, the initiation of core debris slumping into the lower plenum results in a notable temperature excursion in the lower head wall - Between T+8.4 hours and T+9.0 hours, the interior temperature of the three central lower
head nodes increases from about 400 K to between 1000 K and 1100 K • In the MELCOR simulation, by contrast, only very modest increases in interior lower head
wall temperature are correlated with debris slumping events - Interior lower head wall temperature excursions occur initially with relocation of failed
control blades after T+4 hours - The second period of interior lower head wall temperature excursion occurs following
initial core plate failure at T+5.1 hours - Slumping of core debris after T+8.4 hours and T+9 hours correlates with collapse of fuel
assemblies in rings 2 and 3
31 Fuel assemblies in rings 4 and 5 do not collapse in this MELCOR simulation, which is run until T+15 hours.
4-14
- These periods of debris slumping-induced interior lower head wall temperature excursions are moderate, corresponding to an increase in temperature of around 100 K
The MELCOR simulation exhibits less potential for the lower head wall (and penetrations) to be challenged by a debris slumping-induced thermal transient. As noted above, the relatively low rate of debris slumping and low debris temperature in the MELCOR simulation contribute to this distinct estimation of early challenge to lower head wall integrity. This is due to the following factors.
• Different rates of debris formation in the core region - MELCOR simulates a relatively low rate of debris formation in the core region
o Fuel assemblies degrade at a rate determined primarily by their decay heat level o Formation of debris in the central region of the core does not enhance the potential
for debris to form in more peripheral regions of the core - MAAP5 simulates much more significant holdup of high temperature debris inside the
core region o Central region fuel assembly degradation results in formation of molten pools, which
enhance heatup of neighboring peripheral assemblies (see, for example, Appendix B.5.2)
o Failure of even the most peripheral fuel assemblies occurs in the MAAP5 simulation about 1.5 hours after first fuel assembly collapse (see Table 4-1)
As noted in Appendix C.2.1.1, these differences can be enhanced further due to the different models for slumping of debris into the lower plenum. This is discussed further in Section 5.5.1.
4.5.2 Lower Plenum Debris Dynamics Formation of high temperature molten debris in the lower plenum is a key difference between the MAAP5 and MELCOR simulations of Fukushima Daiichi Unit 1 [8]. The different lower plenum debris thermodynamic states simulated by the two codes are not due entirely to lower plenum transport processes. As noted in Section 4.4 and Section 4.5.1, the MAAP5 and MELCOR simulations diverge considerably before debris accumulates in the lower plenum.
The type of debris and how it enters the lower plenum are dramatically different between the two codes. These affect the mass and energy transport processes in the lower plenum. It is thus not possible to use the results of typical MAAP5 and MELCOR accident simulations, such as performed for this study, to directly compare lower plenum debris modeling in the two codes.
The results developed for this phase of the study are thus not intended to provide a complete assessment of lower plenum debris modeling in MAAP5 and MELCOR. They can, however, identify aspects of models in the two codes that contribute to simulation differences first observed in MAAP5 and MELCOR Fukushima Daiichi Unit 1 assessments [8].
A complete study of lower plenum debris dynamics and thermal-mechanical challenge to the RPV lower head require alignment of the amount of heat transfer through the lower head wall into containment. Since both codes have different models of containment thermal hydraulics, alignment of this type of boundary condition between the two codes is not readily performed in an integral simulation. Section 5.6.1 describes how comparison of MAAP5 and MELCOR lower plenum debris modeling can be performed in a subsequent phase of this study.
4-15
The following discussion summarizes key differences in lower plenum debris behavior identified between the two code simulations presented in this study.
• Total debris mass in the lower plenum (see Figure C-5) - As noted in Section 4.5.1, MAAP5 relocates all the material originally in the core region
into the lower plenum in an approximately 30 minute period - The MELCOR simulation identifies the build-up of debris in the lower plenum over an
approximately 10-hour period from the time of initial control blade failure o By the time of RPV lower head breach, the debris mass in the lower plenum reaches
approximately 66% of the initial core mass - This difference between the two codes is due to the different
o Representations of core degradation above the core plate o Core plate failure
• Distribution of debris between solid particulates and molten pools (see Figure C-6 and Figure C-7) - MAAP5 identifies the following distribution of debris between different components of
the lower plenum debris bed o The mass of debris in the oxidic molten pool increases from about 25% to 66% of the
initial core mass (from initial slumping to the time of RPV lower head breach) o The mass of solid particulate debris is approximately 10% of the initial core mass for
about 3 hours after initial core slump before the particulate melt into the oxidic pool o The light metallic layer overlying the oxidic pool is about 35% of the initial core mass
- MELCOR calculates a negligible mass of debris in the lower plenum as being in either a metallic or oxidic pool o The vast majority of lower plenum debris remains as particulate until the time of RPV
lower head breach • Temperature of debris in the lower plenum (see Figure C-8)
- MAAP5 simulates notably higher debris temperatures because of the presence of molten oxides o The oxidic molten pool temperature is around 2600 K to 2700 K until the time of
RPV lower head breach o The light metallic layer temperature varies between about 1500 K and 1700 K until
the time of RPV lower head breach - MELCOR simulates debris temperatures that vary between about 1000 K and 2100 K
o Molten debris does form in the lower plenum, primarily associated with relocation of debris from the core region (see Figure C-8)
o The transfer of energy from molten debris to particulate debris is the primary mechanism by which particulate debris temperatures increase
o Particulate debris temperature increases however, are reduced in periods without debris slumping to the lower plenum until dryout of the lower plenum
Following lower plenum dryout, decay heat rejection to the debris results in particulate debris temperatures increasing to 2100 K, until RPV lower head breach occurs
4-16
5 CODE-TO-CODE COMPARISON CONCLUSIONS 5.1 Introduction This study has identified a number of areas in which MAAP5 and MELCOR have implemented different models of core degradation phenomena inside the RPV. These modeling differences reflect uncertainty that persists in the understanding of severe accident phenomena due to difficulties in devising experiments representative of reactor scale.
This section is organized as follows:
• Section 5.2 presents conclusions related to the implications to the representation of core oxidation onset that can be derived from this MAAP5-MELCOR comparative study
• Section 5.3 presents the implications of this study with respect to modeling of initial core melting
• Section 5.4 presents the study conclusions regarding core melt progression prior to debris slumping to the lower plenum
• Section 5.5 presents the implications of modeling differences between MAAP5 and MELCOR in the treatment of debris slumping to the lower plenum
• Section 5.6 presents conclusions regarding - Modeling differences and implications for the treatment of debris in the lower plenum - Implications of modeling lower plenum debris modeling differences on development of
the RPV lower head wall integrity challenge
5.2 Onset of Core Oxidation 5.2.1 Key Modeling Differences While the thermal hydraulic modeling implemented in the two codes is different, the unmitigated scenario considered in this study does not require detailed thermal hydraulic modeling. Prior to the onset of core damage, the transient involves the boil-off of water.
The early operation of feedwater and the Isolation Condenser do not induce rapid changes in the thermal hydraulic state of the RPV. The associated transients primarily affect the overall mass and energy balance in the RPV. Thus, detailed evaluation of both forced and natural circulation patterns within the RPV and core region are not essential to capturing the effects of feedwater and Isolation Condenser operation.
For the type of scenario considered in this study, modeling differences up to the point of onset of core oxidation are not relevant. Both computer codes are designed to represent the overall mass and energy balance in the RPV for this transient.
The primary issue is how the two codes allocate RPV water inventory to different regions. The MELCOR model results in an initial inventory of water that is smaller than that required by two-phase RPV water volume tables for Fukushima Daiichi Unit 1.
5-1

5.2.2 Impact of Modeling Differences on Simulation Results Both simulations of the comparative scenario used in this study represent the onset of core oxidation reasonably well. As noted above, this is due to the fact that both simulations capture the overall RPV mass and energy balances prior to the onset of core damage.
A study using alternate scenarios, that involve more rapid thermal hydraulic and reactivity transients leading to core damage, could identify differences between the two computer codes. However, for such scenarios, both computer codes would simulation relatively rapid progression to core damage. Simulated timings would be too rapid to alter key insights derived from these computer code results.
The dominant contributors to radiological release in PRAs involve relatively slow progression to core damage. These accident sequences are typically characterized by a loss of heat sink for decay heat removal. For these scenarios, the heat up of the fuel is determined by decay heating. This is similar to the comparative scenario used in this study. Thus, the results of this study indicate that across the range of severe accident sequences of risk significance, both MAAP5 and MELCOR provide consistent results for the time that
• RPV water inventory reaches TAF (see Table 4-1 and Appendix A.3.2) • RPV water inventory reaches the middle of the active fuel region (see Table 4-1 and
Appendix A.3.2) • RPV water inventory reaches about one-third of the height of the active fuel region (see
Table 4-1 and Appendix A.3.2) • Fuel cladding heats up to above 1200 K and hydrogen generation starts (see Table 4-1 and
Appendix A.3.2)
As a result the onset of core oxidation is expected to be comparably simulated by MAAP5 and MELCOR across a range of risk significant severe accident scenarios. Users of this insight, however, should ensure that the scenario being simulated has a relatively slow heat up of fuel assemblies due to decay heating.
5.3 Initial Core Melting This topic is discussed in more detail in Appendix B.4.1, Appendix B.5.1 and Appendix D.3.
The progression to core melting leads to the disruption of the initial core geometry. In the absence of any Zircaloy oxidation, core materials will slowly heat up to the point of liquefaction due to decay heating. However, once the temperature of Zircaloy in the core exceeds 1200 K, a significant amount of chemical heat will be generated. The amount of chemical heat generated can be as much as ten times the magnitude of the decay heat.
Since this exothermic reaction occurs over a very short time period, this will tend to result in a rapid heat up of the core. Rapid liquefaction of core material can thus occur following the onset of core oxidation. The onset of core melting is thus governed by the rate at which chemical heat is generated.
It should be noted that core melting begins with the core components having the lowest melting temperatures, which are stainless steel and Inconel. In MAAP, this is a threshold that causes
5-2
failure of the in-core instrumentation and initiates flow of hydrogen and steam, as well as fission products, into the containment. This flow also has ramifications on the gas transport from the core to the upper plenum.
5.3.1 Key Modeling Differences The modeling of the initial phase of core degradation is discussed in more detail in Appendix B.4.1.
MAAP5 does not explicitly consider the radial relocation of particulate or molten material during this early phase of core degradation. It is assumed that downward motion of core debris is the primary mode of relocation. Thus, debris tends to accumulate in radial rings first, eventually causing a blockage to occur at an axial level in the ring. This can result in core nodes becoming blocked above the level of the core support plate.
MELCOR also assumes that debris relocates downward predominately as long as fuel canisters have not failed. Once fuel canisters have failed, debris is assumed to relocate radially. This is intended to balance hydrostatic forces by achieving a constant debris level in the core. The result of this is the distribution of debris from central radial rings (higher temperature and likely the first to collapse) across the lowest axial levels of the core to achieve a constant debris level. In this manner, the formation of debris is less likely to lead to a radial ring becoming blocked at a higher axial elevation—the debris is more likely to spread out across the core plate, over a larger volume. This reduces the amount by which any radial ring core node has its free volume reduced.
5.3.2 Impact of Modeling Differences on Simulation Results As discussed in Appendix D.3, both MAAP5 and MELCOR simulations have a consistent rate of hydrogen generation during this period of the accident simulation. Prior to appreciable change in the core geometry from its initial rod-like configuration, the two codes simulate essentially the same hydrogen generation transient.
Differences in early phase relocation of core materials outside their initial geometry do not have a significant impact on quantities such as hydrogen generation. It is only once sufficient core degradation occurs to promote the formation of debris blockages inside the core region in a MAAP5 simulation that deviations between the two codes become significant. This is discussed further below.
5.4 Progression of Core Melting inside Core Region This topic is discussed in more detail in Appendix B.3, Appendix B.4 and Appendix B.5.2, which present how the two codes model core structure failure, core debris transport/relocation and associated simulation results. The in-vessel hydrogen generation transient is discussed further in Appendix D.3.
This stage of the in-vessel core melt progression is characterized by the formation and relocation of core debris. This debris accumulates in the originally open flow channels of the core and the rod-like core geometry is lost.
5.4.1 Key Modeling Differences The physics modeled at this stage is relatively similar between the two codes. Both represent
5-3
• Melting of core debris • Downward relocation of molten debris along still solid surfaces of the core • Re-freezing of the molten debris • Collapse of fuel assemblies due to prolonged periods of oxidation and exposure to high
temperatures - When fuel assemblies collapse, both codes assume that they form a debris bed of solid
particulates Both simulations represent the formation of molten material due to eutectic interactions. The MELCOR simulation captures these interactions through adjustments in melting temperatures. This is done by adjustment of user inputs.32 The MAAP5 simulation utilizes the internal eutectic interaction model implemented in the code. Slight differences can arise as a result of these different ways of modeling eutectic interactions.
In addition to the melting transient, the two simulations represent the collapse of oxidized fuel assemblies exposed to a prolonged period of high temperature in different ways. Both simulations employ a time-at-temperature model; i.e., fuel assemblies are assumed to collapse when they have been exposed to a temperature for a fixed amount of time. The period of time required to collapse a fuel assembly decreases with increasing temperature.
MAAP5 implements a Larson-Miller type of model, similar to creep failure of a load-bearing structure. MELCOR implements a similar type of model; however, the time-at-temperature failure curve is provided through a user input. This model is significantly different from that implemented in the MAAP5 computer code. Its implementation in the Fukushima Daiichi Unit 1 MELCOR model, consistent with current MELCOR best practices, leads to an earlier collapse of fuel assemblies.
The user-defined model implemented in the MELCOR simulation for this study is described further in Appendix B.3. It is also further compared to the MAAP5 model for time-at-temperature collapse of fuel assemblies.
The deviations in collapse behavior are relevant. The MAAP5 and MELCOR codes are different in how particulate debris beds are modeled. Representation of particulate debris bed heat transfer surface area is a key difference between the two computer code models. This is discussed further in Appendix B.4.
• For rod-like geometries, the two codes employ similar flow and heat transfer models
32 It should be noted that this approach prevents complete representation of all eutectic interactions. In particular, the eutectic interaction between stainless steel and Zr cannot be captured in this manner. This eutectic interaction is one way by which early failure of fuel canisters occurs in a BWR. The early liquefaction of control blades (by the eutectic interaction between B4C and stainless steel) can bring high temperature stainless steel into contact with fuel canister material. MELCOR, however, applies the user input Zr melting temperature to all material structures in the core, including fuel cladding. Adjustment of the melting point of Zr to capture the formation of molten stainless steel-Zr eutectics cannot be done without resulting in unphysical modifications to overall core melt progression. MELCOR thus simulations a higher temperature and delayed degradation of fuel canisters when compared with MAAP5. This is discussed further in Appendix B.6.2.
5-4

- In both codes, the freezing of debris in open flow channels on solid core structure surfaces results in a reduction in the heat transfer surface area to volume ratio for fuel rods
• Particulate debris bed geometries, however, are treated in significantly different manners - In MAAP5, particulate debris beds have lower heat transfer surface areas than the rod-
like core geometry o The heat transfer surface area decreases as a greater amount of core debris volume
fills in a particulate debris bed (i.e., there is less empty volume for gases to pass through and exchange energy with core debris particles)
- In MELCOR, particulate debris beds are represented in terms of particles with fixed diameter so that the heat transfer surface area tends to be enhanced relative to a rod-like geometry o MELCOR never completely blocks flow through the particulate core node - though it
does decrease with decreasing porosity o MELCOR also models the effective heat transfer surface area as increasing with the
total particulate volume33 The representation of heat transfer from particulate debris to RPV fluids is the most significant difference between MAAP5 and MELCOR modeling abstractions. Both codes have been validated against numerous separate effect experiments related to core melt progression. MAAP5 code validation is summarized in Volume 3 of the MAAP5 computer code manual [18]. MELCOR code validation is summarized in [19].
5.4.2 Impact of Modeling Differences on Simulation Results The modeling of core melt progression within the core region is represented in significantly different ways by MAAP5 and MELCOR. The following are key differences identified in the simulations, with further details provided in Appendix B.5.2.
• In MAAP5 simulations, - With decreasing debris bed porosity, the amount of decay and oxidation heat rejected
from core debris will decrease - Core debris melting will result as the heat not rejected will be converted to stored energy
• By contrast, in MELCOR simulations, - Much larger amounts of decay heat will be simulated to be rejected away from the core
debris - The extent of debris melting simulated by MELCOR will thus be depressed relative to
MAAP5 simulations MELCOR simulations allow a greater degree of interaction between gases in the RPV and core debris. The formation of compacted debris beds in MAAP5 with more limited heat transfer
33 MELCOR assumes that the effective “connectedness” of a debris bed is unchanged with accumulation of particulate (i.e., decreasing porosity). This is intended to reflect the incoherent degradation of fuel assemblies around a radial ring. In this abstraction, there will always be open flow areas through a particulate debris bed. Increasing the volume of particulates thus serves to increase the effective heat transfer surface area.
5-5
surface area prevents significant interaction between hot debris and RPV gases. As a result, MAAP5 simulations tend to reject a larger amount of decay and chemical heat into core debris stored energy—i.e., debris temperatures are much higher than identified in MELCOR simulations.
This key difference in debris heat transfer modeling has two important consequences.
• MELCOR simulations exhibit severe temperature transients in the RPV steam dome and MSLs, relative to MAAP5 simulations
• Prolonged hydrogen generation occurs from core debris located in the core region in MELCOR simulations, whereas MAAP5 simulations exhibit significant abatement of in-vessel hydrogen generation once a rod-like core debris geometry is lost
5.4.2.1 High RPV Gas Temperatures As noted in Section 4, and discussed in detail in Appendix B and Appendix D, MELCOR simulations exhibit severe temperature transients in the RPV steam dome and MSLs, relative to the MAAP5 simulation. The potential for MSL creep rupture, prior to RPV lower head breach, thus exists in MELCOR simulations. It has been identified as a likely means of depressurizing the RPV prior to RPV lower head breach in SOARCA Peach Bottom uncertainty study [11].
By contrast, MAAP5 simulations do not identify the potential for MSL creep rupture in the simulation for this study. This result is generic across a range of MAAP5 simulations performed in different studies (see, for example, the simulations performed to investigate the Fukushima Daiichi event progression [6]).
It is important to note that this is also consistent with the observations from the TMI-2 accident. Upper plenum temperatures, as evidenced by metallographic studies on the control rod drives, ranged from about 982.2°C (1800°F) near the core to approximately 426.7°C (800°F) near the top of the RPV.
The most significant consequence of a MSL creep rupture, however, is not directly investigated in this study. The Peach Bottom SOARCA Uncertainty study [11] identified MSL creep rupture as a means of enhancing fission product release to the environment.
For these scenarios, there is a direct discharge pathway from the RPV into the drywell, bypassing the suppression pool. Thus, should leakage out of the drywell occur via, for example, the drywell head flange or due to drywell liner melt-through, releases to the environment will bypass the suppression pool. Since discharge from the RPV is into the drywell for this type of scenario, there is reduced scrubbing of fission products by the suppression pool.
As noted in MAAP5 sensitivity calculations [6], MSL creep rupture also results in enhanced fission product releases to the environment should impairment of the drywell occur. The radiological consequences of MSL creep rupture are thus similar between MAAP5 and MELCOR.
5.4.2.2 In-Vessel Hydrogen Generation Differences in the magnitude of in-vessel hydrogen generation have similarly important consequences on evaluation of accident severity. There are two important questions for which integral severe accident simulation codes can aid in developing insights.
5-6
• How severe is the overall in-vessel hydrogen generation (i.e., total mass of hydrogen generated)?
• Can in-vessel hydrogen generation occur over a prolonged period of time?
Precise, quantitative answers to these questions are not required to provide insights for accident management evaluations. The potential for flammable gas combustion following the onset of core damage has been recognized since TMI-2 [13].
These questions, however, are relevant for assessing the impact of mitigation actions. A particular concern is whether in-vessel core damage states are susceptible to continued hydrogen generation despite recovery of RPV injection.34
Core debris configurations that remain more open (i.e., like those in MELCOR simulations) will allow for more extensive hydrogen generation over a longer period of time should RPV water injection be recovered.
By contrast, the type of core debris configuration represented in MAAP5 simulations results in less exposed surface area. Thus, steam generated upon RPV water injection recovery does not necessarily contribute to extensive oxidation of Zircaloy. Furthermore, should sufficient surface area be open and above 1200 K, the rapid generation of chemical energy will result in debris formation and relocation into debris beds that have limited open flow area. Thus, MAAP5 simulations exhibit inherent limitations on the amount and duration of in-vessel hydrogen.
5.5 Development of Challenge to RPV Integrity prior to RPV Lower Head Breach The modeling of lower plenum debris dynamics, and associated challenge to the RPV lower head wall, are discussed in more detail in Appendix C. This subsection provides a summary of the key differences in how MAAP5 and MELCOR model lower plenum debris behavior.
The primary areas investigated in this study are
• The characteristics of the lower plenum debris bed of relevance to conditions affecting the debris relocation transient into the containment (i.e., debris bed temperature)
• The heat transfer from the lower plenum debris to the lower head wall (i.e., how each code characterizes the thermal challenge to the RPV lower head wall)
5.5.1 Key Modeling Differences There are two areas in which key modeling differences in lower plenum debris modeling arise. These differences are distinct from the differences that arise due to fundamentally different representations of core debris behavior inside the core region.
34 It is important to note that water injection rates around that required to remove heat by conversion of injected flow to steam are most relevant to these considerations. Flow rates that can remove all decay heat sensibly quench debris rapidly enough to terminate the high temperature conditions that activate the exothermic oxidation reaction.
5-7
The first type of modeling difference is in how MAAP5 and MELCOR represent molten debris slumping into the lower plenum. How the two codes model molten debris slumping is discussed further in Appendix C.2.1.
MAAP5 assumes that molten debris relocating into the lower plenum forms a jet that interacts primarily with lower plenum water. At sufficiently high molten debris pours, limited interaction with lower plenum water occurs. As a result, a substantial amount of the energy in the molten jet entering the lower plenum can be retained. Interaction of high temperature debris with the lower head wall can result in pronounced temperature excursions on initial core debris slumping.
MELCOR relocates debris (molten or particulate) to the lower plenum when the debris is no longer supported in the active fuel region. Unsupported molten material can flow through the assembly bottom end fittings. The lower core plate will support particulate debris; its failure, by either yielding or loss of mass (melting), will allow particulate debris to enter the lower plenum.
The second type of modeling difference is related to how the two codes represent core debris geometry and heat transfer inside the lower plenum. The MAAP5 and MELCOR models of lower plenum core debris are conceptually quite different. As noted in Section 5.4, these modeling differences ultimately result in distinct ways in which debris heat transfer is characterized. The modeling of lower plenum debris dynamics is discussed in more detail in Appendix C.2.1.
MELCOR represents the debris in the lower plenum in terms of a set of debris nodes occupying fixed sub-volumes in the lower plenum. These nodes are defined in both the radial and axial directions in the lower plenum. The type of debris in a node is determined based on the type of debris that has relocated into it and its temperature. For example, a node will only be included in a lower plenum molten pool if molten material relocates into it or particulate debris in the node melts.
By contrast, MAAP5 nodalizes the lower plenum debris bed in terms of debris constituents. The MAAP5 simulation in this study represents particulate, light metallic, upper oxidic crust, molten oxidic and lower oxidic crust debris. These debris bed constituents are layered from the top to the bottom of the debris bed. Each of these debris constituents can vary in volume based on the amount of core material that has formed each type of lower plenum debris.
Thus, the MAAP5 simulation in this study assumes that the lower plenum debris forms a terminal debris bed. The MELCOR simulation on the other hand performs a number of additional calculations to track how the spatially nodalized lower plenum debris bed behaves to form a terminal debris bed. Thus, the terminal form of the MELCOR lower plenum debris is not fixed to take a form similar to what is pre-determined in the MAAP5 simulation.
Thus, should sufficient heat transfer occur from particulate, lower plenum debris in a MELCOR simulation, formation of a coherent molten pool of oxide material may not occur. MAAP5 however, assumes that with sufficient accumulation of debris in the lower plenum, limitations to conduction of decay heat from the highly oxidic debris will result in formation of an oxidic molten pool.
In MAAP5 simulations, the formation of a molten oxidic pool allows decay heat to be convectively transferred to the outer surfaces of the debris. Thus, about 25% of the decay heat in
5-8

the lower plenum will be convectively rejected to the lower head wall - the remaining 75% of decay will be rejected upward, through the upper oxidic debris crust and ultimately radiate to the RPV upper structure above the debris.
Care must be taken in interpreting MELCOR results regarding melting of lower plenum core debris. The debris nodes in direct contact with the lower head wall are assumed to transfer heat to the lower head wall without any conduction limitation. This is because a conduction length is not explicitly modeled for these nodes.
5.5.2 Impact of Modeling Differences on Simulation Results Appendix C provides details regarding the MAAP5 and MELCOR simulations of RPV lower plenum debris behavior and lower head wall response.
Different modeling of debris slumping into the lower plenum cannot be directly correlated with the divergent simulation results identified in this study. The primary reason for this is that the nature of debris slumping into the lower plenum is significantly different in the two code simulations. Debris relocation into the lower plenum is influenced significantly by the fact that
• MAAP5 estimates approximately 80% of the core forming debris that is held up above the core plate - This debris relocates into the lower plenum over a 30 minute time frame following in
which the shroud and core plate fail - Approximately 60% of the debris relocating into the lower plenum is molten, at
temperatures exceeding 2500 K • MELCOR, by contrast, estimates a lower rate of debris relocation into the lower plenum,
with the debris largely in the form of solid particulates
Lower plenum heat transfer is a key area where modeling differences between the two codes influence the simulation results presented in this study. The results presented in Appendix C.3 indicate that MELCOR simulates lower plenum debris with relatively low temperatures compared with MAAP5.
• Peak temperatures in MELCOR lower plenum debris nodes are around 2100 K, which is below typical eutectic temperatures for U-Zr-O oxidic debris mixtures
• Peak temperatures in the MAAP5 oxidic molten pool are above 2500 K
Despite these different debris temperatures in the lower plenum, both simulations estimate appreciable heatup of the lower head wall.
• MAAP5 calculates lower head wall heatup commencing shortly after debris slumping to the lower plenum - Convective heat transfer from the oxidic molten pool is the primary process by which
decay heat in the lower plenum core debris is rejected to the lower head wall • MELCOR calculates lower head wall heatup commencing after all water in the lower plenum
has boiled away - The lower rate of debris slumping to the lower plenum results in a much slower depletion
of lower plenum water than found in the MAAP5 simulation
5-9

- After lower plenum dryout, the almost completely particulate lower plenum debris bed rejects its decay heat through conduction to the lower head wall
The conduction-limited heat transfer represented in the MAAP5 simulations results in about 55% of the core debris forming a molten, oxidic pool. The temperature of this molten debris is comparably high (above 2500 K), consistent with the melting point of a U-Zr-O eutectic. In the MAAP5 simulation, melting of debris is essential to enhance heat transfer out of the debris bed—convection of the molten debris is required to reject all the lower plenum decay heat away from this conduction-limited debris bed.
It is noted that the formation of a long term debris bed in a BWR lower plenum is contingent upon no failures in the lower head as core material is relocating from the core region. There are numerous penetrations through the lower head and severe of these are dry tubes. Submerging these penetrations in debris as it relocates to the lower plenum could result in a failure of the lower head before the debris beds are completely formed.
Such analyses should be part of any future evaluations. They are, however, beyond the scope of this present phase of the study. The simulated differences in debris bed formation prior to core debris slumping to the lower plenum prevented a rigorous comparison of how the two codes represents challenges to BWR lower head integrity.
5.6 Recommendations for Further Study The present study identified a number of key areas in which MAAP5 and MELCOR simulation of in-vessel core melt progression are appreciably different. The framework of this code-to-code comparison was essential for revealing these differences.
Integral response computer codes are very detailed, representing numerous physical processes that interact with each other. Isolated results comparison renders it impossible to identify the dominant effects contributing to simulation differences. Without a detailed investigation of a concrete scenario simulation, together with a side-by-side evaluation of relevant models, identification of key modeling deviations would not have been possible.
This framework has proved highly effective at identifying sources of differences in MAAP5 and MELCOR simulation results. These differences, for example different magnitudes of in-vessel hydrogen generation, had been unexplained for a number of years. As a result, it is worthwhile to consider the application of this methodology to an additional study of MAAP5 and MELCOR modeling.
The following items for future investigation have been identified as they are important to the representation of
• Features of accident sequences that are distinct from that considered in this study • Overall severe accident progression and this includes a deeper focus on the possible
influences of other modes of RPV failure • Severe accident radiological consequences
5-10
5.6.1 Comparison of Lower Plenum Response As noted in Section 4.5, lower plenum debris behavior in the MAAP5 and MELCOR simulations of this study reflects differences not directly related to how the two codes model lower plenum debris. The significant divergence identified in degraded core conditions in the core region makes it impossible to discern the impact of lower plenum debris modeling differences.
This area for further study is intended to isolate lower plenum debris modeling by invoking the MAAP5 and MELCOR models in stand-alone mode. In this manner both lower plenum models can be exercised using the same debris slumping transients.
To identify the impact of debris slumping transients on lower plenum debris response, it is important to study the two types of debris slumping transients identified in this study. That is,
• A slow, largely particulate debris slumping transient similar to that simulated by MELCOR in this study
• A rapid debris slumping transient comprised of a large molten fraction similar to that simulated by MAAP5 in this study
This type of approach enables a more specific means of quantifying the extent to which distinctly different debris slumping transients are influencing the lower plenum debris dynamics.
5.6.2 Simulation of Recovery Actions The scenario considered in the present study did not assume any mitigating actions. This type of sequence falls under the category of unmitigated scenarios. An unmitigated sequence, however, does provide a relatively transparent means of evaluating how different computer codes are modeling core melt progression physics.
Unmitigated sequences, however, are relatively low contributors to overall risk. The three core melt events that occurred at Fukushima Daiichi illustrated that, even in the most extreme of situations, some mitigation will be performed. What these core melt events also demonstrate is that a critical uncertainty is the effectiveness of different mitigation strategies. For example, a large amount of evidence has accumulated at present to indicate that the recovery of RPV water injection was likely insufficient to quench core debris in the short term at Units 1, 2 and 3.
It is thus relevant to develop insights into the effectiveness of, but also the impact on, core melt progression from less than ideal mitigation strategies. These insights are relevant to
• Assessing the underlying uncertainty in knowledge of degraded core response following the initiation of water injection recovery actions35
• The range of outcomes that are realistically achievable with current state-of-the-art modeling • The components of models, developed as extrapolations of empirical data, that have the most
significant impact on simulation differences
35 As noted in this study, the range of modeling choices made for representing degraded core geometry reflects the uncertainty in how single assembly degradation experiments should be scaled to reactor scale.
5-11
To gain a broad enough range of information, it is necessary to investigate accident sequences with the following characteristics
• Water injection recovery prior to significant loss of the rod-like core geometry • Water injection recovery following significant loss of rod-like geometry • Water injection following core slumping into the lower plenum to assess the representation
of different in-vessel heat removal mechanisms for lower plenum debris
It is relevant to probe the response of each of these core debris “end states” to different rates of water injection recovery. It is most useful for this range of water injection rates to cover the transition from steam feeding to steam cooling to water quenching of core oxidation.
5.6.3 Ex-Vessel Core Melt Progression The current study investigated severe accident progression up to the point of RPV lower head breach. The DOE study of Fukushima Daiichi Unit 1 ex-vessel core melt spreading [8] has highlighted the impact that MAAP5 and MELCOR simulation deviations can have. As noted above, MAAP5 and MELCOR discharge core debris into the containment at notably different
• Temperatures • Discharge rates
MAAP5 simulations identify debris discharge from the damaged RPV at relatively high discharge rates. The severity of this type of discharge is enhanced by the fact that the debris is discharged in a largely molten state at relatively high temperatures. There are some scenarios for which this type of debris discharge can challenge the integrity of the drywell steel liner upon contact.
By contrast, the debris discharged identified by MELCOR simulations typically has a high fraction of solid particulate and is at notably lower temperatures. The debris discharge rate is also much slower due to the more limited availability of molten debris in the lower plenum at the time of RPV lower head breach. The debris that spreads along the reactor pedestal and drywell floor is thus significantly more viscous than identified in MAAP5 simulations. It is also discharged from the RPV with a lower driving force (i.e., lower mass flow rate).
The net effect is that MELCOR-simulated debris spreads relatively slowly over the reactor pedestal and drywell floors. This provides a greater amount of time for additional heat transfer mechanisms to act and reduce the temperature of the debris. As a result, MELCOR-simulated debris tends to spread over a smaller surface area than MAAP5-simulated debris.
There are limited additional insights to be gained by considering the different spreading dynamics of MELCOR- and MAAP5-simulated debris. This has been addressed in significant detail in the DOE Fukushima Daiichi Unit 1 ex-vessel core debris study [8].
5.6.4 Comparison of Radiological Consequences What has received limited attention, however, is the impact of these different types of debris on the simulation fission product release following RPV lower head breach. The temperature of the core debris can have a significant effect on the magnitude of fission product release from ex-
5-12
vessel core debris. This is particularly true for the less volatile fission products, which are not typically released in large magnitudes for in-vessel core damage states.
Of particular interest is the release of less volatile fission products like cerium. This fission product can make an important contribution to off-site consequences, particularly on latent cancer fatalities [11]. The Peach Bottom SOARCA uncertainty analysis has noted that evaluation of latent cancer fatalities should consider the effect of cerium and cesium in conjunction [11]. Presently, latent cancer fatalities are typically assumed to be driven by cesium release.
5.6.5 Comparison of Simulation Sensitivities and Uncertainties The previous discussion identified considerations for future investigation into specific features of accident progression, considering single sets of accident sequences. This approach is the most worthwhile when considering how modeling of specific phenomena may deviate between computer codes.
This approach, however, does not elucidate the uncertainty inherent in any severe accident simulation. This uncertainty arises due to a number of factors.
1. Uncertainty in the empirical data used to develop and benchmark computer code models (a component of modeling uncertainty)
2. Uncertainty in the conditions of the experiments from which empirical data was obtained for use in developing and benchmarking computer code models (a component of modeling uncertainty)
3. Uncertainty in the understanding of the physical process itself due to limited data available to characterize it (representational uncertainty)
4. Uncertainty in understanding of the behavior and interaction of physical processes when extrapolating to conditions or scales beyond those for which empirical data has been obtained (scaling uncertainty)
The final three sources of uncertainty are the primary ones of relevance to severe accident simulations. Such uncertainty arises due to the large number of physical processes that contribute to plant response in the event of a severe accident. The large number of degrees of freedom makes it difficult if not impossible to completely characterize how they will all interact from a limited number of experiments. The inability to completely control all the degrees of freedom in experimental tests approaching reactor scale ensures that a small number of experiments will not be able to completely assess the role of uncontrolled degrees of freedom.
The large uncertainty that influences a severe accident simulation thus requires the results be adequately characterized in terms of a range of outcomes. This is the only means by which the uncertainty in state-of-knowledge can be adequately evaluated with respect to its impact on overall risk.
It is therefore meaningful to gain insight into how the simulation uncertainty compares between a MAAP5 and MELCOR uncertainty analysis. For this purpose, it is appropriate to subject the simulation of this study to a more rigorous uncertainty analysis. The purpose of this uncertainty analysis is to identify how in-vessel core melt progression modeling uncertainty impacts the cumulative in-vessel hydrogen generation.
5-13
This type of comparative uncertainty analysis is relevant given the increased application of these computer codes to evaluate ranges of severe accident consequences [11].
5.6.6 Simulation of the TMI-2 Event TMI-2 represents the only LWR core damage event that can provide information regarding degraded core conditions at reactor scale. Until further information is available from the Fukushima Daiichi units, TMI-2 provides the only means by which code models and model parameter choices can be benchmarked.
This study has identified a number of critical assumptions in the two models regarding degraded core geometry that lead to dramatic differences in the code simulations. These differences arise once core materials begin relocating outside their original geometry.
Simulation of the TMI-2 event provides the only means at present against which to assess the degree to which these different assumptions are representative of this reactor scale event. The first stage of this activity is intended to simulate the TMI-2 event with best practice modeling choices. This simulation thus provides an important means to assess the degree to which these different models and model parameter choices can represent an actual reactor scale event.
In addition to simulating the TMI-2 event with best practice model parameter choices, insights from the sensitivity and uncertainty analyses discussed in Section 5.6.5 should be used to identify what, if any, modeling parameter choices may provide a more representative simulation of the TMI-2 event.
5.7 Summary of In-Vessel Core Degradation Modeling Differences Identified in this Study Table 5-1 provides a summary of the key modeling differences identified in this study. This table is intended to summarize and supplement the above discussion.
These differences are restricted to in-vessel core degradation. It is important to note that additional differences may occur “downstream” in the code calculations. These differences, however, reflect key points of bifurcation in the code modeling and resulting code calculations. Comparison of code calculations beyond these differences becomes difficult because of the notable divergence in the simulated state of the degraded core.
5-14
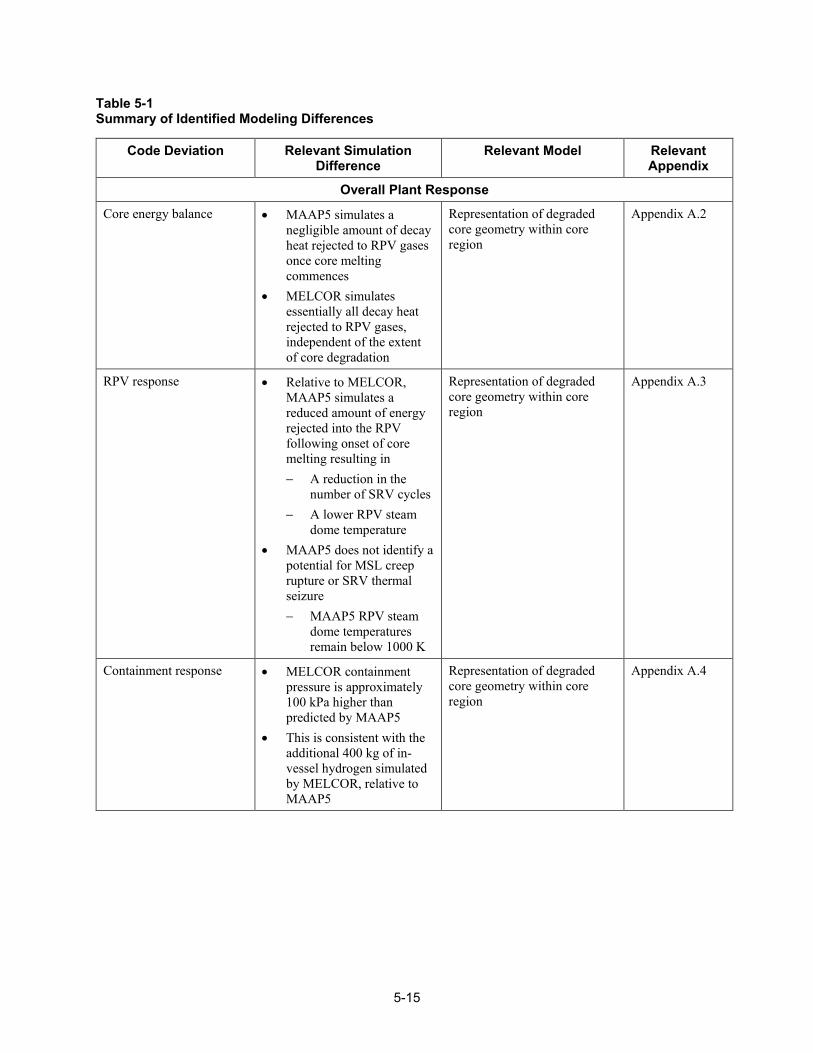
Table 5-1 Summary of Identified Modeling Differences
Code Deviation Relevant Simulation Difference
Relevant Model Relevant Appendix
Overall Plant Response
Core energy balance • MAAP5 simulates a negligible amount of decay heat rejected to RPV gases once core melting commences
• MELCOR simulates essentially all decay heat rejected to RPV gases, independent of the extent of core degradation
Representation of degraded core geometry within core region
Appendix A.2
RPV response • Relative to MELCOR, MAAP5 simulates a reduced amount of energy rejected into the RPV following onset of core melting resulting in − A reduction in the
number of SRV cycles − A lower RPV steam
dome temperature • MAAP5 does not identify a
potential for MSL creep rupture or SRV thermal seizure − MAAP5 RPV steam
dome temperatures remain below 1000 K
Representation of degraded core geometry within core region
Appendix A.3
Containment response • MELCOR containment pressure is approximately 100 kPa higher than predicted by MAAP5
• This is consistent with the additional 400 kg of in-vessel hydrogen simulated by MELCOR, relative to MAAP5
Representation of degraded core geometry within core region
Appendix A.4
5-15
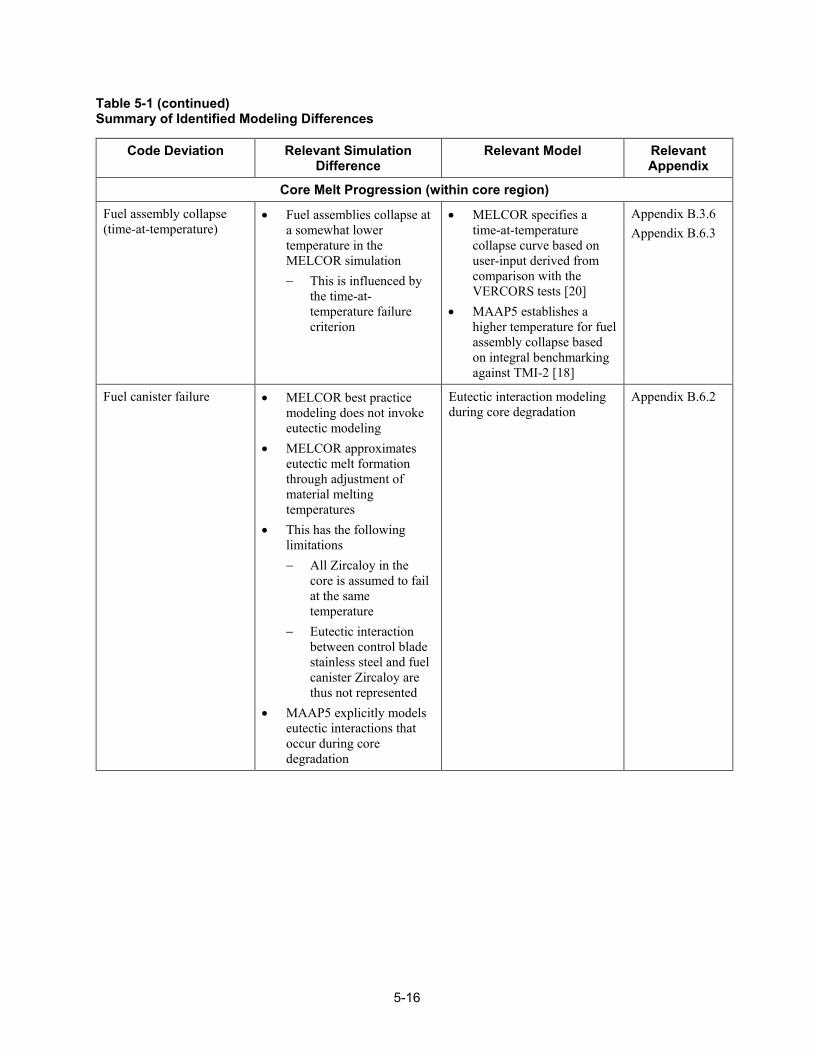
Table 5-1 (continued) Summary of Identified Modeling Differences
Code Deviation Relevant Simulation Difference
Relevant Model Relevant Appendix
Core Melt Progression (within core region)
Fuel assembly collapse (time-at-temperature)
• Fuel assemblies collapse at a somewhat lower temperature in the MELCOR simulation − This is influenced by
the time-at-temperature failure criterion
• MELCOR specifies a time-at-temperature collapse curve based on user-input derived from comparison with the VERCORS tests [20]
• MAAP5 establishes a higher temperature for fuel assembly collapse based on integral benchmarking against TMI-2 [18]
Appendix B.3.6 Appendix B.6.3
Fuel canister failure • MELCOR best practice modeling does not invoke eutectic modeling
• MELCOR approximates eutectic melt formation through adjustment of material melting temperatures
• This has the following limitations − All Zircaloy in the
core is assumed to fail at the same temperature
− Eutectic interaction between control blade stainless steel and fuel canister Zircaloy are thus not represented
• MAAP5 explicitly models eutectic interactions that occur during core degradation
Eutectic interaction modeling during core degradation
Appendix B.6.2
5-16
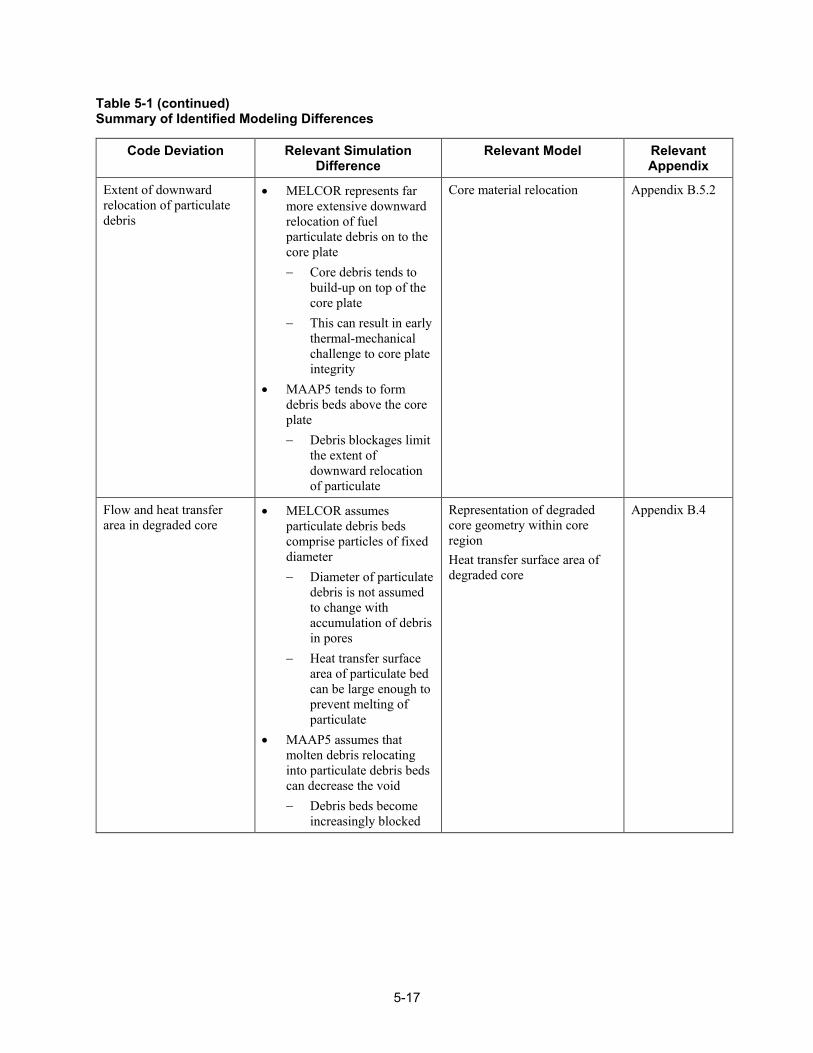
Table 5-1 (continued) Summary of Identified Modeling Differences
Code Deviation Relevant Simulation Difference
Relevant Model Relevant Appendix
Extent of downward relocation of particulate debris
• MELCOR represents far more extensive downward relocation of fuel particulate debris on to the core plate − Core debris tends to
build-up on top of the core plate
− This can result in early thermal-mechanical challenge to core plate integrity
• MAAP5 tends to form debris beds above the core plate − Debris blockages limit
the extent of downward relocation of particulate
Core material relocation Appendix B.5.2
Flow and heat transfer area in degraded core
• MELCOR assumes particulate debris beds comprise particles of fixed diameter − Diameter of particulate
debris is not assumed to change with accumulation of debris in pores
− Heat transfer surface area of particulate bed can be large enough to prevent melting of particulate
• MAAP5 assumes that molten debris relocating into particulate debris beds can decrease the void − Debris beds become
increasingly blocked
Representation of degraded core geometry within core region Heat transfer surface area of degraded core
Appendix B.4
5-17
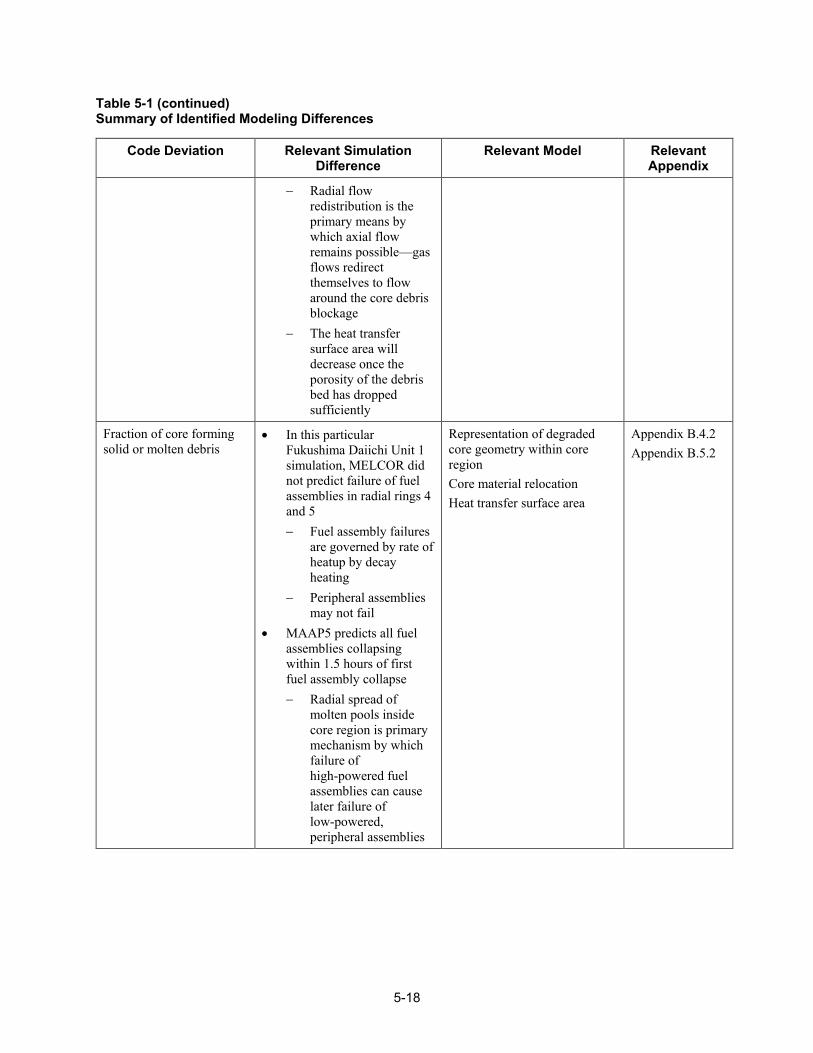
Table 5-1 (continued) Summary of Identified Modeling Differences
Code Deviation Relevant Simulation Difference
Relevant Model Relevant Appendix
− Radial flow redistribution is the primary means by which axial flow remains possible—gas flows redirect themselves to flow around the core debris blockage
− The heat transfer surface area will decrease once the porosity of the debris bed has dropped sufficiently
Fraction of core forming solid or molten debris
• In this particular Fukushima Daiichi Unit 1 simulation, MELCOR did not predict failure of fuel assemblies in radial rings 4 and 5 − Fuel assembly failures
are governed by rate of heatup by decay heating
− Peripheral assemblies may not fail
• MAAP5 predicts all fuel assemblies collapsing within 1.5 hours of first fuel assembly collapse − Radial spread of
molten pools inside core region is primary mechanism by which failure of high-powered fuel assemblies can cause later failure of low-powered, peripheral assemblies
Representation of degraded core geometry within core region Core material relocation Heat transfer surface area
Appendix B.4.2 Appendix B.5.2
5-18
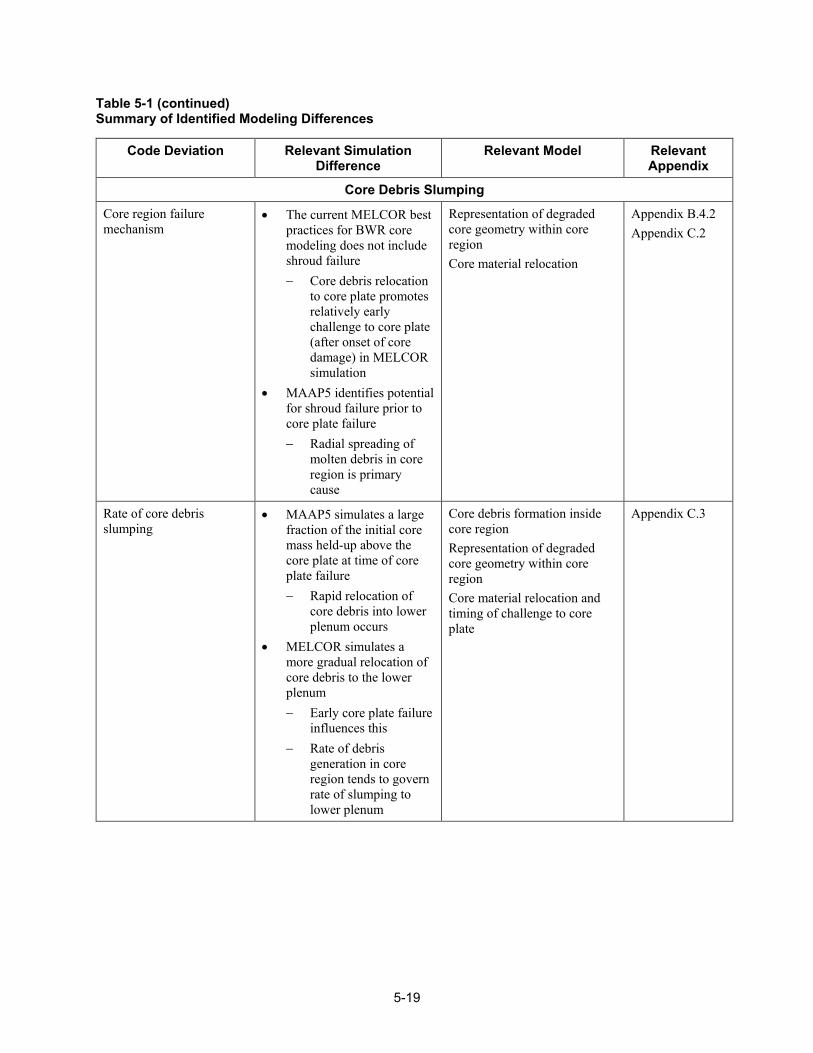
Table 5-1 (continued) Summary of Identified Modeling Differences
Code Deviation Relevant Simulation Difference
Relevant Model Relevant Appendix
Core Debris Slumping
Core region failure mechanism
• The current MELCOR best practices for BWR core modeling does not include shroud failure − Core debris relocation
to core plate promotes relatively early challenge to core plate (after onset of core damage) in MELCOR simulation
• MAAP5 identifies potential for shroud failure prior to core plate failure − Radial spreading of
molten debris in core region is primary cause
Representation of degraded core geometry within core region Core material relocation
Appendix B.4.2 Appendix C.2
Rate of core debris slumping
• MAAP5 simulates a large fraction of the initial core mass held-up above the core plate at time of core plate failure − Rapid relocation of
core debris into lower plenum occurs
• MELCOR simulates a more gradual relocation of core debris to the lower plenum − Early core plate failure
influences this − Rate of debris
generation in core region tends to govern rate of slumping to lower plenum
Core debris formation inside core region Representation of degraded core geometry within core region Core material relocation and timing of challenge to core plate
Appendix C.3
5-19
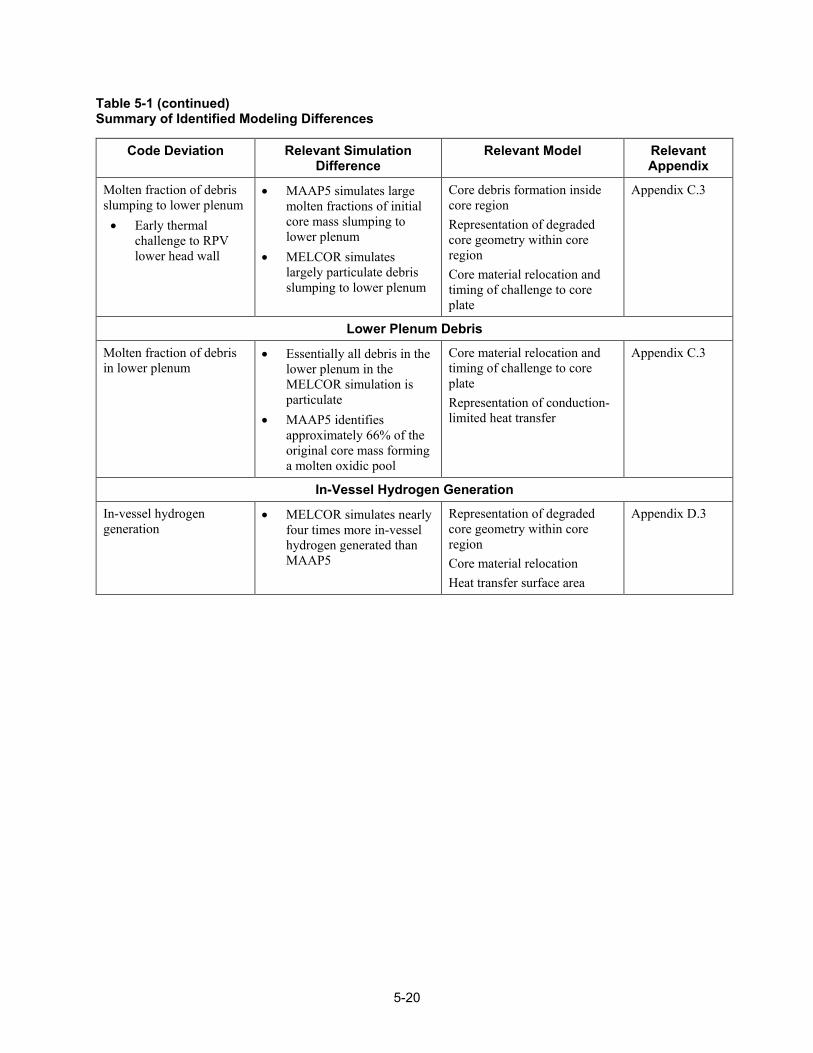
Table 5-1 (continued) Summary of Identified Modeling Differences
Code Deviation Relevant Simulation Difference
Relevant Model Relevant Appendix
Molten fraction of debris slumping to lower plenum • Early thermal
challenge to RPV lower head wall
• MAAP5 simulates large molten fractions of initial core mass slumping to lower plenum
• MELCOR simulates largely particulate debris slumping to lower plenum
Core debris formation inside core region Representation of degraded core geometry within core region Core material relocation and timing of challenge to core plate
Appendix C.3
Lower Plenum Debris
Molten fraction of debris in lower plenum
• Essentially all debris in the lower plenum in the MELCOR simulation is particulate
• MAAP5 identifies approximately 66% of the original core mass forming a molten oxidic pool
Core material relocation and timing of challenge to core plate Representation of conduction-limited heat transfer
Appendix C.3
In-Vessel Hydrogen Generation
In-vessel hydrogen generation
• MELCOR simulates nearly four times more in-vessel hydrogen generated than MAAP5
Representation of degraded core geometry within core region Core material relocation Heat transfer surface area
Appendix D.3
5-20
6 REFERENCES [1] “Transmittal Document for MAAP5 Code Revision MAAP 5.02,” prepared by Fauske &
Associates, LLC, FAI/13-0801, November 2013.
[2] Sandia National Laboratories. MELCOR Computer Code Manuals. NUREG/CR-6119 (2011).
[3] M.T. Farmer, J.J. Sienicki and B.W. Spencer, “The MELTSPREAD-1 Computer Code for Analysis of Transient Spreading in Containments,” Proceedings of ANS Winter Meeting, Washington DC, Nov. 11-15, 1990.
[4] M.T. Farmer, J.J. Sienicki, C.C. Chu and B.W. Spencer, “The MELTSPREAD-1 Code for Analysis of Transient Spreading and Cooling of High-Temperature Melts, Code Manual,” EPRI TR-103413 (1993).
[5] M.T. Farmer, “The CORQUENCH Code for Modeling of Ex-Vessel Corium Coolability under Top Flooding Conditions, Code Manual—Version 3.03,” OECD/MCCI-2010-TR03, Rev. 2, January 2011.
[6] Fukushima Technical Evaluation: Phase I—MAAP5 Analysis. EPRI, Palo Alto, CA: 2013. 1025750.
[7] R.O. Gauntt et. al., Fukushima Dai-ichi Accident Study. Sandia Document No. SAND2012-6173, July 2012.
[8] K.R. Robb, M.W. Francis and M.T. Farmer, “Enhanced Ex-Vessel Analysis for Fukushima Daiichi Unit 1: Melt Spreading and Core-Concrete Interaction Analyses with MELTSPREAD and CORQUENCH,” ORNL/TM-2012/455, February 2013.
[9] U.S. Nuclear Regulatory Commission, “State-of-the-Art Reactor Consequence Analyses (SOARCA) Report,” NUREG-1935, Washington, DC: NRC, 2012.
[10] U.S. Nuclear Regulatory Commission, “MELCOR Best Practices as Applied in the State-of-the-Art Reactor Consequence Analyses (SOARCA) Project,” NUREG/CR-7008, Washington, DC: NRC, 2012.
[11] State-of-the-Art Reactor Consequence Analysis Project, Uncertainty Analysis of the Unmitigated Long-Term Station Blackout of the Peach Bottom Atomic Power Station, SAND2012-1070P, Sandia National Laboratories, Albuquerque, NM, March 2013.
[12] Investigation of Strategies for Mitigating Radiological Releases in Severe Accidents. EPRI, Palo Alto, CA: 2012. 1026539.
[13] Severe Accident Management Guidance Technical Basis Report, Volume 1: Candidate High-Level Actions and Their Effects. EPRI, Palo Alto, CA: 2012. 1025295.
6-1
[14] R.O. Gauntt and L.L. Humphries, Final Results of the XR2-1 BWR Metallic Melt Relocation Experiment. NRC Document No. NUREG/CR-6527, August 1997.
[15] P. Hofmann, S. Hagen, G. Schanz and A. Skokan. “Reactor Core Materials Interactions at Very High Temperatures,” Nuclear Technology 87, 146-186 (1989).
[16] Use of Modular Accident Analysis Program (MAAP) in Support of Post-Fukushima Applications. EPRI, Palo Alto, CA: 2013. 3002001785.
[17] R.E. Henry. TMI-2: An Event in Accident Management for Light-Water-Moderated Reactors. American Nuclear Society, La Grange Park IL (2011).
[18] MAAP5 - Modular Accident Analysis Program for LWR Power Plants. EPRI, Palo Alto, CA: 2013.
[19] MELCOR Computer Code Manuals, Vol. 3: Demonstration Problems, Version 2.1, SAND2008-XXXX, Vol. 3, Rev. 1, NUREG/CR-6119, Sandia National Laboratories, Albuquerque, NM, September 2008, DRAFT.
[20] Y. Pontillon, P.P. Malgouyres, G. Ducros, G. Nicaise, R. Dubourg, , M. Kissane and M. Baichi, “Lessons learnt from VERCORS tests. Study of the active role played by UO2-ZrO2-FP interactions on irradiated fuel collapse temperature,” Journal of Nuclear Materials, Volume 344, pp. 265-273, 2005.
[21] B. Clement and R. Zeyen, “The PHEBUS Fission Product and Source Term International Programme,” Proc. Int. Conf. for Nuclear Energy for New Europe (2005). Bled, Slovenia.
6-2
A SIMULATION OF OVERALL PLANT AND PLANT SYSTEM RESPONSE A.1 Introduction This appendix is intended to establish the extent to which MAAP5 and MELCOR simulate similar bulk plant response. These are primarily related to total mass and energy transport from the degrading core.
The characteristics of plant and plant system response considered in this appendix are the
• Overall energy balance • RPV pressure and temperature transients • Reactor water level transient • Feedwater system injection • Isolation Condenser heat removal transient • Drywell and wetwell pressure transients • Suppression pool bulk water temperature transient
A.2 Simulation of Overall Energy Balance Figure A-1 presents the overall energy balance inside the reactor. This accounts for different source of energy released from the core. It also accounts for different forms of heat sinks.
There are two sources of energy inside the reactor
• Decay heat from the fission of decay products36 - Under normal and abnormal conditions, the primary heat source is fission product decay
heat • Chemical heat generated upon oxidation of Zircaloy or stainless steel
- Upon core damage onset, sufficient heat up of the uncovered core causes an exothermic oxidation reaction to occur between the steam in the RPV and overheated metals (e.g., Zircaloy fuel cladding)
- This energy can be significantly in excess of decay heat (e.g., ten times) for transient periods
The energy generated inside the reactor (from fission product decay and oxidation reactions) is dissipated in a number of ways.
36 Note that fission products released from damaged fuel can plate out on reactor internals. The decay of these fission products is also a heat source within the reactor
A-1
• Convective heat transfer to RPV water or gases, with the magnitude of this heat transfer pathway influenced by the - Heat transfer coefficient (i.e., heat transfer to water is more effective than to gas or
steam) - Available surface area for heat transfer, with the available area potentially decreasing as
core debris melts and relocates into flow channels - but this may not always be the case as particulate debris beds can exhibit an enhanced area for heat transfer
• Radiative heat loss to reactor structures - As the core heats up, radiation heat transfer to reactor structures, such as the core shroud,
will become appreciable pathways for heat transfer - The magnitude of radiation heat transfer is influenced by not only the temperature of the
surface but also how well two surfaces can see each other (i.e., their line of sight) o For example, radiation from the top of intact fuel assemblies to the upper reactor
internals is relatively small - there is limited surface area relative to that along the height of fuel rods
• Stored energy in core material - The heat up of the reactor core represents the process of conversion of decay or chemical
heat to material stored energy - Stored energy increases inside the reactor core because other available heat transfer
pathways (e.g., convection to RPV gases or radiation to reactor structures) are not sufficiently large to transport the generated energy away from the fuel
Figure A-1 shows how these different energy sources and sinks compare with each other. There are a number of features to note.
• Total energy production in the reactor - MELCOR simulates more extensive oxidation of core material than MAAP5
o The amount of chemical energy generated in the MELCOR simulation is about 100 GJ o By comparison, the MAAP5 simulation estimates about 35 GJ of energy is generated
due to oxidation in the core o The oxidation energy found in the MAAP5 simulation represents is about 30% of that
estimated in the MELCOR simulation - The amount of energy rejected convectively to RPV fluids (i.e., water and gas) is more
restricted in the MAAP5 simulation by comparison to the MELCOR simulation o The MELCOR simulation identifies about all of the decay energy being convectively
dissipated away from the core o The MAAP5 simulation, by contrast, identifies about 65% of the decay and chemical
energy being dissipated to RPV fluids - The extent of decay and chemical energy converted to core material stored energy is
notably larger in the MAAP5 simulation than the MELCOR simulation o In the MELCOR simulation, approximately 75 GJ of decay and chemical energy is
converted to stored energy
A-2
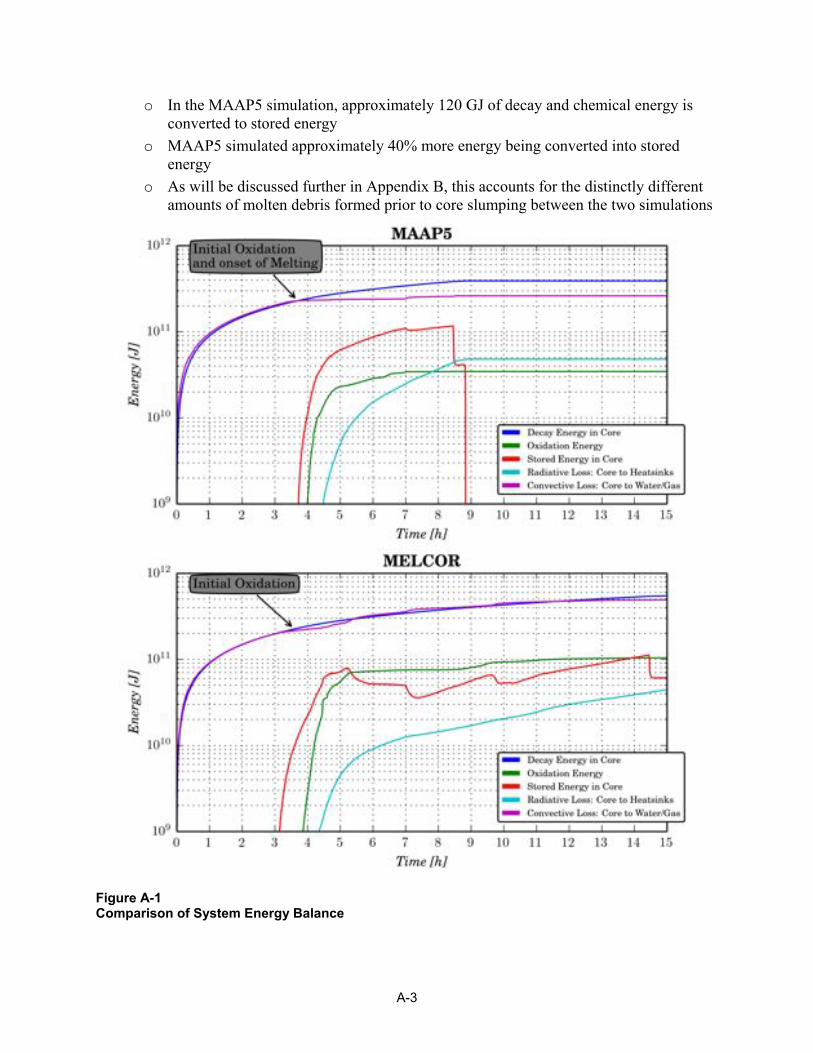
o In the MAAP5 simulation, approximately 120 GJ of decay and chemical energy is converted to stored energy
o MAAP5 simulated approximately 40% more energy being converted into stored energy
o As will be discussed further in Appendix B, this accounts for the distinctly different amounts of molten debris formed prior to core slumping between the two simulations
Figure A-1 Comparison of System Energy Balance
A-3
A.3 Simulation of Bulk RPV Response Bulk conditions in the RPV are characterized by the
• System pressure • Steam dome temperature • Reactor water level
These parameters provide an indication of the decay heat removal function. Observation of these parameters provides critical information to accident management evaluations in BWR plant EOPs and SAMGs. Simulation of these parameters is relevant to the use of code simulations in developing plant response insights to inform and support accident management development and training.
A.3.1 Overall RPV Pressure and Temperature Transient The MAAP5 and MELCOR simulated RPV pressure transients are shown in Figure A-2.
The following distinct phases of RPV response are illustrated in Figure A-2.
• During the first hour after the initiating event, the RPV pressure is controlled by operation of the Isolation Condenser - The initially rapid depressurization of the RPV is due to operation of both trains of the
Isolation Condenser, cumulatively removing a total of 84.4 MW - Subsequent operations of the Isolation Condenser assume only one train of the Isolation
Condenser in operation - The operational periods of the Isolation Condenser are provided in Table 2-2 - Both MAAP5 and MELCOR provide a similar representation of the RPV pressure during
the first hour of Isolation Condenser operation • After the first hour, the RPV repressurizes to the SRV setpoint and the pressure is
subsequently controlled by SRV cycling - Rapid SRV cycling occurs in both MAAP5 and MELCOR simulations until about
T+4.2 hours - Both simulations exhibit a reduction in SRV cycling around T+4.2 hours due to a
reduction in the RPV water inventory (and a decrease in the steam generation rate) - The MAAP5 simulation, however, exhibits a much more prolonged decrease in SRV
cycling o The SRV cycles three times for an hour period after about T+4.2 hours, until T+5.2
hours o Steam generation decreases over this time period, which corresponds to the point
when the downcomer water level reaches the top of the jet pumps (see Figure A-4, below)
o After T+5.2 hours, sufficient core debris has formed inside the core region to enhance the heat transfer to the core shroud
o A gradual decrease in the downcomer water level results, along with an increase in steam generation rate (see Figure A-4, below)
A-4
o Beyond T+5.3 hours, this increased steam generation rate results in the MAAP5 simulation estimating increased SRV cycling
- By contrast, there is never such a severe reduction of steam flow through the core in the MELCOR simulation o Over this same period, up until T+7 hours, continual SRV cycling is simulated by
MELCOR (see Figure A-2) • Beyond T+7 hours, both MAAP5 and MELCOR simulate similar RPV pressure transients
- SRV seizure causes the RPV to depressurized in both simulations after T+7 hours - The overall rate of depressurization after T+7 hours is similar in the two simulations,
with MELCOR exhibiting a somewhat slower rate of depressurization than MAAP5 o The slower rate of RPV depressurization in the MELCOR simulation is attributable to
the greater amount of energy removed from the core debris to the RPV gases (see Figure A-1, above, for the overall simulated energy balance)
- MAAP5 and MELCOR also simulate a similar rise in RPV pressure around the time of core slumping o The MAAP5 simulation exhibits a strong pressure surge in the RPV around T+10
hours when the majority of core debris relocates into the lower plenum o By contrast, the MELCOR simulation exhibits a more muted, but prolonged, pressure
rise upon initial core slumping (approximately 4 MPa lower than the MAAP5 simulation)
o This difference between the two simulations is attributable to the much larger mass of core debris MAAP5 simulates to slump into the lower plenum
A-5
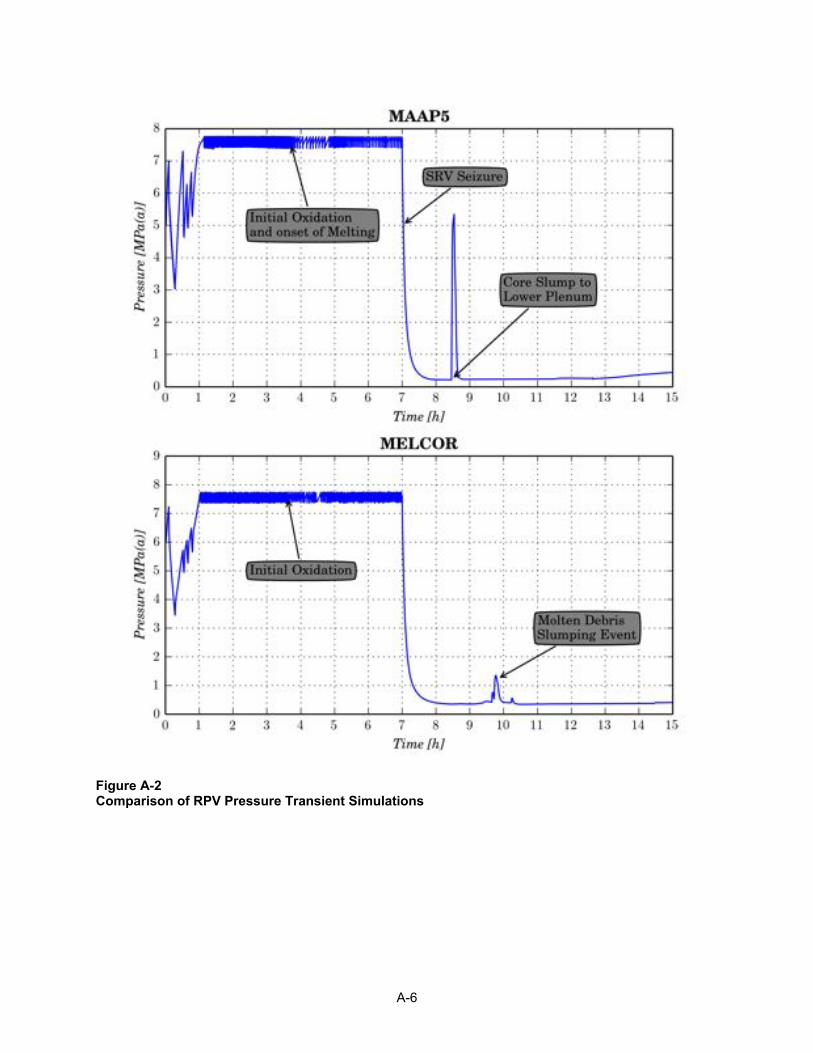
Figure A-2 Comparison of RPV Pressure Transient Simulations
A-6

The greater amount of energy removed from the core debris to the RPV gases can be more directly seen in the RPV gas temperatures. Figure A-3 shows the temperature of RPV gas in the steam dome region.
• MAAP5 simulates a large rise in the temperature, approaching 1000 K upon core slumping to the lower plenum - Aside from this event, the RPV gas temperature in the steam dome is simulated to be
below 1000 K for the majority of the simulation - The MAAP5 steam dome gas temperature is typically around 800 K for most of the
simulation • These temperatures are far too low to induce creep in stainless steel structures such as an
MSL when the RPV is at full system pressure. By contrast, MELCOR estimates higher RPV gas temperatures in the steam dome - Following the onset of core damage at T+3 hours, the temperature escalates to over 1200
K for about 15 minutes. This temperature is sufficiently high to induce creep in stainless steel structures such as an MSL at full system pressure
- For the remainder of the MELCOR simulation, the steam dome gas temperature is generally in the range of 950 K to about 1150 K
A-7
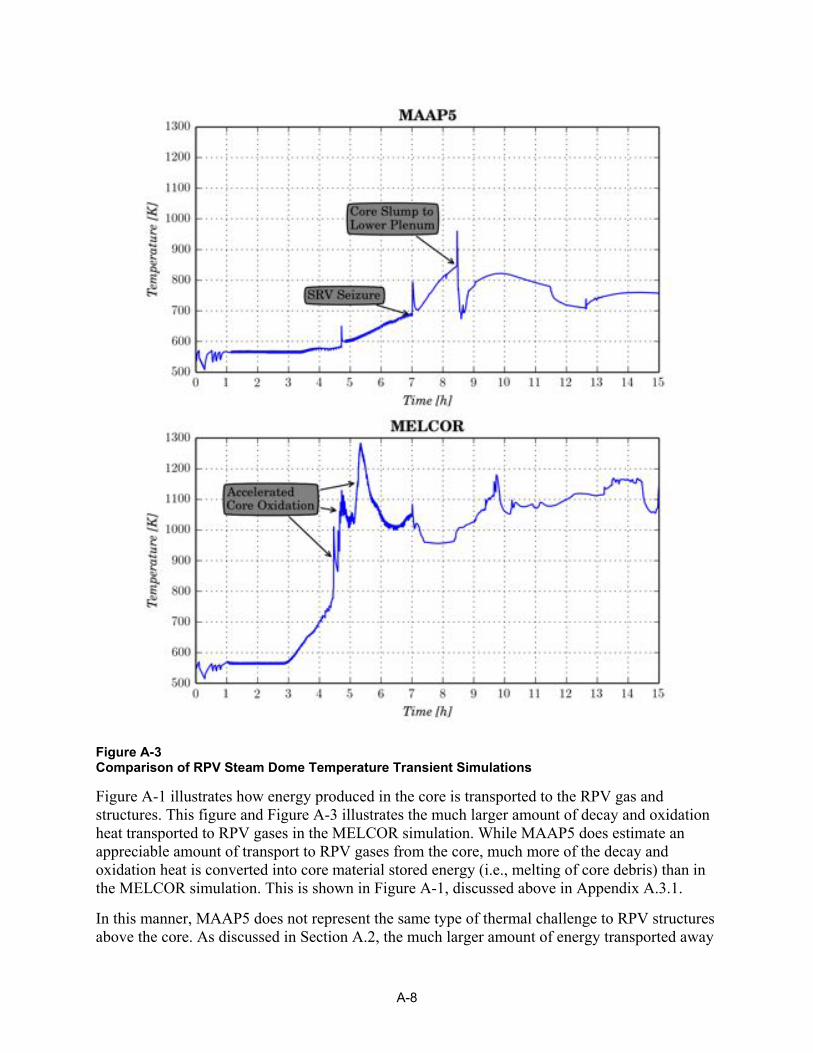
Figure A-3 Comparison of RPV Steam Dome Temperature Transient Simulations
Figure A-1 illustrates how energy produced in the core is transported to the RPV gas and structures. This figure and Figure A-3 illustrates the much larger amount of decay and oxidation heat transported to RPV gases in the MELCOR simulation. While MAAP5 does estimate an appreciable amount of transport to RPV gases from the core, much more of the decay and oxidation heat is converted into core material stored energy (i.e., melting of core debris) than in the MELCOR simulation. This is shown in Figure A-1, discussed above in Appendix A.3.1.
In this manner, MAAP5 does not represent the same type of thermal challenge to RPV structures above the core. As discussed in Section A.2, the much larger amount of energy transported away
A-8
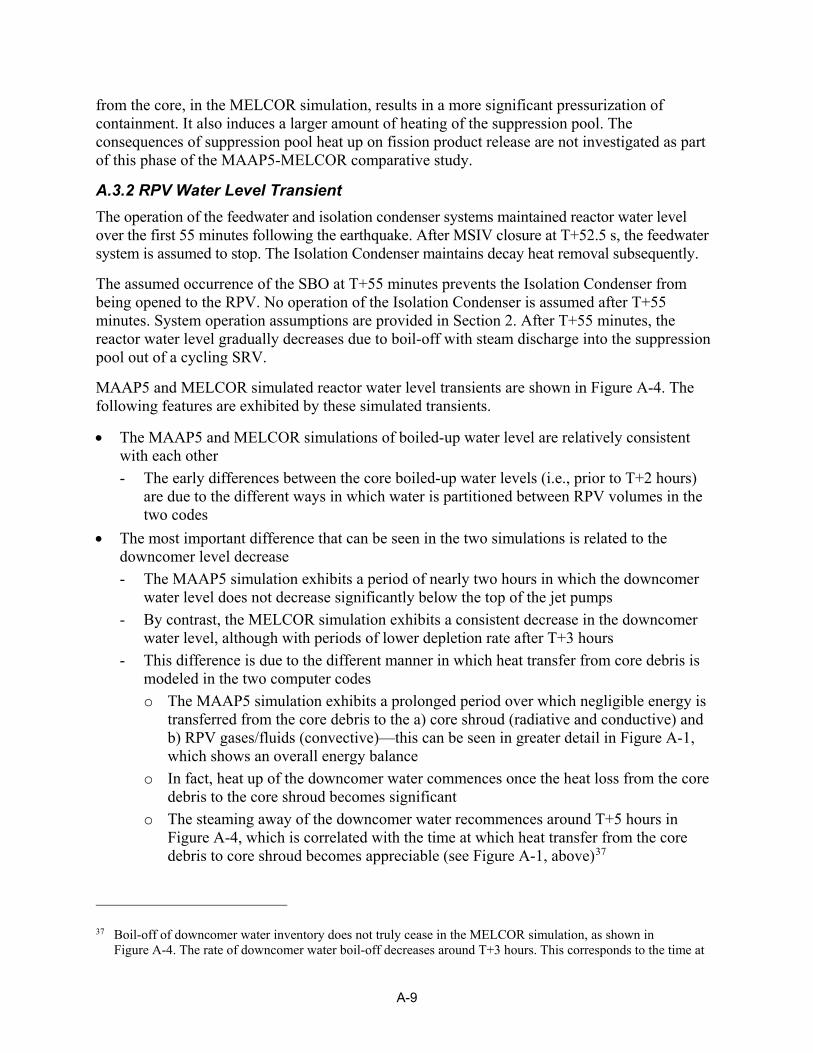
from the core, in the MELCOR simulation, results in a more significant pressurization of containment. It also induces a larger amount of heating of the suppression pool. The consequences of suppression pool heat up on fission product release are not investigated as part of this phase of the MAAP5-MELCOR comparative study.
A.3.2 RPV Water Level Transient The operation of the feedwater and isolation condenser systems maintained reactor water level over the first 55 minutes following the earthquake. After MSIV closure at T+52.5 s, the feedwater system is assumed to stop. The Isolation Condenser maintains decay heat removal subsequently.
The assumed occurrence of the SBO at T+55 minutes prevents the Isolation Condenser from being opened to the RPV. No operation of the Isolation Condenser is assumed after T+55 minutes. System operation assumptions are provided in Section 2. After T+55 minutes, the reactor water level gradually decreases due to boil-off with steam discharge into the suppression pool out of a cycling SRV.
MAAP5 and MELCOR simulated reactor water level transients are shown in Figure A-4. The following features are exhibited by these simulated transients.
• The MAAP5 and MELCOR simulations of boiled-up water level are relatively consistent with each other - The early differences between the core boiled-up water levels (i.e., prior to T+2 hours)
are due to the different ways in which water is partitioned between RPV volumes in the two codes
• The most important difference that can be seen in the two simulations is related to the downcomer level decrease - The MAAP5 simulation exhibits a period of nearly two hours in which the downcomer
water level does not decrease significantly below the top of the jet pumps - By contrast, the MELCOR simulation exhibits a consistent decrease in the downcomer
water level, although with periods of lower depletion rate after T+3 hours - This difference is due to the different manner in which heat transfer from core debris is
modeled in the two computer codes o The MAAP5 simulation exhibits a prolonged period over which negligible energy is
transferred from the core debris to the a) core shroud (radiative and conductive) and b) RPV gases/fluids (convective)—this can be seen in greater detail in Figure A-1, which shows an overall energy balance
o In fact, heat up of the downcomer water commences once the heat loss from the core debris to the core shroud becomes significant
o The steaming away of the downcomer water recommences around T+5 hours in Figure A-4, which is correlated with the time at which heat transfer from the core debris to core shroud becomes appreciable (see Figure A-1, above)37
37 Boil-off of downcomer water inventory does not truly cease in the MELCOR simulation, as shown in Figure A-4. The rate of downcomer water boil-off decreases around T+3 hours. This corresponds to the time at
A-9
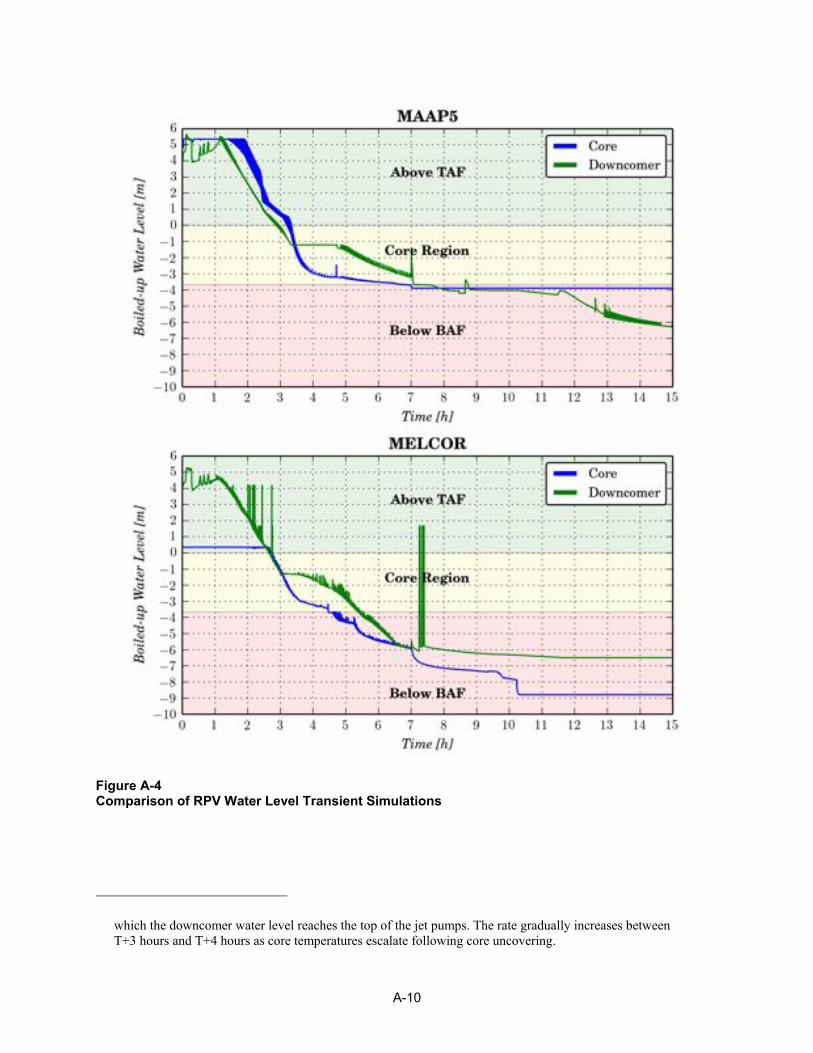
Figure A-4 Comparison of RPV Water Level Transient Simulations
which the downcomer water level reaches the top of the jet pumps. The rate gradually increases between T+3 hours and T+4 hours as core temperatures escalate following core uncovering.
A-10
A.3.3 Feedwater System Response The MAAP5 and MELCOR codes represent the feedwater system in an effective manner. Crude controllers are implemented to adjust the rate of feedwater injection to balance the flow out of the MSLs.
In this scenario, the feedwater system is assumed to operate for about one minute before shutdown. This corresponded to the time of Main Steam Isolation Valve (MSIV) closure. For simplicity, a feedwater transient is imposed as an RPV downcomer injection transient.
The rate of feedwater injection to the RPV is shown below in Figure A-5. This figure compares how the MAAP5 and MELCOR simulations represent the transient injection of feedwater into the RPV. Since the injection is an imposed boundary condition, Figure A-5 is intended to illustrate the alignment of this boundary condition.
Figure A-5 Feedwater Flow Rate
The associated cumulative mass of water injected into the RPV during feedwater operation is shown for both code simulations in Figure A-6. This represents the accumulated mass of feedwater injection injected from the start of the accident to a later time t.
A-11
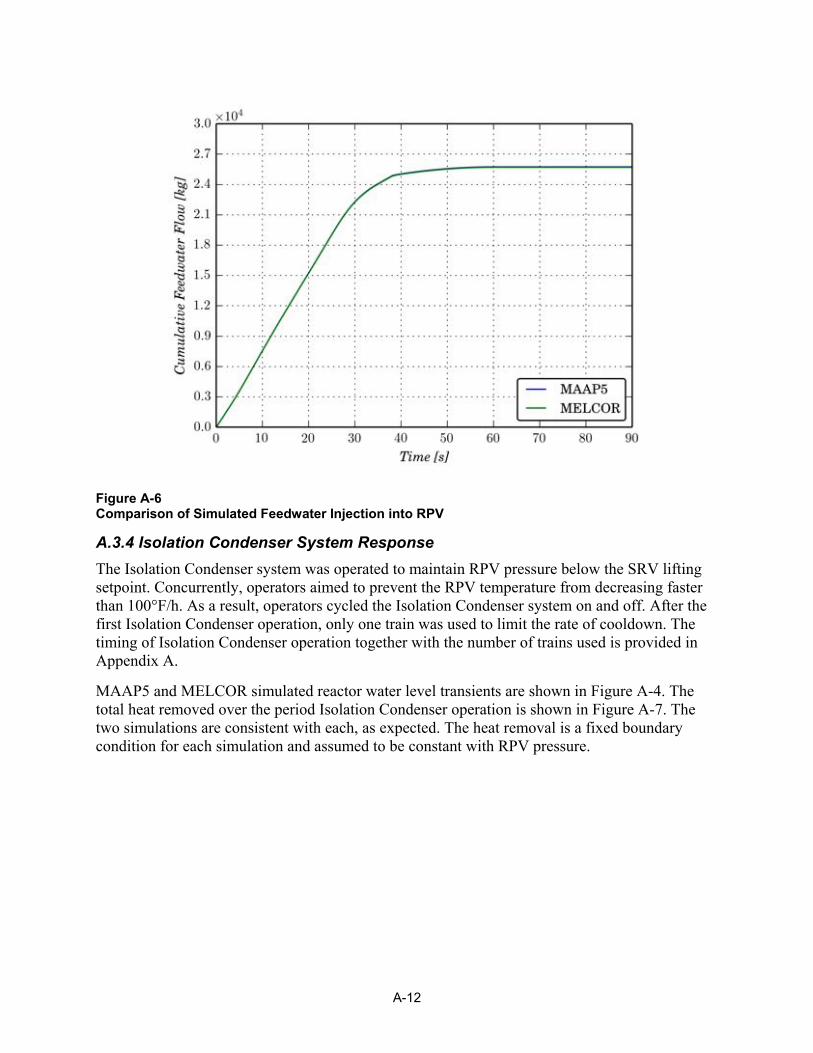
Figure A-6 Comparison of Simulated Feedwater Injection into RPV
A.3.4 Isolation Condenser System Response The Isolation Condenser system was operated to maintain RPV pressure below the SRV lifting setpoint. Concurrently, operators aimed to prevent the RPV temperature from decreasing faster than 100°F/h. As a result, operators cycled the Isolation Condenser system on and off. After the first Isolation Condenser operation, only one train was used to limit the rate of cooldown. The timing of Isolation Condenser operation together with the number of trains used is provided in Appendix A.
MAAP5 and MELCOR simulated reactor water level transients are shown in Figure A-4. The total heat removed over the period Isolation Condenser operation is shown in Figure A-7. The two simulations are consistent with each, as expected. The heat removal is a fixed boundary condition for each simulation and assumed to be constant with RPV pressure.
A-12
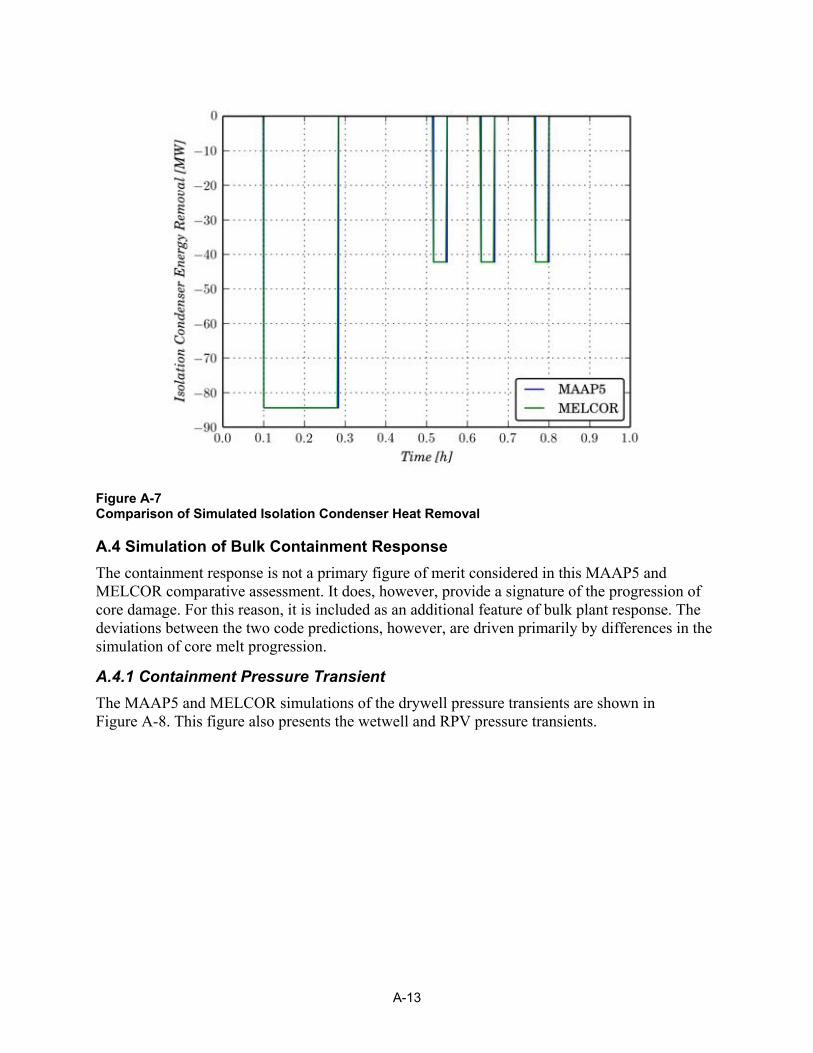
Figure A-7 Comparison of Simulated Isolation Condenser Heat Removal
A.4 Simulation of Bulk Containment Response The containment response is not a primary figure of merit considered in this MAAP5 and MELCOR comparative assessment. It does, however, provide a signature of the progression of core damage. For this reason, it is included as an additional feature of bulk plant response. The deviations between the two code predictions, however, are driven primarily by differences in the simulation of core melt progression.
A.4.1 Containment Pressure Transient The MAAP5 and MELCOR simulations of the drywell pressure transients are shown in Figure A-8. This figure also presents the wetwell and RPV pressure transients.
A-13
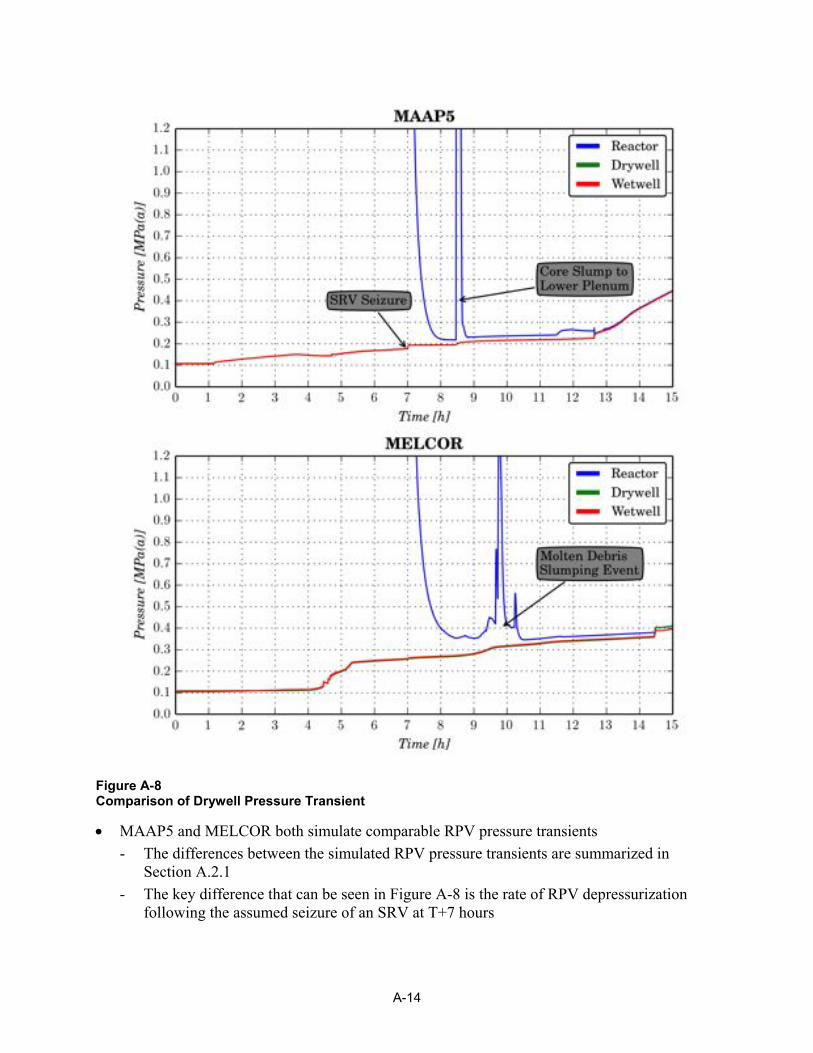
Figure A-8 Comparison of Drywell Pressure Transient
• MAAP5 and MELCOR both simulate comparable RPV pressure transients - The differences between the simulated RPV pressure transients are summarized in
Section A.2.1 - The key difference that can be seen in Figure A-8 is the rate of RPV depressurization
following the assumed seizure of an SRV at T+7 hours
A-14
o The additional energy rejected to RPV gases in the MELCOR simulation is the primary cause of this discrepancy
• Both simulations exhibit similar drywell pressurization transients prior to the onset of core damage after T+3 hours - Decay heat rejected to the containment as steam is condensed in the suppression pool
during this period - Figure A-9, below, shows the bulk pool temperature during this period—the significant
subcooling of the suppression pool water prior to core damage ensures reasonably effective steam condensation prior to core damage
• Following the onset of core damage beyond about T+3.5 hours, MELCOR simulates more significant pressurization of containment than MAAP5 - As discussed in relation to the RPV steam dome gas temperature (Section A.3.1), the
enhanced pressurization simulated by MELCOR is due to increased decay and chemical energy dissipation from the core debris
- In fact, the greater heat transfer surface area (see Appendix B, for further discussion) of the core debris results in larger generation of oxidation energy in the MELCOR simulation
- Enhanced energy generation and dissipation from the core debris into the RPV gases is the primary reason for enhanced pressurization following core damage in the MELCOR simulation
• Prior to RPV lower head breach (T+13 hours in the MAAP5 simulation and T+14 hours in the MELCOR simulation), both simulations identify relatively modest pressurization of containment - Prior to RPV lower head breach, however, the rate of containment pressurization is
somewhat higher in the MELCOR simulation, relative to the MAAP5 simulation - The primary cause of strong containment pressurization in the MELCOR simulation is
the generation of hydrogen during the period T+4.2 hours and T+5.2 hours - The MAAP5 simulation exhibits far less in-vessel hydrogen generation than the
MELCOR simulation - The different partial pressures of hydrogen in the two simulations accounts for the nearly
100 kPa(d) in containment pressure found in the two code simulations • In fact, it is not until T+13 hours in the MAAP5 simulation that the containment pressure
begins to increase sharply - This corresponds to the onset of aggressive core-concrete interaction and generation of
large amounts of noncondensable gases - The subject of core-concrete interaction is not treated in detail in this phase of the
MAAP5-MELCOR comparative study - However, it is useful to note that, in the MAAP5 simulation, the pressurization of
containment is most severe following the onset of core-concrete interaction o As discussed further in Appendix B, the manner in which the MAAP5 core debris
geometry is represented precludes significant amounts of hydrogen generation prior to the onset of core-concrete interaction
A-15
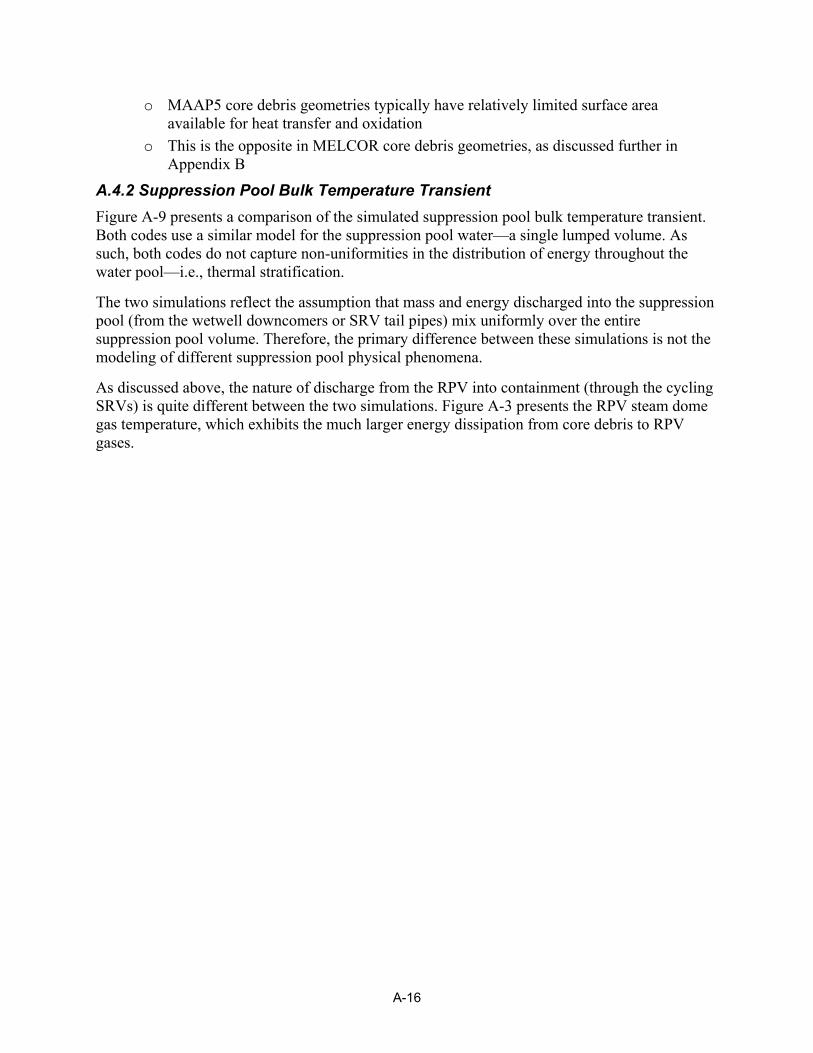
o MAAP5 core debris geometries typically have relatively limited surface area available for heat transfer and oxidation
o This is the opposite in MELCOR core debris geometries, as discussed further in Appendix B
A.4.2 Suppression Pool Bulk Temperature Transient Figure A-9 presents a comparison of the simulated suppression pool bulk temperature transient. Both codes use a similar model for the suppression pool water—a single lumped volume. As such, both codes do not capture non-uniformities in the distribution of energy throughout the water pool—i.e., thermal stratification.
The two simulations reflect the assumption that mass and energy discharged into the suppression pool (from the wetwell downcomers or SRV tail pipes) mix uniformly over the entire suppression pool volume. Therefore, the primary difference between these simulations is not the modeling of different suppression pool physical phenomena.
As discussed above, the nature of discharge from the RPV into containment (through the cycling SRVs) is quite different between the two simulations. Figure A-3 presents the RPV steam dome gas temperature, which exhibits the much larger energy dissipation from core debris to RPV gases.
A-16

Figure A-9 Comparison of Suppression Pool Temperature Transient
Each code simulates different discharges of mass and energy into the suppression pool as a result of deviations in core melt progression simulation. As noted for the drywell and wetwell pressure transient simulations, deviations in MAAP5 and MELCOR simulations of the suppression pool bulk temperature transient are a signature of differences in modeling of core melt progression.
The MAAP5 simulation estimates a lower suppression pool temperature transient prior to RPV lower head breach. This reflects the lower amount of energy MAAP5 simulates to be transported
A-17
away from the core debris during the course of in-vessel core melt progression. Thus, the MELCOR simulation estimates a higher bulk pool temperature over the course of in-vessel core damage progression. The difference in suppression pool bulk temperature is about 20 K prior to SRV seizure.
The temperature difference between the MAAP5 and MELCOR simulated suppression pool bulk water temperatures persists even after SRV seizure. The temperature difference decreases after the point at which core slump to the lower plenum is simulated to occur in the MAAP5 simulation. The suppression pool temperature difference between the MELCOR and MAAP5 simulations decreases to 10 K, with the MELCOR simulation estimating a higher pool temperature.
This is consistent with a much larger mass of core material simulated to slump into the lower plenum in the MAAP5 simulation. By contrast, MELCOR simulates a more gradual slumping of largely solid core debris into the lower plenum (core ring by core ring). This is discussed further in Appendix C.
A-18

B MAAP AND MELCOR SIMULATION OF CORE MELT PROGRESSION B.1 Introduction This appendix presents a comparison of MAAP5 and MELCOR simulation of core melt progression. This discussion focuses on how the two codes simulate the degradation of the core prior to slumping into the lower plenum.
The appendix is structured as follows.
• Modeling of core failure modes - Relevant physics for representing core failure modes - MAAP5 and MELCOR modeling of core failure modes
• Modeling of degraded core material relocation processes - Relevant physics for representing degraded core material relocation - MAAP5 and MELCOR modeling of degraded core material relocation
• Comparison of MAAP5 and MELCOR simulation results - Representation of core structure failure conditions and timing - Representation of simulated degraded core geometry
The focus of this appendix is on contrasting the types of degraded core geometries simulated by the MAAP5 and MELCOR integrated core degradation calculations.
B.2 Overview of MAAP5 and MELCOR Abstractions of Core Degradation The degradation of a reactor core is modeled in considerable detail by MAAP5 and MELCOR. Both codes simplify the complicated physical processes once core structures begin to fail through either melting or yielding.
The degradation of a core in principle obeys a number of partial differential equations that reflect the fundamental conservation laws for mass, momentum and energy. Following the onset of core damage, however, the number of degrees of freedom in the problem grows considerably. The melting and dislocation of core material out of the original core geometry generates a large number of debris components (i.e., rubble). Each of these must be accounted for in the overall mass, momentum and energy balance for the core. They further interact with each other through mechanical, momentum and energy transport processes.
Explicit treatment of such a large number of interacting degrees of freedom is a physically intractable problem. While computational modeling of the partial differential equations representing the multitude of degrees of freedom is possible, the solutions are not well-posed. Physically, the nature of interactions between such large numbers of degrees of freedom cannot be uniquely quantified to permit deterministic modeling. As in the theory of statistical physics
B-1
for many-body systems, a range of solutions for each of the system’s degrees of freedom is possible.
As in the case of statistical physics, however, it is actually not the exact state of each degree of freedom that is of relevance. The quantities of interest, from the perspective of severe accident safety evaluations, depend primarily on the overall transport of mass and energy out of the core region into the lower/upper plenum or containment. Numerically these types of quantities, such as total hydrogen displaced into containment, are averages over all the degrees of freedom that makeup the overall (i.e., macroscopic) state of the degraded core. These average quantities tend to reflect gross properties of the degraded core, such as the average surface area exposed to steam.
This stems a fundamental principle of macroscopic physics: the quantities that represent the macroscopic state of a system reflect a limited number of microscopic, stiff degrees of freedom. Such stiff degrees of freedom constrain the average, macroscopic behavior of the system. The other degrees of freedom principally contribute to small fluctuations about the system’s average macroscopic behavior (i.e., local turbulence in a moving fluid).
MAAP5 and MELCOR modeling of core degradation reflect this fundamental principle of macroscopic physics. Each code has adopted a modeling approach that abstracts the complicated processes arising upon core degradation into a number of stiff “degrees of freedom”. These are chosen based on quantitative and qualitative evaluations of their relative importance on determining the macroscopic state of the degraded core.
The selection of these degrees of freedom, however, is not unique. Typically, in macroscopic physics, experiments play a critical role in identifying the dominant modes of macroscopic behavior. Unlike most problems in macroscopic physics, there are limited experiments available that can be used to characterize the macroscopic behavior of a degraded core. With the exception of TMI-2, the experiments that are available for assessing degraded core behavior are separate effects experiments. These are not at reactor scale and limited to single assembly degradation. As a result, there is limited information available to assess the types of macroscopic processes that govern the behavior of a degraded core.
This section provides a description of how each code has selected the critical degrees of freedom to represent core debris relocation processes. It is organized as follows.
• Description of degraded core components that capture the key types of degraded core structures and morphologies
• Selection and modeling of dominant mass and energy transport processes during the - Initial phases of core degradation, spanning the period of core damage onset to the
formation of molten pools - Late phases of core degradation, spanning the period of molten pool formation to large
scale slumping to the plenum
B-2

B.2.1 MAAP5 Degraded Core Components and Morphologies MAAP5 represents the degraded core in terms of a number of core nodes, representing a volume from the original core geometry. A core volume is comprised of a number of fuel assemblies and control blades, which can be adjusted based on user input to the code.
Typical MAAP5 practice is to discretize the core so that all radial rings occupy the same fraction of total core volume. In this study, the volume fraction of radial rings has been altered to conform to that used in the comparable MELCOR model.
In addition, MAAP5 does not model the variation of power between fuel assemblies in a ring. The three-dimensional core is simplified to a two-dimensional core with radial and axial degrees of freedom. This is an important assumption; it has the potential to result in more coherent melting of material within a ring than would occur by accounting for assembly-to-assembly power variations in a ring.
Each core node is characterized by the
• Mass and energy of different core materials in the volume • The morphology of the agglomeration of debris in the volume
These distinct features are discussed in more detail below.
B.2.1.1 Core Volume Component Mass and Energy The total mass and energy of a core volume is the total for all materials in the volume. The BWR material groups considered by MAAP5 constituting core debris are as follows.
• UO2 arising from degraded fuel pellets • Zircaloy, arising from degraded fuel cladding or fuel canisters • U-Zr-O eutectic mixtures, which is formed from the dissolution of UO2 fuel by molten
Zircaloy • Stainless steel, arising from upper or lower core structures as well as the stainless steel clad
of control blades • B4C incorporated into degraded core debris upon failure of control blades
B.2.1.2 Core Volume Morphology Each core volume is considered to be in one of five types of core morphologies.
• Type 1 - Fuel pin configuration • Type 2 - Collapsed fuel pin configuration, which represents a rubble bed of solid, particulate
debris in with the particulates assumed to be similar in size and shape to fuel pellets • Type 3 - Thickened fuel pin configuration, which is formed from the freezing of molten
material on fuel rods • Type 4 - Blocked, degraded core configuration through which molten debris and gas flow is
not possible because of limited hydraulic diameter • Type 5 - Molten debris pool
B-3

MAAP5 tracks how the accumulation of debris inside core nodes reduces the effective free volume. As more debris accumulates in a core node, there is less open area through which fluids can flow. A node thus becomes increasingly resistant to the flow of fluids, such as water or steam and molten core debris (i.e., the hydraulic diameter for the node decreases). At a certain limiting free volume, MAAP5 assumes that the node is effectively blocked to flow. This limiting free volume is a user-defined parameter. This marks the transition of a core node to Type 4 morphology (a blocked, degraded core node).38
This has a significant effect on the heat transfer from debris in a core node. When considered fully blocked, there can be no gas flow through the node and the heat transfer is governed by conduction to the outer surface of the core node. Conduction-limited heat transfer thus limits the extent to which decay heat and stored energy can be rejected to surrounding RPV fluids from Type 4 core debris.
Prior to formation of a completely blocked node, RPV fluids (and molten material) can relocate through a node of either Types 1, 2 or 3. The magnitude of flow through an open node is limited by the hydraulic diameter, which decreases with decreasing node free volume (i.e., decreasing porosity). The heat transfer to RPV fluids passing through a core node is affected by the nodal porosity by
• The decrease in the fluid flow with decreasing porosity (i.e., the effective flow resistance of the node increases with decreasing porosity through a decrease in the hydraulic diameter)
• The modification of the overall convective heat transfer coefficient between debris and RPV fluids with decreasing porosity (i.e., the decrease in the hydraulic diameter)
B.2.2 MELCOR Degraded Core Components and Morphologies MELCOR represents the core region in terms of a number of nodes or volumes. The modeling approach is similar to MAAP5. The number of nodes can be adjusted by the user. MELCOR best practice has adopted five radial rings and 12 axial rows for the region at and above the lower core plate.
MELCOR best practice identifies the 5 radial rings differently from MAAP5 typical practice. Each ring is comprised of a discrete number of fuel assemblies that are in close proximity and exhibit relatively similar power fractions. This is different from typical MAAP5 practice, where the fraction of volume in each radial ring is kept constant. As noted above, however, the MAAP5 model used in this study has been modified to use a similar discretization of core volumes as the MELCOR model.
As with MAAP5, the three dimensional core is simplified by assuming constant power within each axial row of a radial ring.
38 MAAP5 modeling of core geometry is ultimately supported by integral validation exercises against TMI-2 [B-7].
B-4
B.2.2.1 Core Volume Materials MELCOR models the following materials.
• UO2 • Zircaloy • Stainless steel • ZrO2 • Stainless steel oxide • B4C
B.2.2.2 Core Volume Components Each core volume is partitioned between the following components.
• Intact core components - Fuel - Fuel cladding - Fuel canister - portion not adjacent to control blade - Fuel canister - portion adjacent to control blade
• Particulate debris that results from the collapse of fuel rods or other core components - Inside the fuel channels - Inside the fuel channel bypass regions
• Structural components - Supporting - A structure that is capable of supporting components of the core (e.g., core
plate) - Non-supporting - A structure that cannot support other core structures (e.g., a control
blade) • Oxide molten pool
- Inside the fuel channel region - Inside the fuel channel bypass region
• Metallic molten pool - Inside the fuel channel region - Inside the fuel channel bypass region
MELCOR considers an additional component, which is termed conglomerate debris. This represents debris that has refrozen on an intact core structure. It is treated as part of the intact core structure on which it has solidified.39 Once a core structure has collapsed, molten debris cannot solidify on it to form a conglomerate.
39 Debris is excluded from refreezing directly on intact fuel in MELCOR.
B-5

Particulate debris is formed from the failure of the different core structures. For fuel rods this can occur when
• Fuel rods persist at elevated temperatures for an extended period of time that creep failure would be likely
• The fuel cladding metal thickness is reduced below a critical thickness by the effects of oxidation and melt erosion
Non-fuel rod structures are assumed to collapse into a particulate debris bed when the remaining metal thickness (either Zircaloy or stainless steel) decreases below a critical thickness. As in the case of fuel cladding, the loss of metal thickness can occur due to oxidation and melt erosion.
For both fuel and non-fuel structures, the failure of a supporting structure will result in the supported structure collapsing into a particulate debris bed.
Two types of particulate debris are considered in MELCOR
• Particulate debris in the channels • Particulate debris in the channel and core bypasses
The diameter of particulate debris can be different for these two particulate debris beds.
Failed solid debris is considered part of a particulate debris bed within MELCOR. Debris that solidifies on failed solid debris forms part of the particulate debris bed. This has the effect of decreasing the free volume (i.e., porosity) of the solid debris bed. The resistance to fluid flow through particulate debris is thus calculated to increase with decreasing core node free volume.
Unlike MAAP5, however, MELCOR does not allow a particulate debris bed to become completely blocked to fluid flow. A limiting porosity is imposed in MELCOR calculations such that the free volume inside the particulate bed can never decrease below this limiting value. Thus, unlike MAAP5, MELCOR assumes that flow through a particulate bed continues to occur.
This assumption in MELCOR also has the effect of maintaining heat transfer from core debris to fluids in the RPV (e.g., steam). Since a particulate debris bed has a large surface area, MELCOR calculates a significant amount of heat transfer between particulate debris and RPV fluids passing through the node. Typically, the magnitude of heat transfer in this type of configuration is sufficient to equilibrate the core debris in the node with the RPV fluid passing through. This is quite distinct from MAAP5, in loss of nodal free volume results in a decrease in hydraulic diameter and an associated decrease in heat transfer to RPV fluids.
MELCOR parameterizes a particulate debris bed in terms of the particle diameter. This is distinct from the MAAP5 parameterization in terms of hydraulic diameter. The MAAP5 calculation effectively incorporates the concept of connectedness in a particulate debris bed - i.e., how likely is it for a path to exist from an entry point to an exit point in a particulate bed.
MELCOR assumes an incoherent melting of core debris around a ring. In this abstraction of the degraded core morphology, there will always be numerous paths through a particulate debris bed for gas to continue to flow through the bed. RPV fluids will always be able to flow upward, to some extent, through a core ring despite loss of free volume at an axial level.
B-6

MAAP5 by contrast assumes a more coherent degradation of core debris around a ring. The extent of blockage of a core node is representative of the entire core around the axial level in the associated ring. In this abstraction of degraded core morphology, the loss of free volume at an axial level of a core ring results in a limitation of axial flow through the ring.
B.3 MAAP5 and MELCOR Modeling of Core Failure Modes B.3.1 Degradation of Control Blade Structure
B.3.1.1 Description of Failure Mode The B4C control blade in a BWR is constructed from B4C pellets clad in stainless steel sheath filled with helium. When the control blade heats up to 1500 K, a eutectic interaction between the B4C and stainless steel begins. In addition, the stainless steel control blade cladding can interact with the Zircaloy fuel canister wall. This is a eutectic interaction that also commences around 1500 K.
These interactions lead to early liquefaction of control blades and fuel canisters. Control blade and fuel canister failures commence around 1500 K rather than the melting points of stainless steel (1700 K) and Zircaloy (2125 K).
Following liquefaction of a portion of the control rod, it drains down the inner and outer surfaces of the stainless steel clad below the location of melting. There is usually enough stainless steel to liquefy the majority of B4C in a control blade. The liquefied material candles downward until it loses enough heat to lower control blade and fuel canister structures. It will then refreeze within the interstitial flow channels.
B.3.1.2 Comparison of MAAP5 and MELCOR Modeling of Failure Mode MAAP5 Modeling:
MAAP5 models the eutectic interactions between the control blade and the fuel canister.
• The model begins to calculate dissolution of B4C once the control blade temperature exceeds 1500 K, with the dissolved B4C entering into a B-Zr-SS-C-O40 mixture
• The interaction between B4C and stainless steel (or oxidized stainless steel) is assumed to occur first
• The chemical mixture formed through the B4C and stainless steel interaction is then assumed to interact with the fuel canister
• The fuel canister material that interacts with the dissolved control blade material is assumed to be at the B4C-stainless steel eutectic temperature
• The fuel canister material that does not interact with the dissolved control blade material is assumed to remain at the temperature of the fuel canister
40 Note that SS stands for stainless steel
B-7
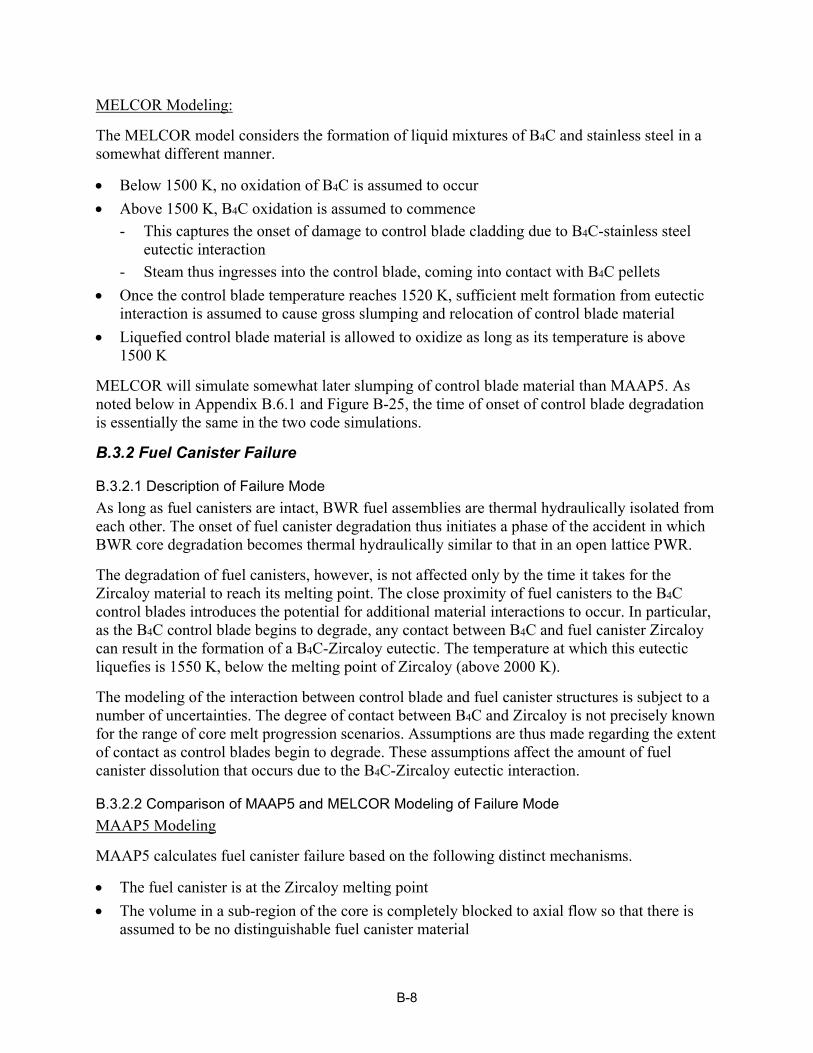
MELCOR Modeling:
The MELCOR model considers the formation of liquid mixtures of B4C and stainless steel in a somewhat different manner.
• Below 1500 K, no oxidation of B4C is assumed to occur • Above 1500 K, B4C oxidation is assumed to commence
- This captures the onset of damage to control blade cladding due to B4C-stainless steel eutectic interaction
- Steam thus ingresses into the control blade, coming into contact with B4C pellets • Once the control blade temperature reaches 1520 K, sufficient melt formation from eutectic
interaction is assumed to cause gross slumping and relocation of control blade material • Liquefied control blade material is allowed to oxidize as long as its temperature is above
1500 K
MELCOR will simulate somewhat later slumping of control blade material than MAAP5. As noted below in Appendix B.6.1 and Figure B-25, the time of onset of control blade degradation is essentially the same in the two code simulations.
B.3.2 Fuel Canister Failure
B.3.2.1 Description of Failure Mode As long as fuel canisters are intact, BWR fuel assemblies are thermal hydraulically isolated from each other. The onset of fuel canister degradation thus initiates a phase of the accident in which BWR core degradation becomes thermal hydraulically similar to that in an open lattice PWR.
The degradation of fuel canisters, however, is not affected only by the time it takes for the Zircaloy material to reach its melting point. The close proximity of fuel canisters to the B4C control blades introduces the potential for additional material interactions to occur. In particular, as the B4C control blade begins to degrade, any contact between B4C and fuel canister Zircaloy can result in the formation of a B4C-Zircaloy eutectic. The temperature at which this eutectic liquefies is 1550 K, below the melting point of Zircaloy (above 2000 K).
The modeling of the interaction between control blade and fuel canister structures is subject to a number of uncertainties. The degree of contact between B4C and Zircaloy is not precisely known for the range of core melt progression scenarios. Assumptions are thus made regarding the extent of contact as control blades begin to degrade. These assumptions affect the amount of fuel canister dissolution that occurs due to the B4C-Zircaloy eutectic interaction.
B.3.2.2 Comparison of MAAP5 and MELCOR Modeling of Failure Mode MAAP5 Modeling
MAAP5 calculates fuel canister failure based on the following distinct mechanisms.
• The fuel canister is at the Zircaloy melting point • The volume in a sub-region of the core is completely blocked to axial flow so that there is
assumed to be no distinguishable fuel canister material
B-8

• Eutectic interaction between the B-SS-C-O eutectic mixture and Zircaloy fuel canister occurs
The last mechanism can lead to the dissolution of fuel canister material at temperatures below Zircaloy melting. The potential for this type of eutectic dissolution of the fuel canister to occur arises once the control blade or fuel canister reaches a temperature of 1500 K. The dissolution of the Zircaloy fuel canister by this mechanism is determined as follows.
• The amount of control blade material in the interstitial region between fuel canisters must be high enough for it to come into contact with the fuel canister
• The excess energy in control blade or Zircaloy fuel canister material determined the amount of material that enters into a eutectic mixture of B4C, stainless steel and Zircaloy - The temperature of either the control blade or Zircaloy fuel canister material must be
above 1500 K to facilitate eutectic dissolution of these materials - Equal numbers of moles of B4C, stainless steel and Zircaloy are assumed to dissolve into
a eutectic mixture B-Zr-SS-C-O MELCOR Modeling
MELCOR does not explicitly model the eutectic interaction between control blade material and the Zircaloy fuel canister.41 As a result failure of this structure is likely to occur around the Zircaloy melting point. This will be examined further below in the comparison of simulation results.
B.3.3 Fuel Clad Melting This is a failure mechanism that contributes to fuel assembly degradation.
B.3.3.1 Description of Failure Mode The melting of fuel cladding is one means by which early loss of fuel geometry can occur. As cladding melts, it relocates downwards along the fuel rod. The solid surfaces of the fuel rod below the point of clad melt formation will remove stored energy from the molten clad run down. This can result in either
• Melting of the solid fuel cladding material, or • Freezing of the molten material on the surface of the solid fuel cladding material.
41 MELCOR best practice modeling adjusts the melting temperature of different materials in the core to capture eutectic interactions. This approach prevents complete representation of all eutectic interactions. In particular, the eutectic interaction between stainless steel and Zr cannot be captured in this manner. This eutectic interaction is one way by which early failure of fuel canisters occurs in a BWR. The early liquefaction of control blades (by the eutectic interaction between B4C and stainless steel) can bring high temperature stainless steel into contact with fuel canister material. MELCOR, however, applies the user input Zr melting temperature to all material structures in the core, including fuel cladding. Adjustment of the melting point of Zr to capture the formation of molten stainless steel-Zr eutectics cannot be done without resulting in unphysical modifications to overall core melt progression. MELCOR thus simulations a higher temperature and delayed degradation of fuel canisters when compared with MAAP5. This is discussed further in Appendix B.6.2.
B-9

Molten material freezing will occur at lower points of the fuel rod due to lower decay heat levels in and loss of stored energy in the molten run down to the lower portion of the fuel assembly. The build-up of re-solidified material tends to reduce the open spaces between the fuel rods. This increases the volume to heat transfer surface area for the conglomerated debris.
Thus, fuel cladding melting and run down (i.e., a candling process) is one means by which fuel assemblies can lose their coolable geometry. This mechanism, however, is not always the primary means by which fuel assemblies can lose coolable geometry. The melting of fuel cladding typically occurs when the rate of clad heat up is sufficiently high to prevent formation of a protective ZrO2 oxide crust on top of the unoxidized Zircaloy [B-1].
• For sufficiently high rates of fuel cladding heatup (i.e., greater than about 1 K/s), the Zircaloy cladding will melt prior to a protective ZrO2 layer being formed - The formation of molten Zircaloy occurs at a rate faster than diffusion of steam into the
cladding can occur to participate in cladding oxidation • For lower rates of fuel cladding heat up (i.e., less than 1 K/s), a protective ZrO2 layer forms
around the cladding that has a higher melting point than the cladding itself - This prevents the candling of molten Zircaloy cladding and/or fuel - Candling can eventually occur when this crust fails under prolonged high temperatures
and attack by a molten mix of a Zr-UO2 eutectic The formation of a protective oxide layer is critical to preventing the early relocation of molten cladding into the flow channels of a fuel assembly. Under this situation, the formation of blockages (i.e., conglomeration of refrozen cladding material) to flow through a fuel assembly is delayed.
As a result, there can be a significant difference between the extents of initial fuel cladding melting in intact fuel assemblies across the core.
• Lower powered fuel assembly cladding heats up at a slower rate and thus a protective oxide layer is more likely to form - These lower powered fuel assemblies are thus more likely to remain open to steam flow
through their flow channels for a longer period of time • Higher powered fuel assembly cladding tends to heat up at a faster rate, which promotes
more fuel clad melting - This causes more extensive loss of flow area through the fuel assemblies, reducing the
extent of interaction between steam and hot cladding Flow blockage formation in a fuel assembly tends to reduce the extent of steam flow. In turn, this results in less oxidation of fuel cladding and thus a lower amount of hydrogen generated in-vessel.
Fuel cladding temperature transient simulations are the primary code calculations that influence the potential for candling of fuel cladding. This is one mode by which fuel assembly flow blockage can occur. Thus, deviations between computer codes can have a significant impact on the simulation of the amount of hydrogen generated in-vessel.
B-10
B.3.3.2 Comparison of MAAP5 and MELCOR Modeling of Failure Mode MAAP5 Modeling:
MAAP5 models dissolution of fuel cladding through two distinct mechanisms.
• Melting of the fuel cladding when it reaches the Zircaloy melting point (2125 K) • Liquefaction of the cladding through the eutectic interaction between UO2 and Zircaloy as
well as ZrO2 and Zr
The eutectic dissolution of the fuel cladding can result in earlier failure of fuel cladding as well as fuel pellets. Two distinct eutectic interactions occur.
• UO2 and Zr eutectic interaction - Formation of molten Zircaloy in the interior of the fuel cladding is assumed to result in
contact between cladding and fuel material42 - This contact promotes a eutectic interaction between the UO2 and molten Zr to form U-
Zr-O and α-Zr(O) o The rate of dissolution is based on correlations developed by Hofmann et. al. [C-2] o This dissolution rate is limited by the solubility of UO2 in molten Zr, the availability
of UO2 and Zr and the contact area • α-Zr(O) and ZrO2 eutectic interaction
- The α-Zr(O) formed from the UO2 and Zr eutectic interaction diffuses toward the exterior of the fuel clad, coming into contact with ZrO2
- Oxygen uptake from the ZrO2 layer to the α-Zr(O) causes the α-Zr(O) layer to grow and the ZrO2 layer to shrink
- The rate of α-Zr(O) layer growth is determined based on correlations developed by Hofmann et. al. [B-2]
42 The contact area is based on the cylindrical geometry of the fuel rod, adjusted to account for the dissolution distance into the fuel pellet (see Figure B-1).
B-11

Figure B-1 Illustration of Fuel-Clad Interaction
MELCOR Modeling:
MELCOR uses a fixed fraction (0.2 kg UO2 dissolved per 1 kg of molten Zr) for the calculation of the dissolution of UO2 into molten Zr.
B.3.4 Fuel Melting This is a failure mechanism that contributes to fuel assembly degradation.
B.3.4.1 Description of Failure Mode The liquefaction of fuel can occur via the following mechanisms.
• The melting of UO2 at it melting temperature of 3113 K • The melting of the U-Zr-O ceramic at its melting point of 2850 K • The formation of α-Zr(O)/UO2 or U/UO2 monotectics • The liquefaction of solid UO2 due to eutectic interaction with molten Zr
The final fuel failure mechanism has been discussed above in Section C.2.3. The other mechanisms represent distinct melting points for different materials that can be formed during core melt progression.
Liquefaction of solid UO2 by molten Zr is the primary mechanism for fuel failure encountered during transients occurring at shutdown power levels. Events involving a rapid increase in power can have early fuel melting due to a rate of fuel enthalpy deposition in excess of the rate at which the energy generation can be conducted away to the cladding. These types of transients are beyond the scope of this study.
B-12
B.3.4.2 Comparison of MAAP5 and MELCOR Modeling of Failure Mode MAAP5 Modeling:
MAAP5 models the dominant fuel failure mechanisms.
• Melting of fuel at temperatures of 3113 K • Formation of U-Zr-O eutectics as discussed in Section C.2.3.2
MELCOR Modeling:
MELCOR uses a fixed fraction (0.2 kg UO2 dissolved per 1 kg of molten Zr) for the calculation of the dissolution of UO2 into molten Zr.
B.3.5 Fuel Cladding Rupture This is a failure mechanism that contributes to fuel assembly degradation.
B.3.5.1 Description of Failure Mode Fuel cladding rupture has a number of consequences.
• It is responsible for early release of fission products, primarily the gap inventory • Accelerated cladding oxidation by exposing internal clad surfaces to a steam environment • Relocation of molten U-Zr-O outside of the cladding , candling down the fuel rod
B.3.5.2 Comparison of MAAP5 and MELCOR Modeling of Failure Mode
MAAP5 Modeling:
Cladding rupture is characterized using a Larson-Miller like approach to limit the numerical sensitivity in the calculations to threshold effects. The occurrence of cladding rupture is assumed to occur based on the following criteria.
• A user-defined temperature is used to specify the condition at which cladding rupture will occur in 36 s if the cladding is maintained at this temperature
and
• The cladding oxidation fraction is below a user-specified fraction
MELCOR Modeling:
Models are implemented in MELCOR to allow for oxide layers to prevent relocation of molten U-Zr-O outside of the cladding. Molten material is assumed to be held-up within an oxide shell when
• The thickness of the oxide shell is greater than a critical value, typically above the Zr melting temperature
and
• The component temperature is less than a critical value
B-13

The MELCOR model is similar in principle to that implement in MAAP5.
B.3.6 Degradation of Fuel Assembly Structures
B.3.6.1 Description of Failure Mode The collapse of fuel assemblies is an alternate mechanism by which debris can form in the core region. After a sufficient period of oxidation, the mechanical response properties of fuel assemblies will degrade at elevated temperature.
There are a number of factors that contribute to the collapse of a fuel assembly structure.
• High temperatures resulting in the loss of metallic cladding through melting and oxidation • Thinning of the fuel rod dimension resulting in substantial lateral displacement • High temperatures with removal of the metallic cladding accompanied by collapse of an
adjacent fuel assembly • Rapid steam generation resulting in excessive vibration of an overheated fuel assembly • Loss of a core support structure or failure (collapse or melting) of a lower segment of the fuel
assembly43
B.3.6.2 Comparison of MAAP5 and MELCOR Modeling of Failure Mode Both MAAP5 and MELCOR represent fuel assembly collapse into a rubble bed of primarily fuel pins. This type of debris configuration is shown in Figure B-2.
Figure B-2 Illustration of Collapsed Fuel Assembly Debris (Fuel Pin Configuration)
43 The collapse of a fuel assembly due to rapid steaming during core recovery is not considered further below. This process is not relevant to the scenario evaluated in this study.
B-14
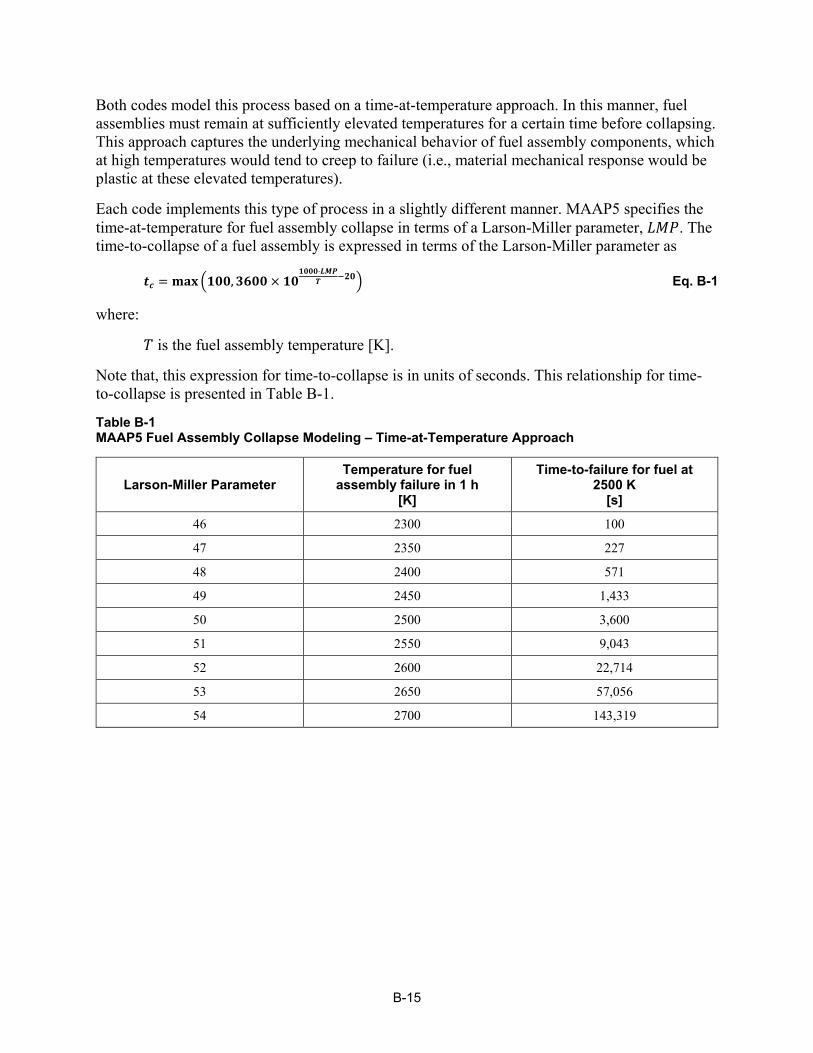
Both codes model this process based on a time-at-temperature approach. In this manner, fuel assemblies must remain at sufficiently elevated temperatures for a certain time before collapsing. This approach captures the underlying mechanical behavior of fuel assembly components, which at high temperatures would tend to creep to failure (i.e., material mechanical response would be plastic at these elevated temperatures).
Each code implements this type of process in a slightly different manner. MAAP5 specifies the time-at-temperature for fuel assembly collapse in terms of a Larson-Miller parameter, 𝐿𝐿𝐿𝐿𝐿𝐿. The time-to-collapse of a fuel assembly is expressed in terms of the Larson-Miller parameter as
𝒕𝒕𝒄𝒄 = 𝐦𝐦𝐦𝐦𝐦𝐦�𝟏𝟏𝟏𝟏𝟏𝟏,𝟑𝟑𝟑𝟑𝟏𝟏𝟏𝟏 × 𝟏𝟏𝟏𝟏𝟏𝟏𝟏𝟏𝟏𝟏𝟏𝟏⋅𝑳𝑳𝑳𝑳𝑳𝑳
𝑻𝑻 −𝟐𝟐𝟏𝟏� Eq. B-1
where:
𝑇𝑇 is the fuel assembly temperature [K].
Note that, this expression for time-to-collapse is in units of seconds. This relationship for time-to-collapse is presented in Table B-1.
Table B-1 MAAP5 Fuel Assembly Collapse Modeling – Time-at-Temperature Approach
Larson-Miller Parameter Temperature for fuel
assembly failure in 1 h [K]
Time-to-failure for fuel at 2500 K
[s]
46 2300 100
47 2350 227
48 2400 571
49 2450 1,433
50 2500 3,600
51 2550 9,043
52 2600 22,714
53 2650 57,056
54 2700 143,319
B-15
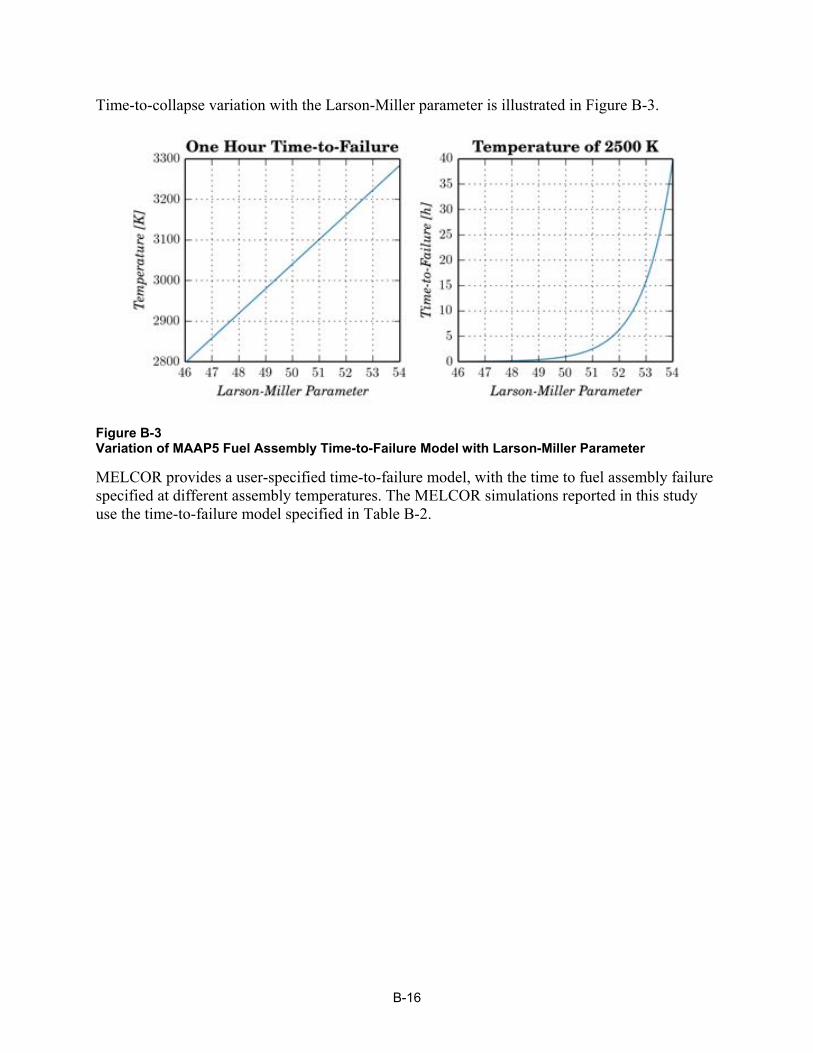
Time-to-collapse variation with the Larson-Miller parameter is illustrated in Figure B-3.
Figure B-3 Variation of MAAP5 Fuel Assembly Time-to-Failure Model with Larson-Miller Parameter
MELCOR provides a user-specified time-to-failure model, with the time to fuel assembly failure specified at different assembly temperatures. The MELCOR simulations reported in this study use the time-to-failure model specified in Table B-2.
B-16
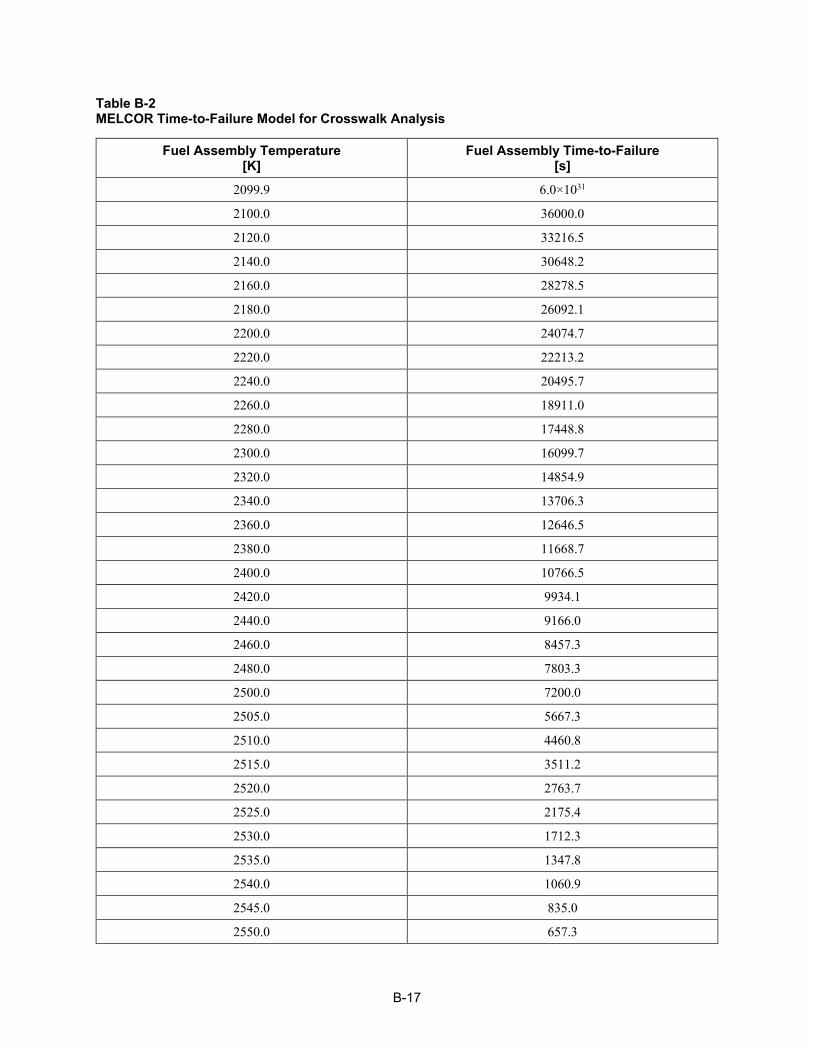
Table B-2 MELCOR Time-to-Failure Model for Crosswalk Analysis
Fuel Assembly Temperature [K]
Fuel Assembly Time-to-Failure [s]
2099.9 6.0×1031
2100.0 36000.0
2120.0 33216.5
2140.0 30648.2
2160.0 28278.5
2180.0 26092.1
2200.0 24074.7
2220.0 22213.2
2240.0 20495.7
2260.0 18911.0
2280.0 17448.8
2300.0 16099.7
2320.0 14854.9
2340.0 13706.3
2360.0 12646.5
2380.0 11668.7
2400.0 10766.5
2420.0 9934.1
2440.0 9166.0
2460.0 8457.3
2480.0 7803.3
2500.0 7200.0
2505.0 5667.3
2510.0 4460.8
2515.0 3511.2
2520.0 2763.7
2525.0 2175.4
2530.0 1712.3
2535.0 1347.8
2540.0 1060.9
2545.0 835.0
2550.0 657.3
B-17

Table B-2 (continued) MELCOR Time-to-Failure Model for Crosswalk Analysis
Fuel Assembly Temperature [K]
Fuel Assembly Time-to-Failure [s]
2555.0 517.3
2560.0 407.2
2565.0 320.5
2570.0 252.3
2575.0 198.6
2580.0 156.3
2585.0 123.0
2590.0 96.8
2595.0 76.2
2600.0 60.0
The MAAP5 and MELCOR fuel assembly time-to-failure listed in Table B-1 and Table B-2 are illustrated in Figure B-4.
These fuel assembly time-to-failure models are notably different. The MELCOR model was developed based on insights from the VERCORS experimental program [B-3]. The MAAP5 model is supported by integral validation against the TMI-2 event [B-7].
MAAP5 and MELCOR also trigger the collapse of a fuel assembly if a lower core support structure fails (e.g., the core support plate). Alternatively, melting or collapse of a lower segment of a fuel support structure will trigger the collapse of all upper axial levels of the fuel assembly.
B-18
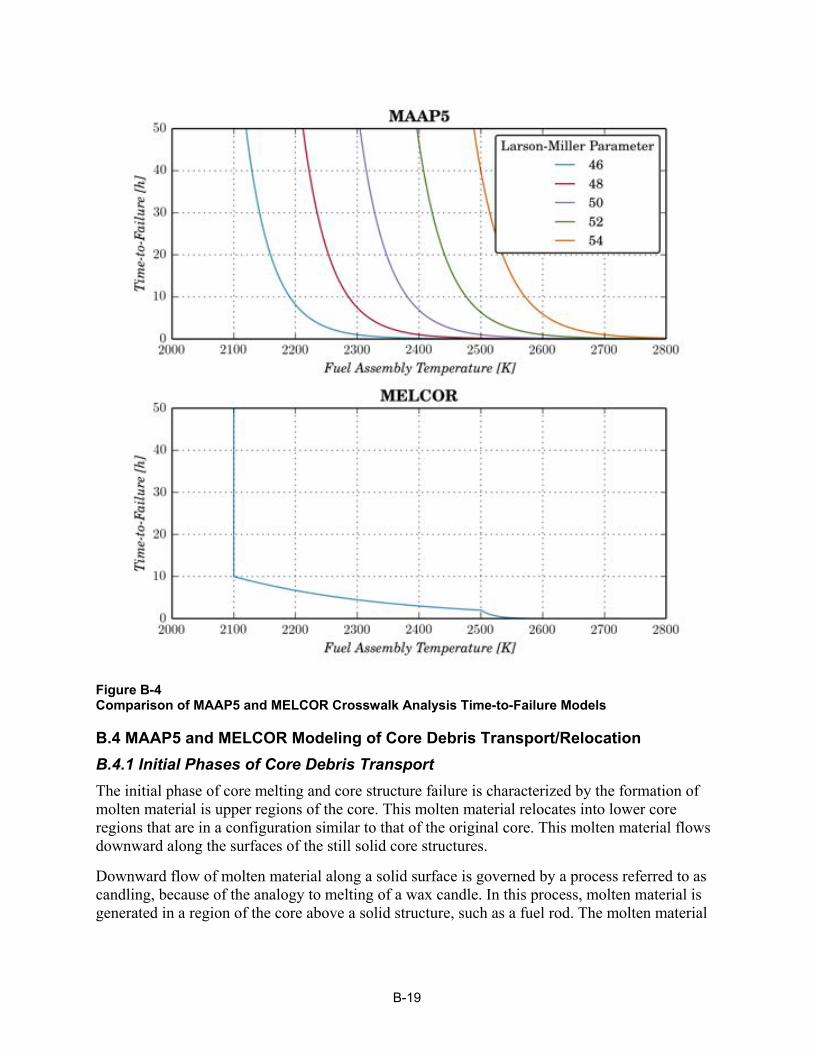
Figure B-4 Comparison of MAAP5 and MELCOR Crosswalk Analysis Time-to-Failure Models
B.4 MAAP5 and MELCOR Modeling of Core Debris Transport/Relocation B.4.1 Initial Phases of Core Debris Transport The initial phase of core melting and core structure failure is characterized by the formation of molten material is upper regions of the core. This molten material relocates into lower core regions that are in a configuration similar to that of the original core. This molten material flows downward along the surfaces of the still solid core structures.
Downward flow of molten material along a solid surface is governed by a process referred to as candling, because of the analogy to melting of a wax candle. In this process, molten material is generated in a region of the core above a solid structure, such as a fuel rod. The molten material
B-19
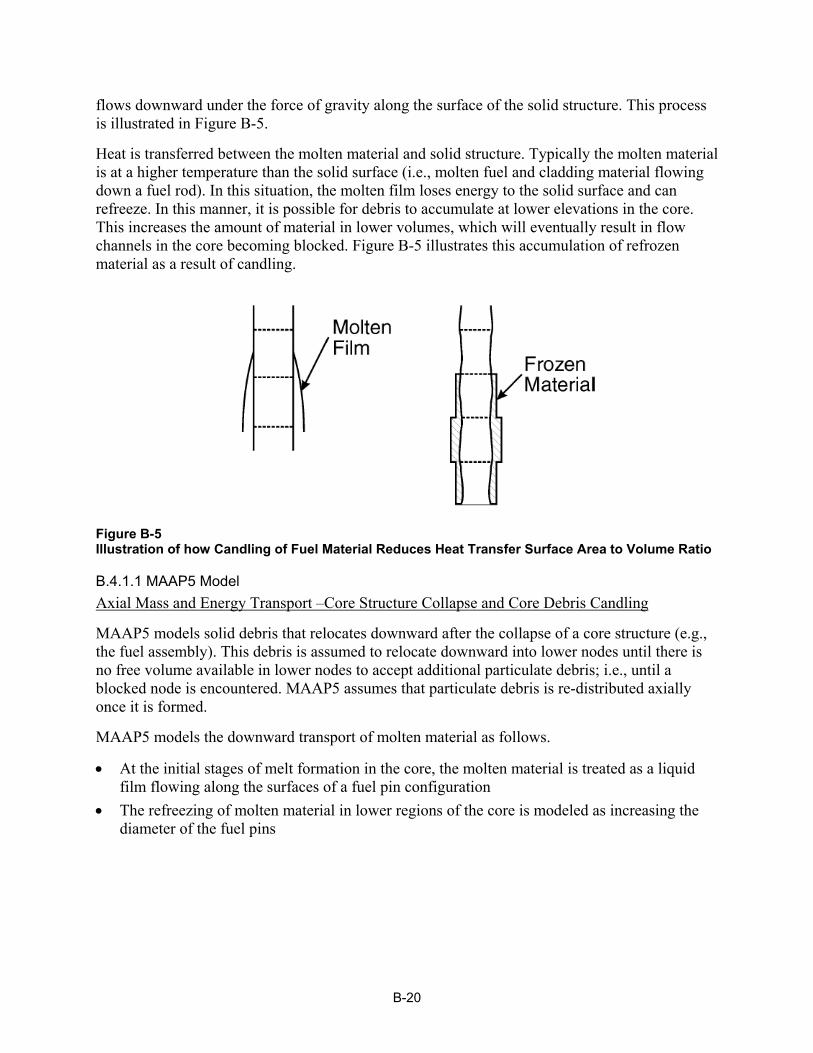
flows downward under the force of gravity along the surface of the solid structure. This process is illustrated in Figure B-5.
Heat is transferred between the molten material and solid structure. Typically the molten material is at a higher temperature than the solid surface (i.e., molten fuel and cladding material flowing down a fuel rod). In this situation, the molten film loses energy to the solid surface and can refreeze. In this manner, it is possible for debris to accumulate at lower elevations in the core. This increases the amount of material in lower volumes, which will eventually result in flow channels in the core becoming blocked. Figure B-5 illustrates this accumulation of refrozen material as a result of candling.
Figure B-5 Illustration of how Candling of Fuel Material Reduces Heat Transfer Surface Area to Volume Ratio
B.4.1.1 MAAP5 Model Axial Mass and Energy Transport –Core Structure Collapse and Core Debris Candling
MAAP5 models solid debris that relocates downward after the collapse of a core structure (e.g., the fuel assembly). This debris is assumed to relocate downward into lower nodes until there is no free volume available in lower nodes to accept additional particulate debris; i.e., until a blocked node is encountered. MAAP5 assumes that particulate debris is re-distributed axially once it is formed.
MAAP5 models the downward transport of molten material as follows.
• At the initial stages of melt formation in the core, the molten material is treated as a liquid film flowing along the surfaces of a fuel pin configuration
• The refreezing of molten material in lower regions of the core is modeled as increasing the diameter of the fuel pins
B-20
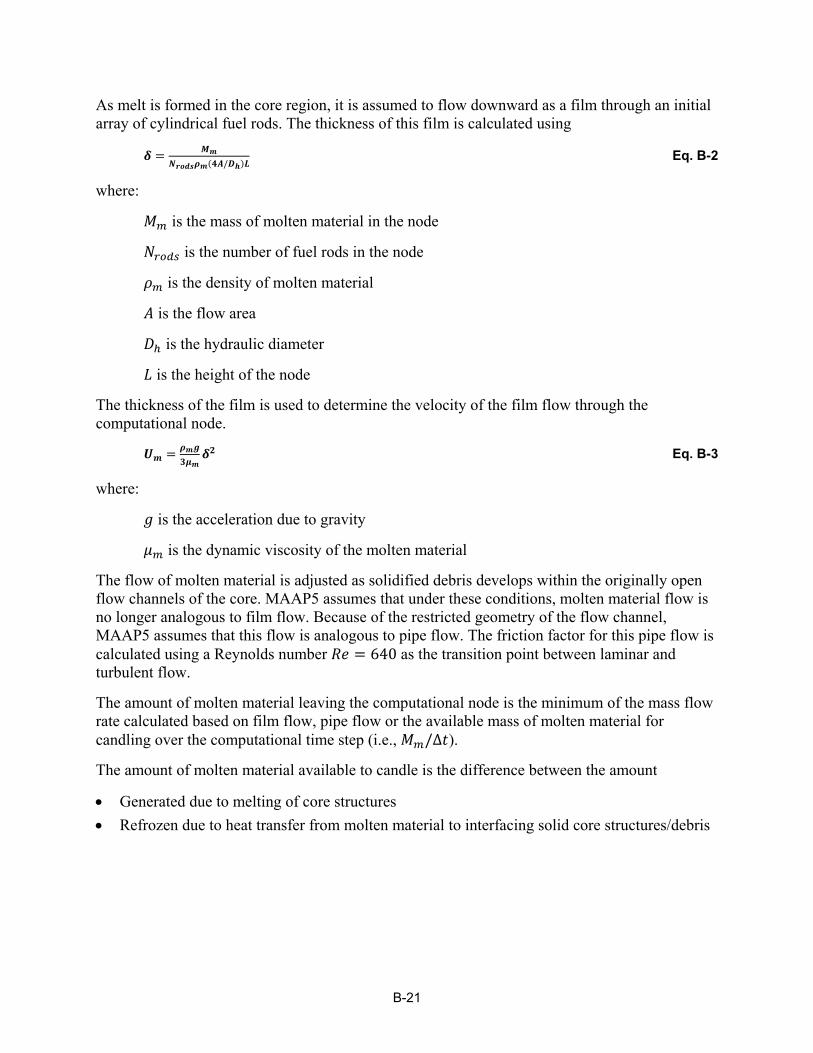
As melt is formed in the core region, it is assumed to flow downward as a film through an initial array of cylindrical fuel rods. The thickness of this film is calculated using
𝜹𝜹 = 𝑳𝑳𝒎𝒎𝑵𝑵𝒓𝒓𝒓𝒓𝒓𝒓𝒓𝒓𝝆𝝆𝒎𝒎(𝟒𝟒𝟒𝟒/𝑫𝑫𝒉𝒉)𝑳𝑳
Eq. B-2
where:
𝐿𝐿𝑚𝑚 is the mass of molten material in the node
𝑁𝑁𝑟𝑟𝑟𝑟𝑟𝑟𝑟𝑟 is the number of fuel rods in the node
𝜌𝜌𝑚𝑚 is the density of molten material
𝐴𝐴 is the flow area
𝐷𝐷ℎ is the hydraulic diameter
𝐿𝐿 is the height of the node
The thickness of the film is used to determine the velocity of the film flow through the computational node.
𝑼𝑼𝒎𝒎 = 𝝆𝝆𝒎𝒎𝒈𝒈𝟑𝟑𝝁𝝁𝒎𝒎
𝜹𝜹𝟐𝟐 Eq. B-3
where:
𝑔𝑔 is the acceleration due to gravity
𝜇𝜇𝑚𝑚 is the dynamic viscosity of the molten material
The flow of molten material is adjusted as solidified debris develops within the originally open flow channels of the core. MAAP5 assumes that under these conditions, molten material flow is no longer analogous to film flow. Because of the restricted geometry of the flow channel, MAAP5 assumes that this flow is analogous to pipe flow. The friction factor for this pipe flow is calculated using a Reynolds number 𝑅𝑅𝑅𝑅 = 640 as the transition point between laminar and turbulent flow.
The amount of molten material leaving the computational node is the minimum of the mass flow rate calculated based on film flow, pipe flow or the available mass of molten material for candling over the computational time step (i.e., 𝐿𝐿𝑚𝑚/Δ𝑡𝑡). The amount of molten material available to candle is the difference between the amount
• Generated due to melting of core structures • Refrozen due to heat transfer from molten material to interfacing solid core structures/debris
B-21
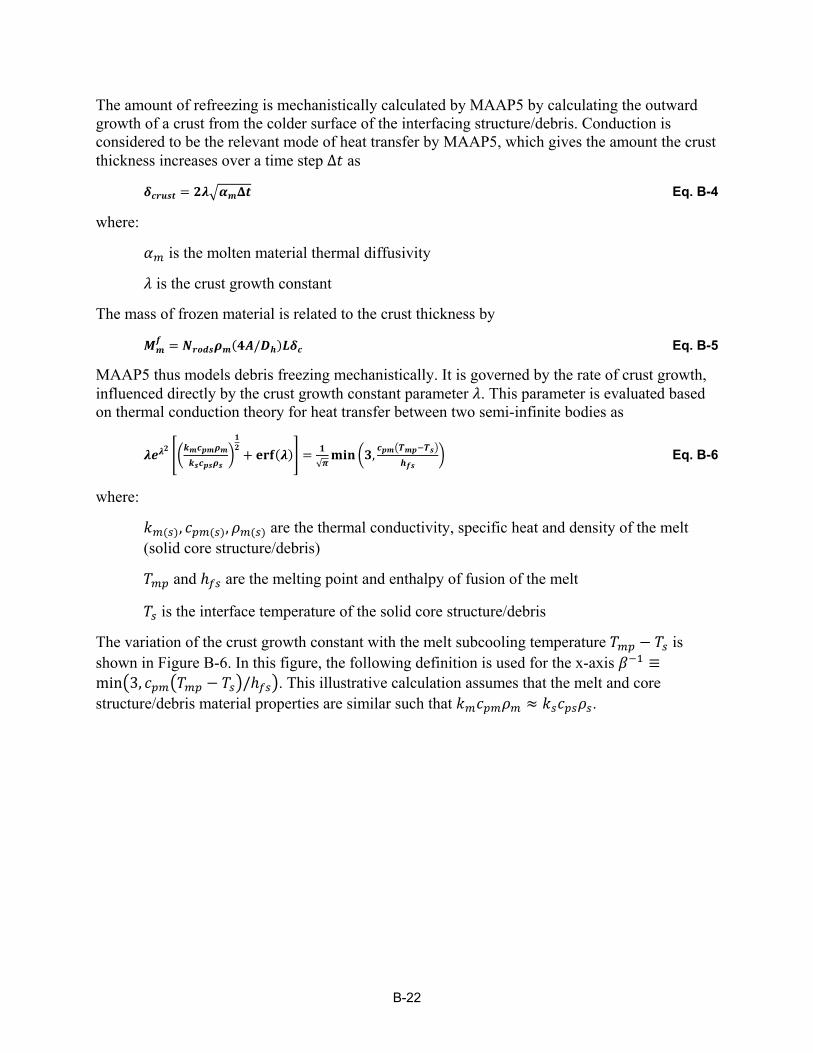
The amount of refreezing is mechanistically calculated by MAAP5 by calculating the outward growth of a crust from the colder surface of the interfacing structure/debris. Conduction is considered to be the relevant mode of heat transfer by MAAP5, which gives the amount the crust thickness increases over a time step Δ𝑡𝑡 as
𝜹𝜹𝒄𝒄𝒓𝒓𝒄𝒄𝒓𝒓𝒕𝒕 = 𝟐𝟐𝟐𝟐�𝜶𝜶𝒎𝒎𝚫𝚫𝒕𝒕 Eq. B-4
where:
𝛼𝛼𝑚𝑚 is the molten material thermal diffusivity
𝜆𝜆 is the crust growth constant
The mass of frozen material is related to the crust thickness by
𝑳𝑳𝒎𝒎𝒇𝒇 = 𝑵𝑵𝒓𝒓𝒓𝒓𝒓𝒓𝒓𝒓𝝆𝝆𝒎𝒎(𝟒𝟒𝟒𝟒/𝑫𝑫𝒉𝒉)𝑳𝑳𝜹𝜹𝒄𝒄 Eq. B-5
MAAP5 thus models debris freezing mechanistically. It is governed by the rate of crust growth, influenced directly by the crust growth constant parameter 𝜆𝜆. This parameter is evaluated based on thermal conduction theory for heat transfer between two semi-infinite bodies as
𝟐𝟐𝒆𝒆𝟐𝟐𝟐𝟐 ��𝒌𝒌𝒎𝒎𝒄𝒄𝒑𝒑𝒎𝒎𝝆𝝆𝒎𝒎𝒌𝒌𝒓𝒓𝒄𝒄𝒑𝒑𝒓𝒓𝝆𝝆𝒓𝒓�𝟏𝟏𝟐𝟐 + 𝐞𝐞𝐞𝐞𝐞𝐞(𝟐𝟐)� = 𝟏𝟏
√𝝅𝝅𝐦𝐦𝐦𝐦𝐦𝐦 �𝟑𝟑,𝒄𝒄𝒑𝒑𝒎𝒎�𝑻𝑻𝒎𝒎𝒑𝒑−𝑻𝑻𝒓𝒓�
𝒉𝒉𝒇𝒇𝒓𝒓� Eq. B-6
where:
𝑘𝑘𝑚𝑚(𝑟𝑟), 𝑐𝑐𝑝𝑝𝑚𝑚(𝑟𝑟), 𝜌𝜌𝑚𝑚(𝑟𝑟) are the thermal conductivity, specific heat and density of the melt (solid core structure/debris)
𝑇𝑇𝑚𝑚𝑝𝑝 and ℎ𝑓𝑓𝑟𝑟 are the melting point and enthalpy of fusion of the melt
𝑇𝑇𝑟𝑟 is the interface temperature of the solid core structure/debris
The variation of the crust growth constant with the melt subcooling temperature 𝑇𝑇𝑚𝑚𝑝𝑝 − 𝑇𝑇𝑟𝑟 is shown in Figure B-6. In this figure, the following definition is used for the x-axis 𝛽𝛽−1 ≡min�3, 𝑐𝑐𝑝𝑝𝑚𝑚�𝑇𝑇𝑚𝑚𝑝𝑝 − 𝑇𝑇𝑟𝑟�/ℎ𝑓𝑓𝑟𝑟�. This illustrative calculation assumes that the melt and core structure/debris material properties are similar such that 𝑘𝑘𝑚𝑚𝑐𝑐𝑝𝑝𝑚𝑚𝜌𝜌𝑚𝑚 ≈ 𝑘𝑘𝑟𝑟𝑐𝑐𝑝𝑝𝑟𝑟𝜌𝜌𝑟𝑟.
B-22
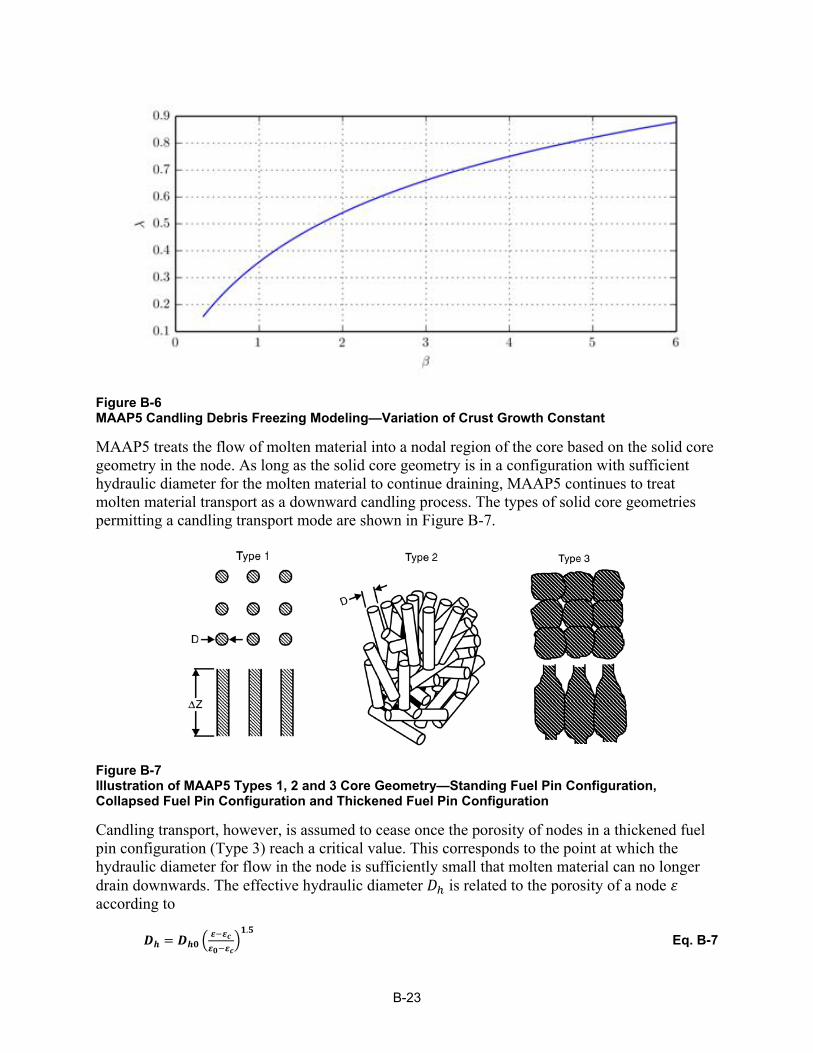
Figure B-6 MAAP5 Candling Debris Freezing Modeling—Variation of Crust Growth Constant
MAAP5 treats the flow of molten material into a nodal region of the core based on the solid core geometry in the node. As long as the solid core geometry is in a configuration with sufficient hydraulic diameter for the molten material to continue draining, MAAP5 continues to treat molten material transport as a downward candling process. The types of solid core geometries permitting a candling transport mode are shown in Figure B-7.
Figure B-7 Illustration of MAAP5 Types 1, 2 and 3 Core Geometry—Standing Fuel Pin Configuration, Collapsed Fuel Pin Configuration and Thickened Fuel Pin Configuration
Candling transport, however, is assumed to cease once the porosity of nodes in a thickened fuel pin configuration (Type 3) reach a critical value. This corresponds to the point at which the hydraulic diameter for flow in the node is sufficiently small that molten material can no longer drain downwards. The effective hydraulic diameter 𝐷𝐷ℎ is related to the porosity of a node 𝜀𝜀 according to
𝑫𝑫𝒉𝒉 = 𝑫𝑫𝒉𝒉𝟏𝟏 � 𝜺𝜺−𝜺𝜺𝒄𝒄𝜺𝜺𝟏𝟏−𝜺𝜺𝒄𝒄�𝟏𝟏.𝟓𝟓
Eq. B-7
B-23
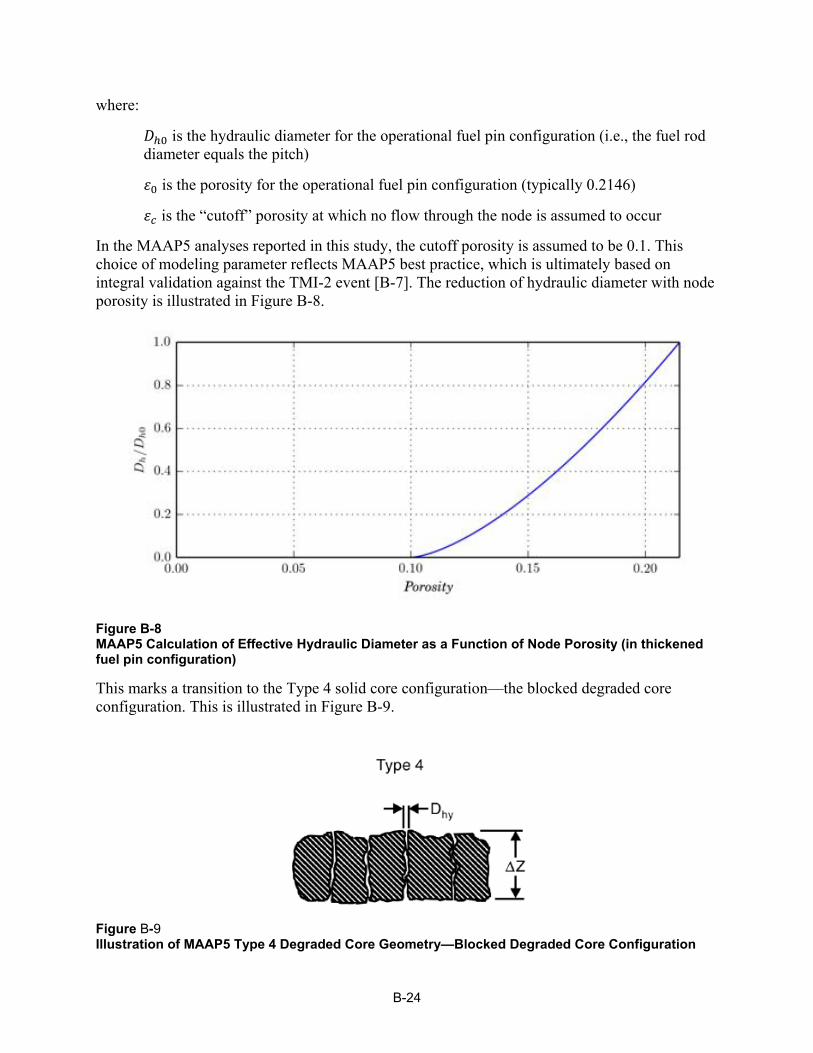
where:
𝐷𝐷ℎ0 is the hydraulic diameter for the operational fuel pin configuration (i.e., the fuel rod diameter equals the pitch)
𝜀𝜀0 is the porosity for the operational fuel pin configuration (typically 0.2146)
𝜀𝜀𝑐𝑐 is the “cutoff” porosity at which no flow through the node is assumed to occur
In the MAAP5 analyses reported in this study, the cutoff porosity is assumed to be 0.1. This choice of modeling parameter reflects MAAP5 best practice, which is ultimately based on integral validation against the TMI-2 event [B-7]. The reduction of hydraulic diameter with node porosity is illustrated in Figure B-8.
Figure B-8 MAAP5 Calculation of Effective Hydraulic Diameter as a Function of Node Porosity (in thickened fuel pin configuration)
This marks a transition to the Type 4 solid core configuration—the blocked degraded core configuration. This is illustrated in Figure B-9.
Figure B-9 Illustration of MAAP5 Type 4 Degraded Core Geometry—Blocked Degraded Core Configuration
B-24
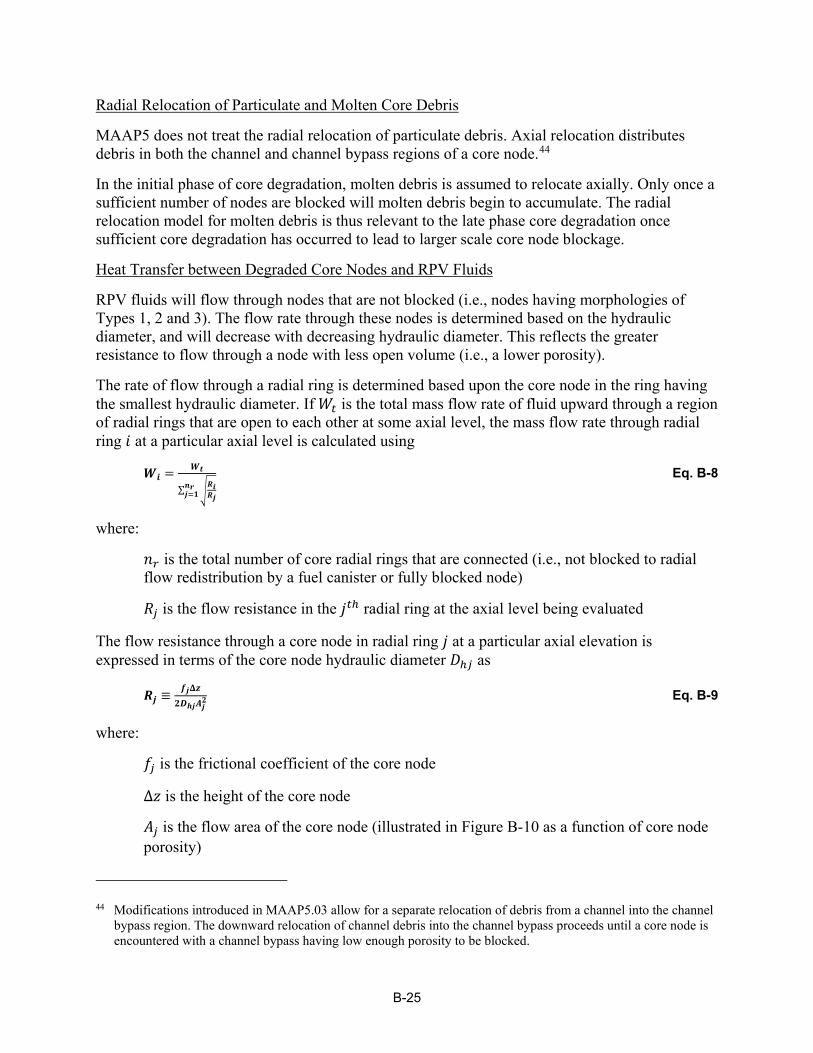
Radial Relocation of Particulate and Molten Core Debris
MAAP5 does not treat the radial relocation of particulate debris. Axial relocation distributes debris in both the channel and channel bypass regions of a core node.44
In the initial phase of core degradation, molten debris is assumed to relocate axially. Only once a sufficient number of nodes are blocked will molten debris begin to accumulate. The radial relocation model for molten debris is thus relevant to the late phase core degradation once sufficient core degradation has occurred to lead to larger scale core node blockage.
Heat Transfer between Degraded Core Nodes and RPV Fluids
RPV fluids will flow through nodes that are not blocked (i.e., nodes having morphologies of Types 1, 2 and 3). The flow rate through these nodes is determined based on the hydraulic diameter, and will decrease with decreasing hydraulic diameter. This reflects the greater resistance to flow through a node with less open volume (i.e., a lower porosity).
The rate of flow through a radial ring is determined based upon the core node in the ring having the smallest hydraulic diameter. If 𝑊𝑊𝑡𝑡 is the total mass flow rate of fluid upward through a region of radial rings that are open to each other at some axial level, the mass flow rate through radial ring 𝑖𝑖 at a particular axial level is calculated using
𝑾𝑾𝒊𝒊 = 𝑾𝑾𝒕𝒕
∑ �𝑹𝑹𝒊𝒊𝑹𝑹𝒋𝒋𝒏𝒏𝒓𝒓𝒋𝒋=𝟏𝟏
Eq. B-8
where:
𝑛𝑛𝑟𝑟 is the total number of core radial rings that are connected (i.e., not blocked to radial flow redistribution by a fuel canister or fully blocked node)
𝑅𝑅𝑗𝑗 is the flow resistance in the 𝑗𝑗𝑡𝑡ℎ radial ring at the axial level being evaluated
The flow resistance through a core node in radial ring 𝑗𝑗 at a particular axial elevation is expressed in terms of the core node hydraulic diameter 𝐷𝐷ℎ𝑗𝑗 as
𝑹𝑹𝒋𝒋 ≡𝒇𝒇𝒋𝒋𝚫𝚫𝒛𝒛
𝟐𝟐𝑫𝑫𝒉𝒉𝒋𝒋𝟒𝟒𝒋𝒋𝟐𝟐 Eq. B-9
where:
𝑓𝑓𝑗𝑗 is the frictional coefficient of the core node
Δ𝑧𝑧 is the height of the core node
𝐴𝐴𝑗𝑗 is the flow area of the core node (illustrated in Figure B-10 as a function of core node porosity)
44 Modifications introduced in MAAP5.03 allow for a separate relocation of debris from a channel into the channel bypass region. The downward relocation of channel debris into the channel bypass proceeds until a core node is encountered with a channel bypass having low enough porosity to be blocked.
B-25

As shown in Figure B-10, the flow through a core node drops to zero below a user-defined cutoff porosity. In the case of the figure, this cutoff porosity is 0.1, which is the same value used in the MAAP5 simulations reported in this study.
Figure B-10 MAAP5 Variation of Core Node Flow Area with Porosity (relative to initial flow area)
The heat transfer from a core node to RPV fluids flowing through the node (𝑄𝑄𝑐𝑐−𝑔𝑔) is determined using
𝑸𝑸𝒄𝒄−𝒈𝒈 = 𝒉𝒉𝒄𝒄−𝒈𝒈𝟒𝟒𝒉𝒉𝒕𝒕�𝑻𝑻𝒄𝒄 − 𝑻𝑻𝒈𝒈� Eq. B-10
where:
ℎ𝑐𝑐−𝑔𝑔 is the heat transfer coefficient, accounting for radiation, between the core debris and RPV fluids
𝐴𝐴ℎ𝑡𝑡 is the heat transfer surface area in the core node
𝑇𝑇𝑐𝑐(𝑔𝑔) is the temperature of debris in (gas flowing through) the core node
The heat transfer coefficient is inversely proportional to the hydraulic diameter of the core node and depends on the Reynolds number for gas flow through the node. The more important quantity, however, is the heat transfer surface area, which is shown in Figure B-11.
B-26
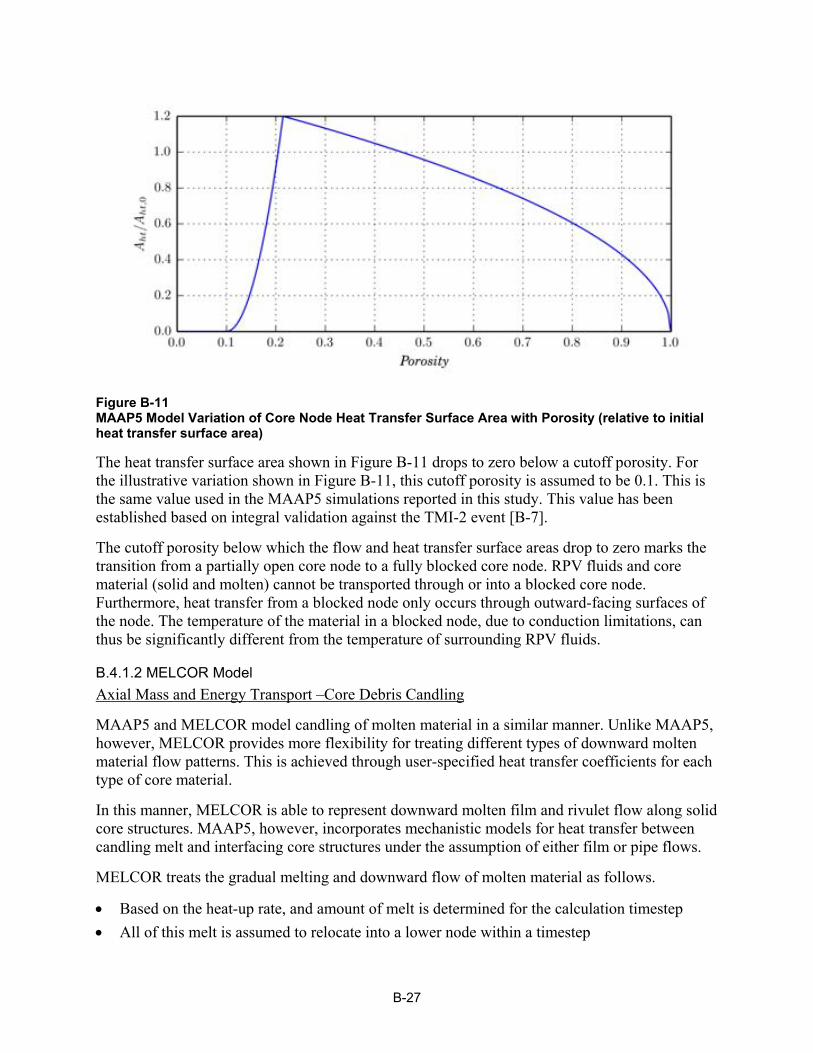
Figure B-11 MAAP5 Model Variation of Core Node Heat Transfer Surface Area with Porosity (relative to initial heat transfer surface area)
The heat transfer surface area shown in Figure B-11 drops to zero below a cutoff porosity. For the illustrative variation shown in Figure B-11, this cutoff porosity is assumed to be 0.1. This is the same value used in the MAAP5 simulations reported in this study. This value has been established based on integral validation against the TMI-2 event [B-7].
The cutoff porosity below which the flow and heat transfer surface areas drop to zero marks the transition from a partially open core node to a fully blocked core node. RPV fluids and core material (solid and molten) cannot be transported through or into a blocked core node. Furthermore, heat transfer from a blocked node only occurs through outward-facing surfaces of the node. The temperature of the material in a blocked node, due to conduction limitations, can thus be significantly different from the temperature of surrounding RPV fluids.
B.4.1.2 MELCOR Model Axial Mass and Energy Transport –Core Debris Candling
MAAP5 and MELCOR model candling of molten material in a similar manner. Unlike MAAP5, however, MELCOR provides more flexibility for treating different types of downward molten material flow patterns. This is achieved through user-specified heat transfer coefficients for each type of core material.
In this manner, MELCOR is able to represent downward molten film and rivulet flow along solid core structures. MAAP5, however, incorporates mechanistic models for heat transfer between candling melt and interfacing core structures under the assumption of either film or pipe flows.
MELCOR treats the gradual melting and downward flow of molten material as follows.
• Based on the heat-up rate, and amount of melt is determined for the calculation timestep • All of this melt is assumed to relocate into a lower node within a timestep
B-27
• Heat transfer between the melt and available heat sink is considered to be conductive with the heat transfer coefficient specified by the user45
𝑸𝑸 = 𝒉𝒉𝒎𝒎𝟒𝟒𝒄𝒄(𝑻𝑻𝒎𝒎 − 𝑻𝑻𝒓𝒓)𝚫𝚫𝒕𝒕 Eq. B-11
where:
ℎ𝑚𝑚 is the user-specified heat transfer coefficient
𝐴𝐴𝑐𝑐 is the area of contact between the melt and structural component in the node
𝑇𝑇𝑚𝑚 is the melt temperature (determined implicitly)
𝑇𝑇𝑟𝑟 is the temperature of the structural component (determined implicitly)
Δ𝑡𝑡 is the size of the timestep
• The amount of melt that freezes within the computational node is based on the amount of additional heat removed above the melt superheat
𝑳𝑳𝒎𝒎𝒇𝒇 ≡ 𝑸𝑸−𝑸𝑸𝒓𝒓𝒉𝒉
𝒉𝒉𝒇𝒇𝒓𝒓 Eq. B-12
where:
𝑄𝑄𝑟𝑟ℎ ≡ 𝐿𝐿𝑚𝑚𝑐𝑐𝑝𝑝𝑚𝑚�𝑇𝑇𝑚𝑚 − 𝑇𝑇𝑚𝑚𝑝𝑝� is the superheat in a melt of mass 𝐿𝐿𝑚𝑚 and temperature 𝑇𝑇𝑚𝑚 with specific heat 𝑐𝑐𝑝𝑝𝑚𝑚 and melting temperature 𝑇𝑇𝑚𝑚𝑝𝑝
ℎ𝑓𝑓𝑟𝑟 is the enthalpy of fusion for the molten material mixture
• Molten material continues to candle from one node into its lower node until only refrozen material exists
• Refrozen material is termed conglomerate debris and is treated as an extension of the core structure on which it has frozen
MELCOR applies this candling model to represent the downward motion of molten debris.
Downward relocation of solid debris can be considered by MELCOR when the eutectic modeling option is not invoked. This model represents the transport of solid materials in the molten candling flow. It is used to represent the effect of
• Thin oxide shells breaking off into the candling flow • Eutectic dissolution of UO2 by molten Zr
MELCOR represents the mass of solid material transported from a core structure into the downward molten flow through the specification of one of two user-defined input parameters.
45 The thickness of the molten film is assumed to be sufficiently small that the temperature through the molten film is relatively constant (i.e., the lumped volume approximation is appropriate).
B-28
The mass of solid material incorporated within the relocating molten flow is denoted as 𝐿𝐿𝑟𝑟𝑟𝑟. MELCOR uses one of two relationships to estimate this mass.
The mass 𝐿𝐿𝑟𝑟𝑟𝑟 represents the mass of solid material relocating downward to another core node. MELCOR assumes that this mass is proportional to the amount of molten material that relocates and freezes on a core structure.
• As a fraction 𝑓𝑓1 of the molten material mass frozen on a core structure
𝑳𝑳𝒓𝒓𝒓𝒓 = 𝒇𝒇𝟏𝟏𝑳𝑳𝒎𝒎𝒇𝒇 Eq. B-13
• As a fraction 𝑓𝑓2 of the proportion of total solid mass to total material in the node from which the mass relocated
𝑳𝑳𝒓𝒓𝒓𝒓 = 𝒇𝒇𝟐𝟐 𝑳𝑳𝒓𝒓𝒕𝒕
𝑳𝑳𝒓𝒓𝒕𝒕+𝑳𝑳𝒎𝒎𝒕𝒕𝑳𝑳𝒎𝒎
𝒇𝒇 Eq. B-14
where:
𝐿𝐿𝑟𝑟𝑡𝑡 is the total solid mass that can relocate in the node from which mass relocated
𝐿𝐿𝑚𝑚𝑡𝑡 is the total mass of molten material in the node from which mass relocated
This model is not used in this study. It is not active in the MELCOR Fukushima Daiichi Unit 1 model. Furthermore, MELCOR best practice does not activate this modeling approach.
Radial Relocation of Molten Core Debris
In addition to the axial relocation of core debris, MELCOR models the radial relocation of molten and particulate debris. The physics governing the radial motion of molten and particulate debris is similar. Molten debris, however, is only considered to move radially when it is not possible for it to continue candling downward (i.e., blockages have formed in the flow path due to molten debris freezing).
Once molten debris becomes blocked to continued downward flow, MELCOR applies a gravitational leveling algorithm. This distributes molten debris across radially adjacent computational nodes, ensuring that the hydrostatic head is equal over these nodes.
MELCOR assumes that molten debris relocates radially until all nodes at an axial level have equal hydrostatic heads. MELCOR identifies a volume of molten material 𝑉𝑉𝑏𝑏𝑏𝑏𝑏𝑏 that must be moved radial to balance the hydrostatic head. The time over which this volume of material relocates is not assumed to be instant. The equation that determines how much volume relocates over a single timestep Δ𝑡𝑡 is given by
𝑽𝑽𝒓𝒓 = 𝑽𝑽𝒃𝒃𝒃𝒃𝒃𝒃�𝟏𝟏 − 𝒆𝒆−𝚫𝚫𝒕𝒕/𝝉𝝉𝒃𝒃𝒃𝒃𝒃𝒃� Eq. B-15
where:
𝜏𝜏𝑏𝑏𝑏𝑏𝑏𝑏 is the time constant for this gravitational leveling process with a value of 60 s used for the analysis in this study
B-29
Radial and Axial Relocation of Particulate Debris
MELCOR assumes particulate debris forms for fuel rod structures based on a time-at-temperature criterion, or when the remaining fraction of metal decreases below a critical value. These mechanisms are discussed in Section B.3.6.2. All non-fuel rod structures are assumed to collapse into a particulate debris bed when the unoxidized metal thickness decreases below a critical value, as discussed in Sections B.3.1.2 and B.3.2.2. In addition, an intact component will degrade into particulate debris when the structure supporting it fails.
Prior to fuel canister failure, no radial relocation of particulate debris is treated. Downward relocation of particulate debris is treated prior to fuel canister failure, but cannot occur unless
• There is available volume in lower axial levels • Molten material exists at lower levels - particulate debris is assumed to displace molten
material
The exclusion of particulate debris from a core node is affected by the morphology of the particulate debris and the core node. For example, particulate debris cannot enter a core node with a sufficiently low porosity, even though there is open volume available. Fluids and molten material, however, can flow through such a node because they are liquid or gas.
Once fuel canisters have failed, it is possible for particulate debris to relocate radially. As with molten material, MELCOR assumes that the radial relocation of particulate debris is driven by hydrostatic forces attempting to achieve gravitational leveling across the core.
To ensure that the hydrostatic head in different radial rings balance, MELCOR also considers the available volume in the channel bypass when fuel canisters have failed. Hydrostatic balance is achieved when the levels of core debris across the radius of the core (particulate and molten) are equal.
As in the treatment of molten debris radial relocation, particulate debris is assumed to relocate radially at a fixed rate given by a user-defined time constant. Equation B-16 is used to determine the volume of particulate debris relocated over a timestep. The time constant for particulate debris relocation is 360 s in the simulations of this study.
The gravitational leveling of particulate debris in the core results in particulate relocating downward. The fall of particulate debris is assumed to occur at a fixed velocity that is user-specified. The downward relocation of particulate debris is implemented using the following algorithm.
• As long as the fuel canister for a core node is intact, debris relocates strictly downward through the channel or channel bypass
• Particulate debris entering a core node with no intact fuel canister is mixed across the volume of both the channel and channel bypass
• Debris will be split between the channel and channel bypass when relocating from a core node without an intact fuel canister into a node with an intact canister
B-30
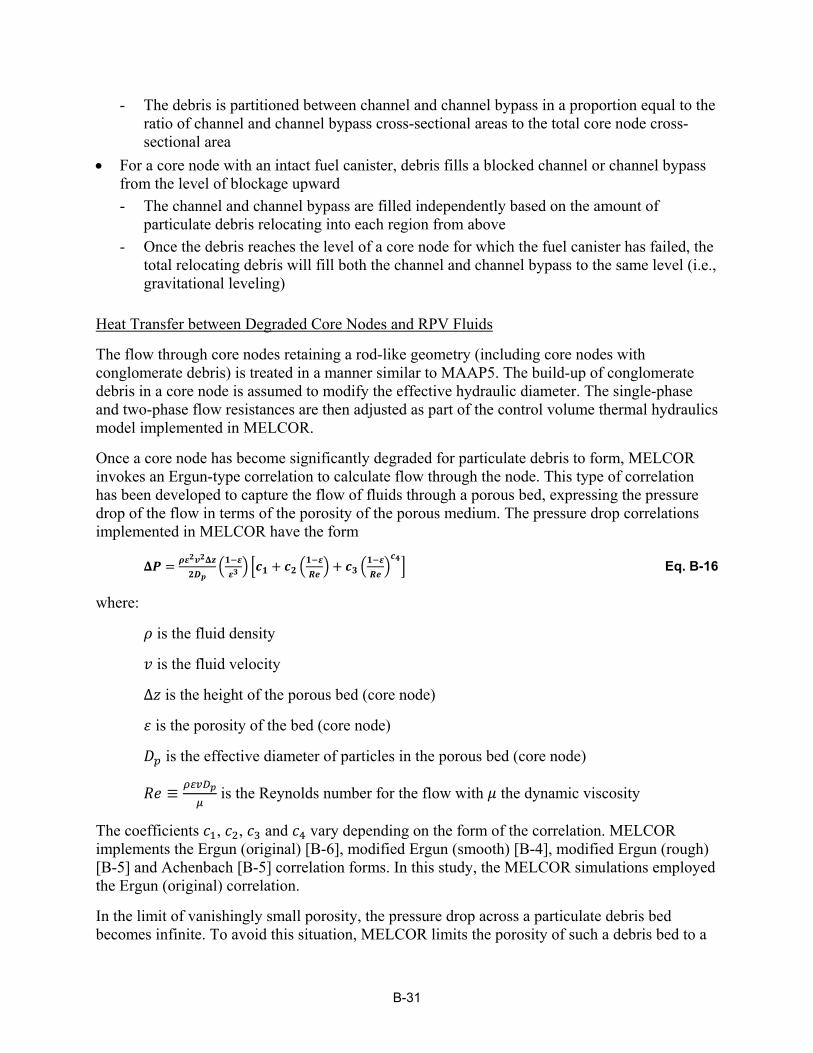
- The debris is partitioned between channel and channel bypass in a proportion equal to the ratio of channel and channel bypass cross-sectional areas to the total core node cross-sectional area
• For a core node with an intact fuel canister, debris fills a blocked channel or channel bypass from the level of blockage upward - The channel and channel bypass are filled independently based on the amount of
particulate debris relocating into each region from above - Once the debris reaches the level of a core node for which the fuel canister has failed, the
total relocating debris will fill both the channel and channel bypass to the same level (i.e., gravitational leveling)
Heat Transfer between Degraded Core Nodes and RPV Fluids
The flow through core nodes retaining a rod-like geometry (including core nodes with conglomerate debris) is treated in a manner similar to MAAP5. The build-up of conglomerate debris in a core node is assumed to modify the effective hydraulic diameter. The single-phase and two-phase flow resistances are then adjusted as part of the control volume thermal hydraulics model implemented in MELCOR.
Once a core node has become significantly degraded for particulate debris to form, MELCOR invokes an Ergun-type correlation to calculate flow through the node. This type of correlation has been developed to capture the flow of fluids through a porous bed, expressing the pressure drop of the flow in terms of the porosity of the porous medium. The pressure drop correlations implemented in MELCOR have the form
𝚫𝚫𝑳𝑳 = 𝝆𝝆𝜺𝜺𝟐𝟐𝒗𝒗𝟐𝟐𝚫𝚫𝒛𝒛𝟐𝟐𝑫𝑫𝒑𝒑
�𝟏𝟏−𝜺𝜺𝜺𝜺𝟑𝟑 � �𝒄𝒄𝟏𝟏 + 𝒄𝒄𝟐𝟐 �𝟏𝟏−𝜺𝜺𝑹𝑹𝒆𝒆 �+ 𝒄𝒄𝟑𝟑 �𝟏𝟏−𝜺𝜺𝑹𝑹𝒆𝒆 �𝒄𝒄𝟒𝟒� Eq. B-16
where:
𝜌𝜌 is the fluid density
𝑣𝑣 is the fluid velocity
Δ𝑧𝑧 is the height of the porous bed (core node)
𝜀𝜀 is the porosity of the bed (core node)
𝐷𝐷𝑝𝑝 is the effective diameter of particles in the porous bed (core node)
𝑅𝑅𝑅𝑅 ≡ 𝜌𝜌𝜌𝜌𝜌𝜌𝐷𝐷𝑝𝑝𝜇𝜇 is the Reynolds number for the flow with 𝜇𝜇 the dynamic viscosity
The coefficients 𝑐𝑐1, 𝑐𝑐2, 𝑐𝑐3 and 𝑐𝑐4 vary depending on the form of the correlation. MELCOR implements the Ergun (original) [B-6], modified Ergun (smooth) [B-4], modified Ergun (rough) [B-5] and Achenbach [B-5] correlation forms. In this study, the MELCOR simulations employed the Ergun (original) correlation.
In the limit of vanishingly small porosity, the pressure drop across a particulate debris bed becomes infinite. To avoid this situation, MELCOR limits the porosity of such a debris bed to a
B-31
minimum of 5%. This ensures that adjustment of the timestep using the material Courant condition does not result in a significant slowdown in the calculation. In this manner, however, flow of fluids through a particulate debris bed is assumed to continue.
MELCOR determines the heat rejected from core materials to RPV fluids using a similar type of equation as used by MAAP5 (see the equation above).
• The heat transfer coefficient between the core materials and RPV fluids is calculated using similar correlations as used in the MAAP5 formulation
• The heat transfer surface area is calculated differently for the type of core node geometry - For a core node in a rod-like geometry, the heat transfer surface area varies with the
effective porosity - For a particulate debris bed, the heat transfer surface area increases with the volume of
particulate as the effective hydraulic diameter does not vary with porosity (it is a constant value input by the user)
B.4.1.3 Comparison of MAAP5 and MELCOR Models The representation of gravitational leveling during the initial phase of core degradation is the primary difference between the MAAP5 and MELCOR relocation models.
MAAP5 does not explicitly consider the radial relocation of particulate or molten material during this early phase of core degradation. It is assumed that downward motion of core debris is the primary mode of relocation. Thus, debris tends to accumulate in radial rings first, eventually causing a blockage to occur at an axial level in the ring. This can result in core nodes becoming blocked above the level of the core support plate.
MELCOR also assumes that debris relocates downward predominately as long as fuel canisters have not failed. Once fuel canisters have failed, debris is assumed to relocate radially. This is intended to balance hydrostatic forces by achieving a constant debris level in the core. The result of this is the distribution of debris from central radial rings (higher temperature and likely the first to collapse) across the lowest axial levels of the core to achieve a constant debris level. In this manner, the formation of debris is less likely to lead to a radial ring becoming blocked at a higher axial elevation—the debris is more likely to spread out across the core plate, over a larger volume. This reduces the amount by which any radial ring core node has its free volume reduced.
In addition to the relocation modes considered by the two codes, the heat transfer from core debris to RPV fluids is significantly different between the two codes
• For rod-like geometries, the two codes employ similar flow and heat transfer models • Particulate debris bed geometries, however, are treated in significantly different manners
- MAAP5 assumes that flow and heat transfer surface areas decrease with decreasing porosity
- MELCOR never completely blocks flow through the particulate core node—though it does decrease with decreasing porosity
B-32
- MELCOR also models the effective heat transfer surface area as increasing with the total particulate volume46
The representation of heat transfer from particulate debris to RPV fluids is the most significant difference between MAAP5 and MELCOR modeling abstractions.
• In MAAP5 simulations, heat transfer will degrade with decreasing debris bed porosity - With decreasing debris bed porosity, the amount of decay and oxidation heat rejected
from core debris will decrease - Core debris melting will result as the heat not rejected will be converted to stored energy
• In MELCOR simulations, heat transfer degradation will not occur with decreasing debris bed porosity - Much larger amounts of decay heat will be simulated to be rejected away from the core
debris • The extent of debris melting simulated by MELCOR will thus be depressed relative to
MAAP5 simulations
B.4.2 Late Phase Molten Material Transport Once significant core material degradation has occurred, candling no longer describes the dominant mode of degraded core material transport. This regime is characterized by a large amount of disruption to the core geometry such that flow paths through the core are either more restricted or largely absent. As a result of this gross loss of the originally coolable core geometry, a number of effects can arise.
• The downward flow of solid or molten debris can become impeded by the accumulation of frozen debris lower in the core region - This can result in solid or molten debris relocating radially until unimpeded axial flow
paths closer to the core periphery are reached • The accumulation/hold-up of solid or molten debris can impact heat transfer should
convective flows develop in these pools - A much greater fraction of heat would tend to be transported in the upward and radial
directions because of this convective circulation • The flow of steam and other gases (such as hydrogen) through the core debris can become
much more restricted as a result of accumulation of debris in formerly open flow channels - This has the potential to lead to a reduced contact area between core debris and gases that
can carry away energy from the debris (i.e., a loss of core coolable geometry) The following discussion identifies how MAAP5 and MELCOR model mass and energy transport processes once the core has become significantly degraded. This corresponds to the late-phase of core melt progression inside the core region.
46 MELCOR assumes that the effective “connectedness” of a debris bed is unchanged with accumulation of particulate (i.e., decreasing porosity). This is intended to reflect the incoherent degradation of fuel assemblies around a radial ring. In this abstraction, there will always be open flow areas through a particulate debris bed. Increasing the volume of particulates thus serves to increase the effective heat transfer surface area.
B-33

B.4.2.1 MAAP5 Model MAAP5 considers the mass and energy transport through a significantly degraded core in terms of a number of distinct processes and associated calculations.
• Accumulation of debris above core blockages - Radial relocation of molten debris
• Energy transport processes - Core-region molten pool natural circulation
Radial Relocation of Core Debris
Molten debris will relocate in the radial direction if a number of adjacent blocked or fully molten core nodes are encountered at a lower axial elevation. Radial relocation of molten core debris will proceed until
• A radial ring is reached through which the molten material can drain downwards (see, for example, Figure B-12)
• A partially solid, blocked core node is encountered forming a sideward molten debris boundary (as shown in Figure B-13)
Figure B-12 Illustration of Molten Debris Spreading to Side Crust Boundaries
The molten debris is re-distributed across a number of blocked nodes until the level of molten material across these nodes is equal. Solid material in a blocked node is assumed to form an upper crust. This is illustrated in Figure B-13. This modeling approach is supported by integral validation against the TMI-2 event [B-7].
B-34
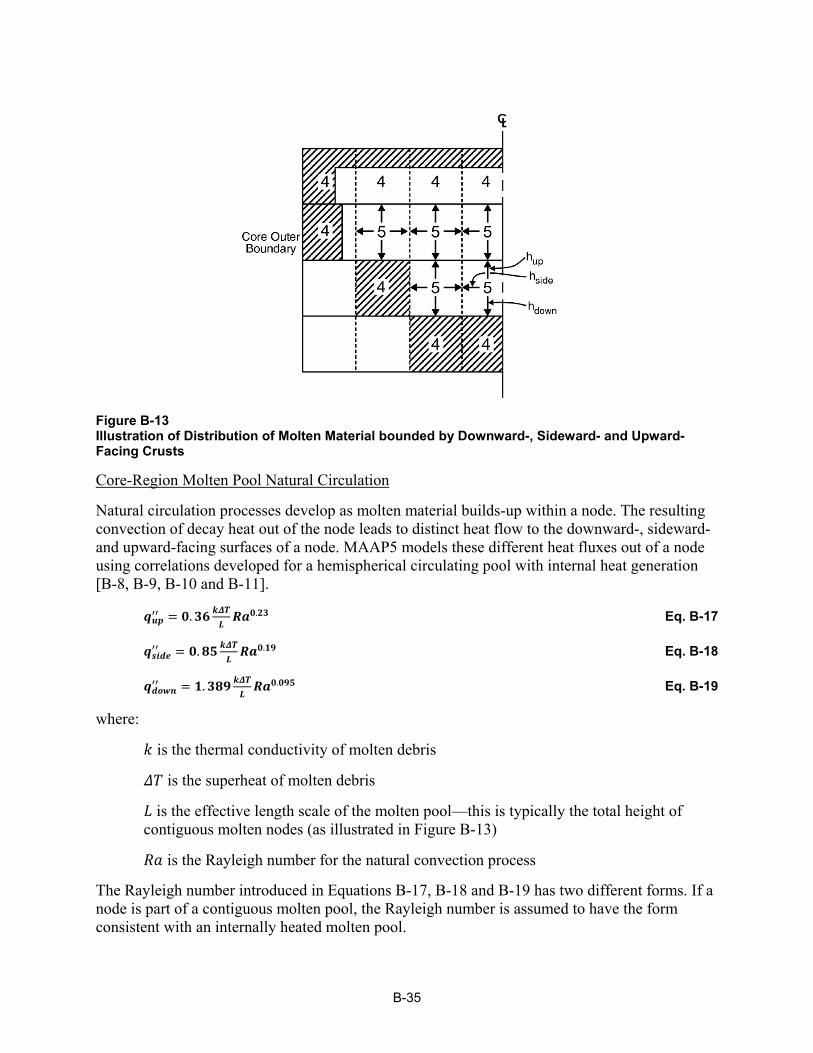
Figure B-13 Illustration of Distribution of Molten Material bounded by Downward-, Sideward- and Upward-Facing Crusts
Core-Region Molten Pool Natural Circulation
Natural circulation processes develop as molten material builds-up within a node. The resulting convection of decay heat out of the node leads to distinct heat flow to the downward-, sideward- and upward-facing surfaces of a node. MAAP5 models these different heat fluxes out of a node using correlations developed for a hemispherical circulating pool with internal heat generation [B-8, B-9, B-10 and B-11].
𝒒𝒒𝒄𝒄𝒑𝒑′′ = 𝟏𝟏.𝟑𝟑𝟑𝟑 𝒌𝒌𝒌𝒌𝑻𝑻𝑳𝑳 𝑹𝑹𝒃𝒃𝟏𝟏.𝟐𝟐𝟑𝟑 Eq. B-17
𝒒𝒒𝒓𝒓𝒊𝒊𝒓𝒓𝒆𝒆′′ = 𝟏𝟏.𝟖𝟖𝟓𝟓 𝒌𝒌𝒌𝒌𝑻𝑻𝑳𝑳 𝑹𝑹𝒃𝒃𝟏𝟏.𝟏𝟏𝟏𝟏 Eq. B-18
𝒒𝒒𝒓𝒓𝒓𝒓𝒅𝒅𝒏𝒏′′ = 𝟏𝟏.𝟑𝟑𝟖𝟖𝟏𝟏 𝒌𝒌𝒌𝒌𝑻𝑻𝑳𝑳 𝑹𝑹𝒃𝒃𝟏𝟏.𝟏𝟏𝟏𝟏𝟓𝟓 Eq. B-19
where:
𝑘𝑘 is the thermal conductivity of molten debris
𝛥𝛥𝑇𝑇 is the superheat of molten debris
𝐿𝐿 is the effective length scale of the molten pool—this is typically the total height of contiguous molten nodes (as illustrated in Figure B-13)
𝑅𝑅𝑅𝑅 is the Rayleigh number for the natural convection process
The Rayleigh number introduced in Equations B-17, B-18 and B-19 has two different forms. If a node is part of a contiguous molten pool, the Rayleigh number is assumed to have the form consistent with an internally heated molten pool.
B-35
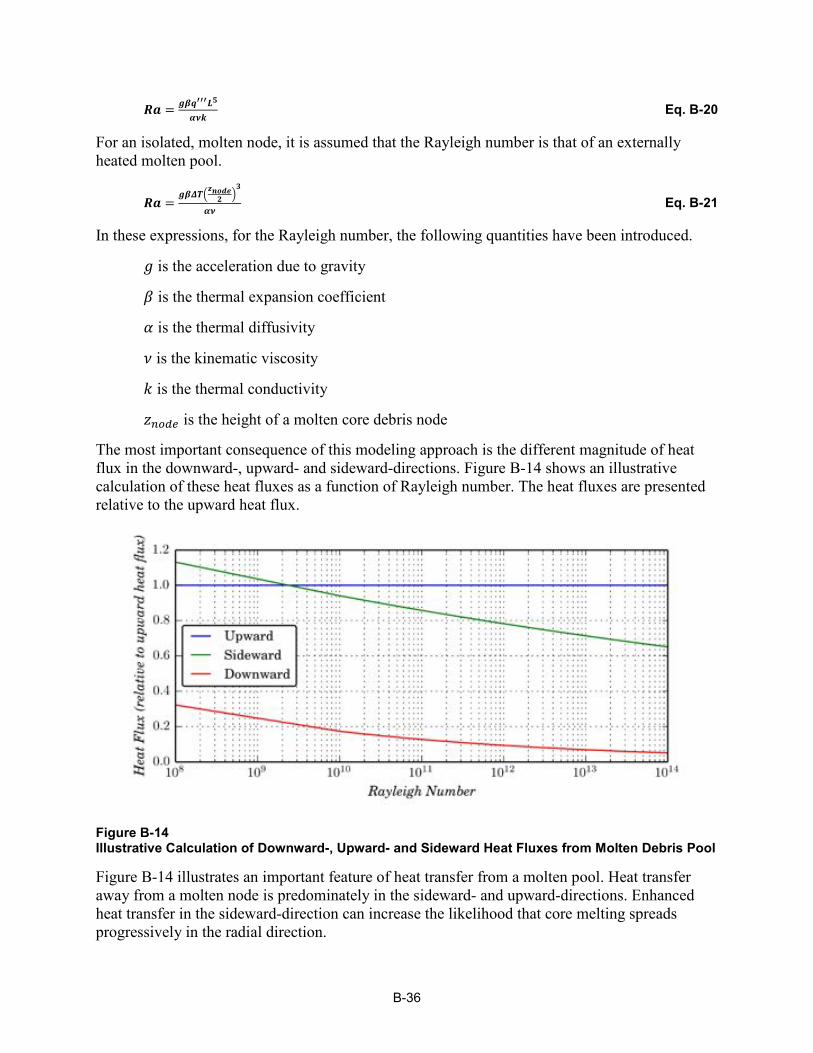
B-36
𝑹𝑹𝒃𝒃 = 𝒈𝒈𝒈𝒈𝒒𝒒′′′𝑳𝑳𝟓𝟓𝜶𝜶𝜶𝜶𝒌𝒌 Eq. B-20
For an isolated, molten node, it is assumed that the Rayleigh number is that of an externally heated molten pool.
𝑹𝑹𝒃𝒃 = 𝒈𝒈𝒈𝒈𝒌𝒌𝑻𝑻�𝒛𝒛𝒏𝒏𝒓𝒓𝒓𝒓𝒆𝒆𝟐𝟐 �𝟑𝟑
𝜶𝜶𝜶𝜶 Eq. B-21
In these expressions, for the Rayleigh number, the following quantities have been introduced.
𝑔𝑔 is the acceleration due to gravity
𝛽𝛽 is the thermal expansion coefficient
𝛼𝛼 is the thermal diffusivity
𝜈𝜈 is the kinematic viscosity
𝑘𝑘 is the thermal conductivity
𝑧𝑧𝑛𝑛𝑟𝑟𝑟𝑟𝑛𝑛 is the height of a molten core debris node
The most important consequence of this modeling approach is the different magnitude of heat flux in the downward-, upward- and sideward-directions. Figure B-14 shows an illustrative calculation of these heat fluxes as a function of Rayleigh number. The heat fluxes are presented relative to the upward heat flux.
Figure B-14 Illustrative Calculation of Downward-, Upward- and Sideward Heat Fluxes from Molten Debris Pool
Figure B-14 illustrates an important feature of heat transfer from a molten pool. Heat transfer away from a molten node is predominately in the sideward- and upward-directions. Enhanced heat transfer in the sideward-direction can increase the likelihood that core melting spreads progressively in the radial direction.
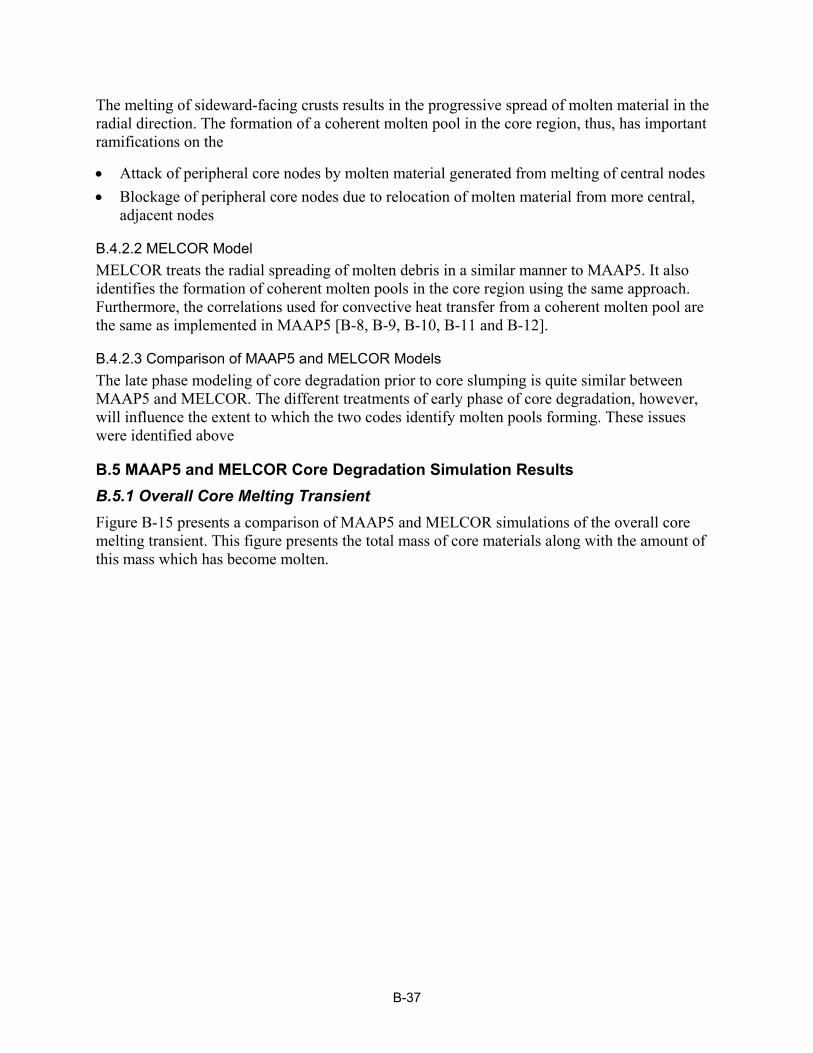
The melting of sideward-facing crusts results in the progressive spread of molten material in the radial direction. The formation of a coherent molten pool in the core region, thus, has important ramifications on the
• Attack of peripheral core nodes by molten material generated from melting of central nodes • Blockage of peripheral core nodes due to relocation of molten material from more central,
adjacent nodes
B.4.2.2 MELCOR Model MELCOR treats the radial spreading of molten debris in a similar manner to MAAP5. It also identifies the formation of coherent molten pools in the core region using the same approach. Furthermore, the correlations used for convective heat transfer from a coherent molten pool are the same as implemented in MAAP5 [B-8, B-9, B-10, B-11 and B-12].
B.4.2.3 Comparison of MAAP5 and MELCOR Models The late phase modeling of core degradation prior to core slumping is quite similar between MAAP5 and MELCOR. The different treatments of early phase of core degradation, however, will influence the extent to which the two codes identify molten pools forming. These issues were identified above
B.5 MAAP5 and MELCOR Core Degradation Simulation Results B.5.1 Overall Core Melting Transient Figure B-15 presents a comparison of MAAP5 and MELCOR simulations of the overall core melting transient. This figure presents the total mass of core materials along with the amount of this mass which has become molten.
B-37

Figure B-15 Comparison of Simulated Core Melting Transient
Unlike MELCOR, the MAAP5 simulation estimates a significant fraction of the core liquefying prior to the initial slump to the lower plenum. Approximately 50% of the core melts in the MAAP5 simulation. By contrast, MELCOR simulates about 10% of the core becoming molten while still in the core region.
Moreover, MAAP5 simulates a molten core holding up inside the core region for a prolonged period of time (approximately 4 hours). The MELCOR simulation, while forming molten debris,
B-38
does not simulate a large fraction of this debris holding up within the core region for a prolonged period of time. Molten debris is more likely to drain into the lower plenum in the MELCOR simulation.
This is due primarily to the fact that debris primarily relocates to the bottom of the core in the MELCOR simulation (i.e., relocates on top of the core plate). In the MELCOR simulation, debris formation in upper regions of the core usually results in relocation of particulate to the bottom of the core based on the leveling principle, discussed above.
By contrast, MAAP5 does not invoke such a leveling principle for particulate debris forming in upper regions of the core. Particulate debris will relocate downward and fill voids in lower core nodes. In this manner, the MAAP5 simulation identifies a much larger fraction of core debris being held up in core nodes a few levels above the core plate. The relocation of debris into originally open core regions tends to result in debris blockages forming above the core plate. These act as crusts that prevent further downward relocation. Debris can only relocate through these crusts once they fail, which typically requires high temperature conditions.
The distinction in the overall core geometry is discussed further below. It is important to note that there is an immediate difference between the two codes just based on the core melt transient prior to initial slump to the lower plenum.
B.5.2 Overall Core Geometry and Impact on Heat Transfer The geometry of a core plays a central role in the extent to which decay heat can be rejected away from core material. This is typically characterized as the ratio of heat transfer surface area to core material volume47. This ratio decreases as heat transfer surface area decreases.
Onset of core degradation results in a loss of heat transfer surface area. As core materials degrade, through either melting or creep failure due to extended exposure to elevated temperatures, relocation of solid and molten debris modifies the original core geometry. This has the effect of reducing the amount of surface area exposed to RPV fluids. Figure B-16 and Figure B-17 illustrate how formation of debris results in a decrease of the heat transfer surface area to core material volume ratio.
Figure B-16 Different Core Debris Configurations Illustrating Loss of Heat Transfer Surface Area to Core Volume
Figure B-17 provides an additional illustration of the impact of fuel rod melting and melt run-down (i.e., candling) on how core material volume to heat transfer surface area increases.
47 Core material volume is a measure of the volume of heat bearing materials.
B-39
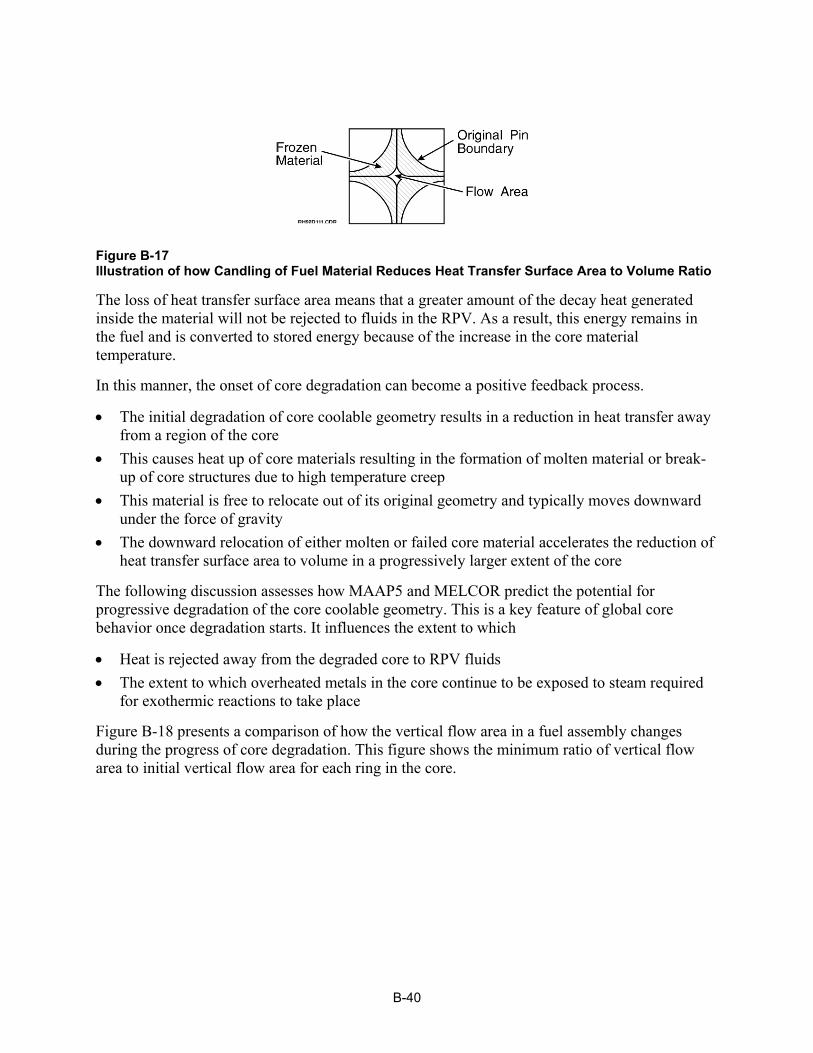
Figure B-17 Illustration of how Candling of Fuel Material Reduces Heat Transfer Surface Area to Volume Ratio
The loss of heat transfer surface area means that a greater amount of the decay heat generated inside the material will not be rejected to fluids in the RPV. As a result, this energy remains in the fuel and is converted to stored energy because of the increase in the core material temperature.
In this manner, the onset of core degradation can become a positive feedback process.
• The initial degradation of core coolable geometry results in a reduction in heat transfer away from a region of the core
• This causes heat up of core materials resulting in the formation of molten material or break-up of core structures due to high temperature creep
• This material is free to relocate out of its original geometry and typically moves downward under the force of gravity
• The downward relocation of either molten or failed core material accelerates the reduction of heat transfer surface area to volume in a progressively larger extent of the core
The following discussion assesses how MAAP5 and MELCOR predict the potential for progressive degradation of the core coolable geometry. This is a key feature of global core behavior once degradation starts. It influences the extent to which
• Heat is rejected away from the degraded core to RPV fluids • The extent to which overheated metals in the core continue to be exposed to steam required
for exothermic reactions to take place
Figure B-18 presents a comparison of how the vertical flow area in a fuel assembly changes during the progress of core degradation. This figure shows the minimum ratio of vertical flow area to initial vertical flow area for each ring in the core.
B-40

Figure B-18 Comparison of Minimum Vertical Flow Area through Fuel Assemblies across the Radial Extent of Core
Unlike MAAP5, MELCOR does not simulate the formation of debris blockages in peripheral radial rings of the core—in this case, rings 3, 4 and 5 maintain enough open area to allow continued flow of steam up through these rings. Rings 3 and 4 have a minimum flow area between about 50% and 60% of the nominal flow area through intact fuel assemblies.
B-41
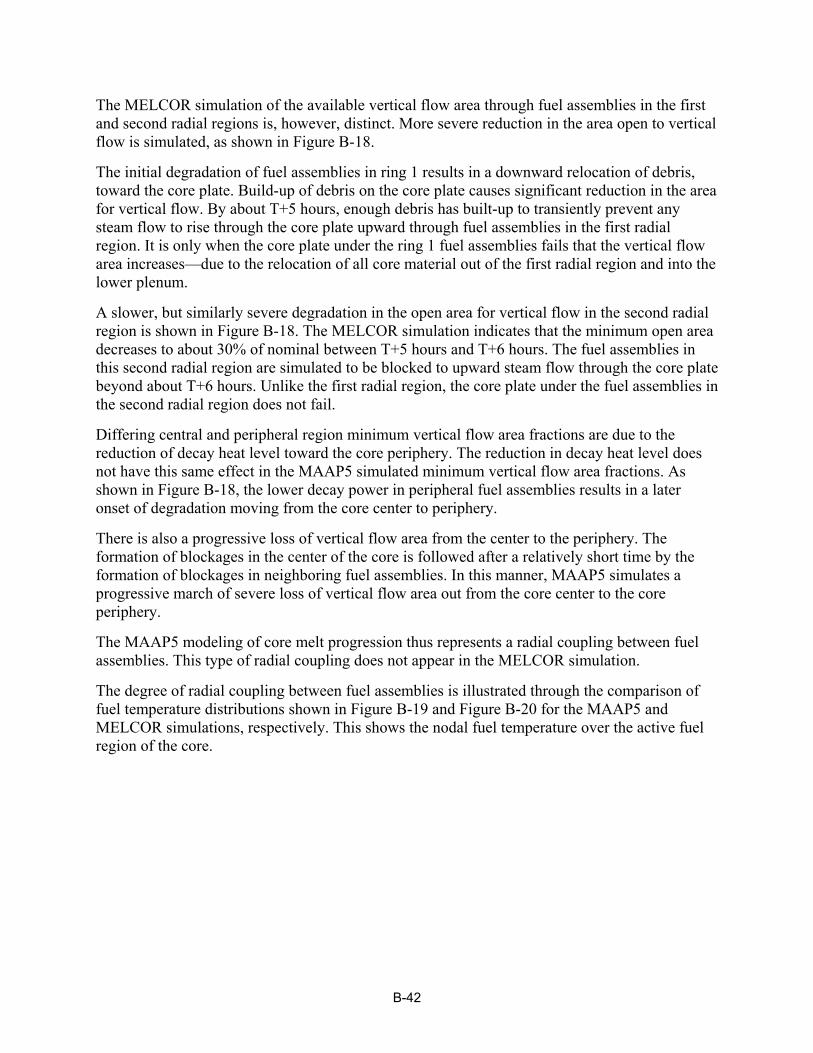
The MELCOR simulation of the available vertical flow area through fuel assemblies in the first and second radial regions is, however, distinct. More severe reduction in the area open to vertical flow is simulated, as shown in Figure B-18.
The initial degradation of fuel assemblies in ring 1 results in a downward relocation of debris, toward the core plate. Build-up of debris on the core plate causes significant reduction in the area for vertical flow. By about T+5 hours, enough debris has built-up to transiently prevent any steam flow to rise through the core plate upward through fuel assemblies in the first radial region. It is only when the core plate under the ring 1 fuel assemblies fails that the vertical flow area increases—due to the relocation of all core material out of the first radial region and into the lower plenum.
A slower, but similarly severe degradation in the open area for vertical flow in the second radial region is shown in Figure B-18. The MELCOR simulation indicates that the minimum open area decreases to about 30% of nominal between T+5 hours and T+6 hours. The fuel assemblies in this second radial region are simulated to be blocked to upward steam flow through the core plate beyond about T+6 hours. Unlike the first radial region, the core plate under the fuel assemblies in the second radial region does not fail.
Differing central and peripheral region minimum vertical flow area fractions are due to the reduction of decay heat level toward the core periphery. The reduction in decay heat level does not have this same effect in the MAAP5 simulated minimum vertical flow area fractions. As shown in Figure B-18, the lower decay power in peripheral fuel assemblies results in a later onset of degradation moving from the core center to periphery.
There is also a progressive loss of vertical flow area from the center to the periphery. The formation of blockages in the center of the core is followed after a relatively short time by the formation of blockages in neighboring fuel assemblies. In this manner, MAAP5 simulates a progressive march of severe loss of vertical flow area out from the core center to the core periphery.
The MAAP5 modeling of core melt progression thus represents a radial coupling between fuel assemblies. This type of radial coupling does not appear in the MELCOR simulation.
The degree of radial coupling between fuel assemblies is illustrated through the comparison of fuel temperature distributions shown in Figure B-19 and Figure B-20 for the MAAP5 and MELCOR simulations, respectively. This shows the nodal fuel temperature over the active fuel region of the core.
B-42

Figure B-19 Distribution of Active Fuel Region Fuel Temperatures at Different Times from MAAP5 Simulation
B-43
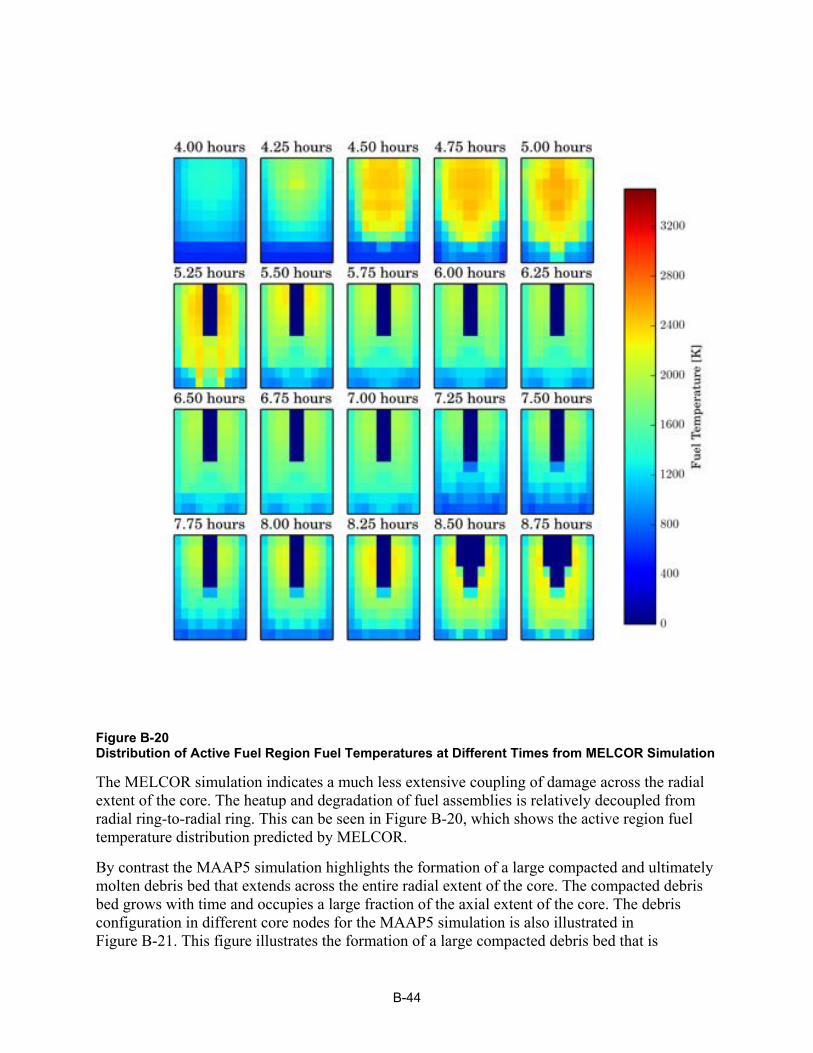
Figure B-20 Distribution of Active Fuel Region Fuel Temperatures at Different Times from MELCOR Simulation
The MELCOR simulation indicates a much less extensive coupling of damage across the radial extent of the core. The heatup and degradation of fuel assemblies is relatively decoupled from radial ring-to-radial ring. This can be seen in Figure B-20, which shows the active region fuel temperature distribution predicted by MELCOR.
By contrast the MAAP5 simulation highlights the formation of a large compacted and ultimately molten debris bed that extends across the entire radial extent of the core. The compacted debris bed grows with time and occupies a large fraction of the axial extent of the core. The debris configuration in different core nodes for the MAAP5 simulation is also illustrated in Figure B-21. This figure illustrates the formation of a large compacted debris bed that is
B-44
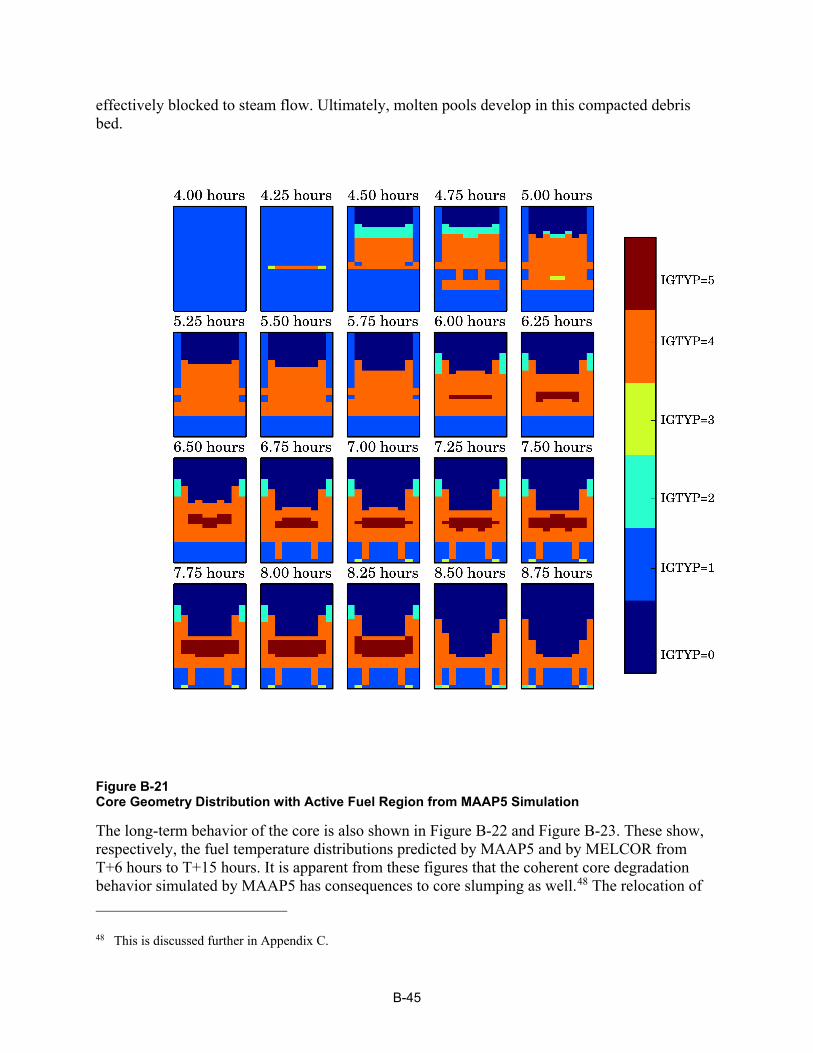
effectively blocked to steam flow. Ultimately, molten pools develop in this compacted debris bed.
Figure B-21 Core Geometry Distribution with Active Fuel Region from MAAP5 Simulation
The long-term behavior of the core is also shown in Figure B-22 and Figure B-23. These show, respectively, the fuel temperature distributions predicted by MAAP5 and by MELCOR from T+6 hours to T+15 hours. It is apparent from these figures that the coherent core degradation behavior simulated by MAAP5 has consequences to core slumping as well.48 The relocation of
48 This is discussed further in Appendix C.
B-45

essentially all the core is shown to occur after T+8 hours (initial shroud failure occurs at T+8.5 hours).
Figure B-22 Distribution of Active Fuel Region Fuel Temperatures to End of MAAP5 Simulation
The MELCOR simulation, on the other hand, highlights the more incoherent core degradation exhibited in Figure B-23. Each radial ring slumps to the lower plenum in a largely independent manner.
B-46
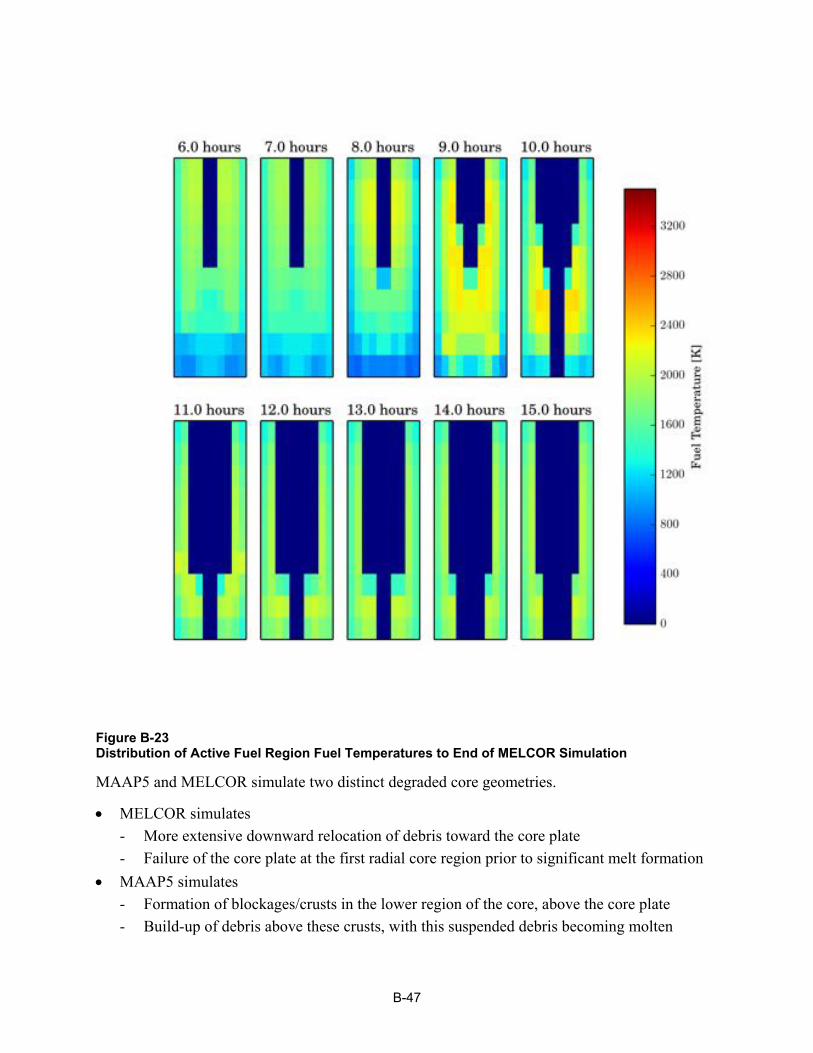
Figure B-23 Distribution of Active Fuel Region Fuel Temperatures to End of MELCOR Simulation
MAAP5 and MELCOR simulate two distinct degraded core geometries.
• MELCOR simulates - More extensive downward relocation of debris toward the core plate - Failure of the core plate at the first radial core region prior to significant melt formation
• MAAP5 simulates - Formation of blockages/crusts in the lower region of the core, above the core plate - Build-up of debris above these crusts, with this suspended debris becoming molten
B-47

- Convective circulation within molten debris nodes transferring heat predominately to neighboring core nodes in the radial direction
- Radial spreading of the core region molten pool
B.6 Comparison of MAAP5 and MELCOR Simulation of Core Failure Mechanisms The previous section discussed the comparison of MAAP5 and MELCOR simulation of the overall core degradation. This focused on the global or bulk characterization of core degradation, identifying key differences related to
• MAAP5 calculation of more extensive core material melting relative to MELCOR • MELCOR determination of more extensive heat rejection from core debris to RPV gases
How the two codes simulation degraded core geometry is the critical deviation giving rise to these distinct features. This section provides additional comparison of the simulation of core failure modes.
The comparisons provided in this section, however, are not intended to be considered at each stage of the overall core degradation transient. The critical different in modeling of degraded core geometry between the two codes obviates the usefulness of such a comparison—i.e., the two simulations have diverged already at a gross level. Comparison, however, of how distinct failure modes are represented by each code (i.e., at what temperature do control blades first fail) is of distinct value. This facilitates the determination of how different individual components of core degradation are between the two simulations.
The purpose of this section is thus to identify any additional features of core degradation modeling that may be relevant to the key simulation differences identified above.
B.6.1 Degradation of Control Blade Structure Control blades are one of the earliest structures to undergo degradation. This is because of the eutectic interaction that occurs between B4C and stainless steel, which causes the control blade structure to melt at 1500 K.
Figure B-24 presents MELCOR simulation results for the control blade temperatures. The temperatures presented are for all core nodes in the core region. This figure indicates that failure of control blade material occurs at a temperature of 1500 K, which corresponds to the stainless steel-B4C eutectic melt temperature as discussed above.
Figure B-24 presents MAAP5 simulation results for all control blade temperatures across the core. The temperatures are non-zero only for nodes in which the control blade has not failed—a control blade temperature of zero indicates failure of the control blade structure in the node.
As with the MELCOR simulation, the results in Figure B-24 demonstrate that MAAP5 is representing similar physics related to the formation of a stainless steel-B4C eutectic at 1500 K. The occurrence of this eutectic results in formation of liquid control blade material that then relocates downward (i.e., out of the node). This dissolution first starts at the top of the control blade. Molten material and debris relocate progressively downward.
B-48
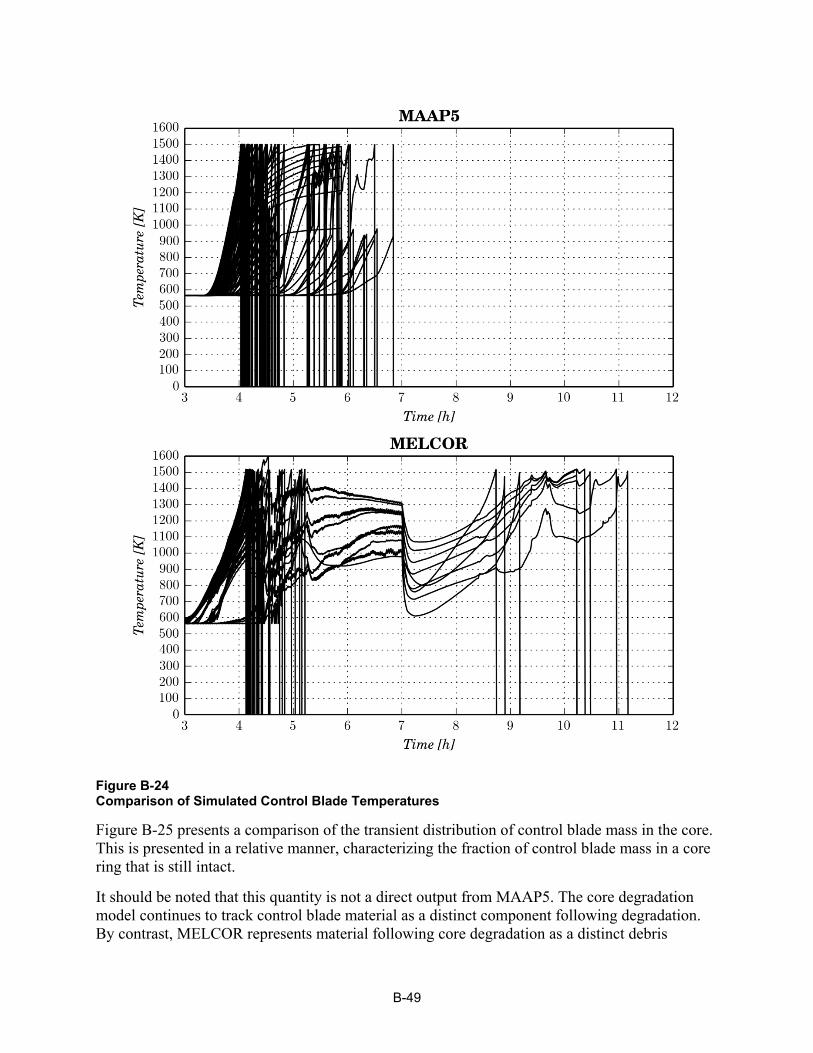
Figure B-24 Comparison of Simulated Control Blade Temperatures
Figure B-25 presents a comparison of the transient distribution of control blade mass in the core. This is presented in a relative manner, characterizing the fraction of control blade mass in a core ring that is still intact.
It should be noted that this quantity is not a direct output from MAAP5. The core degradation model continues to track control blade material as a distinct component following degradation. By contrast, MELCOR represents material following core degradation as a distinct debris
B-49

component of the total core mass. To represent this quantity for comparison purposes, the MAAP5 results are processed to identify the mass of control blade material belonging to nodes where control blade collapse has not occurred (i.e., the control blade temperature is below 1500 K). These are the MAAP5 results presented in Figure B-25.
Figure B-25 Comparison of Fraction of Intact Control Blade Mass
B-50
B.6.2 Degradation Fuel Canister Structures Figure B-26 presents a comparison of the MAAP5 and MELCOR predictions of intact fuel canister temperatures in all the core nodes. The temperatures are non-zero only for nodes in which the fuel canister has not failed—a fuel canister temperature of zero indicates failure of the control blade structure in the node.
The simulated distribution of mass in each radial ring is shown Figure B-27. These masses are normalized to the nominal mass in each ring prior to core damage. As fuel canisters typically fail from the top down, the fraction of intact mass can act as a surrogate for the highest elevation (within the active fuel region) of intact fuel canisters. Also, note that increase in the MELCOR fuel canister intact fraction above 1.0 is due to control blade mass that melted and refroze onto fuel canisters.
MAAP5 calculates the eventual failure of all of the fuel canisters, while MELCOR does not predict fuel canister failure in ring 5. The lower portion of rings 3 and 4 are not predicted to fail until about T+9.5 hours. This is a key difference between the two simulations. Compared to MAAP5, the MELCOR results also show a shorter period between initial fuel canister failures and complete failure of the canisters within a given ring.
B-51
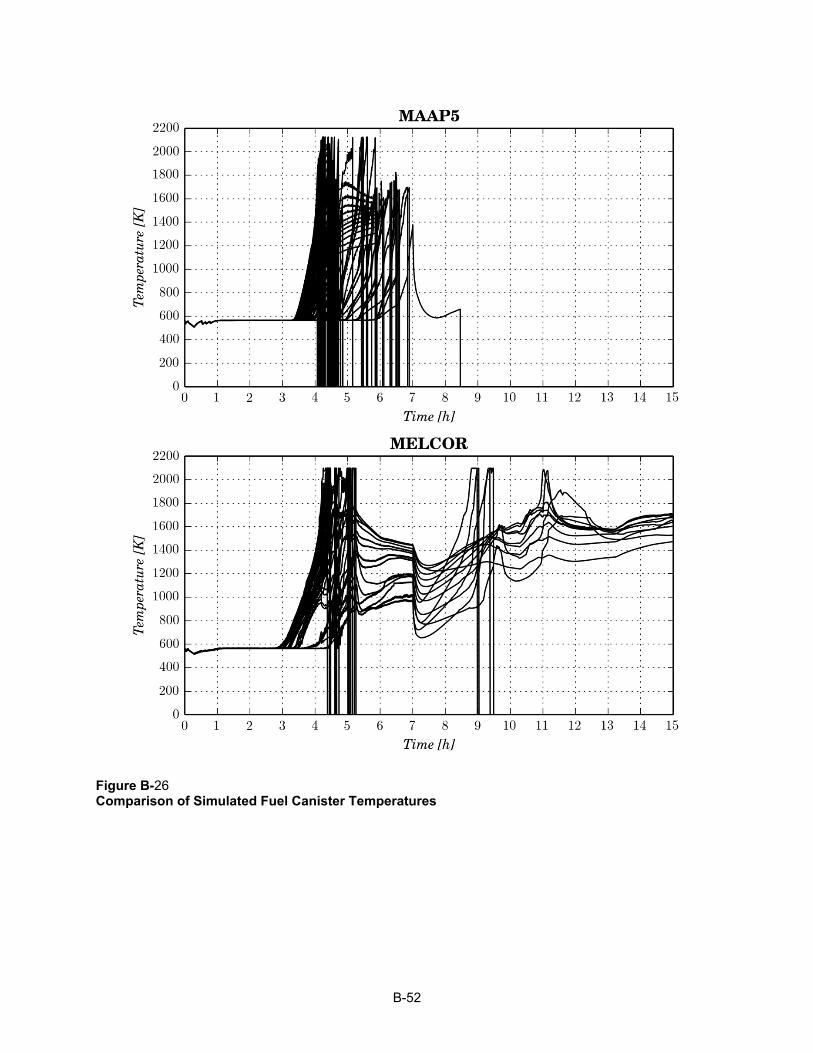
Figure B-26 Comparison of Simulated Fuel Canister Temperatures
B-52
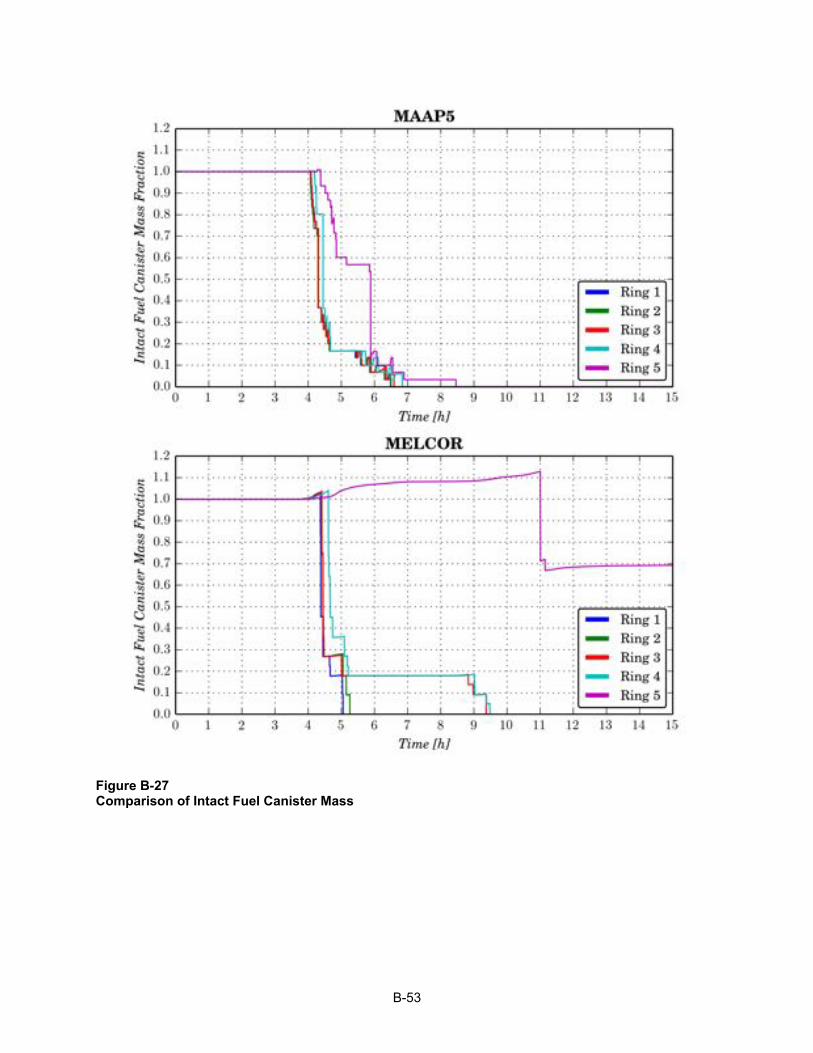
Figure B-27 Comparison of Intact Fuel Canister Mass
B-53
B.6.3 Degradation of Fuel Assemblies As discussed above, different mechanisms influence the degradation of fuel assembly structures.
• Zircaloy cladding heat up and melting • Dissolution due to eutectic formation between Zircaloy cladding and UO2 • High temperature loss of structural integrity (prior to fuel melting)
The following discussion is focused on resolving the contribution of these different mechanisms to overall fuel assembly degradation.
B.6.3.1 Fuel Cladding Melting Figure B-28 presents a comparison of the MAAP5 and MELCOR predicted values for the fuel cladding temperatures in all the core nodes. The temperatures are non-zero only for nodes in which the fuel cladding has not failed—a fuel cladding temperature of zero indicates failure of the fuel cladding in the node.
B-54

Figure B-28 Comparison of Intact Fuel Cladding Temperature Transient49
49 Fuel cladding can comprise oxidized Zircaloy. The temperatures reported can thus be in excess of the melting point of unoxidized Zircaloy.
B-55
B.6.3.2 Fuel Degradation An additional way in which fuel assemblies can begin to degrade is through the melting of the fuel. Typically, this occurs in conjunction with fuel cladding heat up and melting. As noted above, formation of a molten U-Zr-O eutectic is the primary mechanism driving liquefaction of UO2.50
Melting of either fuel cladding or fuel are not the only mechanisms by which fuel assembly degradation occurs. Fuel cladding oxidation results in material properties changing, with oxidized material becoming more
• Resistant to melt formation as melting temperatures increase with oxygen content • Susceptible to creep failure as the elastic response properties tend to degrade with increasing
oxygen content
The following discussion contrasts different aspects of fuel failure predictions identified through the MAAP5 and MELCOR simulations.
Figure B-29 presents a comparison of the MAAP5 and MELCOR predictions of the intact fuel temperatures in all the core nodes. The temperatures are non-zero only for nodes in which the fuel has not failed—a fuel temperature of zero indicates failure of the fuel in the node.
Relative to the MAAP5 simulation, MELCOR simulates less extensive heat up of the fuel.
• MAAP5 fuel temperatures can reach temperatures in excess of 3000 K, primarily later in the core degradation transient as peripheral assemblies are attacked by sideward relocating molten debris
• MELCOR temperatures generally remain below about 2500 K due to the different fuel assembly collapse conditions represented - Current MAAP5 best practice is based on an interpretation of hydrogen generation
observed at Phebus experiments - This is in contrast to the MELCOR best practice, which interprets the overall fuel
assembly collapse conditions based on the VERCORS experiments - These two choices for best practice modeling are at odds, since VERCORS tends to
indicate that fuel assembly collapse can occur at relatively lower temperatures than MAAP5 simulates to match the TMI-2 hydrogen generation
The condition of the core is correlated to the relatively high temperatures of fuel in a MAAP5 simulation. Figure B-19 illustrates this point, presenting a map of core damage condition. Peak fuel temperatures are simulated in excess of 3000 K in the core once debris has compacted into a bed with limited axial flow area (relative to nominal).
50 Melting of UO2 without significant heat up of fuel cladding occurs for scenarios with a very rapid power increase in the fuel (i.e., at a rate greater than that by which heat can be conducted through the fuel pin to the cladding). Typically only a small (on the order of a few %) amount of UO2 is liquefied in this manner.
B-56
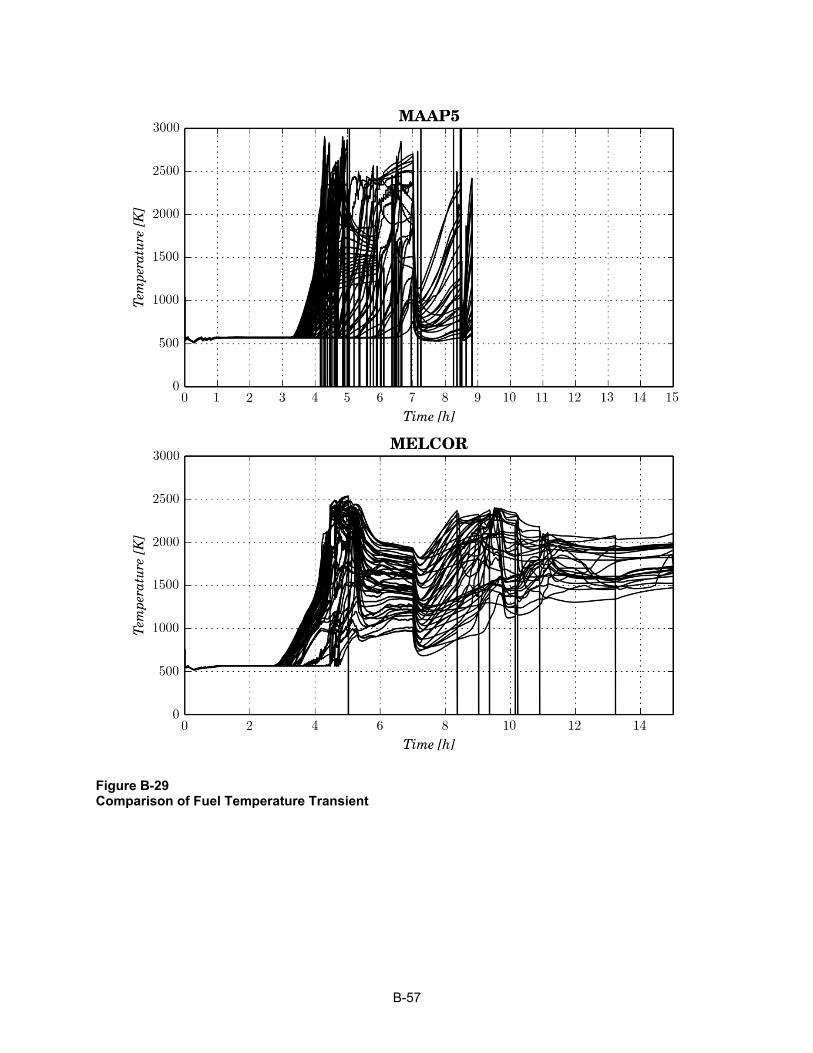
Figure B-29 Comparison of Fuel Temperature Transient
B-57
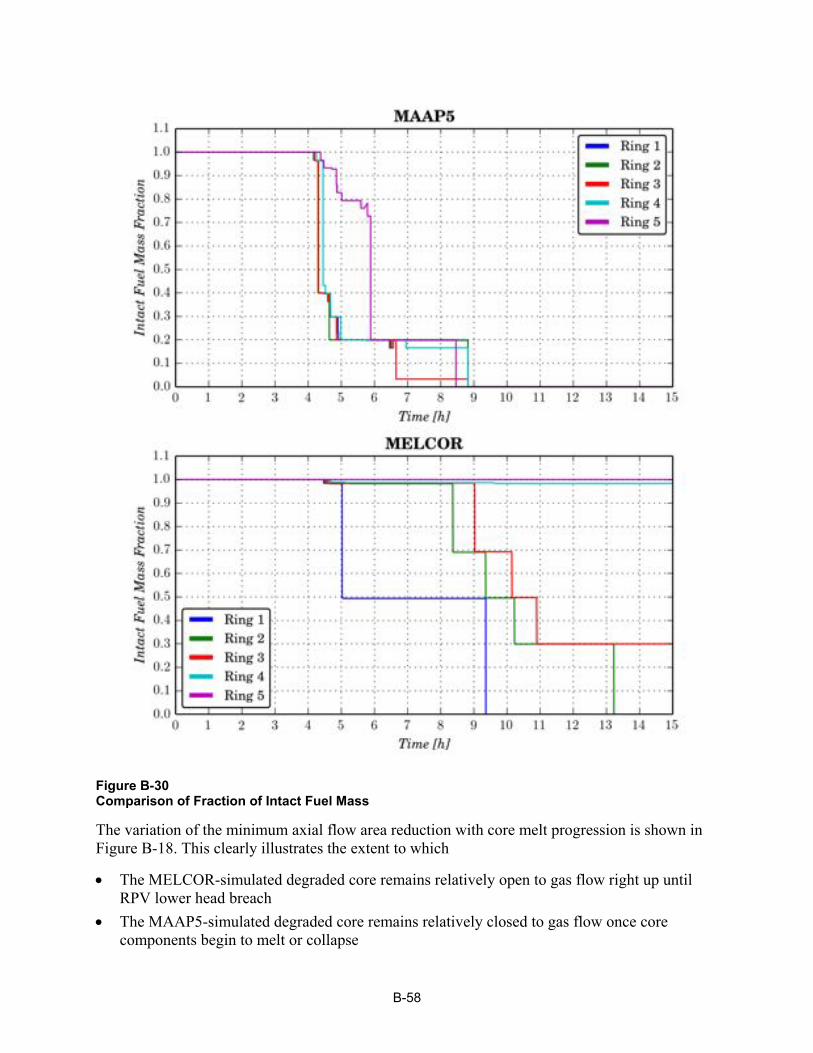
Figure B-30 Comparison of Fraction of Intact Fuel Mass
The variation of the minimum axial flow area reduction with core melt progression is shown in Figure B-18. This clearly illustrates the extent to which
• The MELCOR-simulated degraded core remains relatively open to gas flow right up until RPV lower head breach
• The MAAP5-simulated degraded core remains relatively closed to gas flow once core components begin to melt or collapse
B-58
Figure A-1 illustrates how a significant reduction in the amount of decay and chemical heat MELCOR simulates being rejected to material stored energy. In the MELCOR simulation, almost all of the energy produced in the degrading core is rejected to RPV gases. This can be expected from how the core remains relatively open (i.e., the porosity remains relatively high) to gas flow and, by extension, heat transfer.
By contrast, Figure A-1 also illustrates how decay and chemical heat are rejected to stored energy in a larger fraction than represented in the MELCOR simulation. As a result, much more molten debris develops in the MAAP5 simulation. The temperature of this debris is only limited by the extent to which natural convection of molten debris in the core region can reject heat to surrounding debris crusts.
In the MAAP5 simulation, the absence of good flow paths through the debris limits the heat transfer surface area. The only means by which energy generated within this type of compacted debris bed can be rejected is for high temperatures to develop. These high temperatures cause the debris to melt and convect—this convection achieves what thermal conduction cannot as it moves heat generated within the debris to the exposed surfaces of the debris bed. In this manner, limited flow paths through the debris make it a certainty that high temperature debris will form to re-establish quasi-equilibrium between what is generated inside the debris and what is rejected from the debris.
B.7 Summary of Key Modeling and Simulation Differences The above discussion has highlighted the key modeling differences between the two codes. These differences are manifest in key disparities between simulation results for core melt progression.
• Both computer codes simulate the different core debris failure modes in a similar manner - There are slight differences that arise in, for example, the temperature at which fuel
canisters first begin to degrade - However, this type of difference only influences the time at which fuel canister
degradation commences • The simulation of these different failure mechanisms is actually in very good agreement
because the underlying mechanisms have been well explored in separate effect experiments • The codes differ in representing degraded core morphologies
- Downward relocation of particulate debris o MELCOR represents far more extensive relocation of fuel particulate debris on to the
core plate based on debris relocating into the core bypass to minimize the debris static head
o MAAP5 tends to limit the downward relocation of particulate fuel debris because of the limited open volume in lower regions of fuel assemblies—this facilitates build-up of debris above the core plate into particulate beds with low porosities
- Flow and heat transfer area through a particulate debris bed o MELCOR represents a particulate debris bed in terms of fixed diameter particles—
additional debris does not accumulate within open volume and limit the heat transfer surface area
B-59
o MAAP5 assumes that a particulate debris bed can continue to accept debris into open regions, and thus will lose flow and heat transfer surface area as these pores are “filled up” beyond a critical value
- Fraction of core forming molten debris o As a result of these distinctly different ways of modeling degraded core geometries,
MAAP5 simulates far more extensive melting of core debris than MELCOR The areas in which the two computer codes differ relate to how models have been extrapolated from available experimental tests, as well as the TMI-2 event. The differences between the two codes should not be interpreted in terms of level of correctness, since both codes represent the known physics in the same manner. They differ in areas of incomplete knowledge due to reactor scale information not being available.
Thus, the differences between how the two codes represent core degradation, prior to core slumping, should be treated as a realization of epistemic uncertainty.
B.8 References [B-1] Nuclear Safety in Light Water Reactors: Severe Accident Phenomenology. B.R. Sehgal,
ed., Academic Press, New York, NY: 2012.
[B-2] New Determination of the UO2/Zircaloy Reaction Kinetics and Calculation of the Oxygen Diffusion Coefficients. P. Hofmann, H. Uetsuka, E. Garcia and A. Denis. KfK 4253, CNEA NT-33/86: 1987.
[B-3] Y. Pontillon, P.P. Malgouyres, G. Ducros, G. Nicaise, R. Dubourg, , M. Kissane and M. Baichi, “Lessons learnt from VERCORS tests. Study of the active role played by UO2-ZrO2-FP interactions on irradiated fuel collapse temperature,” Journal of Nuclear Materials, Volume 344, pp. 265-273, 2005.
[B-4] I. F. Macdonald, M. S. El-Sayed, K. Mow, and F. A. L. Dullien, “Flow Through Porous Media – the Ergun Equation Revisited,” in Ind. Eng. Chem. Fundam., Vol. 18, No. 3, pp. 199-208, 1979.
[B-5] E. Achenbach, “Heat Transfer and Pressure Drop of Pebble Beds Up to High Reynolds Number,” in Proceedings of Seventh International Heat Transfer Conference, Vol. 1, pp. 3-8, 1982.
[B-6] S. Ergun, “Fluid Flow Through Packed Columns,” in Chem. Eng. Progress, Vol. 48, No. 2, p. 504 (1952).
B-60
C MAAP5 AND MELCOR SIMULATION OF RPV LOWER PLENUM DEBRIS DYNAMICS AND LOWER HEAD BREACH C.1 Introduction The primary focus of this comparative study has been the investigation of how MAAP5 and MELCOR represent core degradation prior to slumping to the RPV lower plenum. Behavior prior to core slumping has important consequences with respect to
• Mass and energy transport into containment influencing - The extent of containment overpressurization - The suppression pool fission product aerosol retention effectiveness
• The potential for a flammable gas hazard to develop outside containment • The extent and duration of debris slumping to the lower plenum • The extent to which debris in the lower plenum can be cooled
The state of debris in the lower plenum also has significant implications to overall accident progression. The state of lower plenum debris impacts
• The time at which RPV lower head breach first occurs • The nature of RPV lower head breach
- The location of RPV lower head breach influences how much debris can initially relocate into containment
- A lower head breach where the lower head wall contacts the top of the debris bed will result in a smaller fraction of debris initially relocating into containment
- A gross lower head breach near the bottom of the RPV lower head will result in a faster release of the majority of core debris into containment
• The rate at which debris entering into containment can spread over the containment floor - Superheated, oxidic molten debris is likely to spread over nearly the entire containment
floor area [C-1] • The potential for debris in containment to form a coolable geometry
- The fraction of debris that is molten has a critical impact on how much fragmentation, and enhancement of heat transfer surface area, occurs by pre-existing water pools
• The requirements on water injection to cover debris in containment - Relocating, primarily solid debris will not spread as rapidly and can accumulate into a
mound of greater depth - Such a containment debris bed would require containment to be flooded to a greater
depth to ensure submergence of the bed
C-1
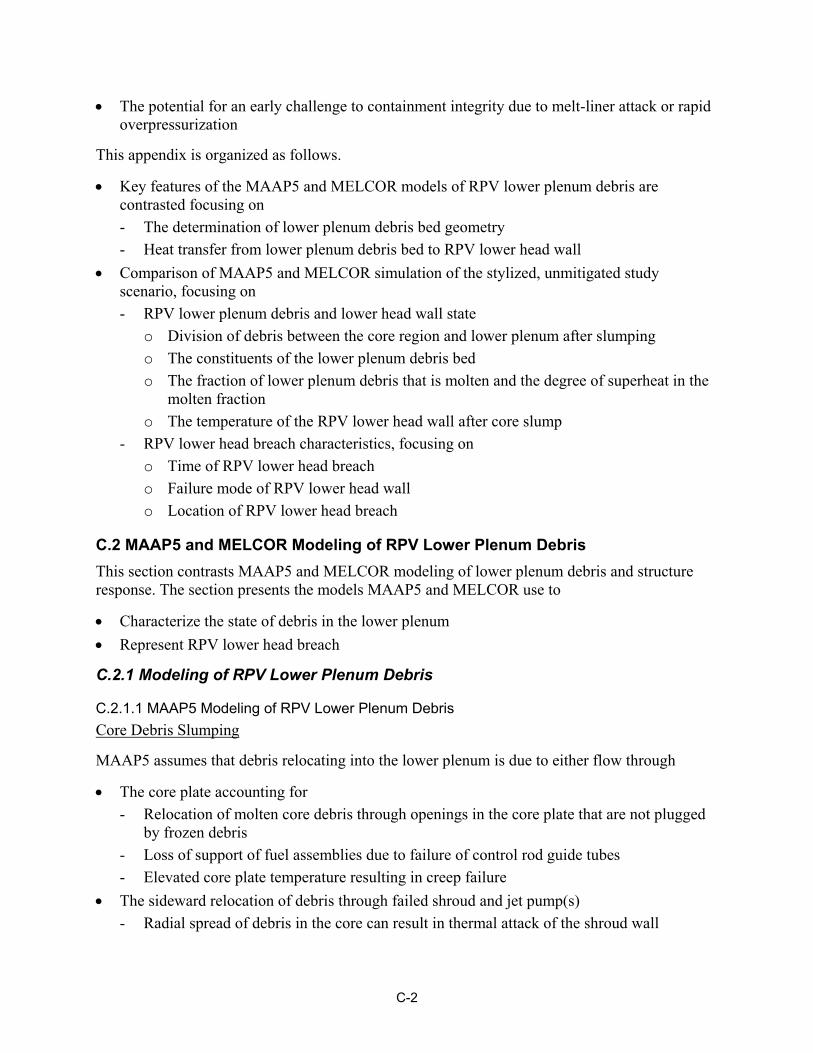
• The potential for an early challenge to containment integrity due to melt-liner attack or rapid overpressurization
This appendix is organized as follows.
• Key features of the MAAP5 and MELCOR models of RPV lower plenum debris are contrasted focusing on - The determination of lower plenum debris bed geometry - Heat transfer from lower plenum debris bed to RPV lower head wall
• Comparison of MAAP5 and MELCOR simulation of the stylized, unmitigated study scenario, focusing on - RPV lower plenum debris and lower head wall state
o Division of debris between the core region and lower plenum after slumping o The constituents of the lower plenum debris bed o The fraction of lower plenum debris that is molten and the degree of superheat in the
molten fraction o The temperature of the RPV lower head wall after core slump
- RPV lower head breach characteristics, focusing on o Time of RPV lower head breach o Failure mode of RPV lower head wall o Location of RPV lower head breach
C.2 MAAP5 and MELCOR Modeling of RPV Lower Plenum Debris This section contrasts MAAP5 and MELCOR modeling of lower plenum debris and structure response. The section presents the models MAAP5 and MELCOR use to
• Characterize the state of debris in the lower plenum • Represent RPV lower head breach
C.2.1 Modeling of RPV Lower Plenum Debris
C.2.1.1 MAAP5 Modeling of RPV Lower Plenum Debris Core Debris Slumping
MAAP5 assumes that debris relocating into the lower plenum is due to either flow through
• The core plate accounting for - Relocation of molten core debris through openings in the core plate that are not plugged
by frozen debris - Loss of support of fuel assemblies due to failure of control rod guide tubes - Elevated core plate temperature resulting in creep failure
• The sideward relocation of debris through failed shroud and jet pump(s) - Radial spread of debris in the core can result in thermal attack of the shroud wall
C-2
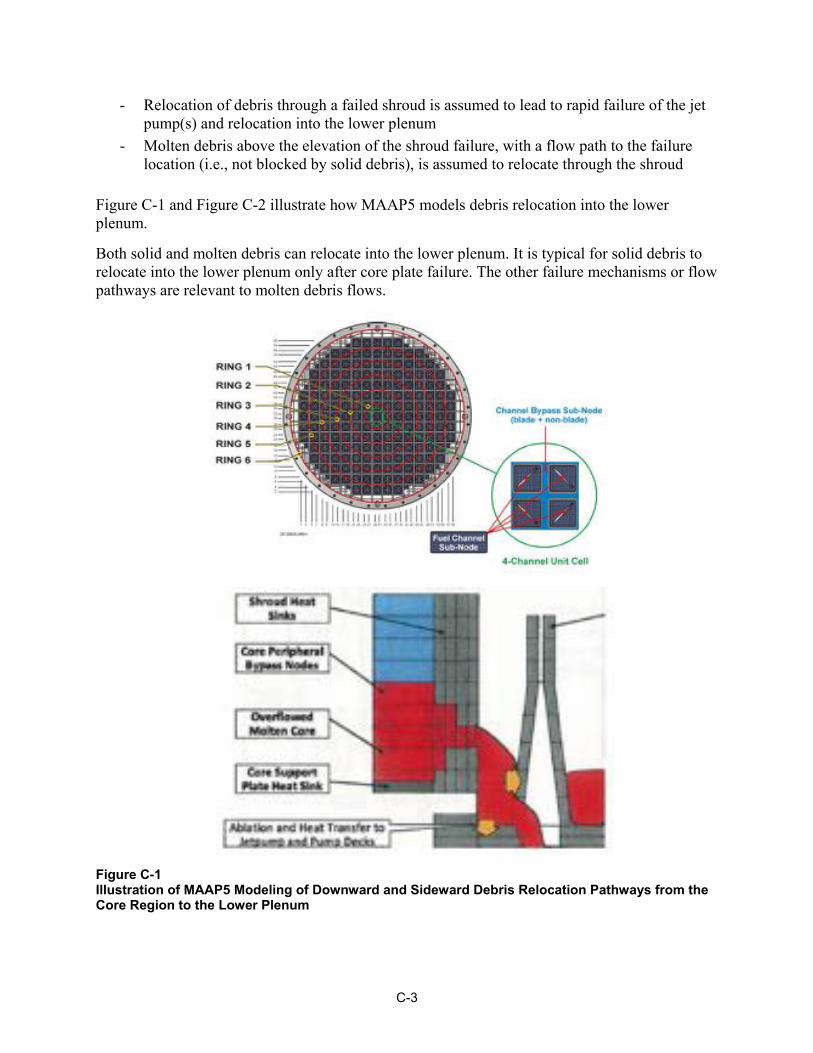
- Relocation of debris through a failed shroud is assumed to lead to rapid failure of the jet pump(s) and relocation into the lower plenum
- Molten debris above the elevation of the shroud failure, with a flow path to the failure location (i.e., not blocked by solid debris), is assumed to relocate through the shroud
Figure C-1 and Figure C-2 illustrate how MAAP5 models debris relocation into the lower plenum.
Both solid and molten debris can relocate into the lower plenum. It is typical for solid debris to relocate into the lower plenum only after core plate failure. The other failure mechanisms or flow pathways are relevant to molten debris flows.
Figure C-1 Illustration of MAAP5 Modeling of Downward and Sideward Debris Relocation Pathways from the Core Region to the Lower Plenum
C-3

As debris relocates into the lower plenum, out of the core region, MAAP5 assumes that it forms a mechanical mixture. This mechanical mixture is comprised of two types of debris entering
• Completely solid, rubbleized debris • Molten or partially molten (slurry) debris
Lower Plenum Debris Bed Morphology
The debris in the lower plenum is initially treated as two distinct beds.
• A particulate bed formed from - Completely solid debris slumping into the lower plenum - Molten debris entrained in lower plenum water
• A continuous bed formed from the debris not entrained by lower plenum water
Figure C-2 Illustration of MAAP5 Modeling of Debris Relocation to Lower Plenum
The lower plenum particulate debris bed is assumed to form on top of the continuous debris bed. The debris is a mixture of metallic and oxidic material distributed as spherical particles of constant diameter. The radius of these particles represents an average of the particle diameters resulting from entrainment of all debris jets that relocated into lower plenum water. The heat transfer surface area for this particulate debris bed is thus quite large.
C-4
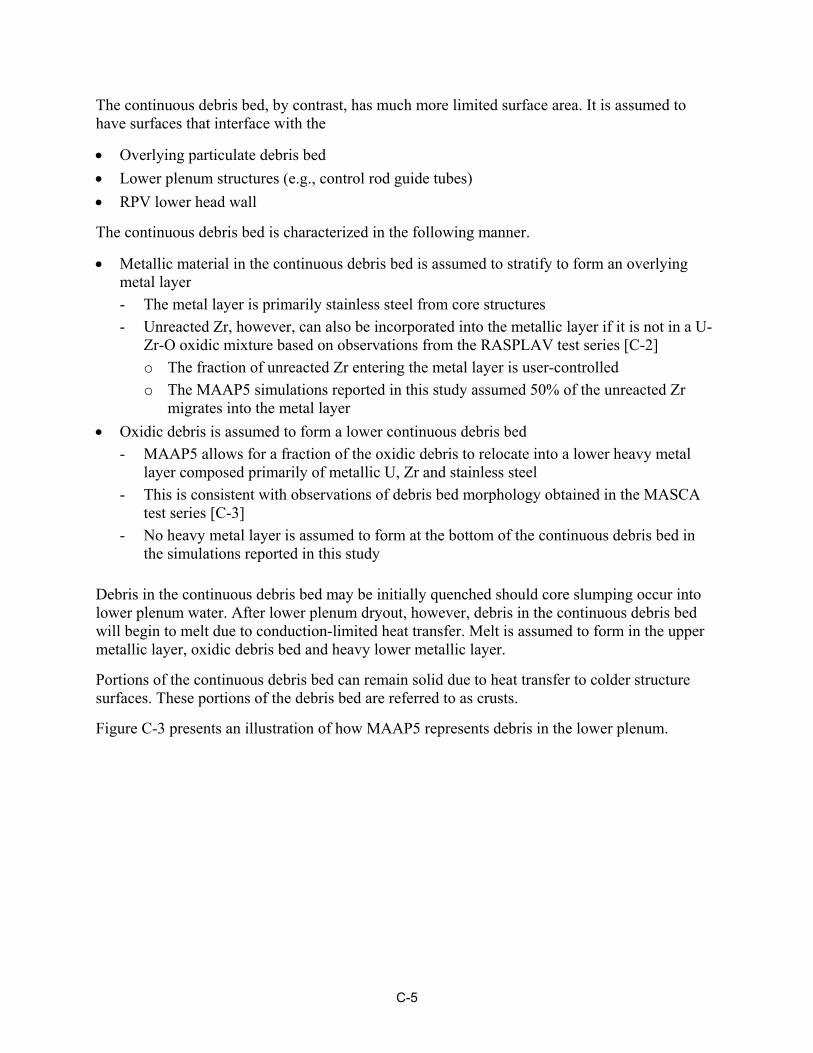
The continuous debris bed, by contrast, has much more limited surface area. It is assumed to have surfaces that interface with the
• Overlying particulate debris bed • Lower plenum structures (e.g., control rod guide tubes) • RPV lower head wall
The continuous debris bed is characterized in the following manner.
• Metallic material in the continuous debris bed is assumed to stratify to form an overlying metal layer - The metal layer is primarily stainless steel from core structures - Unreacted Zr, however, can also be incorporated into the metallic layer if it is not in a U-
Zr-O oxidic mixture based on observations from the RASPLAV test series [C-2] o The fraction of unreacted Zr entering the metal layer is user-controlled o The MAAP5 simulations reported in this study assumed 50% of the unreacted Zr
migrates into the metal layer • Oxidic debris is assumed to form a lower continuous debris bed
- MAAP5 allows for a fraction of the oxidic debris to relocate into a lower heavy metal layer composed primarily of metallic U, Zr and stainless steel
- This is consistent with observations of debris bed morphology obtained in the MASCA test series [C-3]
- No heavy metal layer is assumed to form at the bottom of the continuous debris bed in the simulations reported in this study
Debris in the continuous debris bed may be initially quenched should core slumping occur into lower plenum water. After lower plenum dryout, however, debris in the continuous debris bed will begin to melt due to conduction-limited heat transfer. Melt is assumed to form in the upper metallic layer, oxidic debris bed and heavy lower metallic layer.
Portions of the continuous debris bed can remain solid due to heat transfer to colder structure surfaces. These portions of the debris bed are referred to as crusts.
Figure C-3 presents an illustration of how MAAP5 represents debris in the lower plenum.
C-5
Figure C-3 MAAP5 Representation of Lower Plenum Debris Bed
Debris can move from the particulate and continuous debris beds.
• Particulate debris that melts is assumed to relocate into the continuous debris bed • Upon formation of an upper metallic layer, particulate debris is assumed to become
submerged in the layer (unless a crust overlies the metallic layer)51
Transport of debris is not possible from the continuous to particulate debris bed. There is no mechanism by which continuous debris can particulate within the lower plenum.
In summary, MAAP5 represents lower plenum debris beds comprised of the following constituents.
• Internal oxidic debris pool (i.e., U-Zr-O molten pool) • Material inside the oxidic debris pool that freezes on lower plenum structures (referred to as
embedded crusts) • Frozen material on the upper surface of the oxidic debris pool (referred to as an upper crust) • Frozen material at the interface between the oxidic debris pool and the lower head wall
(referred to as the lower crust) • A layer of metallic debris above the oxidic molten pool, separated by the upper crust • Particulate debris above the metallic layer
51 Decay heat from particulate debris submerged in the metallic layer is added to this layer
C-6
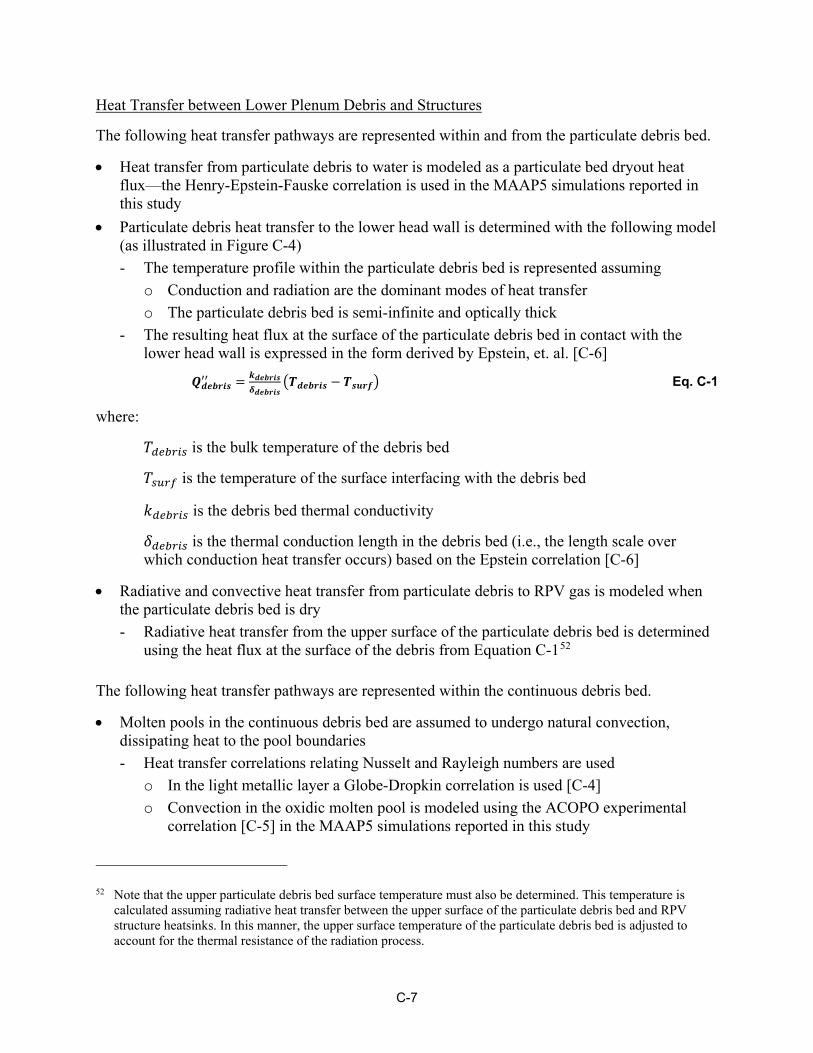
Heat Transfer between Lower Plenum Debris and Structures
The following heat transfer pathways are represented within and from the particulate debris bed.
• Heat transfer from particulate debris to water is modeled as a particulate bed dryout heat flux—the Henry-Epstein-Fauske correlation is used in the MAAP5 simulations reported in this study
• Particulate debris heat transfer to the lower head wall is determined with the following model (as illustrated in Figure C-4) - The temperature profile within the particulate debris bed is represented assuming
o Conduction and radiation are the dominant modes of heat transfer o The particulate debris bed is semi-infinite and optically thick
- The resulting heat flux at the surface of the particulate debris bed in contact with the lower head wall is expressed in the form derived by Epstein, et. al. [C-6]
𝑸𝑸𝒓𝒓𝒆𝒆𝒃𝒃𝒓𝒓𝒊𝒊𝒓𝒓′′ = 𝒌𝒌𝒓𝒓𝒆𝒆𝒃𝒃𝒓𝒓𝒊𝒊𝒓𝒓
𝜹𝜹𝒓𝒓𝒆𝒆𝒃𝒃𝒓𝒓𝒊𝒊𝒓𝒓�𝑻𝑻𝒓𝒓𝒆𝒆𝒃𝒃𝒓𝒓𝒊𝒊𝒓𝒓 − 𝑻𝑻𝒓𝒓𝒄𝒄𝒓𝒓𝒇𝒇� Eq. C-1
where:
𝑇𝑇𝑟𝑟𝑛𝑛𝑏𝑏𝑟𝑟𝑑𝑑𝑟𝑟 is the bulk temperature of the debris bed
𝑇𝑇𝑟𝑟𝑠𝑠𝑟𝑟𝑓𝑓 is the temperature of the surface interfacing with the debris bed
𝑘𝑘𝑟𝑟𝑛𝑛𝑏𝑏𝑟𝑟𝑑𝑑𝑟𝑟 is the debris bed thermal conductivity
𝛿𝛿𝑟𝑟𝑛𝑛𝑏𝑏𝑟𝑟𝑑𝑑𝑟𝑟 is the thermal conduction length in the debris bed (i.e., the length scale over which conduction heat transfer occurs) based on the Epstein correlation [C-6]
• Radiative and convective heat transfer from particulate debris to RPV gas is modeled when the particulate debris bed is dry - Radiative heat transfer from the upper surface of the particulate debris bed is determined
using the heat flux at the surface of the debris from Equation C-152 The following heat transfer pathways are represented within the continuous debris bed.
• Molten pools in the continuous debris bed are assumed to undergo natural convection, dissipating heat to the pool boundaries - Heat transfer correlations relating Nusselt and Rayleigh numbers are used
o In the light metallic layer a Globe-Dropkin correlation is used [C-4] o Convection in the oxidic molten pool is modeled using the ACOPO experimental
correlation [C-5] in the MAAP5 simulations reported in this study
52 Note that the upper particulate debris bed surface temperature must also be determined. This temperature is calculated assuming radiative heat transfer between the upper surface of the particulate debris bed and RPV structure heatsinks. In this manner, the upper surface temperature of the particulate debris bed is adjusted to account for the thermal resistance of the radiation process.
C-7
• Heat dissipated from the oxide molten pool is rejected to the following components - Downward-facing oxide molten pool crust - Upward-facing oxide molten pool crust - Embedded oxide molten pool crusts
• Oxide molten pool crusts dissipate heat to the following debris bed components and lower plenum structures - The upward-facing oxide molten pool crust dissipates heat to the overlying metal layer - The downward-facing oxide molten pool crust dissipates heat to the lower head wall - The embedded oxide molten pool crusts dissipate heat to lower plenum structures (e.g.,
control rod guide tubes) - Heat transfer through crusts is conductive
o The temperature variation in a crusts is represented as a steady-state quadratic form due to the presence of internal heat generation (decay heating)
o The temperature variation is assumed to achieve steady-state in the crust due to the fact that crusts are thin (on the order of a few centimeters)
• Heat transfer between the continuous and particulate debris beds is via radiation and convection from the light metallic layer
Figure C-4 Illustration of MAAP5 Treatment of Temperature Profile in Solid Debris Bed for Conduction Heat Transfer Calculations
C.2.1.2 MELCOR Modeling of RPV Lower Plenum Debris Core Debris Slumping
The slumping of core debris into the lower plenum is not modeled in terms of a molten stream/jet. Molten debris can relocate into the lower plenum (via opening for the lower end fittings) before lower core plate failure. Solid (particulate) debris relocates into the lower plenum upon failure of the lower plate.
C-8
Lower Plenum Debris Bed Morphology
Similar to MAAP5, MELCOR represents debris in the lower plenum in terms of the following components:
• Conglomerate debris (i.e., molten debris that has frozen on lower plenum structures such as control rod guide tubes)
• Particulate debris which is idealized to constitute a bed of spherical particles of fixed diameter
• An oxidic molten pool • An overlying metallic molten pool • Lower plenum structures (e.g., control rod guide tubes)
Unlike MAAP5, however, MELCOR assumes that these different debris components accumulate within a nodalized lower plenum. The MELCOR simulations presented in this study assume that the lower plenum consists of 5 radial rings53 and 5 axial levels. The lowest level of axial nodes extends from the bottom of the RPV lower head wall to the top of the control rod guide stub tubes.
MELCOR models the distribution of debris components within lower plenum nodes based on the following assumptions. While these assumptions different from those applied in MAAP5, they are similar in principle to the assumed MAAP5 lower plenum debris bed morphology.
• Particulate debris in a lower plenum node will sink into a molten pool and displace molten pool volume
• Molten pools across a number of contiguous core nodes are assumed to form a coherent pool with heat transfer to it surfaces dominated by natural convection - Molten pools are segregated from solidified material, including particulate debris (i.e.,
molten pools cannot relocate downward and penetrate particulate debris beds) • Oxidic and metallic melts are assumed to be immiscible and will segregate into two molten
pools - The less dense metallic pool is assumed to overly the denser oxidic pool
53 In the lower plenum a 6th ring is used to represent the region below the downcomer.
C-9
Heat Transfer between Lower Plenum Debris and Structures
Heat transfer between lower plenum debris and structures is similar to MAAP5. A detailed discussion will not be presented for this reason, with one exception.
The heat flux 𝑄𝑄𝑟𝑟𝑛𝑛𝑏𝑏𝑟𝑟𝑑𝑑𝑟𝑟′′ between the lower plenum debris in contact with the lower head wall is assumed to have the form
𝑸𝑸𝒓𝒓𝒆𝒆𝒃𝒃𝒓𝒓𝒊𝒊𝒓𝒓′′ = 𝒉𝒉𝒓𝒓𝒆𝒆𝒃𝒃𝒓𝒓𝒊𝒊𝒓𝒓−𝒅𝒅𝒃𝒃𝒃𝒃𝒃𝒃𝟒𝟒𝒅𝒅𝒃𝒃𝒃𝒃𝒃𝒃(𝑻𝑻𝒓𝒓𝒆𝒆𝒃𝒃𝒓𝒓𝒊𝒊𝒓𝒓 − 𝑻𝑻𝒅𝒅𝒃𝒃𝒃𝒃𝒃𝒃) Eq. C-2
where:
ℎ𝑟𝑟𝑛𝑛𝑏𝑏𝑟𝑟𝑑𝑑𝑟𝑟−𝑤𝑤𝑏𝑏𝑏𝑏𝑏𝑏 is a user-specified heat transfer coefficient
𝐴𝐴𝑤𝑤𝑏𝑏𝑏𝑏𝑏𝑏 is the area of the lower head wall in contact with the debris node
𝑇𝑇𝑟𝑟𝑛𝑛𝑏𝑏𝑟𝑟𝑑𝑑𝑟𝑟 is the bulk temperature of the debris
𝑇𝑇𝑤𝑤𝑏𝑏𝑏𝑏𝑏𝑏 is the temperature of the inner node of the lower head that is in contact with debris
Unlike, for example Equation C-1, there is no explicit representation of the conduction length scale. The temperature profile in the bottom lower plenum debris nodes is assumed to be uniform, equal to the bulk temperature of the debris in the node. This approximation is valid only when a debris node is sufficiently thin that the heat transfer diffusion time is sufficiently small relative to the time step used in the numerical problem.
C.2.1.3 Comparison of MAAP5 and MELCOR Modeling of Lower Plenum Debris The MELCOR model for RPV lower plenum debris is quite different from the MAAP5 model. In modeling philosophy, MELCOR treats lower plenum debris in a similar manner to debris within the core region. As a result lower plenum debris beds are represented by allocating different debris components into lower plenum nodes. MELCOR then models the heat transfer between debris components and lower plenum nodes to track the evolution of the debris to a terminal lower plenum debris bed.
By contrast, MAAP5 assumes that following core slumping, a lower plenum debris bed will evolve to the form shown in Figure C-3. As a result, MAAP5 does not attempt to track the mechanistic evolution of the post-slump debris bed toward a terminal lower plenum debris bed. MAAP5 thus only models one node in the lower plenum.
Despite these fundamental differences in modeling philosophy, the most significant difference between MAAP5 and MELCOR is how heat transfer is modeled to the RPV lower head wall. MAAP5 assumes that
• Heat transfer from particulate debris to the lower head wall is conduction-limited and accounts for a conduction length scale - As a result only a fraction of the particulate debris can participate in heat transfer to the
wall - The bulk debris bed temperature can be substantially in excess of the wall temperature
• Heat transfer from debris crusts is assumed to be conduction-limited
C-10
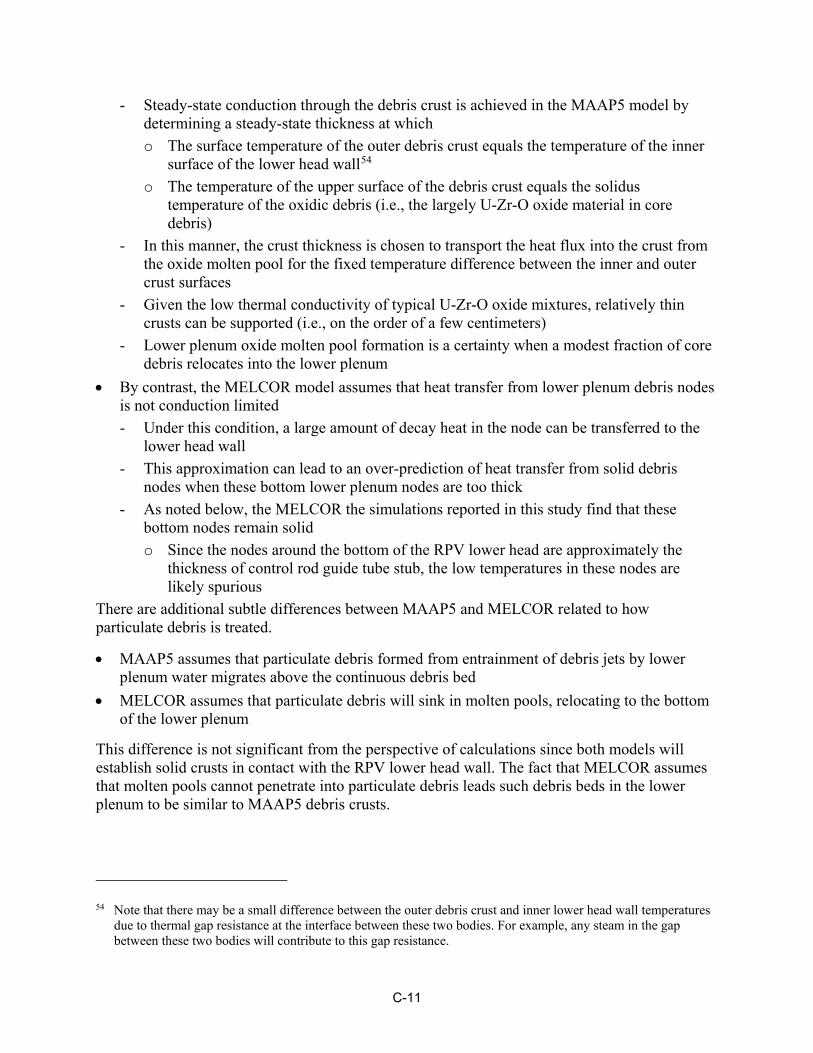
- Steady-state conduction through the debris crust is achieved in the MAAP5 model by determining a steady-state thickness at which o The surface temperature of the outer debris crust equals the temperature of the inner
surface of the lower head wall54 o The temperature of the upper surface of the debris crust equals the solidus
temperature of the oxidic debris (i.e., the largely U-Zr-O oxide material in core debris)
- In this manner, the crust thickness is chosen to transport the heat flux into the crust from the oxide molten pool for the fixed temperature difference between the inner and outer crust surfaces
- Given the low thermal conductivity of typical U-Zr-O oxide mixtures, relatively thin crusts can be supported (i.e., on the order of a few centimeters)
- Lower plenum oxide molten pool formation is a certainty when a modest fraction of core debris relocates into the lower plenum
• By contrast, the MELCOR model assumes that heat transfer from lower plenum debris nodes is not conduction limited - Under this condition, a large amount of decay heat in the node can be transferred to the
lower head wall - This approximation can lead to an over-prediction of heat transfer from solid debris
nodes when these bottom lower plenum nodes are too thick - As noted below, the MELCOR the simulations reported in this study find that these
bottom nodes remain solid o Since the nodes around the bottom of the RPV lower head are approximately the
thickness of control rod guide tube stub, the low temperatures in these nodes are likely spurious
There are additional subtle differences between MAAP5 and MELCOR related to how particulate debris is treated.
• MAAP5 assumes that particulate debris formed from entrainment of debris jets by lower plenum water migrates above the continuous debris bed
• MELCOR assumes that particulate debris will sink in molten pools, relocating to the bottom of the lower plenum
This difference is not significant from the perspective of calculations since both models will establish solid crusts in contact with the RPV lower head wall. The fact that MELCOR assumes that molten pools cannot penetrate into particulate debris leads such debris beds in the lower plenum to be similar to MAAP5 debris crusts.
54 Note that there may be a small difference between the outer debris crust and inner lower head wall temperatures due to thermal gap resistance at the interface between these two bodies. For example, any steam in the gap between these two bodies will contribute to this gap resistance.
C-11
C.2.2 MAAP5 and MELCOR Modeling of RPV Lower Head Breach Mechanisms
C.2.2.1 MAAP5 Modeling of RPV Lower Head Breach Mechanisms The MAAP5 study simulations represent the following RPV lower head breach mechanisms.
• Molten material relocation through penetration leading to thermal failure of the penetration • Molten debris thermal attack of lower head penetration welds causing weakening of the
penetration support weld • Lower head wall creep-to-failure • Thermal ablation of the lower head wall by molten debris jet impingement • Thermal erosion of the lower head wall due to heat flux focusing from an overlying metallic
layer
C.2.2.2 MELCOR Modeling of RPV Lower Head Breach Mechanisms Lower head wall creep failure is the only RPV lower head breach mechanism represented in the MELCOR simulations presented in this study.
C.2.2.3 Comparison of MAAP5 and MELCOR Modeling of RPV Lower Head Breach Mechanisms As discussed below, both models simulate that a creep failure of the RPV lower head occurs. In the case of MAAP5, this creep failure is due to differential creep between the RPV lower head wall and control rod guide tube penetration. This weakens the control rod guide tube penetration weld.
Both MAAP5 and MELCOR have developed models for lower head breach mechanisms based on experiments carried out at Sandia [C-7].
C.3 MAAP5 and MELCOR Simulation of RPV Lower Plenum Response C.3.1 MAAP5 and MELCOR Simulation of RPV Lower Plenum Debris Behavior MAAP5 models the lower plenum debris in a different manner from MELCOR. Therefore, the primary focus of this section is identifying the mechanisms by which decay heat is transported out of the debris bed into RPV structures.
This section also considers how the behavior of debris in the lower plenum is affected by distinct debris behavior in the core region. As discussed in Appendix B, the treatment of core degradation inside the core region results in different debris formation and debris state inside the core region. In particular,
• MELCOR simulates a smaller fraction of the core degrading than MAAP5 (e.g., rings 4 and 5 are not predicted to degrade in this MELCOR simulation of a stylized Fukushima Daiichi Unit 1 event)
• MAAP5 determines a larger fraction of debris melting, with debris temperatures considerably higher, than predicted by MELCOR
In addition to lower plenum debris behavior, the RPV lower head wall failure is considered in this section. The distinct differences between the two codes in terms of debris slumping to and
C-12
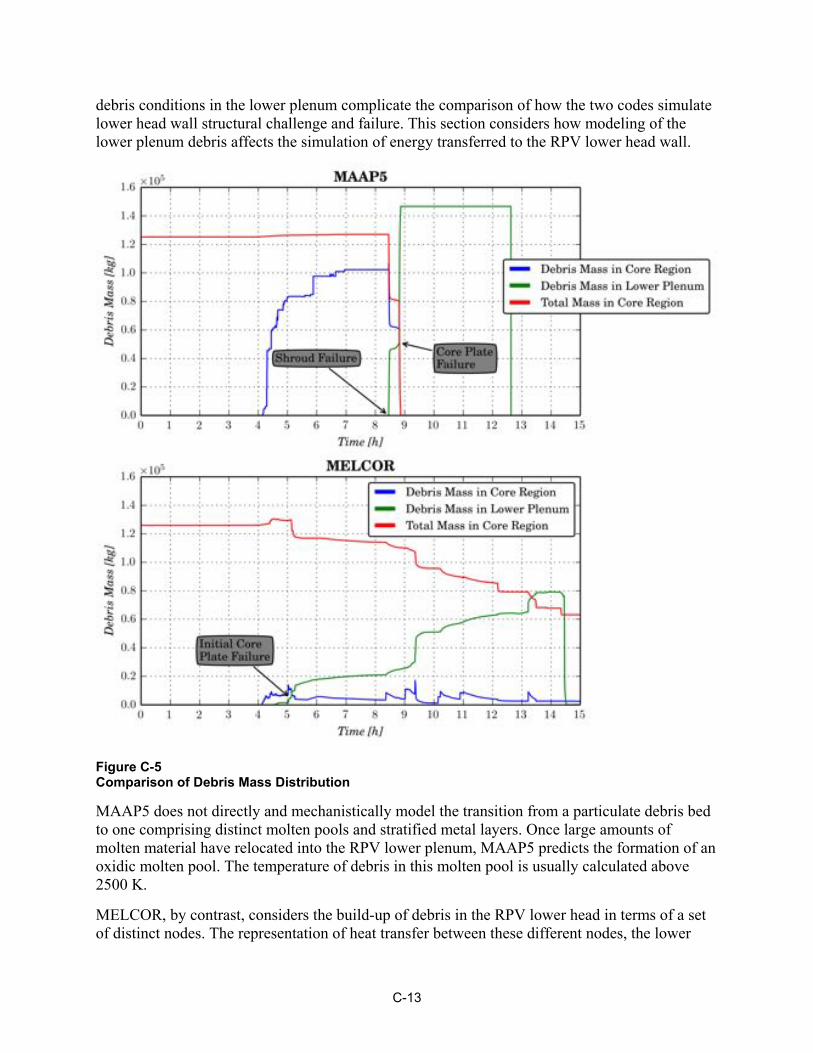
debris conditions in the lower plenum complicate the comparison of how the two codes simulate lower head wall structural challenge and failure. This section considers how modeling of the lower plenum debris affects the simulation of energy transferred to the RPV lower head wall.
Figure C-5 Comparison of Debris Mass Distribution
MAAP5 does not directly and mechanistically model the transition from a particulate debris bed to one comprising distinct molten pools and stratified metal layers. Once large amounts of molten material have relocated into the RPV lower plenum, MAAP5 predicts the formation of an oxidic molten pool. The temperature of debris in this molten pool is usually calculated above 2500 K.
MELCOR, by contrast, considers the build-up of debris in the RPV lower head in terms of a set of distinct nodes. The representation of heat transfer between these different nodes, the lower
C-13
head and RPV internals determines the configuration of the debris bed at the time of RPV lower head breach.
Figure C-5 compares the simulated total debris mass in the RPV lower plenum. This comparison clearly shows the more extensive core degradation predicted in the MAAP5 simulation. In the MAAP5 simulation, around 80% of the core material degrades (i.e., is converted to debris) about 2 hours prior to commencement of core slumping to the lower plenum (T+8.5 hours).
By contrast, the MELCOR simulation identifies a more gradual degradation of the core. By the time that MAAP5 predicts the commencement of core slumping (around T+8.5 hours), somewhat more than 30% of the core is predicted to have degraded. The mass of debris in the lower plenum, distinct from that found in the MAAP5 simulation, increases gradually from just after T+4 hours. This corresponds to the time at which control blades first fail by melting55. The molten material relocates downward to the core plate where it flows through openings in the core plate into the lower plenum.
This significant difference in the progression of core degradation can also be seen in the mass of core material that is predicted to melt in the two simulations. Figure C-6 presents the MAAP5 and MELCOR predictions for the amount of core and lower plenum structure that is molten in the core region and the lower plenum.
The following features can be identified from Figure C-6.
• Coincident with the onset of core degradation (around T+4 hours), both MAAP5 and MELCOR simulate the formation of molten material in the core region
• The molten material formation inside the core region is subsequently quite different between the two codes - From the time that core degradation starts, the mass of molten material in the core region
gradually increases in the MAAP5 simulation over a period of around 4 hours - By contrast, after about half an hour of molten material mass increasing, the MELCOR
simulation identifies an overall gradual decrease in the mass of molten material in the core region beyond T+4.5 hours o There is a sharper decrease in the mass of molten material around T+5.1 hours when
MELCOR predicts core plate failure occurring • In addition, the mass of material that is held up inside the core region and available to slump
into the lower plenum at any instant diverges beyond about T+5 hours - Molten material is held up inside the core region until core slumping commences at about
T+8.5 hours in the MAAP5 simulation o The mass of molten material held up inside the core corresponds to about 50% of the
initial core mass
55 This is due to the eutectic interaction between B4C and stainless steel. This promotes liquefaction of these materials at a temperature of 1500 K.
C-14

- The mass of molten material available to relocate out of the core region is less than 10,000 kg after core plate failure (or about 8% of the initial core mass) in the MELCOR simulation o The largest mass of molten material available to relocate into the lower plenum is
around 10,000 kg o Approximately 5,000 kg of this molten mass relocates into the lower plenum upon the
initial core plate failure at T+5.1 h
Figure C-6 Comparison of Molten Pool Mass in RPV
C-15

Thus, there are two important effects that differentiate the MAAP5 and MELCOR simulations of core slumping to the lower plenum.
• The MAAP5 simulation of significant molten debris holdup inside the core region (about 50% of the initial core mass) is due to the delayed failure of the shroud and core plate
• The MELCOR simulation, by contrast, identifies a relatively early failure of the core plate and a subsequent gradual draining of core material into the lower plenum
The distinct representation of core plate failure is ultimately due to different models for core debris relocation within the core region. As discussed in Appendix B, the MELCOR simulation identifies more extensive downward relocation of debris on to the core plate. MAAP5, by contrast, tends to hold debris above the core plate due to the formation of blockages inside the core region.
These blockages that occur in the MAAP5 simulation of the degraded core limit the ability of degraded core material to relocate into direct contact with the core plate. Similarly, the challenge to shroud integrity also represented in MAAP5 is delayed. This is due to the fact that radial relocation of core debris is required to relocate high temperature debris into contact with the shroud.56
Figure C-7 presents an additional breakdown of how the lower plenum debris is distributed between different constituents in the MAAP5 and MELCOR simulations.57 These results illustrate the extent to which lower plenum debris in MELCOR remains at sufficiently low temperatures to result in essentially no lower plenum melt formation to occur in this simulation. By contrast, significant amounts of lower plenum debris become molten in the MAAP5 simulation.
The following features are important to note from the MAAP5 simulation of debris distribution amongst lower plenum debris constituents.
• The majority of lower plenum debris in the MAAP5 simulation is molten - By the time of RPV lower head breach, approximately 60% of the debris has
accumulated in the molten oxidic debris pool • The fraction of debris that is particulate is relatively low
- Shortly after the initial core slump, the fraction of particulate debris in the lower plenum is about 25%
- After the final core slump, the particulate debris is a fraction of about 7% of the total lower plenum debris mass
- By the time of RPV lower head breach, all particulate debris has melted into the overlying stainless steel metal layer and the oxidic molten pool
56 It is important to note that this radial relocation of core debris simulated in MAAP5 provides a mechanism whereby the high powered fuel can migrate out to the peripheral region of the core. This has the effect of increasing the effective power density in debris at the periphery of the core. This enhances the thermal loading of the shroud by degraded core.
57 Figure C-3 illustrates the different constituents of the MAAP5 lower plenum debris model.
C-16
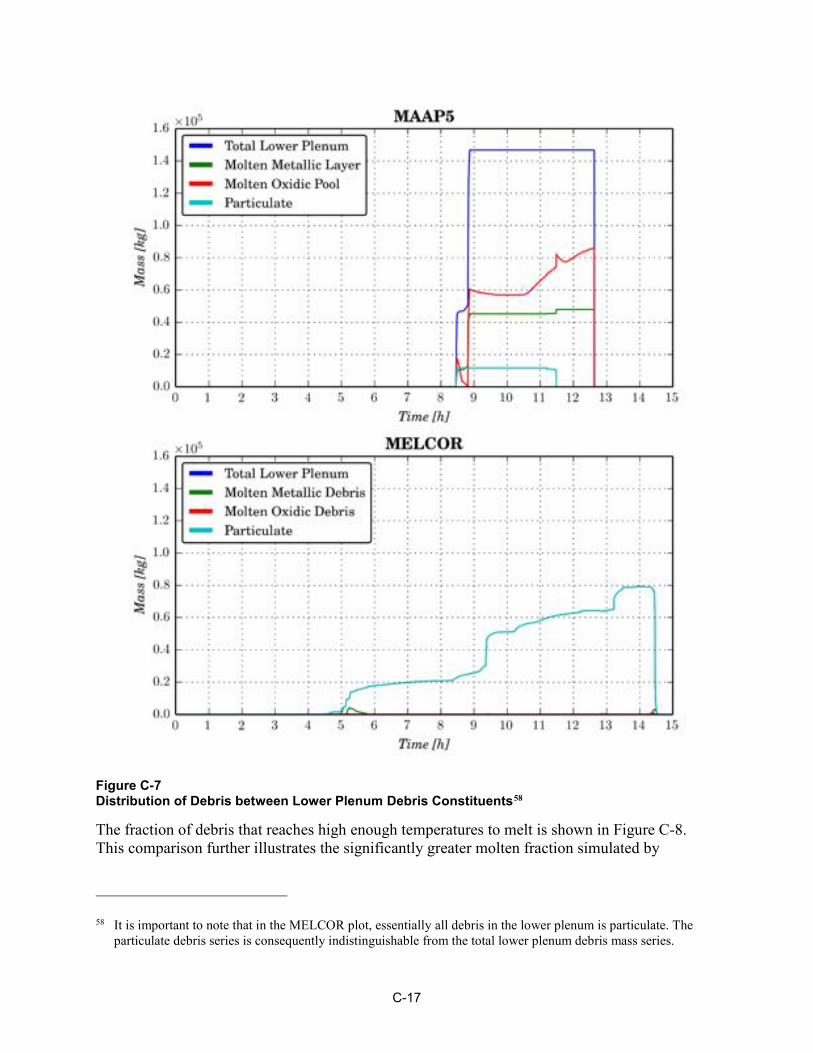
C-17
Figure C-7 Distribution of Debris between Lower Plenum Debris Constituents58
The fraction of debris that reaches high enough temperatures to melt is shown in Figure C-8. This comparison further illustrates the significantly greater molten fraction simulated by
58 It is important to note that in the MELCOR plot, essentially all debris in the lower plenum is particulate. The
particulate debris series is consequently indistinguishable from the total lower plenum debris mass series.
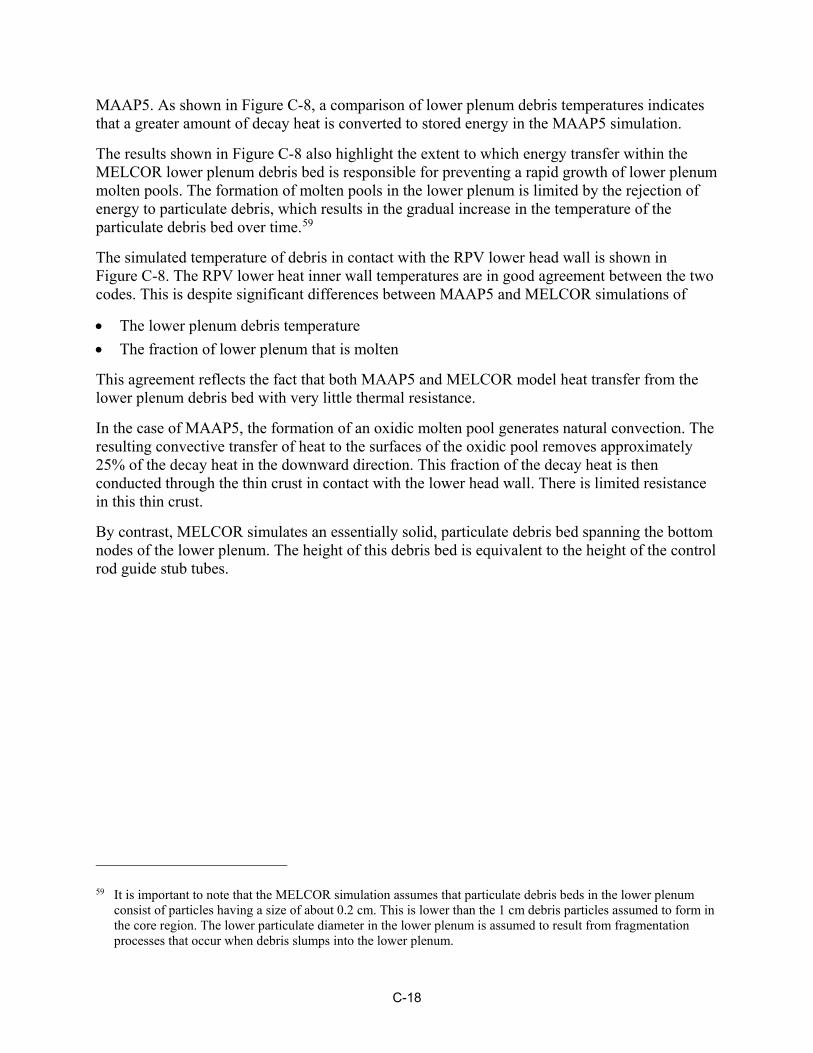
MAAP5. As shown in Figure C-8, a comparison of lower plenum debris temperatures indicates that a greater amount of decay heat is converted to stored energy in the MAAP5 simulation.
The results shown in Figure C-8 also highlight the extent to which energy transfer within the MELCOR lower plenum debris bed is responsible for preventing a rapid growth of lower plenum molten pools. The formation of molten pools in the lower plenum is limited by the rejection of energy to particulate debris, which results in the gradual increase in the temperature of the particulate debris bed over time.59
The simulated temperature of debris in contact with the RPV lower head wall is shown in Figure C-8. The RPV lower heat inner wall temperatures are in good agreement between the two codes. This is despite significant differences between MAAP5 and MELCOR simulations of
• The lower plenum debris temperature • The fraction of lower plenum that is molten
This agreement reflects the fact that both MAAP5 and MELCOR model heat transfer from the lower plenum debris bed with very little thermal resistance.
In the case of MAAP5, the formation of an oxidic molten pool generates natural convection. The resulting convective transfer of heat to the surfaces of the oxidic pool removes approximately 25% of the decay heat in the downward direction. This fraction of the decay heat is then conducted through the thin crust in contact with the lower head wall. There is limited resistance in this thin crust.
By contrast, MELCOR simulates an essentially solid, particulate debris bed spanning the bottom nodes of the lower plenum. The height of this debris bed is equivalent to the height of the control rod guide stub tubes.
59 It is important to note that the MELCOR simulation assumes that particulate debris beds in the lower plenum consist of particles having a size of about 0.2 cm. This is lower than the 1 cm debris particles assumed to form in the core region. The lower particulate diameter in the lower plenum is assumed to result from fragmentation processes that occur when debris slumps into the lower plenum.
C-18
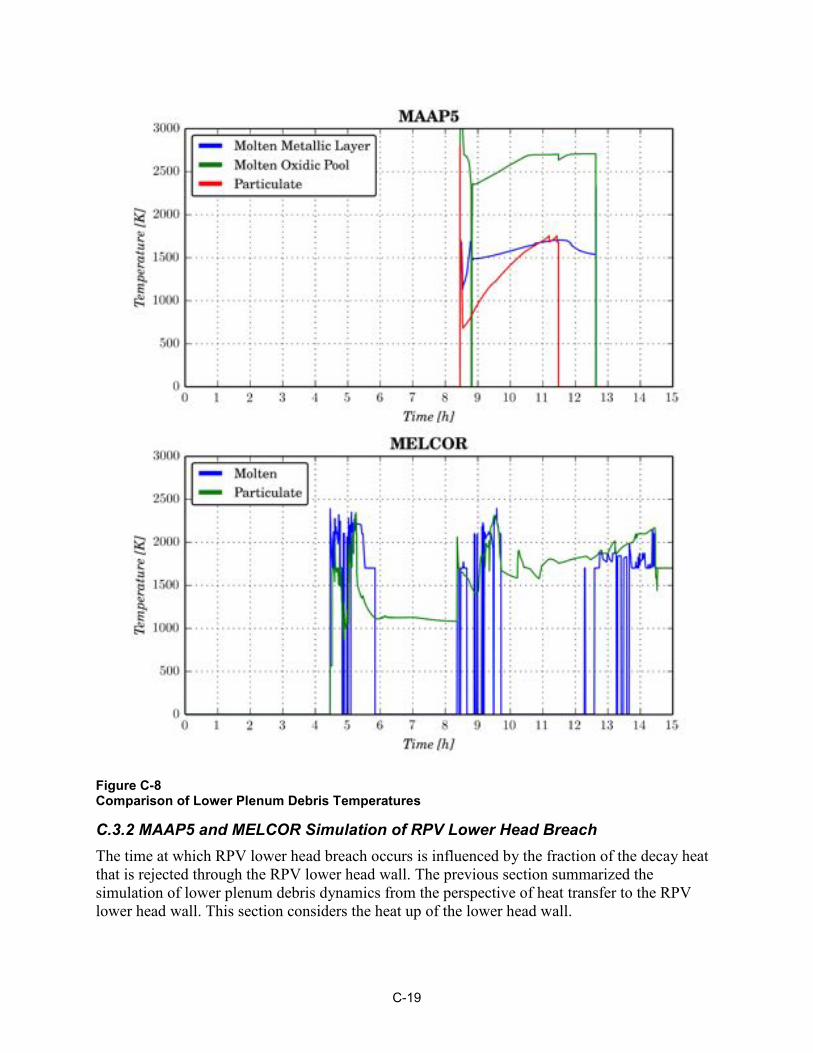
C-19
Figure C-8 Comparison of Lower Plenum Debris Temperatures
C.3.2 MAAP5 and MELCOR Simulation of RPV Lower Head Breach The time at which RPV lower head breach occurs is influenced by the fraction of the decay heat that is rejected through the RPV lower head wall. The previous section summarized the simulation of lower plenum debris dynamics from the perspective of heat transfer to the RPV lower head wall. This section considers the heat up of the lower head wall.
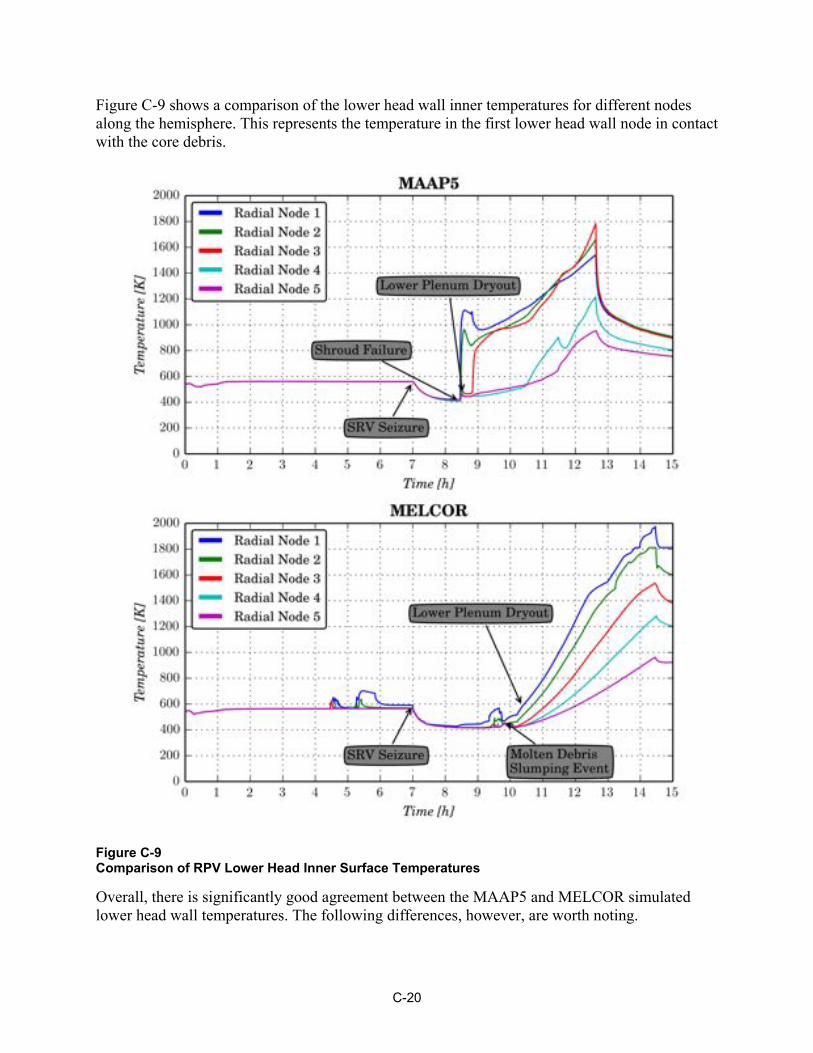
Figure C-9 shows a comparison of the lower head wall inner temperatures for different nodes along the hemisphere. This represents the temperature in the first lower head wall node in contact with the core debris.
Figure C-9 Comparison of RPV Lower Head Inner Surface Temperatures
Overall, there is significantly good agreement between the MAAP5 and MELCOR simulated lower head wall temperatures. The following differences, however, are worth noting.
C-20
• There is a larger temperature response in the MAAP5 lower head wall temperature upon initial core debris slumping (around T+8.3 hours) due to the larger debris molten fraction
• The subsequent heat up of the lower head wall reflects dissipation of approximately 25% of the decay heat through the wall - MELCOR, however, identifies a larger temperature excursion in the central lower head
wall node because this is the portion of the debris bed that has the greatest height o The larger amount of debris above the central lower head wall node results in more
decay heat being rejected through this node because heat transfer is conductive - MAAP5 simulates higher temperatures developing in the second and third radial nodes
along the lower head hemisphere o This is due to the fact that decay heat is rejected to the lower head wall via molten
pool convection in the MAAP5 simulation o Such convective heat transfer results in higher through-wall heat fluxes moving
upward along the lower head wall • There is a difference in the temperature required to cause lower head breach
- The MAAP5 simulation assumes that lower head breach occurs due to creep of the lower head wall at the location of CRGT penetrations
- Creep in this region can result in failure of the RPV lower head at temperatures below that required to cause gross creep failure of the lower head wall
C.4 References [C-1] K.R. Robb, M.W. Francis and M.T. Farmer, “Enhanced Ex-Vessel Analysis for
Fukushima Daiichi Unit 1: Melt Spreading and Core-Concrete Interaction Analyses with MELTSPREAD and CORQUENCH,” ORNL/TM-2012/455, February 2013.
[C-2] V.V. Asmolov, “Last findings of the RASPLAV Project,” Proceedings OECD/CSNI workshop on in-vessel core debris retention and coolability, Munich OECD/NEA Report (1999).
[C-3] V.V. Asmolov, et. al., “Zirconium and Uranium partitioning between oxide and metallic phases of molten corium,” MPTR-9, RRC Kurchatov Institute Russia, 2003.
[C-4] Natural Convection Heat Transfer in Liquids Confined by Two Horizontal Plates and Heated from Below. S. Globe and D. Dropkin, ASME Journal of Heat Transfer 81, 24 (1959).
[C-5] In-Vessel Coolability and Retention of a Core Melt. T.G. Theofanous, C. Liu, S. Addition, S. Angelini, O. Kymalainen and T. Salmassi, DOE/ID-10460. 1996.
[C-6] M. Epstein, et. al., J. Heat Transfer 103, 114 (1981).
[C-7] An Assessment of the Effects of Heat Flux Distribution and Penetration on the Creep Rupture of a Reactor Vessel Lower Head. T.Y. Chu, M.M. Pilch and J.H. Bentz.. 12th Proceedings of Nuclear Thermal Hydrualics, 1997 ANS Winter Meeting, November 16-20, Albuquerque NM, pp. 135-144. 1997.
C-21

D MAAP5 AND MELCOR SIMULATION OF IN-VESSEL HYDROGEN GENERATION D.1 Introduction The generation of hydrogen during in-vessel core melt progression can pose a significant hazard to plant equipment and personnel. For a BWR Mark I containment, which is inerted with nitrogen, there are very few circumstances for most scenarios where hydrogen combustion can occur within containment. The primary hazard that hydrogen poses is in the reactor building, where it can accumulate if containment is impaired.
The combustion of hydrogen in the Fukushima Daiichi Units 1, 3 and 4 reactor buildings degraded accident management capabilities. What is not clear from the Fukushima Daiichi events at present is how the hydrogen generated is correlated with the extent of core damage.
A key feature of the Fukushima Daiichi Units 1 and 3 core melt events is the large difference in time between onset of core damage and the occurrence of reactor building combustion (approximately one day). This feature points to the potential for long-term hydrogen generation after the onset of core damage.
It is not clear at this point whether such long-term hydrogen generation is indicative of the potential for relocation of core debris outside the RPV. This stems from the fact that core-concrete interaction is one means by which prolonged hydrogen generation can occur. As will be discussed further in this section, the manner in which MAAP5 represents core degradation causes tends to prevent long-term hydrogen generation—debris blockages forming in the core limit the flow of steam past high temperature core metal surfaces essential to oxidation reactions that generate hydrogen. By contrast, the MELCOR simulation of core degradation results in extended in-core hydrogen generation supported by the flow of steam through particulate debris beds that maintain open surface area sufficient to allow continued hydrogen generation.
The MAAP5 simulation of degraded core would tend to indicate that long-term hydrogen generation occurred as a result of core-concrete interaction. Such a conclusion is not directly supported by the MELCOR simulation. At present, it is not possible to develop insights regarding how the generation of hydrogen at Fukushima Daiichi correlated with the extent of core damage. Such insights, however, are of particular importance to accident management. Should the potential for flammable conditions develop inside a reactor building exist during in-vessel core melt progression, priority to mitigate hydrogen build-up becomes critical earlier in the event.
In addition to the hydrogen hazard outside of containment, hydrogen generation can have a significant impact on containment pressurization and suppression pool response.
• Hydrogen generation enhances containment pressurization • Bursts of in-vessel hydrogen generation can result in relatively rapid rates of pressurization
D-1

- The rate of pressurization can be rapid enough for the timeliness of accident management actions to control pressure below failure to be challenged
Insights gained from simulation of in-vessel hydrogen generation are thus of broader significance. It is critical to identify how modeling differences between MAAP5 and MELCOR contribute to different in-vessel hydrogen generation transients. The purpose of this appendix is to contrast MAAP5 and MELCOR in-vessel hydrogen transients and identify the underlying reasons for differences.
This appendix is organized as follows.
• Discussion of how the two codes represent in-vessel oxidation reactions and the role that degraded core geometry plays
• Comparison of MAAP5 and MELCOR simulations of in-vessel hydrogen generation from the perspective of - Hydrogen generation onset - The in-vessel hydrogen generation transient prior to and following core slumping - Peak in-vessel hydrogen generation prior to and following core slumping
D.2 MAAP5 and MELCOR Modeling of In-Vessel Hydrogen Generation D.2.1 Oxidation Reaction Modeling Both MAAP5 and MELCOR implement correlations that simulate the rate at which steam and core metals (Zircaloy and stainless steel) react. While some detailed severe accident codes have implemented detailed transport models to simulate oxidation reactions, the complexity of such models limits their applicability to system-level codes such as MAAP5 and MELCOR. The predictions obtained from such models, furthermore, do not represent a sufficient enhancement over correlation-based reaction rate models implemented in MAAP5 and MELCOR.
This section summarizes the models implemented in MAAP5 and MELCOR and used in the simulations performed for this study. Since the focus of this study is on accident sequences where uncovered fuel will exist in a steam environment, oxidation in air atmospheres is not considered.
D.2.1.1 MAAP5 Oxidation Reaction Modeling MAAP5 determines oxidation of the following BWR core structures.
• Fuel cladding (Zircaloy) • Fuel canisters (Zircaloy) • Control blade sheaths (stainless steel)
MAAP5 determines the amount of Zr and stainless steel consumed by oxidation accounting for the following rate-limiting factors.
• Rate of steam diffusion to Zircaloy/stainless steel structure surface, which decreases with decreasing steam mass fraction
D-2

• Oxidation reaction rate, which is proportional to the rate at which the ZrO2/stainless steel oxide layer thickness increases
• Availability of steam, which is determined by the steam flow rate through the core node • Zr/stainless steel availability, which is proportional to the mass of Zr/stainless steel
remaining in the core node
The MAAP5 simulations reported in this study use the IDCOR oxidation model for Zr and stainless steel [D-1]. This model represents Zr oxidation as follows:
• Above 1875 K, the Baker-Just parabolic reaction kinetics correlation is applied • Below 1850 K, the Cathcart parabolic reaction kinetics correlation is applied • In between 1850 K and 1875 K, the reaction rate is interpolated
Stainless steel oxidation is based on
• White’s parabolic rate equation at low temperatures • The ANL condenser discharge data at high temperatures
Core nodes that are below the two-phase boil-up level are assumed to have sufficient supply of steam to participate in the oxidation reaction. For these nodes, steam diffusion is not considered. Steam mass diffusion limitations are of relevance to uncovered regions of the core where high hydrogen mass fractions exist.
MAAP5 also implements a model for B4C oxidation. It is presently not applicable, however, to BWR control blades.
D.2.1.2 MELCOR Oxidation Reaction Modeling MELCOR determines oxidation of the same core structures as MAAP5. As well, the rate of oxidation is limited in a similar manner based on the same physical processes. However, the models implemented to provide key boundary conditions for these physical processes (e.g., availability of steam) can be different.
The oxidation correlations used are based on similar parabolic rate laws. The MELCOR simulations reported in this study use:
• A Zr-H2O reaction rate constant evaluated using the Urbanic-Heidrich constants [D-2] • A Zr-O2 reaction rate constant evaluated a described in “Spent Fuel Heatup Following Loss
of Water During Storage” [D-3]; this is the same as that used by MAAP5 at low temperatures • A steel-O2 reaction the rate constant evaluated based on the “Fifth Annual Report—High
Temperature Material Programs, Part A” [D-4] • A B4C reaction model from MARCON 2.1B [D-5]
D.2.2 Modeling of Oxidation Reaction Area during Core Melt Progression prior to Core Slumping MAAP5 and MELCOR do not represent oxidation of core materials using fundamentally different rate laws. The same physical processes are also considered when determining the extent to which the oxidation rate could be limited.
D-3
As discussed further below, the two codes do differ significantly in the representation of available surface area that can participate in oxidation during the course of core melt progression. This is a critical area of uncertainty that is due to the complexity of core melt progression and the limited number of experiments to characterize the evolution of exposed degraded core surface area.
D.2.2.1 MAAP5 Modeling of Oxidation Reaction Area prior to Core Slumping MAAP5 represents the surface area available for oxidation in the same manner as the available heat transfer surface area (see Figure B-11). The oxidation surface area is parameterized in terms of the porosity of a core node. Complementing the modeling of oxidation surface area is the modeling of flow area. This also varies with porosity, decreasing with decreasing porosity (see Figure B-10).
MAAP5 also considers the enhancement of surface area available to be oxidized when fuel cladding ruptures. This creates flow pathways for steam to ingress into the fuel cladding, facilitating oxidation of the inner surface of the fuel cladding. A user-controlled parameter is used to control the enhancement of oxidation surface area upon fuel cladding rupture. In the simulations reported in this study, this parameter is set to 1 so that no enhancement of oxidation surface area is considered upon fuel cladding rupture. This is based on current MAAP5 best practice. Integral validation against TMI-2 supports this choice of modeling parameter [D-6].
D.2.2.2 MELCOR Modeling of Oxidation Reaction Area prior to Core Slumping MELCOR equates the oxidation surface area to the heat transfer surface area of the node. Rod-like and particulate debris core node geometries are both assumed to participate in oxidation. When a rod-like geometry becomes blocked, oxidation is assumed to cease. Unlike MAAP5, however, MELCOR does not assume that the flow through solid debris beds becomes blocked at low porosities. MELCOR assumes that node porosity cannot decrease below a minimum porosity to ensure stability of the flow calculations.
At lower core node porosities, the particulate debris geometry maintains relatively high amounts of oxidation surface area when compared to the MAAP5 model. As noted in Section B.4.1.3, MAAP5 and MELCOR assume fundamentally different flow geometries for particulate debris. As in the case of heat transfer surface area, MELCOR assumes that particulate debris beds remain open to flow. This allows debris in this configuration to interact with steam for a prolonged period of time. This is distinct from MAAP5, which assumes that the oxidation surface area decreases with increasing porosity.
D.2.3 Modeling of Hydrogen Generation during and after Core Slumping When overheated debris relocates into lower plenum water, additional hydrogen occurs during the period it is quenched. Particulate debris if not adequately quenched may continue to oxidize if sufficient steam is available in conjunction with oxidation surface area.
D.2.3.1 MAAP5 Modeling of Hydrogen Generation during and after Core Slumping MAAP5 assumes that additional hydrogen generation can occur during the period that core debris slumps into the lower plenum. No hydrogen generation is assumed to occur from the terminal debris bed in the lower plenum; it is assumed that the lower plenum debris bed has a limited oxidation surface area following slumping.
D-4
Slumping of molten debris into the lower plenum water pool will result in the breakup of the molten debris stream into particles. This is shown in Figure D-1.
Figure D-1 Illustration of MAAP5 Treatment of Debris Stream Particulation and Interactions with Lower Plenum Water
MAAP5 calculates the oxidation of debris particles entrained in the lower plenum water. Hydrogen is generated as the surface of particulate debris containing Zircaloy is quenched. This is schematically shown in Figure D-2.
Figure D-2 MAAP5 Modeling of Entrained Particulate Debris Oxidation during Slumping to Lower Plenum
D-5
D.2.3.2 MELCOR Modeling of Hydrogen Generation during and after Core Slumping There are two modes of debris relocation into the lower plenum treated by MELCOR.
The first mode is a candling mode. This is intended to represent the continued candling of molten material through openings in the core plate. These molten materials are assumed to continue to candle along the CRGT walls after relocation past the core plate.
The second mode of relocation into the lower plenum occurs when a structure supporting core and core debris above the lower plenum fails. For example, when the core plate fails, debris on the core plate is assumed to drop into the lower plenum at a user-specified fall velocity.
Unlike MAAP5, however, MELCOR does not directly calculate the consequences of debris dropping into the lower plenum in terms of a molten jet-water interaction model. In the MELCOR model, debris dropping is represented in terms of a number user-specified parameters intended to capture the underlying physics. These control the rate at which material relocates into the lower plenum and the effective heat transfer from and associated oxidation of the debris slumping into lower plenum water.
Oxidation of debris in the lower plenum is modeled in the same manner as debris in the core region. As long as steam is available, particulate debris in the lower plenum can continue to be oxidized after slumping.
D.2.3.3 Comparison of MAAP5 and MELCOR Models The amount of hydrogen generated during slumping of core debris to the lower plenum is not explored further in this phase of the study. The different state of core debris slumping to the lower plenum in these two simulations renders direct comparison of these models inappropriate for this phase of the study—the boundary conditions for lower plenum oxidation modeling are too different between the codes for a comparison of these particular simulation results to be meaningful. The comparison of how the two codes represent an area for additional study in a later phase.
D.3 Comparison of MAAP5 and MELCOR Simulation Results for Hydrogen Generation The onset of hydrogen generation is not predicted to occur until about T+3.6 hours for the MELCOR simulation and about T+3.7 hours to 3.8 hours for the MAAP5 simulation (see, for example, Table 4-1). The different time for onset of hydrogen generation in the two simulations is the result of the slightly different RPV water masses. This difference is the primary alignment issue that exists between the two simulations, as discussed above in Section 2.
Figure D-3 illustrates dramatic differences between total mass of hydrogen that has been noted from comparison of past MAAP and MELCOR studies.
• MAAP5 simulates a total hydrogen generation by T+6 hours of about 190 kg • MELCOR, by contrast, calculates approximately 530 kg of hydrogen generation by
T+6 hours
D-6
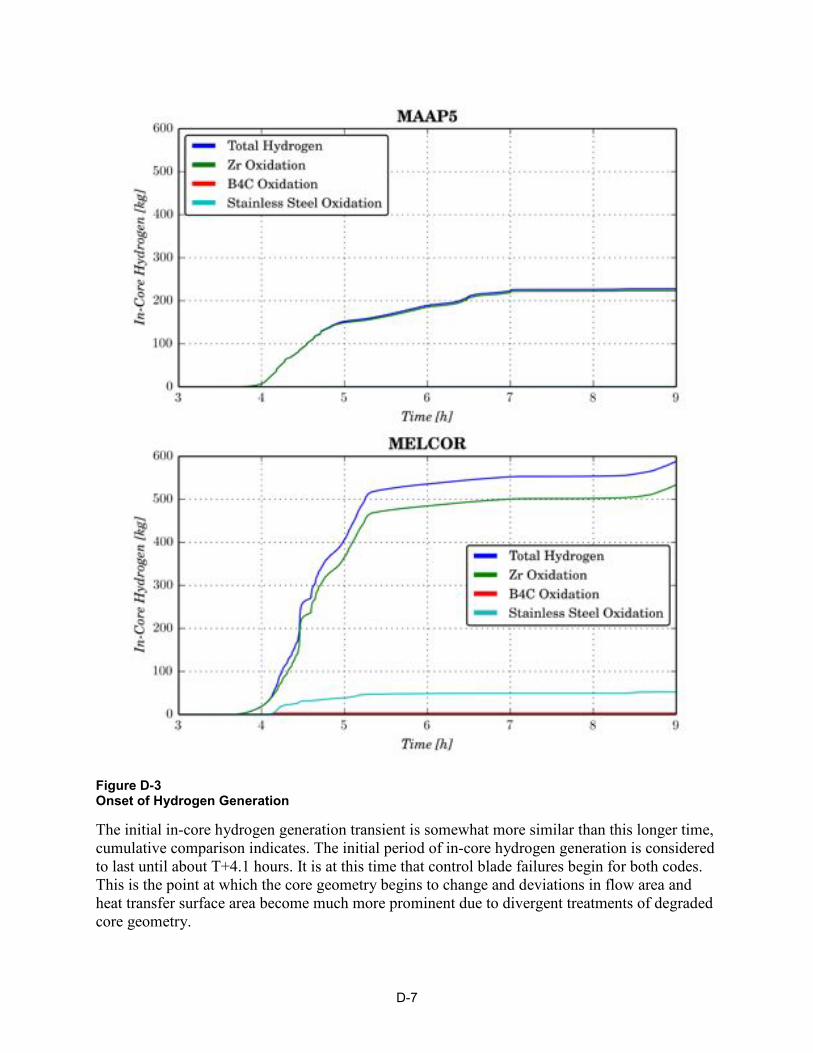
D-7
Figure D-3 Onset of Hydrogen Generation
The initial in-core hydrogen generation transient is somewhat more similar than this longer time, cumulative comparison indicates. The initial period of in-core hydrogen generation is considered to last until about T+4.1 hours. It is at this time that control blade failures begin for both codes. This is the point at which the core geometry begins to change and deviations in flow area and heat transfer surface area become much more prominent due to divergent treatments of degraded core geometry.
D-8
Hydrogen generation starts 10 to 20 minutes earlier in the MELCOR simulation when compared to the MAAP5 simulation. As a result, MELCOR exhibits a somewhat longer period of time over which hydrogen generation occurs without the onset of a core geometry change. By about T+4.1 hours, however, both simulations predict about 40 kg of hydrogen generated due to Zircaloy oxidation.
Beyond T+4.1 hours, the two simulations begin to diverge. The following discussion provides further details about the nature of the differences between the two codes.
One area of divergence is the different amounts of hydrogen generated due to oxidation of stainless steel. The MAAP5 simulation predicts essentially no hydrogen generation from stainless steel oxidation, whereas MELCOR identifies about 50 kg of hydrogen being generated from oxidation of stainless steel. This remains an area requiring further investigation, but is less important to the overall divergence between the two codes, as discussed further below.
Beyond about T+4.1 hours, the rate of hydrogen generation found in the MELCOR simulation (Figure D-3) accelerates rapidly. By T+5 hours, the total amount of in-core hydrogen predicted by MELCOR is about 400 kg. The MAAP5 simulation, however, predicts only about 150 kg of hydrogen generated in-core by T+5 hours. As can be seen in Figure D-3, the rate of hydrogen generation in the MAAP5 simulation is actually decreasing beyond about T+4.1 hours. From about T+4.9 hours until T+7 hours (the time of SRV seizure) the rate of hydrogen generation predicted by MAAP5 is approximately constant. Beyond T+7 hours, no more in-core hydrogen generation is predicted.
The MELCOR simulation, however, predicts an accelerating rate of hydrogen generation between T+4.1 hours and T+4.5 hours. Beyond T+4.5 hours, until about T+5.3 hours, the rate of hydrogen generation is approximately constant in the MELCOR simulation (Figure D-3). After about T+5.3 hours, which is just after the time of initial core plate failure, the rate of hydrogen generation decreases significantly and remains constant until after about T+8.4 hours when fuel assemblies in rings 2 and 3 start collapsing.
From the above discussion, the following factors appear to influence the different rates of hydrogen generation predicted by the two codes.
• MAAP5 in-core hydrogen generation appears to be sensitive to - The progression of core damage and the change in core geometry (i.e., available area to
interact with steam) - The steam flow through the core, which would be significantly reduced following seizure
of the SRV60 • MELCOR in-core hydrogen generation appears to be sensitive to
- The progression of core damage and the slumping of core material into the lower plenum
60 SRV cycling at high RPV pressure drives additional steam flow through the core. The depressurization of the
RPV removes this pressure-induced flow of steam through the core. The steam generation rate with the core uncovered is considerably lower than the rate of steam flow that can be induced due to SRV cycling.
D-9
o Slumping of overheated material from ring 1 is correlated with a reduction in the rate of hydrogen generation
o Slumping of overheated material from rings 2 and 3 into the lower plenum is correlated with an increased rate of hydrogen generation
- The steam flow through the core o Based on the impact of core slumping events on overall hydrogen generation,
MELCOR can predict either steam cooling of core debris or enhanced oxidation The overall hydrogen generation does not provide complete information about the influence of core damage progression. The contribution of the different radial rings to in-core hydrogen generation is thus also worth considering.
Figure D-4 shows how much each radial ring contributes to the total in-core hydrogen generated as a function of time. As expected, the earliest contribution to in-vessel hydrogen generation arises from the first and second core radial rings. These have the highest power densities and thus reach temperatures for a self-sustaining Zircaloy oxidation reaction first. The power densities in the third and fourth core radial rings are somewhat lower than the first and second, but still sufficient to support a relatively rapid temperature escalation once effective steam cooling in the core has been lost.
The fifth core radial ring, by contrast, has a relatively low power density. It is also able to radiate a fraction of its decay heat to the core shroud. As a result, the temperature excursion in this peripheral ring is slower than those in the interior four rings.
These trends are consistent between MAAP5 and MELCOR. The two codes, however, differ in the predicted contributions of each ring to the cumulative in-core hydrogen generation.
• MAAP5 estimates an approximately equal contribution from each radial ring to the cumulative hydrogen generation (on the scale of this figure)
• MELCOR predicts a much more significant contribution from radial rings 3 and 5, with the smallest contribution coming from ring 1
As noted in Appendix B, the different contributions from the radial rings to cumulative in-core hydrogen generation provide another illustration of distinct core damage progression modeling. MELCOR simulates a relatively incoherent core damage progression, while MAAP5 simulates a much more coherent damage progression.
In the MELCOR simulation, the progression of damage in each radial ring is seemingly independent, with the rate of damage progression influenced to a large extent by the initial power level of the radial ring. There is thus a much more significant difference in the time at which geometry distortion occurs in each radial ring. MAAP5, however, simulates a much more coherent progression in which significant amounts of core in all radial rings become damaged at similar times.61
61 Table 4-1 illustrates how MAAP5 predicts fuel assembly collapse occurring in all radial rings within a 1.5-hour
period.
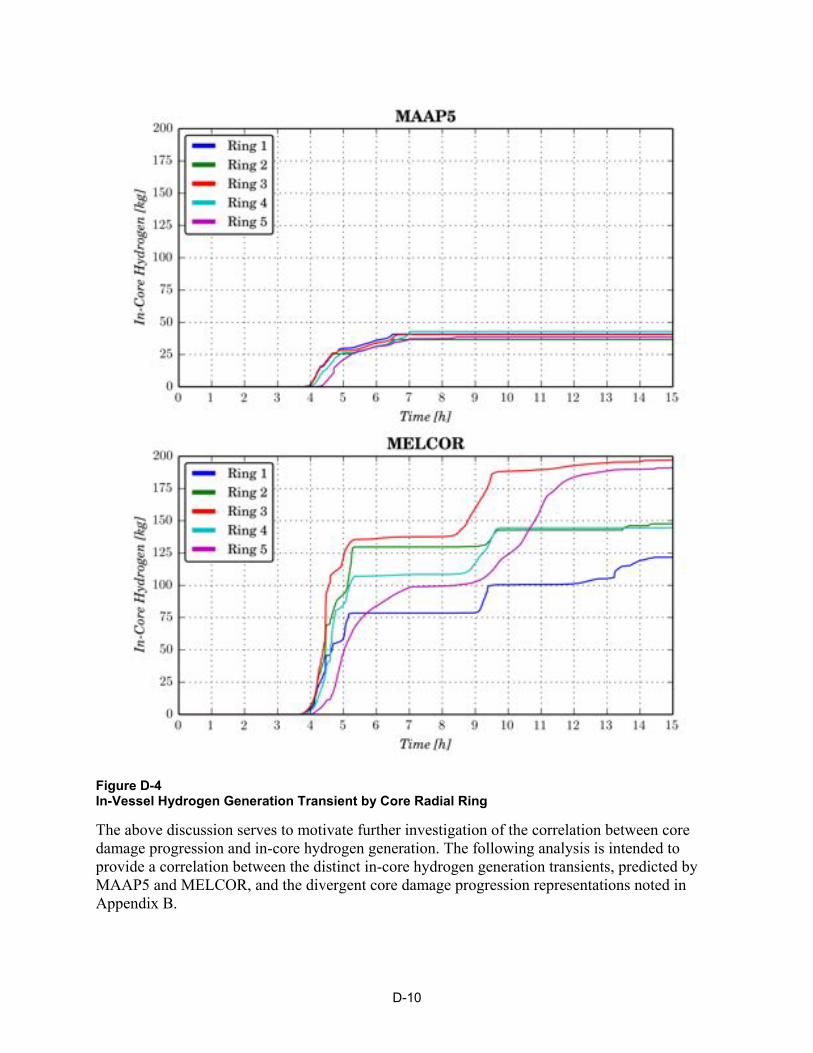
Figure D-4 In-Vessel Hydrogen Generation Transient by Core Radial Ring
The above discussion serves to motivate further investigation of the correlation between core damage progression and in-core hydrogen generation. The following analysis is intended to provide a correlation between the distinct in-core hydrogen generation transients, predicted by MAAP5 and MELCOR, and the divergent core damage progression representations noted in Appendix B.
D-10
D-11
It is useful to first focus on the period between T+4.1 hours and T+4.6 hours. Over this period, substantial differences begin to manifest themselves in the overall degraded core geometry. Previous discussion in Appendix B highlighted the differences between MAAP5 and MELCOR in this respect. Some of the relevant figures are repeated here to aid the reader. The discussion is primarily based on correlating the different hydrogen generation transients to different parameters that affect the oxidation reaction rate.
The MAAP5 and MELCOR active region fuel temperature maps are presented in Figure D-5 and Figure D-9, respectively. These maps illustrate the different nature of core damage between the two simulations. They form an important component of the following discussion.
MAAP5 Simulation:
For the MAAP5 simulation, the in-core hydrogen generation appears to proceed somewhat linearly between T+4.1 hours and T+4.6 hours. For an accelerating reaction, an increasing rate of hydrogen generation would be expected. An approximately constant rate of hydrogen generation is shown in Figure D-3, which highlights additional processes that are impeding hydrogen generation.
The heatup of the core, following onset of oxidation, is evident in Figure D-5 by T+4.25 hours. Figure D-5 illustrates that beyond this time there is a growing amount of fuel assembly degradation predicted in the MAAP5 simulation. This is evident through the voided (empty) regions at the top of the core, which are formed due to collapsing fuel assemblies (see the T+4.5-hour fuel temperature map in Figure D-5).
The degradation of fuel material in these rings, by fuel assembly collapse and melt candling, leads to blockages forming at lower elevations in the core. Due to these blockages, gas flow through the core is redistributed radially, with gas having to find open paths due to blockages that prevent upward axial flow. Figure D-6 presents a map of the core node geometry. 62 This illustrates the initial formation of local blockages of the core around T+4.25 hours.
Despite the blockages in the core forming just under the mid-plane at T+4.25 hours, there is still a substantial fraction of the core that remains open enough to allow steam flow. The localized blockage, however, diverts flow radially toward the periphery. In order for steam to be able to access core metals above the extended blockage that can be seen at T+4.25 hours, it is necessary for fuel canisters to fail. The inflection point that is evident in the rings 1, 2 and 3 hydrogen generation transients at about T+4.3 hours in Figure D-4 is correlated with the commencement of fuel canister failure in these rings. Figure D-7 illustrates this, showing the mass fraction of intact fuel canisters for MAAP5 and MELCOR, which is reproduced from Figure B-27.
Oxidation in the first three radial rings proceeds beyond about T+4.3 hours, reducing considerably beyond about T+4.6 hours. As can be seen in Figure D-6, the collapse of fuel assemblies above the debris blockages in these radial rings ensures that there is still available material with open surface area to participate in oxidation.
62 MAAP5 refers to the different core node types using a parameter IGTYP, as discussed in Appendix B
D-12
From T+4.25 hours to T+4.5 hours, approximately half of the core nodes in the first four radial rings have become blocked to flow. Flow blockages are also predicted to extend the most peripheral ring. At T+4.5 hours, the uppermost rows in these first four radial rings still have temperatures sufficient to support oxidation based on Figure D-4. These uppermost rows are also in a particulate configuration such that flow and oxidation areas are still sufficient to allow some oxidation to persist, influenced by the impedance to radial flow redistribution due intact fuel canisters.63
Beyond about T+5 hours, there is a slow generation of hydrogen from all radial rings. Core nodes near the top of the core have exposed surface area to the limited steam that flows over the top of the core due to fuel canister failure. After about T+5.9 hours, failure of the majority of the peripheral fuel canister material is predicted in the MAAP5 simulation (Figure D-7). As a result, steam flow paths through central core nodes near the bottom of the core (below the primary blockage shown in Figure D-6) toward the periphery open up. This promotes additional hydrogen generation. Figure D-4 highlights the increase in temperature in these nodes at this point. Oxidation of the areas around the large core blockage contributes to the slow production of hydrogen in the radial rings in Figure D-4 after about T+5 hours.
It is also important to note that radial redistribution of steam flow is not the only means by which steam supply to feed oxidation is limited in the MAAP5 simulation. The oxidation reaction of course is also highly steam limited by this point. Flow of steam out of the RPV is limited by slow boiling and SRV cycling. Figure D-8 illustrates the cumulative mass discharge through the SRV. After about T+4 hours, there is a relatively slow discharge of steam through the cycling SRV (compared with the cumulative discharge transient prior to this time). There is, however, one enhanced increase shown at about T+4.6 hours. This corresponds to the jump in hydrogen generation from ring 5 shown in Figure D-4. This also corresponds to a more rapid loss of fuel canister (and also control blade) mass, which facilitates radial steam flow redistribution around core blockages.
As noted above, SRV cycling can drive steam flow through the degraded core. SRV seizure at T+7 hours also drives steam flow out of the RPV, as shown in Figure D-8. It is useful to note that by T+7 hours, failure of the fuel canisters allows for sufficient radial redistribution to allow a reasonable amount of steam cooling of the core debris below central core blockage. This can be seen in Figure D-5, which shows the decrease in fuel temperatures below the central blockage after the SRV seizure event at T+7 hours.It is possible for other sources of steam generation to exist following the onset of core degradation. An important source is the relocation of molten or overheated core material into water. One process that gives rise to such steam generation is the slumping of core debris into the lower plenum. In the MAAP5 simulation, as discussed in more detail in Appendix C, core is held up above the core plate for an extended period of time. The slumping of debris into the lower plenum does not occur gradually. By the time that slumping does occur, substantial core degradation is predicted to have occurred.
As a result, when core debris does slump into the lower plenum in the MAAP5 simulation, there is limited material available in the core region to oxidize. In fact, there is only a very modest
63 Figure D-10 illustrates the difference between MAAP5 and MELCOR predictions of vertical flow area through
the core. The formation of blockages to gas flow in the MAAP5 simulation means that the only way for gas to flow upward through the degraded core is if it can be redistributed radially to find axial regions that are not blocked to gas flow.
D-13
increase in the in-core hydrogen generation upon initial shroud failure in the MAAP5 simulation. Figure D-3 and Figure D-4 show a slight increase in the in-core hydrogen generated at initial shroud failure, with the hydrogen being generated from the most peripheral radial ring. This is consistent with the presence of particulate debris in the fifth radial ring just prior to shroud failure (see Figure D-6 at T+8.25 hours).
It is important to note also that the relocation of core debris occurs at such a rapid rate that, independent of degraded core geometry, there is limited core material that remains in the core region during the core slump period. A prolonged debris holdup period in the core region combined with the relocation of a large fraction of the core into the lower plenum tends to reduce the total amount of in-core hydrogen generated. Amplification of in-core hydrogen generation tends to require the generation of steam combined with the availability of core material over which the steam can flow.
Thus, the MAAP5 simulation of in-core hydrogen generation is governed by the following factors.
• The formation of core blockages decreases the amount of material that can interact with steam
• These core blockages also impede the access of steam to regions of the core (either above or below the blockage) that are sufficiently hot and able to oxidize - Redistribution of steam flow radially can only occur once fuel canisters have failed
• The prolonged holdup of core debris above the core plate and the resulting gross relocation of the majority of the core debris into the lower plenum upon shroud and/or core plate failure tends to reduce the predicted in-core hydrogen generation
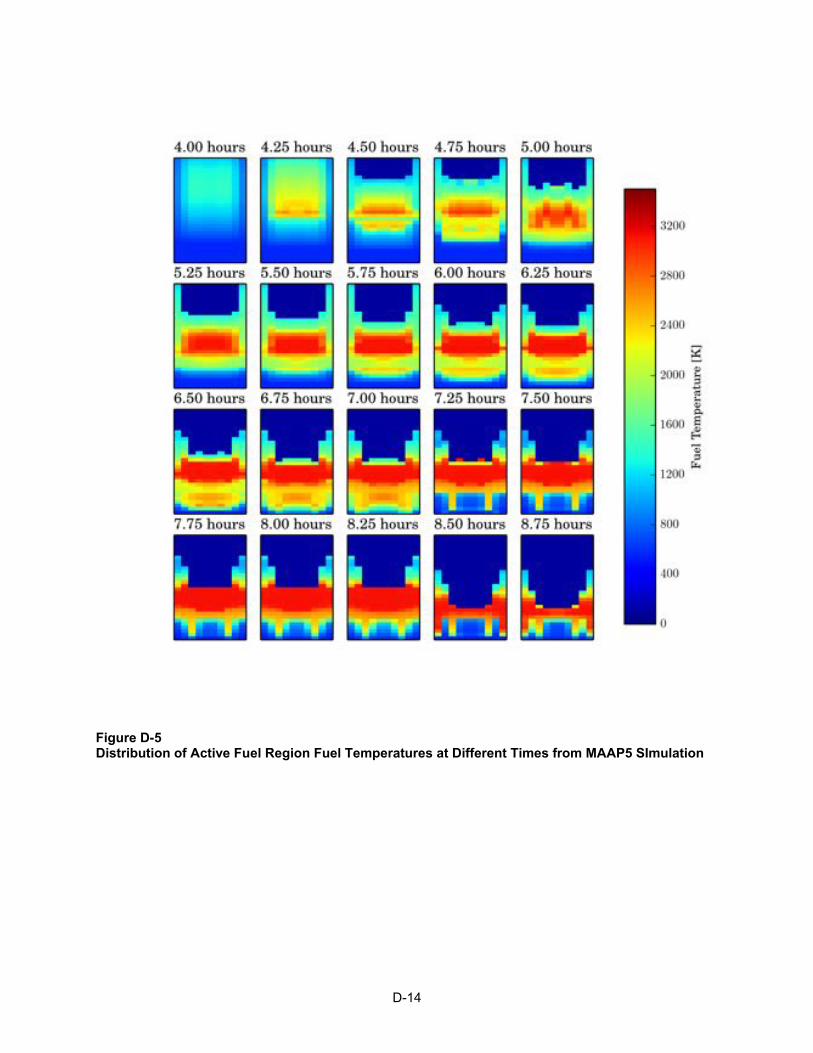
Figure D-5 Distribution of Active Fuel Region Fuel Temperatures at Different Times from MAAP5 SImulation
D-14
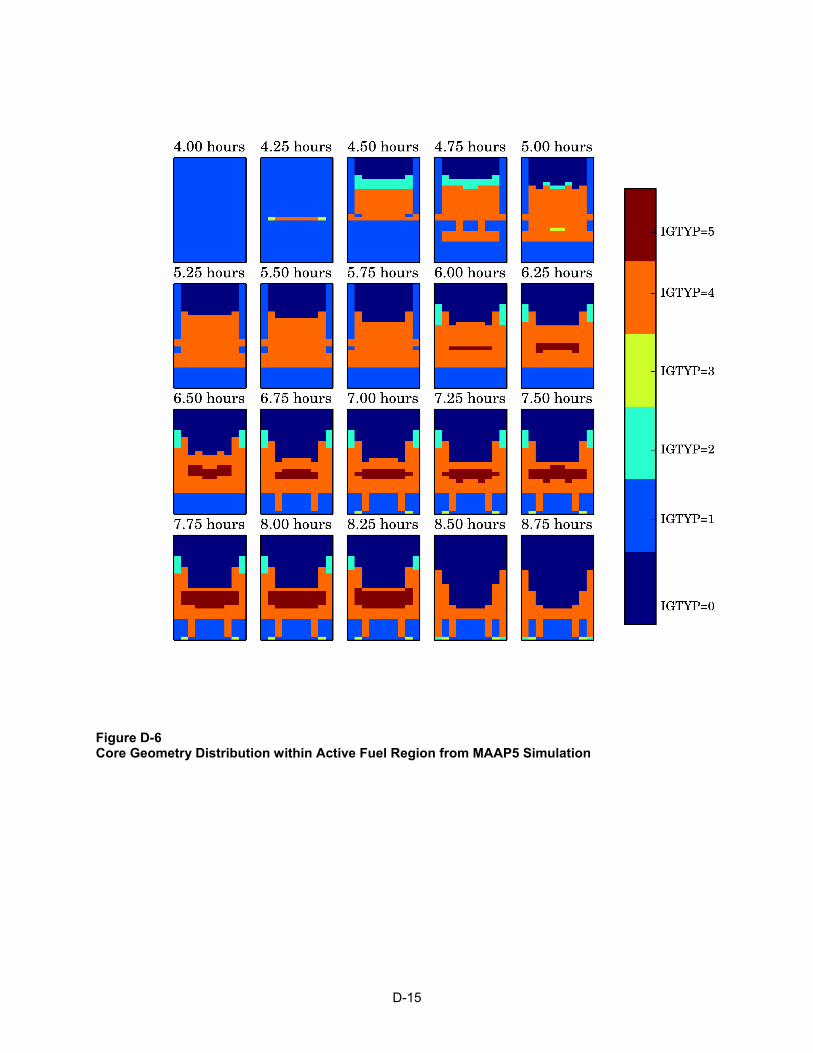
Figure D-6 Core Geometry Distribution within Active Fuel Region from MAAP5 Simulation
D-15

Figure D-7 Comparison of Intact Fuel Canister Mass
D-16
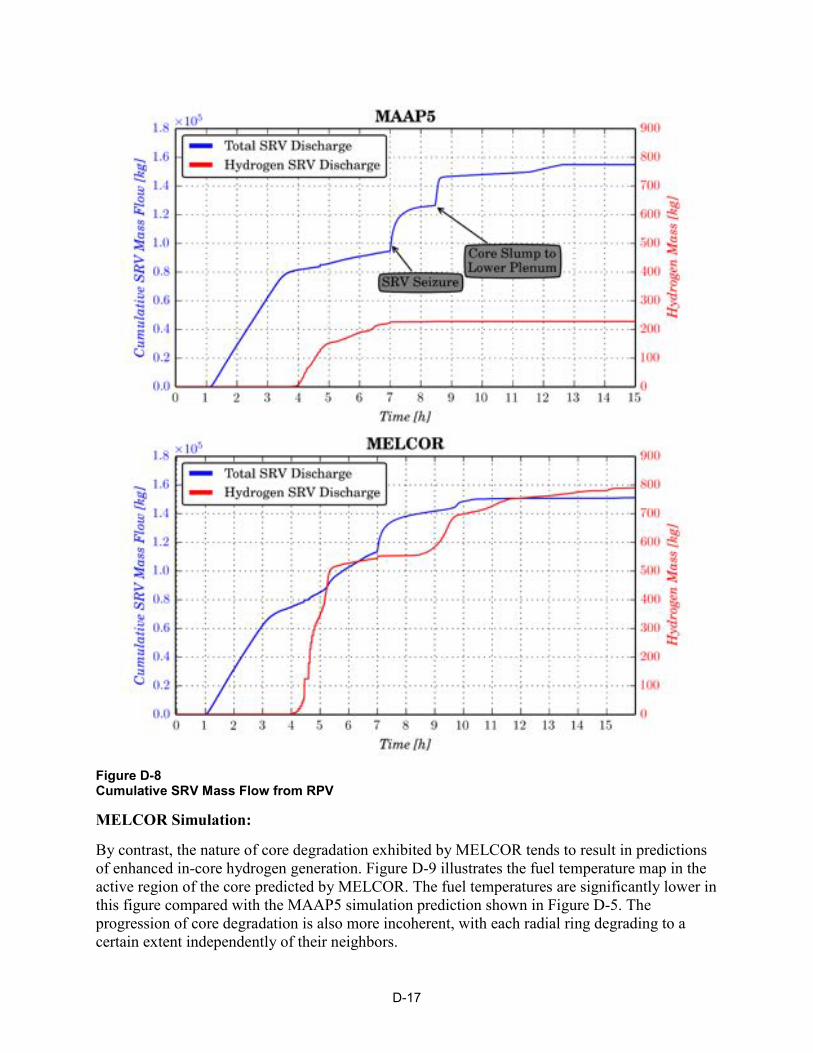
D-17
Figure D-8 Cumulative SRV Mass Flow from RPV
MELCOR Simulation:
By contrast, the nature of core degradation exhibited by MELCOR tends to result in predictions of enhanced in-core hydrogen generation. Figure D-9 illustrates the fuel temperature map in the active region of the core predicted by MELCOR. The fuel temperatures are significantly lower in this figure compared with the MAAP5 simulation prediction shown in Figure D-5. The progression of core degradation is also more incoherent, with each radial ring degrading to a certain extent independently of their neighbors.
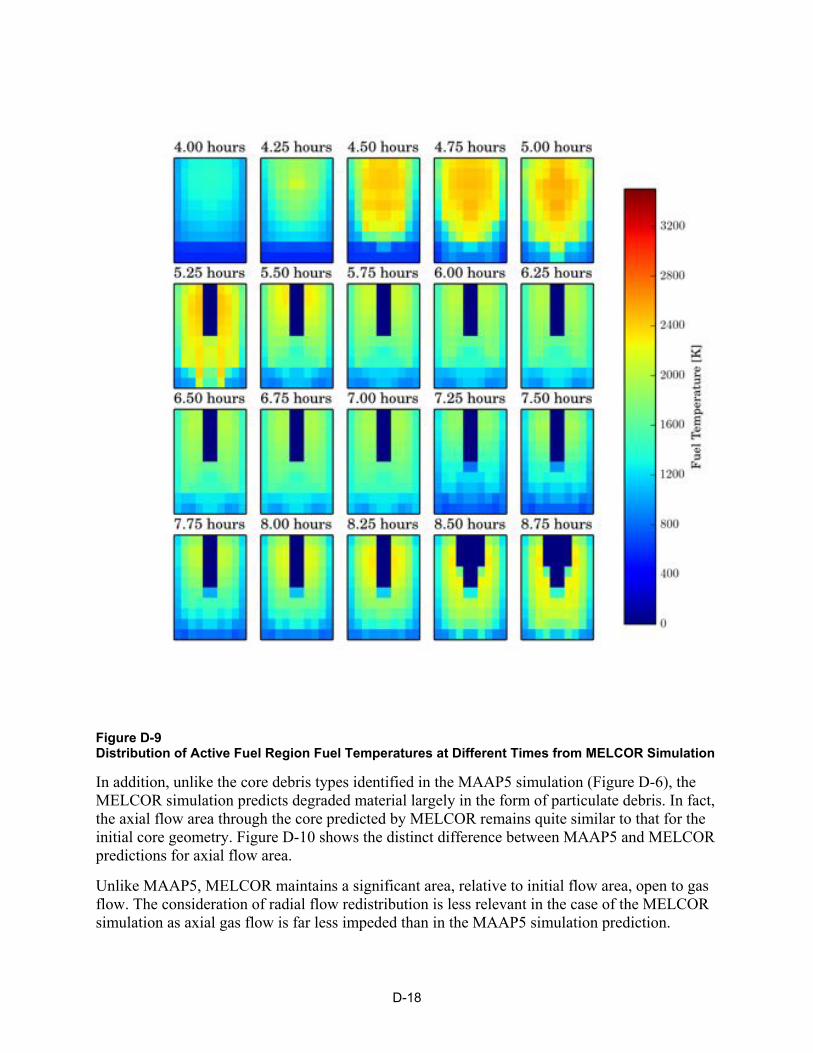
Figure D-9 Distribution of Active Fuel Region Fuel Temperatures at Different Times from MELCOR Simulation
In addition, unlike the core debris types identified in the MAAP5 simulation (Figure D-6), the MELCOR simulation predicts degraded material largely in the form of particulate debris. In fact, the axial flow area through the core predicted by MELCOR remains quite similar to that for the initial core geometry. Figure D-10 shows the distinct difference between MAAP5 and MELCOR predictions for axial flow area.
Unlike MAAP5, MELCOR maintains a significant area, relative to initial flow area, open to gas flow. The consideration of radial flow redistribution is less relevant in the case of the MELCOR simulation as axial gas flow is far less impeded than in the MAAP5 simulation prediction.
D-18

Figure D-10 Comparison of Minimum Vertical Flow Area through Fuel Assemblies across the Radial Extent of the Core
In the MELCOR simulation, in-core hydrogen generation is thus more sensitive to effects that alter the steam flow through the core. The greater amount of exposed surface area means that MELCOR simulations of degraded core response to steam flow are amplified relative to MAAP5. A much larger portion of the core can either oxidize or be steam cooled.
D-19

D-20
Highlights from MAAP5 and MELCOR Simulations:
Hydrogen generation in MAAP5 and MELCOR simulations exhibits a strong dependence on how degraded core geometry is represented.
• The much greater loss of flow and heat transfer surface areas in the MAAP5 simulation provides a strong limitation to continued hydrogen generation - The compaction of core debris into an extended region that spans much of the radial
extent of the core, as well as a large axial extent, severely reduces the core material over which steam can flow
• The larger heat transfer and oxidation surface areas assumed in MELCOR particulate debris beds promote axial flow through radial rings - Radial redistribution of steam flow is less important in the MELCOR simulation due to
the available axial flow area - By contrast, in the MAAP5 simulation core material below a central blockage sees
reduced steam flow due to the high flow resistance created by overlying core blockages • A more coherent core-region debris bed identified in the MAAP5 simulation (due to
sideward relocation of molten debris) limits the availability of peripheral assemblies to provide a source of long-term in-core hydrogen
- In the MAAP5 simulation all radial rings behave in an approximately coherent manner - Steam surges through the core thus do not generally affect radial rings differently in the
MAAP5 simulation64 - In the MELCOR simulation, incoherent degradation of radial rings promotes steam
surges (e.g., due to slumping of core debris from one radial ring to the lower plenum) that can act as a steam source for other radial rings65
• The more open core identified in the MELCOR simulation (i.e., open to axial flow) tends to amplify the effect of steam generation on either steam cooling or enhanced oxidation - In contrast to the MAAP5 degraded core configuration, steam flow through the core is
relatively unimpeded in the MELCOR simulation - The formation of extended blockages in the MAAP5 simulation generates a flow regime
in which significant diversion of gas flow away from the core blockage occurs - In the MAAP5 simulation, a larger fraction of the core is inaccessible during various
times during core melt progress to steam flow due to
64 It is important to note that, because MAAP5 simulations do have periods where more of the core is open (i.e.,
early in core damage progression), it is possible to find accident sequences with a more pronounced generation of hydrogen in response to increased steam flow through the core. This tends to require the coincidence of increased steam flow through the core and high fuel cladding temperatures. The coincidence of these two conditions tends to occur over a relatively brief period during core damage progression in a MAAP5 simulation due to the more coherent progression of core damage.
65 Note that the effect of this steam source is sensitive to the steam generation rate. At high enough steam generation rates, steam cooling of a large fraction of the core can result. At lower steam generation rates, enhanced oxidation can result.
D-21
o Blockages that imped upward (axial) flow of gas o The presence of fuel canisters that impede radial redistribution of gas flows
D.4 References [D-1] Hydrogen Generation during Severe Core Damage Sequences, Final Report for IDCOR
Task 12.1. FAI and ANL, Chicago, IL: 1983.
[D-2] V. F. Urbanic and T. R. Heidrich, “High-Temperature Oxidation of Zircaloy-2 and Zircaloy-4 in Steam,” Journal of Nuclear Materials, Vol. 75, pp. 251-261 (1978).
[D-3] A. S. Benjamin, D. J. McCloskey, D.A. Powers, and S. A. Dupree, Spent Fuel Heatup Following Loss of Water During Storage, SAND77-1371, NUREG/CR-0649, Sandia National Laboratories, Albuquerque, NM, March 1979.
[D-4] J. F. White et al., “Fifth Annual Report–High Temperature Material Programs, Part A,” GEMP-400A (February 1966).
[D-5] L. J. Ott, C. F. Weber, and C. R. Hyman, “Station Blackout Calculations for Browns Ferry, Proceedings of the Thirteenth Water Reactor Safety Research Information Meeting,” Gaithersburg, MD (October 1985).
[D-6] MAAP5 - Modular Accident Analysis Program for LWR Power Plants. EPRI, Palo Alto, CA: 2013.


The Electric Power Research Institute, Inc. (EPRI, www.epri.com) conducts research and development relating to the generation, delivery and use of electricity for the benefit of the public. An independent, nonprofit organization, EPRI brings together its scientists and engineers as well as experts from academia and industry to help address challenges in electricity, including reliability, efficiency, affordability, health, safety and the environment. EPRI also provides technology, policy and economic analyses to drive long-range research and development planning, and supports research in emerging technologies. EPRI’s members represent approximately 90 percent of the electricity generated and delivered in the United States, and international participation extends to more than 30 countries. EPRI’s principal offices and laboratories are located in Palo Alto, Calif.; Charlotte, N.C.; Knoxville, Tenn.; and Lenox, Mass.
Together…Shaping the Future of Electricity
© 2014 Electric Power Research Institute (EPRI), Inc. All rights reserved. Electric Power Research Institute, EPRI, and TOGETHER…SHAPING THE FUTURE OF ELECTRICITY are registered service marks of the Electric Power Research Institute, Inc.
3002004449
Electric Power Research Institute 3420 Hillview Avenue, Palo Alto, California 94304-1338 PO Box 10412, Palo Alto, California 94303-0813 USA
800.313.3774 650.855.2121 [email protected] www.epri.com

![MELCOR Computer Code Manuals · PDF fileThis publication of the MELCOR computer code manuals corresponds to MELCOR 1.8.5, ... of Volume 1 contains the MELCOR User’s Guides, ... [1]](https://img.dokumen.tips/doc/110x75/5a86a7f27f8b9a87368dc173/melcor-computer-code-manuals-publication-of-the-melcor-computer-code-manuals-corresponds.jpg)