Embed Size (px)
Citation preview
25-05-2018
1
Training for Asian Young Professionals on
Performance Assessment of Irrigation Systems
( 9th to 13th April 2018 in Beijing, China)
Performance assessment of irrigation and drainage systems -
Rapid Appraisal Procedure By
M G Shivakumar Chief Engineer
VJNL, UBP Zone, ChitradurgaWater Resources Department , Karnataka, India
Modernization to improve performance
• Irrigation performance often lower than
expected and improvements are critically
needed.
• Modernization a continuing process that aims to
bring about improvements.
Management and operation: more complex more demanding !!
…... An urgent need to tackle complexity
⚫service to users more diversified
⚫Water management more demanding
⚫Cost effective Management
Modernization
FAO 1997 Definition of Modernization:
a process of technical and managerial upgrading
(as opposed to mere rehabilitation) of irrigation
schemes with the objective to improve resource
utilization (labor, water, economics,
environmental) and water delivery service to
farms.
25-05-2018
2
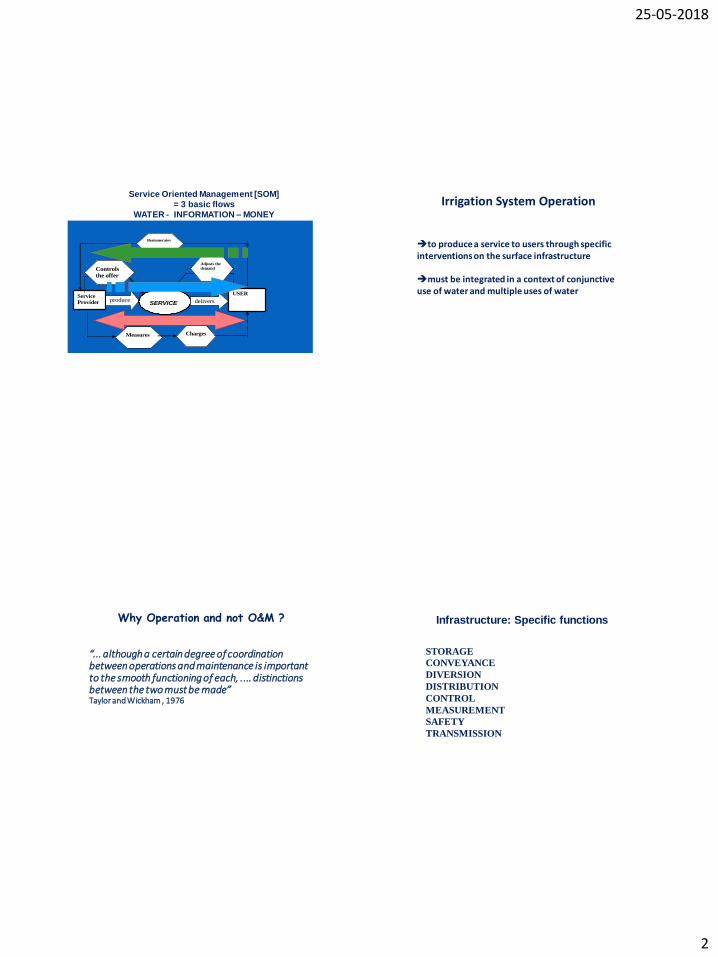
Service Oriented Management [SOM]
= 3 basic flows
WATER - INFORMATION – MONEY
Service
Provider produces
SERVICE delivers to Fournit à
USER
Measures Charges
Controls the offer Contrôle l’offre
Adjusts the
demand
Remunerates
➔to produce a service to users through specific interventions on the surface infrastructure
➔must be integrated in a context of conjunctive use of water and multiple uses of water
Irrigation System Operation
“... although a certain degree of coordination between operations and maintenance is important to the smooth functioning of each, .... distinctions between the two must be made” Taylor and Wickham , 1976
• Operation to deliver the service to users
• Maintenance to maintain the physical capacity
Why Operation and not O&M ?
STORAGE
CONVEYANCE
DIVERSION
DISTRIBUTION
CONTROL
MEASUREMENT
SAFETY
TRANSMISSION
Infrastructure: Specific functions
25-05-2018
3
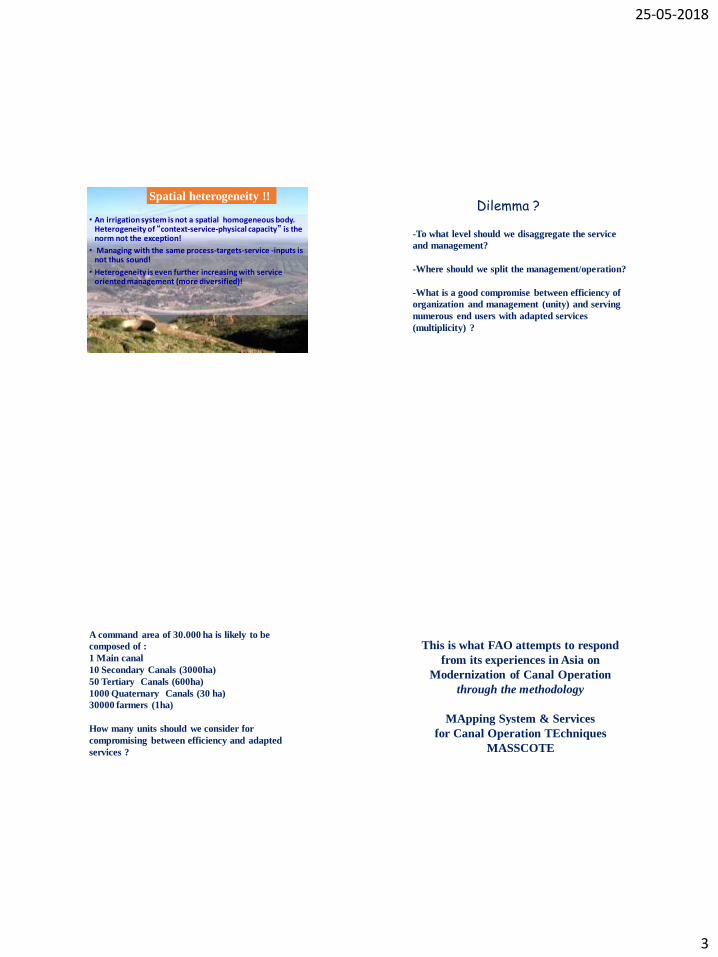
• An irrigation system is not a spatial homogeneous body. Heterogeneity of “context-service-physical capacity” is the norm not the exception!
• Managing with the same process-targets-service -inputs is not thus sound!
• Heterogeneity is even further increasing with service oriented management (more diversified)!
Spatial heterogeneity !!
-To what level should we disaggregate the service
and management?
-Where should we split the management/operation?
-What is a good compromise between efficiency of
organization and management (unity) and serving
numerous end users with adapted services
(multiplicity) ?
Dilemma ?
A command area of 30.000 ha is likely to be
composed of :
1 Main canal
10 Secondary Canals (3000ha)
50 Tertiary Canals (600ha)
1000 Quaternary Canals (30 ha)
30000 farmers (1ha)
How many units should we consider for
compromising between efficiency and adapted
services ?
This is what FAO attempts to respond
from its experiences in Asia on
Modernization of Canal Operation
through the methodology
MApping System & Services
for Canal Operation TEchniques
MASSCOTE
25-05-2018
4
MASSCOTE
Mascot: A person, animal, or object believed to bring good luck,
especially one kept as the symbol of an organization such as a
sports team. (Mascot came into English as a borrowing of the
French word mascotte, meaning “mascot, charm.”) The
American Heritage® Dictionary of the English Language: Fourth
Edition. 2000
MApping System & Services
for Canal Operation TEchniques
MASSCOTE Assumptions
• Focus on Canal Operation BUT Scope on Management: Canal Operation produces the service – Canal examination is critical for the appraisal (canal don’t lie)
• Service Oriented Management: the service to users is the central and only goal of MOM.
• Heterogeneity of service: based on the physical constraints, opportunities, demand for service, willingness to pay, ……
• Cost effectiveness: modernization means for each users the right service at the right cost.
• Users=payers=decision makers: Users are the clients, the beneficiaries, the payers and the decision makers
• Professionalism !!! : MOM is complex and needs skilled professionals
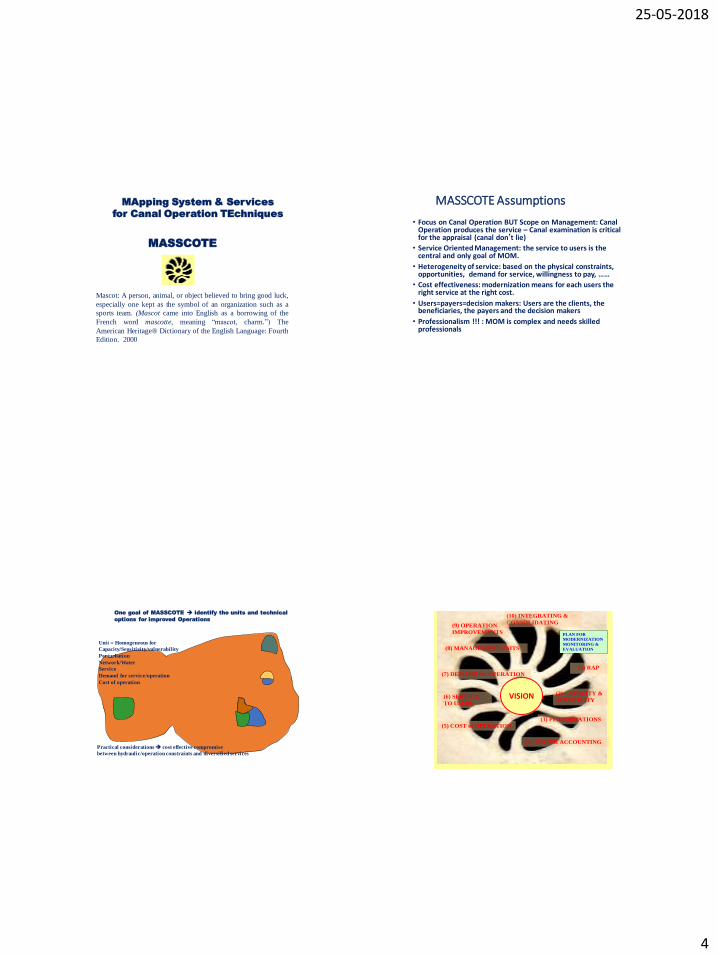
One goal of MASSCOTE ➔ identify the units and technical
options for improved Operations
Unit = Homogeneous for
Capacity/Sensitivity/vulnerability
Perturbation
Network/Water
Service
Demand for service/operation
Cost of operation
Practical considerations ➔ cost effective compromise
between hydraulic/operation constraints and diversified services
(4) WATER ACCOUNTING
(1) RAP
(2) CAPACITY &
SENSITIVITY
(3) PERTURBATIONS
(6) SERVICE
TO USERS
(5) COST of OPERATION
(8) MANAGEMENT UNITS
(10) INTEGRATING &
CONSOLIDATING (9) OPERATION
IMPROVEMENTS PLAN FOR
MODERNIZATION
MONITORING &
EVALUATION
(7) DEMAND for OPERATION
VISION
25-05-2018
5
Modernization Project
MASSCOTERAP
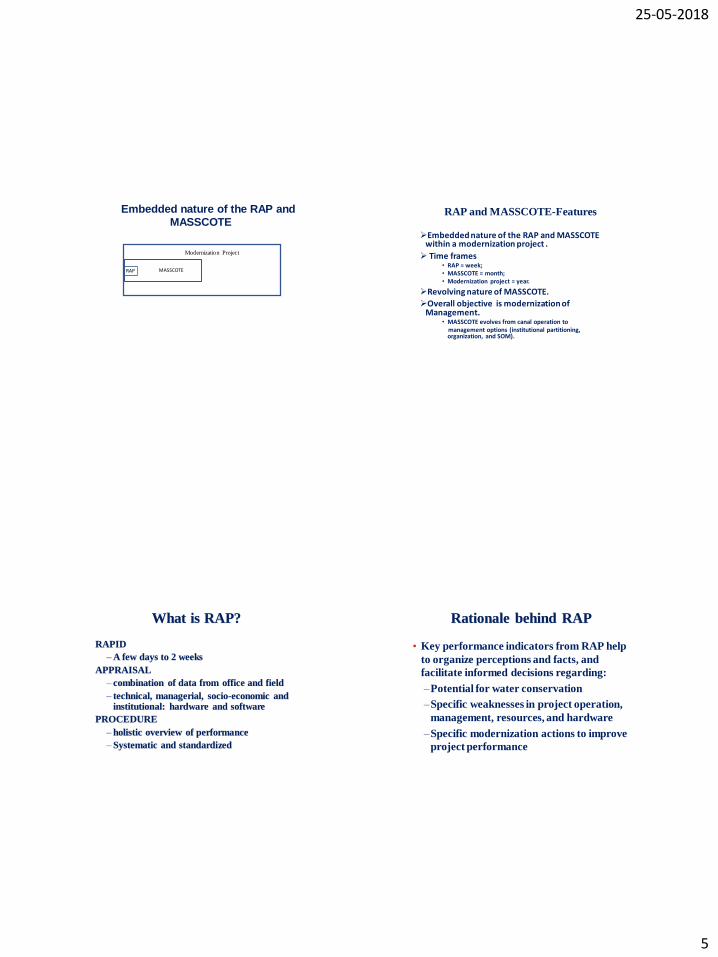
Embedded nature of the RAP and MASSCOTE
RAP and MASSCOTE-Features
➢Embedded nature of the RAP and MASSCOTE within a modernization project .
➢ Time frames • RAP = week;• MASSCOTE = month;• Modernization project = year.
➢Revolving nature of MASSCOTE.
➢Overall objective is modernization of Management.
• MASSCOTE evolves from canal operation tomanagement options (institutional partitioning, organization, and SOM).
What is RAP?
RAPID
–A few days to 2 weeks
APPRAISAL
– combination of data from office and field
– technical, managerial, socio-economic and institutional: hardware and software
PROCEDURE
– holistic overview of performance
– Systematic and standardized
Rationale behind RAP
• Key performance indicators from RAP help
to organize perceptions and facts, and
facilitate informed decisions regarding:
–Potential for water conservation
–Specific weaknesses in project operation,
management, resources, and hardware
–Specific modernization actions to improve
project performance
25-05-2018
6
Objectives of RAP
• Provide a basis for making specific
recommendations for modernization
and improvement of water delivery
service
• Provide a baseline for comparison of
future performance after
modernization
• Benchmarking for comparison against
other irrigation projects
Conceptual Framework
• the irrigation systems operate under a set
of physical and institutional constraints
and with a certain resource base.
• the systems are analyzed as a series of
management levels, each level providing
water delivery service through the
system’s internal management and control
processes to the next lower level, from the
bulk water supply to the main canals
down to the individual farm or field
RAP Methodology
• The process examines external inputs such
as water supplies, and outputs such as
water destinations (ET, surface runoff,
etc.).
• It provides a systematic examination of
the hardware and processes used to
convey and distribute water internally to
all levels within the project (from the
source to the fields).
RAP Outputs
• External indicators
– Examine inputs and outputs of the whole project
• Internal indicators
– Examine processes and hardware within the
project
• IPTRID Benchmark indicators
– Mostly external indicators
• WB Technical indicators
25-05-2018
7
External Indicators
• Ratios or percentages comparing project
inputs and outputs to describe
performance, for example:
Water Required
Total Water Available
External Indicators
• Expressions of forms of efficiencies related
to budgets, water, yields, etc. for example
Crop Yield
Irrigation Water Delivered to the Fields
External Indicators
Do not provide insight in how to improve
performance
Internal Indicators
• Identify key factors related to water
control throughout a project.
• Define level of water delivery service
provided to users.
• Examine specific hardware and
management techniques and processes
used in the control and distribution of
water.
25-05-2018
8
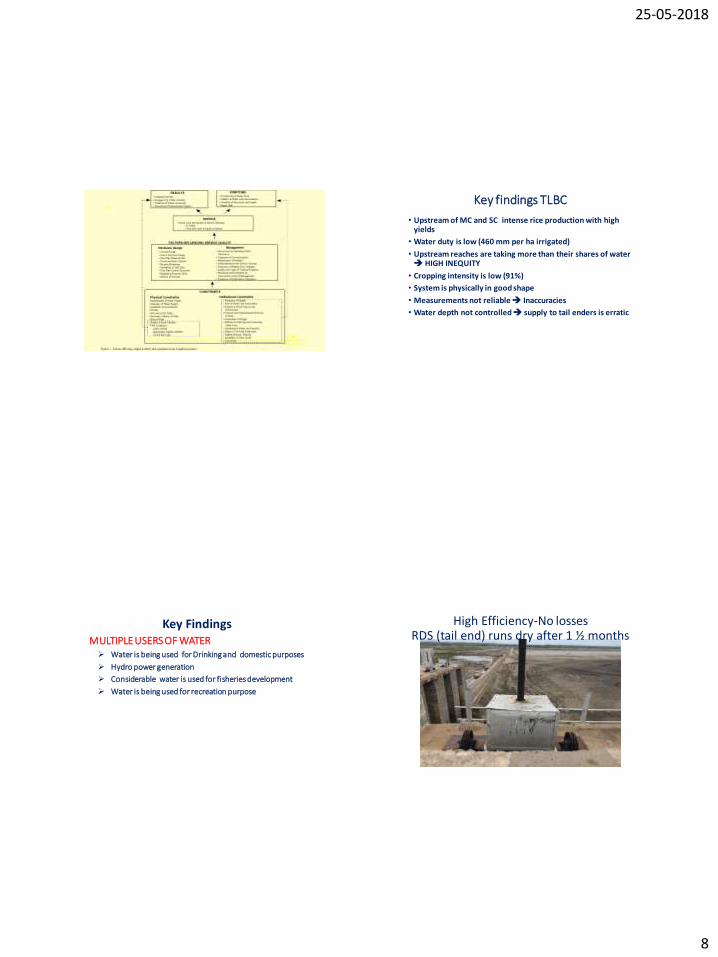
Key findings TLBC
• Upstream of MC and SC intense rice production with high yields
• Water duty is low (460 mm per ha irrigated)
• Upstream reaches are taking more than their shares of water ➔ HIGH INEQUITY
• Cropping intensity is low (91%)
• System is physically in good shape
• Measurements not reliable ➔ Inaccuracies
• Water depth not controlled ➔ supply to tail enders is erratic
MULTIPLE USERS OF WATER➢ Water is being used for Drinking and domestic purposes
➢ Hydro power generation
➢ Considerable water is used for fisheries development
➢ Water is being used for recreation purpose
Key Findings High Efficiency-No lossesRDS (tail end) runs dry after 1 ½ months
25-05-2018
9
0
500
1000
1500
2000
2500
3000
3500
0
1
2
3
4
5
6
7
8
9
7-1-13 8-1-13 9-1-13 10-1-13 11-1-13 12-1-13 1-1-14 2-1-14 3-1-14 4-1-14 5-1-14
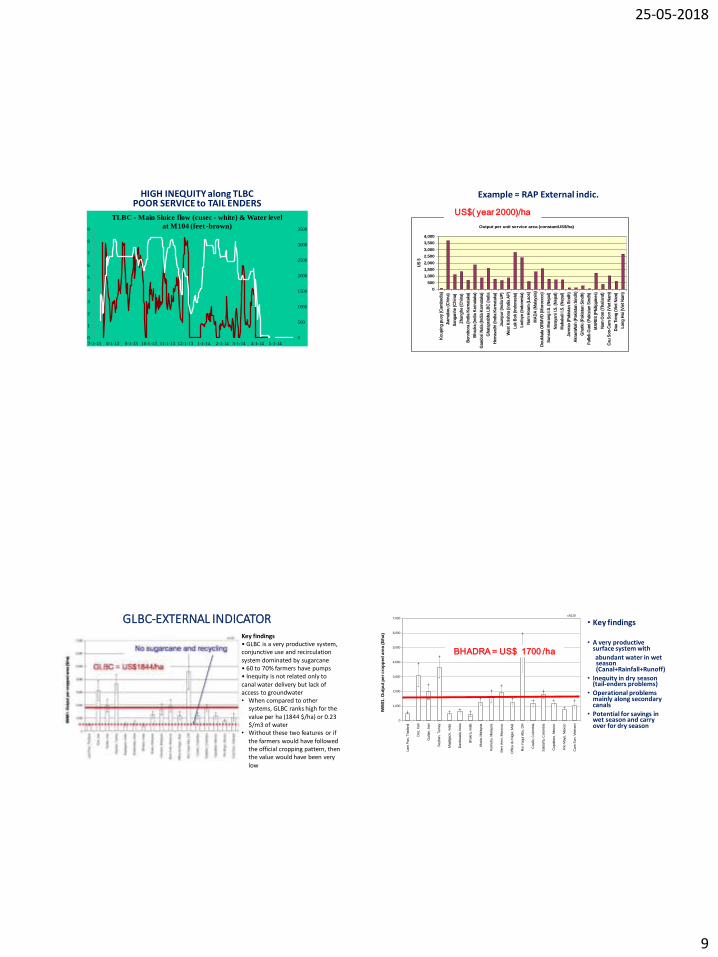
TLBC - Main Sluice flow (cusec - white) & Water level
at M104 (feet -brown)
HIGH INEQUITY along TLBCPOOR SERVICE to TAIL ENDERS
Output per unit service area (constantUS$/ha)
0
500
1,000
1,500
2,000
2,500
3,000
3,500
4,000
Ko
up
ing
pu
oy
(Cam
bo
dia
)
Jiam
ako
u (
Ch
ina)
San
gan
he
(Ch
ina)
Zh
ang
he
(Ch
ina)
Ben
nit
ora
(In
dia
Kar
nat
aka)
Bh
adra
(In
dia
Kar
nat
aka)
Gan
do
ri N
ala
(In
dia
Kar
nat
aka)
Gh
atap
rab
ha
LB
C (
Ind
ia
Hem
avat
hi (
Ind
ia K
arn
atak
a)
Jau
np
ur
(In
dia
UP
)
Wes
t K
rish
na
(In
dia
AP
)
Lak
Bo
k (I
nd
on
esia
)
Lo
do
yo (
Ind
on
esia
)
Nam
Ho
um
(L
aos)
MA
DA
(M
alay
sia)
Do
ukk
ala
OR
MV
D (
Mo
rocc
co)
Su
nsa
ri M
ora
ng
I.S
. (N
epal
)
Nar
ayan
i I.S
. (N
epal
)
Mah
akal
i I.S
. (N
epal
)
Jam
rao
(P
akis
tan
Sin
dh
)
Akr
amW
ah (
Pak
ista
n S
ind
h)
Gh
otk
i (P
akis
tan
Sin
dh
)
Fu
lleli-
Gu
ni (
Pak
ista
n S
ind
h)
MA
RIIS
(P
hili
pp
ines
)
Nam
Oo
n (
Th
aila
nd
)
Cau
So
n-C
am S
on
(V
iet
Nam
)
Dau
Tie
ng
(V
iet
Nam
)
Lo
ng
Hai
(V
iet
Nam
)
US
$
Example = RAP External indic.
US$( year 2000)/ha
GLBC-EXTERNAL INDICATORKey findings• GLBC is a very productive system, conjunctive use and recirculation system dominated by sugarcane• 60 to 70% farmers have pumps• Inequity is not related only to canal water delivery but lack of access to groundwater• When compared to other
systems, GLBC ranks high for the value per ha (1844 $/ha) or 0.23 $/m3 of water
• Without these two features or if the farmers would have followed the official cropping pattern, then the value would have been very low
0
1,000
2,000
3,000
4,000
5,000
6,000
7,000
Lam
Pao, T
haila
nd
Dez,
Ira
n
Guila
n, Ir
an
Seyh
an, T
urk
ey
Maja
lgaon, In
dia
Dantiw
ada, In
dia
Bhakr
a, In
dia
Muda, M
ala
ysia
Kem
ubu, M
ala
ysia
Beni A
mir, M
oro
cco
Offic
e d
u N
iger,
Mali
Rio
Yaqui A
lto, D
R
Coello
, C
olo
mbia
Sald
aña, C
olo
mbia
Cupatit
zio, M
exi
co
Rio
Mayo
, M
exi
co
Cam
Sun, V
ietn
am
IWM
I1. O
utp
ut
pe
r c
rop
pe
d a
rea
($
/ha
) .
ch110
BHADRA = US$ 1700 /ha
• Key findings
• A very productive surface system with
abundant water in wet season (Canal+Rainfall+Runoff)
• Inequity in dry season (tail-enders problems)
• Operational problems mainly along secondary canals
• Potential for savings in wet season and carry over for dry season
25-05-2018
10
0.00
0.05
0.10
0.15
0.20
0.25
0.30
0.35
0.40
0.45
0.50
Lam
Pao, T
haila
nd
Dez,
Ira
n
Guila
n, Ir
an
Seyh
an, T
urk
ey
Maja
lgaon, In
dia
Dantiw
ada, In
dia
Bhakr
a, In
dia
Muda, M
ala
ysia
Kem
ubu, M
ala
ysia
Beni A
mir, M
oro
cco
Offic
e d
u N
iger,
Mali
Rio
Yaqui A
lto, D
R
Coello
, C
olo
mbia
Sald
aña, C
olo
mbia
Cupatit
zio, M
exi
co
Rio
Mayo
, M
exi
co
Cam
Sun, V
ietn
am
IWM
I3. O
utp
ut
pe
r u
nit
irr
ig. s
up
ply
($
/cu
. m
.) .
ch112
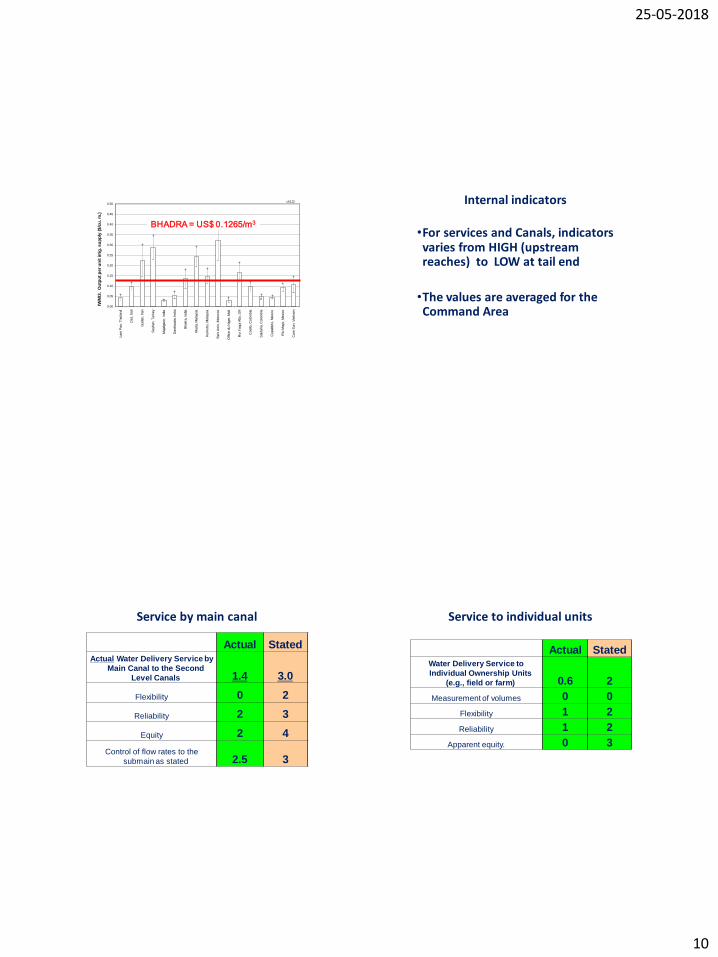
BHADRA = US$ 0.1265/m3
Internal indicators
•For services and Canals, indicatorsvaries from HIGH (upstreamreaches) to LOW at tail end
•The values are averaged for the Command Area
Service by main canal
Actual StatedActual Water Delivery Service by
Main Canal to the Second
Level Canals 1.4 3.0
Flexibility 0 2
Reliability 2 3
Equity 2 4
Control of flow rates to the
submain as stated 2.5 3
Service to individual units
Actual StatedWater Delivery Service to
Individual Ownership Units
(e.g., field or farm) 0.6 2
Measurement of volumes 0 0
Flexibility 1 2
Reliability 1 2
Apparent equity. 0 3
25-05-2018
11
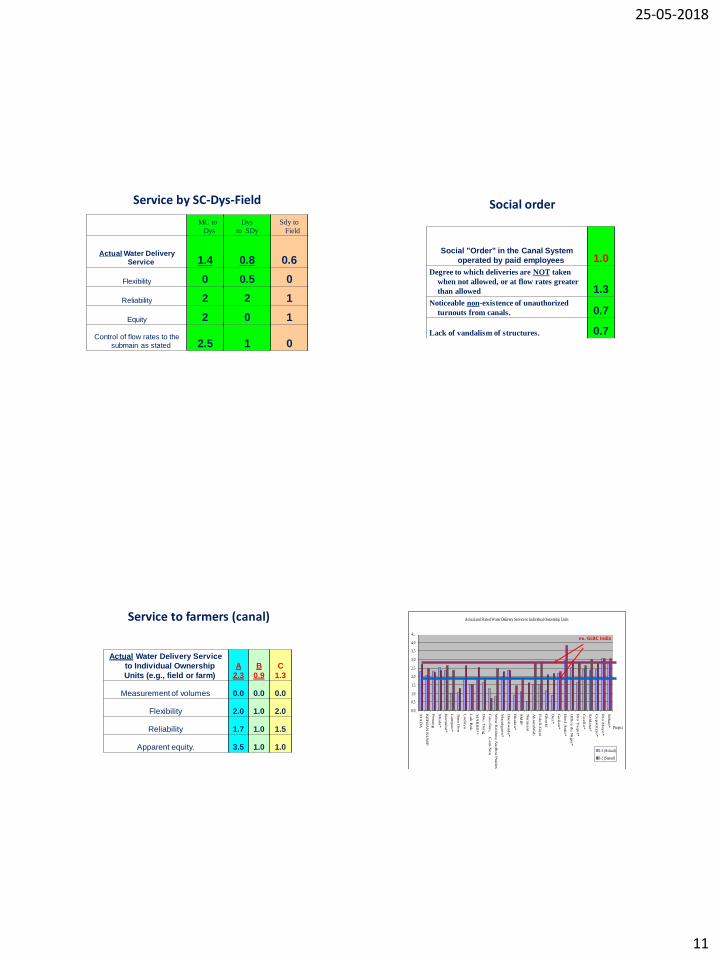
Service by SC-Dys-Field
MC to
Dys
Dys
to SDy
Sdy to
Field
Actual Water Delivery
Service 1.4 0.8 0.6
Flexibility 0 0.5 0
Reliability 2 2 1
Equity 2 0 1
Control of flow rates to the
submain as stated 2.5 1 0
Social order
Social "Order" in the Canal System
operated by paid employees 1.0Degree to which deliveries are NOT taken
when not allowed, or at flow rates greater
than allowed 1.3Noticeable non-existence of unauthorized
turnouts from canals. 0.7
Lack of vandalism of structures. 0.7
Service to farmers (canal)
Actual Water Delivery Service
to Individual Ownership
Units (e.g., field or farm)
A
2.3
B
0.9
C
1.3
Measurement of volumes 0.0 0.0 0.0
Flexibility 2.0 1.0 2.0
Reliability 1.7 1.0 1.5
Apparent equity. 3.5 1.0 1.0
Actual and Stated Water Delivery Service to Individual Ownership Units
0.0
0.5
1.0
1.5
2.0
2.5
3.0
3.5
4.0
4.5
MA
DA
KE
RIA
N K
UM
P
Pen
an
g
Mu
da*
Kem
ub
u*
Lam
pao
*
Nam
Oo
n
Lo
do
yo
Lak
Bo
k
MA
RIIS
**
Dau
Tie
ng
Cau
-So
n, C
am
-So
n
West K
rish
na A
ud
hra
Pra
desh
Maja
lgao
n*
Dan
tiwad
a*
Bh
ak
ra*
SM
IP
Nara
yan
i
Ak
ram
Wah
Fu
leli-G
un
i
Gh
otk
i
Dez*
Gu
ilan
*
Ben
l Am
ir*
Offic
e d
u N
iger*
Rio
Yaq
ul*
Co
ello
*
Sald
an
a*
Cu
patitz
io*
Rio
May
o*
Seh
an
*
Project
I-1 (Actual)
I-2 (Stated)
ex. GLBC India
25-05-2018
12
0.0
0.5
1.0
1.5
2.0
2.5
3.0
3.5
4.0
MA
DA
KE
RIA
N K
UM
P
Pen
an
g
Mu
da*
Kem
ub
u*
Lam
pao
*
Nam
Oo
n
Lo
doy
o
Lak
Bo
k
MA
RIIS
**
Dau
Tie
ng
Cau
-So
n, C
am
-So
n
West K
rish
na A
ud
hra
Pra
desh
Maja
lgao
n*
Dan
tiwad
a*
Bhak
ra*
SM
IP
Nara
yan
i
Ak
ram
Wah
Fu
leli-G
un
i
Gh
otk
i
Dez*
Gu
ilan
*
Ben
l Am
ir*
Offic
e d
u N
iger*
Rio
Yaq
ul*
Coello
*
Sald
an
a*
Cup
atitz
io*
Rio
May
o*
Seh
an
*
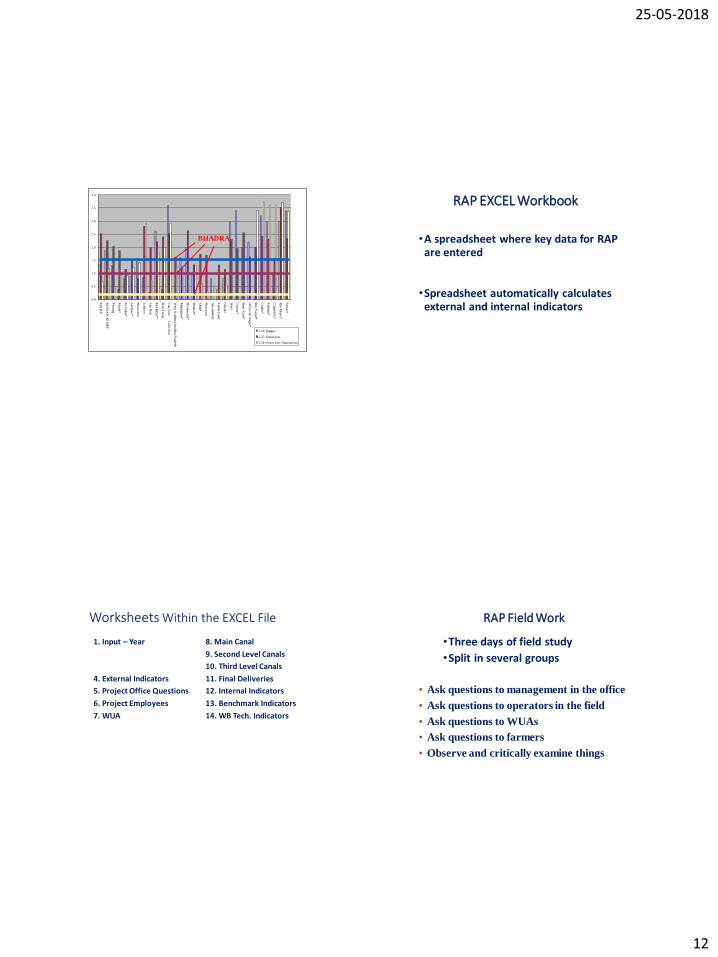
I-26: Budgets
I-27: Employees
I-28: Water User Associations
BHADRA
RAP EXCEL Workbook
•A spreadsheet where key data for RAP are entered
•Spreadsheet automatically calculates external and internal indicators
Worksheets Within the EXCEL File
1. Input – Year 8. Main Canal
9. Second Level Canals
10. Third Level Canals
4. External Indicators 11. Final Deliveries
5. Project Office Questions 12. Internal Indicators
6. Project Employees 13. Benchmark Indicators
7. WUA 14. WB Tech. Indicators
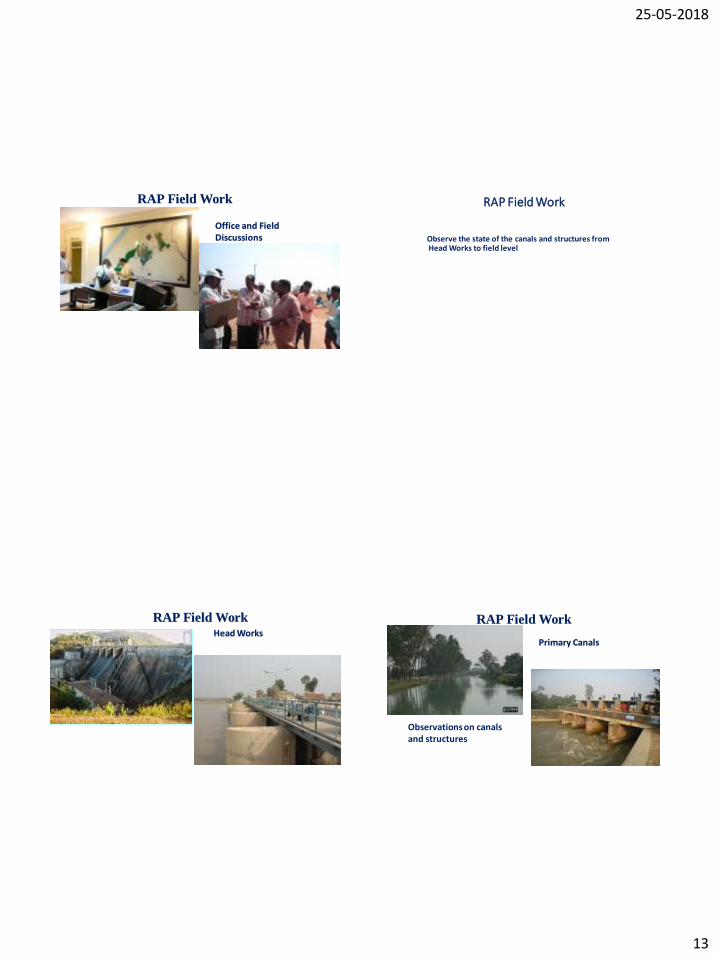
RAP Field Work
•Three days of field study
•Split in several groups
• Ask questions to management in the office
• Ask questions to operators in the field
• Ask questions to WUAs
• Ask questions to farmers
• Observe and critically examine things
25-05-2018
13
Discuss in the field with operators and farmers
Office and Field Discussions
Discuss the scheme and performance in the office
RAP Field Work RAP Field Work
Observe the state of the canals and structures from Head Works to field level
Observations and Discussion
Head Works
RAP Field Work
Observations on canals and structures
Primary Canals
RAP Field Work
25-05-2018
14
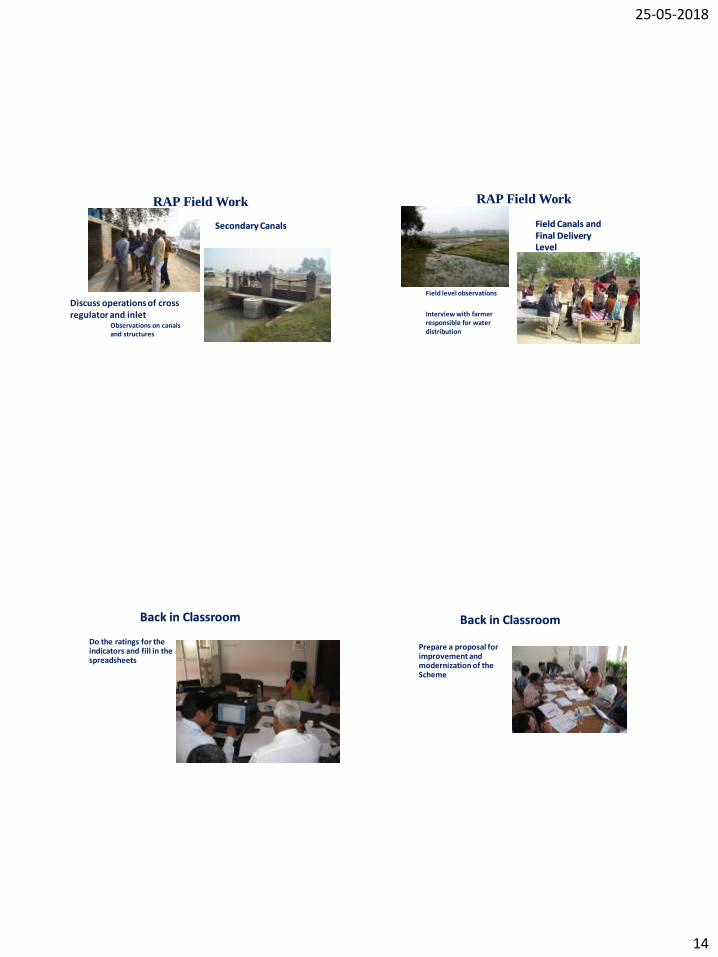
Observations on canals and structures
Secondary Canals
Discuss operations of cross regulator and inlet
RAP Field Work
Field level observations
Interview with farmer responsible for water distribution
Field Canals and Final Delivery Level
RAP Field Work
Back in Classroom
Do the ratings for the indicators and fill in the spreadsheets
Back in Classroom
Prepare a proposal for improvement and modernization of the Scheme
25-05-2018
15
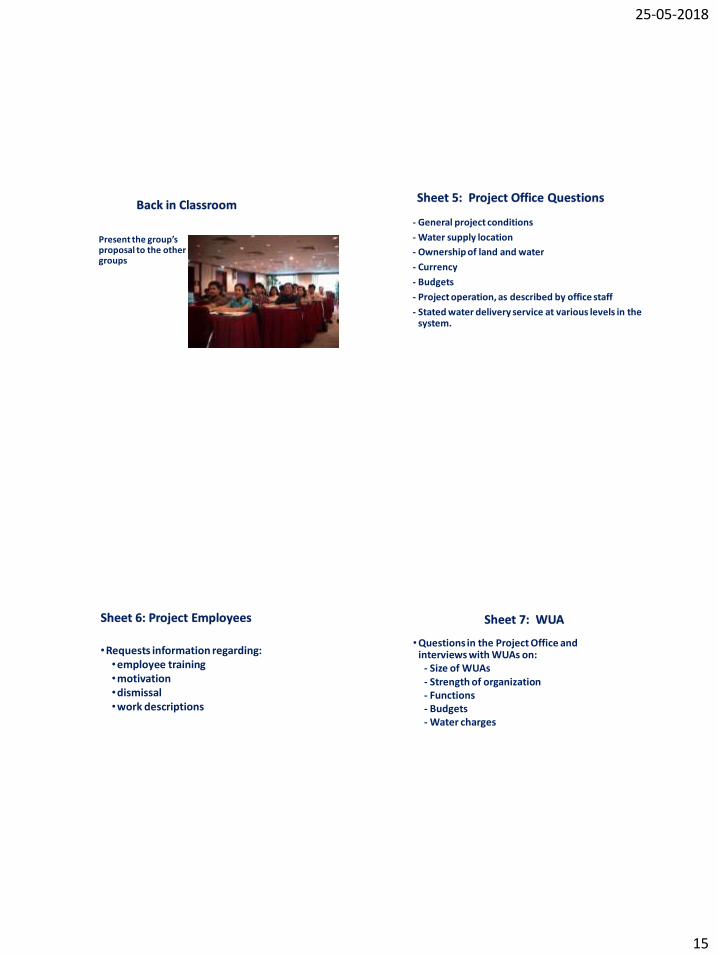
Back in Classroom
Present the group’s proposal to the other groups
Sheet 5: Project Office Questions
- General project conditions
- Water supply location
- Ownership of land and water
- Currency
- Budgets
- Project operation, as described by office staff
- Stated water delivery service at various levels in the system.
Sheet 6: Project Employees
•Requests information regarding:•employee training•motivation•dismissal •work descriptions
Sheet 7: WUA
•Questions in the Project Office and interviews with WUAs on:
- Size of WUAs- Strength of organization- Functions- Budgets- Water charges
25-05-2018
16
Sheet 8: Main Canal
• Data for the Main Canal, including:
- Control of flows - Operation rules
- General canal characteristics - Turnouts
- Cross regulators - Communications
- General conditions - Regulating reservoirs
- The level of service provided to
the next lower level
Sheets 9 & 10: Second and Third Level Canals
• Sheet 9: Second Level Canals• Same as Main Canal
• Sheet 10: Third Level Canals• Same as Second Level Canals
Sheet 11: Final Deliveries:
• Information regarding the level of water delivery service to individual ownership units, and at the last point of operation by paid employees.
Sheet 12: Internal Indicators
•Summarizes internal indicators calculated in the previous worksheets
• Input regarding a few extra indicators
•Weighted category indicators are computed for groups of sub-indicators.
25-05-2018
17
Sheet 13: Benchmark Indicators
• Specific data items and benchmark values that have been developed by IPTRID in 2000 for the International Benchmarking Programme (WB, FAO, IWMI, IPTRID, ITRC…)
Sheet 14: WB Tech. Indicators
•Selected indicators … nothing new compared with external and internal indicators … but useful if you are with a World Bank project
REFERENCES• Rapid Appraisal Process (RAP) and Benchmarking Explanation and Tools
http://www.fao.org/3/a-aq443e.pdf
• Rapid Appraisal Process (RAP) Excel spreadsheet
• http://www.itrc.org/reports/rapidappraisal/rapandbenchmarkingblank041803.xls
• Modernizing irrigation management – the MASSCOTE approach
http://www.fao.org/3/a-a1114e.pdf
THANK YOU