Embed Size (px)
Citation preview
DICE
Horizon 2020 Research & Innovation Action
Grant Agreement no. 644869
http://www.dice-h2020.eu
Funded by the Horizon 2020 Framework Programme of the European Union
Modelling Multi-tier Enterprise Applications Behaviour with Design of Experiments Technique
Tatiana Ustinova, Pooyan Jamshidi
Imperial College London
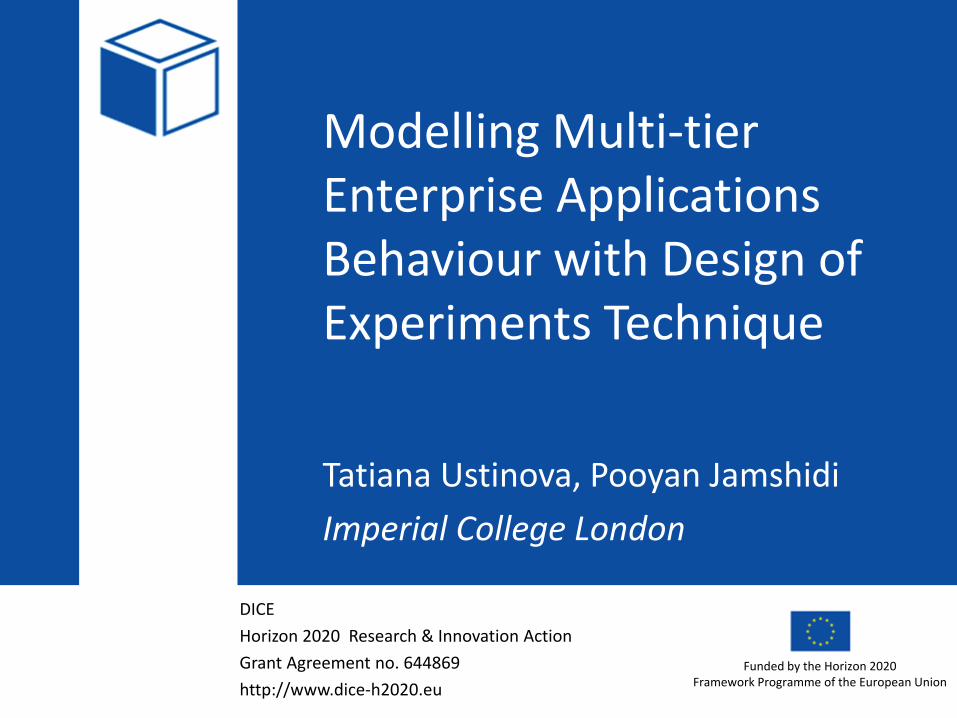
DevOps
2 ©DICE
https://upload.wikimedia.org/wikipedia/commons/b/b5/Devops.svg
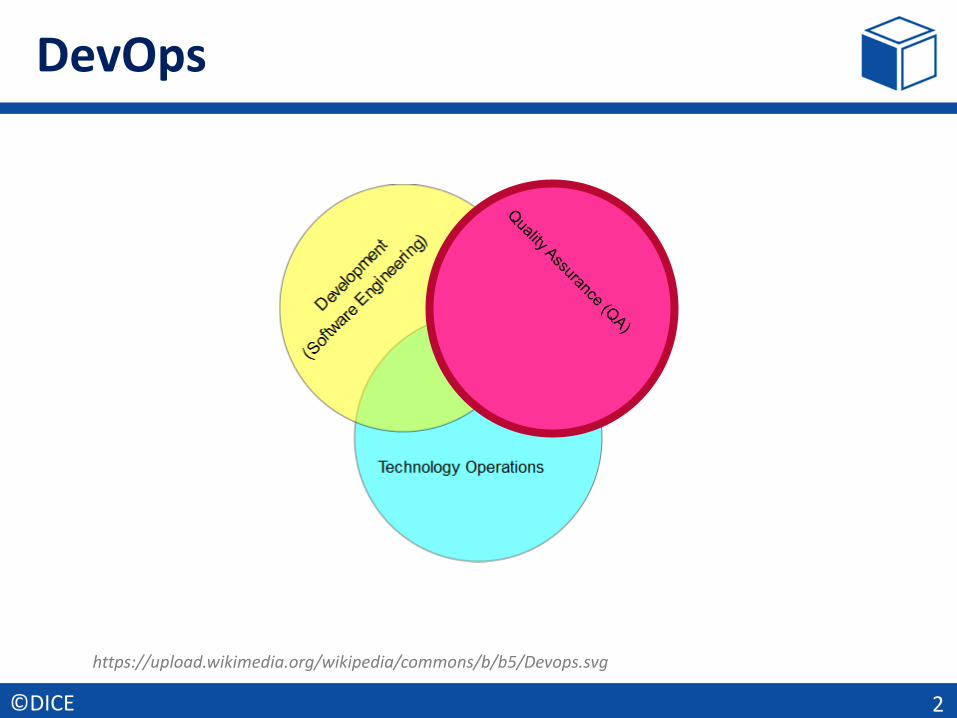
Research Aim and Objectives
Aim:
Is DoE good to model and predict application performance?
Objectives:
1. Introduce DoE.
2. Build app performance model.
3. Model prediction accuracy.
Test environment: 3-tier web-based enterprise application
3 ©DICE
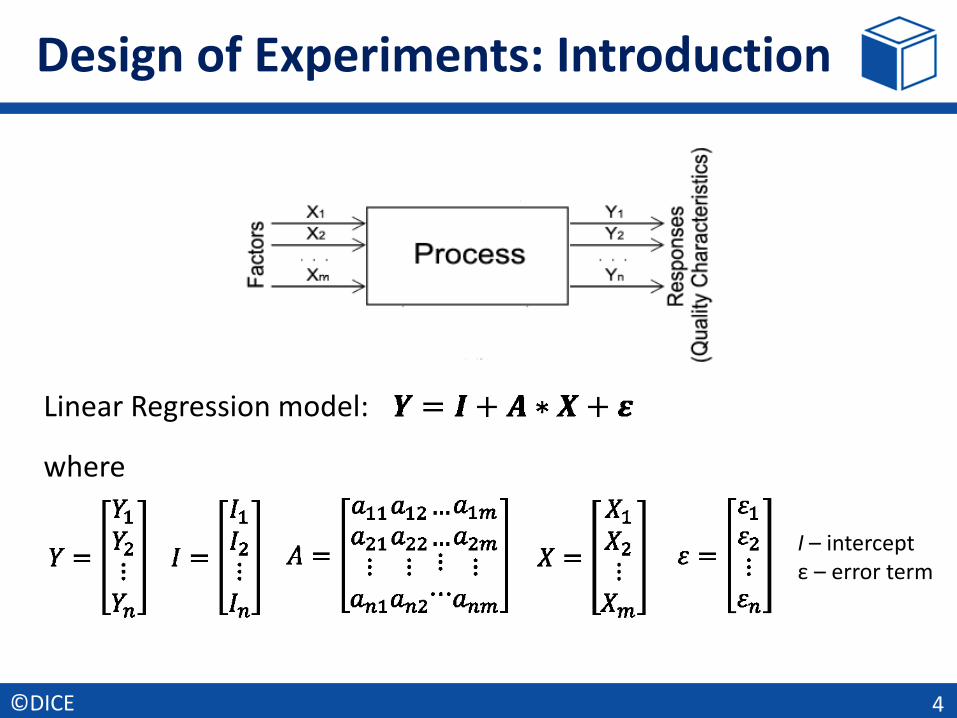
Design of Experiments: Introduction
4 ©DICE
where
Linear Regression model:
I – intercept ε – error term
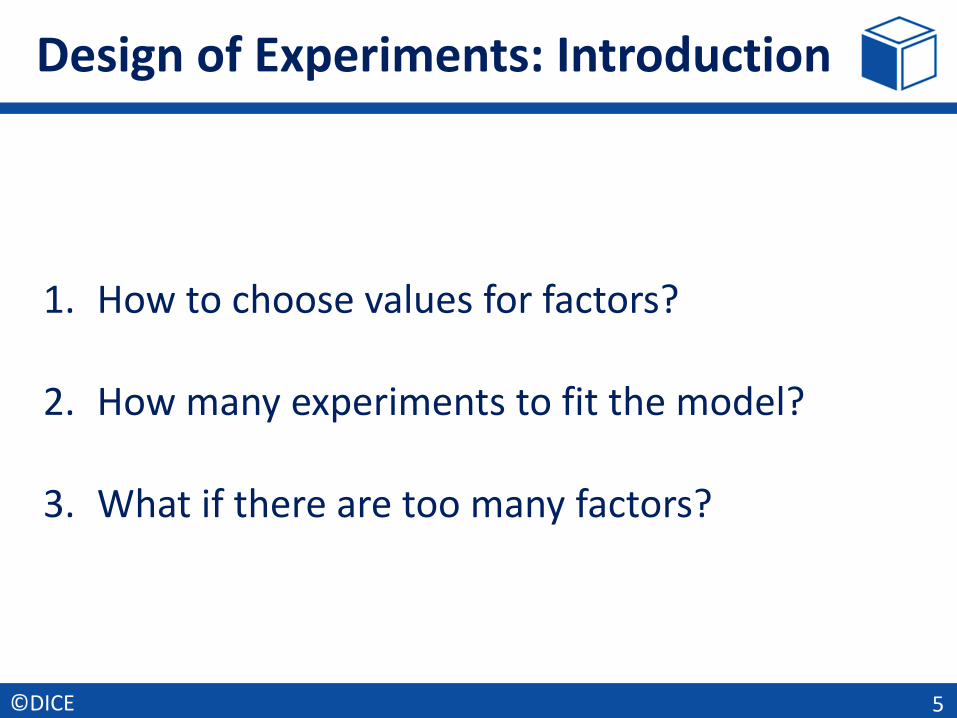
Design of Experiments: Introduction
5 ©DICE
1. How to choose values for factors?
2. How many experiments to fit the model?
3. What if there are too many factors?
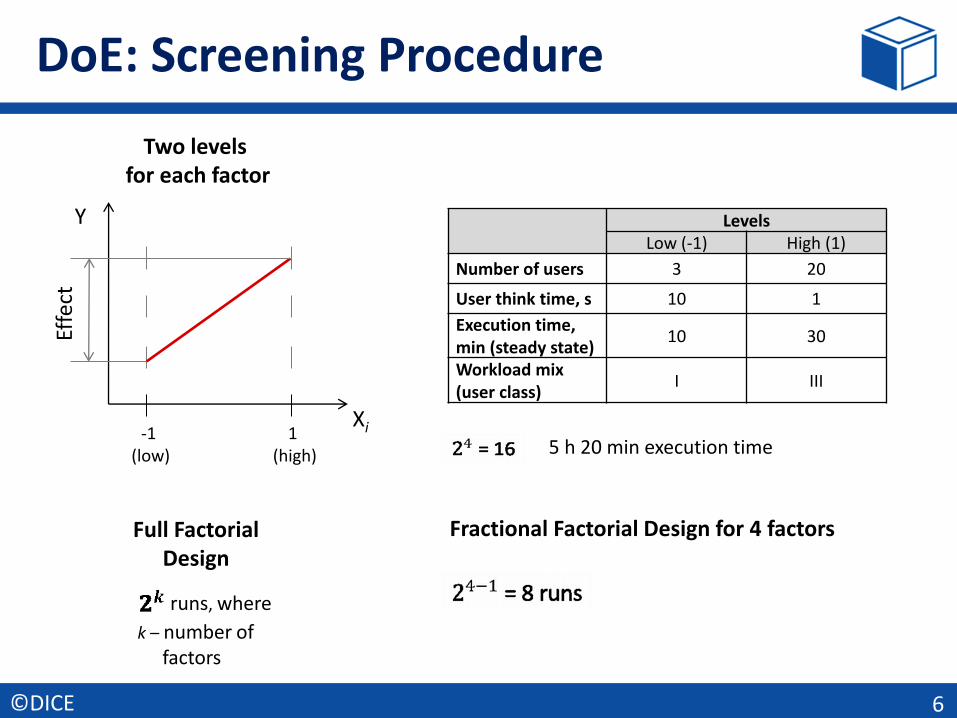
DoE: Screening Procedure
6 ©DICE
Y
Xi -1 (low)
1 (high)
Effe
ct
Two levels for each factor
Full Factorial Design
runs, where
k – number of factors
Levels
Low (-1) High (1)
Number of users 3 20
User think time, s 10 1
Execution time, min (steady state)
10 30
Workload mix (user class)
I III
5 h 20 min execution time
Fractional Factorial Design for 4 factors
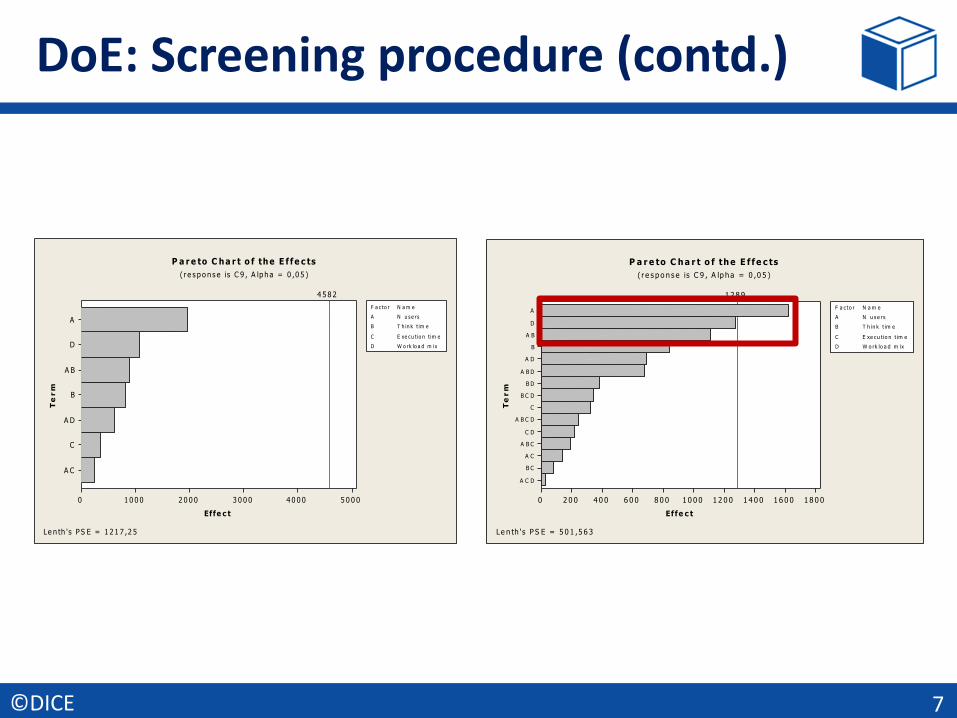
DoE: Screening procedure (contd.)
7 ©DICE
A C D
B C
A C
A B C
C D
A B C D
C
B C D
B D
A B D
A D
B
A B
D
A
1 8 0 01 6 0 01 4 0 01 2 0 01 0 0 08 0 06 0 04 0 02 0 00T
er
mEf fe c t
1 2 8 9
A N u s e rs
B T h in k t im e
C E xe cu t io n t im e
D W o rk lo a d m ix
F a c to r N a m e
P a r e to C h a r t o f th e E f f e c ts
( r e s p o n s e is C 9 , A lp h a = 0 ,0 5 )
Le n th 's P S E = 5 0 1 ,5 6 3
A C
C
A D
B
A B
D
A
5 0 0 04 0 0 03 0 0 02 0 0 01 0 0 00
Te
rm
Ef fe c t
4 5 8 2
A N u s e rs
B T h in k t im e
C E xe cu t io n t im e
D W o rk lo a d m ix
F a c to r N a m e
P a r e to C h a r t o f th e E f f e c ts
( r e s p o n s e is C 9 , A lp h a = 0 ,0 5 )
Le n th 's P S E = 1 2 1 7 ,2 5
DoE: Screening procedure (contd.)
8 ©DICE
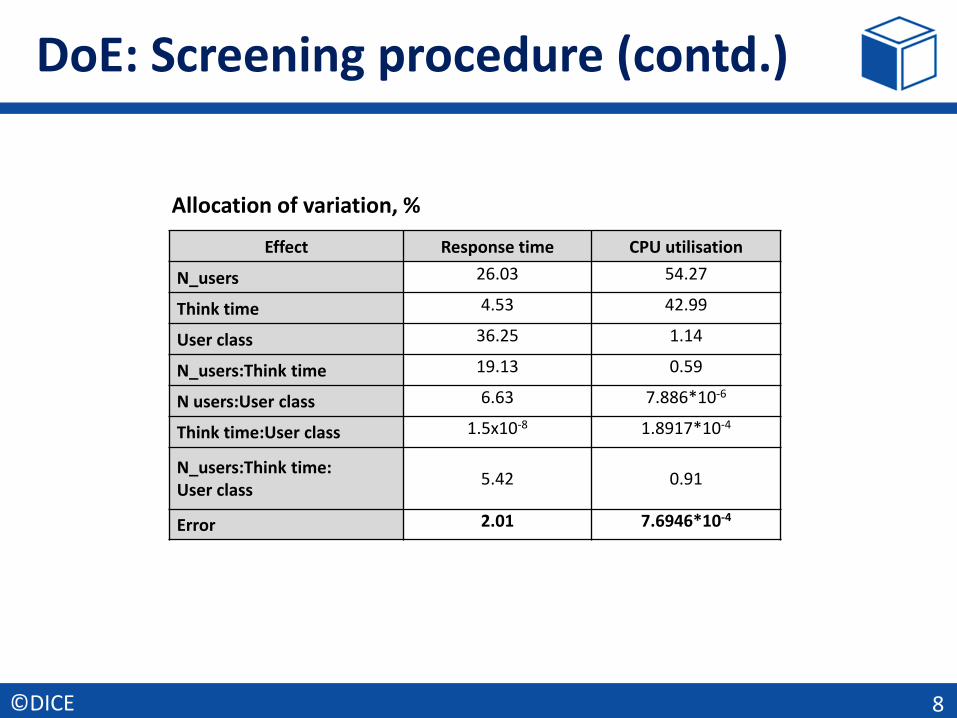
Effect Response time CPU utilisation
N_users 26.03 54.27
Think time 4.53 42.99
User class 36.25 1.14
N_users:Think time 19.13 0.59
N users:User class 6.63 7.886*10-6
Think time:User class 1.5x10⁻⁸ 1.8917*10-4
N_users:Think time: User class
5.42 0.91
Error 2.01 7.6946*10-4
Allocation of variation, %
DoE: Constructing the Model
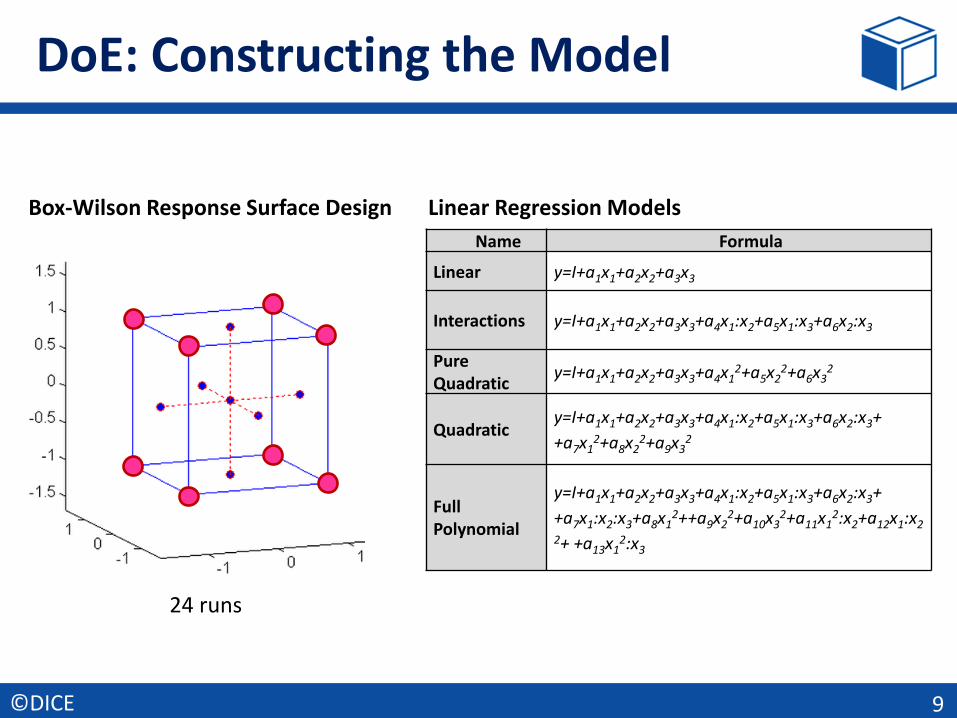
Name Formula
Linear y=I+a1x1+a2x2+a3x3
Interactions y=I+a1x1+a2x2+a3x3+a4x1:x2+a5x1:x3+a6x2:x3
Pure Quadratic
y=I+a1x1+a2x2+a3x3+a4x12+a5x2
2+a6x32
Quadratic y=I+a1x1+a2x2+a3x3+a4x1:x2+a5x1:x3+a6x2:x3+
+a7x12+a8x2
2+a9x32
Full Polynomial
y=I+a1x1+a2x2+a3x3+a4x1:x2+a5x1:x3+a6x2:x3+
+a7x1:x2:x3+a8x12++a9x2
2+a10x32+a11x1
2:x2+a12x1:x22+ +a13x1
2:x3
9 ©DICE
Box-Wilson Response Surface Design Linear Regression Models
24 runs
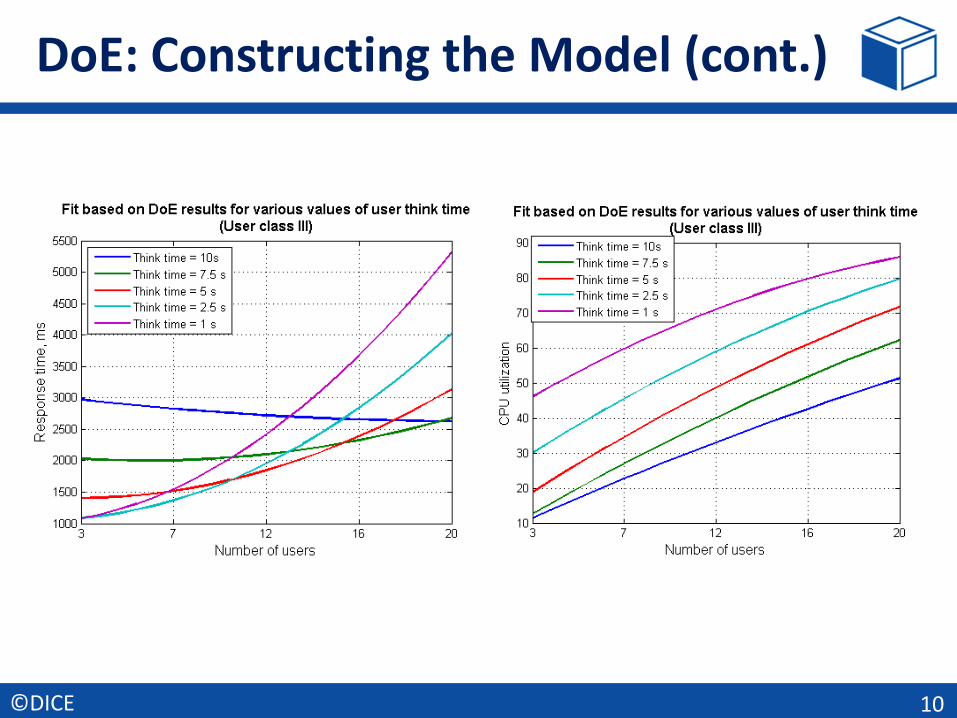
DoE: Constructing the Model (cont.)
10 ©DICE
Model Prediction Accuracy
11 ©DICE
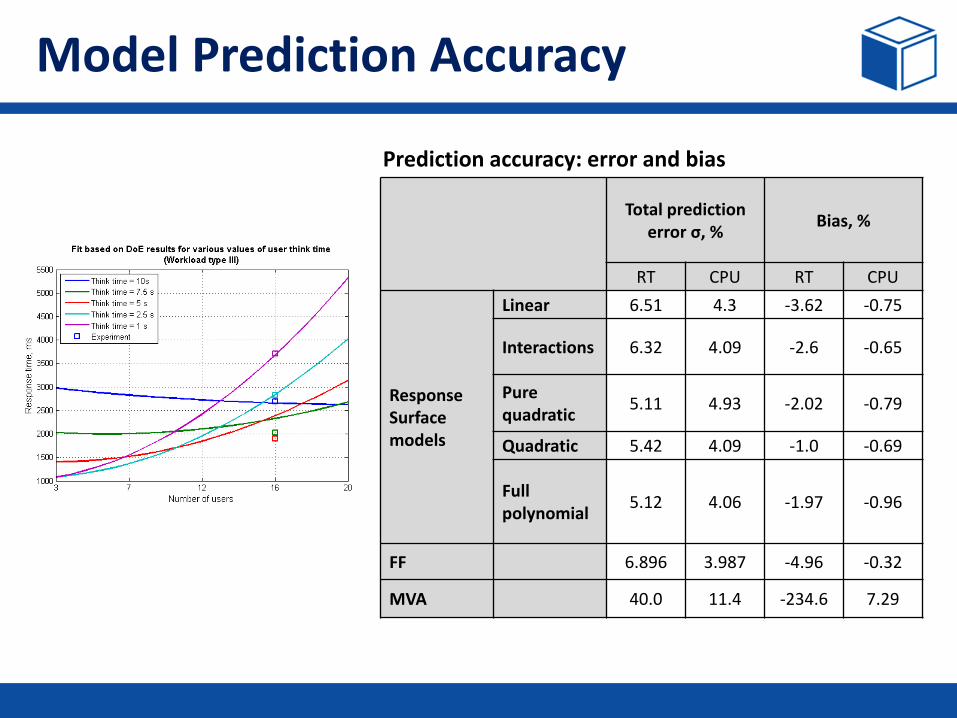
Total prediction
error σ, % Bias, %
RT CPU RT CPU
Response Surface models
Linear 6.51 4.3 -3.62 -0.75
Interactions 6.32 4.09 -2.6 -0.65
Pure quadratic
5.11 4.93 -2.02 -0.79
Quadratic 5.42 4.09 -1.0 -0.69
Full polynomial
5.12 4.06 -1.97 -0.96
FF 6.896 3.987 -4.96 -0.32
MVA 40.0 11.4 -234.6 7.29
Prediction accuracy: error and bias
Conclusions
• DoE prediction accuracy: 5-6% for RT and 4-5% for Ucpu. Out-of-the box QN algorithm - 40% and 12% respectively.
• DoE captured app’s ‘anomalous’ behaviour w/o information about its ‘insides’.
• Screening: 3 factors - 98% of variation in RT and 99.9% in Ucpu.
• Fractional factorial designs - use with care.
12 ©DICE
Feedback and Discussion Starter Qs
1. What is the place of DoE in Continuous Testing?
2. CT presents challenges to DevOps. Design of Experiments might be a solution.
13 ©DICE
Thank you!
14 ©DICE