Embed Size (px)
Citation preview
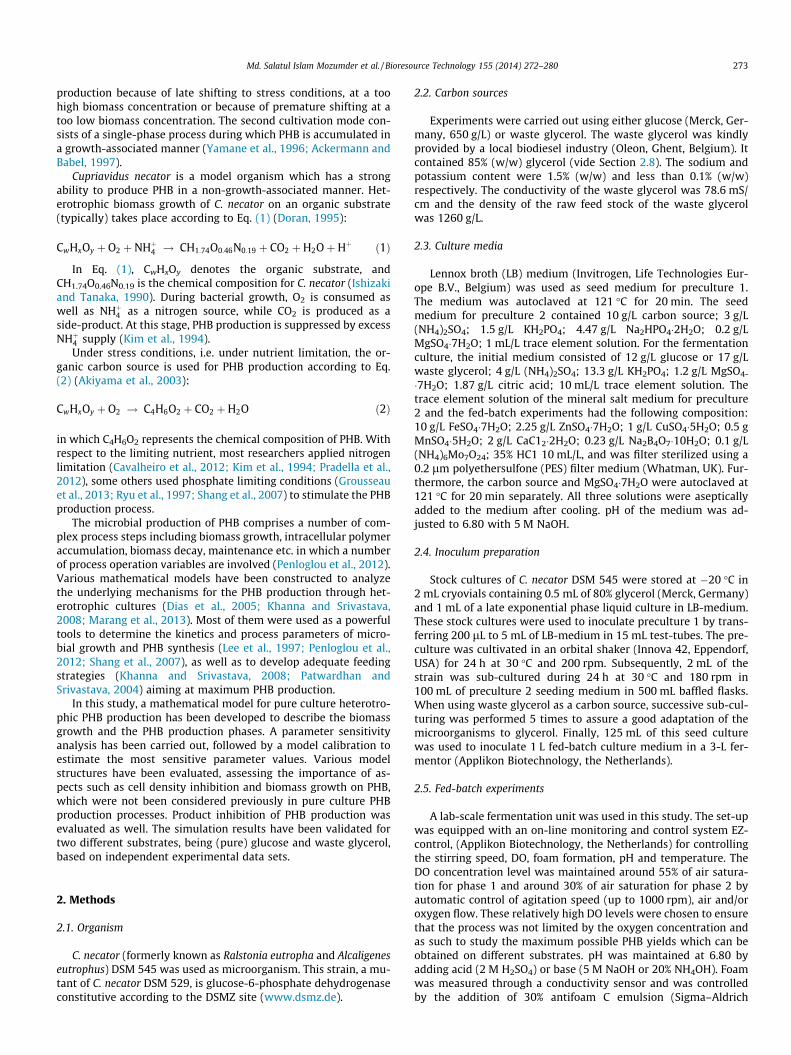
Bioresource Technology 155 (2014) 272–280
Contents lists available at ScienceDirect
Bioresource Technology
journal homepage: www.elsevier .com/locate /bior tech
Modeling pure culture heterotrophic production of polyhydroxybutyrate(PHB)
0960-8524/$ - see front matter � 2013 Elsevier Ltd. All rights reserved.http://dx.doi.org/10.1016/j.biortech.2013.12.103
⇑ Corresponding author at: Flemish Institute for Technological Research (VITO),Business Unit Separation and Conversion Technology, Boeretang 200, 2400 Mol,Belgium. Tel.: +32 14336903; fax: +32 14326586.
E-mail address: [email protected] (M.S.I Mozumder).
Md. Salatul Islam Mozumder a,b,⇑, Laurens Goormachtigh b, Linsey Garcia-Gonzalez a, Heleen De Wever a,Eveline I.P. Volcke b
a Flemish Institute for Technological Research (VITO), Business Unit Separation and Conversion Technology, Boeretang 200, 2400 Mol, Belgiumb Ghent University, Department of Biosystems Engineering, Coupure Links 653, 9000 Gent, Belgium
h i g h l i g h t s
� A mechanistic model was developed for fed-batch heterotrophic PHB production.� Model calibration and validation was performed for glucose and for waste glycerol.� Biomass growth takes place on PHB besides carbon substrate.� Growth is inhibited nonlinearly by the biomass density.� PHB production is characterized by nonlinear product inhibition.
a r t i c l e i n f o
Article history:Received 17 October 2013Received in revised form 19 December 2013Accepted 22 December 2013Available online 3 January 2014
Keywords:FermentationPolyhydroxybutyrate (PHB)Cell density inhibitionProduct inhibitionSimulation
a b s t r a c t
In this contribution a mechanistic model describing the production of polyhydroxybutyrate (PHB)through pure-culture fermentation was developed, calibrated and validated for two different substrates,namely glucose and waste glycerol. In both cases, non-growth-associated PHB production was triggeredby applying nitrogen limitation. The occurrence of some growth-associated PHB production besides non-growth-associated PHB production was demonstrated, although it is inhibited in the presence of nitro-gen. Other phenomena observed experimentally and described by the model included biomass growthon PHB and non-linear product inhibition of PHB production. The accumulated impurities from the wastesubstrate negatively affected the obtained maximum PHB content. Overall, the developed mathematicalmodel provided an accurate prediction of the dynamic behavior of heterotrophic biomass growth andPHB production in a two-phase pure culture system.
� 2013 Elsevier Ltd. All rights reserved.
1. Introduction
Polyhydroxybutyrate (PHB) is a biodegradable and bio-basedplastic, which is synthesized by a wide variety of organisms asan intracellular storage material from renewable resources andhas the potential to substitute conventional fossil fuel based plas-tics for a wide range of applications. Despite its advantages, PHB isstill commercially behind the petroleum based synthetic plastics.Although rising oil price and environmental consciousness gener-ated interest on commercial production of PHB, the majordrawback is the high production cost. The factors affecting the eco-nomics of PHB include the costs for raw materials and downstreamprocessing as well as the lack of an optimal control strategy (Atlic
et al., 2011; Patnaik, 2005). To overcome these limitations, a num-ber of studies aimed at better understanding and optimization ofthe fermentation process (Dias et al., 2005, 2008; Khanna andSrivastava, 2008; Spoljaric et al., 2013).
Fed-batch operation is typically applied to achieve a high celldensity culture, which is a prerequisite for a high productivityand yield, particularly in cases of intracellular products. Two pre-valent cultivation methods are employed for PHB productiondepending on the microorganisms used. The most frequentlyapplied method is a two-phase fermentation process consistingof a cell growth phase under favorable growth conditions to yielda high cell density, followed by a PHB production phase underimbalanced growth conditions by limiting a nutritional elementsuch as nitrogen, phosphate or oxygen to trigger PHB synthesisand accumulation (Grousseau et al., 2013; Patwardhan andSrivastava, 2008; Ryu et al., 1997). During the two-phase fermen-tation processes, cell growth and PHB production need to bebalanced to obtain a higher productivity, avoiding incomplete
Md. Salatul Islam Mozumder et al. / Bioresource Technology 155 (2014) 272–280 273
production because of late shifting to stress conditions, at a toohigh biomass concentration or because of premature shifting at atoo low biomass concentration. The second cultivation mode con-sists of a single-phase process during which PHB is accumulated ina growth-associated manner (Yamane et al., 1996; Ackermann andBabel, 1997).
Cupriavidus necator is a model organism which has a strongability to produce PHB in a non-growth-associated manner. Het-erotrophic biomass growth of C. necator on an organic substrate(typically) takes place according to Eq. (1) (Doran, 1995):
CwHxOy þ O2 þ NHþ4 ! CH1:74O0:46N0:19 þ CO2 þH2OþHþ ð1Þ
In Eq. (1), CwHxOy denotes the organic substrate, andCH1.74O0.46N0.19 is the chemical composition for C. necator (Ishizakiand Tanaka, 1990). During bacterial growth, O2 is consumed aswell as NHþ4 as a nitrogen source, while CO2 is produced as aside-product. At this stage, PHB production is suppressed by excessNHþ4 supply (Kim et al., 1994).
Under stress conditions, i.e. under nutrient limitation, the or-ganic carbon source is used for PHB production according to Eq.(2) (Akiyama et al., 2003):
CwHxOy þ O2 ! C4H6O2 þ CO2 þH2O ð2Þ
in which C4H6O2 represents the chemical composition of PHB. Withrespect to the limiting nutrient, most researchers applied nitrogenlimitation (Cavalheiro et al., 2012; Kim et al., 1994; Pradella et al.,2012), some others used phosphate limiting conditions (Grousseauet al., 2013; Ryu et al., 1997; Shang et al., 2007) to stimulate the PHBproduction process.
The microbial production of PHB comprises a number of com-plex process steps including biomass growth, intracellular polymeraccumulation, biomass decay, maintenance etc. in which a numberof process operation variables are involved (Penloglou et al., 2012).Various mathematical models have been constructed to analyzethe underlying mechanisms for the PHB production through het-erotrophic cultures (Dias et al., 2005; Khanna and Srivastava,2008; Marang et al., 2013). Most of them were used as a powerfultools to determine the kinetics and process parameters of micro-bial growth and PHB synthesis (Lee et al., 1997; Penloglou et al.,2012; Shang et al., 2007), as well as to develop adequate feedingstrategies (Khanna and Srivastava, 2008; Patwardhan andSrivastava, 2004) aiming at maximum PHB production.
In this study, a mathematical model for pure culture heterotro-phic PHB production has been developed to describe the biomassgrowth and the PHB production phases. A parameter sensitivityanalysis has been carried out, followed by a model calibration toestimate the most sensitive parameter values. Various modelstructures have been evaluated, assessing the importance of as-pects such as cell density inhibition and biomass growth on PHB,which were not been considered previously in pure culture PHBproduction processes. Product inhibition of PHB production wasevaluated as well. The simulation results have been validated fortwo different substrates, being (pure) glucose and waste glycerol,based on independent experimental data sets.
2. Methods
2.1. Organism
C. necator (formerly known as Ralstonia eutropha and Alcaligeneseutrophus) DSM 545 was used as microorganism. This strain, a mu-tant of C. necator DSM 529, is glucose-6-phosphate dehydrogenaseconstitutive according to the DSMZ site (www.dsmz.de).
2.2. Carbon sources
Experiments were carried out using either glucose (Merck, Ger-many, 650 g/L) or waste glycerol. The waste glycerol was kindlyprovided by a local biodiesel industry (Oleon, Ghent, Belgium). Itcontained 85% (w/w) glycerol (vide Section 2.8). The sodium andpotassium content were 1.5% (w/w) and less than 0.1% (w/w)respectively. The conductivity of the waste glycerol was 78.6 mS/cm and the density of the raw feed stock of the waste glycerolwas 1260 g/L.
2.3. Culture media
Lennox broth (LB) medium (Invitrogen, Life Technologies Eur-ope B.V., Belgium) was used as seed medium for preculture 1.The medium was autoclaved at 121 �C for 20 min. The seedmedium for preculture 2 contained 10 g/L carbon source; 3 g/L(NH4)2SO4; 1.5 g/L KH2PO4; 4.47 g/L Na2HPO4�2H2O; 0.2 g/LMgSO4�7H2O; 1 mL/L trace element solution. For the fermentationculture, the initial medium consisted of 12 g/L glucose or 17 g/Lwaste glycerol; 4 g/L (NH4)2SO4; 13.3 g/L KH2PO4; 1.2 g/L MgSO4-
�7H2O; 1.87 g/L citric acid; 10 mL/L trace element solution. Thetrace element solution of the mineral salt medium for preculture2 and the fed-batch experiments had the following composition:10 g/L FeSO4�7H2O; 2.25 g/L ZnSO4�7H2O; 1 g/L CuSO4�5H2O; 0.5 gMnSO4�5H2O; 2 g/L CaC12�2H2O; 0.23 g/L Na2B4O7�10H2O; 0.1 g/L(NH4)6Mo7O24; 35% HC1 10 mL/L, and was filter sterilized using a0.2 lm polyethersulfone (PES) filter medium (Whatman, UK). Fur-thermore, the carbon source and MgSO4�7H2O were autoclaved at121 �C for 20 min separately. All three solutions were asepticallyadded to the medium after cooling. pH of the medium was ad-justed to 6.80 with 5 M NaOH.
2.4. Inoculum preparation
Stock cultures of C. necator DSM 545 were stored at �20 �C in2 mL cryovials containing 0.5 mL of 80% glycerol (Merck, Germany)and 1 mL of a late exponential phase liquid culture in LB-medium.These stock cultures were used to inoculate preculture 1 by trans-ferring 200 lL to 5 mL of LB-medium in 15 mL test-tubes. The pre-culture was cultivated in an orbital shaker (Innova 42, Eppendorf,USA) for 24 h at 30 �C and 200 rpm. Subsequently, 2 mL of thestrain was sub-cultured during 24 h at 30 �C and 180 rpm in100 mL of preculture 2 seeding medium in 500 mL baffled flasks.When using waste glycerol as a carbon source, successive sub-cul-turing was performed 5 times to assure a good adaptation of themicroorganisms to glycerol. Finally, 125 mL of this seed culturewas used to inoculate 1 L fed-batch culture medium in a 3-L fer-mentor (Applikon Biotechnology, the Netherlands).
2.5. Fed-batch experiments
A lab-scale fermentation unit was used in this study. The set-upwas equipped with an on-line monitoring and control system EZ-control, (Applikon Biotechnology, the Netherlands) for controllingthe stirring speed, DO, foam formation, pH and temperature. TheDO concentration level was maintained around 55% of air satura-tion for phase 1 and around 30% of air saturation for phase 2 byautomatic control of agitation speed (up to 1000 rpm), air and/oroxygen flow. These relatively high DO levels were chosen to ensurethat the process was not limited by the oxygen concentration andas such to study the maximum possible PHB yields which can beobtained on different substrates. pH was maintained at 6.80 byadding acid (2 M H2SO4) or base (5 M NaOH or 20% NH4OH). Foamwas measured through a conductivity sensor and was controlledby the addition of 30% antifoam C emulsion (Sigma–Aldrich
274 Md. Salatul Islam Mozumder et al. / Bioresource Technology 155 (2014) 272–280
Chemie, GmbH, Germany). PHB synthesis was triggered throughapplying nitrogen limitation in the presence of substrate (glucoseor waste glycerol), which was achieved by replacing the NH4OHfeeding with NaOH for pH control. The process temperature wasfixed at 30 �C. A three-stage substrate feeding strategy was appliedto control the substrate concentration at the desired level, consist-ing of an initial 10 h of exponential feeding and then feeding basedon alkali-addition (coupled with NH4OH feeding for pH control)during biomass growth (phase 1), followed by constant feedingduring PHB production (phase 2) (Mozumder et al., 2013). Sampleswere taken at regular time intervals for analysis.
2.6. Analytical procedures
The glucose concentration in the medium was determined off-line by the phenol–sulfuric acid method as originally described inDubois et al. (1956). Concentrations of ammonium NHþ4 -N
� �were
evaluated off-line colorimetrically with standard cuvette tests ofHACH LANGE (Hach Lange Gmbh, Germany). A gravimetrical meth-od was used to determine the biomass concentration expressed asdry cell weight (DCW). Hereto, 15–20 mL culture broth was centri-fuged in pre-weighted screw-cap tubes for 30 min at 4 �C and7000 g in a centrifuge (SORVALL RC6+ centrifuge, Thermo Scien-tific, Clintonpark Keppekouter, Belgium). The cell pellets werewashed with distilled water, re-centrifuged, frozen at �20 �C andlyophilized until constant weight. For PHB analysis, dried samplesand external standards (PHB, Biomer) were subjected to methanol-ysis in presence of 50% (v/v) methanol and 50% (v/v) NaOH andthen acidified with 30% HCl. The resulting 3-hydroxybutyric acidwere analyzed by HPLC (Agilent Technologies, 1200 Series) with0.05% H3PO4 as mobile phase, Prevail Organic Acid column (particlesize 5 lm) at 40 �C and UV detector (Agilent Technologies, 1200Series). Residual cell concentration (RCC) was defined as the differ-ence between DCW and PHB concentration. Waste glycerol con-centration was determined off-line through HPLC using ultrapurewater (resistivity, 18.2 MX cm at 25 �C) as a mobile phase withMonochrom 5 Diol column at 25 �C and ELSD detector (Alltech3300 ELSD). The ultrapure water was produced using a Milli-Q de-vice (Merck Millipore, Germany) and 0.22 lm membrane filter. Thesodium quantification in waste glycerol was performed at 589 nmin a flame atomic absorption spectrophotometer (PerkinElmerAAnalyst 300) after dilution with water.
The PHB yield on substrate (Yps) was determined from the slopeof the PHB versus substrate concentration profile in the absence ofnitrogen. The residual biomass yield over substrate (Yxs) was deter-mined from the slope of the residual cell versus substrate concen-tration profile while correcting for substrate consumption for PHBproduction.
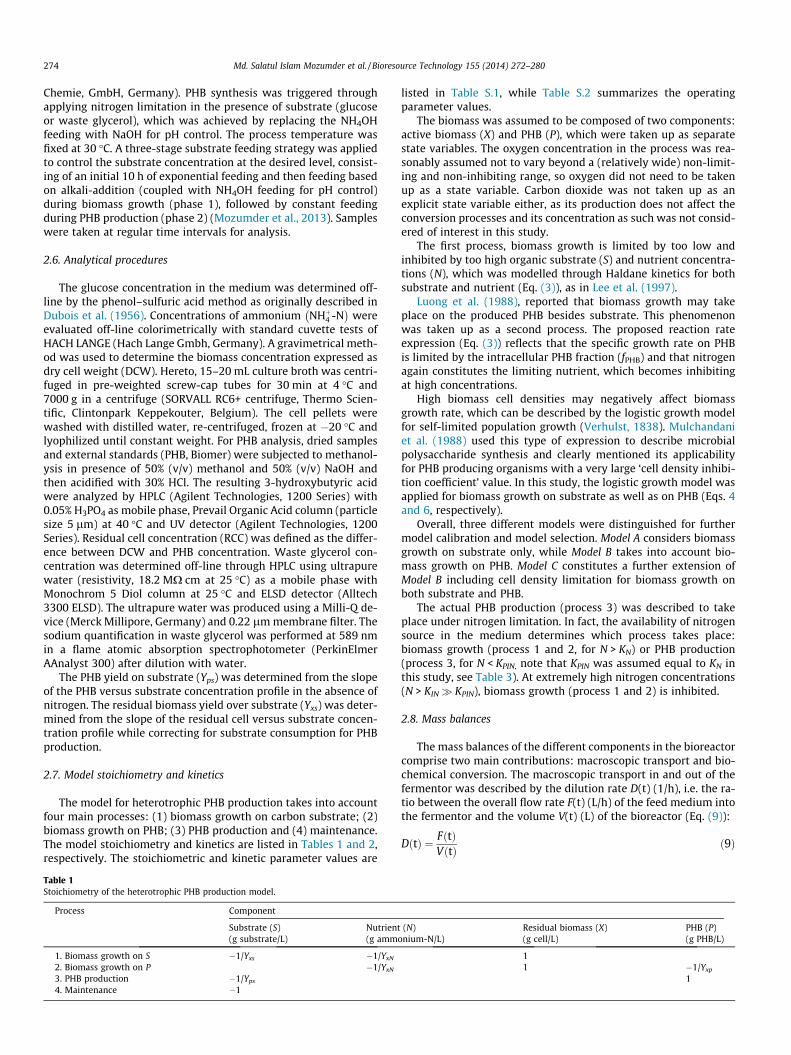
2.7. Model stoichiometry and kinetics
The model for heterotrophic PHB production takes into accountfour main processes: (1) biomass growth on carbon substrate; (2)biomass growth on PHB; (3) PHB production and (4) maintenance.The model stoichiometry and kinetics are listed in Tables 1 and 2,respectively. The stoichiometric and kinetic parameter values are
Table 1Stoichiometry of the heterotrophic PHB production model.
Process Component
Substrate (S)(g substrate/L)
Nutrient(g amm
1. Biomass growth on S �1/Yxs �1/YxN
2. Biomass growth on P �1/YxN
3. PHB production �1/Yps
4. Maintenance �1
listed in Table S.1, while Table S.2 summarizes the operatingparameter values.
The biomass was assumed to be composed of two components:active biomass (X) and PHB (P), which were taken up as separatestate variables. The oxygen concentration in the process was rea-sonably assumed not to vary beyond a (relatively wide) non-limit-ing and non-inhibiting range, so oxygen did not need to be takenup as a state variable. Carbon dioxide was not taken up as anexplicit state variable either, as its production does not affect theconversion processes and its concentration as such was not consid-ered of interest in this study.
The first process, biomass growth is limited by too low andinhibited by too high organic substrate (S) and nutrient concentra-tions (N), which was modelled through Haldane kinetics for bothsubstrate and nutrient (Eq. (3)), as in Lee et al. (1997).
Luong et al. (1988), reported that biomass growth may takeplace on the produced PHB besides substrate. This phenomenonwas taken up as a second process. The proposed reaction rateexpression (Eq. (3)) reflects that the specific growth rate on PHBis limited by the intracellular PHB fraction (fPHB) and that nitrogenagain constitutes the limiting nutrient, which becomes inhibitingat high concentrations.
High biomass cell densities may negatively affect biomassgrowth rate, which can be described by the logistic growth modelfor self-limited population growth (Verhulst, 1838). Mulchandaniet al. (1988) used this type of expression to describe microbialpolysaccharide synthesis and clearly mentioned its applicabilityfor PHB producing organisms with a very large ‘cell density inhibi-tion coefficient’ value. In this study, the logistic growth model wasapplied for biomass growth on substrate as well as on PHB (Eqs. 4and 6, respectively).
Overall, three different models were distinguished for furthermodel calibration and model selection. Model A considers biomassgrowth on substrate only, while Model B takes into account bio-mass growth on PHB. Model C constitutes a further extension ofModel B including cell density limitation for biomass growth onboth substrate and PHB.
The actual PHB production (process 3) was described to takeplace under nitrogen limitation. In fact, the availability of nitrogensource in the medium determines which process takes place:biomass growth (process 1 and 2, for N > KN) or PHB production(process 3, for N < KPIN, note that KPIN was assumed equal to KN inthis study, see Table 3). At extremely high nitrogen concentrations(N > KIN� KPIN), biomass growth (process 1 and 2) is inhibited.
2.8. Mass balances
The mass balances of the different components in the bioreactorcomprise two main contributions: macroscopic transport and bio-chemical conversion. The macroscopic transport in and out of thefermentor was described by the dilution rate D(t) (1/h), i.e. the ra-tio between the overall flow rate F(t) (L/h) of the feed medium intothe fermentor and the volume V(t) (L) of the bioreactor (Eq. (9)):
DðtÞ ¼ FðtÞVðtÞ ð9Þ
(N)onium-N/L)
Residual biomass (X)(g cell/L)
PHB (P)(g PHB/L)
11 �1/Yxp
1
Table 2Kinetic expressions of the heterotrophic PHB production model.
Process Reaction rate Model
1. Biomass growth on S qxs ¼ lxsXWith
lxs ¼ lmaxxs
S
KS þ Sþ S2=KIS
!N
KN þ N þ N2=KIN
!ð3Þ A, B
lxs ¼ lmaxxs
S
KS þ Sþ S2=KIS
!N
KN þ N þ N2=KIN
!1� ð X
XmÞa� �ð4Þ C
2. Biomass growth on P qxp ¼ lxpX
with
lxp ¼ lmaxxp
fPHB
KPHBþfPHB
N
KN þ N þ N2=KIN
!ð5Þ B
lxp ¼ lmaxxp
fPHB
KPHBþfPHB
N
KN þ N þ N2=KIN
!1� ð X
XmÞa� �
ð6Þ C
3. PHB production qps ¼ lpsX
with
lps ¼ lmaxps
S
KPS þ Sþ S2=KPIS
!1� fPHB
fPHBðmaxÞ
� �b" #
KPIN
N þ KPINð7Þ A, B, C
4. Maintenance qm ¼ msX ð8Þ A, B, C
Table 3Initial and estimated values of most sensitive kinetic parameters used in the model calibration.
Parameter Initial value Unit Estimated parameter value
Using glucose Using waste glycerol
Model A Model B Model C Model C
KIS 17.430 g substrate/L 20.092 17.323 16.728 37.136KIN 1.500 g N/L 1.567 – – –lmax
XS 0.410 g cell/g cell/h 0.491 0.446 0.46 0.328lmax
ps 0.180 g PHB/g cell/h 0.239 0.222 0.217 0.232KPIN 0.254 g N/L – 0.265 0.262 0.679lmax
xp 0.180 g cell/g cell/h – 0.149 0.126 0.136KPHB 0.250 g PHB/g cell – – 0.148 0.138
Md. Salatul Islam Mozumder et al. / Bioresource Technology 155 (2014) 272–280 275
A fed-batch process was considered (no outgoing flow), inwhich organic substrate and nutrient (ammonium) were fed tothe fermentor in such a way that their concentration in thefermentor was kept constant at the levels corresponding withmaximum production, being S and N, respectively. The overall feedflow rate F(t) (L/h) was determined by the flow rates of the organicsubstrate and nutrient solutions (FS (L/h) and FN (L/h), respectively)as well as by the substrate and nitrogen concentrations in thesefeed solutions (SF (g/L) and NF (g/L), respectively) and their densi-ties (qFS (g/L) and qFN (g/L), respectively), through the relationship:
FðtÞ ¼ dVðtÞdt¼ FSðtÞ
qFS � SF
qwþ FNðtÞ
qFN � NF
qwð10Þ
Mass balances were set up for the substrate and nitrogen con-centrations in the fermentor (see Supplementary Material S.1),from which the feed flow rates of the organic substrate andnutrient solutions were subsequently determined, given that thesubstrate and nutrient concentrations were maintained at aconstant (optimal) level:
dSðtÞdt¼ FSðtÞSF
VðtÞ � DðtÞS� lSXðtÞ ¼ 0 ð11Þ
() FSðtÞ ¼1SF
SdVðtÞ
dtþ lSXðtÞVðtÞ
� �ð12Þ
276 Md. Salatul Islam Mozumder et al. / Bioresource Technology 155 (2014) 272–280
dNðtÞdt¼ FNðtÞNF
VðtÞ � DðtÞN � lNXðtÞ ¼ 0 ð13Þ
() FNðtÞ ¼1
NFN
dVðtÞdtþ lNXðtÞVðtÞ
� �ð14Þ
lS (g substrate/g cell/h) and lN (g nitrogen/g cell/h) denote the spe-cific substrate consumption rate and the specific nitrogen consump-tion rate, respectively:
lS ¼lxs
Yxsþ
lps
YpsþmS ð15Þ
lN ¼lxs þ lxp
YxNð16Þ
Assuming that neither biomass nor PHB were present in thefeed solutions, the biomass and PHB concentration profiles duringfed batch culture were obtained from their respective massbalances:
dXðtÞdt¼ lx � DðtÞ� �
XðtÞ ð17Þ
dPðtÞdt¼ lpX � DðtÞPðtÞ ð18Þ
in which lx (g cell/g cell/h) and lp (g PHB/g cell/h) denote the netbiomass growth rate and the net PHB production rate, respectively:lx ¼ lxs þ lxp ð19Þ
lp ¼ lps �lxp
Yxpð20Þ
2.9. Sensitivity analysis
A local sensitivity analysis of different kinetic parametersaround their default values (Table 3) was performed in order toidentify which parameters were the most sensitive. Only theparameters that have a considerable influence on the model out-put, were subsequently considered in the parameter estimation.
The sensitivity function was defined as the partial derivative ofthe variable (y) to the parameter (h), which was approximatednumerically through the finite difference method assuming locallinearity:@yðtÞ@h¼ lim
Dh!0
yðt; hþ DhÞ � yðt; hÞDh
ð21Þ
The perturbation Dh is very low and defined by:
Dh ¼ p � Dh ð22Þ
in which p denotes the perturbation factor. The perturbation needsto be taken small enough for the linear approximation to be validand large enough to avoid numerical instabilities. A typical valuefor the perturbation factor (p) of 10�4 was therefore selected.
The sensitivity function described by Eq. (21) is an absolute sen-sitivity function, of which the value depends on the value of thevariable and the parameter considered. Besides, its unit of sensitiv-ity function is different for different parameters, which furtherhampers its interpretation and the comparison of the sensitivityof different parameters. To overcome these difficulties, the relativesensitivity function SRf ðtÞ of variable y towards parameter h wasdefined as Eq. (23):
SRf ðtÞ ¼@yðtÞ@h
:h
yðtÞ ð23Þ
The relative sensitivity function is dimensionless and allowscomparing the sensitivity of different parameters at a time instantt. To compare the overall sensitivity of different parameters over
the considered time period, the combined relative sensitivity func-tion (d) is obtained from the average of SRf ðtÞ for a given parameterh as:
d ¼Pt
i¼1@yiðtÞ@h � h
yiðtÞ
� n
ð24Þ
in which n denotes a freely chosen number of virtualmeasurements.
In this study, d > 2 was used as a selection criteria for the mostsensitive parameters, of which the values were estimated for mod-el calibration.
2.10. Model calibration
In view of parameter estimation, an objective function (J(h))was defined to obtain the best possible fit between the model pre-dictions and experimental data, as obtained by minimizing thesum of squared errors (Eq. (25)):
jðhÞ ¼Xt
i¼1yiðtÞ � ym
i ðt;hÞ� �2 ð25Þ
yiðtÞ represents the experimental data observations of the mod-el outputs, in this case the residual cell (RCC) and the PHB concen-tration, while ym
t ðt;hÞ denotes the model predictions correspondingwith the given parameter set h at time t. During the model calibra-tion, the ‘Nelder-Mead simplex direct search’ estimation algorithm(Nelder and Mead, 1965), an unconstrained nonlinear optimizationmethod, was used.
2.11. Model validation
During model validation, the model predictions were comparedwith an independent experimental dataset. For this purpose, theNash–Sutcliffe model efficiency coefficient (Nash and Sutcliffe,1970) was used to quantitatively describe the accuracy of modeloutputs and in this way assess the predictive power of the model:
E ¼ 1�PT
t¼0 yt � ymt
� �2PTt¼0 yt � �yð Þ2
ð26Þ
Nash–Sutcliffe efficiencies range from �1 to 1. An efficiency of1 (E = 1) corresponds to a perfect match of modelled outcome tothe observed data. An efficiency of 0 (E = 0) indicates that the mod-el predictions are as accurate as the mean of the observed data,whereas an efficiency less than zero (E < 0) indicates that the ob-served mean is a better predictor than the model. Essentially, thecloser the model efficiency is to 1, the more accurate the model is.
3. Results and discussion
The model behaviour was evaluated for two different sub-strates; pure glucose and waste glycerol. Model calibration andvalidation were performed based on independent experimentaldata sets. The model calibration was based on the growth phase(phase 1) only, while both phases in the PHB production process(phase 1 and 2) were accounted for during validation.
3.1. Model calibration for biomass growth (phase 1) on glucosesubstrate
To describe biomass growth on glucose, three different models(A–C) were considered and calibrated on experimental data. Thesimulation outcomes from the calibrated models were comparedto identify the most suitable model to describe the process.
Md. Salatul Islam Mozumder et al. / Bioresource Technology 155 (2014) 272–280 277
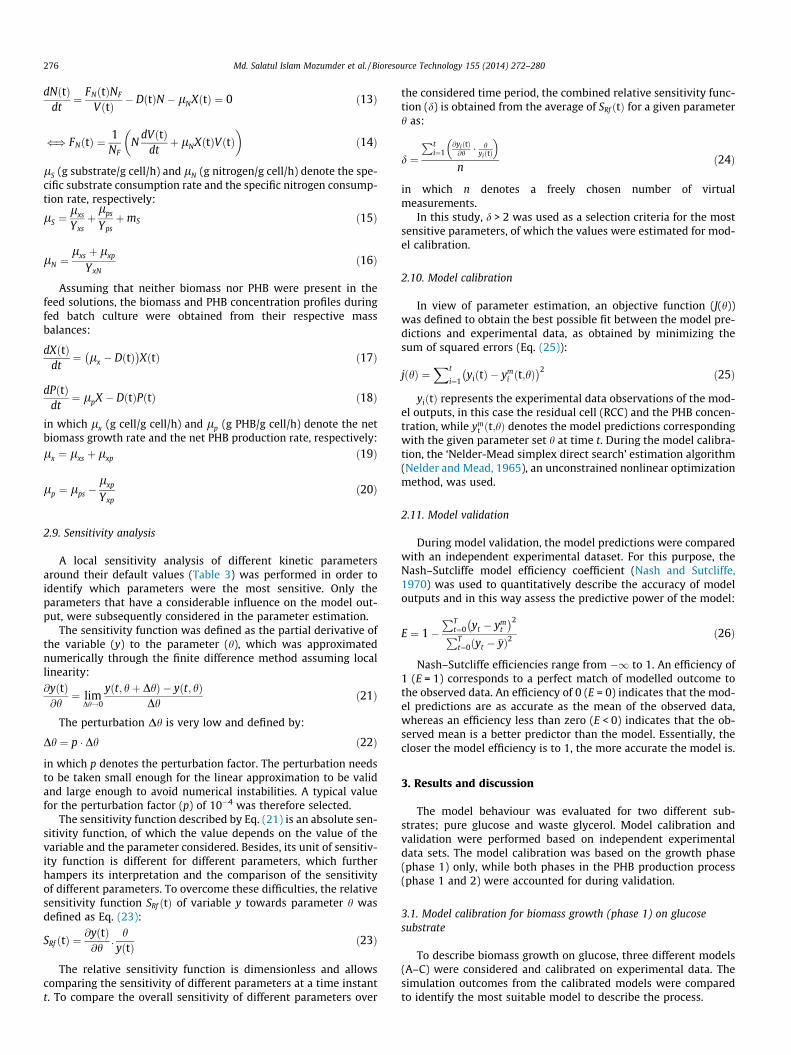
3.1.1. Experimental data for the biomass growth phaseThe experimental results for biomass growth on glucose (Fig. 1,
discrete markers), show that after 33 h the total biomass concen-tration reached a maximal level of 73.5 g/L, while growth-associ-ated PHB production amounted to 6 g/L, corresponding to a PHBcontent of 8%. Throughout the experiment the glucose concentra-tion was maintained within its optimal range (10–20 g/L), in whichthe specific growth rate remained almost constant (Mozumderet al., 2013). Although the ammonium nitrogen concentration de-creased from 0.78 to 0.45 g/L, nitrogen was sufficient for biomassgrowth (Repaske, 1962).
3.1.2. Model AFor this model considering biomass growth on substrate only
and neglecting biomass self-inhibition, the parameters KIS, KIN,lmax
XS and lmaxps were found most sensitive with respect to the model
output variables RCC and PHB (d > 2, Table S.3). The estimatedparameter values are listed in Table 3. Fig. 1a compares the cali-brated model output with the experimental observations. Theexperimental RCC concentrations are underestimated up to themoment that the maximal RCC is reached, while the PHB produc-tion is overestimated by the model with corresponding Nash–Sutc-liffe model efficiency coefficients (E) for RCC and PHB amounting to0.76 and �0.23, respectively (Table S.4). This can be explained bythe fact that the conversion of PHB into biomass is not consideredin Model A.
3.1.3. Model BModel B accounts for biomass growth on the produced PHB, be-
sides growth on organic substrate, in the presence of nitrogen. KIS,lmax
XS , lmaxps , KPIN and lmax
xp were found as the most sensitive param-eters and their values were subsequently estimated (Table 3).Fig. 1b shows that the PHB concentration is predicted better by
Fig. 1. Model calibration results for glucose substrate. Comparison between the simu(c) Model C.
Model B than by Model A, while the RCC is still not so well predicted(E = 0.72 for RCC and E = 0.91 for PHB, see Table S.4). In particular,the simulated biomass concentration keeps rising while the exper-imentally determined biomass concentration reaches a constantlevel at the end of the experiment (around 73 g/L).
The experimental data shows PHB accumulation under non-limiting conditions, i.e. during the biomass growth phase (Fig. 1)that incorporated in the model (Eq. (7)). Microorganisms have beenreported to use this intracellular PHB, besides organic substrate, forbiomass growth in presence of nitrogen (Luong et al., 1988). Bycomparing the simulation results for the model only consideringbiomass growth on organic substrate (Model A) and also includingbiomass growth on PHB (Model B) with the experimental results(Fig. 1a and b), it is clear that biomass growth on PHB duringnon-limiting conditions indeed cannot be neglected, in this respectdemonstrating the better predictive capacity of Model B over ModelA. The proposed reaction rate expression (Eq. (5)) reflects that thespecific growth rate on PHB is limited by the intracellular PHB frac-tion (fPHB) and that nitrogen again constitutes the limiting nutrient,which becomes inhibiting at high concentrations.
3.1.4. Model CBiomass self-inhibition on growth was considered in Model C.
The parameters KIS, lmaxXS , lmax
ps , KPIN, lmaxxp and KPHB were found most
sensitive; estimated in the model calibration. This results in a goodaccordance between the experimental data and the simulation re-sults (Fig. 1c), which is also reflected by values of the Nash–Sutc-liffe model efficiency coefficients close to 1 (E = 0.99 and 0.94 forRCC and PHB, respectively, see Table S.4). Comparing the simulatedand experimental biomass concentrations profiles (Fig. 1c), it isclear that cells cannot grow in an unlimited way as was assumedin Model B. It is quite unlikely that oxygen limitation was thereason for the growth stop, given that the relatively high DO levels
lation outcome and experimental observations for (a) Model A, (b) Model B and
278 Md. Salatul Islam Mozumder et al. / Bioresource Technology 155 (2014) 272–280
applied in the process (the air saturation amounted from 48% to62% in practice). It was also verified that essential nutrients (phos-phate, MgSO4, trace elements); the biomass concentration couldnot be enhanced by adding these components at the middle andat the end of the cultivation period. Instead, the negative effectof high cell density on the biomass growth rate, described byMulchandani et al. (1988) was put responsible for limiting biomassgrowth on substrate and on PHB (Eqs. 4 and 6, respectively). Thismaximum biomass concentration, for which the specific growthrate becomes zero, was determined experimentally as Xm = 68g cell/L. The same value (68 ± 1 g cell/L) was found for bothsubstrates, glucose and waste glycerol, and was confirmed by re-peated experiments, which strengthens the hypothesis of biomassdensity inhibition and justifies its description through the logisticexpression.
The relationship between the biomass growth and cell densitydepends on cell density inhibition coefficient (a), of which the va-lue depends on the microbial species, the physicochemical proper-ties of the culture medium and the operation conditions (Luonget al., 1988). a = 1 denotes a linear relation between the specificgrowth rate and the biomass concentration, corresponding withlogistic growth kinetics. However, Strehaiano et al. (1983) experi-mentally demonstrated that the specific growth rate decreasednonlinearly with increasing biomass concentration. When a > 1,the growth lies in between exponential and logistic patterns. Thisis also the case in this study, in which the a-value of 5.8 given byMulchandani et al. (1988) but not previously evaluated on experi-mental data, was shown to adequately simulate the experimentalbehaviour.
3.2. Model validation for biomass growth and PHB production (phase 1and 2) on glucose substrate
Model C was subjected to validation on two independent exper-imental datasets, both considering the two phases of the PHBproduction process.
3.2.1. Experimental data for PHB productionTwo distinct experimental datasets were considered, which
differed in the time instant at which nitrogen (N) limitation wasimposed (switching point from phase 1 to phase 2) to enhancethe PHB productivity. When stopping the N feed at a RCC of 49 g/L, the maximal biomass (DCW) and corresponding PHB concentra-tions 128 and 97 g/L, respectively, were obtained after 56 h(Fig. 2a), corresponding with a PHB content of 75.8%. When apply-ing nitrogen limitation at 56 g/L residual biomass concentration, amaximal biomass (DCW) concentration of 164 g/L and correspond-ing PHB concentration of 125 g/L are achieved after 62 h (Fig. 2b),corresponding with 76.2% PHB. In both cases, the glucose concen-tration was at its optimal level with a very small fluctuation andthis fluctuation almost did not affect the cell growth and PHBproduction.
3.2.2. Model validationThe behaviour of Model C was simulated for two different
switching points, stopping nitrogen feeding at 49 and 56 g/L resid-ual cell concentration (RCC). The validation consists of a visualcomparison between the model prediction and the experimentalobservations (Fig. 2) besides the calculation of Nash–Sutcliffe mod-el efficiency coefficient (E) for RCC and PHB (Table S.4). In bothcases the models predict the experimental observations quite well.The E-values corresponding with an operation switch at 49 g/L RCCamount to 0.97 for RCC and 0.98 for PHB, while these for an oper-ation switch at 56 g/L RCC are 0.93 for RCC and 0.96 for PHB, all ofwhich are close to 1, thus indicating a very good model fit.
The availability of nitrogen determines whether biomassgrowth or PHB production will take place. Both non-growth-asso-ciated and growth-association PHB production are described by Eq.(7) in this study. During the biomass growth phase, no nitrogenlimitation is imposed, resulting in a high biomass growth and alow growth-associated PHB accumulation. Non-growth-associatedPHB production is triggered during the PHB production phase bystopping the nitrogen feeding. Growth and non-growth-associatedPHB production have been reported as two separate processes byseveral research groups (Mulchandani et al., 1989; Patwardhanand Srivastava, 2004, 2008). However, this phenomenon can be ex-plained only by the inhibition effect of nutrient concentration(Spoljaric et al., 2013).
Fermentation end products are known to negatively effect onmicrobial activities. The accumulation of PHB results in a decreas-ing PHB formation, described by Eq. (7) implying that the cells arenot capable to produce PHB in an unlimited way but that the PHBproduction rate approaches to zero as fPHB approaches fPHB(max). Therelation between the PHB production rate and product concentra-tion depends on the empirical PHB saturation power coefficient (b).Lee et al. (1997) indicated a linear relation (b = 1) whereas otherauthor (Patwardhan and Srivastava, 2004, 2008) used a propor-tional relation, but in reality it is not universally applicable. Thevalue b = 3.85 determined by Dias et al., (2005, 2006) for PHBproduction through mixed cultures was confirmed in this studyto be applicable as well for pure culture PHB production.
3.3. Model calibration for biomass growth (phase 1) on waste glycerolsubstrate
Model C was calibrated using waste glycerol considering onlybiomass growth (phase 1). Fig. 3 illustrates typical time course ofthe fed batch cultivation of C. necator in the bioreactor. A maxi-mum biomass concentration of 84.4 g/L and corresponding PHBconcentration of 18.3 g/L were obtained after 37 h of cultivationperiod, corresponding with a PHB content of 21.7%. The most sen-sitive kinetic parameters KIN , KPHB; KPIN ,lmax
XS ; lmaxPS and lmax
XP wereestimated (Table 3). The resulting model predicted the process per-formance well (Fig. 3), Nash–Sutcliffe model efficiency coefficientfor RCC and PHB were calculated as 0.96 and 0.83, respectively.
A high growth-associated PHB content was obtained usingwaste glycerol (21.7% PHB, Fig. 3) as a substrate compare to usingglucose (8% PHB content, Fig. 1), while the same nitrogen concen-tration level was maintained in both cases. The higher degree ofgrowth-associated PHB production using waste glycerol comparedto glucose is reflected by a higher nitrogen inhibition constant(lower nitrogen inhibition) in the model, namely KPIN = 0.68 and0.26 for waste glycerol and glucose, respectively (Table 3).
3.4. Model validation for biomass growth and PHB production (phase 1and 2) on waste glycerol substrate
Two experimental datasets concerning biomass growth andPHB production on waste glycerol were available for validation ofthe proposed model (Model C). These datasets differed in the timeinstant at which nitrogen limitation was applied to stimulate thePHB production, being 7 and 44 g/L residual cell concentration(RCC), in order to examine the effect of the time instant at whichthe shift was applied. When nitrogen was limited at a residual cellconcentration of 7 g/L, a maximal biomass (DCW) concentration of30.7 g/L and corresponding PHB concentration of 21.6 g/L were ob-tained after 40 h (Fig. 4a), corresponding with 70.4% PHB. Whenapplying nitrogen limitation at 44 g/L residual biomass concentra-tion, a maximal biomass (DCW) concentration of 104.7 g/L and cor-responding PHB concentration of 65.6 g/L were achieved after 48 h(Fig. 4b), corresponding with a PHB content of 62.7%. For both

Fig. 2. Model validation results for glucose substrate. Comparison between simulation outcome for Model C and experimental observations for two independent datasets,corresponding with a stop in the nitrogen feed at (a) 49 g/L and (b) 56 g/L residual cell concentration (RCC).
Fig. 3. Model calibration results for waste glycerol substrate. Comparison between the simulation outcome from Model C with experimental observations using wasteglycerol as a substrate only the growth phase.
Md. Salatul Islam Mozumder et al. / Bioresource Technology 155 (2014) 272–280 279
datasets, the model predictions agree well with the experimentalresults in terms of residual cell concentration (RCC), PHB and totalbiomass concentration (DCW). The E-values corresponding with anoperation switch at 7 g/L RCC amount to 0.95 for RCC and 0.94 forPHB, while these for an operation switch at 44 g/L RCC are 0.95 forRCC and 0.93 for PHB, all of which are close to 1, thus indicating avery good model fit.
The time instant at which the nitrogen limitation is imposed,hardly affects the PHB content in case of glucose substrate: 76%PHB content is obtained for both switching points considered.However, using waste glycerol as substrate, PHB contents of70.4% and 62.7% were obtained when applying nitrogen limitationat 7 and 44 g/L RCC, respectively. It is hypothesized that the lowerPHB content obtained in the case of waste glycerol for a later appli-cation of nitrogen limitation, i.e. at an increased cell density, is dueto the accumulation of impurities in the culture medium, whichnegatively affect the PHB accumulation metabolism of C. necator(Posada et al., 2011), and thus result in a decreased PHB content.
Fig. 4. Model validation results for waste glycerol substrate. Comparison of between simfeed at (a) 7 g/L and (b) 44 g/L residual cell concentration (RCC).
The accumulation of impurities can also be seen as the reasonfor the lower PHB content obtained from waste glycerol comparedto glucose, being maximum 70.4% and 76.2%, respectively, in thisstudy. The lower PHB content obtained on waste glycerol as a car-bon source instead of glucose corresponds to literature. A high PHBcontent (74%) was obtained by Kim et al. (1994) among othersusing glucose as substrate, whereas for glycerol maximum56–67% PHB content was obtained (Cavalheiro et al., 2009; Ibrahimand Steinbuchel, 2009; Posada et al., 2011).
Concerning the model simulation results for waste glycerol, thePHB content was underestimated for the switching point 7 g/L RCC(Fig. 4a) and overestimated for the switching point 44 g/L RCC(Fig. 4b). This is mathematically translated as a deviation of fPHBmax
from the used value (fPHBmax = 2), dependent on the switchingpoint. The maximum PHB to active biomass ratio (fPHBmax) wasexperimentally determined at 2.4 for the switching point 7 g/LRCC and at 1.65 for switching point 44 g/L RCC. Using this experi-mentally determined fPHBmax value for each dataset results in a
ulation outcome for Model C and experimental observations, stopping the nitrogen
280 Md. Salatul Islam Mozumder et al. / Bioresource Technology 155 (2014) 272–280
better model prediction, corresponding with higher values for theNash–Sutcliffe model efficiency coefficient (E) value, being 0.98for PHB both at switching point 7 g/L RCC and at switching point44 g/L RCC. In view of further model applications, further under-standing of the relation between the metabolic activities and accu-mulated impurities is required. For instance, relationships betweenthe maximum PHB content (fPHBmax) and the accumulation ofimpurities from the waste substrate could be established.
4. Conclusions
� A mechanistic model for fed-batch pure culture two-phase PHBproduction was developed, calibrated and validated for twodifferent substrates, namely glucose and waste glycerol.� Biomass growth on PHB during non-limiting (growth)
conditions was found non-negligible, even in the presence ofsubstrate.� Biomass growth was clearly inhibited by the biomass density.� Growth-associated PHB production took place besides non-
growth-associated PHB production.� Product (PHB) inhibition during pure culture PHB production
under nitrogen limitation followed a nonlinear relationship.
Appendix A. Supplementary data
Supplementary data associated with this article can be found, inthe online version, at http://dx.doi.org/10.1016/j.biortech.2013.12.103.
References
Ackermann, J.U., Babel, W., 1997. Growth associated synthesis ofpoly(hydroxybutyricacid) in Methylobacterium rhodesianum as an expressionof an internal bottleneck. Appl. Microbiol. Biotechnol. 47, 144–149.
Akiyama, M., Tsuge, T., Doi, Y., 2003. Environmental life cycle comparison ofpolyhydroxyalkanoates produced from renewable carbon resources by bacterialfermentation. Polym. Degrad. Stab. 80, 183–194.
Atlic, A., Koller, M., Scherzer, D., Kutschera, C., Grillo-Fernandes, E., Horvat, P.,Chiellini, E., Braunegg, G., 2011. Continuous production of poly([R]-3-hydroxybutyrate) by Cupriavidus necator in a multistage bioreactor cascade.Appl. Microbiol. Biotechnol. 91, 295–304.
Cavalheiro, J.M.B.T., de Almeida, M.C.M.D., Grandfils, C., da Fonseca, M.M.R., 2009.Poly(3-hydroxybutyrate) production by Cupriavidus necator using wasteglycerol. Process Biochem. 2009 (44), 509–515.
Cavalheiro, J.M.B.T., Raposo, R.S., de Almeida, C.M.D., Cesario, M.T., Sevrin, C.,Grandfils, C., da Fonseca, M.M.R., 2012. Effect of cultivation parameters on theproduction of poly(3-hydroxybutyrate-co-4-hydroxybutyrate) and poly(3-hydroxybutyrate-4-hydroxybutyrate-3-hydroxyvalerate) by Cupriavidusnecator using waste glycerol. Bioresour. Technol. 111, 391–397.
Dias, J.M.L., Serafim, L.S., Lemos, P.C., Reis, M.A.M., Oliveira, R., 2005. Mathematicalmodelling of a mixed culture cultivation process for the production ofpolyhydroxybutyrate. Biotechnol. Bioeng. 92, 209–222.
Dias, J.M.L., Lemos, P.C., Serafim, L.S., Oliveira, C., Eiroa, M., Albuquerque, M.G.E.,Ramos, A.M., Oliveira, R., Reis, M.A.M., 2006. Recent advances inpolyhydroxyalkanoate production by mixed aerobic cultures: from thesubstrate to the final product. Macromol. Biosci. 6, 885–906.
Dias, J.M.L., Oehmen, A., Serafim, L.S., Lemos, P.C., Reis, M.A.M., Oliveira, R., 2008.Metabolic modelling of polyhydroxyalkanoate copolymers production by mixedmicrobial cultures. BMC Syst. Biol. 2, 1–21.
Doran, P.M., 1995. Bioprocess Engineering Principles. Academic Press, London, UK.Dubois, M., Gilles, K.A., Hamilton, J.K., Rebers, P.A., Smith, F., 1956. Colorimetric
method for determination of sugars and related substances. Anal. Chem. 28,350–356.
Grousseau, E., Blanchet, E., Deleris, S., Albuquerque, M.G.E., Paul, E., Uribelarrea, J.L.,2013. Impact of sustaining a controlled residual growth onpolyhydroxybutyrate yield and production kinetics in Cupriavidus necator.Bioresour. Technol. 148, 30–38.
Ibrahim, M.H.A., Steinbuchel, A., 2009. Poly(3-Hydroxybutyrate) Production fromglycerol by Zobellella denitrificans MW1 via high-cell-density fed-batchfermentation and simplified solvent extraction. Appl. Environ. Microb. 75,6222–6231.
Ishizaki, A., Tanaka, K., 1990. Batch culture of Alcaligenes eutrophus ATCC 17697T
using recycled gas closed circuit culture system. J. Ferment. Bioeng. 69, 170–174.
Khanna, S., Srivastava, A.K., 2008. Productivity enhancement of poly-(b-hydroxybutyrate) by fed-batch cultivation of nutrients using variable(decreasing) nutrient rate by Wautersia eutropha. Chem. Eng. Commun. 195,1424–1436.
Kim, B.S., Lee, S.C., Lee, S.Y., Chang, H.N., Chang, Y.K., Woo, S.I., 1994. Production ofpoly(3-hydroxybutyric acid) by fed-batch culture of Alcaligenes eutrophus withglucose concentration control. Biotechnol. Bioeng. 43, 892–898.
Lee, J.H., Lim, H.C., Hong, J., 1997. Application of singular transformation to on-lineoptimal control of poly-b-hydroxybutyrate fermentation. J. Biotechnol. 55, 135–150.
Luong, J.H.T., Mulchandani, A., Leduy, A., 1988. Kinetics of biopolymer synthesis: arevisit. Enzyme Microb. Technol. 10, 326–332.
Marang, L., Jiang, Y., van Loosdrecht, M.C.M., Kleerebezem, R., 2013. Butyrate aspreferred substrate for polyhydroxybutyrate production. Bioresour. Technol.142, 232–239.
Mozumder, M.S.I., De Wever, H., Volcke, E.I.P., Garcia-Gonzalez, L., 2013. A robustfed-batch feeding strategy independent of the carbon source for optimalpolyhydroxybutyrate production. Process Biochem.. http://dx.doi.org/10.1016/j.procbio.2013.12.004.
Mulchandani, A., Luong, J.H.T., Leduy, A., 1988. Batch kinetics of microbialpolysaccharide biosynthesis. Biotechnol. Bioeng. 32, 639–646.
Mulchandani, A., Luong, J.H.T., Groom, C., 1989. Substrate inhibition kinetics formicrobial growth and synthesis of poly-b-hydroxybutyric acid. Appl. Microbiol.Biotechnol. 30, 11–17.
Nash, J.E., Sutcliffe, J.V., 1970. River flow forecasting through conceptual modelspart I – a discussion of principles. J. Hydrol. 10, 282–290.
Nelder, J.A., Mead, R., 1965. A simplex method for function minimization. Comput. J.7, 308–313.
Patnaik, P.R., 2005. Perspectives in the modeling and optimization of PHBproduction by pure and mixed cultures. Crit. Rev. Biotechnol. 25, 153–171.
Patwardhan, P.R., Srivastava, A.K., 2004. Model-based fed-batch cultivation of R.eutropha for enhanced biopolymer production. Biochem. Eng. J. 20, 21–28.
Patwardhan, P., Srivastava, A.K., 2008. Fed-batch cultivation of Wautersia eutropha.Bioresour. Technol. 99, 1787–1792.
Penloglou, G., Chatzidoukas, C., Kiparissides, C., 2012. Microbial production ofpolyhydroxybutyrate with tailor-made properties: an integrated modellingapproach and experimental validation. Biotechnol. Adv. 30, 329–337.
Posada, J.A., Naranjo, J.M., Lopez, J.A., Higuita, J.C., Cardona, C.A., 2011. Design andanalysis of poly-3-hydroxybutyrate production processes from crude glycerol.Process Biochem. 46, 310–317.
Pradella, J.G.C., Ienczak, J.L., Delgado, C.R., Taciro, M.K., 2012. Carbon source pulsedfeeding to attain high yield and high productivity in poly(3-hydroxybutyrate)(PHB) production from soybean oil using Cupriavidus necator. Biotechnol. Lett.34, 1003–1007.
Repaske, R., 1962. Nutritional requirements for Hydrogenomonas eutropha. J.Bacteriol. 83, 418–422.
Ryu, H.W., Hahn, S.K., Chang, Y.K., Chang, H.N., 1997. Production of poly(3-hydroxybutyrate) by high cell density fed-batch culture of Alcaligenes eutrophuswith phosphate limitation. Biotechnol. Bioeng. 55, 28–32.
Shang, L., Fan, D.D., Kim, M.I., Choi, J., Chang, H.N., 2007. Modeling of Poly(3-hydroxybutyrate) production by high cell density fed-batch culture of Ralstiniaeutropha. Biotechnol. Bioprocess Eng. 12, 417–423.
Spoljaric, I.V., Lopar, M., Koller, M., Muhr, A., Salerno, A., Reiterer, A., Malli, K.,Angerer, H., Strohmeier, K., Schober, S., Mittelbach, M., Horvat, P., 2013.Mathematical modeling of poly[(R)-3-hydroxyalkanoate] synthesis byCupriavidus necator DSM 545 on substrates stemming from biodieselproduction. Bioresour. Technol. 133, 482–494.
Strehaiano, P., Mota, M., Goma, G., 1983. Effects of inoculum level on kinetics ofalcoholic fermentation. Biotechnol. Lett. 5, 135–140.
Verhulst, P.F., 1838. Notice sur la loi que la population suit dans son accroissement.Corr. Mat. et Phys. 10, 113–121.
Yamane, T., Chen, X.F., Ueda, S., 1996. Growth associated production of poly(3-hydroxyvalerate) from n-pentanol by a methylotrophicbac terium, Paracoccusdenitrificans. Appl. Environ. Microbiol. 62, 380–384.


![Heterotrophic nutrition [2015]](https://img.dokumen.tips/doc/110x75/55d39cc0bb61ebf8268b46dd/heterotrophic-nutrition-2015-55d47f014ed07.jpg)


