Embed Size (px)
Citation preview

Wykład 09
Wydział Matematyki
Regresja liniowa prostaModel, estymacja, testowanie
Example 1
A production manager has compared the dexterity test scores of five assembly-line employees with their hourly productivity.
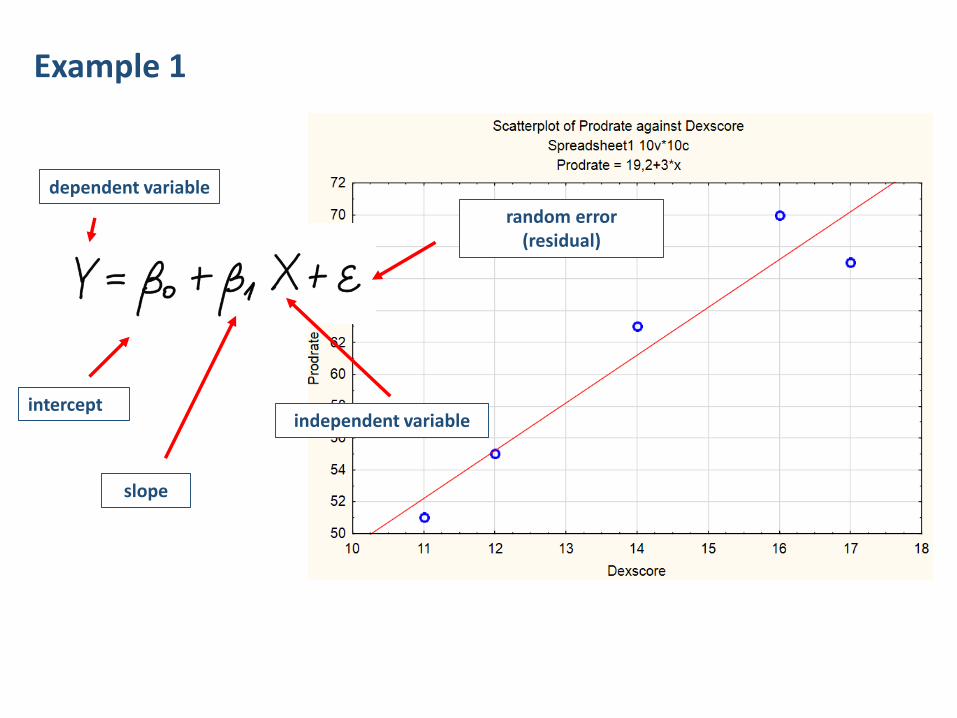
Example 1
dependent variable
independent variable
random error (residual)
slope
intercept
Simple Linear Regression – the model
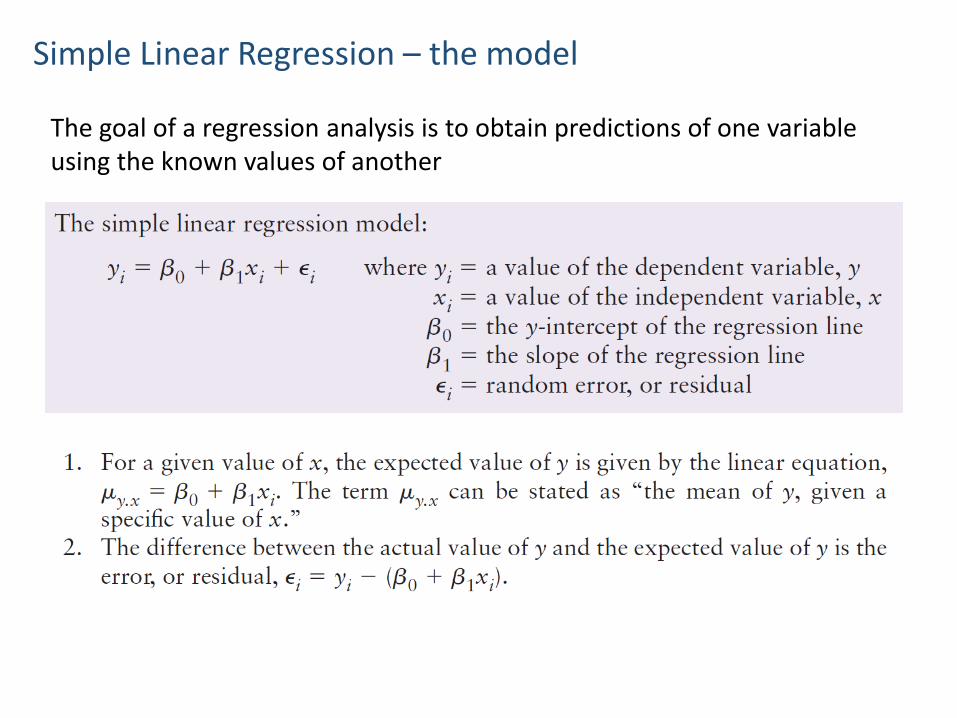
The goal of a regression analysis is to obtain predictions of one variableusing the known values of another
Simple Linear Regression – Three assumptions:
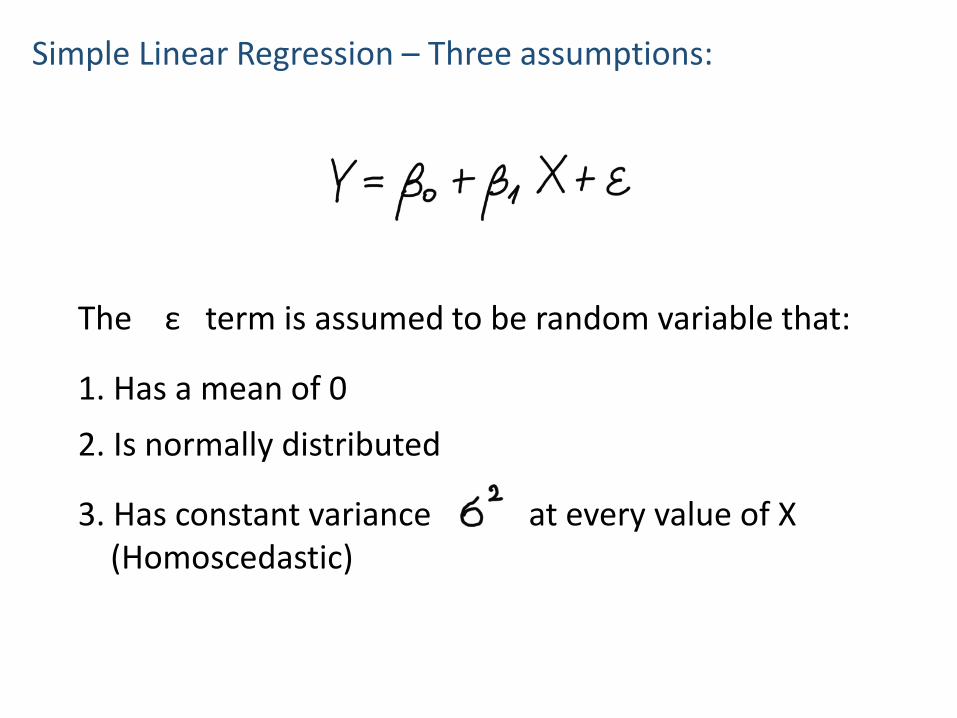
The ε term is assumed to be random variable that:
1. Has a mean of 0
2. Is normally distributed
3. Has constant variance at every value of X(Homoscedastic)
Simple Linear Regression – Three assumptions:
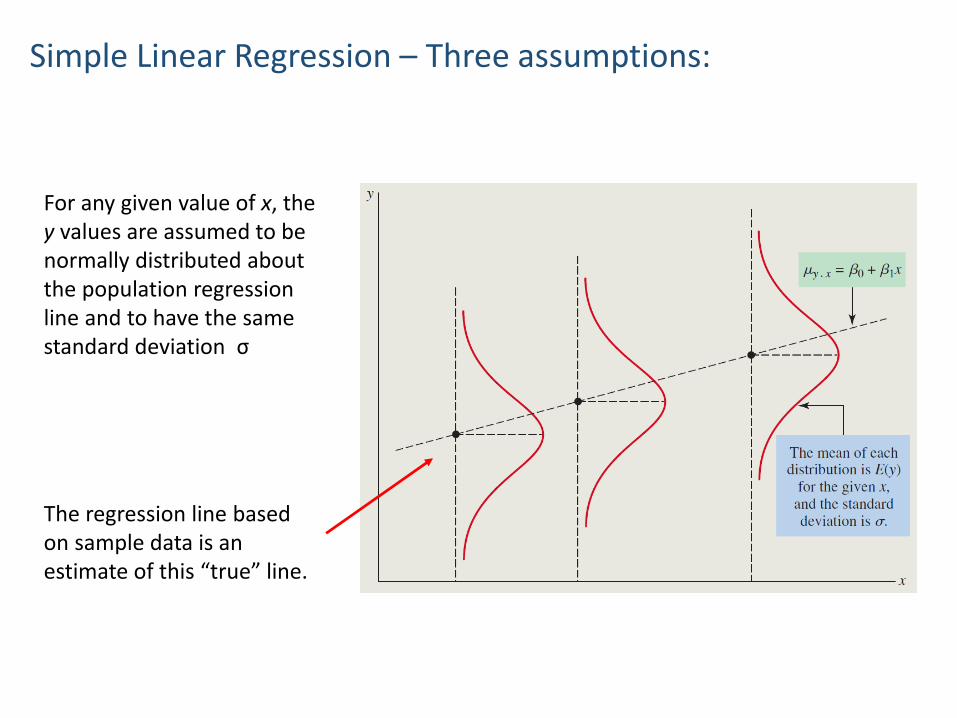
For any given value of x, they values are assumed to benormally distributed aboutthe population regressionline and to have the samestandard deviation σ
The regression line basedon sample data is anestimate of this “true” line.
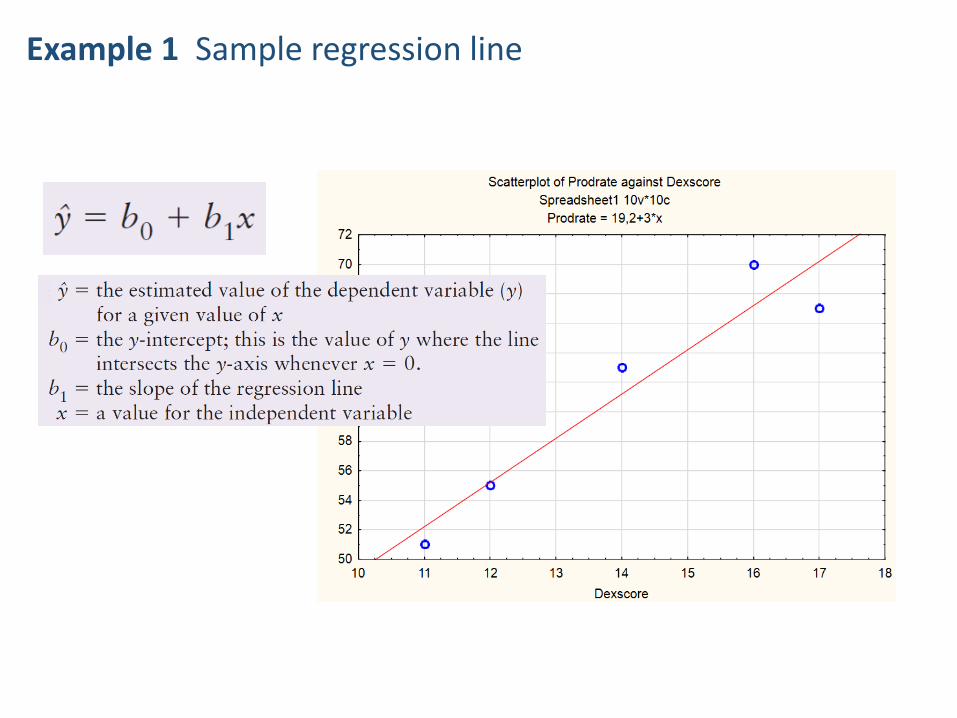
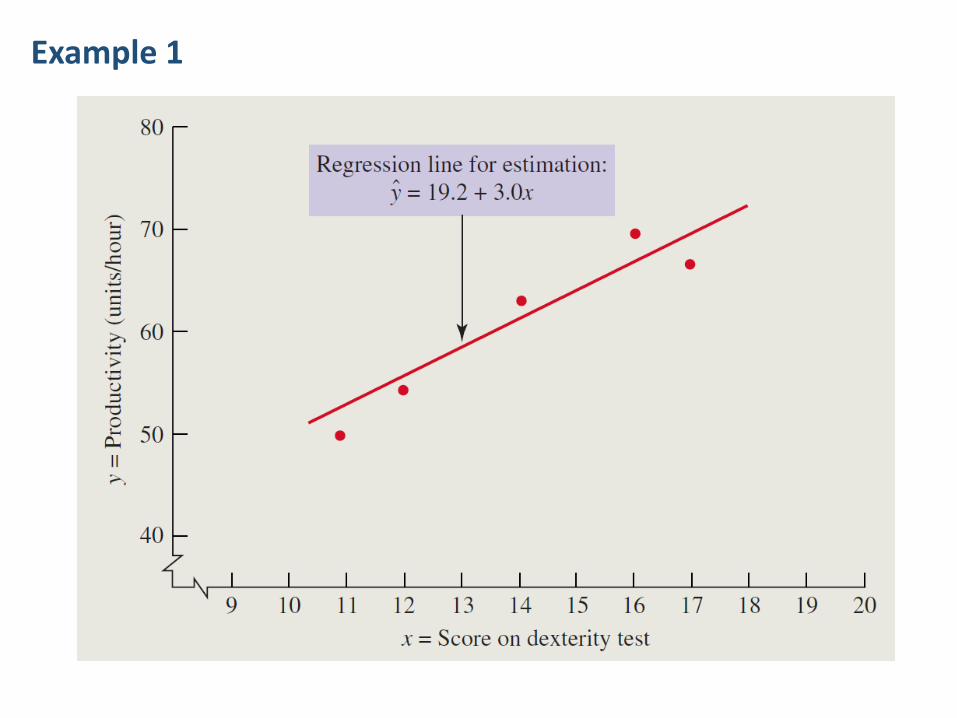
Example 1 Sample regression line
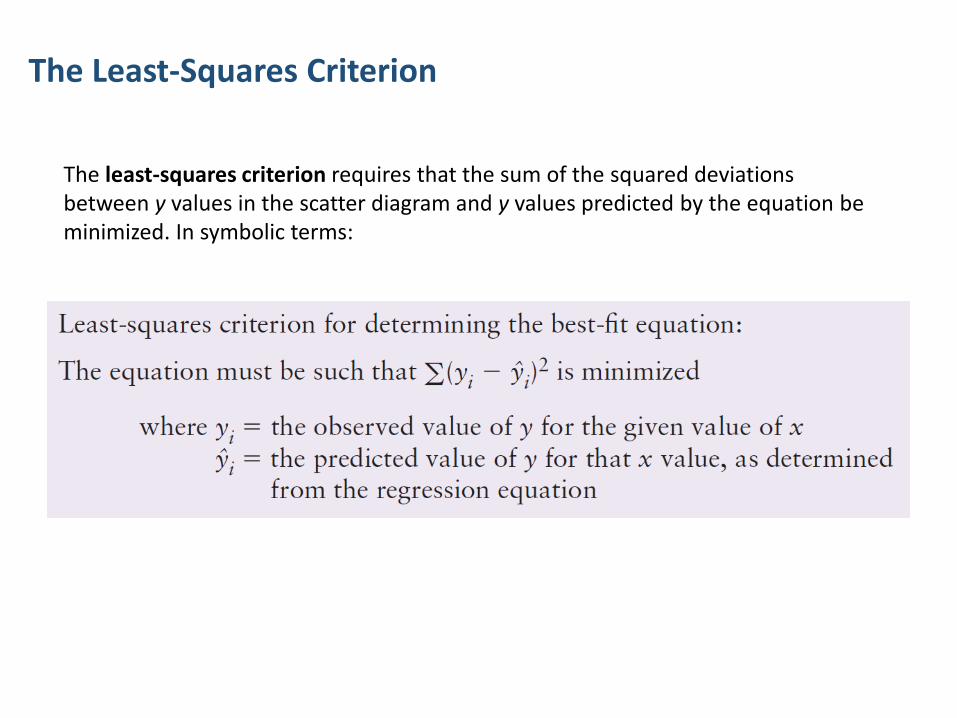
The Least-Squares Criterion
The least-squares criterion requires that the sum of the squared deviationsbetween y values in the scatter diagram and y values predicted by the equation be minimized. In symbolic terms:
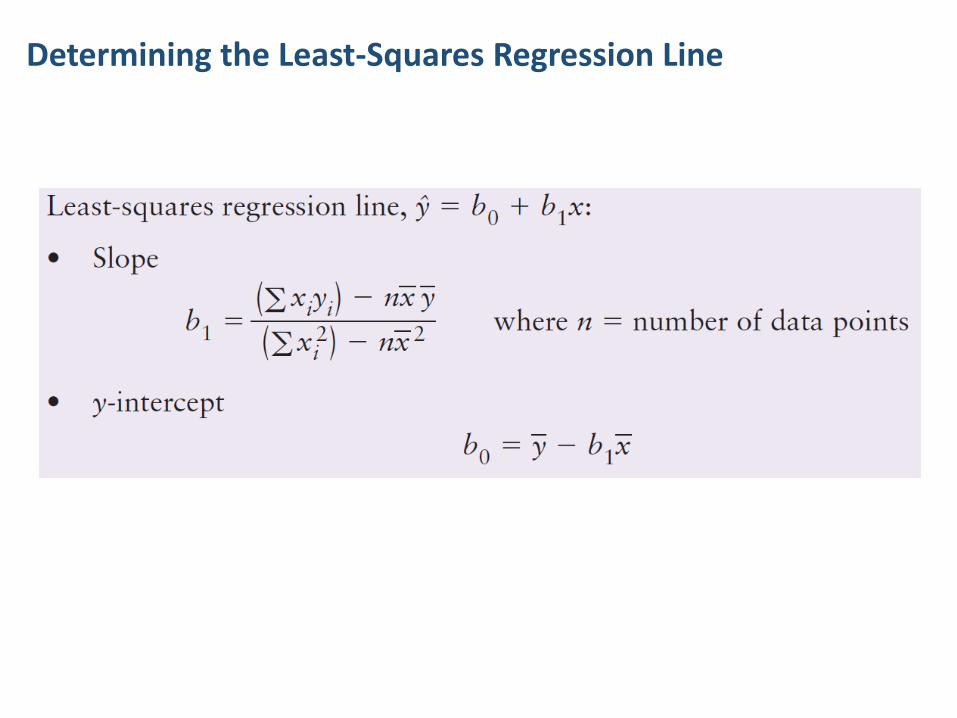
Determining the Least-Squares Regression Line
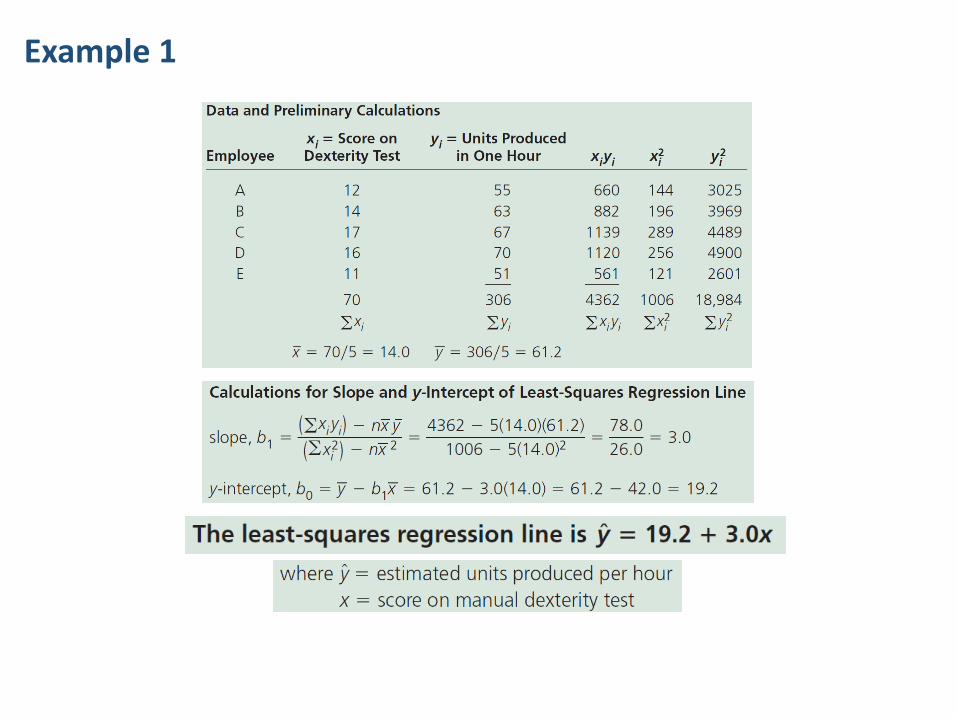
Example 1
Example 1
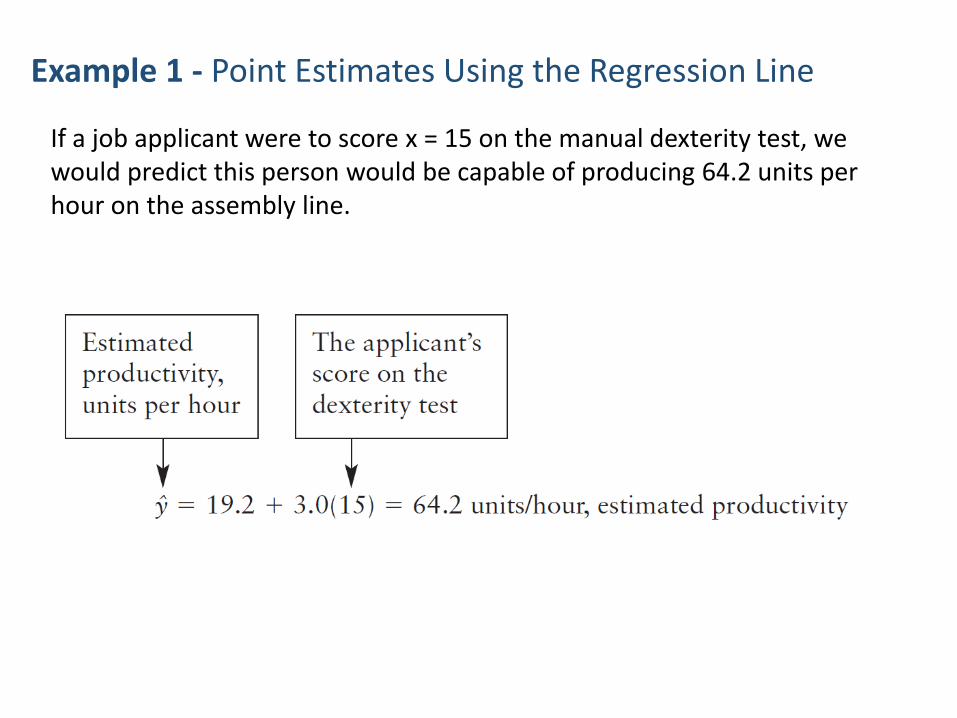
Example 1 - Point Estimates Using the Regression Line
If a job applicant were to score x = 15 on the manual dexterity test, we would predict this person would be capable of producing 64.2 units per hour on the assembly line.
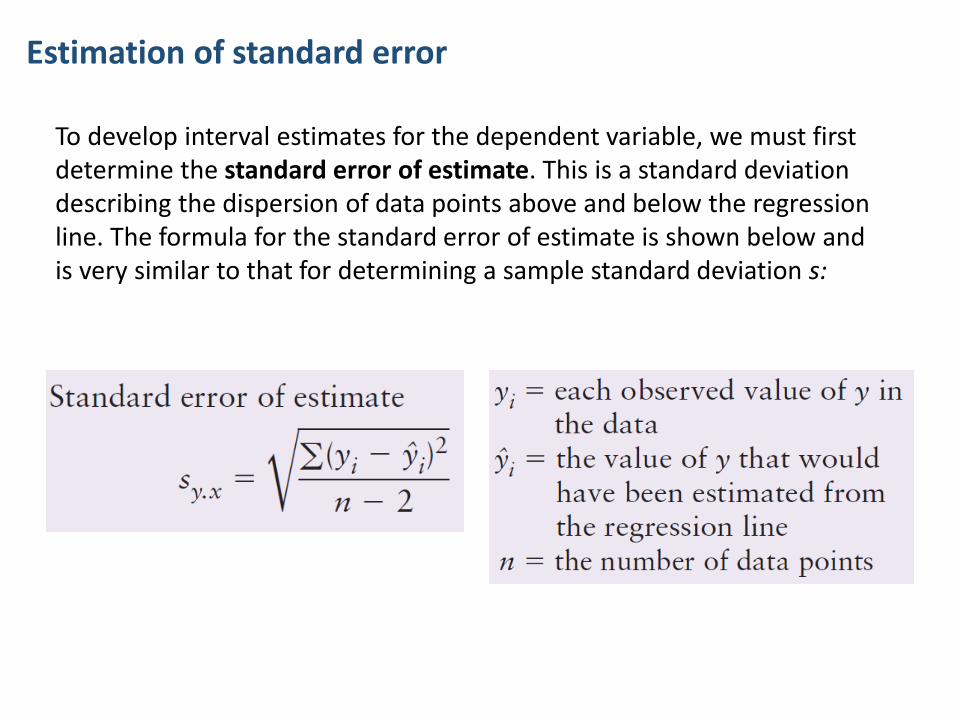
Estimation of standard error
To develop interval estimates for the dependent variable, we must first determine the standard error of estimate. This is a standard deviation describing the dispersion of data points above and below the regression line. The formula for the standard error of estimate is shown below and is very similar to that for determining a sample standard deviation s:
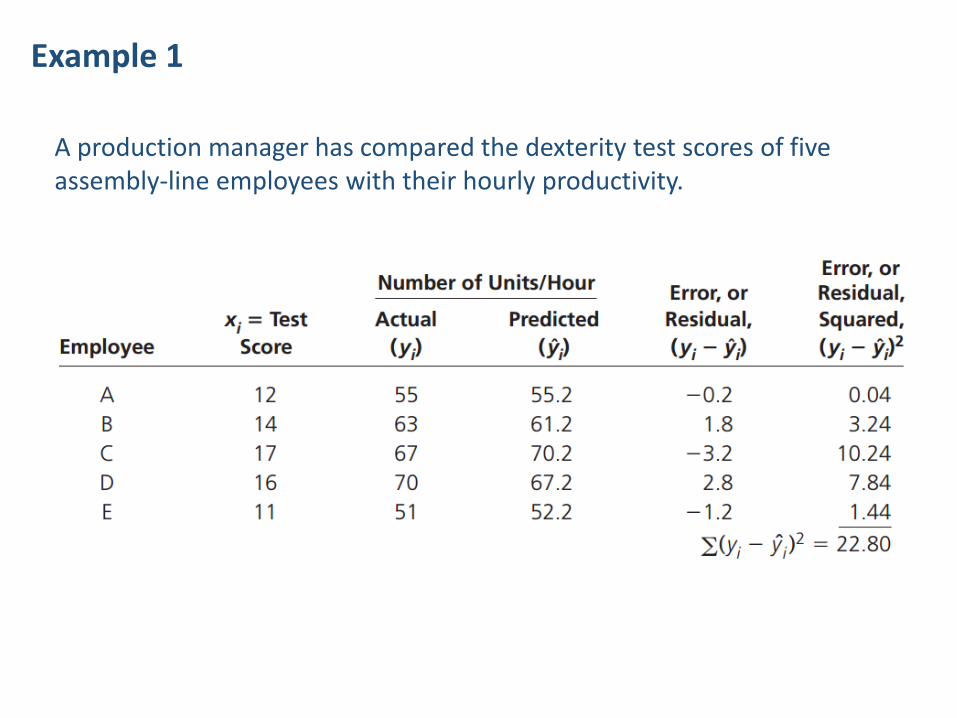
Example 1
A production manager has compared the dexterity test scores of five assembly-line employees with their hourly productivity.
Example 1
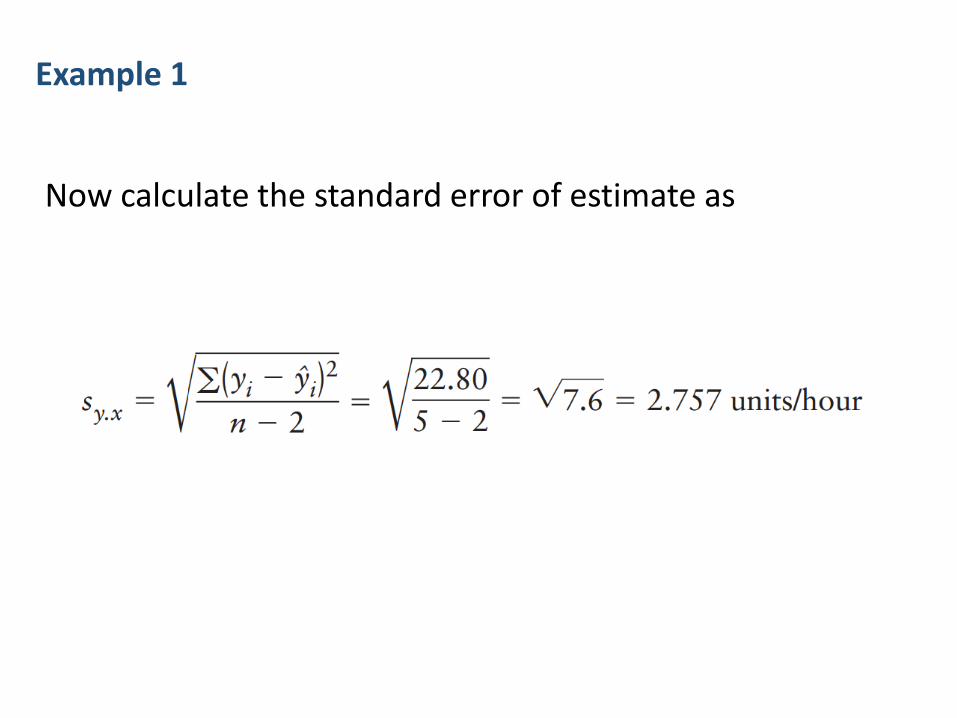
Now calculate the standard error of estimate as
Confidence and prediction Interval for the mean of y given a specific x value
Given a specific value of x, we can make two kinds of interval estimates regarding y: (1) a confidence interval for the (unknown) true mean
of y, and(2) a prediction interval for an individual y observation.
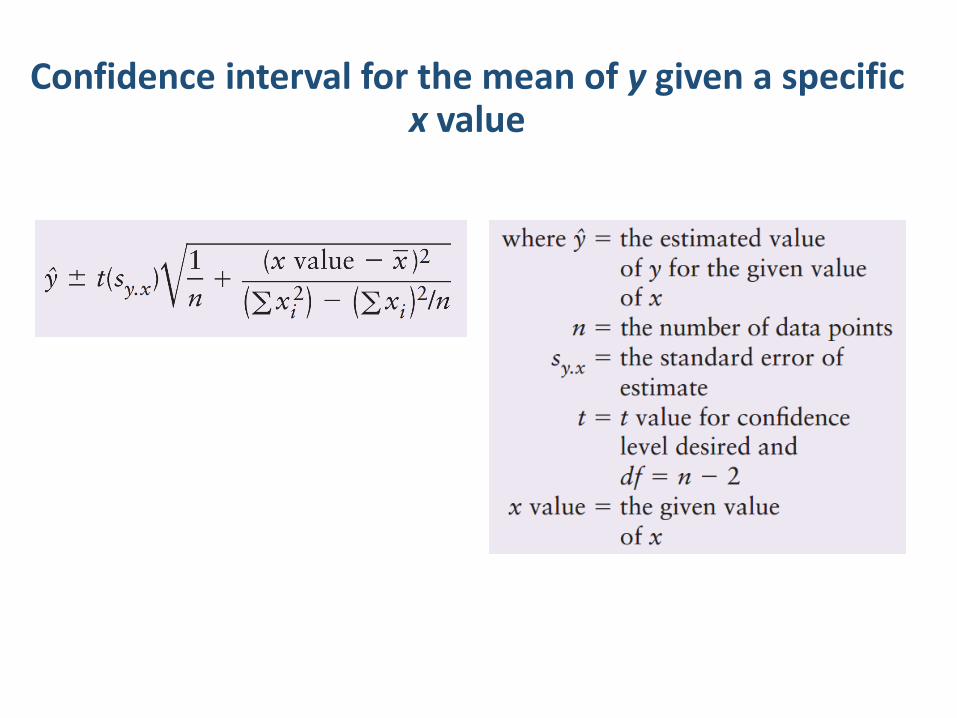
Confidence interval for the mean of y given a specificx value
Example 1 Confidence Interval
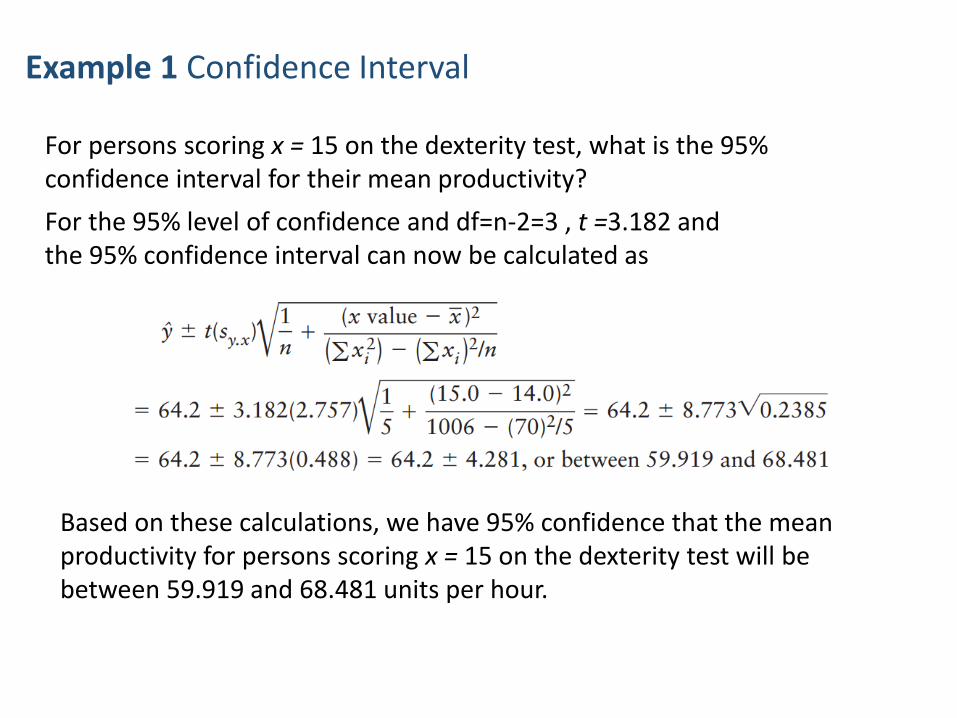
For persons scoring x = 15 on the dexterity test, what is the 95% confidence interval for their mean productivity?
For the 95% level of confidence and df=n-2=3 , t =3.182 andthe 95% confidence interval can now be calculated as
Based on these calculations, we have 95% confidence that the mean productivity for persons scoring x = 15 on the dexterity test will be between 59.919 and 68.481 units per hour.
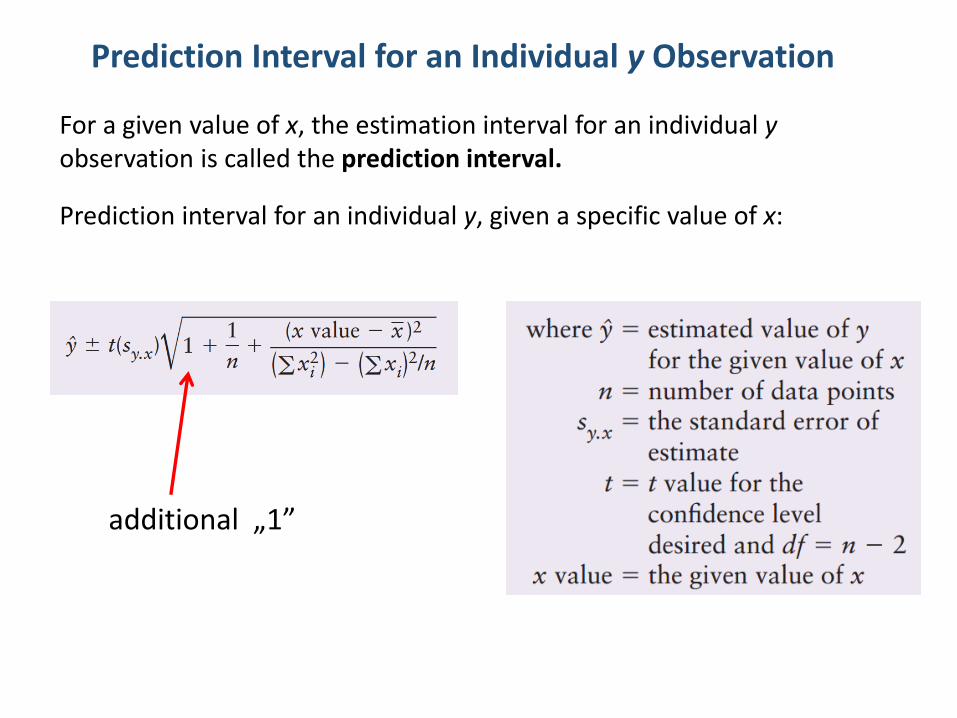
Prediction Interval for an Individual y Observation
For a given value of x, the estimation interval for an individual y observation is called the prediction interval.
Prediction interval for an individual y, given a specific value of x:
additional „1”
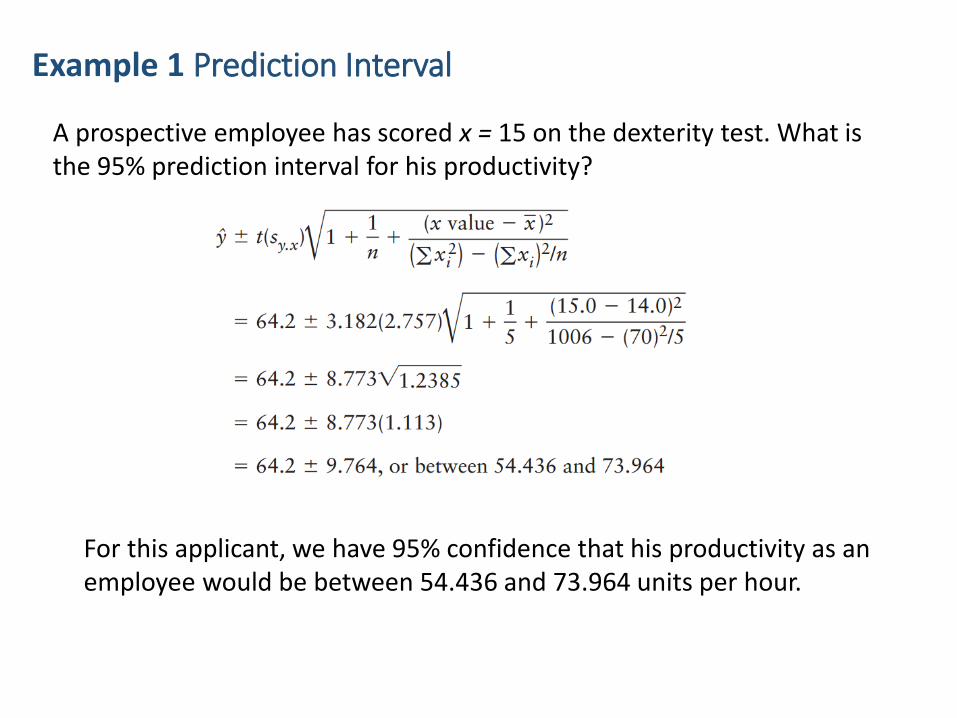
Example 1 Prediction Interval
A prospective employee has scored x = 15 on the dexterity test. What is the 95% prediction interval for his productivity?
For this applicant, we have 95% confidence that his productivity as anemployee would be between 54.436 and 73.964 units per hour.
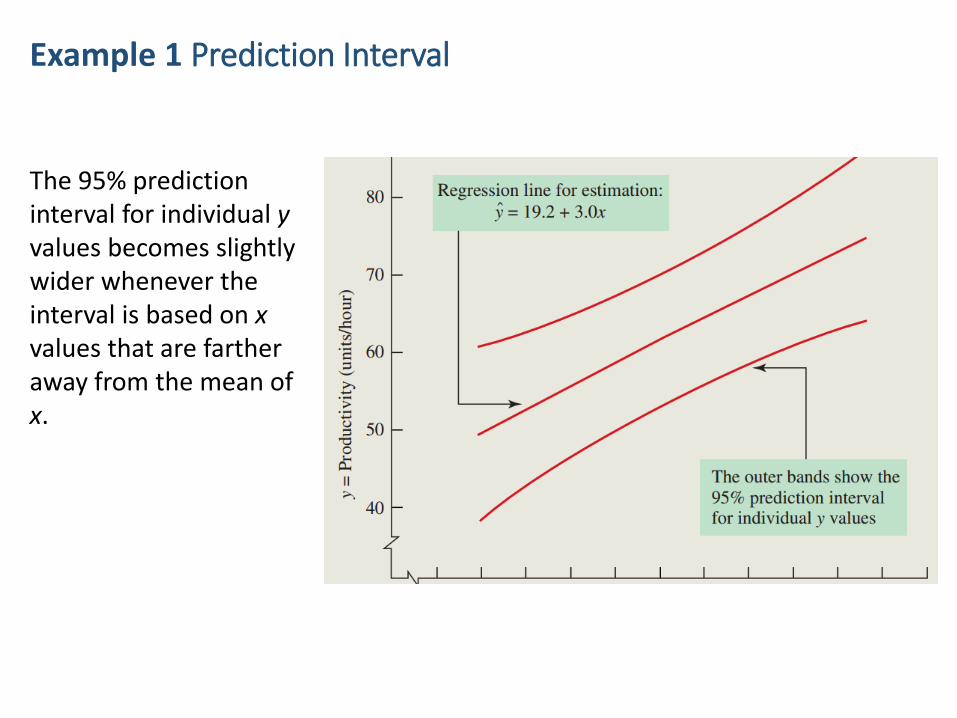
Example 1 Prediction Interval
The 95% prediction interval for individual y values becomes slightly wider whenever the interval is based on x values that are farther away from the mean of x.
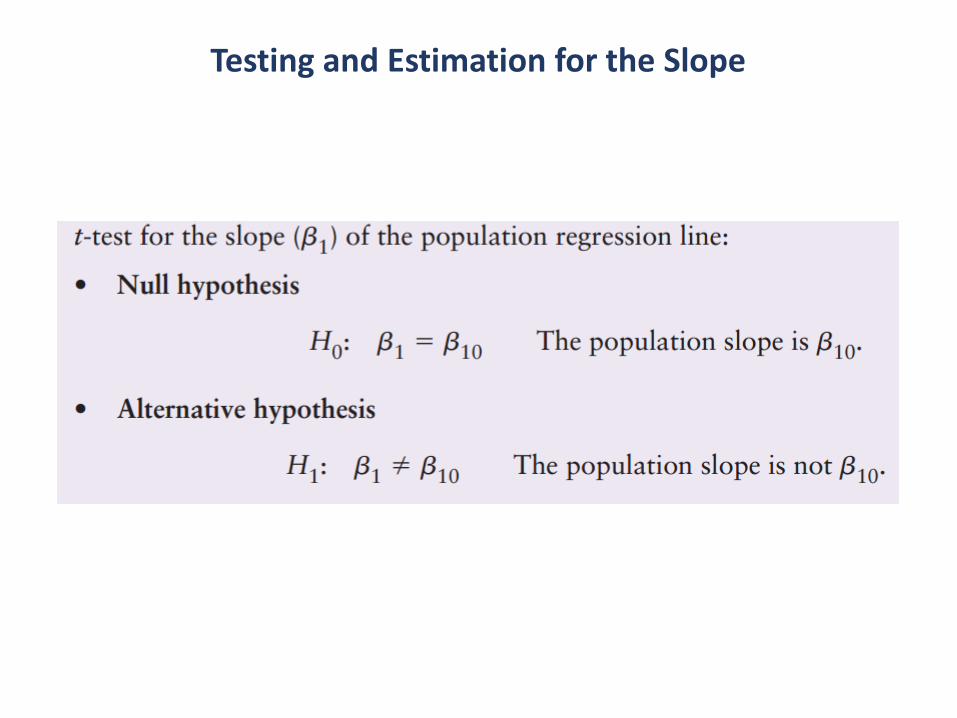
Testing and Estimation for the Slope
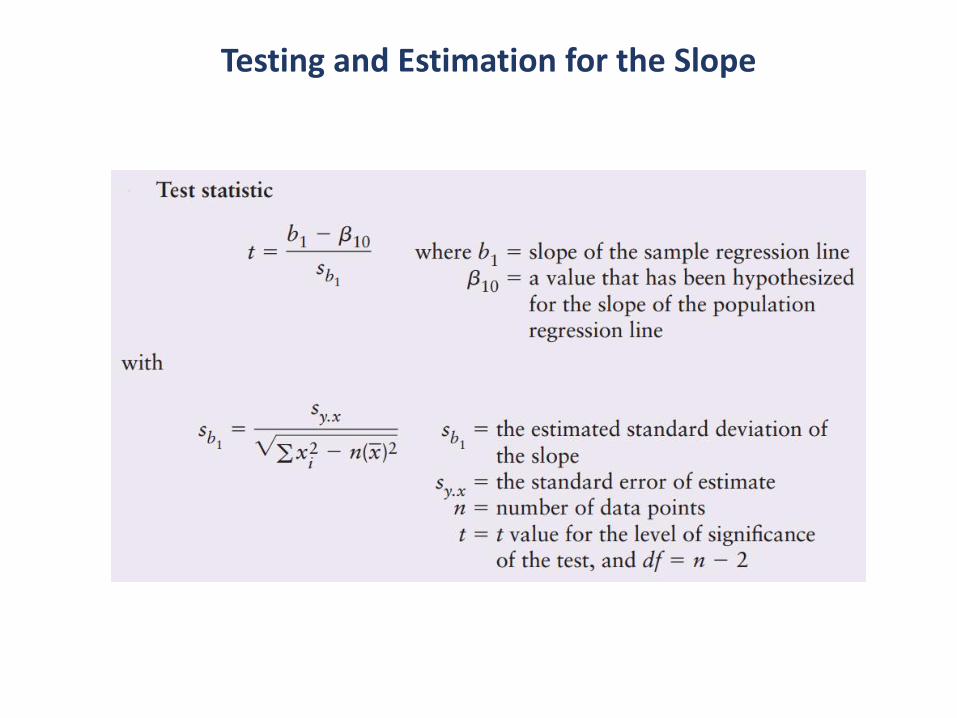
Testing and Estimation for the Slope
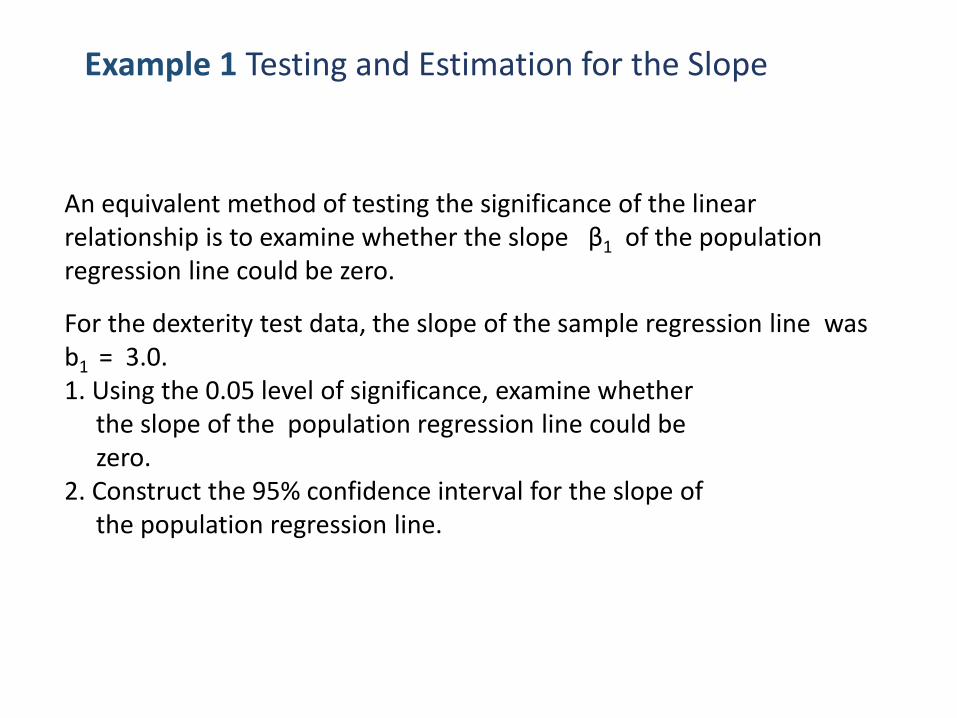
Example 1 Testing and Estimation for the Slope
For the dexterity test data, the slope of the sample regression line was b1 = 3.0.1. Using the 0.05 level of significance, examine whether
the slope of the population regression line could be zero.
2. Construct the 95% confidence interval for the slope of the population regression line.
An equivalent method of testing the significance of the linear relationship is to examine whether the slope β1 of the population regression line could be zero.
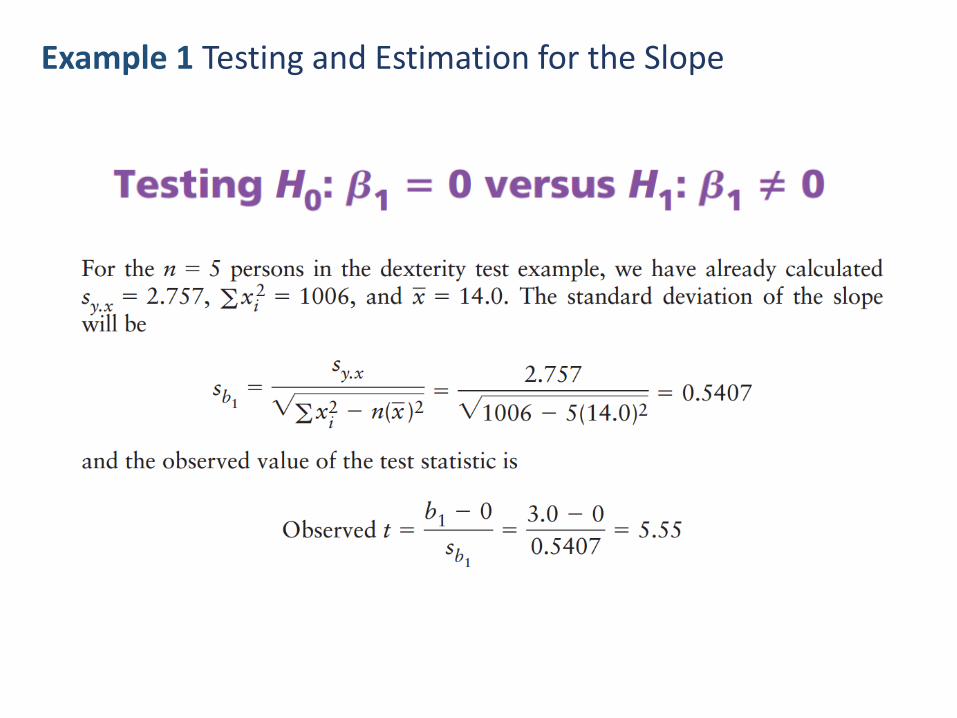
Example 1 Testing and Estimation for the Slope
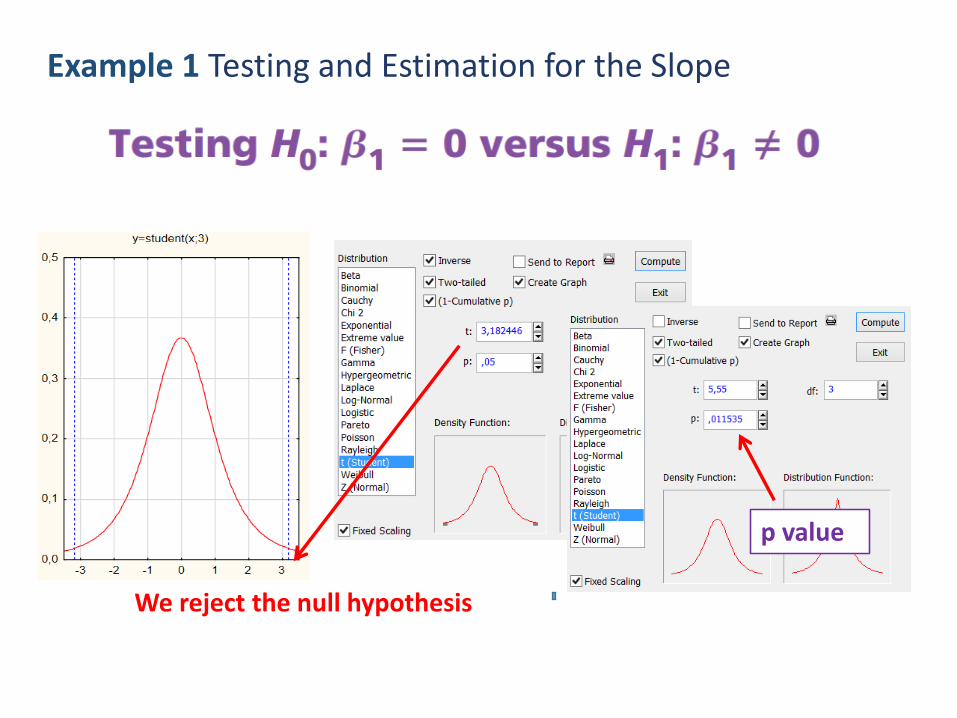
Example 1 Testing and Estimation for the Slope
We reject the null hypothesis
p value
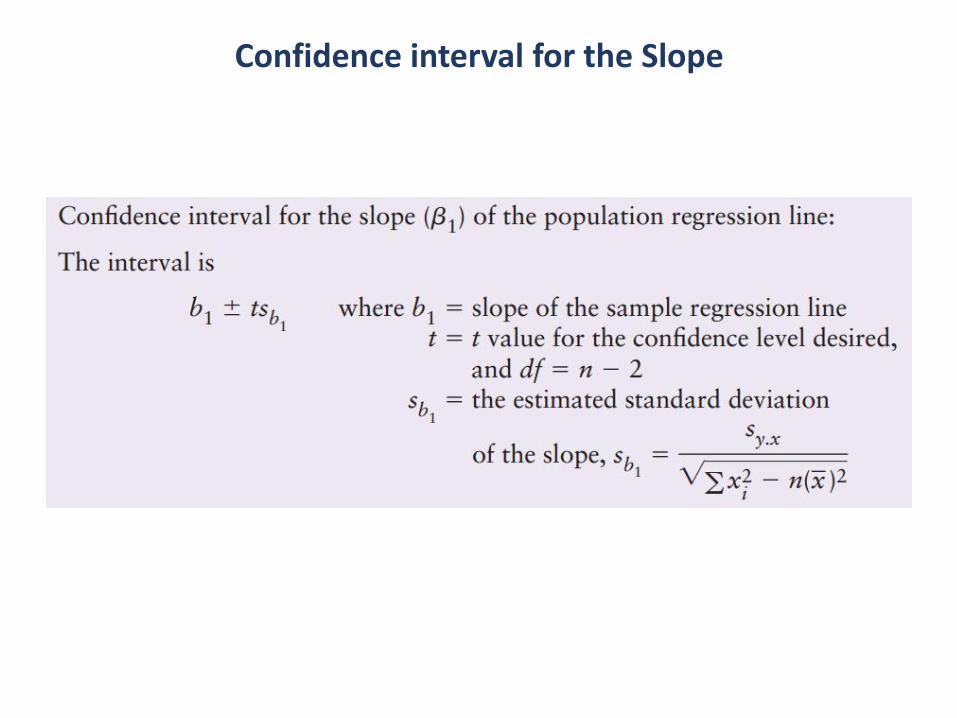
Confidence interval for the Slope
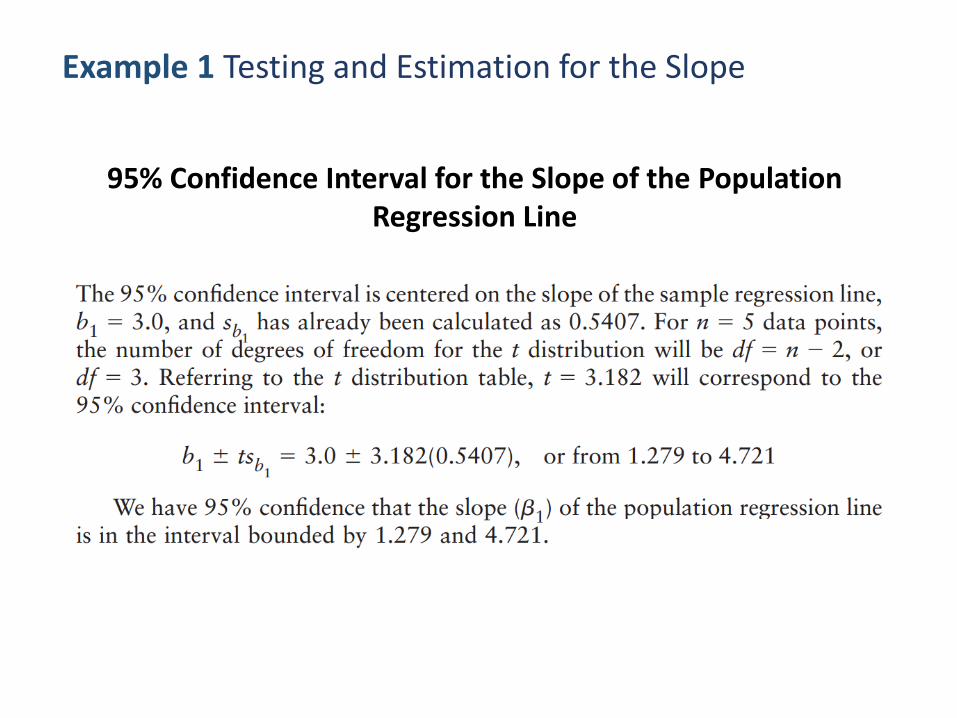
Example 1 Testing and Estimation for the Slope
95% Confidence Interval for the Slope of the Population Regression Line
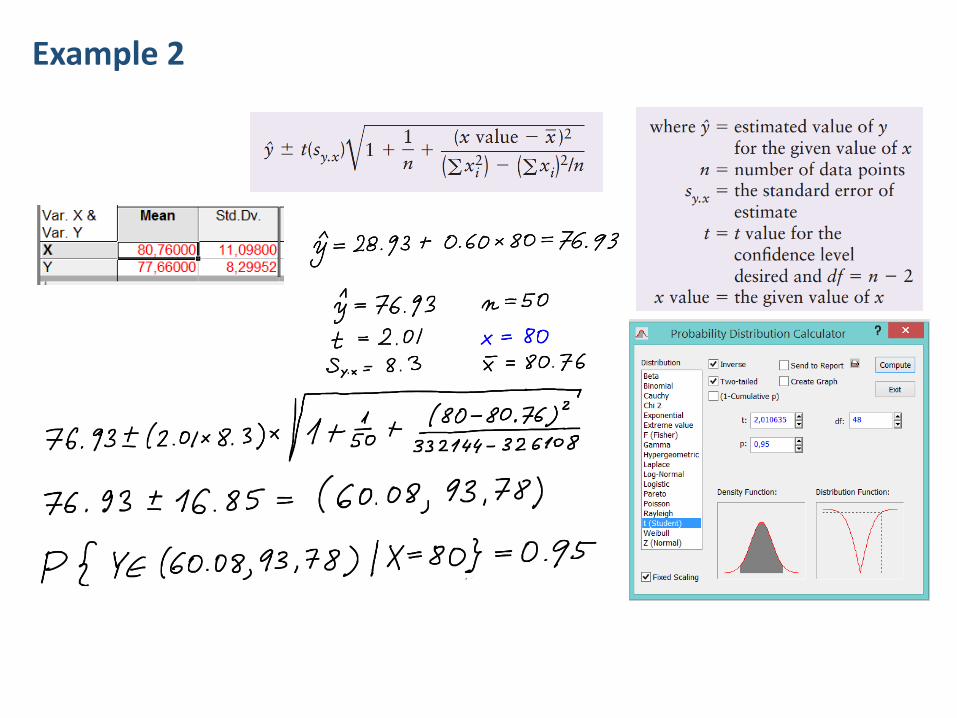
Example 2
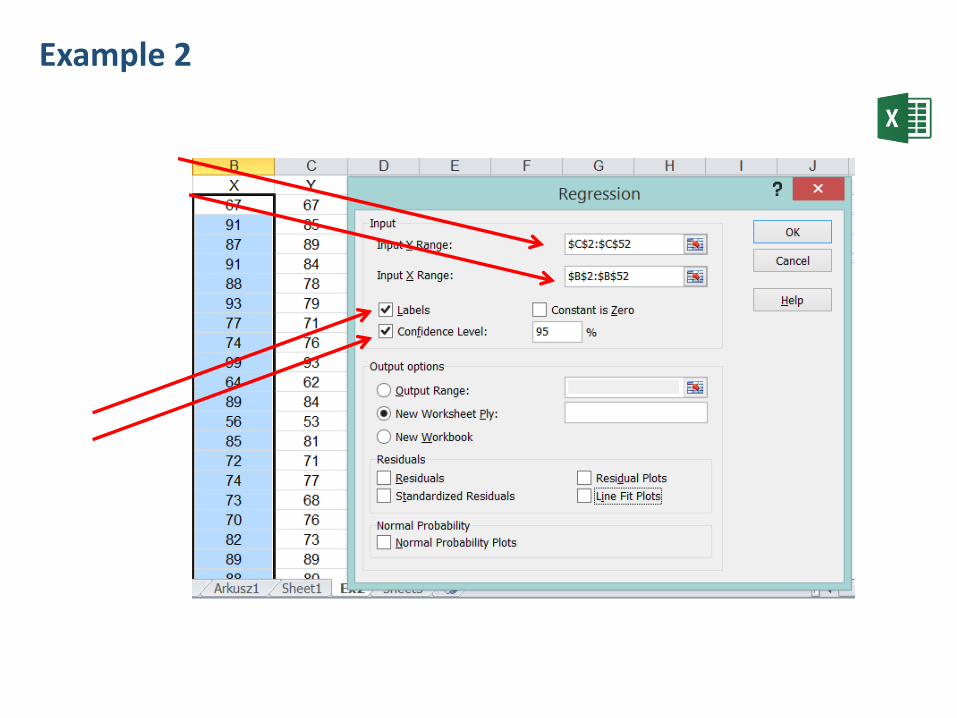
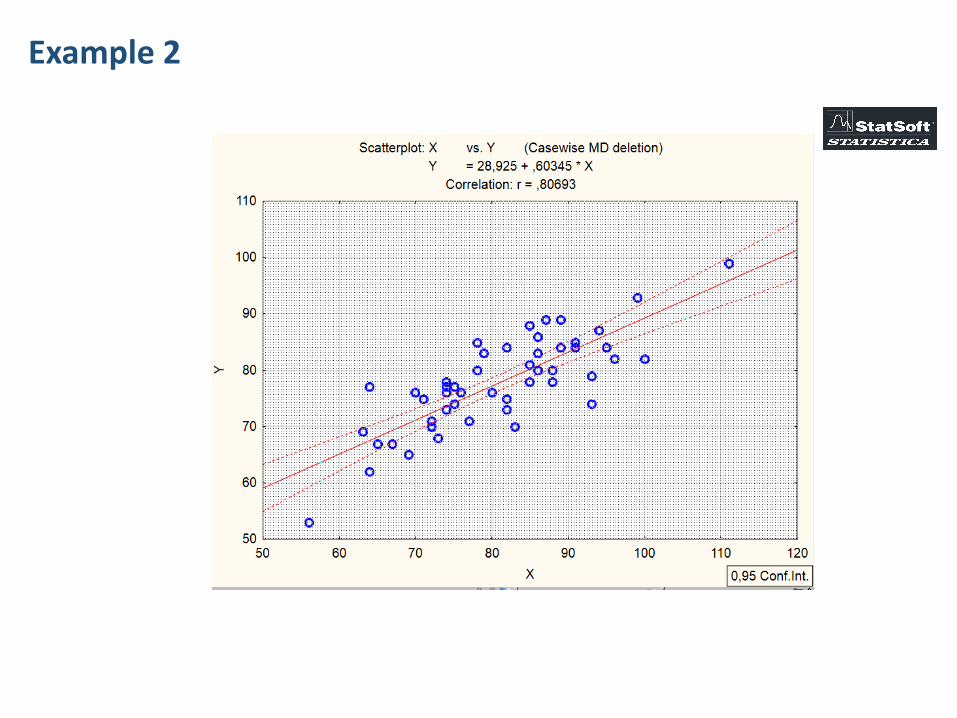
50 randomly selected students took a math aptitude test before they began their statistics course. The Statistics Department has three questions. What linear regression equation best predicts statistics performance, based on math aptitude scores ? If a student made an 80 on the aptitude test, what grade would we expect him to make in statistics ? Make a confidence prediction interval for x=80 using 0.05 level of significance
Example 2
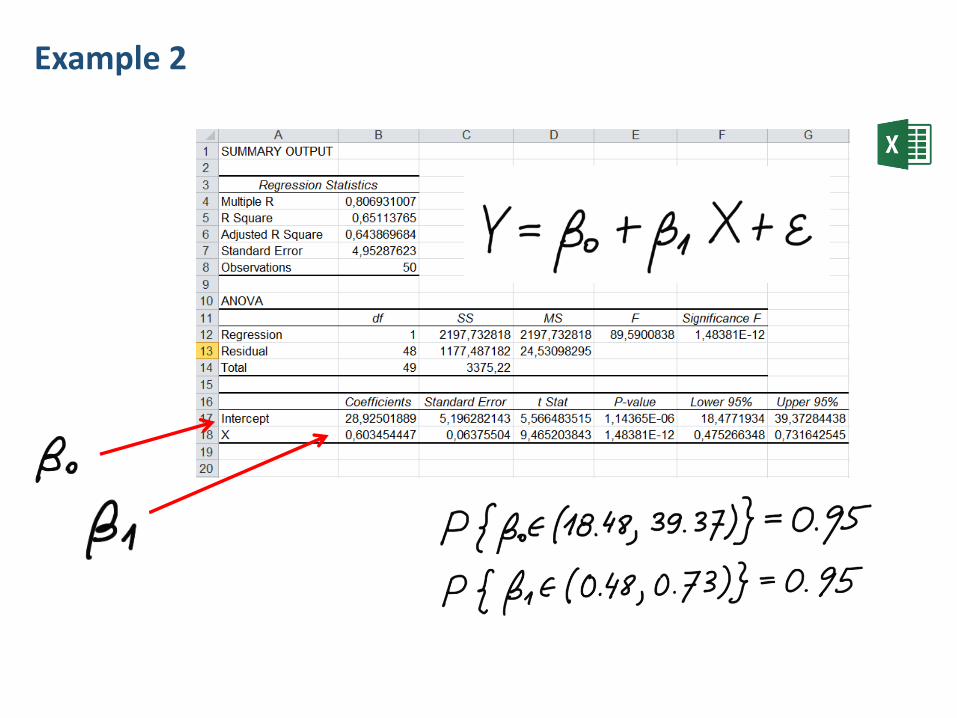
Solution in Excel
Example 2
Example 2
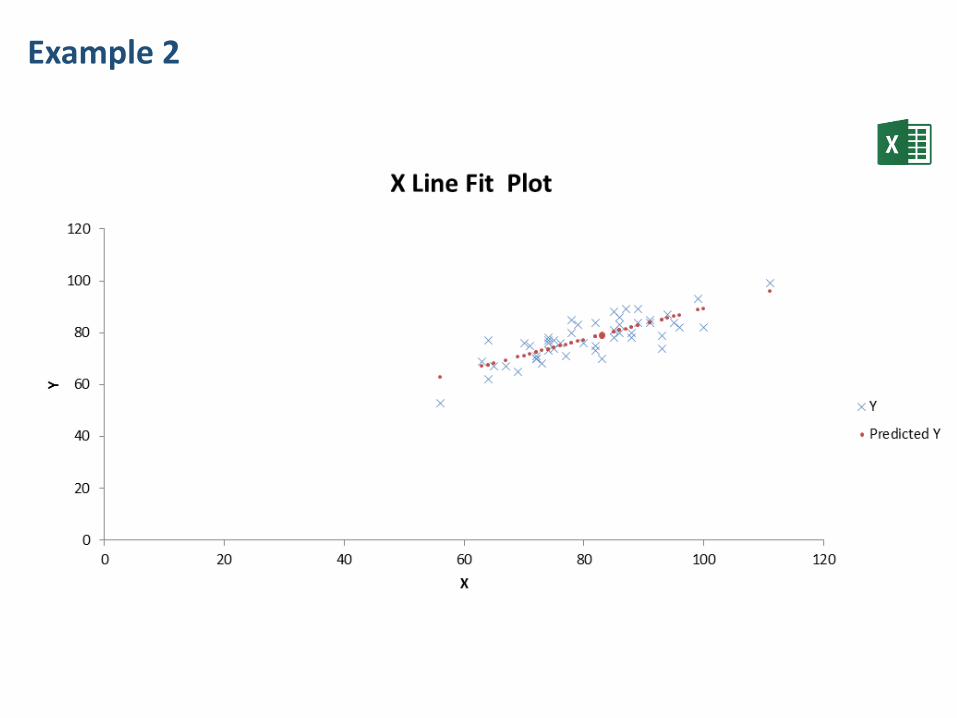
Example 2
Example 2
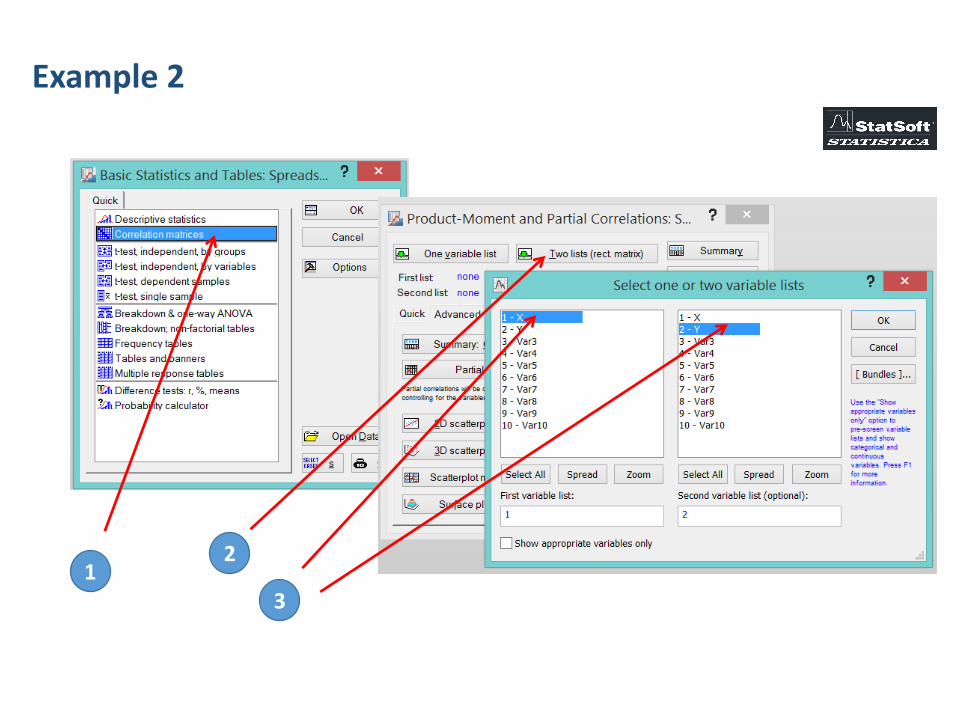
Solution in STATISTICA
Example 2
12
3
Example 2
1 2
3
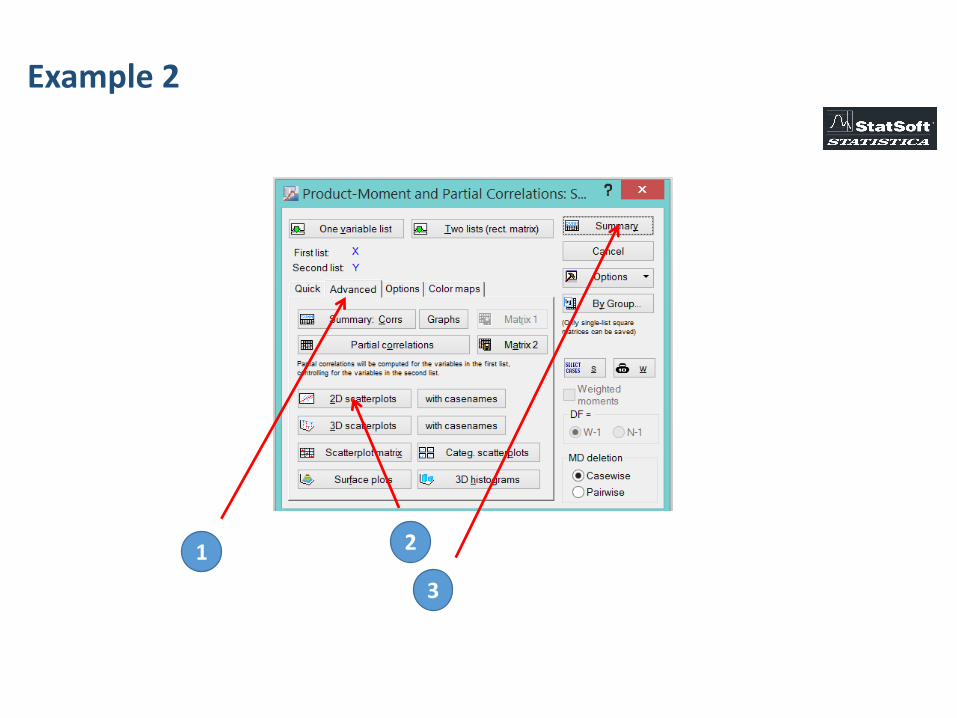
Example 2
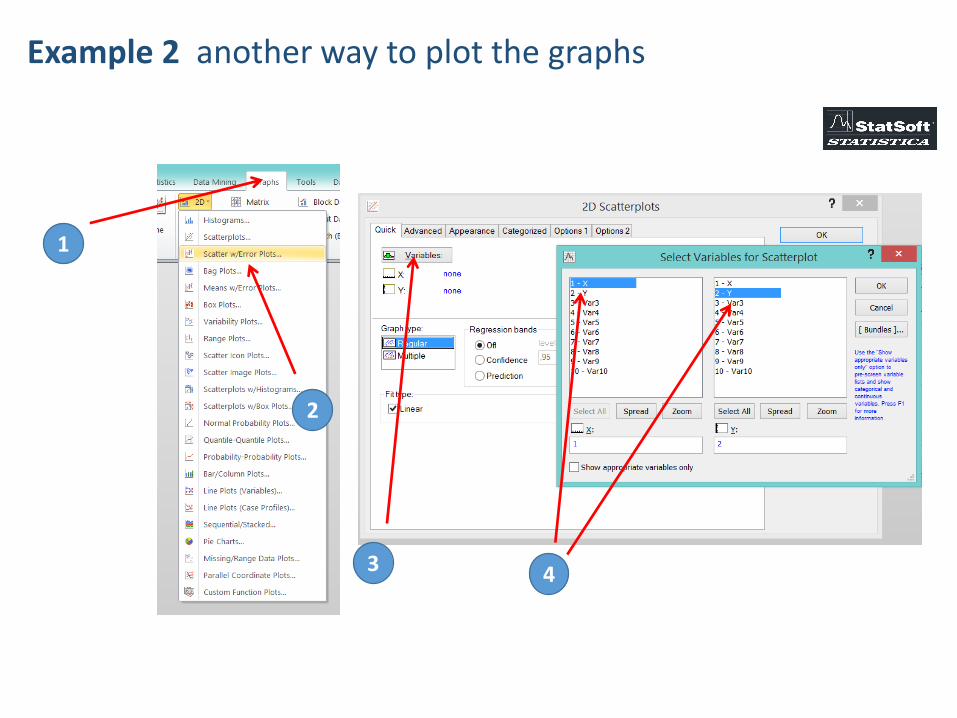
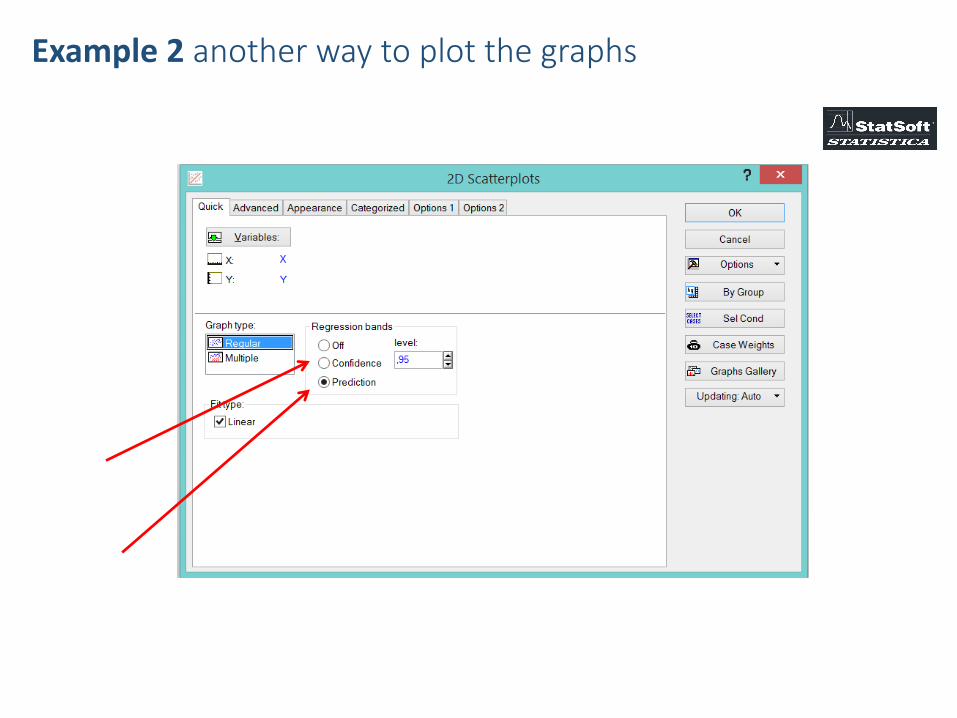
Example 2 another way to plot the graphs
1
2
3 4
Example 2 another way to plot the graphs
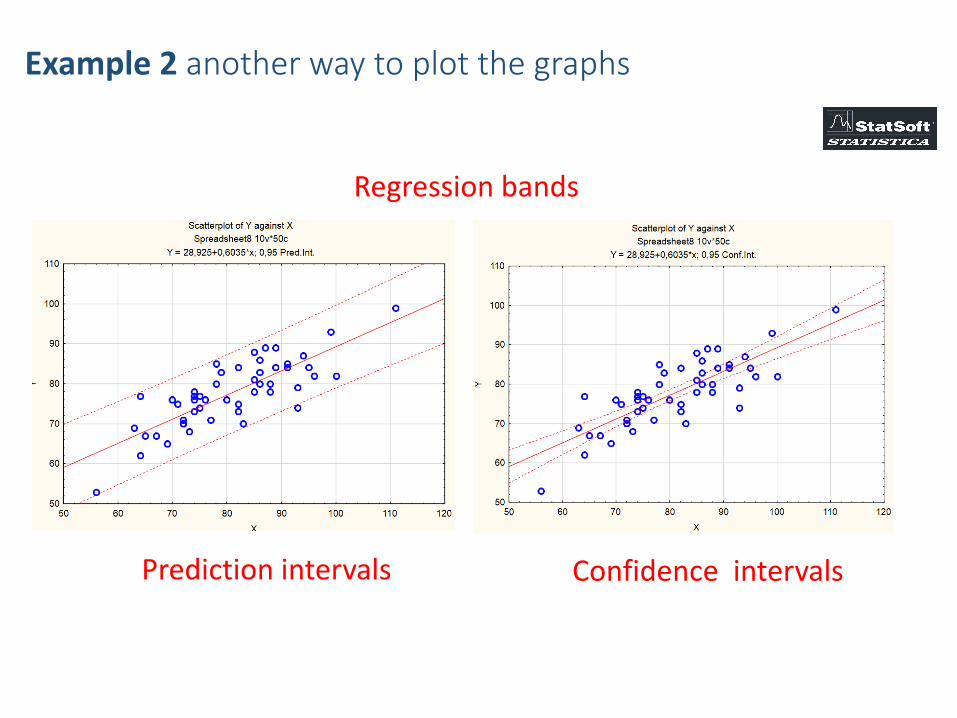
Example 2 another way to plot the graphs
Regression bands
Prediction intervals Confidence intervals
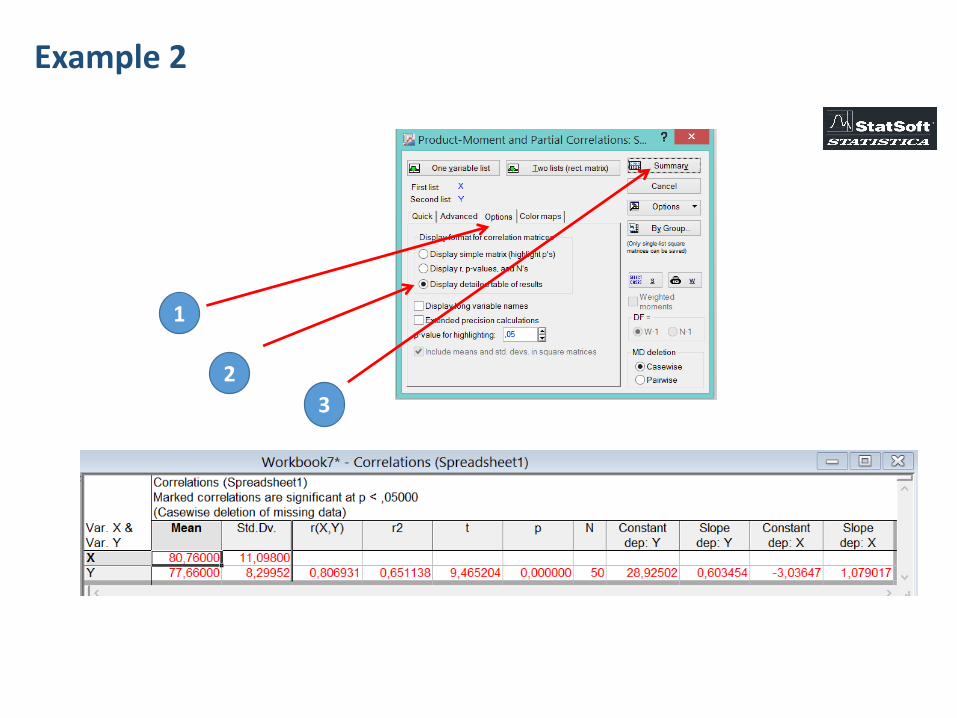
Example 2
1
2
3
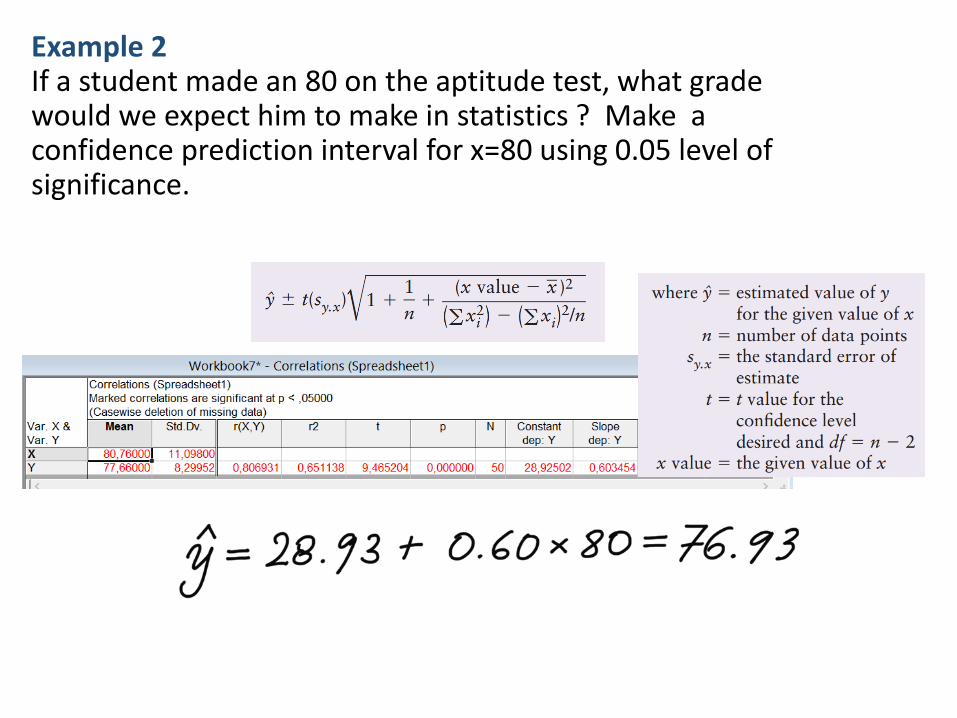
Example 2If a student made an 80 on the aptitude test, what grade would we expect him to make in statistics ? Make a confidence prediction interval for x=80 using 0.05 level of significance.
Example 2