Embed Size (px)
Citation preview
Powered by www.agileto.com
MOBILE RADIO
NETWORK OPTIMIZATION
POST-Swap QNH07 DT Analysis 3G_F1
Powered by www.agileto.com
Agenda
• Introduction: Context, Inputs and Deliverables
• Geo-spatial representation of the Network/Cluster
• Cluster Audit & Sanity Check (RF main param + Neighbors)
• Automatic best Neighboring evaluation (missing detected)
• Drive Test (DT) Analysis and Recommendations
2
Powered by www.agileto.com
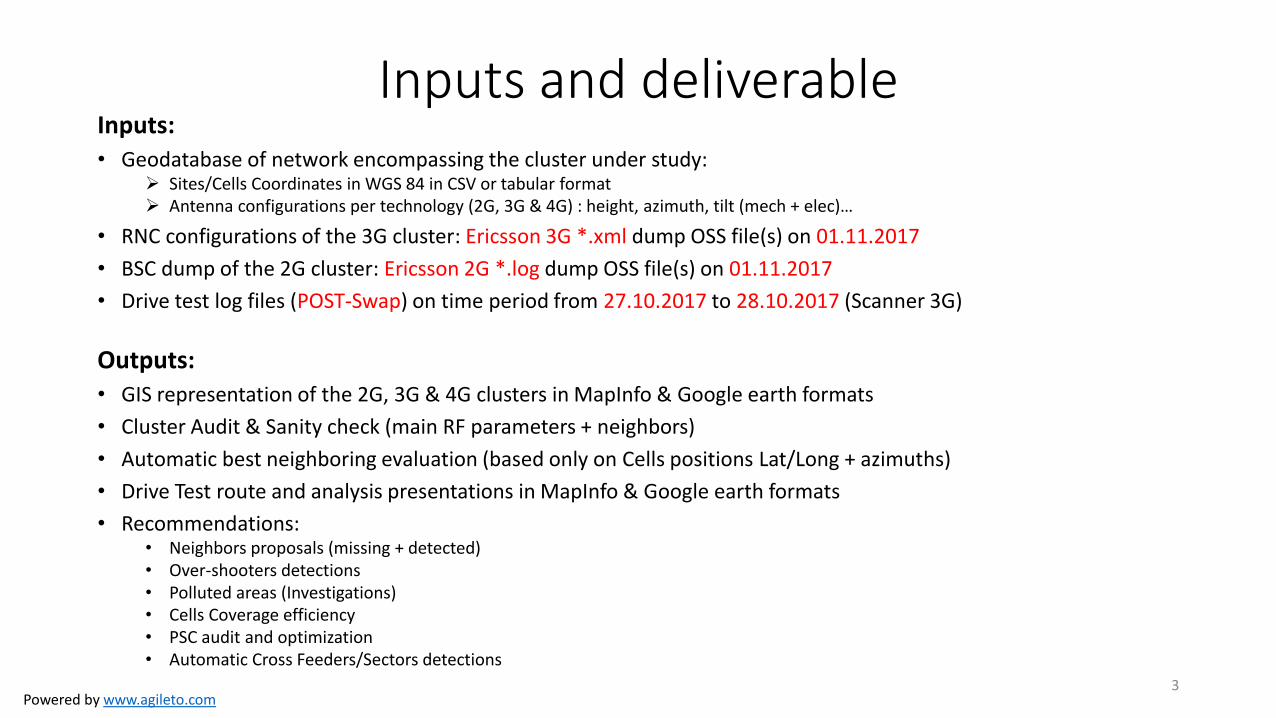
Inputs and deliverable Inputs: • Geodatabase of network encompassing the cluster under study:
Sites/Cells Coordinates in WGS 84 in CSV or tabular format Antenna configurations per technology (2G, 3G & 4G) : height, azimuth, tilt (mech + elec)…
• RNC configurations of the 3G cluster: Ericsson 3G *.xml dump OSS file(s) on 01.11.2017
• BSC dump of the 2G cluster: Ericsson 2G *.log dump OSS file(s) on 01.11.2017
• Drive test log files (POST-Swap) on time period from 27.10.2017 to 28.10.2017 (Scanner 3G)
Outputs: • GIS representation of the 2G, 3G & 4G clusters in MapInfo & Google earth formats
• Cluster Audit & Sanity check (main RF parameters + neighbors)
• Automatic best neighboring evaluation (based only on Cells positions Lat/Long + azimuths)
• Drive Test route and analysis presentations in MapInfo & Google earth formats
• Recommendations: • Neighbors proposals (missing + detected) • Over-shooters detections • Polluted areas (Investigations) • Cells Coverage efficiency • PSC audit and optimization • Automatic Cross Feeders/Sectors detections
3
Powered by www.agileto.com
Agenda
4
• Introduction: Context, Inputs and Deliverables
• Geo-spatial representation of the Network/Cluster
• Cluster Audit & Sanity Check (RF main param + Neighbors)
• Automatic best Neighboring evaluation (missing detected)
• Drive Test (DT) Analysis and Recommendations
Powered by www.agileto.com
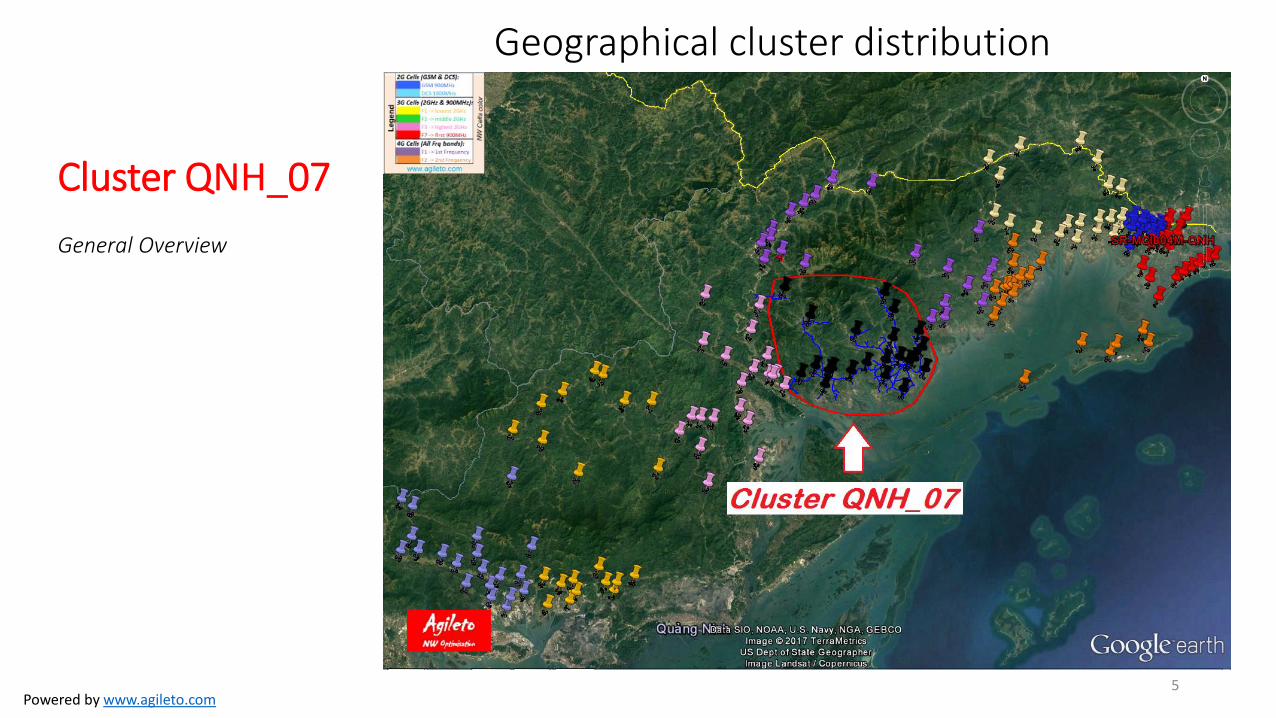
Geographical cluster distribution
5
Cluster QNH_07 General Overview
Powered by www.agileto.com
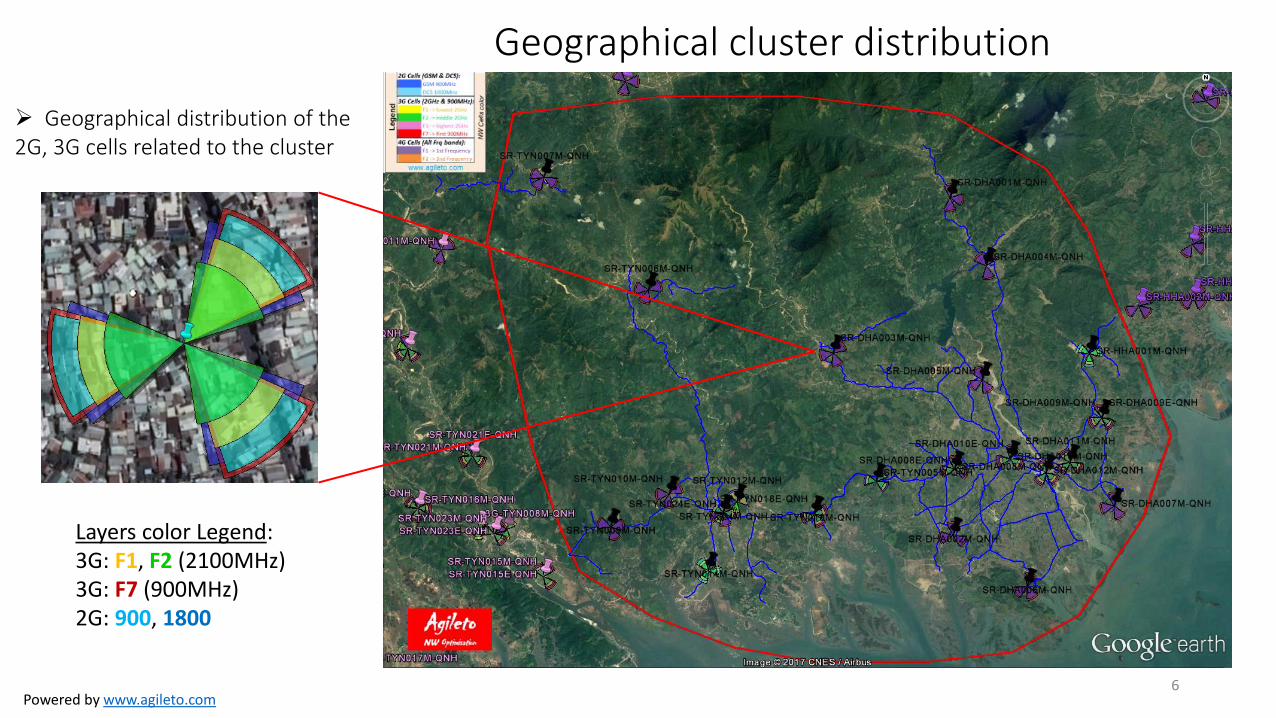
Geographical cluster distribution
6
Geographical distribution of the 2G, 3G cells related to the cluster
Layers color Legend: 3G: F1, F2 (2100MHz) 3G: F7 (900MHz) 2G: 900, 1800
Powered by www.agileto.com
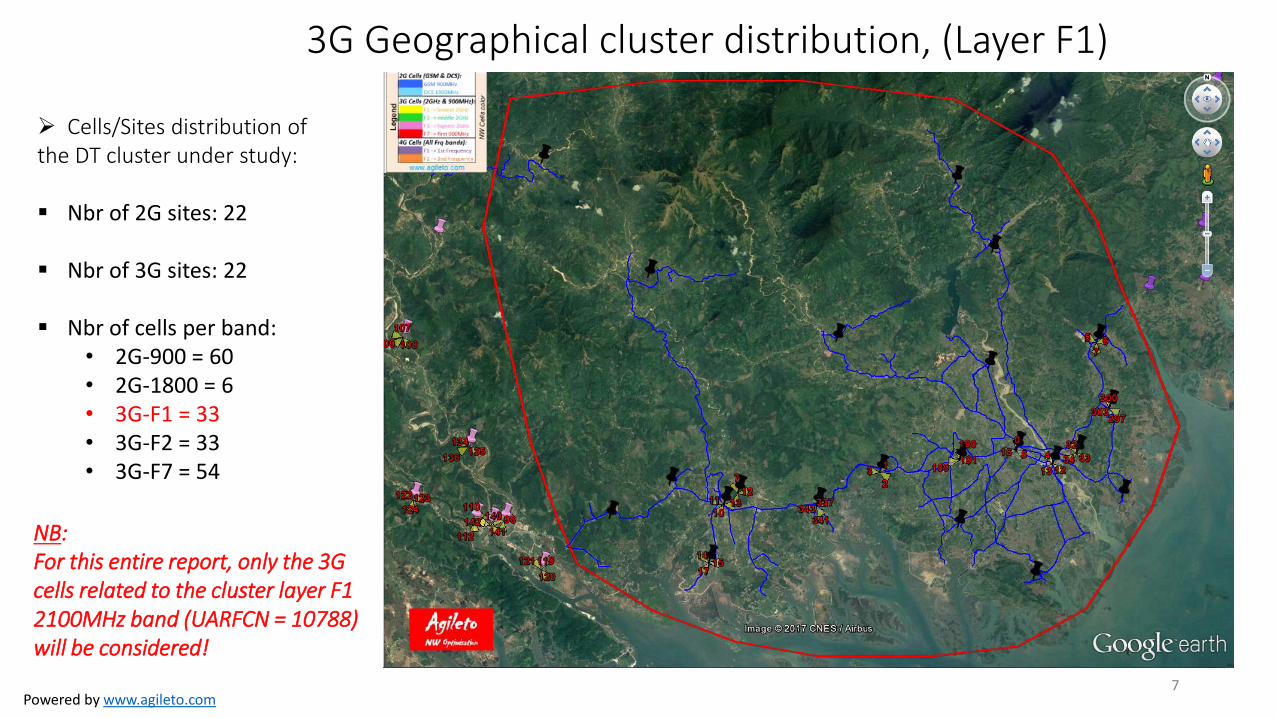
3G Geographical cluster distribution, (Layer F1)
7
Cells/Sites distribution of the DT cluster under study:
Nbr of 2G sites: 22
Nbr of 3G sites: 22
Nbr of cells per band:
• 2G-900 = 60 • 2G-1800 = 6 • 3G-F1 = 33 • 3G-F2 = 33 • 3G-F7 = 54
NB: For this entire report, only the 3G cells related to the cluster layer F1 2100MHz band (UARFCN = 10788) will be considered!
Powered by www.agileto.com
Agenda
• Introduction: Context, Inputs and Deliverables
• Geo-spatial representation of the Network/Cluster
• Cluster Audit & Sanity Check (RF main param + Neighbors)
• Automatic best Neighboring evaluation (missing detected)
• Drive Test (DT) Analysis and Recommendations
8
Powered by www.agileto.com
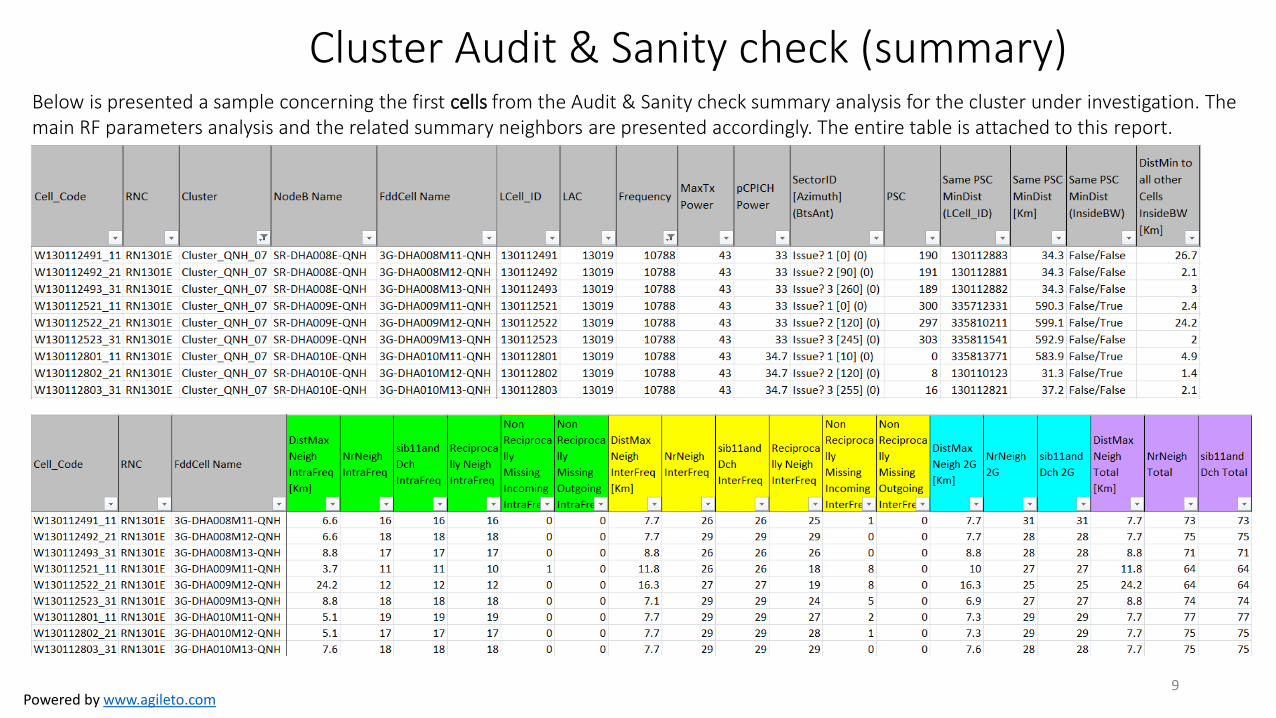
Cluster Audit & Sanity check (summary) Below is presented a sample concerning the first cells from the Audit & Sanity check summary analysis for the cluster under investigation. The main RF parameters analysis and the related summary neighbors are presented accordingly. The entire table is attached to this report.
9
Powered by www.agileto.com
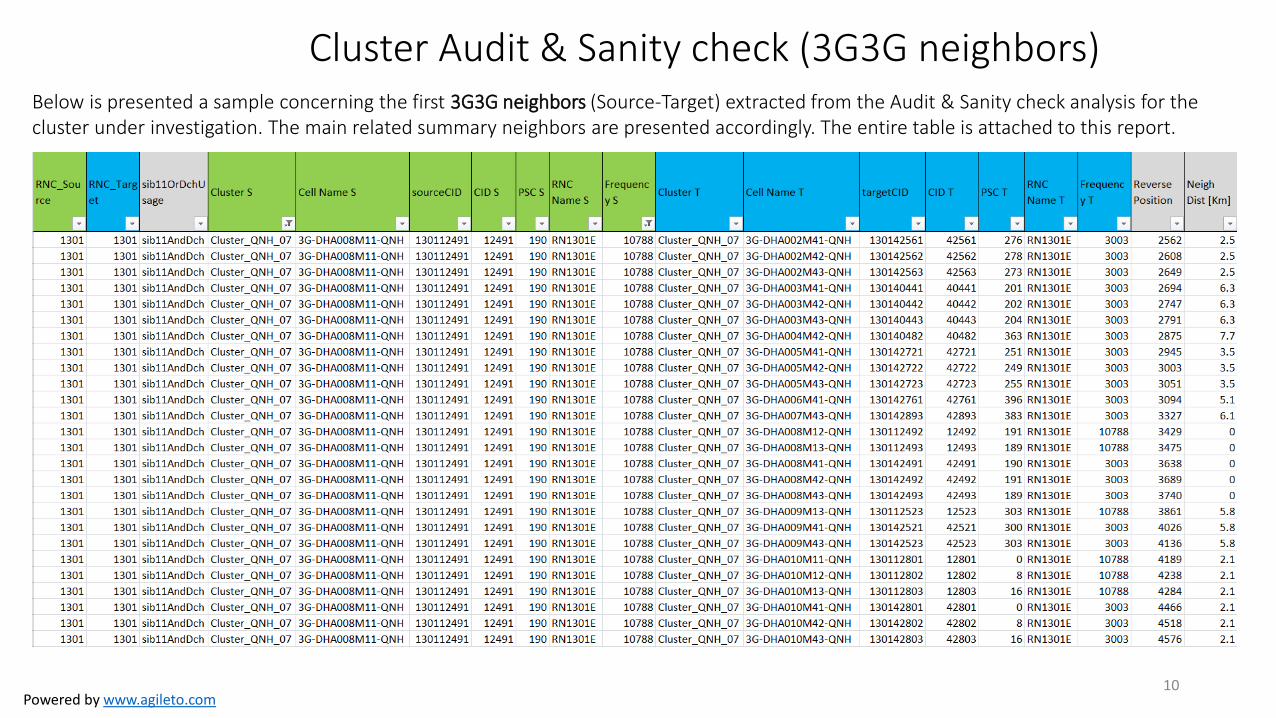
Cluster Audit & Sanity check (3G3G neighbors) Below is presented a sample concerning the first 3G3G neighbors (Source-Target) extracted from the Audit & Sanity check analysis for the cluster under investigation. The main related summary neighbors are presented accordingly. The entire table is attached to this report.
10
Powered by www.agileto.com
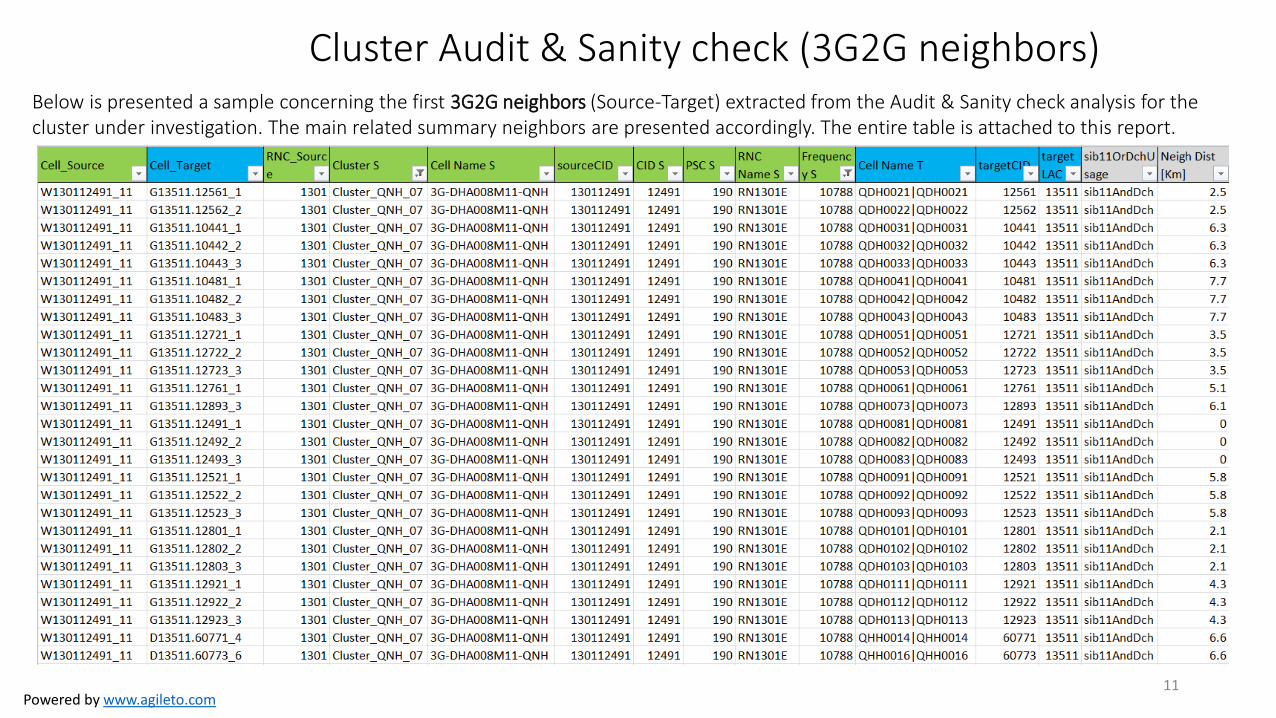
Cluster Audit & Sanity check (3G2G neighbors) Below is presented a sample concerning the first 3G2G neighbors (Source-Target) extracted from the Audit & Sanity check analysis for the cluster under investigation. The main related summary neighbors are presented accordingly. The entire table is attached to this report.
11
Powered by www.agileto.com
Agenda
• Introduction: Context, Inputs and Deliverables
• Geo-spatial representation of the Network/Cluster
• Cluster Audit & Sanity Check (RF main param + Neighbors)
• Automatic best Neighboring evaluation (missing detected)
• Drive Test (DT) Analysis and Recommendations
12
Powered by www.agileto.com
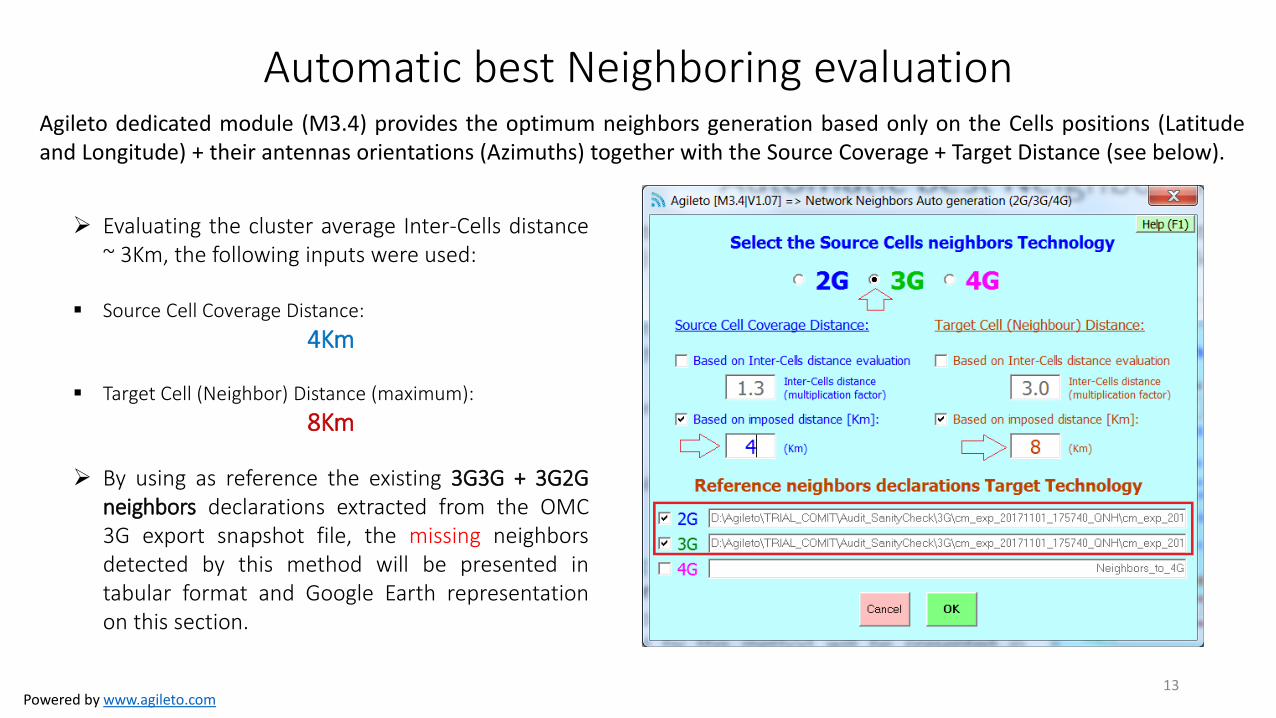
Automatic best Neighboring evaluation Agileto dedicated module (M3.4) provides the optimum neighbors generation based only on the Cells positions (Latitude and Longitude) + their antennas orientations (Azimuths) together with the Source Coverage + Target Distance (see below).
13
Evaluating the cluster average Inter-Cells distance ~ 3Km, the following inputs were used:
Source Cell Coverage Distance:
4Km
Target Cell (Neighbor) Distance (maximum):
8Km
By using as reference the existing 3G3G + 3G2G neighbors declarations extracted from the OMC 3G export snapshot file, the missing neighbors detected by this method will be presented in tabular format and Google Earth representation on this section.
Powered by www.agileto.com
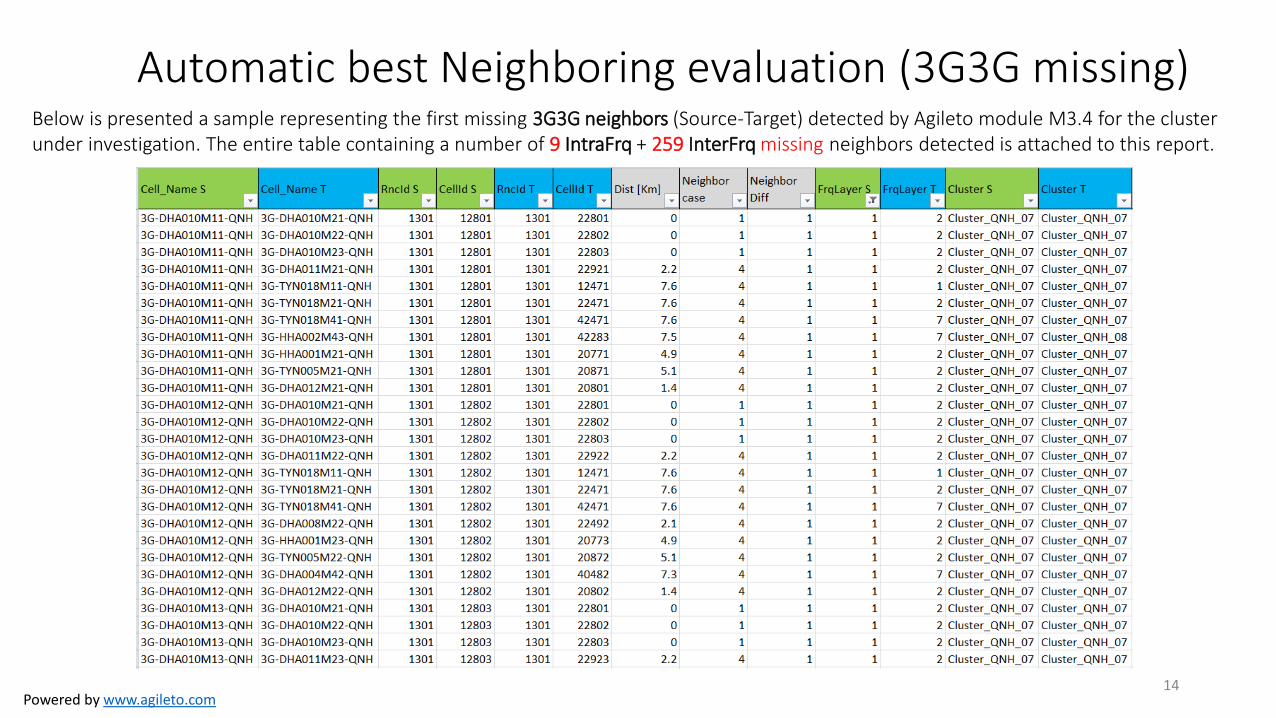
Below is presented a sample representing the first missing 3G3G neighbors (Source-Target) detected by Agileto module M3.4 for the cluster under investigation. The entire table containing a number of 9 IntraFrq + 259 InterFrq missing neighbors detected is attached to this report.
14
Automatic best Neighboring evaluation (3G3G missing)
Powered by www.agileto.com
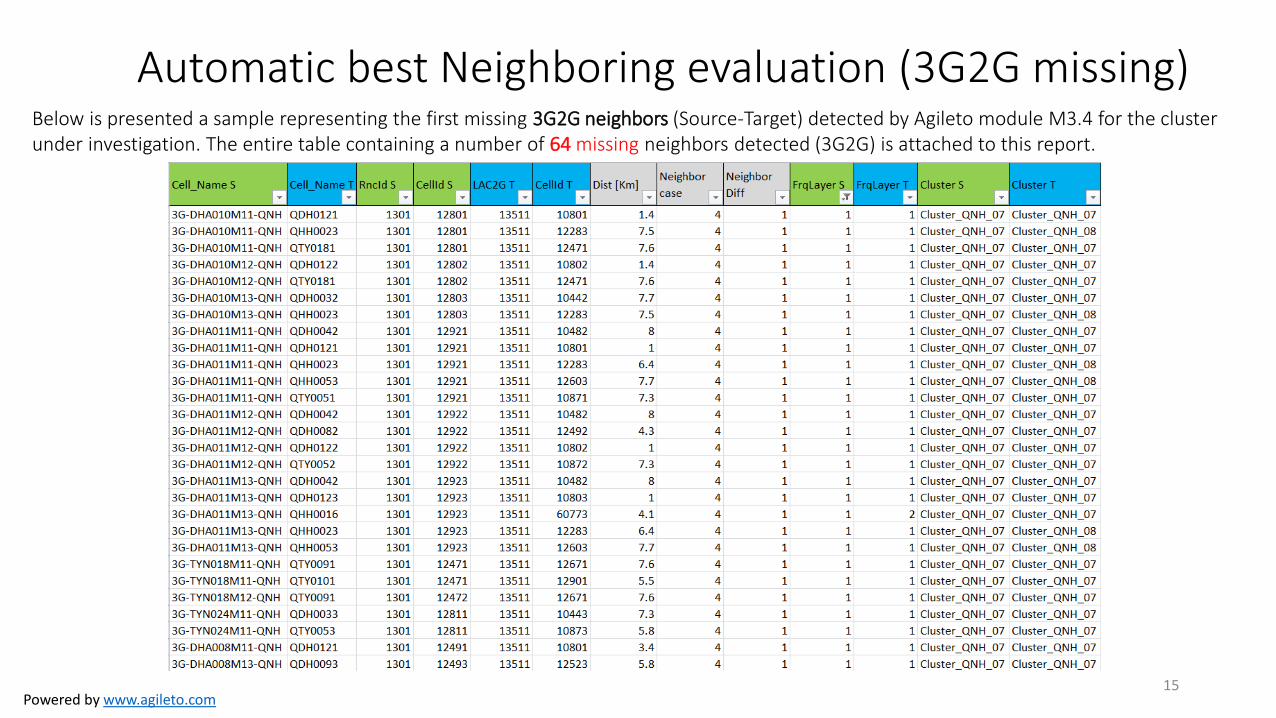
Below is presented a sample representing the first missing 3G2G neighbors (Source-Target) detected by Agileto module M3.4 for the cluster under investigation. The entire table containing a number of 64 missing neighbors detected (3G2G) is attached to this report.
15
Automatic best Neighboring evaluation (3G2G missing)
Powered by www.agileto.com
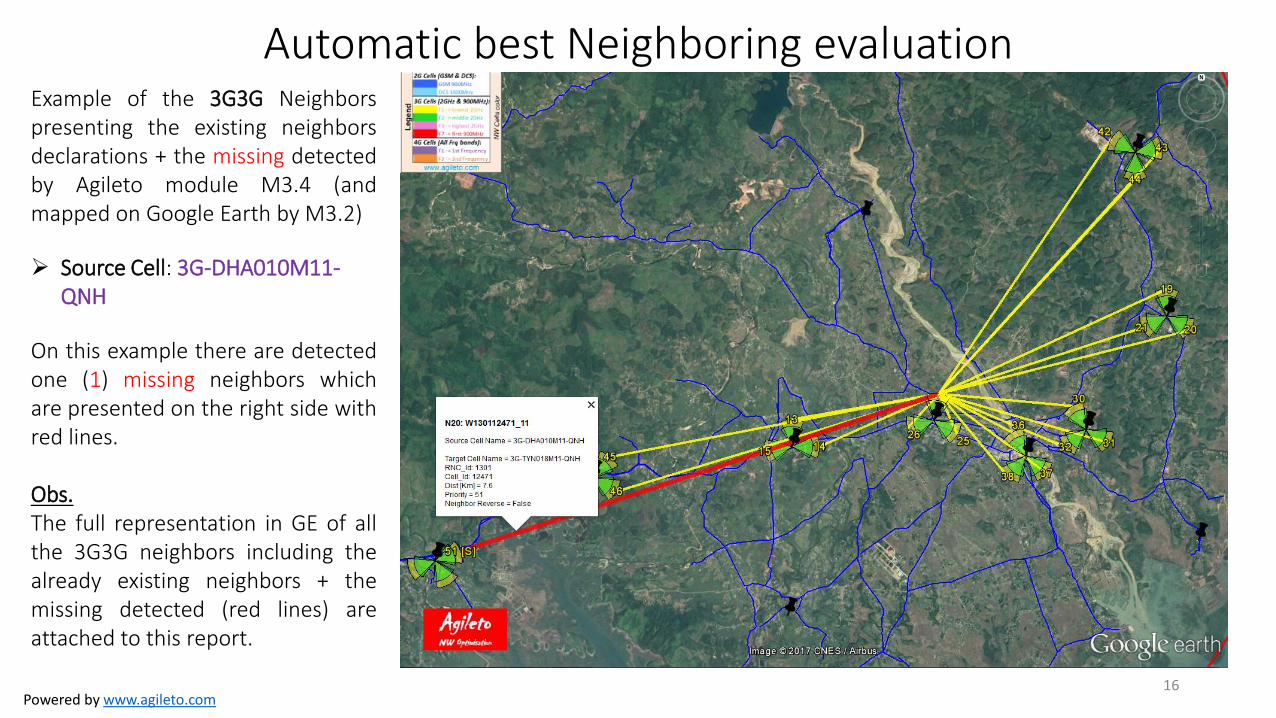
Example of the 3G3G Neighbors presenting the existing neighbors declarations + the missing detected by Agileto module M3.4 (and mapped on Google Earth by M3.2)
Source Cell: 3G-DHA010M11-QNH
On this example there are detected one (1) missing neighbors which are presented on the right side with red lines. Obs. The full representation in GE of all the 3G3G neighbors including the already existing neighbors + the missing detected (red lines) are attached to this report.
16
Automatic best Neighboring evaluation
Powered by www.agileto.com
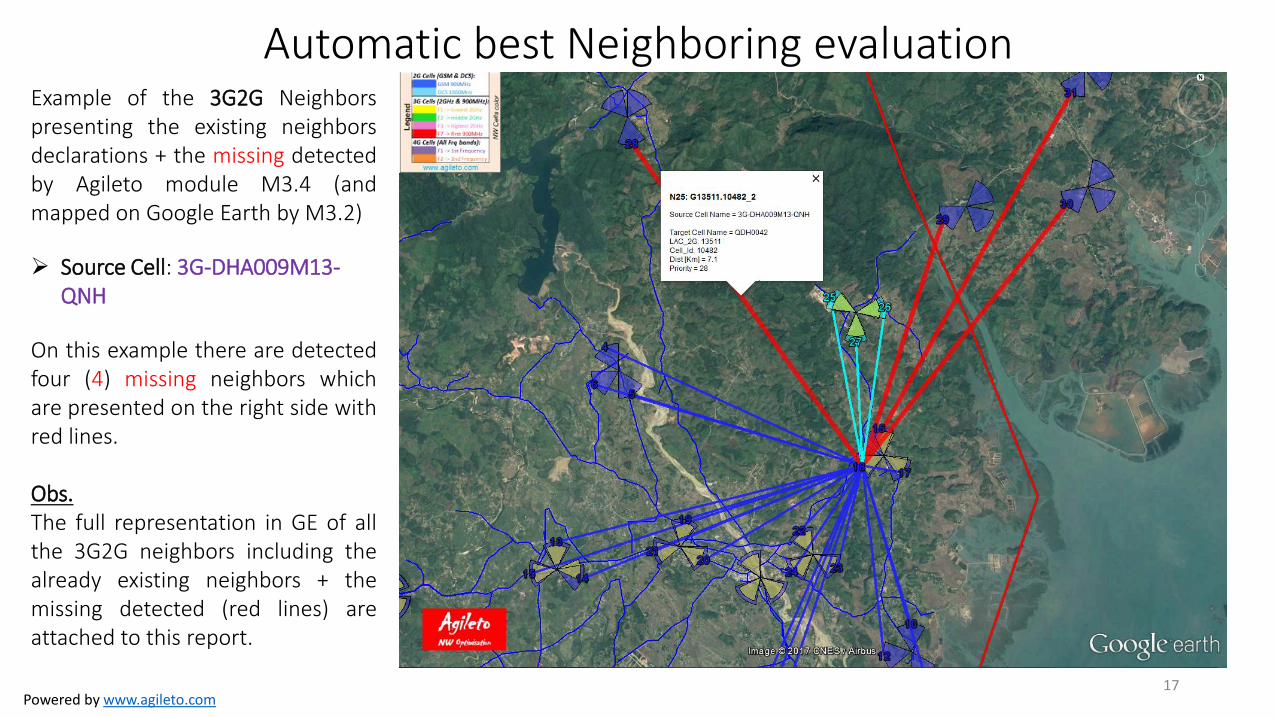
Example of the 3G2G Neighbors presenting the existing neighbors declarations + the missing detected by Agileto module M3.4 (and mapped on Google Earth by M3.2)
Source Cell: 3G-DHA009M13-QNH
On this example there are detected four (4) missing neighbors which are presented on the right side with red lines. Obs. The full representation in GE of all the 3G2G neighbors including the already existing neighbors + the missing detected (red lines) are attached to this report.
17
Automatic best Neighboring evaluation
Powered by www.agileto.com
Agenda
• Introduction: Context, Inputs and Deliverables
• Geo-spatial representation of the Network/Cluster
• Cluster Audit & Sanity Check (RF main param + Neighbors)
• Automatic best Neighboring evaluation (missing detected)
• Drive Test (DT) Analysis and Recommendations
18
Powered by www.agileto.com
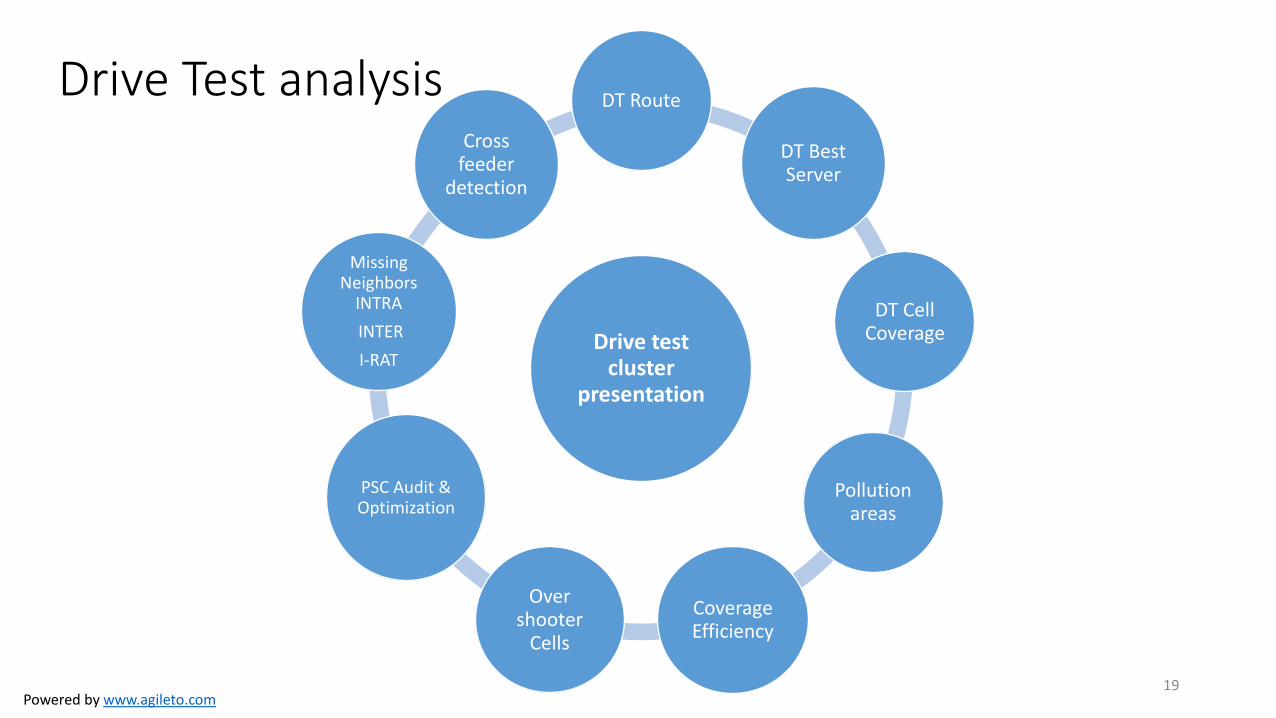
Drive test cluster
presentation
DT Route
DT Best Server
DT Cell Coverage
Pollution areas
Coverage Efficiency
Over shooter
Cells
PSC Audit & Optimization
Missing Neighbors
INTRA
INTER
I-RAT
Cross feeder
detection
Drive Test analysis
19
Powered by www.agileto.com
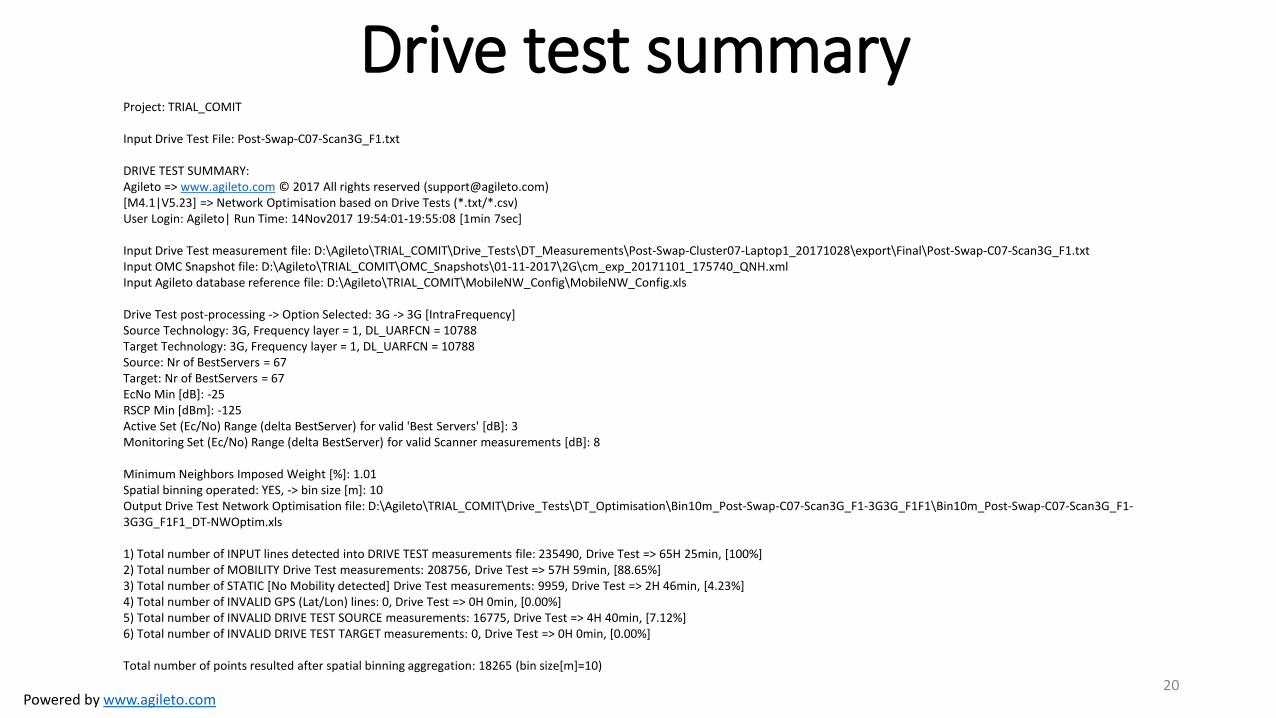
Drive test summary
20
Project: TRIAL_COMIT Input Drive Test File: Post-Swap-C07-Scan3G_F1.txt DRIVE TEST SUMMARY: Agileto => www.agileto.com © 2017 All rights reserved ([email protected]) [M4.1|V5.23] => Network Optimisation based on Drive Tests (*.txt/*.csv) User Login: Agileto| Run Time: 14Nov2017 19:54:01-19:55:08 [1min 7sec] Input Drive Test measurement file: D:\Agileto\TRIAL_COMIT\Drive_Tests\DT_Measurements\Post-Swap-Cluster07-Laptop1_20171028\export\Final\Post-Swap-C07-Scan3G_F1.txt Input OMC Snapshot file: D:\Agileto\TRIAL_COMIT\OMC_Snapshots\01-11-2017\2G\cm_exp_20171101_175740_QNH.xml Input Agileto database reference file: D:\Agileto\TRIAL_COMIT\MobileNW_Config\MobileNW_Config.xls Drive Test post-processing -> Option Selected: 3G -> 3G [IntraFrequency] Source Technology: 3G, Frequency layer = 1, DL_UARFCN = 10788 Target Technology: 3G, Frequency layer = 1, DL_UARFCN = 10788 Source: Nr of BestServers = 67 Target: Nr of BestServers = 67 EcNo Min [dB]: -25 RSCP Min [dBm]: -125 Active Set (Ec/No) Range (delta BestServer) for valid 'Best Servers' [dB]: 3 Monitoring Set (Ec/No) Range (delta BestServer) for valid Scanner measurements [dB]: 8 Minimum Neighbors Imposed Weight [%]: 1.01 Spatial binning operated: YES, -> bin size [m]: 10 Output Drive Test Network Optimisation file: D:\Agileto\TRIAL_COMIT\Drive_Tests\DT_Optimisation\Bin10m_Post-Swap-C07-Scan3G_F1-3G3G_F1F1\Bin10m_Post-Swap-C07-Scan3G_F1-3G3G_F1F1_DT-NWOptim.xls 1) Total number of INPUT lines detected into DRIVE TEST measurements file: 235490, Drive Test => 65H 25min, [100%] 2) Total number of MOBILITY Drive Test measurements: 208756, Drive Test => 57H 59min, [88.65%] 3) Total number of STATIC [No Mobility detected] Drive Test measurements: 9959, Drive Test => 2H 46min, [4.23%] 4) Total number of INVALID GPS (Lat/Lon) lines: 0, Drive Test => 0H 0min, [0.00%] 5) Total number of INVALID DRIVE TEST SOURCE measurements: 16775, Drive Test => 4H 40min, [7.12%] 6) Total number of INVALID DRIVE TEST TARGET measurements: 0, Drive Test => 0H 0min, [0.00%] Total number of points resulted after spatial binning aggregation: 18265 (bin size[m]=10)
Powered by www.agileto.com
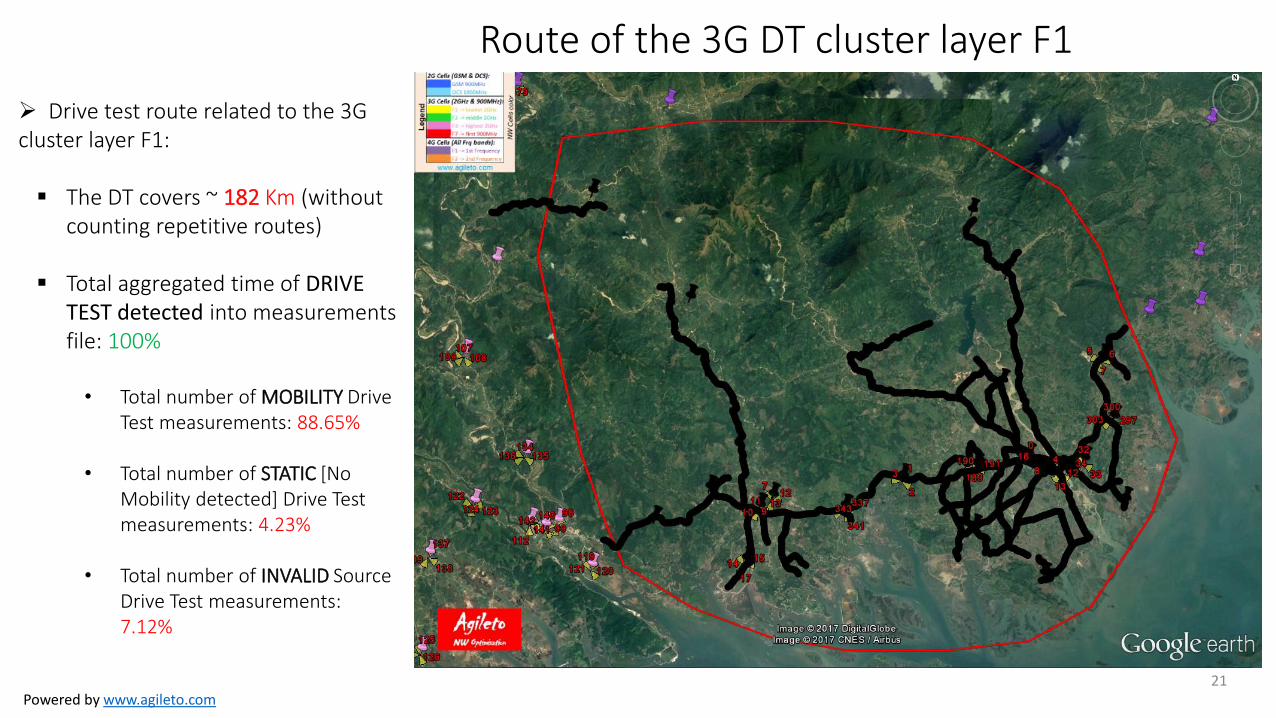
Route of the 3G DT cluster layer F1
21
Drive test route related to the 3G cluster layer F1:
The DT covers ~ 182 Km (without
counting repetitive routes)
Total aggregated time of DRIVE TEST detected into measurements file: 100% • Total number of MOBILITY Drive
Test measurements: 88.65%
• Total number of STATIC [No Mobility detected] Drive Test measurements: 4.23%
• Total number of INVALID Source Drive Test measurements: 7.12%
Powered by www.agileto.com
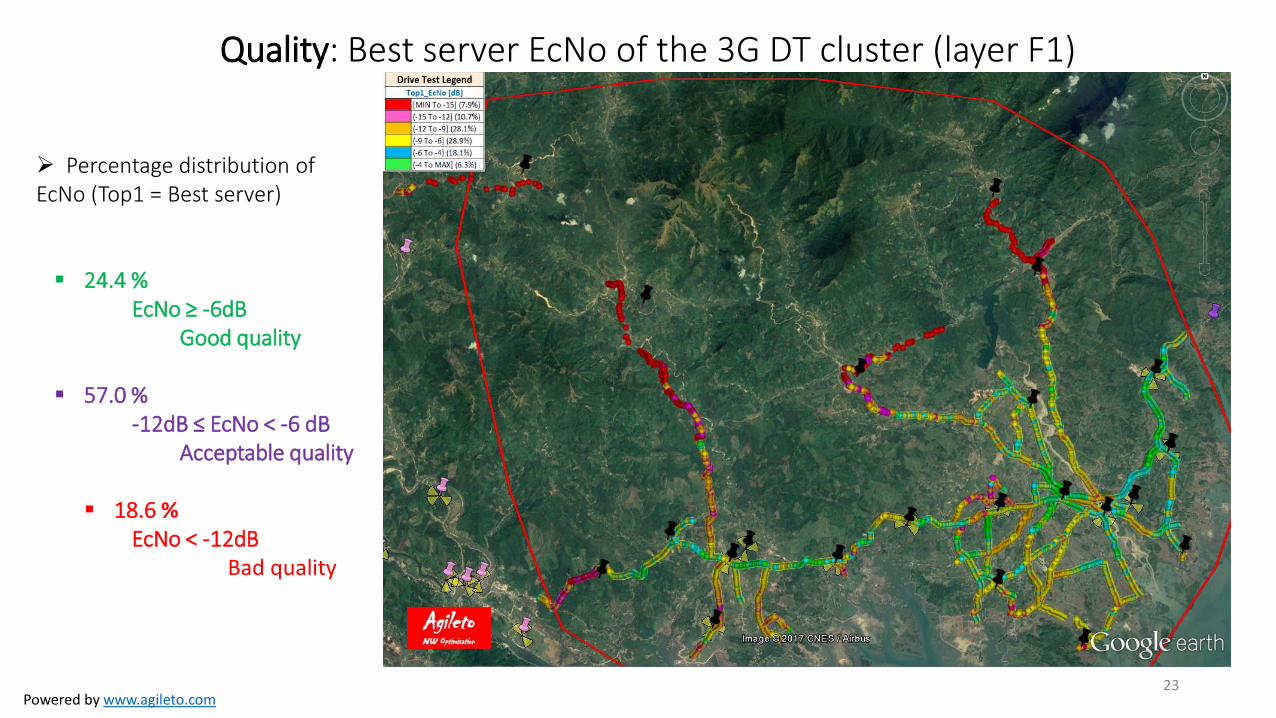
Quality: Best server EcNo of the 3G DT cluster (layer F1)
23
Percentage distribution of EcNo (Top1 = Best server) 24.4 %
EcNo ≥ -6dB Good quality
57.0 %
-12dB ≤ EcNo < -6 dB Acceptable quality
18.6 %
EcNo < -12dB Bad quality
Powered by www.agileto.com
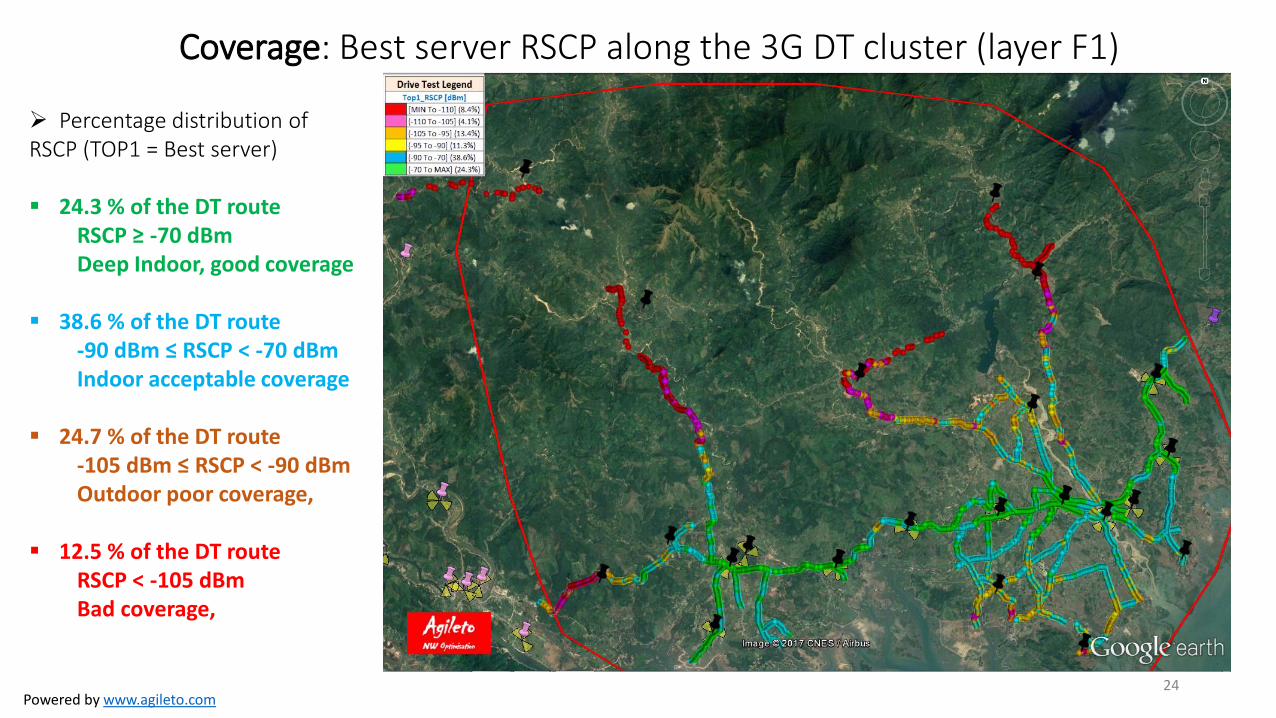
Coverage: Best server RSCP along the 3G DT cluster (layer F1)
24
Percentage distribution of RSCP (TOP1 = Best server) 24.3 % of the DT route
RSCP ≥ -70 dBm Deep Indoor, good coverage
38.6 % of the DT route
-90 dBm ≤ RSCP < -70 dBm Indoor acceptable coverage
24.7 % of the DT route
-105 dBm ≤ RSCP < -90 dBm Outdoor poor coverage,
12.5 % of the DT route
RSCP < -105 dBm Bad coverage,
Powered by www.agileto.com
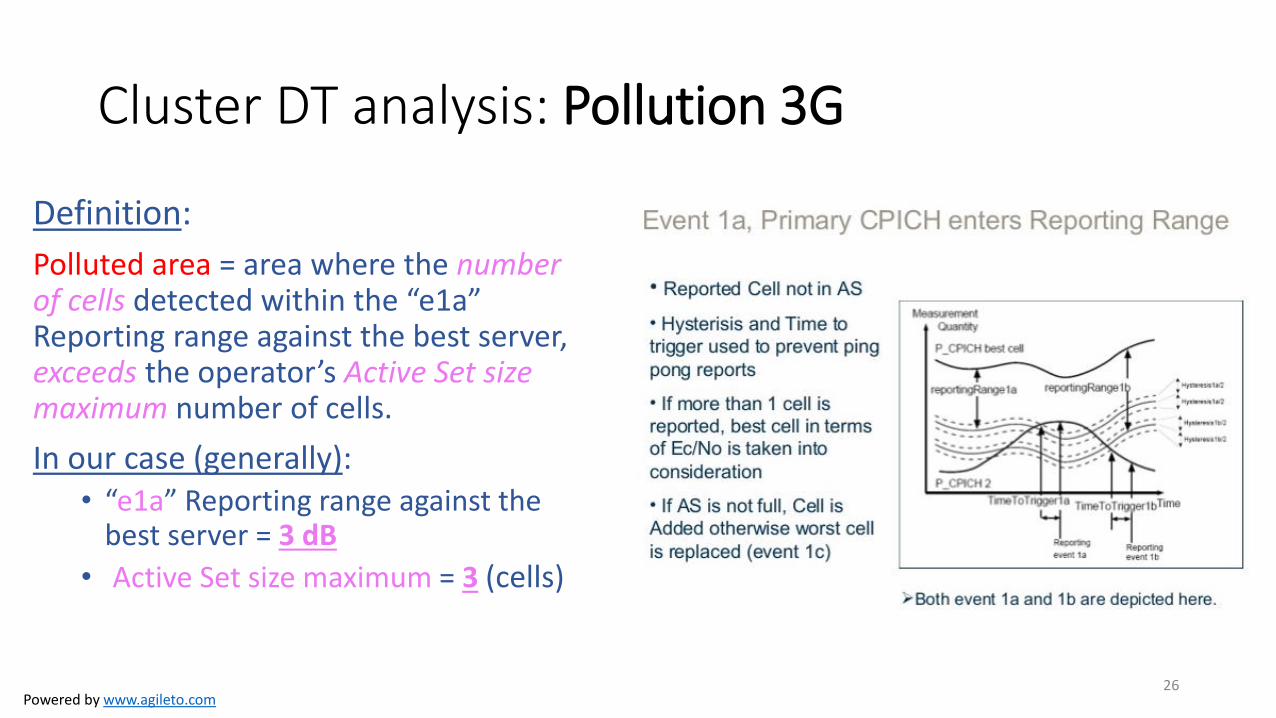
Cluster DT analysis: Pollution 3G
Definition:
Polluted area = area where the number of cells detected within the “e1a” Reporting range against the best server, exceeds the operator’s Active Set size maximum number of cells.
In our case (generally): • “e1a” Reporting range against the
best server = 3 dB
• .Active Set size maximum = 3 (cells)
26
Powered by www.agileto.com
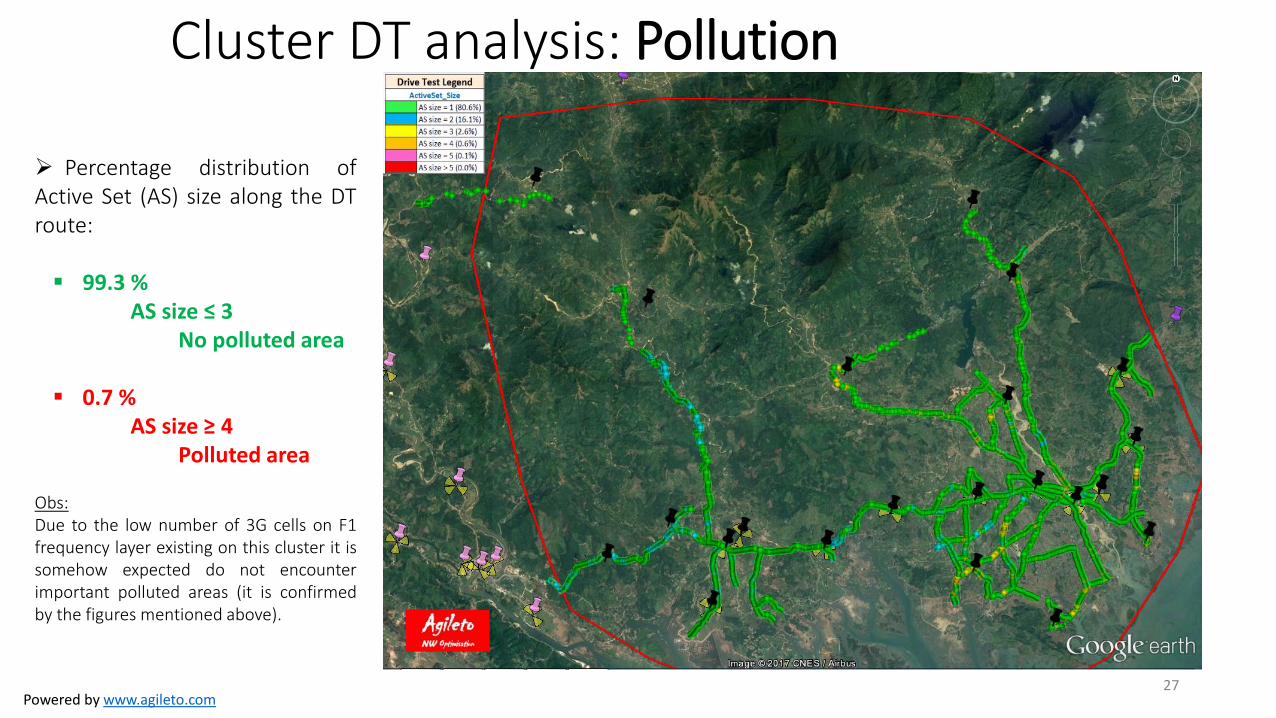
27
Percentage distribution of Active Set (AS) size along the DT route: 99.3 %
AS size ≤ 3 No polluted area
0.7 % AS size ≥ 4
Polluted area Obs: Due to the low number of 3G cells on F1 frequency layer existing on this cluster it is somehow expected do not encounter important polluted areas (it is confirmed by the figures mentioned above).
Cluster DT analysis: Pollution
Powered by www.agileto.com 28
Cluster DT analysis: Pollution
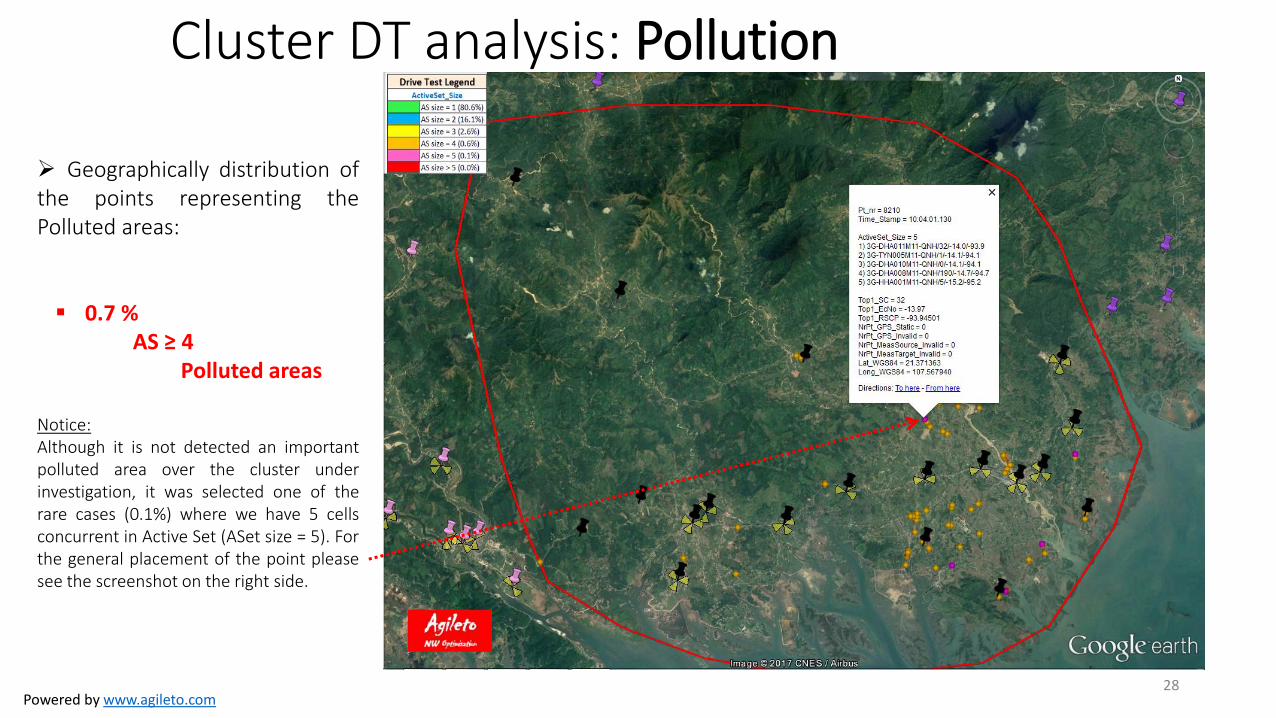
Geographically distribution of the points representing the Polluted areas:
0.7 %
AS ≥ 4 Polluted areas
Notice: Although it is not detected an important polluted area over the cluster under investigation, it was selected one of the rare cases (0.1%) where we have 5 cells concurrent in Active Set (ASet size = 5). For the general placement of the point please see the screenshot on the right side.
Powered by www.agileto.com 29
“Zoom in” on polluted area
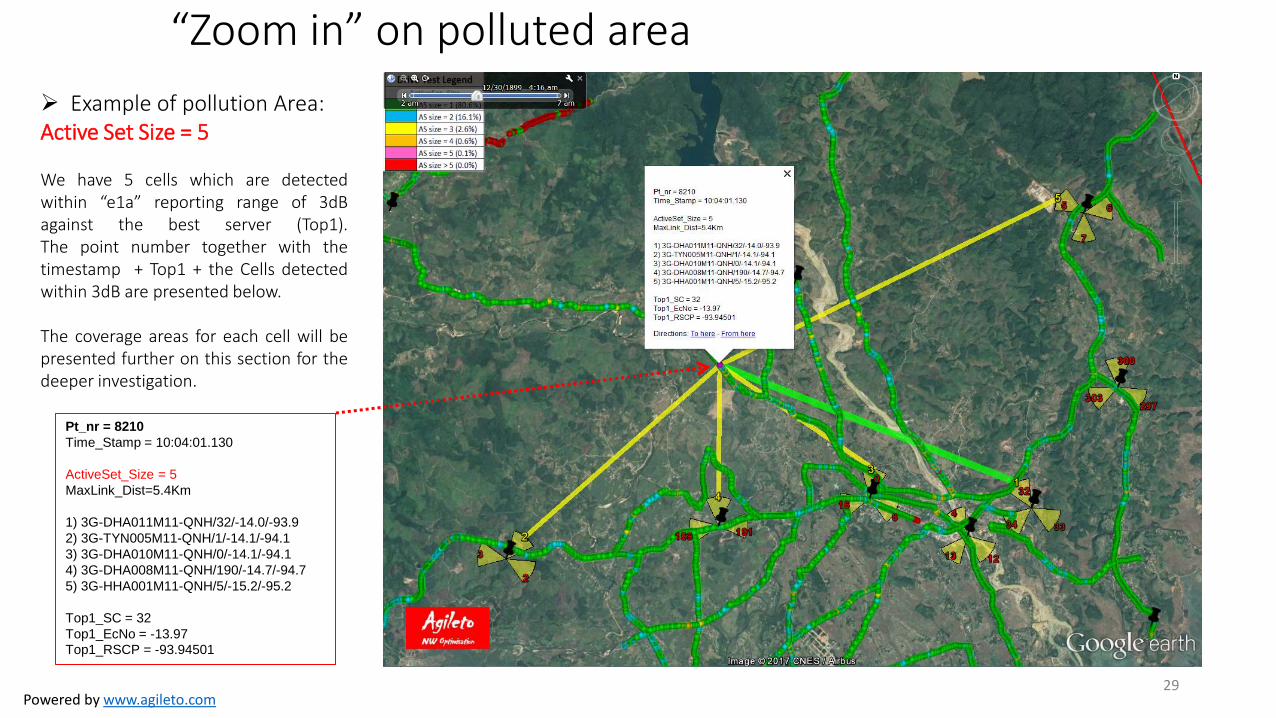
Example of pollution Area: Active Set Size = 5 We have 5 cells which are detected within “e1a” reporting range of 3dB against the best server (Top1). The point number together with the timestamp + Top1 + the Cells detected within 3dB are presented below. The coverage areas for each cell will be presented further on this section for the deeper investigation.
Pt_nr = 8210
Time_Stamp = 10:04:01.130
ActiveSet_Size = 5
MaxLink_Dist=5.4Km
1) 3G-DHA011M11-QNH/32/-14.0/-93.9
2) 3G-TYN005M11-QNH/1/-14.1/-94.1
3) 3G-DHA010M11-QNH/0/-14.1/-94.1
4) 3G-DHA008M11-QNH/190/-14.7/-94.7
5) 3G-HHA001M11-QNH/5/-15.2/-95.2
Top1_SC = 32
Top1_EcNo = -13.97
Top1_RSCP = -93.94501
Powered by www.agileto.com 30
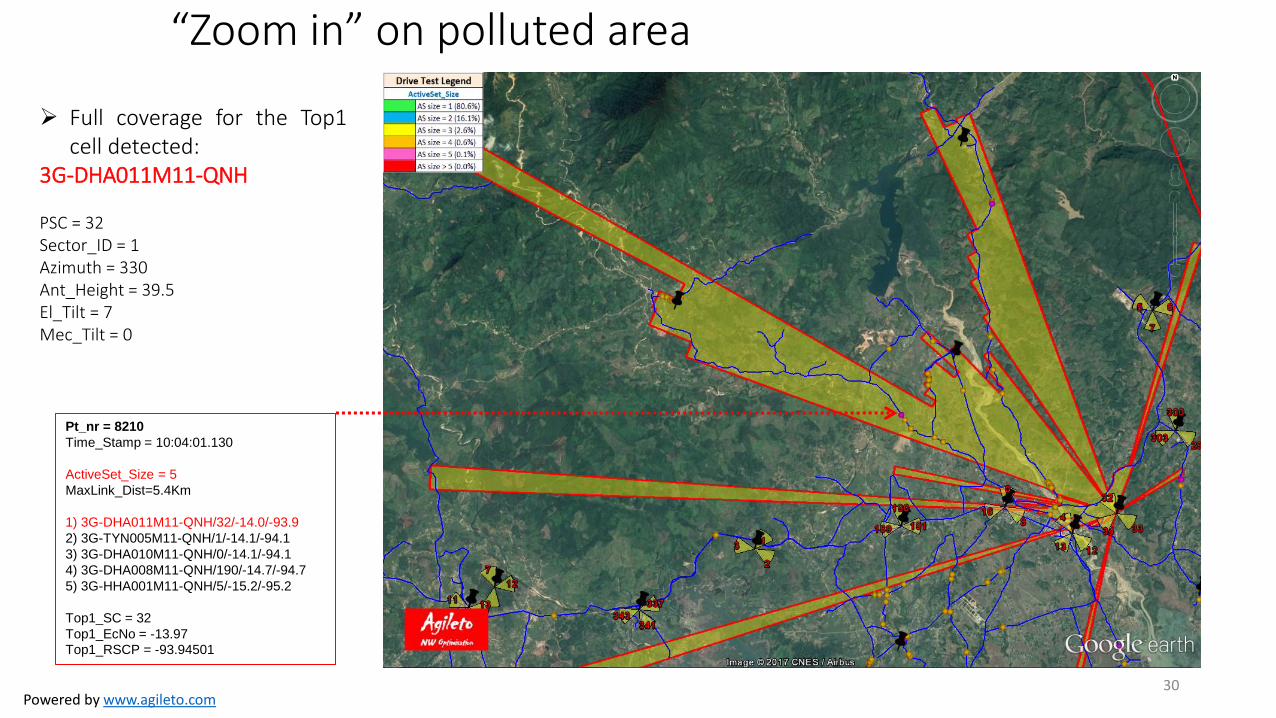
Full coverage for the Top1 cell detected:
3G-DHA011M11-QNH PSC = 32 Sector_ID = 1 Azimuth = 330 Ant_Height = 39.5 El_Tilt = 7 Mec_Tilt = 0
Pt_nr = 8210
Time_Stamp = 10:04:01.130
ActiveSet_Size = 5
MaxLink_Dist=5.4Km
1) 3G-DHA011M11-QNH/32/-14.0/-93.9
2) 3G-TYN005M11-QNH/1/-14.1/-94.1
3) 3G-DHA010M11-QNH/0/-14.1/-94.1
4) 3G-DHA008M11-QNH/190/-14.7/-94.7
5) 3G-HHA001M11-QNH/5/-15.2/-95.2
Top1_SC = 32
Top1_EcNo = -13.97
Top1_RSCP = -93.94501
“Zoom in” on polluted area
Powered by www.agileto.com 31
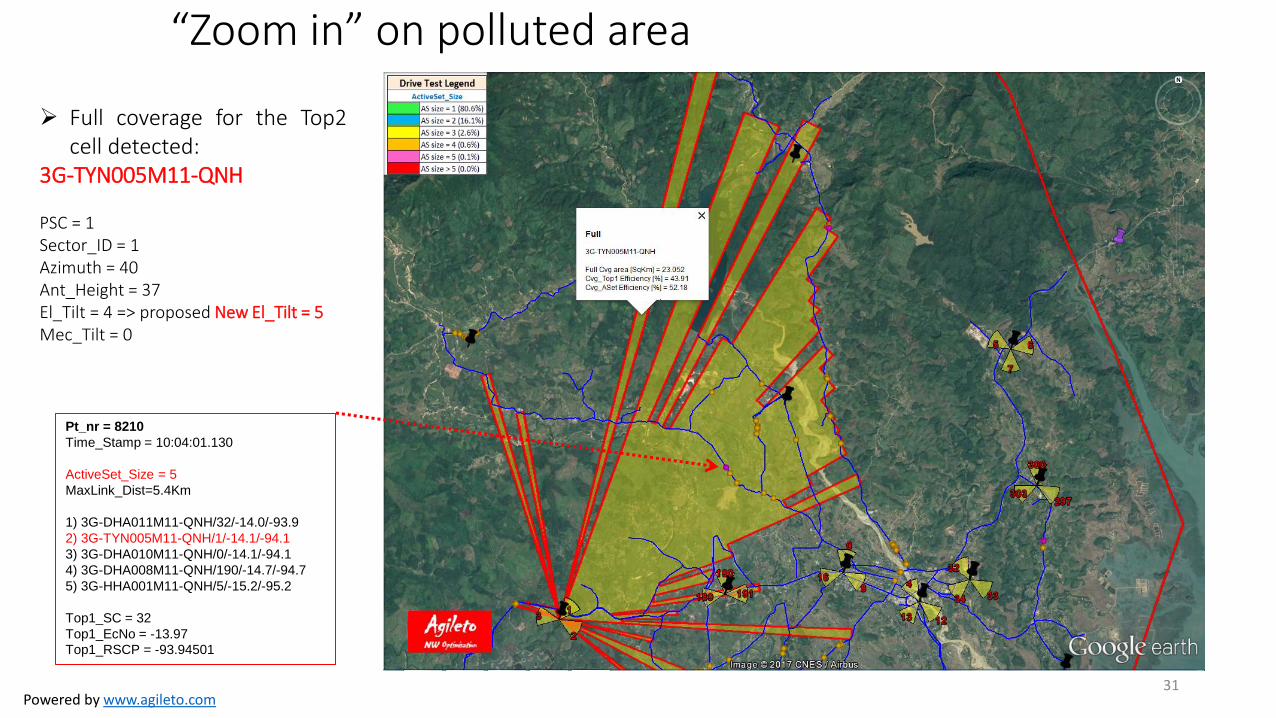
Full coverage for the Top2 cell detected:
3G-TYN005M11-QNH PSC = 1 Sector_ID = 1 Azimuth = 40 Ant_Height = 37 El_Tilt = 4 => proposed New El_Tilt = 5 Mec_Tilt = 0
Pt_nr = 8210
Time_Stamp = 10:04:01.130
ActiveSet_Size = 5
MaxLink_Dist=5.4Km
1) 3G-DHA011M11-QNH/32/-14.0/-93.9
2) 3G-TYN005M11-QNH/1/-14.1/-94.1
3) 3G-DHA010M11-QNH/0/-14.1/-94.1
4) 3G-DHA008M11-QNH/190/-14.7/-94.7
5) 3G-HHA001M11-QNH/5/-15.2/-95.2
Top1_SC = 32
Top1_EcNo = -13.97
Top1_RSCP = -93.94501
“Zoom in” on polluted area
Powered by www.agileto.com 32
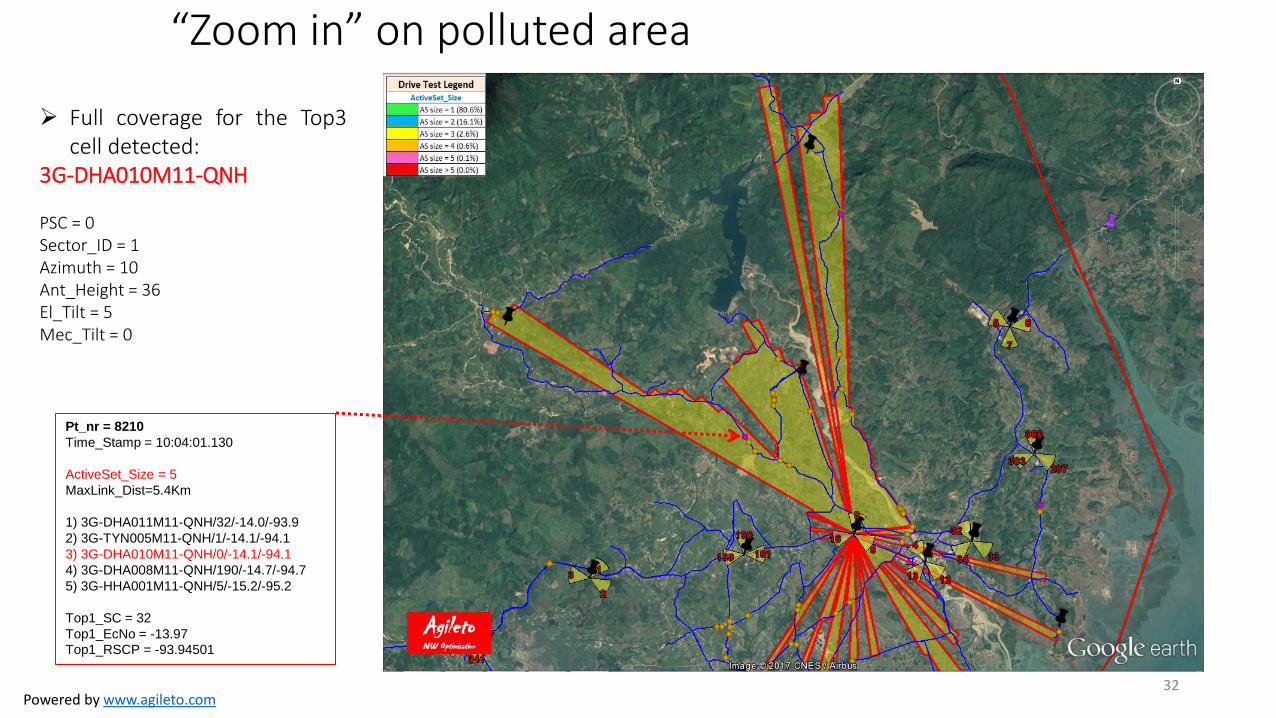
Full coverage for the Top3 cell detected:
3G-DHA010M11-QNH PSC = 0 Sector_ID = 1 Azimuth = 10 Ant_Height = 36 El_Tilt = 5 Mec_Tilt = 0
Pt_nr = 8210
Time_Stamp = 10:04:01.130
ActiveSet_Size = 5
MaxLink_Dist=5.4Km
1) 3G-DHA011M11-QNH/32/-14.0/-93.9
2) 3G-TYN005M11-QNH/1/-14.1/-94.1
3) 3G-DHA010M11-QNH/0/-14.1/-94.1
4) 3G-DHA008M11-QNH/190/-14.7/-94.7
5) 3G-HHA001M11-QNH/5/-15.2/-95.2
Top1_SC = 32
Top1_EcNo = -13.97
Top1_RSCP = -93.94501
“Zoom in” on polluted area
Powered by www.agileto.com 33
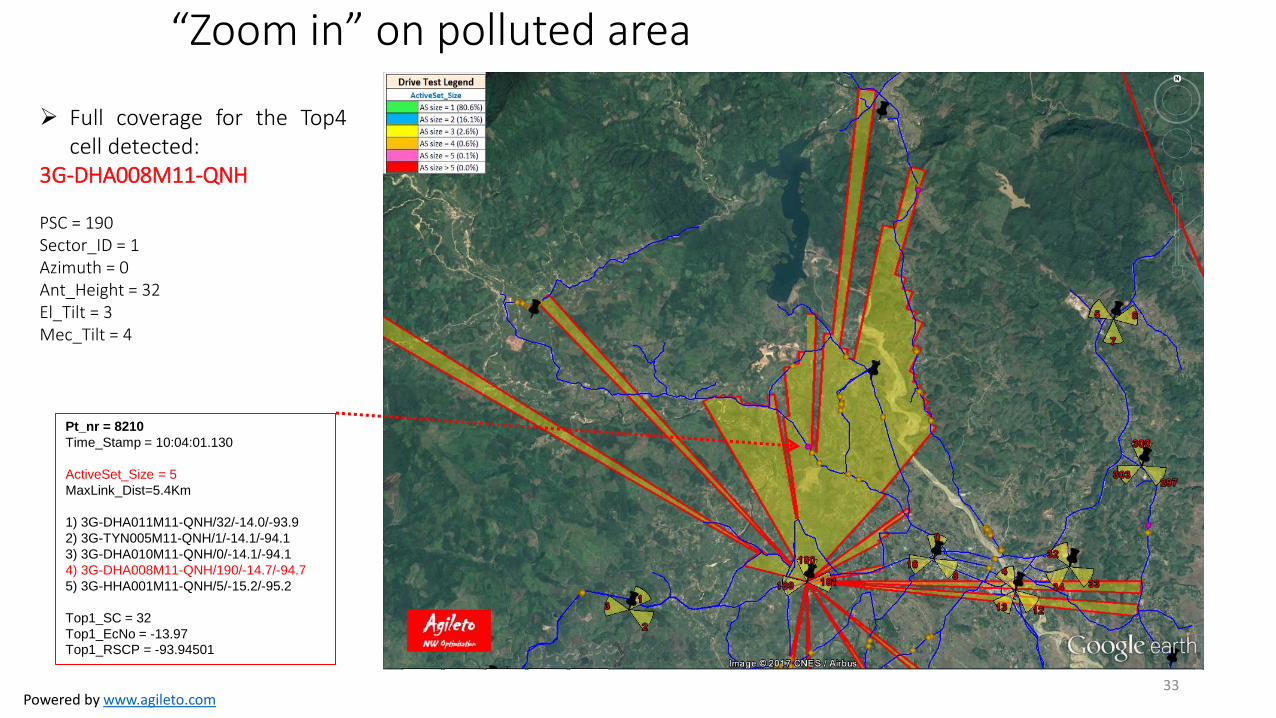
Full coverage for the Top4 cell detected:
3G-DHA008M11-QNH PSC = 190 Sector_ID = 1 Azimuth = 0 Ant_Height = 32 El_Tilt = 3 Mec_Tilt = 4
Pt_nr = 8210
Time_Stamp = 10:04:01.130
ActiveSet_Size = 5
MaxLink_Dist=5.4Km
1) 3G-DHA011M11-QNH/32/-14.0/-93.9
2) 3G-TYN005M11-QNH/1/-14.1/-94.1
3) 3G-DHA010M11-QNH/0/-14.1/-94.1
4) 3G-DHA008M11-QNH/190/-14.7/-94.7
5) 3G-HHA001M11-QNH/5/-15.2/-95.2
Top1_SC = 32
Top1_EcNo = -13.97
Top1_RSCP = -93.94501
“Zoom in” on polluted area
Powered by www.agileto.com 34
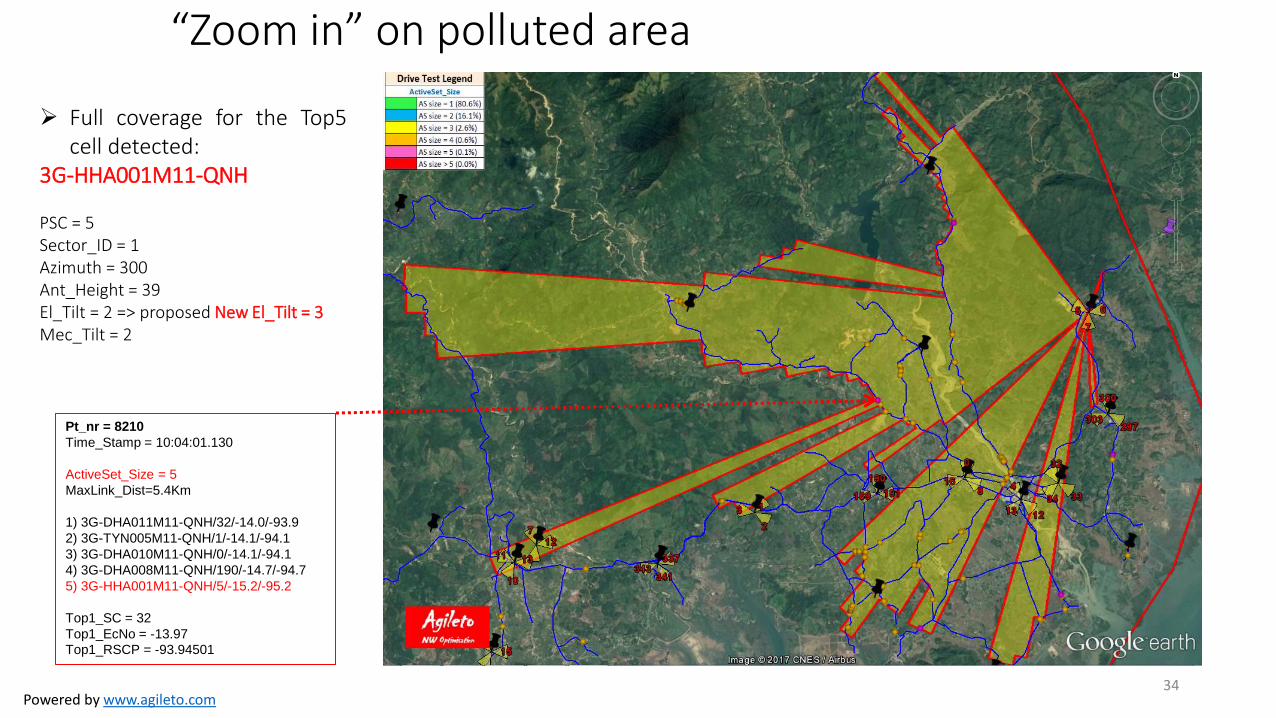
Full coverage for the Top5 cell detected:
3G-HHA001M11-QNH PSC = 5 Sector_ID = 1 Azimuth = 300 Ant_Height = 39 El_Tilt = 2 => proposed New El_Tilt = 3 Mec_Tilt = 2
Pt_nr = 8210
Time_Stamp = 10:04:01.130
ActiveSet_Size = 5
MaxLink_Dist=5.4Km
1) 3G-DHA011M11-QNH/32/-14.0/-93.9
2) 3G-TYN005M11-QNH/1/-14.1/-94.1
3) 3G-DHA010M11-QNH/0/-14.1/-94.1
4) 3G-DHA008M11-QNH/190/-14.7/-94.7
5) 3G-HHA001M11-QNH/5/-15.2/-95.2
Top1_SC = 32
Top1_EcNo = -13.97
Top1_RSCP = -93.94501
“Zoom in” on polluted area
Powered by www.agileto.com
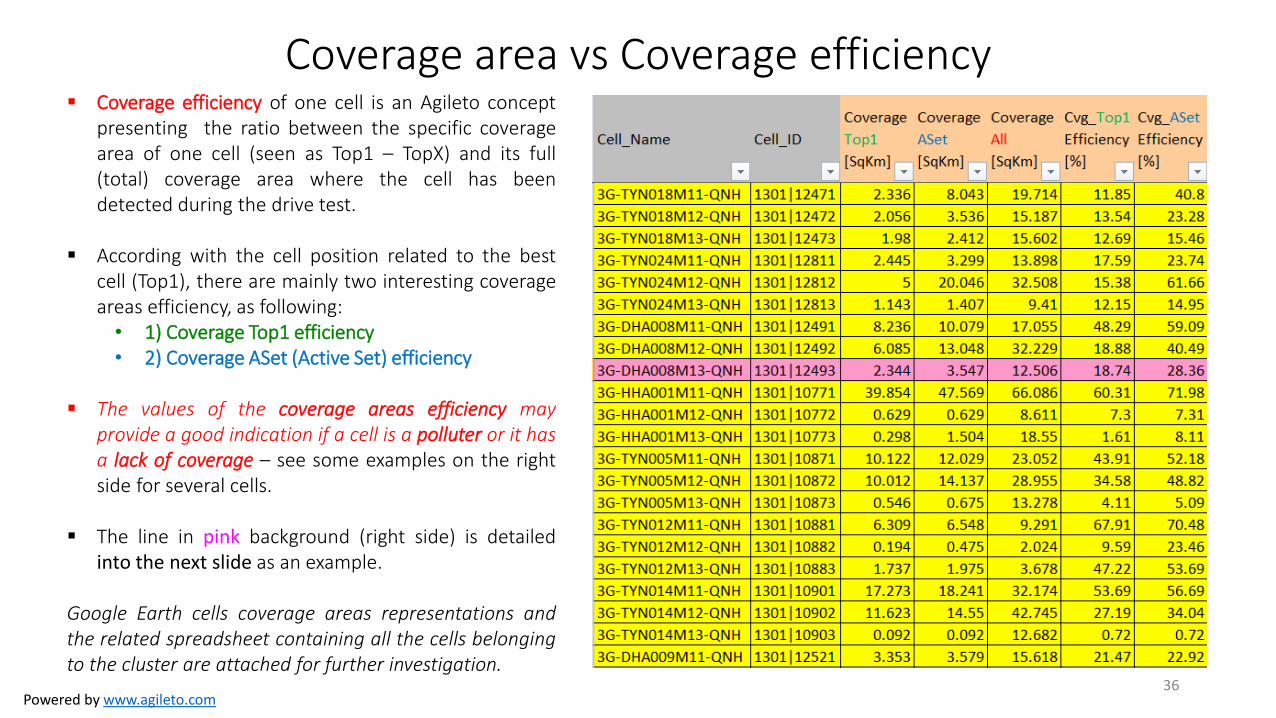
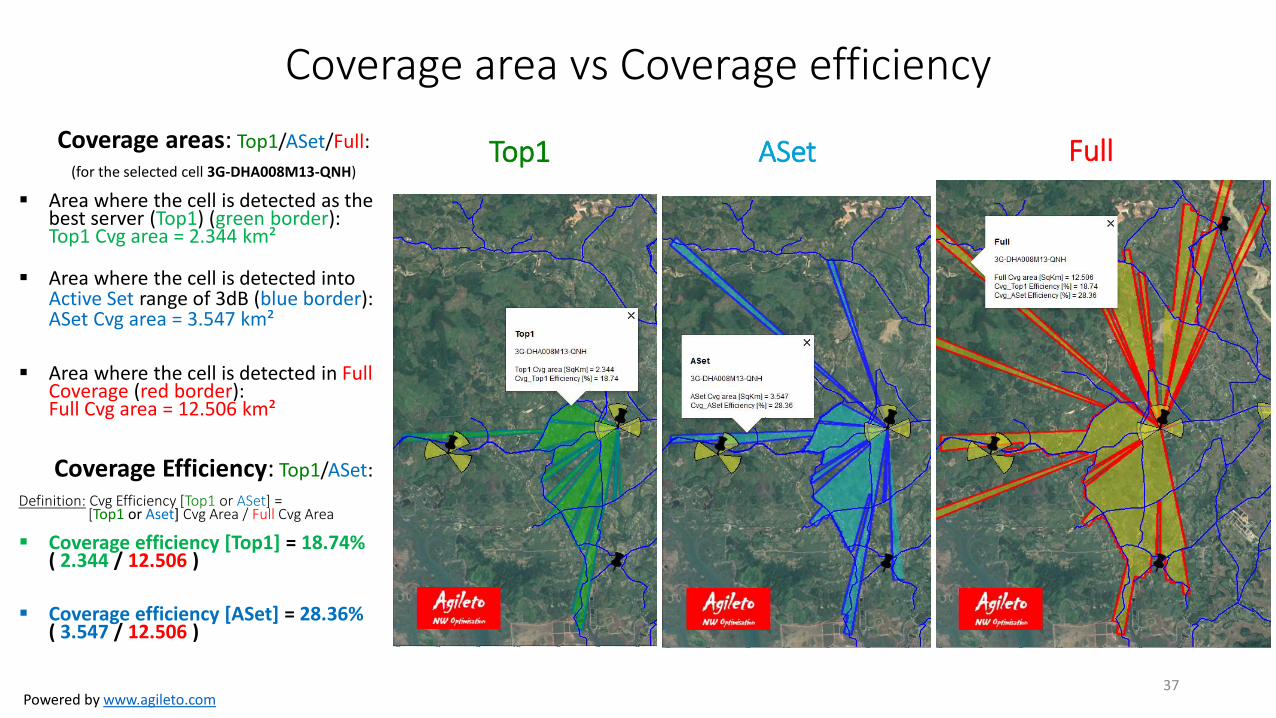
Coverage area vs Coverage efficiency Coverage efficiency of one cell is an Agileto concept
presenting the ratio between the specific coverage area of one cell (seen as Top1 – TopX) and its full (total) coverage area where the cell has been detected during the drive test.
According with the cell position related to the best cell (Top1), there are mainly two interesting coverage areas efficiency, as following: • 1) Coverage Top1 efficiency • 2) Coverage ASet (Active Set) efficiency
The values of the coverage areas efficiency may
provide a good indication if a cell is a polluter or it has a lack of coverage – see some examples on the right side for several cells.
The line in pink background (right side) is detailed into the next slide as an example.
Google Earth cells coverage areas representations and the related spreadsheet containing all the cells belonging to the cluster are attached for further investigation.
36
Powered by www.agileto.com
Coverage areas: Top1/ASet/Full:
(for the selected cell 3G-DHA008M13-QNH)
Area where the cell is detected as the best server (Top1) (green border): Top1 Cvg area = 2.344 km²
Area where the cell is detected into Active Set range of 3dB (blue border): ASet Cvg area = 3.547 km²
Area where the cell is detected in Full Coverage (red border): Full Cvg area = 12.506 km²
Coverage Efficiency: Top1/ASet:
Definition: Cvg Efficiency [Top1 or ASet] = [Top1 or Aset] Cvg Area / Full Cvg Area
Coverage efficiency [Top1] = 18.74% ( 2.344 / 12.506 )
Coverage efficiency [ASet] = 28.36% ( 3.547 / 12.506 )
37
Coverage area vs Coverage efficiency
Top1 ASet Full
Powered by www.agileto.com
OS
Number
Nr of Cells
Affected
per OS
OS RNC
(Overshooter)
OS
LocalCID
Overshooter
CellNameOS SC
Region
Overshooter
1 11 RN1301E 130110653 3G-MCI048M13-QNH 315 Cluster_QNH_12
2 8 RN1301E 130112202 3G-MCI009M12-QNH 465 Cluster_QNH_12
3 7 RN1301E 130110301 3G-BLU003M11-QNH 473 Cluster_QNH_08
4 7 RN1301E 130110802 3G-DHA012M12-QNH 12 Cluster_QNH_07
5 6 RN1301E 130112802 3G-DHA010M12-QNH 8 Cluster_QNH_07
6 6 RN1301E 130112453 3G-MCI026M13-QNH 167 Cluster_QNH_12
7 6 RN1301E 130112663 3G-MCI033M13-QNH 313 Cluster_QNH_11
8 6 RN1301E 130110773 3G-HHA001M13-QNH 7 Cluster_QNH_07
9 5 RN1301E 130112323 3G-MCI018M13-QNH 175 Cluster_QNH_12
10 5 RN1301E 130110353 3G-TYN008M13-QNH 112 Cluster_QNH_06
11 5 RN1301E 130112183 3G-MCI007M13-QNH 458 Cluster_QNH_12
12 5 RN1301E 130112333 3G-MCI019M13-QNH 367 Cluster_QNH_12
13 5 RN1301E 130112153 3G-MCI004M13-QNH 439 Cluster_QNH_12
14 5 RN1301E 130110533 3G-HHA017M13-QNH 386 Cluster_QNH_09
15 4 RN1301E 130110351 3G-TYN008M11-QNH 110 Cluster_QNH_06
16 4 RN1301E 130112392 3G-TYN016M12-QNH 123 Cluster_QNH_06
17 4 RN1301E 130110431 3G-TYN004M11-QNH 107 Cluster_QNH_06
18 4 RN1301E 130112372 3G-TYN015M12-QNH 120 Cluster_QNH_06
19 4 RN1301E 130110352 3G-TYN008M12-QNH 111 Cluster_QNH_06
20 3 RN1301E 130112471 3G-TYN018M11-QNH 337 Cluster_QNH_07
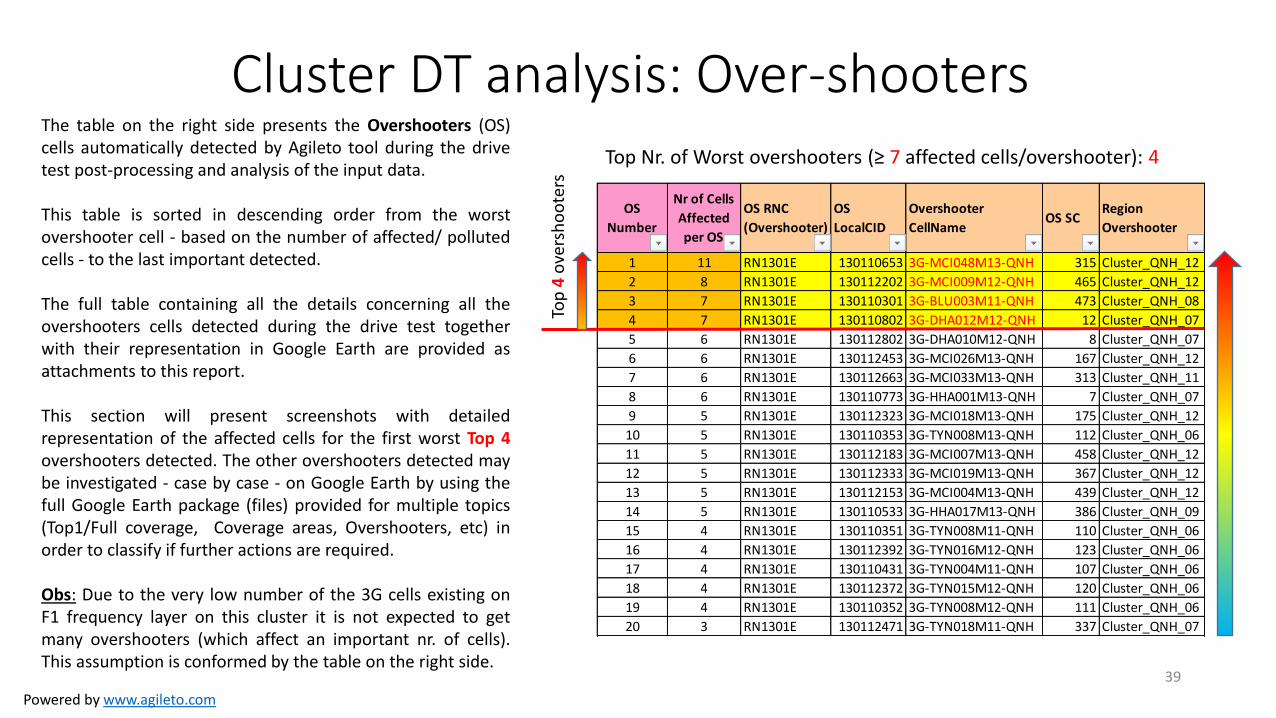
Cluster DT analysis: Over-shooters Top Nr. of Worst overshooters (≥ 7 affected cells/overshooter): 4
39
Top
4 o
vers
ho
ote
rs
The table on the right side presents the Overshooters (OS) cells automatically detected by Agileto tool during the drive test post-processing and analysis of the input data. This table is sorted in descending order from the worst overshooter cell - based on the number of affected/ polluted cells - to the last important detected. The full table containing all the details concerning all the overshooters cells detected during the drive test together with their representation in Google Earth are provided as attachments to this report. This section will present screenshots with detailed representation of the affected cells for the first worst Top 4 overshooters detected. The other overshooters detected may be investigated - case by case - on Google Earth by using the full Google Earth package (files) provided for multiple topics (Top1/Full coverage, Coverage areas, Overshooters, etc) in order to classify if further actions are required. Obs: Due to the very low number of the 3G cells existing on F1 frequency layer on this cluster it is not expected to get many overshooters (which affect an important nr. of cells). This assumption is conformed by the table on the right side.
Powered by www.agileto.com
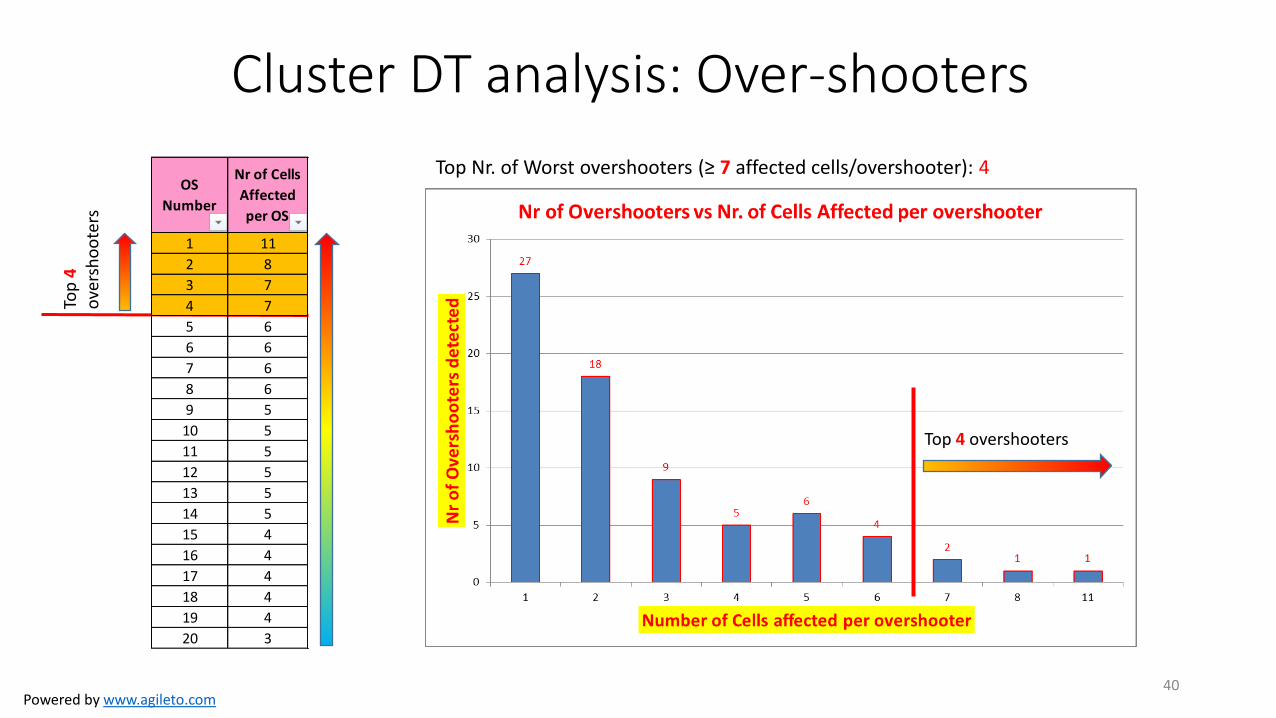
Cluster DT analysis: Over-shooters
Top Nr. of Worst overshooters (≥ 7 affected cells/overshooter): 4
40
Top
4
ove
rsh
oo
ters
OS
Number
Nr of Cells
Affected
per OS
1 11
2 8
3 7
4 7
5 6
6 6
7 6
8 6
9 5
10 5
11 5
12 5
13 5
14 5
15 4
16 4
17 4
18 4
19 4
20 3
Top 4 overshooters
Powered by www.agileto.com
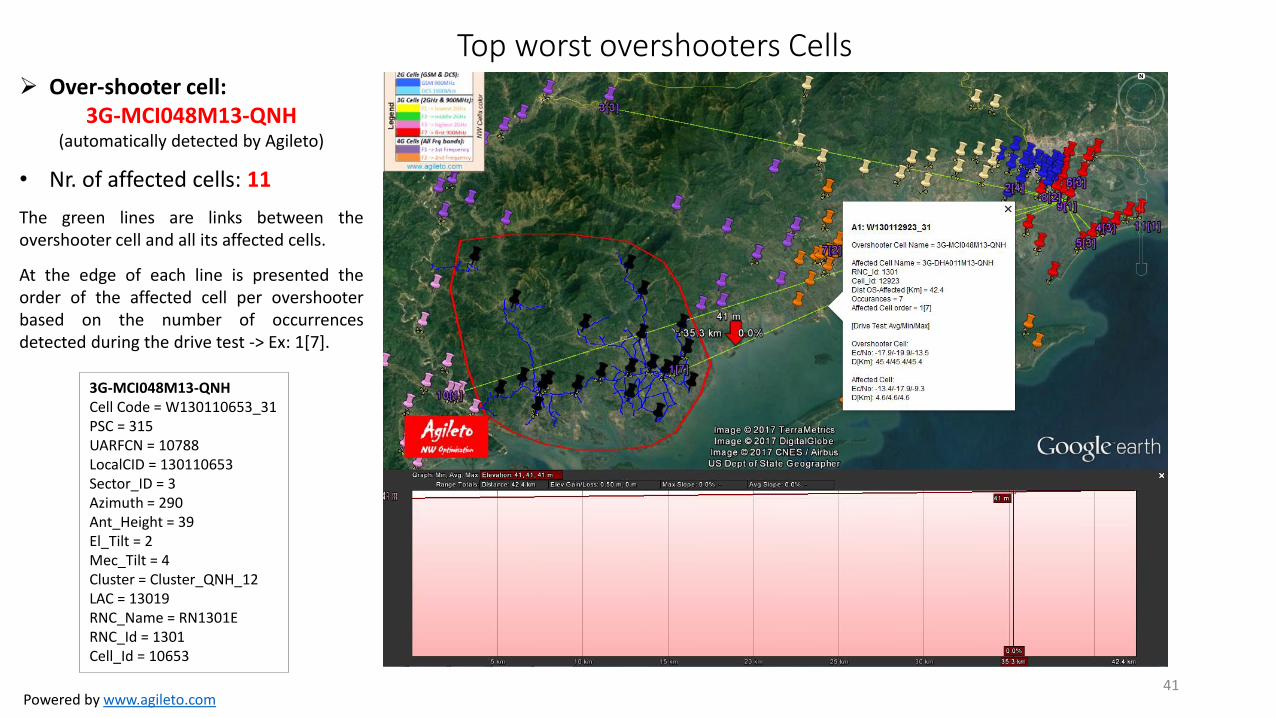
Over-shooter cell: 3G-MCI048M13-QNH
(automatically detected by Agileto)
• Nr. of affected cells: 11
The green lines are links between the overshooter cell and all its affected cells.
At the edge of each line is presented the order of the affected cell per overshooter based on the number of occurrences detected during the drive test -> Ex: 1[7].
Top worst overshooters Cells
3G-MCI048M13-QNH Cell Code = W130110653_31 PSC = 315 UARFCN = 10788 LocalCID = 130110653 Sector_ID = 3 Azimuth = 290 Ant_Height = 39 El_Tilt = 2 Mec_Tilt = 4 Cluster = Cluster_QNH_12 LAC = 13019 RNC_Name = RN1301E RNC_Id = 1301 Cell_Id = 10653
41
Powered by www.agileto.com
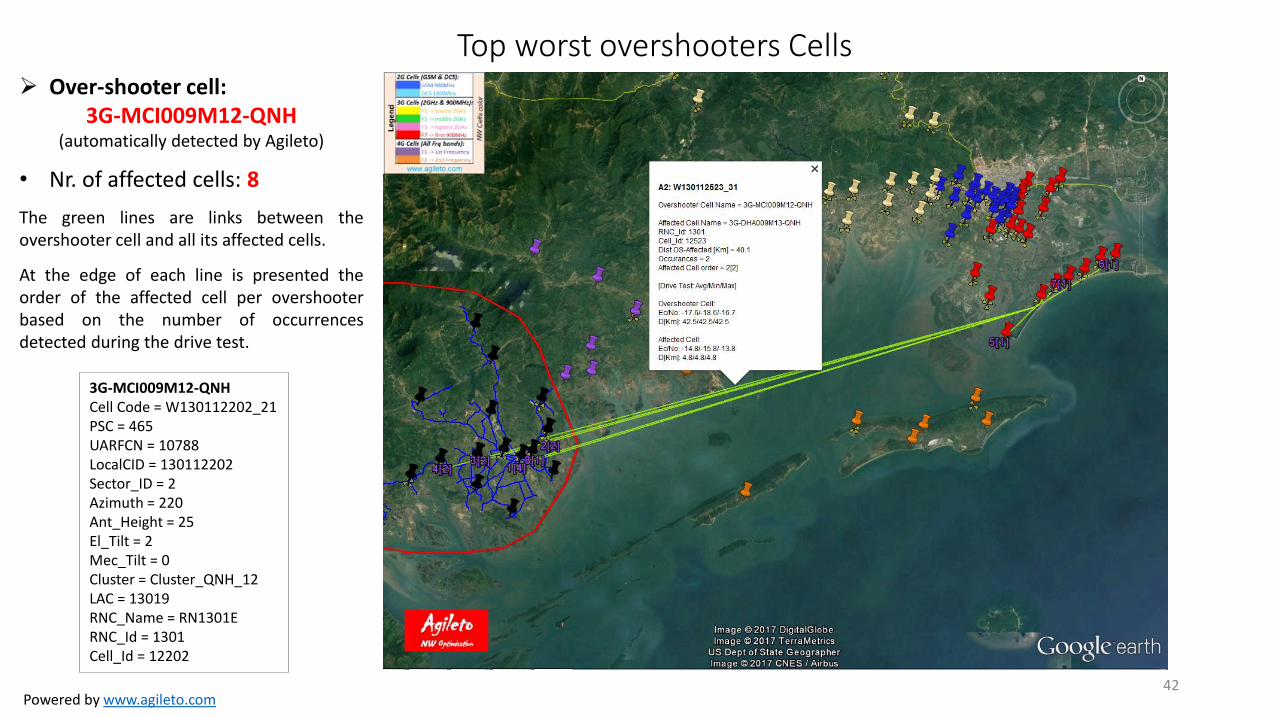
Over-shooter cell: 3G-MCI009M12-QNH
(automatically detected by Agileto)
• Nr. of affected cells: 8
The green lines are links between the overshooter cell and all its affected cells.
At the edge of each line is presented the order of the affected cell per overshooter based on the number of occurrences detected during the drive test.
Top worst overshooters Cells
3G-MCI009M12-QNH Cell Code = W130112202_21 PSC = 465 UARFCN = 10788 LocalCID = 130112202 Sector_ID = 2 Azimuth = 220 Ant_Height = 25 El_Tilt = 2 Mec_Tilt = 0 Cluster = Cluster_QNH_12 LAC = 13019 RNC_Name = RN1301E RNC_Id = 1301 Cell_Id = 12202
42
Powered by www.agileto.com
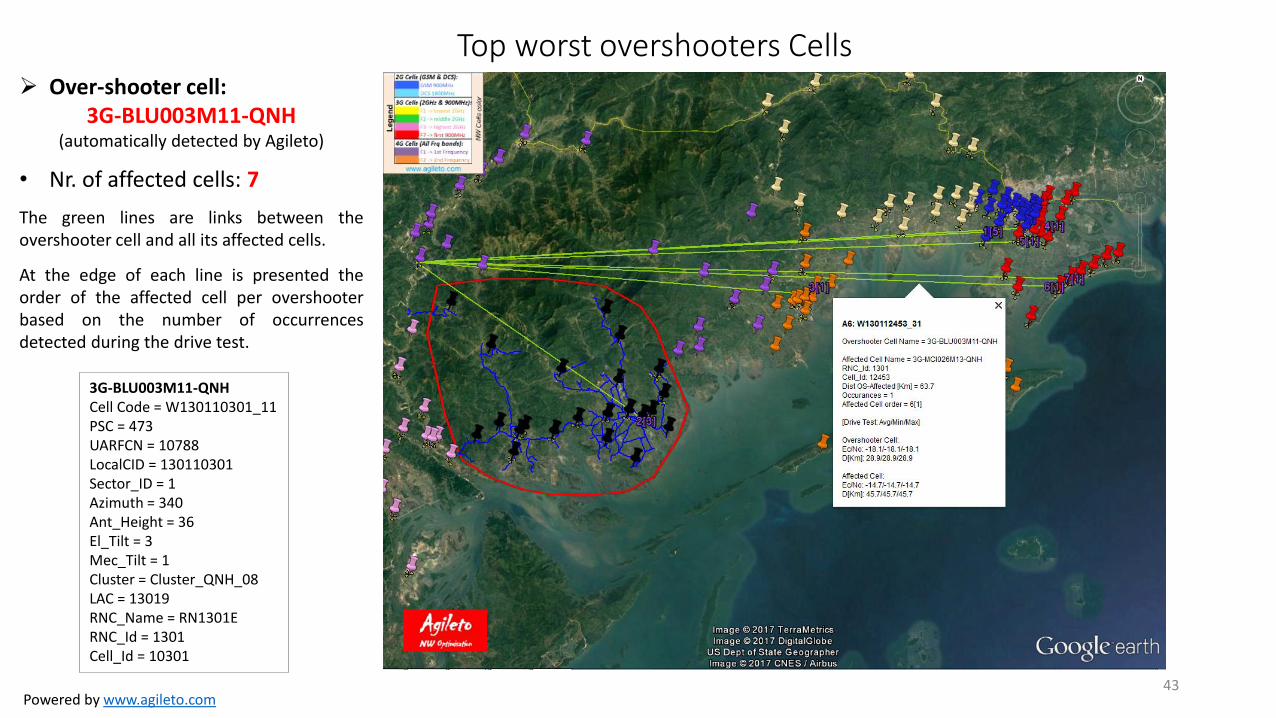
Over-shooter cell: 3G-BLU003M11-QNH
(automatically detected by Agileto)
• Nr. of affected cells: 7
The green lines are links between the overshooter cell and all its affected cells.
At the edge of each line is presented the order of the affected cell per overshooter based on the number of occurrences detected during the drive test.
Top worst overshooters Cells
3G-BLU003M11-QNH Cell Code = W130110301_11 PSC = 473 UARFCN = 10788 LocalCID = 130110301 Sector_ID = 1 Azimuth = 340 Ant_Height = 36 El_Tilt = 3 Mec_Tilt = 1 Cluster = Cluster_QNH_08 LAC = 13019 RNC_Name = RN1301E RNC_Id = 1301 Cell_Id = 10301
43
Powered by www.agileto.com
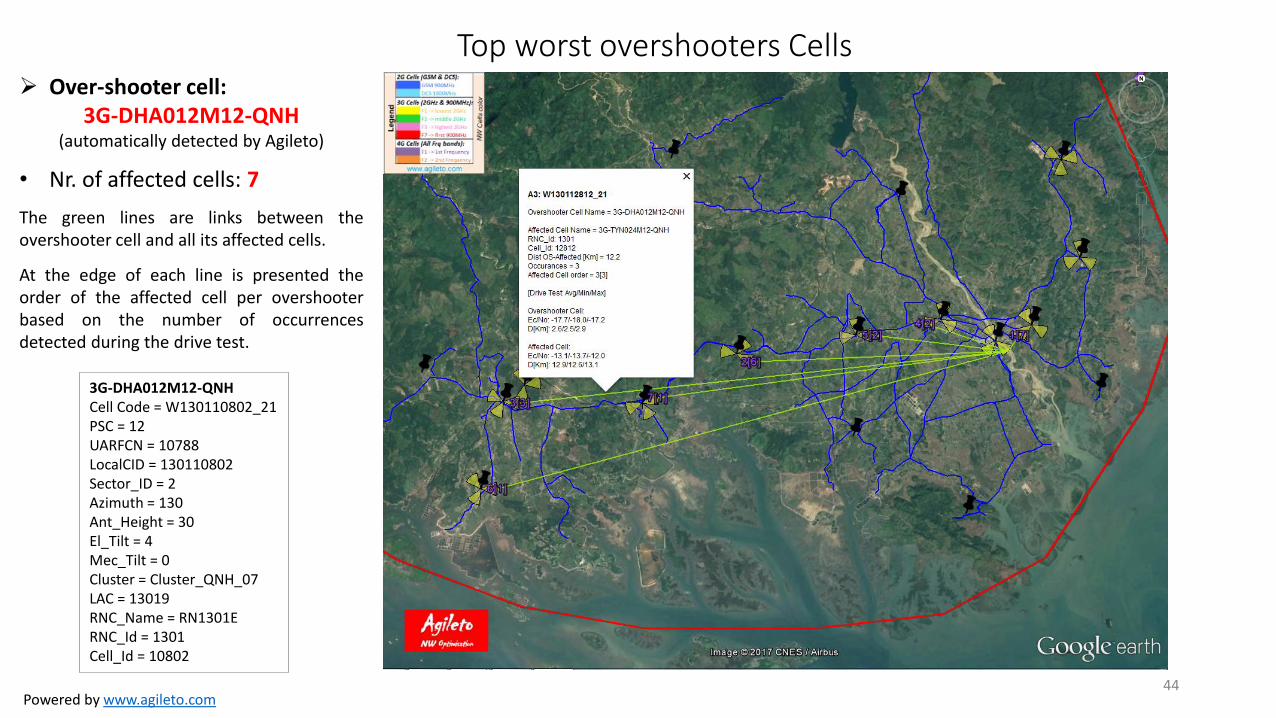
Over-shooter cell: 3G-DHA012M12-QNH
(automatically detected by Agileto)
• Nr. of affected cells: 7
The green lines are links between the overshooter cell and all its affected cells.
At the edge of each line is presented the order of the affected cell per overshooter based on the number of occurrences detected during the drive test.
Top worst overshooters Cells
3G-DHA012M12-QNH Cell Code = W130110802_21 PSC = 12 UARFCN = 10788 LocalCID = 130110802 Sector_ID = 2 Azimuth = 130 Ant_Height = 30 El_Tilt = 4 Mec_Tilt = 0 Cluster = Cluster_QNH_07 LAC = 13019 RNC_Name = RN1301E RNC_Id = 1301 Cell_Id = 10802
44
Powered by www.agileto.com
Missing Neighbors: 1) IntraFq 2) InterFq
3) InterRAT
45
Neighbors audit and optimization analysis have been performed based on the Drive Test input data and the results have been compared with the neighbors declarations detected into OMC/OSS snapshot/dump files. The complete neighbor results (Detected/Missing/Not Detected) provided by Agileto tool after post-processing the drive test input data are provided as attachments to this report, as following: IntraFreq: 3G3G_F1F1, InterFreq: 3G3G_F1F2 + 3G3G_F1F7, InterRAT: 3G2G_F1GSM There are provided as well the Google Earth files containing the neighbors representation where the neighbors results from the tabular format may be visualized in Google Earth environment for supplementary checking if desired (missing neighbors are represented with red). Supplementary, the simulation movie along the drive test route representing the radio links between each drive test measurement point and all the Cells from ASet is provided (where the missing neighbors are provided with red colors) an it may run in Google Earth (GE) environment as so called “Tour”. If desired, this movie may be accessed in GE and used like an ordinary movie with Play/Pause/FastForward, etc in order to arrive quickly to investigate the desired area around a specific timestamp.
Powered by www.agileto.com
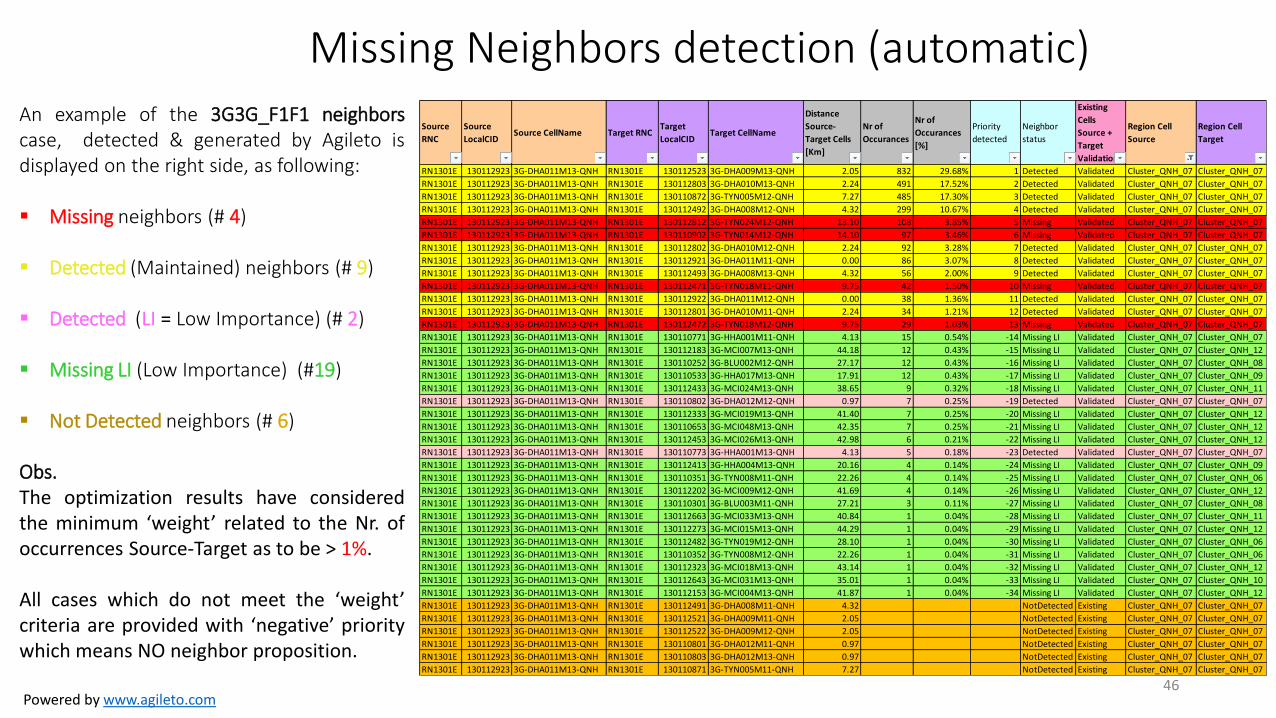
Missing Neighbors detection (automatic) An example of the 3G3G_F1F1 neighbors case, detected & generated by Agileto is displayed on the right side, as following:
Missing neighbors (# 4)
Detected (Maintained) neighbors (# 9)
Detected (LI = Low Importance) (# 2)
Missing LI (Low Importance) (#19)
Not Detected neighbors (# 6) Obs. The optimization results have considered the minimum ‘weight’ related to the Nr. of occurrences Source-Target as to be > 1%. All cases which do not meet the ‘weight’ criteria are provided with ‘negative’ priority which means NO neighbor proposition.
46
Source
RNC
Source
LocalCIDSource CellName Target RNC
Target
LocalCIDTarget CellName
Distance
Source-
Target Cells
[Km]
Nr of
Occurances
Nr of
Occurances
[%]
Priority
detected
Neighbor
status
Existing
Cells
Source +
Target
Validation
Region Cell
Source
Region Cell
Target
RN1301E 130112923 3G-DHA011M13-QNH RN1301E 130112523 3G-DHA009M13-QNH 2.05 832 29.68% 1 Detected Validated Cluster_QNH_07 Cluster_QNH_07
RN1301E 130112923 3G-DHA011M13-QNH RN1301E 130112803 3G-DHA010M13-QNH 2.24 491 17.52% 2 Detected Validated Cluster_QNH_07 Cluster_QNH_07
RN1301E 130112923 3G-DHA011M13-QNH RN1301E 130110872 3G-TYN005M12-QNH 7.27 485 17.30% 3 Detected Validated Cluster_QNH_07 Cluster_QNH_07
RN1301E 130112923 3G-DHA011M13-QNH RN1301E 130112492 3G-DHA008M12-QNH 4.32 299 10.67% 4 Detected Validated Cluster_QNH_07 Cluster_QNH_07
RN1301E 130112923 3G-DHA011M13-QNH RN1301E 130112812 3G-TYN024M12-QNH 13.10 108 3.85% 5 Missing Validated Cluster_QNH_07 Cluster_QNH_07
RN1301E 130112923 3G-DHA011M13-QNH RN1301E 130110902 3G-TYN014M12-QNH 14.10 97 3.46% 6 Missing Validated Cluster_QNH_07 Cluster_QNH_07
RN1301E 130112923 3G-DHA011M13-QNH RN1301E 130112802 3G-DHA010M12-QNH 2.24 92 3.28% 7 Detected Validated Cluster_QNH_07 Cluster_QNH_07
RN1301E 130112923 3G-DHA011M13-QNH RN1301E 130112921 3G-DHA011M11-QNH 0.00 86 3.07% 8 Detected Validated Cluster_QNH_07 Cluster_QNH_07
RN1301E 130112923 3G-DHA011M13-QNH RN1301E 130112493 3G-DHA008M13-QNH 4.32 56 2.00% 9 Detected Validated Cluster_QNH_07 Cluster_QNH_07
RN1301E 130112923 3G-DHA011M13-QNH RN1301E 130112471 3G-TYN018M11-QNH 9.75 42 1.50% 10 Missing Validated Cluster_QNH_07 Cluster_QNH_07
RN1301E 130112923 3G-DHA011M13-QNH RN1301E 130112922 3G-DHA011M12-QNH 0.00 38 1.36% 11 Detected Validated Cluster_QNH_07 Cluster_QNH_07
RN1301E 130112923 3G-DHA011M13-QNH RN1301E 130112801 3G-DHA010M11-QNH 2.24 34 1.21% 12 Detected Validated Cluster_QNH_07 Cluster_QNH_07
RN1301E 130112923 3G-DHA011M13-QNH RN1301E 130112472 3G-TYN018M12-QNH 9.75 29 1.03% 13 Missing Validated Cluster_QNH_07 Cluster_QNH_07
RN1301E 130112923 3G-DHA011M13-QNH RN1301E 130110771 3G-HHA001M11-QNH 4.13 15 0.54% -14 Missing LI Validated Cluster_QNH_07 Cluster_QNH_07
RN1301E 130112923 3G-DHA011M13-QNH RN1301E 130112183 3G-MCI007M13-QNH 44.18 12 0.43% -15 Missing LI Validated Cluster_QNH_07 Cluster_QNH_12
RN1301E 130112923 3G-DHA011M13-QNH RN1301E 130110252 3G-BLU002M12-QNH 27.17 12 0.43% -16 Missing LI Validated Cluster_QNH_07 Cluster_QNH_08
RN1301E 130112923 3G-DHA011M13-QNH RN1301E 130110533 3G-HHA017M13-QNH 17.91 12 0.43% -17 Missing LI Validated Cluster_QNH_07 Cluster_QNH_09
RN1301E 130112923 3G-DHA011M13-QNH RN1301E 130112433 3G-MCI024M13-QNH 38.65 9 0.32% -18 Missing LI Validated Cluster_QNH_07 Cluster_QNH_11
RN1301E 130112923 3G-DHA011M13-QNH RN1301E 130110802 3G-DHA012M12-QNH 0.97 7 0.25% -19 Detected Validated Cluster_QNH_07 Cluster_QNH_07
RN1301E 130112923 3G-DHA011M13-QNH RN1301E 130112333 3G-MCI019M13-QNH 41.40 7 0.25% -20 Missing LI Validated Cluster_QNH_07 Cluster_QNH_12
RN1301E 130112923 3G-DHA011M13-QNH RN1301E 130110653 3G-MCI048M13-QNH 42.35 7 0.25% -21 Missing LI Validated Cluster_QNH_07 Cluster_QNH_12
RN1301E 130112923 3G-DHA011M13-QNH RN1301E 130112453 3G-MCI026M13-QNH 42.98 6 0.21% -22 Missing LI Validated Cluster_QNH_07 Cluster_QNH_12
RN1301E 130112923 3G-DHA011M13-QNH RN1301E 130110773 3G-HHA001M13-QNH 4.13 5 0.18% -23 Detected Validated Cluster_QNH_07 Cluster_QNH_07
RN1301E 130112923 3G-DHA011M13-QNH RN1301E 130112413 3G-HHA004M13-QNH 20.16 4 0.14% -24 Missing LI Validated Cluster_QNH_07 Cluster_QNH_09
RN1301E 130112923 3G-DHA011M13-QNH RN1301E 130110351 3G-TYN008M11-QNH 22.26 4 0.14% -25 Missing LI Validated Cluster_QNH_07 Cluster_QNH_06
RN1301E 130112923 3G-DHA011M13-QNH RN1301E 130112202 3G-MCI009M12-QNH 41.69 4 0.14% -26 Missing LI Validated Cluster_QNH_07 Cluster_QNH_12
RN1301E 130112923 3G-DHA011M13-QNH RN1301E 130110301 3G-BLU003M11-QNH 27.21 3 0.11% -27 Missing LI Validated Cluster_QNH_07 Cluster_QNH_08
RN1301E 130112923 3G-DHA011M13-QNH RN1301E 130112663 3G-MCI033M13-QNH 40.84 1 0.04% -28 Missing LI Validated Cluster_QNH_07 Cluster_QNH_11
RN1301E 130112923 3G-DHA011M13-QNH RN1301E 130112273 3G-MCI015M13-QNH 44.29 1 0.04% -29 Missing LI Validated Cluster_QNH_07 Cluster_QNH_12
RN1301E 130112923 3G-DHA011M13-QNH RN1301E 130112482 3G-TYN019M12-QNH 28.10 1 0.04% -30 Missing LI Validated Cluster_QNH_07 Cluster_QNH_06
RN1301E 130112923 3G-DHA011M13-QNH RN1301E 130110352 3G-TYN008M12-QNH 22.26 1 0.04% -31 Missing LI Validated Cluster_QNH_07 Cluster_QNH_06
RN1301E 130112923 3G-DHA011M13-QNH RN1301E 130112323 3G-MCI018M13-QNH 43.14 1 0.04% -32 Missing LI Validated Cluster_QNH_07 Cluster_QNH_12
RN1301E 130112923 3G-DHA011M13-QNH RN1301E 130112643 3G-MCI031M13-QNH 35.01 1 0.04% -33 Missing LI Validated Cluster_QNH_07 Cluster_QNH_10
RN1301E 130112923 3G-DHA011M13-QNH RN1301E 130112153 3G-MCI004M13-QNH 41.87 1 0.04% -34 Missing LI Validated Cluster_QNH_07 Cluster_QNH_12
RN1301E 130112923 3G-DHA011M13-QNH RN1301E 130112491 3G-DHA008M11-QNH 4.32 NotDetected Existing Cluster_QNH_07 Cluster_QNH_07
RN1301E 130112923 3G-DHA011M13-QNH RN1301E 130112521 3G-DHA009M11-QNH 2.05 NotDetected Existing Cluster_QNH_07 Cluster_QNH_07
RN1301E 130112923 3G-DHA011M13-QNH RN1301E 130112522 3G-DHA009M12-QNH 2.05 NotDetected Existing Cluster_QNH_07 Cluster_QNH_07
RN1301E 130112923 3G-DHA011M13-QNH RN1301E 130110801 3G-DHA012M11-QNH 0.97 NotDetected Existing Cluster_QNH_07 Cluster_QNH_07
RN1301E 130112923 3G-DHA011M13-QNH RN1301E 130110803 3G-DHA012M13-QNH 0.97 NotDetected Existing Cluster_QNH_07 Cluster_QNH_07
RN1301E 130112923 3G-DHA011M13-QNH RN1301E 130110871 3G-TYN005M11-QNH 7.27 NotDetected Existing Cluster_QNH_07 Cluster_QNH_07
Powered by www.agileto.com
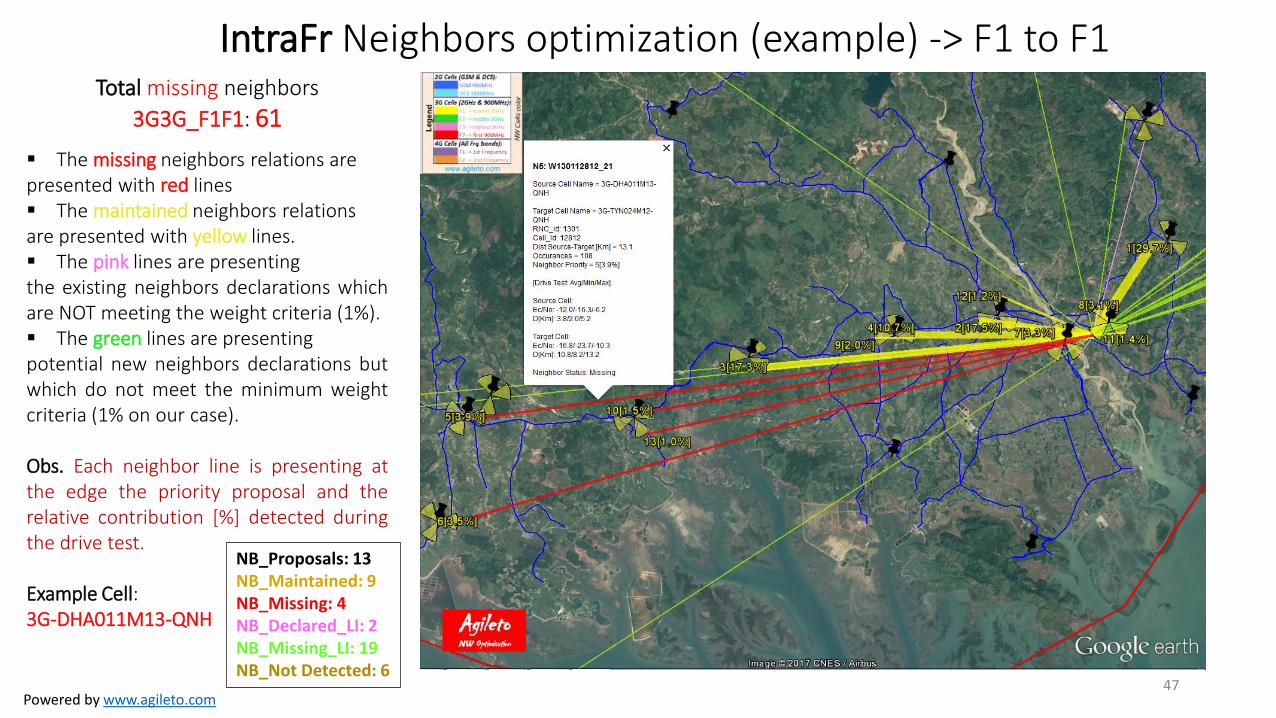
IntraFr Neighbors optimization (example) -> F1 to F1 Total missing neighbors
3G3G_F1F1: 61
The missing neighbors relations are presented with red lines The maintained neighbors relations are presented with yellow lines. The pink lines are presenting the existing neighbors declarations which are NOT meeting the weight criteria (1%). The green lines are presenting potential new neighbors declarations but which do not meet the minimum weight criteria (1% on our case). Obs. Each neighbor line is presenting at the edge the priority proposal and the relative contribution [%] detected during the drive test. Example Cell: 3G-DHA011M13-QNH
NB_Proposals: 13 NB_Maintained: 9 NB_Missing: 4 NB_Declared_LI: 2 NB_Missing_LI: 19 NB_Not Detected: 6
47
Powered by www.agileto.com
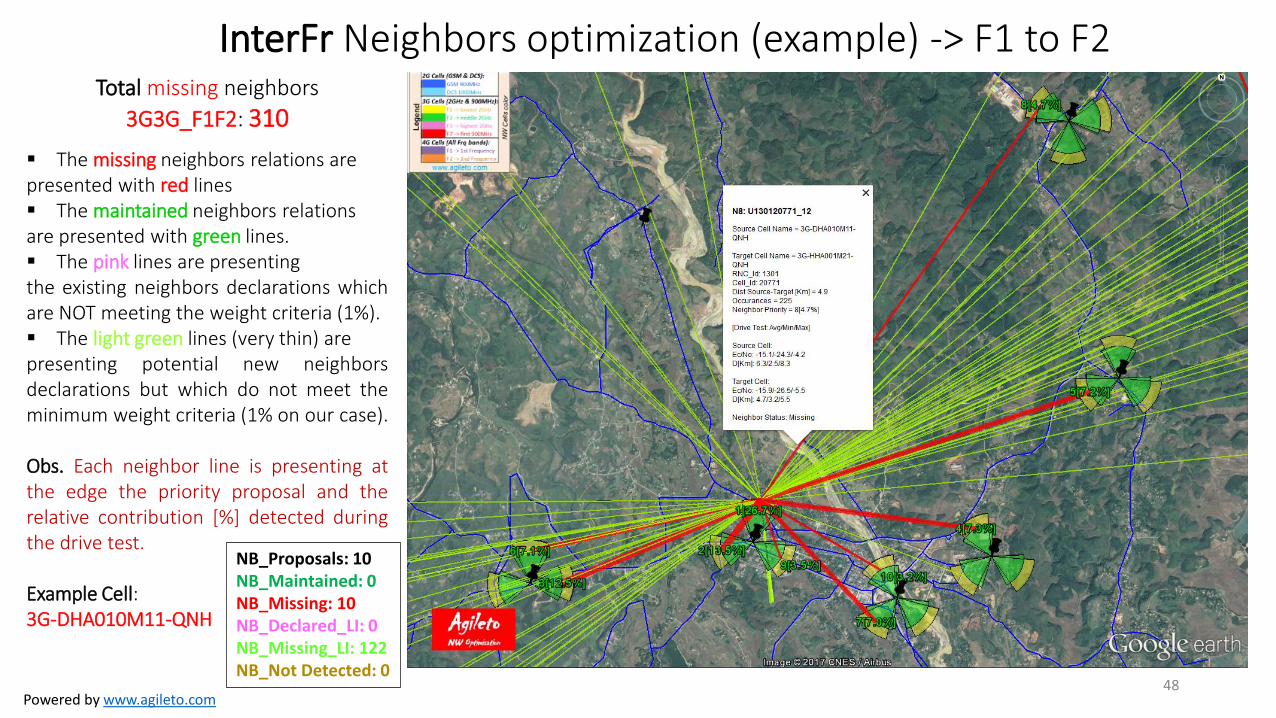
InterFr Neighbors optimization (example) -> F1 to F2 Total missing neighbors
3G3G_F1F2: 310
The missing neighbors relations are presented with red lines The maintained neighbors relations are presented with green lines. The pink lines are presenting the existing neighbors declarations which are NOT meeting the weight criteria (1%). The light green lines (very thin) are presenting potential new neighbors declarations but which do not meet the minimum weight criteria (1% on our case). Obs. Each neighbor line is presenting at the edge the priority proposal and the relative contribution [%] detected during the drive test. Example Cell: 3G-DHA010M11-QNH
NB_Proposals: 10 NB_Maintained: 0 NB_Missing: 10 NB_Declared_LI: 0 NB_Missing_LI: 122 NB_Not Detected: 0
48
Powered by www.agileto.com
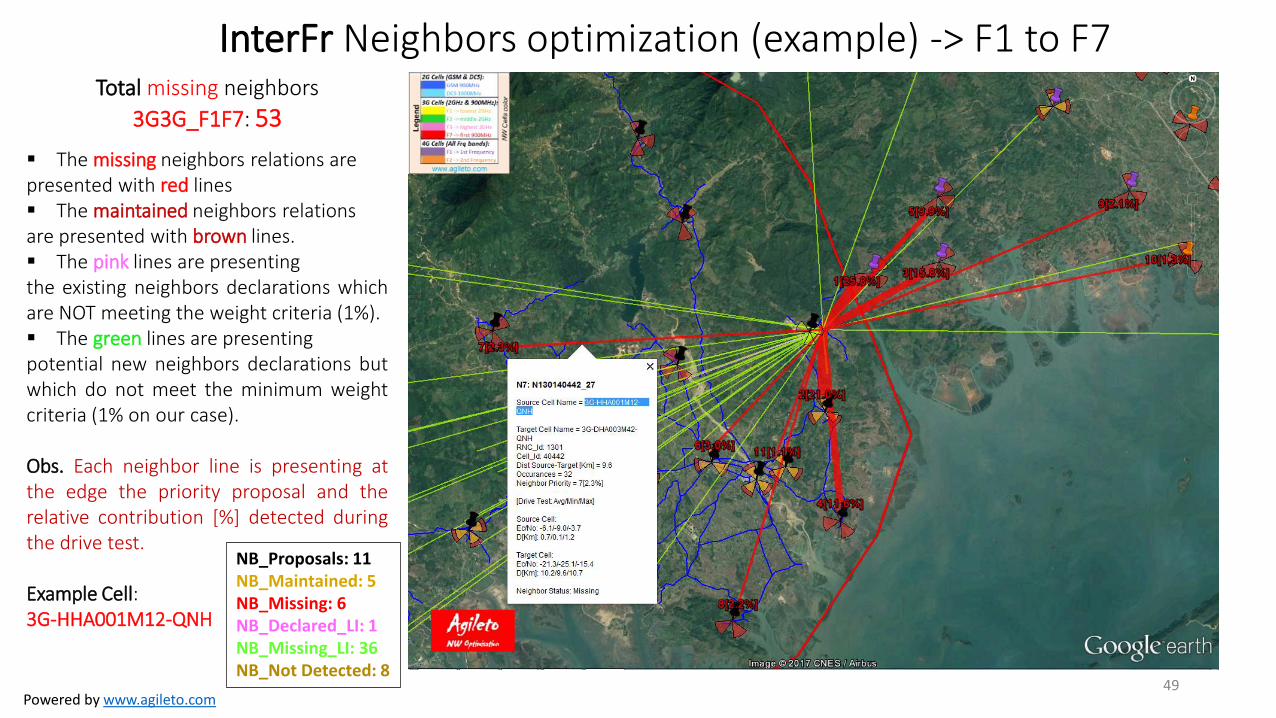
InterFr Neighbors optimization (example) -> F1 to F7 Total missing neighbors
3G3G_F1F7: 53
The missing neighbors relations are presented with red lines The maintained neighbors relations are presented with brown lines. The pink lines are presenting the existing neighbors declarations which are NOT meeting the weight criteria (1%). The green lines are presenting potential new neighbors declarations but which do not meet the minimum weight criteria (1% on our case). Obs. Each neighbor line is presenting at the edge the priority proposal and the relative contribution [%] detected during the drive test. Example Cell: 3G-HHA001M12-QNH
NB_Proposals: 11 NB_Maintained: 5 NB_Missing: 6 NB_Declared_LI: 1 NB_Missing_LI: 36 NB_Not Detected: 8
49
Powered by www.agileto.com
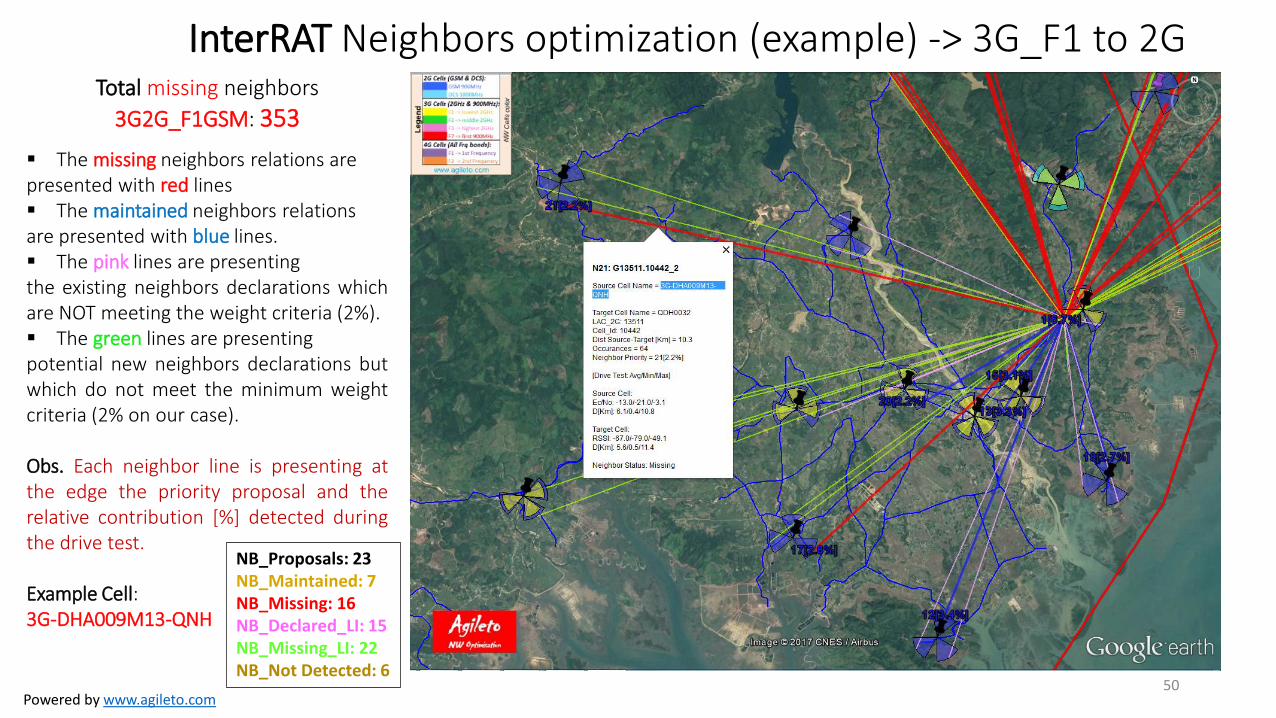
InterRAT Neighbors optimization (example) -> 3G_F1 to 2G Total missing neighbors
3G2G_F1GSM: 353
The missing neighbors relations are presented with red lines The maintained neighbors relations are presented with blue lines. The pink lines are presenting the existing neighbors declarations which are NOT meeting the weight criteria (2%). The green lines are presenting potential new neighbors declarations but which do not meet the minimum weight criteria (2% on our case). Obs. Each neighbor line is presenting at the edge the priority proposal and the relative contribution [%] detected during the drive test. Example Cell: 3G-DHA009M13-QNH
NB_Proposals: 23 NB_Maintained: 7 NB_Missing: 16 NB_Declared_LI: 15 NB_Missing_LI: 22 NB_Not Detected: 6
50
Powered by www.agileto.com
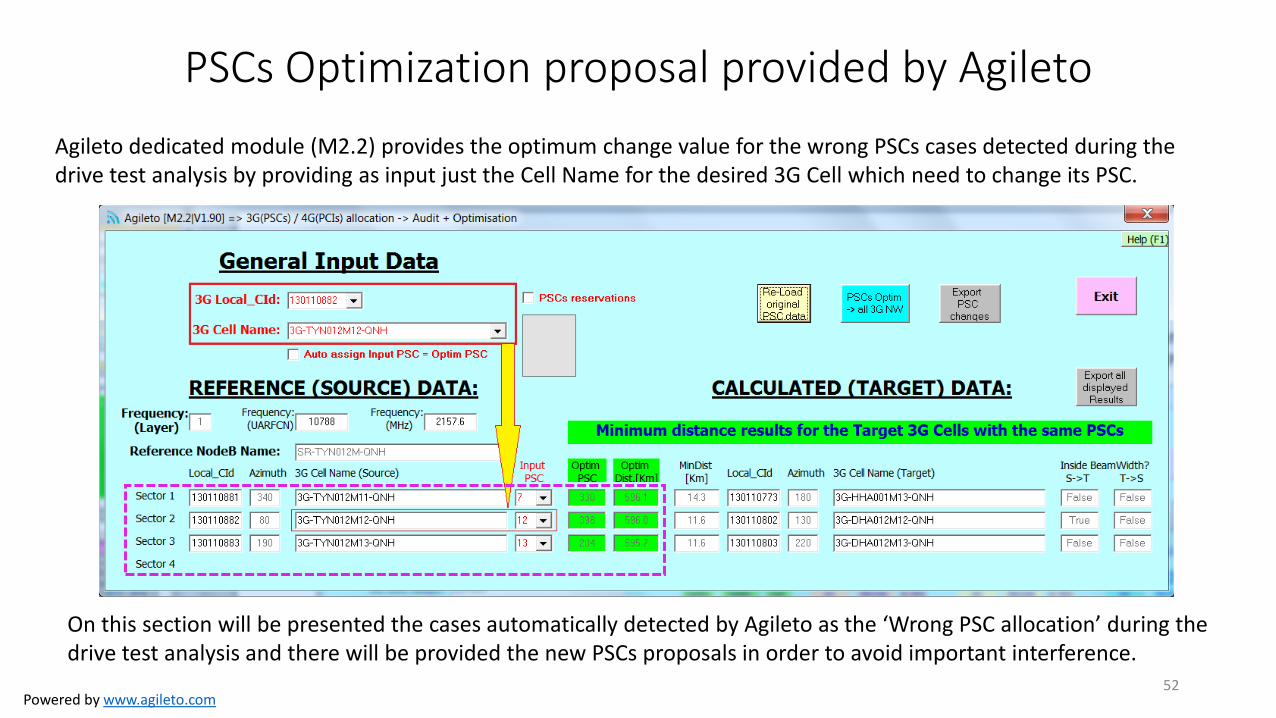
PSCs Optimization proposal provided by Agileto
Agileto dedicated module (M2.2) provides the optimum change value for the wrong PSCs cases detected during the drive test analysis by providing as input just the Cell Name for the desired 3G Cell which need to change its PSC.
52
On this section will be presented the cases automatically detected by Agileto as the ‘Wrong PSC allocation’ during the drive test analysis and there will be provided the new PSCs proposals in order to avoid important interference.
Powered by www.agileto.com
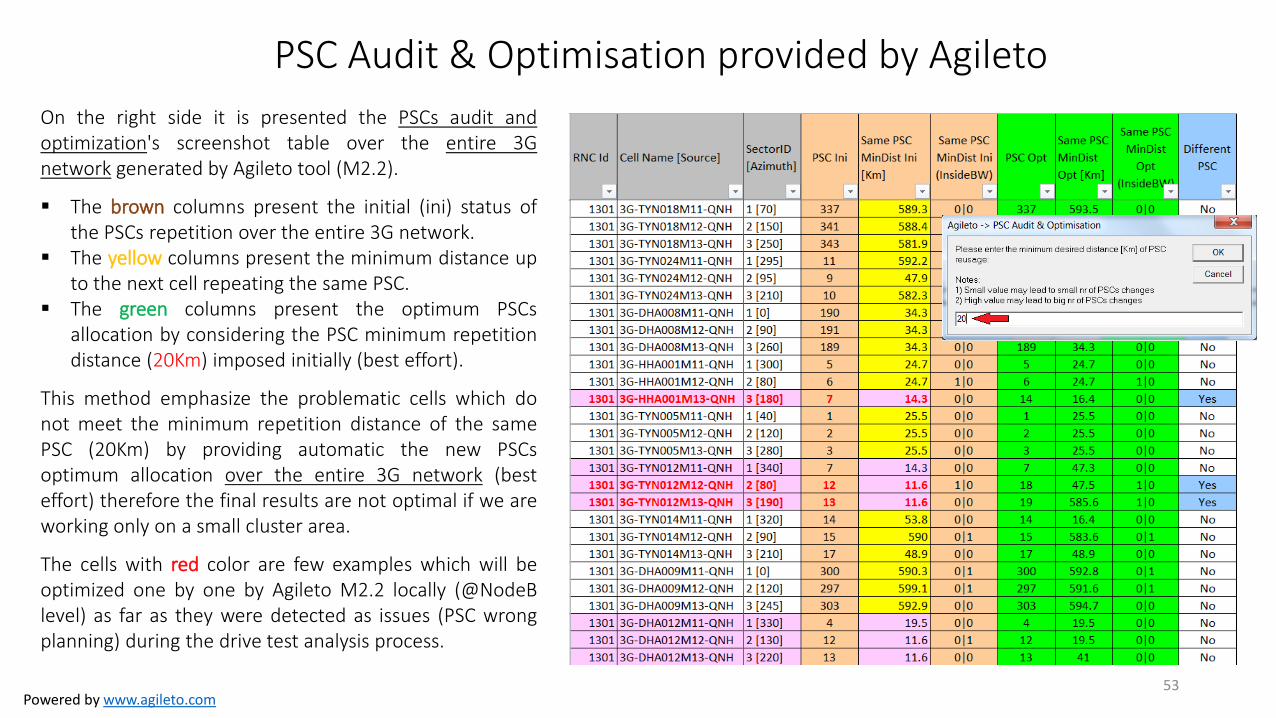
PSC Audit & Optimisation provided by Agileto
On the right side it is presented the PSCs audit and optimization's screenshot table over the entire 3G network generated by Agileto tool (M2.2).
The brown columns present the initial (ini) status of the PSCs repetition over the entire 3G network.
The yellow columns present the minimum distance up to the next cell repeating the same PSC.
The green columns present the optimum PSCs allocation by considering the PSC minimum repetition distance (20Km) imposed initially (best effort).
This method emphasize the problematic cells which do not meet the minimum repetition distance of the same PSC (20Km) by providing automatic the new PSCs optimum allocation over the entire 3G network (best effort) therefore the final results are not optimal if we are working only on a small cluster area.
The cells with red color are few examples which will be optimized one by one by Agileto M2.2 locally (@NodeB level) as far as they were detected as issues (PSC wrong planning) during the drive test analysis process.
53
Powered by www.agileto.com
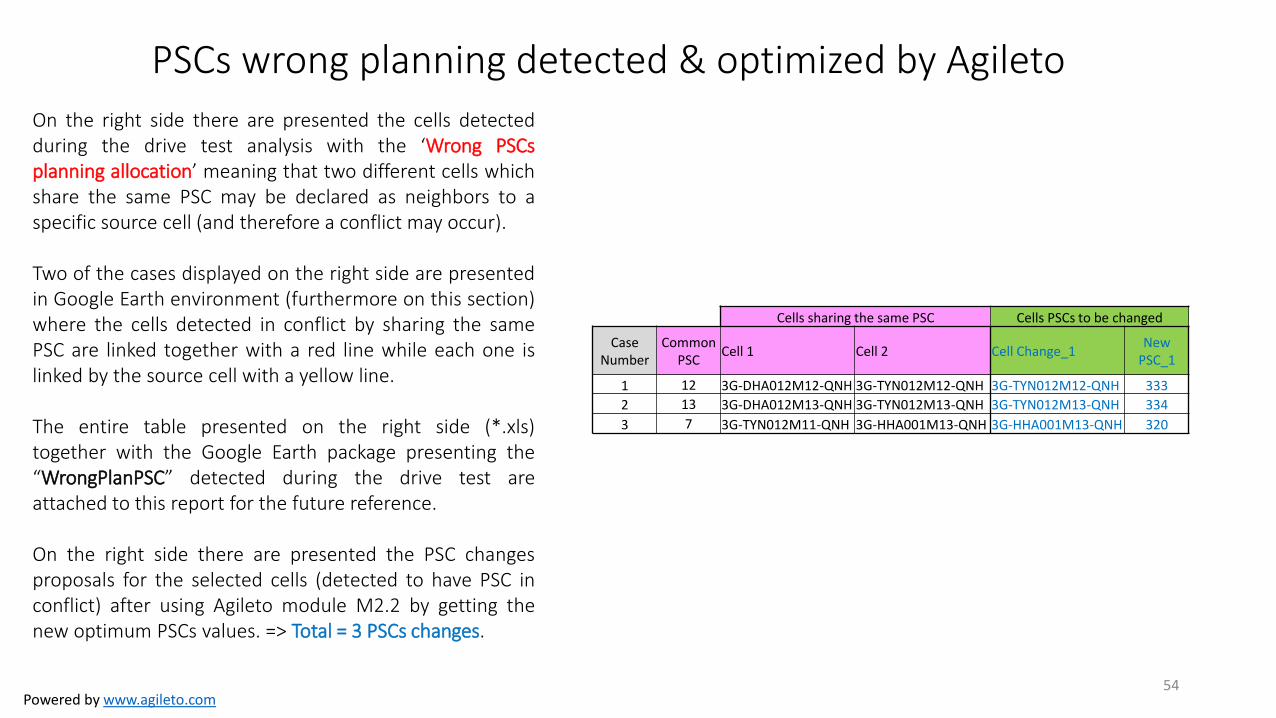
PSCs wrong planning detected & optimized by Agileto
On the right side there are presented the cells detected during the drive test analysis with the ‘Wrong PSCs planning allocation’ meaning that two different cells which share the same PSC may be declared as neighbors to a specific source cell (and therefore a conflict may occur). Two of the cases displayed on the right side are presented in Google Earth environment (furthermore on this section) where the cells detected in conflict by sharing the same PSC are linked together with a red line while each one is linked by the source cell with a yellow line. The entire table presented on the right side (*.xls) together with the Google Earth package presenting the “WrongPlanPSC” detected during the drive test are attached to this report for the future reference. On the right side there are presented the PSC changes proposals for the selected cells (detected to have PSC in conflict) after using Agileto module M2.2 by getting the new optimum PSCs values. => Total = 3 PSCs changes.
54
Cells sharing the same PSC Cells PSCs to be changed
Case Number
Common PSC
Cell 1 Cell 2 Cell Change_1 New
PSC_1
1 12 3G-DHA012M12-QNH 3G-TYN012M12-QNH 3G-TYN012M12-QNH 333
2 13 3G-DHA012M13-QNH 3G-TYN012M13-QNH 3G-TYN012M13-QNH 334
3 7 3G-TYN012M11-QNH 3G-HHA001M13-QNH 3G-HHA001M13-QNH 320
Powered by www.agileto.com
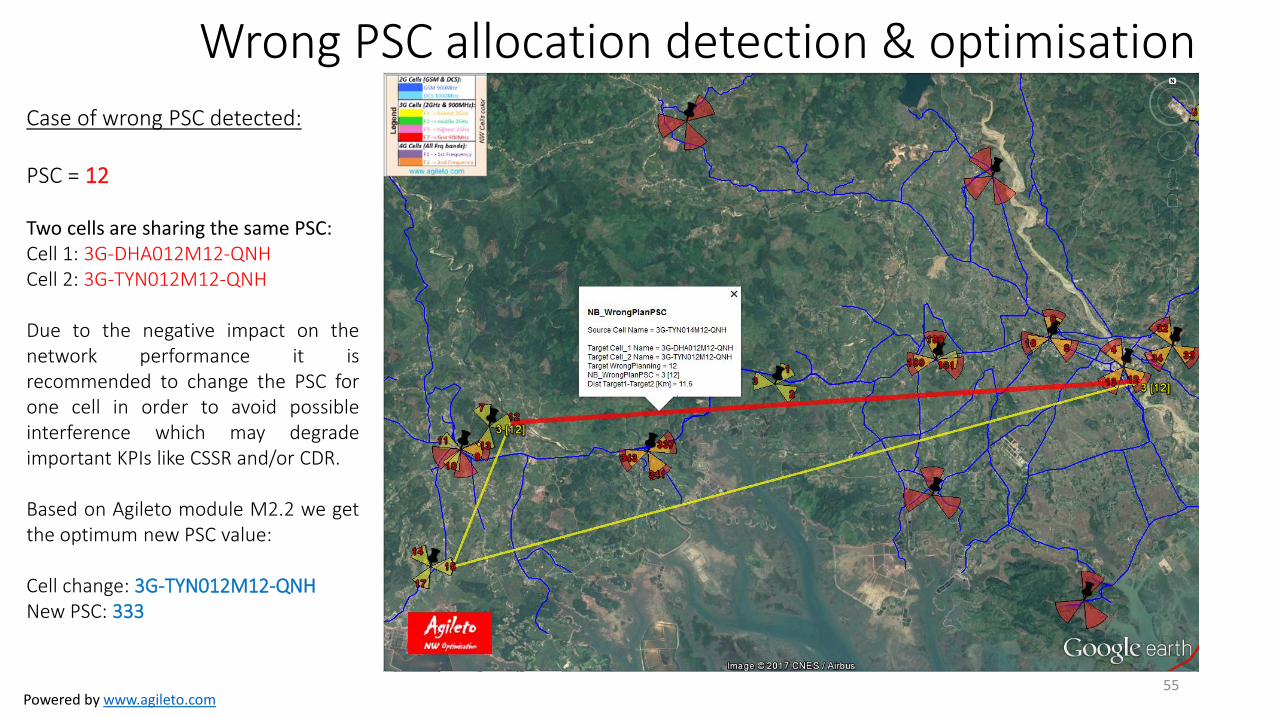
Wrong PSC allocation detection & optimisation
55
Case of wrong PSC detected:
PSC = 12 Two cells are sharing the same PSC: Cell 1: 3G-DHA012M12-QNH Cell 2: 3G-TYN012M12-QNH Due to the negative impact on the network performance it is recommended to change the PSC for one cell in order to avoid possible interference which may degrade important KPIs like CSSR and/or CDR. Based on Agileto module M2.2 we get the optimum new PSC value: Cell change: 3G-TYN012M12-QNH New PSC: 333
Powered by www.agileto.com 56
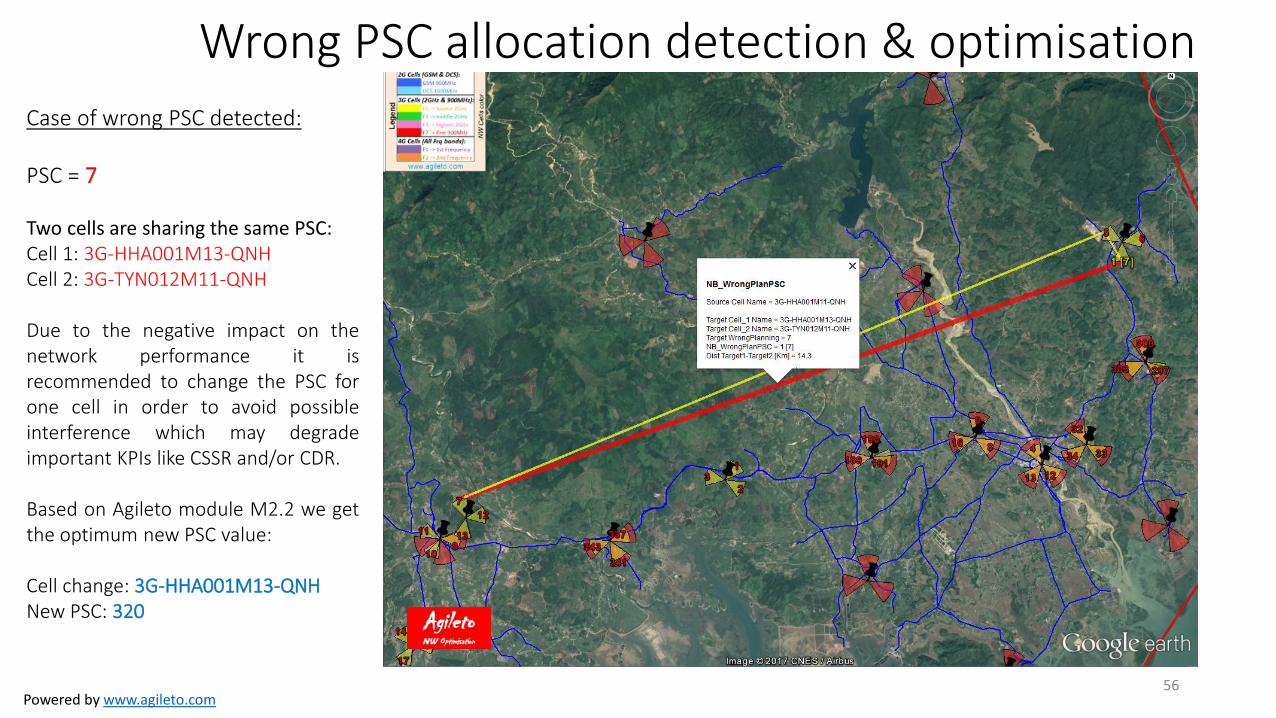
Case of wrong PSC detected:
PSC = 7 Two cells are sharing the same PSC: Cell 1: 3G-HHA001M13-QNH Cell 2: 3G-TYN012M11-QNH Due to the negative impact on the network performance it is recommended to change the PSC for one cell in order to avoid possible interference which may degrade important KPIs like CSSR and/or CDR. Based on Agileto module M2.2 we get the optimum new PSC value: Cell change: 3G-HHA001M13-QNH New PSC: 320
Wrong PSC allocation detection & optimisation
Powered by www.agileto.com
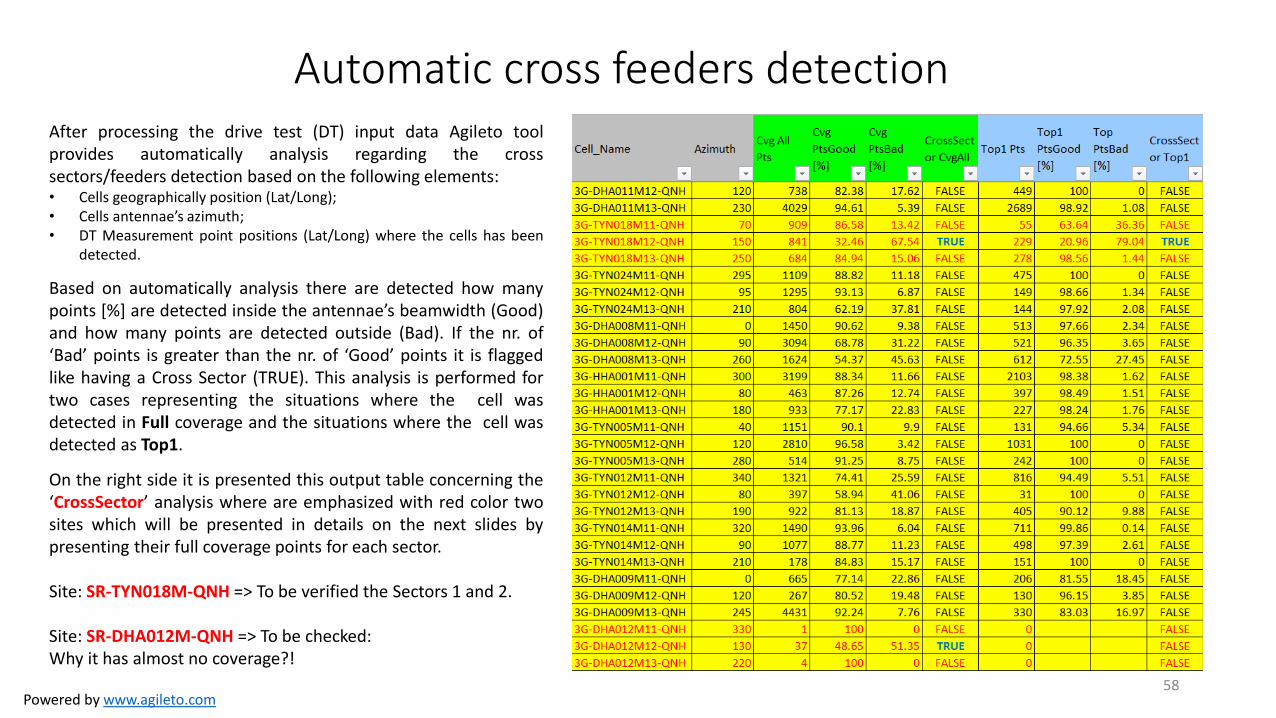
Automatic cross feeders detection After processing the drive test (DT) input data Agileto tool provides automatically analysis regarding the cross sectors/feeders detection based on the following elements: • Cells geographically position (Lat/Long); • Cells antennae’s azimuth; • DT Measurement point positions (Lat/Long) where the cells has been
detected.
Based on automatically analysis there are detected how many points [%] are detected inside the antennae’s beamwidth (Good) and how many points are detected outside (Bad). If the nr. of ‘Bad’ points is greater than the nr. of ‘Good’ points it is flagged like having a Cross Sector (TRUE). This analysis is performed for two cases representing the situations where the cell was detected in Full coverage and the situations where the cell was detected as Top1.
On the right side it is presented this output table concerning the ‘CrossSector’ analysis where are emphasized with red color two sites which will be presented in details on the next slides by presenting their full coverage points for each sector. Site: SR-TYN018M-QNH => To be verified the Sectors 1 and 2. Site: SR-DHA012M-QNH => To be checked: Why it has almost no coverage?!
58
Powered by www.agileto.com
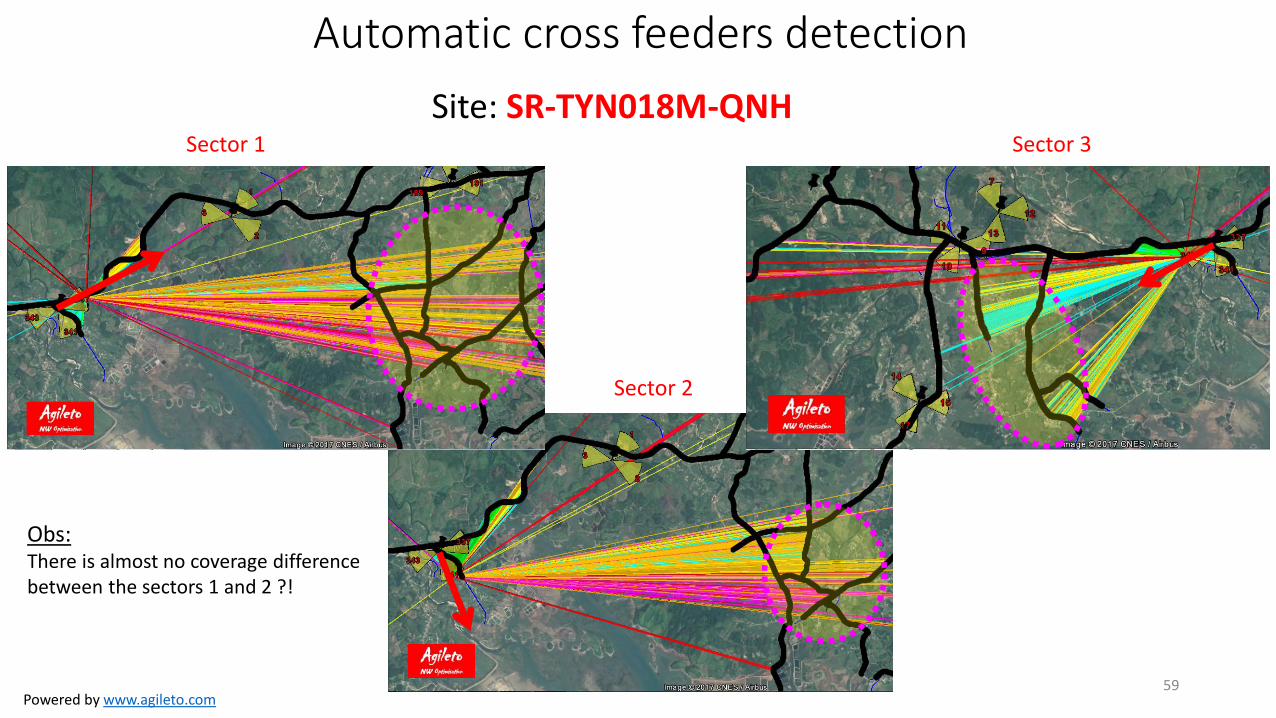
Automatic cross feeders detection
Sector 3
59
Sector 1
Sector 2
Site: SR-TYN018M-QNH
Obs: There is almost no coverage difference between the sectors 1 and 2 ?!
Powered by www.agileto.com 60
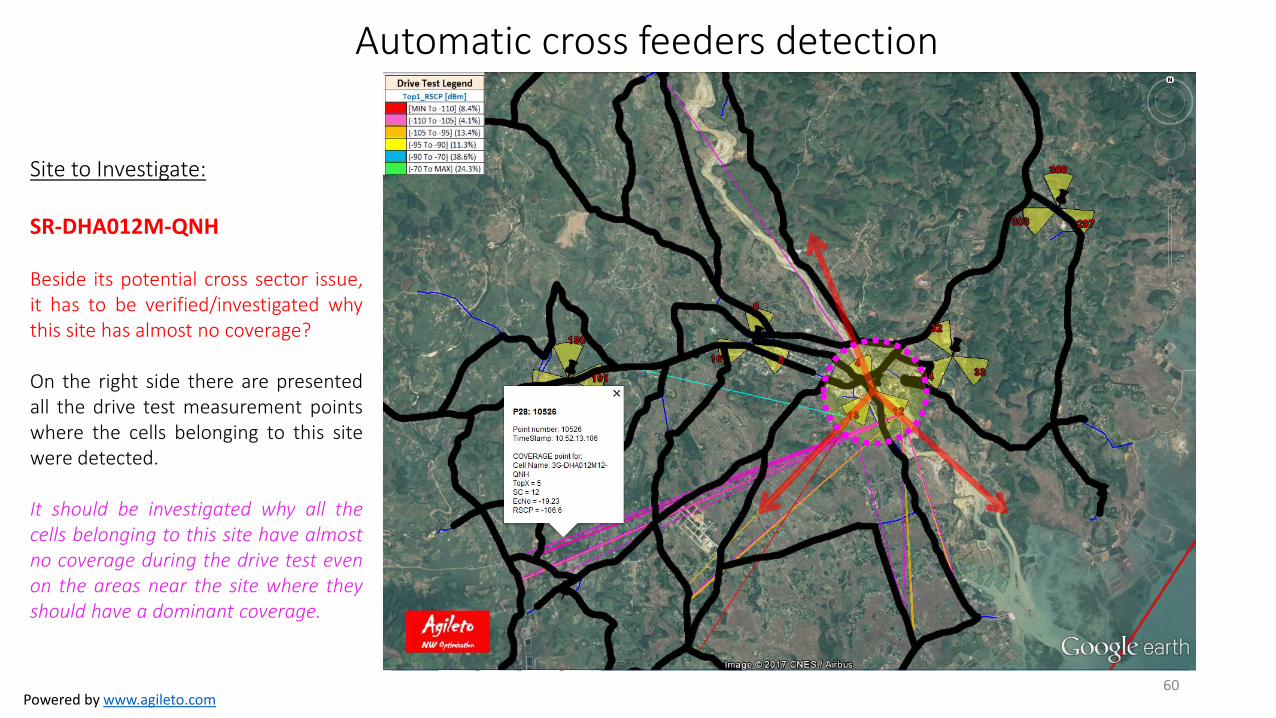
Site to Investigate:
SR-DHA012M-QNH Beside its potential cross sector issue, it has to be verified/investigated why this site has almost no coverage? On the right side there are presented all the drive test measurement points where the cells belonging to this site were detected. It should be investigated why all the cells belonging to this site have almost no coverage during the drive test even on the areas near the site where they should have a dominant coverage.
Automatic cross feeders detection

Powered by www.agileto.com
Thank you
Agileto www.agileto.com

Agileto
What kind of services are we providing currently ?
• Network Optimization services (including roll-out or/and swap) for any mobile
networks (2G/3G/4G) from small clusters to large (BSCs/RNCs/TACs) areas;
• Benchmark analysis on multiple drive test metrics/networks;
• Enhanced Agileto PRO Edition license(s) for your own usage;
We are providing for FREE our services as POC (Proof Of Concept) for all our new clients so do not hesitate to contact us Today !

Agileto
Contact details:
Sales: [email protected]
Support: [email protected]
Web site: www.agileto.com