Embed Size (px)
Citation preview
Case Studies
Mobile, Low-Cost, and Large-Scale Immersive DataVisualization Environment for Civil Engineering
ApplicationsShane Hayden, S.M.ASCE1; Daniel P. Ames, M.ASCE2; Derrick Turner, S.M.ASCE3;
Thomas Keene4; and David Andrus5
Abstract: This case study presents the design and development of a three-dimensional (3D) immersive visualization system constructedfrom commercial off-the-shelf components and open-source software that is intended to address the following key challenges for the practicaluse of immersive environments: (1) extreme costs in both hardware and software; (2) immobility due to calibration and darkroom require-ments; and (3) extensive and expensive manpower requirements for both operation and maintenance. The system—called the VuePod—uses12 consumer grade passive 3D television monitors, an active tracking system, and a modular construction approach. The VuePod capitalizeson recent functional advancements and cost decreases in both hardware and software and is demonstrated herein as a viable alternative toprohibitively expensive projector-based walk-in computer automatic virtual environments (CAVEs). The case study presents a full descriptionof the hardware and its assembly, the software and its configuration, the modular structural system, results from benchmark computation andvisualization tests, and a comparison to other several other immersive visualization systems in terms of cost, scale, pixel density, and systemrequirements. DOI: 10.1061/(ASCE)CP.1943-5487.0000428. © 2014 American Society of Civil Engineers.
Author keywords: Computer automatic virtual environment (CAVE); Stereo visualization; Immersive computing.
Introduction
Stereo three-dimensional (3D) visualization has proven to be avaluable method of interacting with data for engineers, researchers,scientists, and designers. For example, Bryson (1996) discusses theneed to view data sets in 3D to study the behavior of parameters,such as streamlines in a vector field. Kwaw and Gorny (2000) in-troduce computer-aided design software (VCAD) used to producedesign drawings for reinforced concrete and structural engineeringapplications to aid in presentations to project stakeholders.Gruchalla (2004) illustrates the value of immersion in solving a“real-world industrial problem” of planning an oil well path.Kreylos et al. (2006) introduce software specifically designedfor earth science researchers to be able to interact with data at multi-ple scales. Bowman and McMahan (2007) discuss how virtual real-ity is more than just impressive demonstration technology and howit has been successfully used in psychology, military training, andin the entertainment industry. Barham et al. (2012) propose the ideaof improving engineering learning techniques by implementing 3D
immersive simulations in a virtual environment that would allowusers to “explore engineering phenomena in new ways that arenot safe or cost-effective in physical, real-world laboratories.”
Within civil engineering, immersive stereo 3D technology hasbeen applied to areas as diverse as building information manage-ment (Kang et al. 2012), modeling and visualization of under-ground structures (Li and Zhu 2009), virtual interactiveworkspaces for planning and prototyping (Leicht et al. 2014);and the study of discrete event simulations using virtual construc-tion sites (Sacks et al. 2013). Generally, however, 3D immersionhas not become fully adopted in civil and environmental engineer-ing practice. The authors submit that the three reasons for this are(1) the extreme capital cost of constructing an immersive virtualreality system; (2) the general immobility of the technology andspecial physical room and/or building constraints; and (3) expensiveoperational manpower and maintenance requirements.
This case study presents the design, development, and testing ofa new immersive virtual reality system for civil and environmentalengineering applications that attempts to address limitations ofcost, mobility, and manpower and to compare this system to otherimmersive visualization systems in terms of several key parameters.The case study goal was to create a system with a full field of viewand participatory immersive stereoscopic display with head andhand tracking that maximizes pixel density, computational power,and mobility, while minimizing cost, operational expertise, andmaintenance requirements. The system presented here is based en-tirely on commercial off-the-shelf (COTS) hardware and opensource software; hence, the primary contribution of this work isin the unique configuration and assembly of a system that meetsthese specific research goals.
Stereoscopic Immersive Technologies
A wide variety of hardware and software configurations are usedin immersive virtual reality systems, including projector-based
1Graduate Research Assistant, Dept. of Civil and EnvironmentEngineering, Brigham Young Univ., Provo, UT 84602.
2Associate Professor, Dept. of Civil and Environment Engineering,Brigham Young Univ., Provo, UT 84602 (corresponding author). E-mail:[email protected]
3Graduate Research Assistant, Dept. of Civil and EnvironmentEngineering, Brigham Young Univ., Provo, UT 84602.
4Undergraduate Research Assistant, Dept. of Civil and EnvironmentEngineering, Brigham Young Univ., Provo, UT 84602.
5IT Specialist, Office of Information Technology, Brigham YoungUniv., Provo, UT 84602.
Note. This manuscript was submitted on November 12, 2013; approvedon July 5, 2014; published online on September 4, 2014. Discussion periodopen until February 4, 2015; separate discussions must be submitted forindividual papers. This paper is part of the Journal of Computing in CivilEngineering, © ASCE, ISSN 0887-3801/05014011(10)/$25.00.
© ASCE 05014011-1 J. Comput. Civ. Eng.
J. Comput. Civ. Eng.
Dow
nloa
ded
from
asc
elib
rary
.org
by
UN
IVE
RSI
TY
OF
SYD
NE
Y o
n 09
/05/
14. C
opyr
ight
ASC
E. F
or p
erso
nal u
se o
nly;
all
righ
ts r
eser
ved.
wrap-around video systems, LCD panel walls, single monitorsystems, and large walk-in rooms. These systems can all be looselygrouped under the common term computer automatic virtual envi-ronment, or CAVE. Among these CAVE systems, the common pur-pose is typically to aid scientists, engineers, technicians, teachers,and others in enhancing workflows by providing users with aviewer-centered perspective (Cruz-Neira et al. 1992; Sherman et al.2010). With advances in technology and computer science, thequality of CAVE systems continues to improve (Peterka et al.2008; DeFanti et al. 2011). For example, the first CAVE thatwas created in the early 1990s had a “resolution of less than amegapixel per wall per eye; newer ones have up to 15 times asmany pixels” (DeFanti et al. 2011).
A common CAVE configuration consists of four–six projectionscreens forming walls—and, in some cases, floors—that surroundthe viewer with a rear projection projector associated with each wall(Cruz-Neira et al. 1992; Browning et al. 1994; Sherman et al. 2010;DeFanti et al. 2011). Within this CAVE environment, a user wearseither active or passive stereo glasses that provide an immersive 3Dview of the images shown on the surrounding screens. Interactionwith the views is made possible by a tracking system that followsthe movements of a six-degrees-of-freedom sensor worn by theuser that communicates to the software the location and orientationof the user’s head or hands. One of the primary benefits of the pro-jector-based CAVE configuration is that multiple users can viewdata simultaneously (Cruz-Neira et al. 1992; DeFanti et al. 2011).
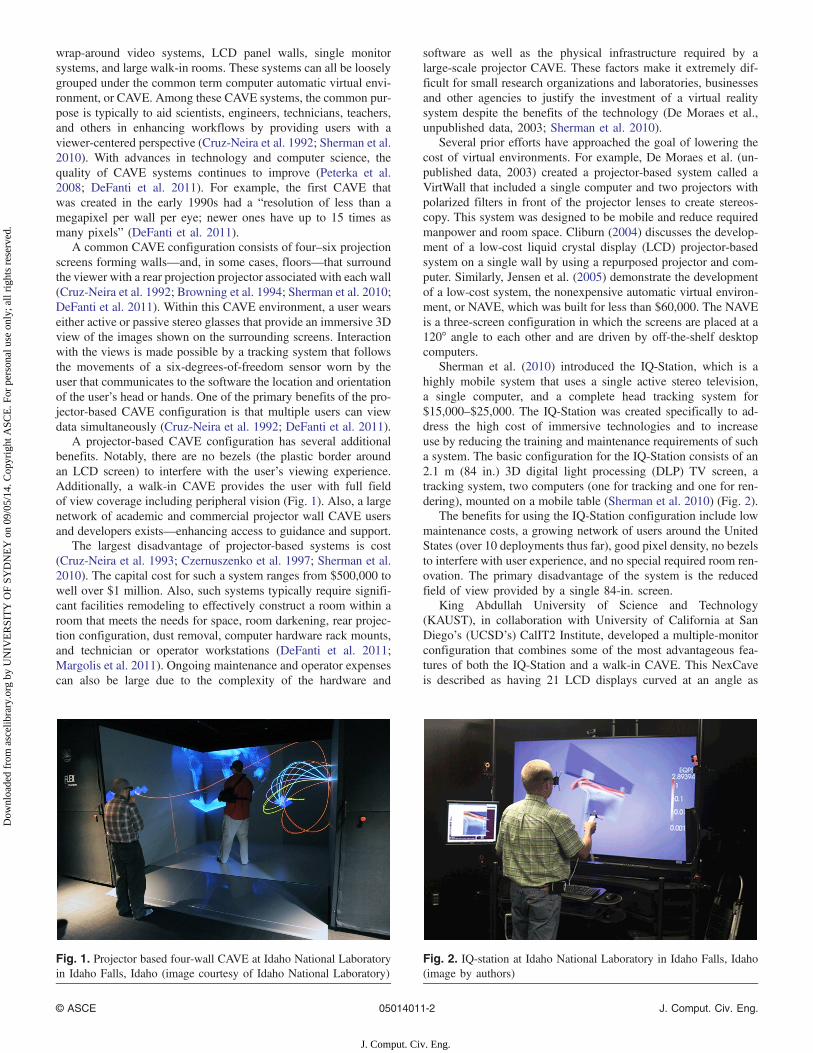
A projector-based CAVE configuration has several additionalbenefits. Notably, there are no bezels (the plastic border aroundan LCD screen) to interfere with the user’s viewing experience.Additionally, a walk-in CAVE provides the user with full fieldof view coverage including peripheral vision (Fig. 1). Also, a largenetwork of academic and commercial projector wall CAVE usersand developers exists—enhancing access to guidance and support.
The largest disadvantage of projector-based systems is cost(Cruz-Neira et al. 1993; Czernuszenko et al. 1997; Sherman et al.2010). The capital cost for such a system ranges from $500,000 towell over $1 million. Also, such systems typically require signifi-cant facilities remodeling to effectively construct a room within aroom that meets the needs for space, room darkening, rear projec-tion configuration, dust removal, computer hardware rack mounts,and technician or operator workstations (DeFanti et al. 2011;Margolis et al. 2011). Ongoing maintenance and operator expensescan also be large due to the complexity of the hardware and
software as well as the physical infrastructure required by alarge-scale projector CAVE. These factors make it extremely dif-ficult for small research organizations and laboratories, businessesand other agencies to justify the investment of a virtual realitysystem despite the benefits of the technology (De Moraes et al.,unpublished data, 2003; Sherman et al. 2010).
Several prior efforts have approached the goal of lowering thecost of virtual environments. For example, De Moraes et al. (un-published data, 2003) created a projector-based system called aVirtWall that included a single computer and two projectors withpolarized filters in front of the projector lenses to create stereos-copy. This system was designed to be mobile and reduce requiredmanpower and room space. Cliburn (2004) discusses the develop-ment of a low-cost liquid crystal display (LCD) projector-basedsystem on a single wall by using a repurposed projector and com-puter. Similarly, Jensen et al. (2005) demonstrate the developmentof a low-cost system, the nonexpensive automatic virtual environ-ment, or NAVE, which was built for less than $60,000. The NAVEis a three-screen configuration in which the screens are placed at a120° angle to each other and are driven by off-the-shelf desktopcomputers.
Sherman et al. (2010) introduced the IQ-Station, which is ahighly mobile system that uses a single active stereo television,a single computer, and a complete head tracking system for$15,000–$25,000. The IQ-Station was created specifically to ad-dress the high cost of immersive technologies and to increaseuse by reducing the training and maintenance requirements of sucha system. The basic configuration for the IQ-Station consists of an2.1 m (84 in.) 3D digital light processing (DLP) TV screen, atracking system, two computers (one for tracking and one for ren-dering), mounted on a mobile table (Sherman et al. 2010) (Fig. 2).
The benefits for using the IQ-Station configuration include lowmaintenance costs, a growing network of users around the UnitedStates (over 10 deployments thus far), good pixel density, no bezelsto interfere with user experience, and no special required room ren-ovation. The primary disadvantage of the system is the reducedfield of view provided by a single 84-in. screen.
King Abdullah University of Science and Technology(KAUST), in collaboration with University of California at SanDiego’s (UCSD’s) CalIT2 Institute, developed a multiple-monitorconfiguration that combines some of the most advantageous fea-tures of both the IQ-Station and a walk-in CAVE. This NexCaveis described as having 21 LCD displays curved at an angle as
Fig. 1. Projector based four-wall CAVE at Idaho National Laboratoryin Idaho Falls, Idaho (image courtesy of Idaho National Laboratory)
Fig. 2. IQ-station at Idaho National Laboratory in Idaho Falls, Idaho(image by authors)
© ASCE 05014011-2 J. Comput. Civ. Eng.
J. Comput. Civ. Eng.
Dow
nloa
ded
from
asc
elib
rary
.org
by
UN
IVE
RSI
TY
OF
SYD
NE
Y o
n 09
/05/
14. C
opyr
ight
ASC
E. F
or p
erso
nal u
se o
nly;
all
righ
ts r
eser
ved.
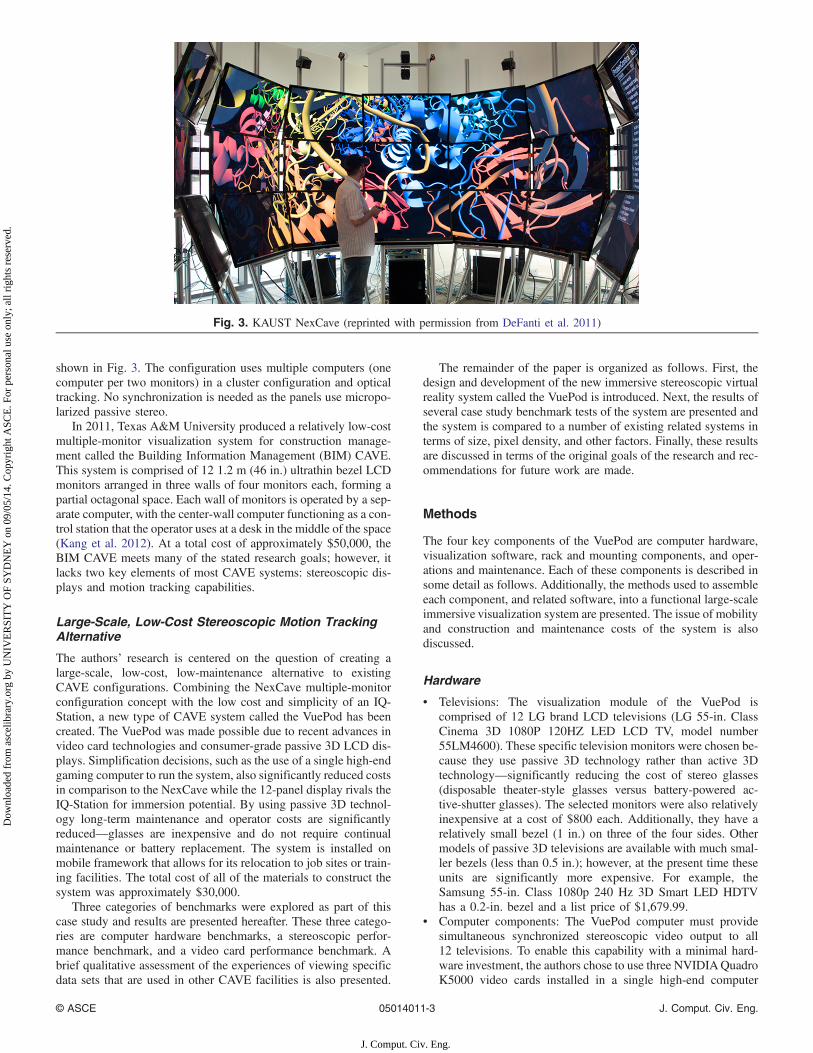
shown in Fig. 3. The configuration uses multiple computers (onecomputer per two monitors) in a cluster configuration and opticaltracking. No synchronization is needed as the panels use micropo-larized passive stereo.
In 2011, Texas A&M University produced a relatively low-costmultiple-monitor visualization system for construction manage-ment called the Building Information Management (BIM) CAVE.This system is comprised of 12 1.2 m (46 in.) ultrathin bezel LCDmonitors arranged in three walls of four monitors each, forming apartial octagonal space. Each wall of monitors is operated by a sep-arate computer, with the center-wall computer functioning as a con-trol station that the operator uses at a desk in the middle of the space(Kang et al. 2012). At a total cost of approximately $50,000, theBIM CAVE meets many of the stated research goals; however, itlacks two key elements of most CAVE systems: stereoscopic dis-plays and motion tracking capabilities.
Large-Scale, Low-Cost Stereoscopic Motion TrackingAlternative
The authors’ research is centered on the question of creating alarge-scale, low-cost, low-maintenance alternative to existingCAVE configurations. Combining the NexCave multiple-monitorconfiguration concept with the low cost and simplicity of an IQ-Station, a new type of CAVE system called the VuePod has beencreated. The VuePod was made possible due to recent advances invideo card technologies and consumer-grade passive 3D LCD dis-plays. Simplification decisions, such as the use of a single high-endgaming computer to run the system, also significantly reduced costsin comparison to the NexCave while the 12-panel display rivals theIQ-Station for immersion potential. By using passive 3D technol-ogy long-term maintenance and operator costs are significantlyreduced—glasses are inexpensive and do not require continualmaintenance or battery replacement. The system is installed onmobile framework that allows for its relocation to job sites or train-ing facilities. The total cost of all of the materials to construct thesystem was approximately $30,000.
Three categories of benchmarks were explored as part of thiscase study and results are presented hereafter. These three catego-ries are computer hardware benchmarks, a stereoscopic perfor-mance benchmark, and a video card performance benchmark. Abrief qualitative assessment of the experiences of viewing specificdata sets that are used in other CAVE facilities is also presented.
The remainder of the paper is organized as follows. First, thedesign and development of the new immersive stereoscopic virtualreality system called the VuePod is introduced. Next, the results ofseveral case study benchmark tests of the system are presented andthe system is compared to a number of existing related systems interms of size, pixel density, and other factors. Finally, these resultsare discussed in terms of the original goals of the research and rec-ommendations for future work are made.
Methods
The four key components of the VuePod are computer hardware,visualization software, rack and mounting components, and oper-ations and maintenance. Each of these components is described insome detail as follows. Additionally, the methods used to assembleeach component, and related software, into a functional large-scaleimmersive visualization system are presented. The issue of mobilityand construction and maintenance costs of the system is alsodiscussed.
Hardware
• Televisions: The visualization module of the VuePod iscomprised of 12 LG brand LCD televisions (LG 55-in. ClassCinema 3D 1080P 120HZ LED LCD TV, model number55LM4600). These specific television monitors were chosen be-cause they use passive 3D technology rather than active 3Dtechnology—significantly reducing the cost of stereo glasses(disposable theater-style glasses versus battery-powered ac-tive-shutter glasses). The selected monitors were also relativelyinexpensive at a cost of $800 each. Additionally, they have arelatively small bezel (1 in.) on three of the four sides. Othermodels of passive 3D televisions are available with much smal-ler bezels (less than 0.5 in.); however, at the present time theseunits are significantly more expensive. For example, theSamsung 55-in. Class 1080p 240 Hz 3D Smart LED HDTVhas a 0.2-in. bezel and a list price of $1,679.99.
• Computer components: The VuePod computer must providesimultaneous synchronized stereoscopic video output to all12 televisions. To enable this capability with a minimal hard-ware investment, the authors chose to use three NVIDIAQuadroK5000 video cards installed in a single high-end computer
Fig. 3. KAUST NexCave (reprinted with permission from DeFanti et al. 2011)
© ASCE 05014011-3 J. Comput. Civ. Eng.
J. Comput. Civ. Eng.
Dow
nloa
ded
from
asc
elib
rary
.org
by
UN
IVE
RSI
TY
OF
SYD
NE
Y o
n 09
/05/
14. C
opyr
ight
ASC
E. F
or p
erso
nal u
se o
nly;
all
righ
ts r
eser
ved.
comparable to a custom-built gaming PC. Each video card hasfour video outputs and occupies two Peripheral ComponentInterconnect (PCI) card slots on the computer mainboard.The NVIDIA Quadro K5000 was released in 2012 and includes1,536 cores that run at 2.1 teraflops with 4 GB GDDR5 RAM,256-bit graphics processing unit (GPU) and 173 GB=s band-width. Space was also needed in the computer case for anadditional PCI-size card that synchronizes the refresh rates ofthe three video cards—the sync card does not need to plug intothe motherboard via PCI as it interfaces with the video cards viaribbon cables. It needs space in the computer chassis; howevermotherboard support for the sync is not necessary. Standarddesktop computer mainboards typically only have six PCI slots;therefore a server-grade motherboard, the Asus P6T7, was used.Additionally, the computer case is a full-size tower typically in-tended for gaming applications due to its extensive ventilationsystem with multiple cooling fans. The system also includes amid-range Intel processor and 24 GB of RAM.
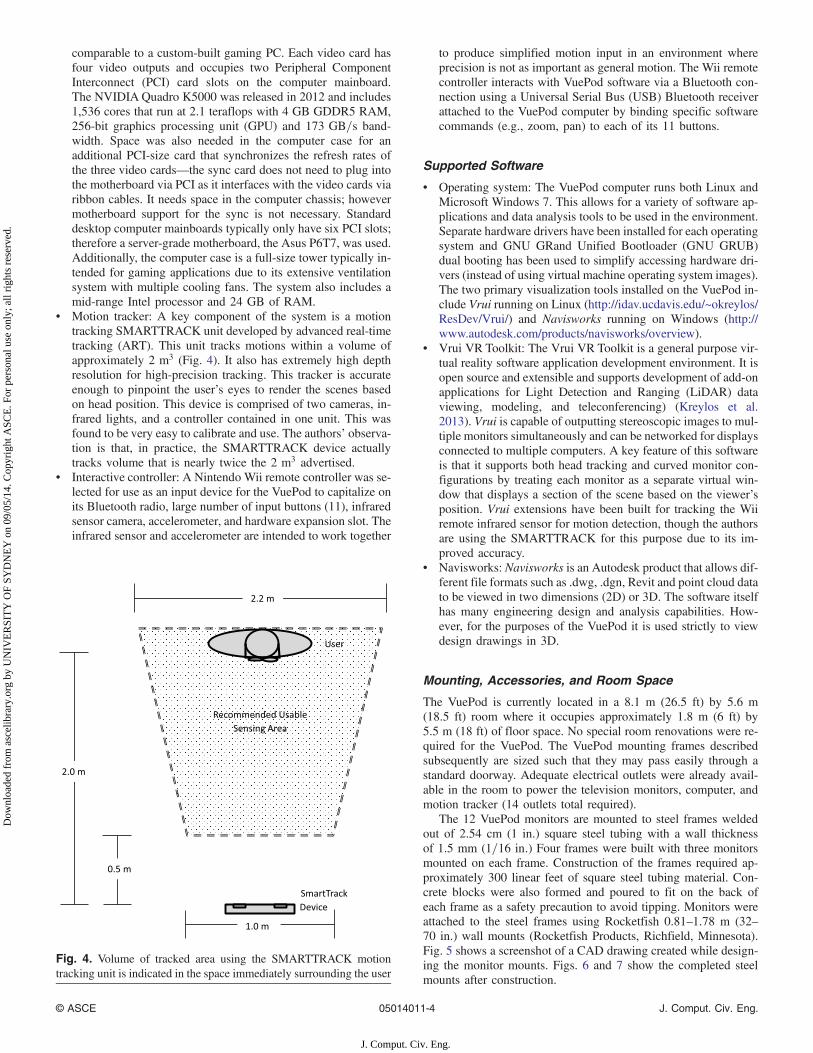
• Motion tracker: A key component of the system is a motiontracking SMARTTRACK unit developed by advanced real-timetracking (ART). This unit tracks motions within a volume ofapproximately 2 m3 (Fig. 4). It also has extremely high depthresolution for high-precision tracking. This tracker is accurateenough to pinpoint the user’s eyes to render the scenes basedon head position. This device is comprised of two cameras, in-frared lights, and a controller contained in one unit. This wasfound to be very easy to calibrate and use. The authors’ observa-tion is that, in practice, the SMARTTRACK device actuallytracks volume that is nearly twice the 2 m3 advertised.
• Interactive controller: A Nintendo Wii remote controller was se-lected for use as an input device for the VuePod to capitalize onits Bluetooth radio, large number of input buttons (11), infraredsensor camera, accelerometer, and hardware expansion slot. Theinfrared sensor and accelerometer are intended to work together
to produce simplified motion input in an environment whereprecision is not as important as general motion. The Wii remotecontroller interacts with VuePod software via a Bluetooth con-nection using a Universal Serial Bus (USB) Bluetooth receiverattached to the VuePod computer by binding specific softwarecommands (e.g., zoom, pan) to each of its 11 buttons.
Supported Software
• Operating system: The VuePod computer runs both Linux andMicrosoft Windows 7. This allows for a variety of software ap-plications and data analysis tools to be used in the environment.Separate hardware drivers have been installed for each operatingsystem and GNU GRand Unified Bootloader (GNU GRUB)dual booting has been used to simplify accessing hardware dri-vers (instead of using virtual machine operating system images).The two primary visualization tools installed on the VuePod in-clude Vrui running on Linux (http://idav.ucdavis.edu/~okreylos/ResDev/Vrui/) and Navisworks running on Windows (http://www.autodesk.com/products/navisworks/overview).
• Vrui VR Toolkit: The Vrui VR Toolkit is a general purpose vir-tual reality software application development environment. It isopen source and extensible and supports development of add-onapplications for Light Detection and Ranging (LiDAR) dataviewing, modeling, and teleconferencing) (Kreylos et al.2013). Vrui is capable of outputting stereoscopic images to mul-tiple monitors simultaneously and can be networked for displaysconnected to multiple computers. A key feature of this softwareis that it supports both head tracking and curved monitor con-figurations by treating each monitor as a separate virtual win-dow that displays a section of the scene based on the viewer’sposition. Vrui extensions have been built for tracking the Wiiremote infrared sensor for motion detection, though the authorsare using the SMARTTRACK for this purpose due to its im-proved accuracy.
• Navisworks: Navisworks is an Autodesk product that allows dif-ferent file formats such as .dwg, .dgn, Revit and point cloud datato be viewed in two dimensions (2D) or 3D. The software itselfhas many engineering design and analysis capabilities. How-ever, for the purposes of the VuePod it is used strictly to viewdesign drawings in 3D.
Mounting, Accessories, and Room Space
The VuePod is currently located in a 8.1 m (26.5 ft) by 5.6 m(18.5 ft) room where it occupies approximately 1.8 m (6 ft) by5.5 m (18 ft) of floor space. No special room renovations were re-quired for the VuePod. The VuePod mounting frames describedsubsequently are sized such that they may pass easily through astandard doorway. Adequate electrical outlets were already avail-able in the room to power the television monitors, computer, andmotion tracker (14 outlets total required).
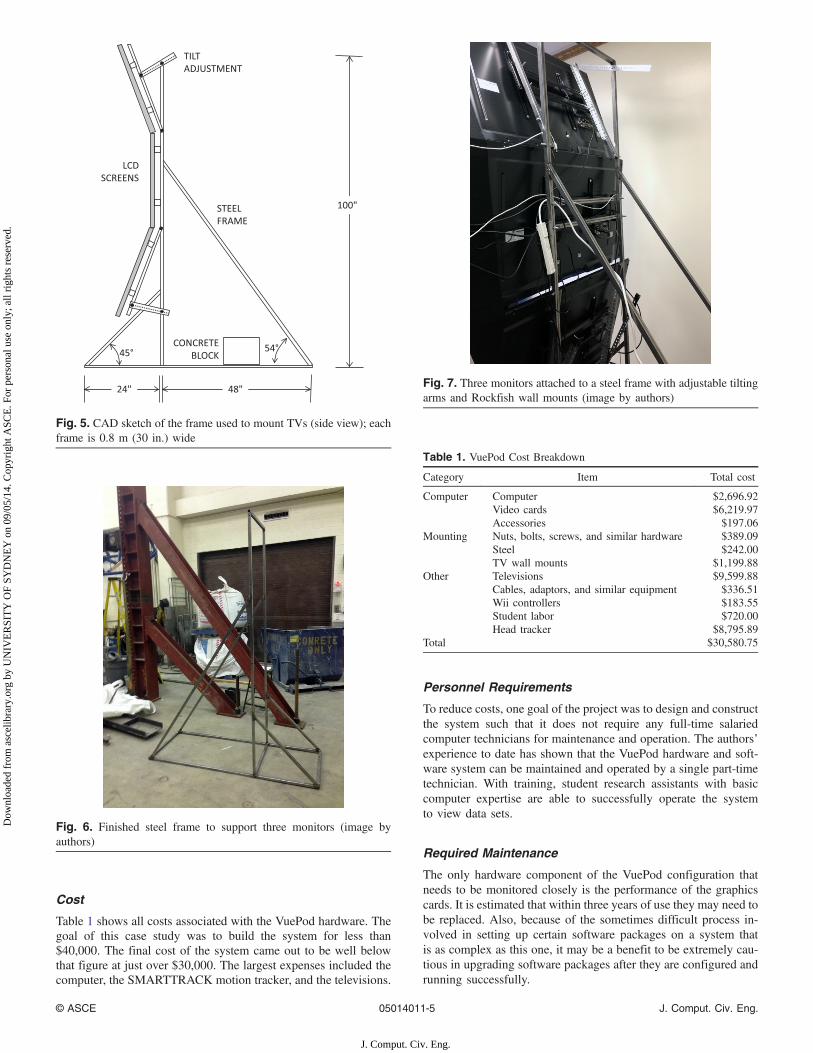
The 12 VuePod monitors are mounted to steel frames weldedout of 2.54 cm (1 in.) square steel tubing with a wall thicknessof 1.5 mm (1=16 in:) Four frames were built with three monitorsmounted on each frame. Construction of the frames required ap-proximately 300 linear feet of square steel tubing material. Con-crete blocks were also formed and poured to fit on the back ofeach frame as a safety precaution to avoid tipping. Monitors wereattached to the steel frames using Rocketfish 0.81–1.78 m (32–70 in.) wall mounts (Rocketfish Products, Richfield, Minnesota).Fig. 5 shows a screenshot of a CAD drawing created while design-ing the monitor mounts. Figs. 6 and 7 show the completed steelmounts after construction.
Fig. 4. Volume of tracked area using the SMARTTRACK motiontracking unit is indicated in the space immediately surrounding the user
© ASCE 05014011-4 J. Comput. Civ. Eng.
J. Comput. Civ. Eng.
Dow
nloa
ded
from
asc
elib
rary
.org
by
UN
IVE
RSI
TY
OF
SYD
NE
Y o
n 09
/05/
14. C
opyr
ight
ASC
E. F
or p
erso
nal u
se o
nly;
all
righ
ts r
eser
ved.
Cost
Table 1 shows all costs associated with the VuePod hardware. Thegoal of this case study was to build the system for less than$40,000. The final cost of the system came out to be well belowthat figure at just over $30,000. The largest expenses included thecomputer, the SMARTTRACK motion tracker, and the televisions.
Personnel Requirements
To reduce costs, one goal of the project was to design and constructthe system such that it does not require any full-time salariedcomputer technicians for maintenance and operation. The authors’experience to date has shown that the VuePod hardware and soft-ware system can be maintained and operated by a single part-timetechnician. With training, student research assistants with basiccomputer expertise are able to successfully operate the systemto view data sets.
Required Maintenance
The only hardware component of the VuePod configuration thatneeds to be monitored closely is the performance of the graphicscards. It is estimated that within three years of use they may need tobe replaced. Also, because of the sometimes difficult process in-volved in setting up certain software packages on a system thatis as complex as this one, it may be a benefit to be extremely cau-tious in upgrading software packages after they are configured andrunning successfully.
Fig. 5. CAD sketch of the frame used to mount TVs (side view); eachframe is 0.8 m (30 in.) wide
Fig. 6. Finished steel frame to support three monitors (image byauthors)
Fig. 7. Three monitors attached to a steel frame with adjustable tiltingarms and Rockfish wall mounts (image by authors)
Table 1. VuePod Cost Breakdown
Category Item Total cost
Computer Computer $2,696.92Video cards $6,219.97Accessories $197.06
Mounting Nuts, bolts, screws, and similar hardware $389.09Steel $242.00TV wall mounts $1,199.88
Other Televisions $9,599.88Cables, adaptors, and similar equipment $336.51Wii controllers $183.55Student labor $720.00Head tracker $8,795.89
Total $30,580.75
© ASCE 05014011-5 J. Comput. Civ. Eng.
J. Comput. Civ. Eng.
Dow
nloa
ded
from
asc
elib
rary
.org
by
UN
IVE
RSI
TY
OF
SYD
NE
Y o
n 09
/05/
14. C
opyr
ight
ASC
E. F
or p
erso
nal u
se o
nly;
all
righ
ts r
eser
ved.
Mobility
Because mobility was identified as a key limiting factor in theadoption of large-scale visualization systems in civil engineeringapplications, the VuePod was constructed with completely modularcomponents that do not require any special calibration or particularroom configuration—thus enabling movement of the system to newlocations as needed for particular applications. The entire VuePodsystem can be disassembled in three hours and reassembled in 3 hby a team of two technicians. The 12 televisions weigh approxi-mately 18 kg (approximately 40 lbs) each and can easily be movedby a single individual. The largest challenge in dismantling andmoving the system has proven to be the mounting frames, whichweigh approximately 27 kg (60 lbs) each and are quite large andunwieldy. However, they can readily pass through a 0.8 m (30-in.)door frame when held horizontally. Another important considera-tion in moving the system is ensuring that the computer andtracking system are handled with some caution (as with any com-puter) such that the hard drives and other internal components donot get excessively jarred during transit.
Case Study Comparison
To expand this case study beyond the development of the VuePodsystem itself, other immersive visualization systems that have beenconstructed and described in the literature were identified and ameta-analysis comparison of these systems was performed in termsof cost, screen configuration, maintenance requirements, hard-ware specifications, primary software used, and display type.Comparison results summarize these systems based on facilitycomponents, viewing components, and computer system compo-nents. The systems, including the VuePod, are then categorizedbased on cost, pixel count versus screen size, and pixel count versuspixel size.
Results
The validation strategy and results presented as follows includecomputer hardware benchmark tests, video card and softwarebenchmark tests, and visualization and user tests of specific datasets. These tests were chosen specifically to demonstrate the gen-eral hardware and software capabilities of the system and generalusability of the system. A detailed usability study of the system,though out of the scope of the current research, is planned forthe immediate future. LiDAR data sets were chosen for the simpledemonstration as follows because of the massive number of pointscontained, and the extensive video requirements to adequately dis-play such point clouds.
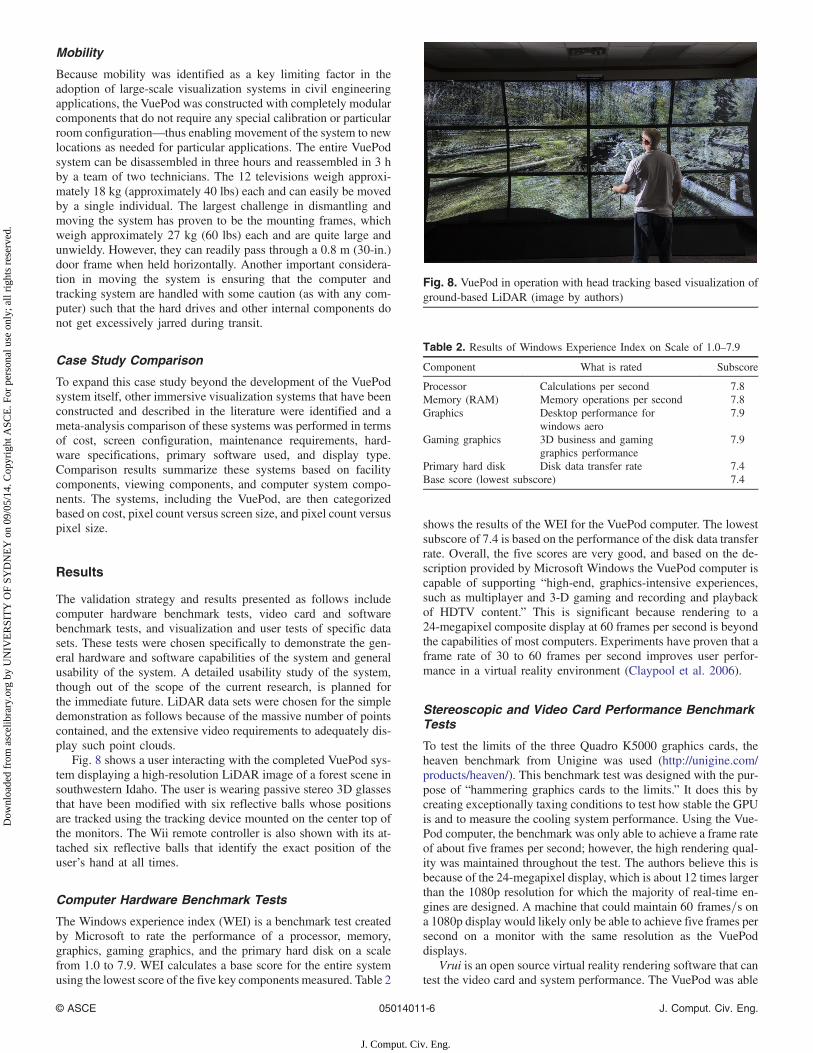
Fig. 8 shows a user interacting with the completed VuePod sys-tem displaying a high-resolution LiDAR image of a forest scene insouthwestern Idaho. The user is wearing passive stereo 3D glassesthat have been modified with six reflective balls whose positionsare tracked using the tracking device mounted on the center top ofthe monitors. The Wii remote controller is also shown with its at-tached six reflective balls that identify the exact position of theuser’s hand at all times.
Computer Hardware Benchmark Tests
The Windows experience index (WEI) is a benchmark test createdby Microsoft to rate the performance of a processor, memory,graphics, gaming graphics, and the primary hard disk on a scalefrom 1.0 to 7.9. WEI calculates a base score for the entire systemusing the lowest score of the five key components measured. Table 2
shows the results of the WEI for the VuePod computer. The lowestsubscore of 7.4 is based on the performance of the disk data transferrate. Overall, the five scores are very good, and based on the de-scription provided by Microsoft Windows the VuePod computer iscapable of supporting “high-end, graphics-intensive experiences,such as multiplayer and 3-D gaming and recording and playbackof HDTV content.” This is significant because rendering to a24-megapixel composite display at 60 frames per second is beyondthe capabilities of most computers. Experiments have proven that aframe rate of 30 to 60 frames per second improves user perfor-mance in a virtual reality environment (Claypool et al. 2006).
Stereoscopic and Video Card Performance BenchmarkTests
To test the limits of the three Quadro K5000 graphics cards, theheaven benchmark from Unigine was used (http://unigine.com/products/heaven/). This benchmark test was designed with the pur-pose of “hammering graphics cards to the limits.” It does this bycreating exceptionally taxing conditions to test how stable the GPUis and to measure the cooling system performance. Using the Vue-Pod computer, the benchmark was only able to achieve a frame rateof about five frames per second; however, the high rendering qual-ity was maintained throughout the test. The authors believe this isbecause of the 24-megapixel display, which is about 12 times largerthan the 1080p resolution for which the majority of real-time en-gines are designed. A machine that could maintain 60 frames=s ona 1080p display would likely only be able to achieve five frames persecond on a monitor with the same resolution as the VuePoddisplays.
Vrui is an open source virtual reality rendering software that cantest the video card and system performance. The VuePod was able
Fig. 8. VuePod in operation with head tracking based visualization ofground-based LiDAR (image by authors)
Table 2. Results of Windows Experience Index on Scale of 1.0–7.9
Component What is rated Subscore
Processor Calculations per second 7.8Memory (RAM) Memory operations per second 7.8Graphics Desktop performance for
windows aero7.9
Gaming graphics 3D business and gaminggraphics performance
7.9
Primary hard disk Disk data transfer rate 7.4Base score (lowest subscore) 7.4
© ASCE 05014011-6 J. Comput. Civ. Eng.
J. Comput. Civ. Eng.
Dow
nloa
ded
from
asc
elib
rary
.org
by
UN
IVE
RSI
TY
OF
SYD
NE
Y o
n 09
/05/
14. C
opyr
ight
ASC
E. F
or p
erso
nal u
se o
nly;
all
righ
ts r
eser
ved.
to render at least 10 million LiDAR points in Vrui with a steadyframe rate of 60 frames=s. This test used Vrui 2.6, which does notimplement multicore rendering optimization.
Viewing Sample Data
Three data sets were identified for testing the capabilities and limitsof the VuePod as part of this case study. The first data set is a 2005aerial LiDAR scan of the San Diego skyline acquired from theOpenTopography portal (www.opentopography.org). The subsetof these data used for the tests includes 15.5 million data points.The second data set is a LiDAR scan of a forest in southwesternIdaho that is described by Murgoitio et al. (2014). This data setincludes 42.5 million data points that are a combination of bothaerial and ground-based LiDAR scans. The third data set is aLiDAR scan of a river and canyon area that is described by Glennet al. (2006). This data set includes 375 million data points.
In viewing the LiDAR scan of the San Diego skyline, the overallexperience has been positive for both repeat and first-time users.The stereo or 3D image is very apparent and users are able to iden-tify certain buildings or parts of the city that are recognizable, suchas the San Diego Padres baseball stadium or the convention center.When looking at the same LiDAR scan in 2D, it is difficult to rec-ognize certain aspects of the data that are highly apparent in stereo3D. For example, at the time that the scan was taken, there wasconstruction occurring near the baseball stadium where excavationhad created a deep hole surrounded by piles of earth. When viewingthis feature in 2D, it is not apparent that there is a deep hole in thatlocation; however, when looking at the same image in 3D and withhead tracking, the feature becomes apparent.
The second data set that was analyzed was a forest LiDAR scanproduced by Murgoitio et al. (2014). This data set is a combinationof an aerial LiDAR scan and a scan performed by a terrestrial laserscanner (TLS). The two scans were overlaid on top of one anotherand in the location where the two scans overlap the point clouddensity is extremely high. Because of this, the user is able tosee a very high resolution of points and is able to analyze and viewvery fine details in the forest area such as bark on trees, cracks inrocks, and pine needles on trees. With head tracking, the user is ableto look over, around and underneath objects in the image by simplymoving their head. When viewing this same image in 2D, the useris able to see a high-resolution representation of the area andcan identify objects; however, the user does not experience theimmersion from the head tracking and the 3D by being able tointeract with the data.
The third data set used to analyze the functionality of the Vue-Pod was a LiDAR scan of canyons, cliffs, and a river area in Idaho
prepared by Glenn et al. (2006). This data set is a combination ofLiDAR scans taken at different times with the purpose of analyzingchanges in the area over a specific time period. When the data setwas processed, the scan from the earlier time period was coloredgreen and the scan from the later time period was colored purple. Inviewing the data using 3D and head tracking in the VuePod, usersare able to easily identify areas that have eroded over time, vegeta-tion that has grown, and a gravel pit area that has been altered dur-ing the time period. When viewing the data in 2D, it is easy to seethat there are differences between the two data sets mainly becauseof the colors; however, it is difficult to recognize the depth of theimage and landmarks in the distance.
Two specific challenges that users experienced while viewing allthree of the previously described data sets were identified. First, thebezels between the monitors can interfere with and/or distract fromthe image presented on the screens. Interestingly, the use of thehead tracking system reduced the negative effects of the bezelsas the user tended to look around them in the same way one looksout a set of window panes, ignoring the window frames. Second,some users noted a small degree of motion sickness.
Comparison to Other CAVE Systems
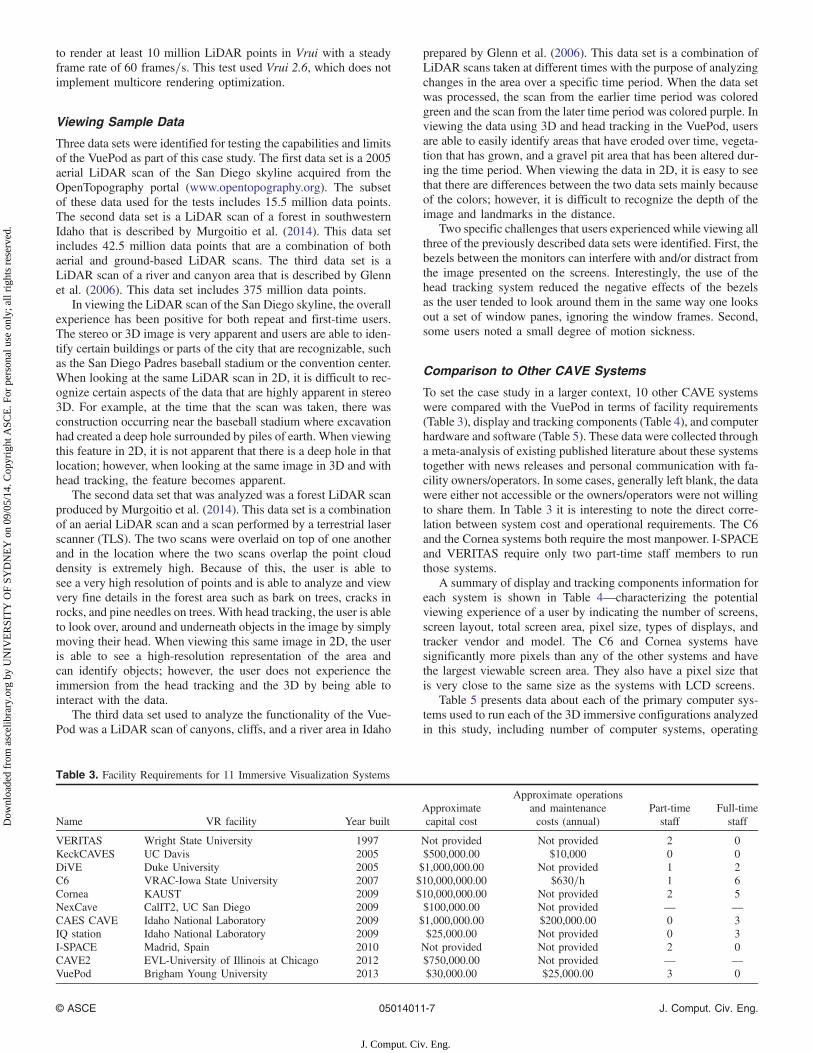
To set the case study in a larger context, 10 other CAVE systemswere compared with the VuePod in terms of facility requirements(Table 3), display and tracking components (Table 4), and computerhardware and software (Table 5). These data were collected througha meta-analysis of existing published literature about these systemstogether with news releases and personal communication with fa-cility owners/operators. In some cases, generally left blank, the datawere either not accessible or the owners/operators were not willingto share them. In Table 3 it is interesting to note the direct corre-lation between system cost and operational requirements. The C6and the Cornea systems both require the most manpower. I-SPACEand VERITAS require only two part-time staff members to runthose systems.
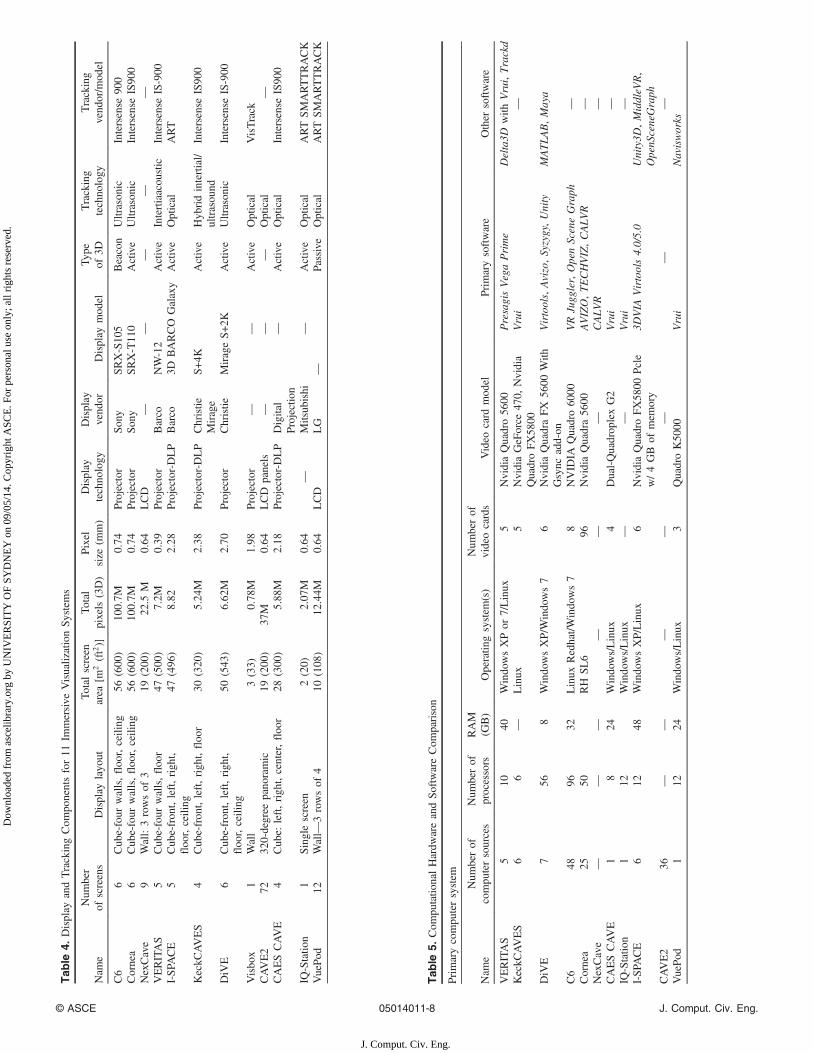
A summary of display and tracking components information foreach system is shown in Table 4—characterizing the potentialviewing experience of a user by indicating the number of screens,screen layout, total screen area, pixel size, types of displays, andtracker vendor and model. The C6 and Cornea systems havesignificantly more pixels than any of the other systems and havethe largest viewable screen area. They also have a pixel size thatis very close to the same size as the systems with LCD screens.
Table 5 presents data about each of the primary computer sys-tems used to run each of the 3D immersive configurations analyzedin this study, including number of computer systems, operating
Table 3. Facility Requirements for 11 Immersive Visualization Systems
Name VR facility Year builtApproximatecapital cost
Approximate operationsand maintenancecosts (annual)
Part-timestaff
Full-timestaff
VERITAS Wright State University 1997 Not provided Not provided 2 0KeckCAVES UC Davis 2005 $500,000.00 $10,000 0 0DiVE Duke University 2005 $1,000,000.00 Not provided 1 2C6 VRAC-Iowa State University 2007 $10,000,000.00 $630=h 1 6Cornea KAUST 2009 $10,000,000.00 Not provided 2 5NexCave CalIT2, UC San Diego 2009 $100,000.00 Not provided — —CAES CAVE Idaho National Laboratory 2009 $1,000,000.00 $200,000.00 0 3IQ station Idaho National Laboratory 2009 $25,000.00 Not provided 0 3I-SPACE Madrid, Spain 2010 Not provided Not provided 2 0CAVE2 EVL-University of Illinois at Chicago 2012 $750,000.00 Not provided — —VuePod Brigham Young University 2013 $30,000.00 $25,000.00 3 0
© ASCE 05014011-7 J. Comput. Civ. Eng.
J. Comput. Civ. Eng.
Dow
nloa
ded
from
asc
elib
rary
.org
by
UN
IVE
RSI
TY
OF
SYD
NE
Y o
n 09
/05/
14. C
opyr
ight
ASC
E. F
or p
erso
nal u
se o
nly;
all
righ
ts r
eser
ved.
Tab
le4.
Display
andTrackingCom
ponentsfor11
Immersive
VisualizationSy
stem
s
Nam
eNum
ber
ofscreens
Display
layout
Totalscreen
area
[m2(ft2)]
Total
pixels
(3D)
Pixel
size
(mm)
Display
technology
Display
vendor
Display
model
Type
of3D
Tracking
technology
Tracking
vendor/m
odel
C6
6Cube-four
walls,floor,ceiling
56(600)
100.7M
0.74
Projector
Sony
SRX-S105
Beacon
Ultrasonic
Intersense
900
Cornea
6Cube-four
walls,floor,ceiling
56(600)
100.7M
0.74
Projector
Sony
SRX-T110
Active
Ultrasonic
Intersense
IS900
NexCave
9Wall:3rowsof
319
(200)
22.5
M0.64
LCD
——
——
—VERITAS
5Cube-four
walls,floor
47(500)
7.2M
0.39
Projector
Barco
NW-12
Active
Intertiaacoustic
Intersense
IS-900
I-SP
ACE
5Cube-front,left,right,
floor,ceiling
47(496)
8.82
2.28
Projector-DLP
Barco
3DBARCO
Galaxy
Active
Optical
ART
KeckC
AVES
4Cube-front,left,right,floor
30(320)
5.24M
2.38
Projector-DLP
Christie
Mirage
S+4K
Active
Hybridintertial/
ultrasound
Intersense
IS900
DiVE
6Cube-front,left,right,
floor,ceiling
50(543)
6.62M
2.70
Projector
Christie
MirageS+
2KActive
Ultrasonic
Intersense
IS-900
Visbox
1Wall
3(33)
0.78M
1.98
Projector
——
Active
Optical
VisTrack
CAVE2
72320-degree
panoramic
19(200)
37M
0.64
LCD
panels
——
—Optical
—CAESCAVE
4Cube:
left,right,center,floor
28(300)
5.88M
2.18
Projector-DLP
Digital
Projectio
n—
Active
Optical
Intersense
IS900
IQ-Statio
n1
Single
screen
2(20)
2.07M
0.64
—Mitsubishi
—Active
Optical
ARTSM
ARTTRACK
VuePo
d12
Wall—
3rowsof
410
(108)
12.44M
0.64
LCD
LG
—Passive
Optical
ARTSM
ARTTRACK
Tab
le5.
Com
putatio
nalHardw
areandSo
ftwareCom
parison
Prim
arycomputersystem
Nam
eNum
berof
computersources
Num
berof
processors
RAM
(GB)
Operatin
gsystem
(s)
Num
berof
videocards
Video
card
model
Prim
arysoftware
Other
software
VERITAS
510
40WindowsXPor
7/Linux
5NvidiaQuadro5600
PresagisVegaPrime
Delta3D
with
Vrui,Trackd
KeckC
AVES
66
—Linux
5NvidiaGeForce
470,
Nvidia
QuadroFX
5800
Vrui
—
DiVE
756
8WindowsXP/Windows7
6NvidiaQuadraFX
5600
With
Gsync
add-on
Virtools,Avizo,Syzygy,Unity
MATL
AB,Maya
C6
4896
32Linux
Redhat/W
indows7
8NVID
IAQuadro6000
VRJuggler,OpenSceneGraph
—Cornea
2550
RH
SL6
96NvidiaQuadra5600
AVIZO,TE
CHVIZ,CALV
R—
NexCave
——
——
——
CALV
R—
CAESCAVE
18
24Windows/Linux
4Dual-QuadroplexG2
Vrui
—IQ
-Statio
n1
12Windows/Linux
——
Vrui
—I-SP
ACE
612
48WindowsXP/Linux
6NvidiaQuadroFX
5800
Pcle
w/4GB
ofmem
ory
3DVIA
Virtools4.0/5.0
Unity3D
,MiddleV
R,
OpenSceneGraph
CAVE2
36—
——
——
——
VuePo
d1
1224
Windows/Linux
3QuadroK5000
Vrui
Navisworks
© ASCE 05014011-8 J. Comput. Civ. Eng.
J. Comput. Civ. Eng.
Dow
nloa
ded
from
asc
elib
rary
.org
by
UN
IVE
RSI
TY
OF
SYD
NE
Y o
n 09
/05/
14. C
opyr
ight
ASC
E. F
or p
erso
nal u
se o
nly;
all
righ
ts r
eser
ved.
system, and other hardware details. Number of computers requiredranges from 48 (C6) to 1 (VuePod, Center for Advanced EnergyStudies–CAES CAVE, and the IQ-Station). Similarly, the numberof processors used ranges from 96 (C6) to 6. Extensive computa-tional hardware requirements contribute directly to long-term main-tenance and replacement costs for any such facility; hence, thosesystems with fewer components are expected to require less on-going maintenance.
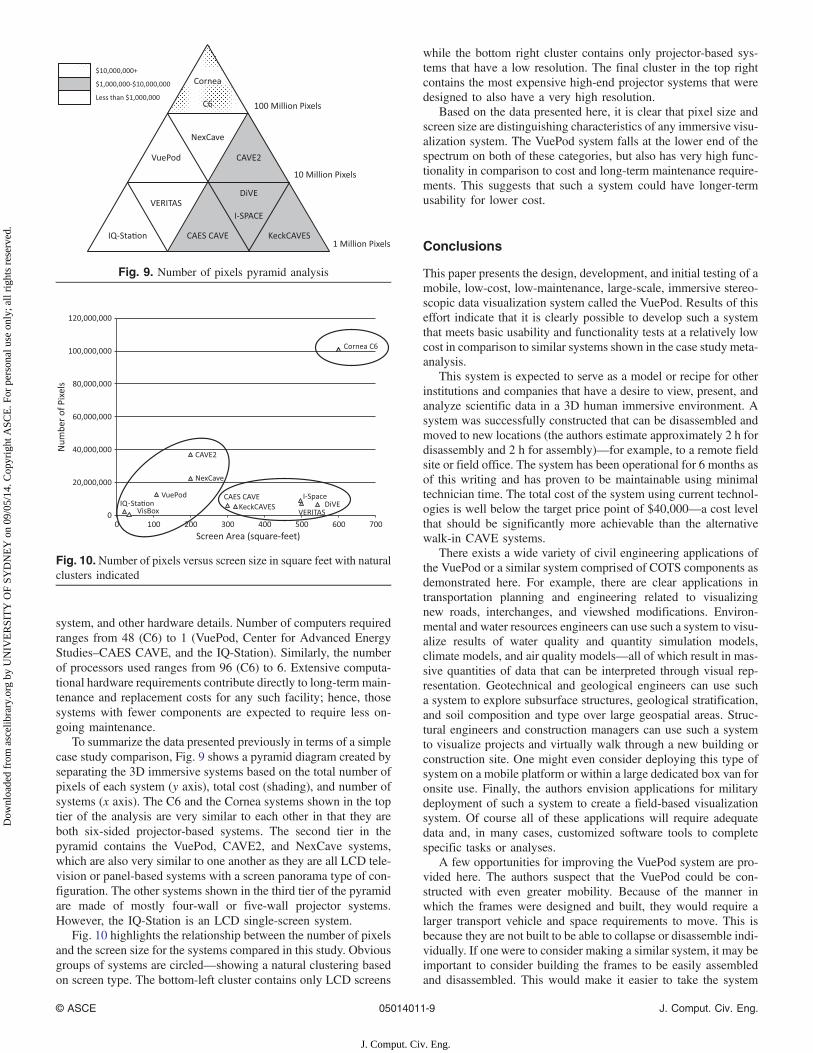
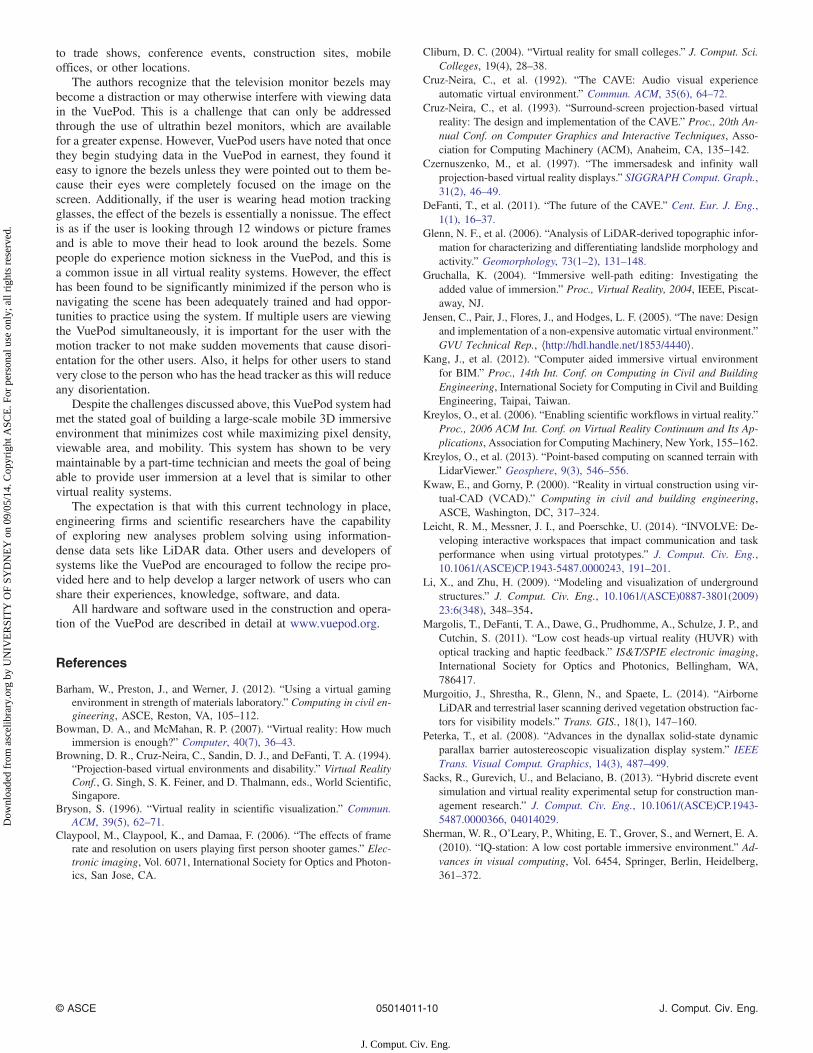
To summarize the data presented previously in terms of a simplecase study comparison, Fig. 9 shows a pyramid diagram created byseparating the 3D immersive systems based on the total number ofpixels of each system (y axis), total cost (shading), and number ofsystems (x axis). The C6 and the Cornea systems shown in the toptier of the analysis are very similar to each other in that they areboth six-sided projector-based systems. The second tier in thepyramid contains the VuePod, CAVE2, and NexCave systems,which are also very similar to one another as they are all LCD tele-vision or panel-based systems with a screen panorama type of con-figuration. The other systems shown in the third tier of the pyramidare made of mostly four-wall or five-wall projector systems.However, the IQ-Station is an LCD single-screen system.
Fig. 10 highlights the relationship between the number of pixelsand the screen size for the systems compared in this study. Obviousgroups of systems are circled—showing a natural clustering basedon screen type. The bottom-left cluster contains only LCD screens
while the bottom right cluster contains only projector-based sys-tems that have a low resolution. The final cluster in the top rightcontains the most expensive high-end projector systems that weredesigned to also have a very high resolution.
Based on the data presented here, it is clear that pixel size andscreen size are distinguishing characteristics of any immersive visu-alization system. The VuePod system falls at the lower end of thespectrum on both of these categories, but also has very high func-tionality in comparison to cost and long-term maintenance require-ments. This suggests that such a system could have longer-termusability for lower cost.
Conclusions
This paper presents the design, development, and initial testing of amobile, low-cost, low-maintenance, large-scale, immersive stereo-scopic data visualization system called the VuePod. Results of thiseffort indicate that it is clearly possible to develop such a systemthat meets basic usability and functionality tests at a relatively lowcost in comparison to similar systems shown in the case study meta-analysis.
This system is expected to serve as a model or recipe for otherinstitutions and companies that have a desire to view, present, andanalyze scientific data in a 3D human immersive environment. Asystem was successfully constructed that can be disassembled andmoved to new locations (the authors estimate approximately 2 h fordisassembly and 2 h for assembly)—for example, to a remote fieldsite or field office. The system has been operational for 6 months asof this writing and has proven to be maintainable using minimaltechnician time. The total cost of the system using current technol-ogies is well below the target price point of $40,000—a cost levelthat should be significantly more achievable than the alternativewalk-in CAVE systems.
There exists a wide variety of civil engineering applications ofthe VuePod or a similar system comprised of COTS components asdemonstrated here. For example, there are clear applications intransportation planning and engineering related to visualizingnew roads, interchanges, and viewshed modifications. Environ-mental and water resources engineers can use such a system to visu-alize results of water quality and quantity simulation models,climate models, and air quality models—all of which result in mas-sive quantities of data that can be interpreted through visual rep-resentation. Geotechnical and geological engineers can use sucha system to explore subsurface structures, geological stratification,and soil composition and type over large geospatial areas. Struc-tural engineers and construction managers can use such a systemto visualize projects and virtually walk through a new building orconstruction site. One might even consider deploying this type ofsystem on a mobile platform or within a large dedicated box van foronsite use. Finally, the authors envision applications for militarydeployment of such a system to create a field-based visualizationsystem. Of course all of these applications will require adequatedata and, in many cases, customized software tools to completespecific tasks or analyses.
A few opportunities for improving the VuePod system are pro-vided here. The authors suspect that the VuePod could be con-structed with even greater mobility. Because of the manner inwhich the frames were designed and built, they would require alarger transport vehicle and space requirements to move. This isbecause they are not built to be able to collapse or disassemble indi-vidually. If one were to consider making a similar system, it may beimportant to consider building the frames to be easily assembledand disassembled. This would make it easier to take the system
Fig. 9. Number of pixels pyramid analysis
Fig. 10.Number of pixels versus screen size in square feet with naturalclusters indicated
© ASCE 05014011-9 J. Comput. Civ. Eng.
J. Comput. Civ. Eng.
Dow
nloa
ded
from
asc
elib
rary
.org
by
UN
IVE
RSI
TY
OF
SYD
NE
Y o
n 09
/05/
14. C
opyr
ight
ASC
E. F
or p
erso
nal u
se o
nly;
all
righ
ts r
eser
ved.
to trade shows, conference events, construction sites, mobileoffices, or other locations.
The authors recognize that the television monitor bezels maybecome a distraction or may otherwise interfere with viewing datain the VuePod. This is a challenge that can only be addressedthrough the use of ultrathin bezel monitors, which are availablefor a greater expense. However, VuePod users have noted that oncethey begin studying data in the VuePod in earnest, they found iteasy to ignore the bezels unless they were pointed out to them be-cause their eyes were completely focused on the image on thescreen. Additionally, if the user is wearing head motion trackingglasses, the effect of the bezels is essentially a nonissue. The effectis as if the user is looking through 12 windows or picture framesand is able to move their head to look around the bezels. Somepeople do experience motion sickness in the VuePod, and this isa common issue in all virtual reality systems. However, the effecthas been found to be significantly minimized if the person who isnavigating the scene has been adequately trained and had oppor-tunities to practice using the system. If multiple users are viewingthe VuePod simultaneously, it is important for the user with themotion tracker to not make sudden movements that cause disori-entation for the other users. Also, it helps for other users to standvery close to the person who has the head tracker as this will reduceany disorientation.
Despite the challenges discussed above, this VuePod system hadmet the stated goal of building a large-scale mobile 3D immersiveenvironment that minimizes cost while maximizing pixel density,viewable area, and mobility. This system has shown to be verymaintainable by a part-time technician and meets the goal of beingable to provide user immersion at a level that is similar to othervirtual reality systems.
The expectation is that with this current technology in place,engineering firms and scientific researchers have the capabilityof exploring new analyses problem solving using information-dense data sets like LiDAR data. Other users and developers ofsystems like the VuePod are encouraged to follow the recipe pro-vided here and to help develop a larger network of users who canshare their experiences, knowledge, software, and data.
All hardware and software used in the construction and opera-tion of the VuePod are described in detail at www.vuepod.org.
References
Barham, W., Preston, J., and Werner, J. (2012). “Using a virtual gamingenvironment in strength of materials laboratory.” Computing in civil en-gineering, ASCE, Reston, VA, 105–112.
Bowman, D. A., and McMahan, R. P. (2007). “Virtual reality: How muchimmersion is enough?” Computer, 40(7), 36–43.
Browning, D. R., Cruz-Neira, C., Sandin, D. J., and DeFanti, T. A. (1994).“Projection-based virtual environments and disability.” Virtual RealityConf., G. Singh, S. K. Feiner, and D. Thalmann, eds., World Scientific,Singapore.
Bryson, S. (1996). “Virtual reality in scientific visualization.” Commun.ACM, 39(5), 62–71.
Claypool, M., Claypool, K., and Damaa, F. (2006). “The effects of framerate and resolution on users playing first person shooter games.” Elec-tronic imaging, Vol. 6071, International Society for Optics and Photon-ics, San Jose, CA.
Cliburn, D. C. (2004). “Virtual reality for small colleges.” J. Comput. Sci.Colleges, 19(4), 28–38.
Cruz-Neira, C., et al. (1992). “The CAVE: Audio visual experienceautomatic virtual environment.” Commun. ACM, 35(6), 64–72.
Cruz-Neira, C., et al. (1993). “Surround-screen projection-based virtualreality: The design and implementation of the CAVE.” Proc., 20th An-nual Conf. on Computer Graphics and Interactive Techniques, Asso-ciation for Computing Machinery (ACM), Anaheim, CA, 135–142.
Czernuszenko, M., et al. (1997). “The immersadesk and infinity wallprojection-based virtual reality displays.” SIGGRAPH Comput. Graph.,31(2), 46–49.
DeFanti, T., et al. (2011). “The future of the CAVE.” Cent. Eur. J. Eng.,1(1), 16–37.
Glenn, N. F., et al. (2006). “Analysis of LiDAR-derived topographic infor-mation for characterizing and differentiating landslide morphology andactivity.” Geomorphology, 73(1–2), 131–148.
Gruchalla, K. (2004). “Immersive well-path editing: Investigating theadded value of immersion.” Proc., Virtual Reality, 2004, IEEE, Piscat-away, NJ.
Jensen, C., Pair, J., Flores, J., and Hodges, L. F. (2005). “The nave: Designand implementation of a non-expensive automatic virtual environment.”GVU Technical Rep., ⟨http://hdl.handle.net/1853/4440⟩.
Kang, J., et al. (2012). “Computer aided immersive virtual environmentfor BIM.” Proc., 14th Int. Conf. on Computing in Civil and BuildingEngineering, International Society for Computing in Civil and BuildingEngineering, Taipai, Taiwan.
Kreylos, O., et al. (2006). “Enabling scientific workflows in virtual reality.”Proc., 2006 ACM Int. Conf. on Virtual Reality Continuum and Its Ap-plications, Association for Computing Machinery, New York, 155–162.
Kreylos, O., et al. (2013). “Point-based computing on scanned terrain withLidarViewer.” Geosphere, 9(3), 546–556.
Kwaw, E., and Gorny, P. (2000). “Reality in virtual construction using vir-tual-CAD (VCAD).” Computing in civil and building engineering,ASCE, Washington, DC, 317–324.
Leicht, R. M., Messner, J. I., and Poerschke, U. (2014). “INVOLVE: De-veloping interactive workspaces that impact communication and taskperformance when using virtual prototypes.” J. Comput. Civ. Eng.,10.1061/(ASCE)CP.1943-5487.0000243, 191–201.
Li, X., and Zhu, H. (2009). “Modeling and visualization of undergroundstructures.” J. Comput. Civ. Eng., 10.1061/(ASCE)0887-3801(2009)23:6(348), 348–354.
Margolis, T., DeFanti, T. A., Dawe, G., Prudhomme, A., Schulze, J. P., andCutchin, S. (2011). “Low cost heads-up virtual reality (HUVR) withoptical tracking and haptic feedback.” IS&T/SPIE electronic imaging,International Society for Optics and Photonics, Bellingham, WA,786417.
Murgoitio, J., Shrestha, R., Glenn, N., and Spaete, L. (2014). “AirborneLiDAR and terrestrial laser scanning derived vegetation obstruction fac-tors for visibility models.” Trans. GIS., 18(1), 147–160.
Peterka, T., et al. (2008). “Advances in the dynallax solid-state dynamicparallax barrier autostereoscopic visualization display system.” IEEETrans. Visual Comput. Graphics, 14(3), 487–499.
Sacks, R., Gurevich, U., and Belaciano, B. (2013). “Hybrid discrete eventsimulation and virtual reality experimental setup for construction man-agement research.” J. Comput. Civ. Eng., 10.1061/(ASCE)CP.1943-5487.0000366, 04014029.
Sherman, W. R., O’Leary, P., Whiting, E. T., Grover, S., and Wernert, E. A.(2010). “IQ-station: A low cost portable immersive environment.” Ad-vances in visual computing, Vol. 6454, Springer, Berlin, Heidelberg,361–372.
© ASCE 05014011-10 J. Comput. Civ. Eng.
J. Comput. Civ. Eng.
Dow
nloa
ded
from
asc
elib
rary
.org
by
UN
IVE
RSI
TY
OF
SYD
NE
Y o
n 09
/05/
14. C
opyr
ight
ASC
E. F
or p
erso
nal u
se o
nly;
all
righ
ts r
eser
ved.