Embed Size (px)
Citation preview

MOBILE LOCATION AND THE TALE OF RETAIL ROI

MATTHEW DAVISVP [email protected]
CAMERON VAN [email protected]
MOBILE LOCATION AND THE TALE OF RETAIL ROI

THE RISE OF MOBILE LOCATIONRETAIL DATA STUDIES
USE CASES & CASE STUDIES
Presentation available after the webinar
MOBILE LOCATION AND THE TALE OF RETAIL ROI

RISE OF MOBILE LOCATION

MOBILE LOCATION AND THE TALE OF RETAIL ROI

MOBILE LOCATION AND THE TALE OF RETAIL ROI
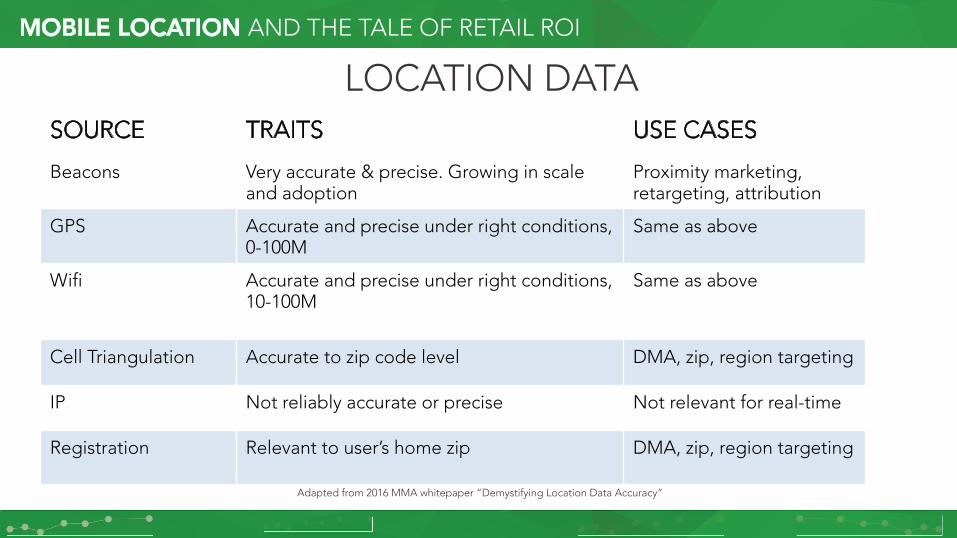
LOCATION DATAMOBILE LOCATION AND THE TALE OF RETAIL ROI
SOURCE TRAITS USE CASES
Beacons Very accurate & precise. Growing in scale and adoption
Proximity marketing, retargeting, attribution
GPS Accurate and precise under right conditions, 0-100M
Same as above
Wifi Accurate and precise under right conditions, 10-100M
Same as above
Cell Triangulation Accurate to zip code level DMA, zip, region targeting
IP Not reliably accurate or precise Not relevant for real-time
Registration Relevant to user’s home zip DMA, zip, region targeting
Adapted from 2016 MMA whitepaper “Demystifying Location Data Accuracy”

500,000,000** By 2021, ABI Research
MOBILE LOCATION AND THE TALE OF RETAIL ROI

DATA STUDIESPairing mobile, beacons, and retail

HOW REVEAL MOBILE SOURCES THE DATA
SDK “Listen Only” for iBeacon & Eddystone + PartnershipsWe also use GPS & Wi-Fi dataSome places more represented – Beacons increase dataData collected over 30 days881,684 Devices in seen at “Retail”
400+apps
MOBILE LOCATION AND THE TALE OF RETAIL ROI
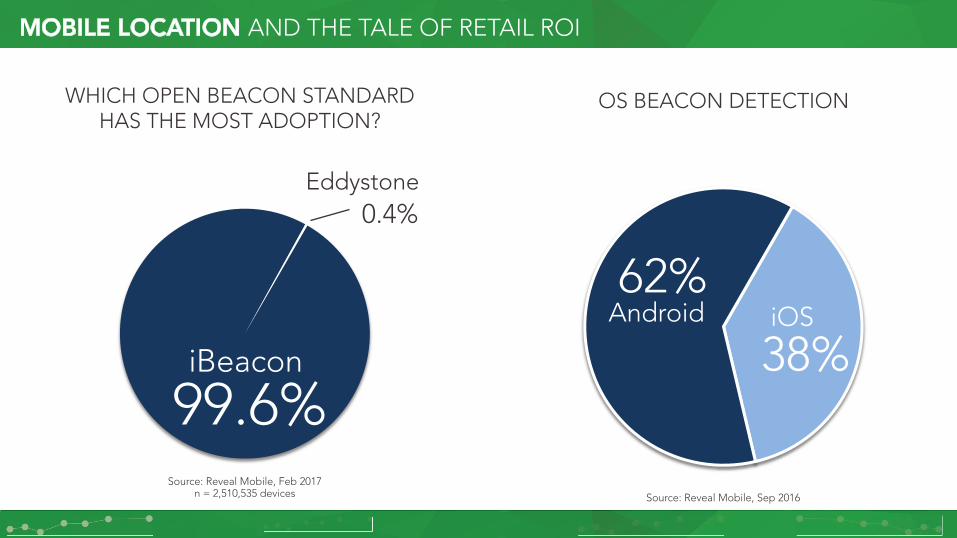
WHICH OPEN BEACON STANDARD HAS THE MOST ADOPTION?
iBeacon
99.6%
Eddystone0.4%
Source: Reveal Mobile, Feb 2017n = 2,510,535 devices
OS BEACON DETECTION
iOS
38%Android62%
Source: Reveal Mobile, Sep 2016
MOBILE LOCATION AND THE TALE OF RETAIL ROI
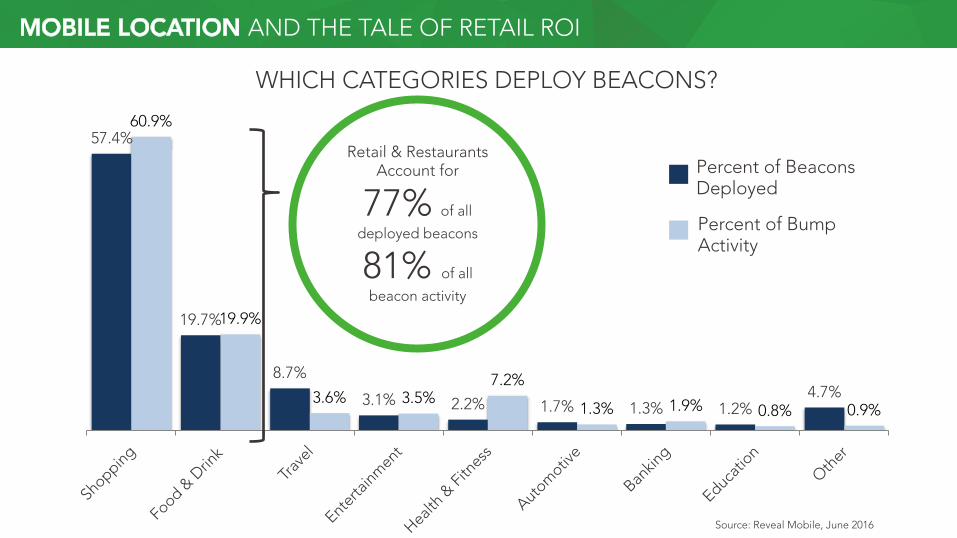
WHICH CATEGORIES DEPLOY BEACONS?
57.4%
19.7%
8.7%
3.1% 2.2% 1.7% 1.3% 1.2%4.7%
60.9%
19.9%
3.6% 3.5%7.2%
1.3% 1.9% 0.8% 0.9%
Retail & Restaurants Account for
77% of all
deployed beacons
81% of all
beacon activity
Source: Reveal Mobile, June 2016
Percent of Beacons Deployed
Percent of Bump Activity
MOBILE LOCATION AND THE TALE OF RETAIL ROI

841,261Seen via GPS
95.4%
198,530Seen via beacon22.5%
Source: Reveal Mobile, Feb 2017
MOBILE LOCATION AND THE TALE OF RETAIL ROI

TOTAL ACTIVITY IN RETAIL
1.7%
2.1%
2.2%
2.6%
2.9%
5.0%
7.4%
12.8%
14.0%
22.4%
26.9%
Shoe Store
Home Goods Store
Convenience Store
Clothing Store
Shopping Malls
Pet Stores
Electronics Stores
Sporting Goods
Wireless Stores
Retail
Grocery
Source: Reveal Mobile, Feb 2017
MOBILE LOCATION AND THE TALE OF RETAIL ROI
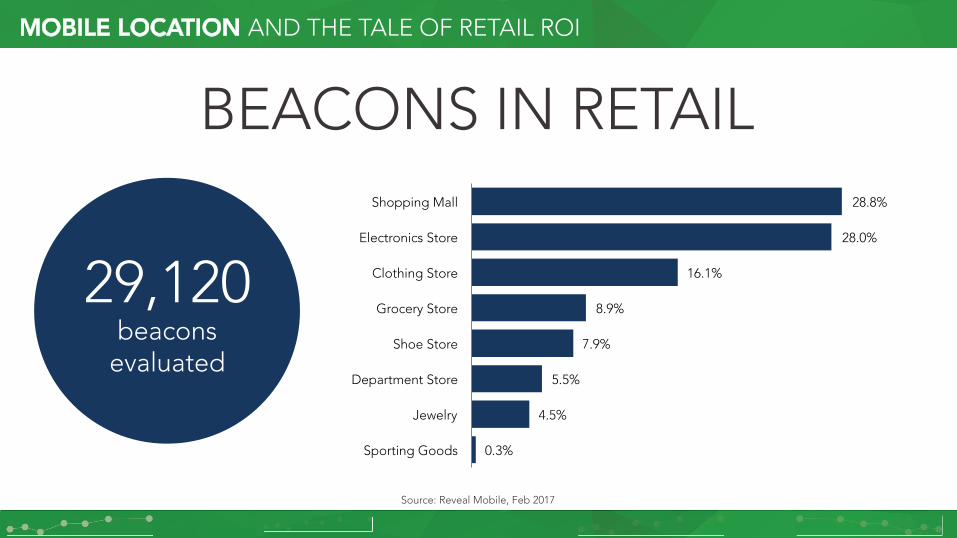
Source: Reveal Mobile, Feb 2017
29,120beacons
evaluated
54.6%
BEACONS IN RETAIL
0.3%
4.5%
5.5%
7.9%
8.9%
16.1%
28.0%
28.8%
Sporting Goods
Jewelry
Department Store
Shoe Store
Grocery Store
Clothing Store
Electronics Store
Shopping Mall
MOBILE LOCATION AND THE TALE OF RETAIL ROI

Source: Reveal Mobile, Feb 2017
54.6%
WHO DEPLOYS?
MOBILE LOCATION AND THE TALE OF RETAIL ROI
964
1088
1212
3264
3613
4651
5015
0 1000 2000 3000 4000 5000 6000
Walmart
Target
Dollar General
Apple Store
Best Buy
CVS Pharmacy
Verizon Wireless

Source: Reveal Mobile, Feb 2017
11
12
13
17
17
23
25
28
33
39
23
17
88
87
86
82
82
76
74
71
66
60
76
82
Walmart
Kroger
Walmart Supercenter
Sears
Kohl's
T.J.Maxx
Ross
Marshalls Department Store
Best Buy
Target
Retail
Overall
iOS
Android
OPERATING SYSTEM OF DEVICES VISITINGMOBILE LOCATION AND THE TALE OF RETAIL ROI
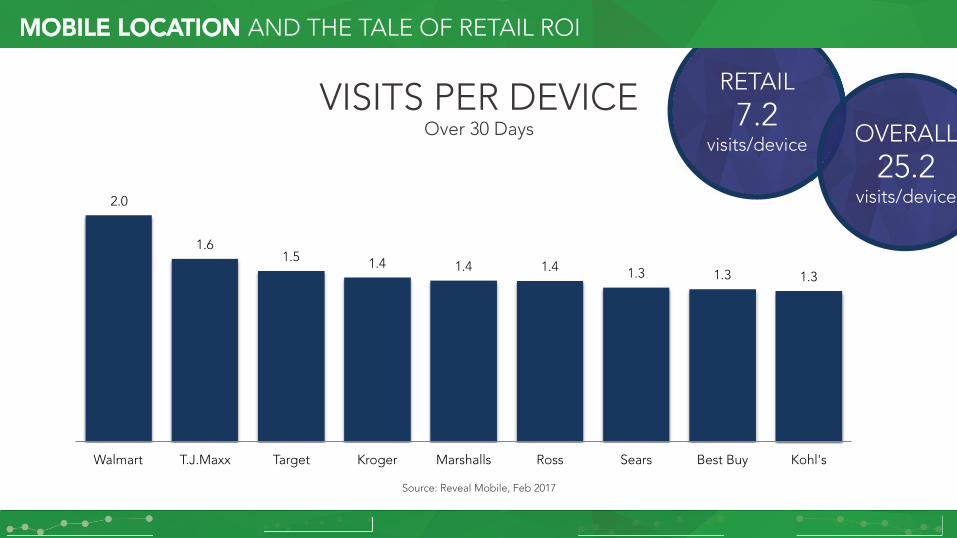
VISITS PER DEVICEOver 30 Days
RETAIL
7.2 visits/device
Source: Reveal Mobile, Feb 2017
2.0
1.61.5 1.4 1.4 1.4 1.3 1.3 1.3
Walmart T.J.Maxx Target Kroger Marshalls Ross Sears Best Buy Kohl's
MOBILE LOCATION AND THE TALE OF RETAIL ROI
OVERALL
25.2 visits/device

HOME VALUES
Source: Reveal Mobile, Feb 2017 | n=431,536 devices
49.1%
33.8%
15.4%
1.6%
<150K 150 - 250K 250 - 500K 500K+
INCOME
23.2%
65.3%
11.5%
<50K 50 - 100K 100K+
Source: Reveal Mobile, Feb 2017 | n=433,351 devices
MOBILE LOCATION AND THE TALE OF RETAIL ROI

MOBILE LOCATION AND THE TALE OF RETAIL ROI
We Turn Location Signals Into Valuable Audience Data

Retail ROI – A Gameplan
Strategy Tip 1 – Mapping to the Customer Acquisition Funnel

RETAIL CUSTOMER ACQUISITION FUNNEL
Purchase Driving: Print On Premise Mobile
General Awareness: Broadcast TV Broadcast Radio Outdoor Print Social Media Desktop Mobile
Retail Consumer Acquisition Funnel

RETAIL CUSTOMER ACQUISITION FUNNEL
Purchase Driving: Print On Premise Mobile
General Awareness: Broadcast TV Broadcast Radio Outdoor Print Social Media Desktop Mobile
Retail Consumer Acquisition Funnel

84%Use mobile in store to help make shopping
decisions
90%Use mobile for pre-shopping
Shopper Marketing Council Google NinthDecimal
Shoppers: Mobile and in the Moment
70%Influenced by mobile advertising to try a
new brand or product

Gameplan Takeaway:
DO
DON’T
Segment strategy into general awareness and purchase driving.
Rely too heavily on one level of the funnel. A balance is key.

Strategy Tip 2 – The Elements of Your Campaign

ELEMENTS – DATA

‘Well’ Data ‘Well’ Data Cell TowerTriagulationCell TowerCell TowerTriagulation BidstreamBidstream IP AddressTriagulation

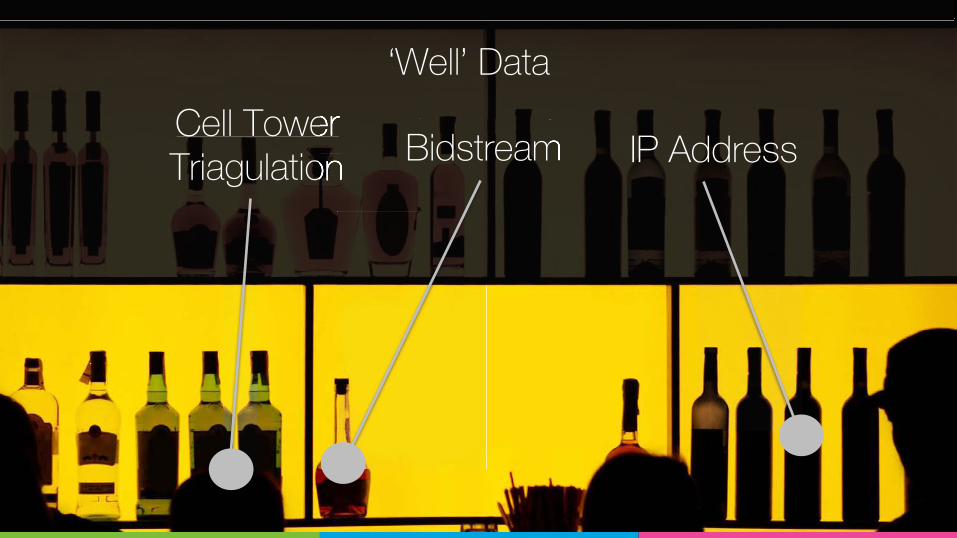
‘Well’ Data Cell TowerTriagulation Bidstream IP Address
‘Well’ Data ‘Well’ Data Cell TowerCell TowerTriagulationCell TowerCell TowerTriagulation BidstreamBidstreamBidstream IP AddressIP AddressTriagulation

Top Shelf Data
Always on Lat / Long Beacons WIFIAlways on Lat / LongLat / Long BeaconsAlways on Lat / LongLat / Long WIFI

Gameplan Takeaway:
DO
DON’T
Target using location data derived from Lat / Long, Wi-Fi and Beacons.
Rely on ‘lose’ data points such as Cell Tower Triangulation and IP Address.

Purchase Driving: •! Immediacy of message •! Relevance of source •! Value to current mission
General Awareness: •! Known interests of recipient •! Authority of source •! Scale of audience
Retail Consumer Acquisition Funnel
ELEMENTS – INVENTORY
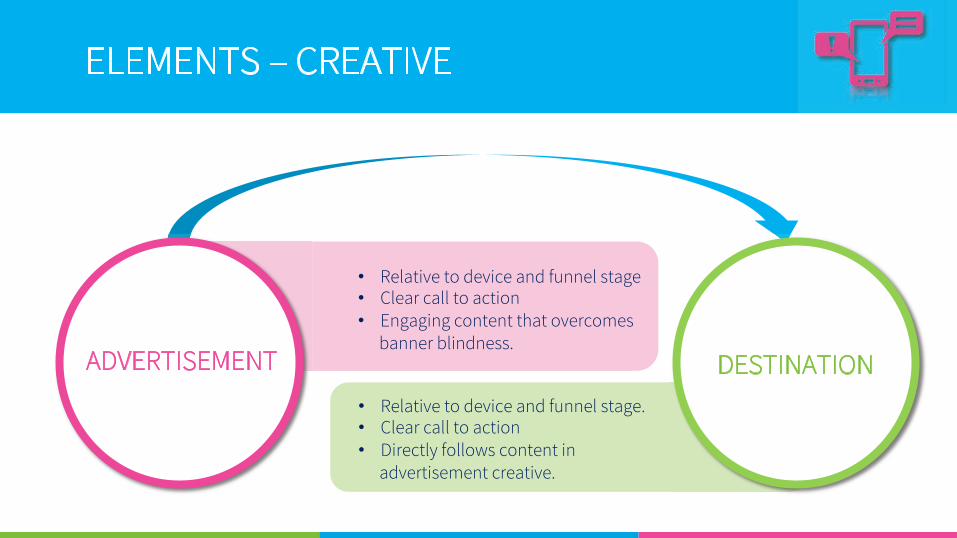
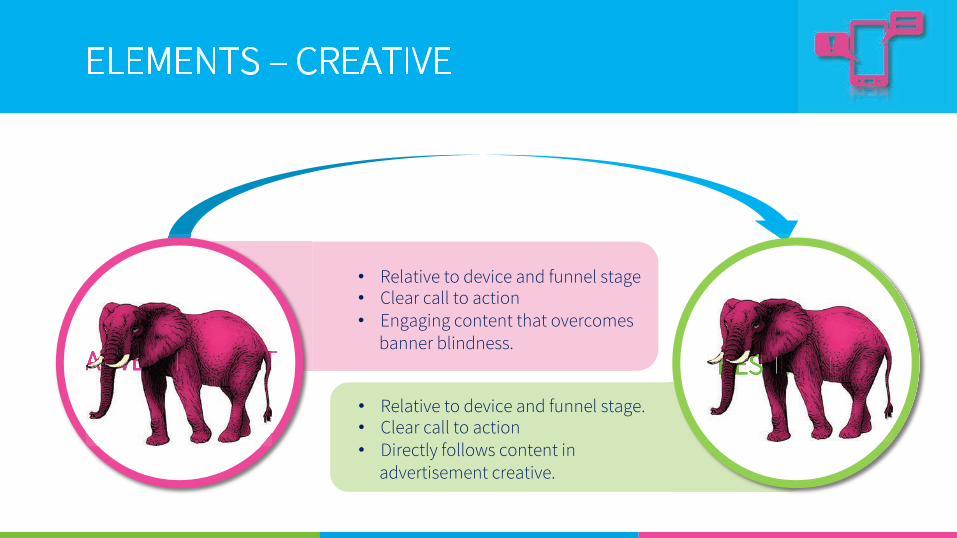
ELEMENTS – CREATIVE
ADVERTISEMENT DESTINATION
•! Relative to device and funnel stage •! Clear call to action •! Engaging content that overcomes
banner blindness.
•! Relative to device and funnel stage. •! Clear call to action •! Directly follows content in
advertisement creative.
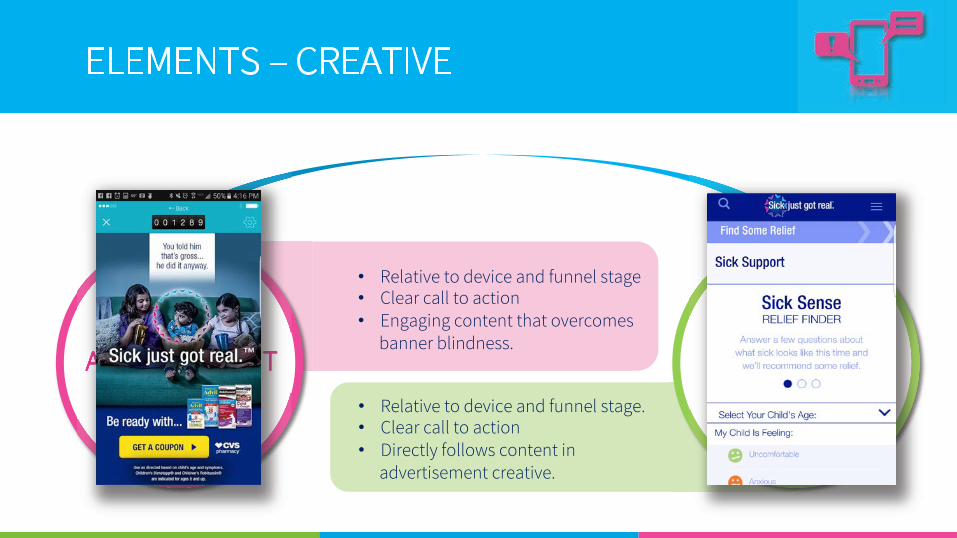
ELEMENTS – CREATIVE
ADVERTISEMENT DESTINATION
•! Relative to device and funnel stage •! Clear call to action •! Engaging content that overcomes
banner blindness.
•! Relative to device and funnel stage. •! Clear call to action •! Directly follows content in
advertisement creative.
ADVERTISEMENT DESTINATION

Gameplan Takeaway:
DO
DON’T
Choose an inventory partner that can fulfill your general awareness and purchase driving KPIs.
Rely on volume alone, programmatic alone or the shotgun strategy.

Gameplan Takeaway:
DO
DON’T
Use creative that is relevant, clear and engaging.
Use one set of creative for desktop and mobile, or mistake brand awareness for loyalty or intent to purchase.

GUEST SPEAKER – MK WOLTZ
MK WoltzGroup Media DirectorInteger

Strategy Tip 4 – Choosing a Vendor

CHOOSING A MEDIA PARTNER
• Provides general awareness and purchase driving opportunities.
• Has first-party GPS and beacon data.
• Uses trusted sources for inventory that the customer relies on.
• Has scale to reach multiple types of consumers and fulfill campaigns.
• Has proven success delivering ROI for the world’s top brands.
• Provides creative design and strategic planning services.
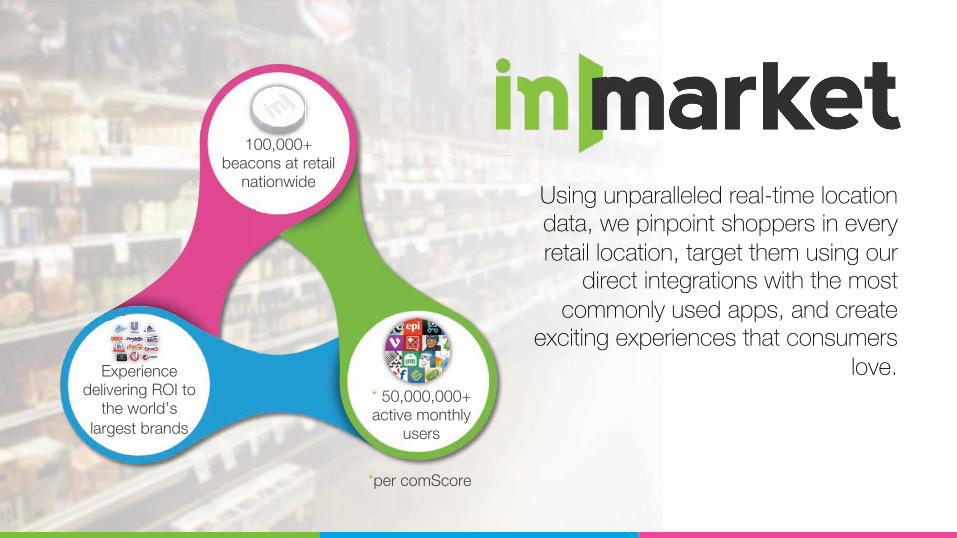
Using unparalleled real-time location data, we pinpoint shoppers in every retail location, target them using our
direct integrations with the most commonly used apps, and create
exciting experiences that consumers love.
*per comScore
100,000+ beacons at retail
nationwide
Experience delivering ROI to
the world’s largest brands
* 50,000,000+ active monthly
users
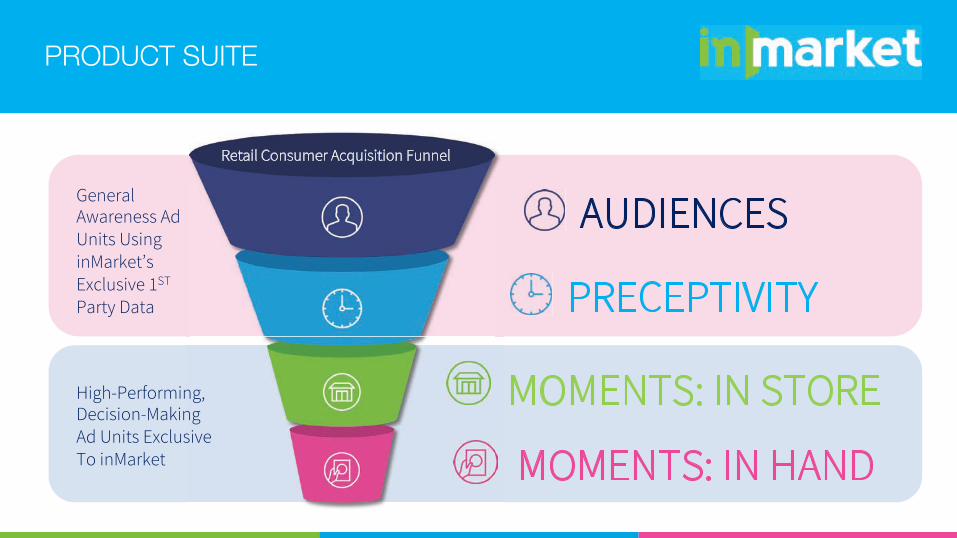
AUDIENCES
PRECEPTIVITY
MOMENTS: IN STORE
MOMENTS: IN HAND
High-Performing, Decision-Making Ad Units Exclusive To inMarket
General Awareness Ad Units Using inMarket’s Exclusive 1ST Party Data
Retail Consumer Acquisition Funnel
PRODUCT SUITE
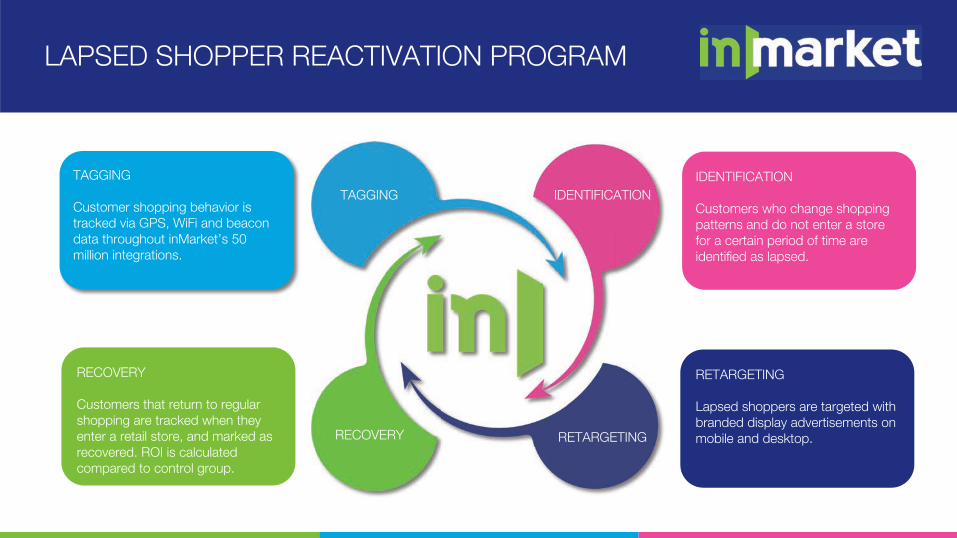
LAPSED SHOPPER REACTIVATION PROGRAM
TAGGING! IDENTIFICATION!
RETARGETING!RECOVERY!
TAGGING Customer shopping behavior is tracked via GPS, WiFi and beacon data throughout inMarket’s 50 million integrations. !
RECOVERY Customers that return to regular shopping are tracked when they enter a retail store, and marked as recovered. ROI is calculated compared to control group. !
RETARGETING Lapsed shoppers are targeted with branded display advertisements on mobile and desktop. !
IDENTIFICATION Customers who change shopping patterns and do not enter a store for a certain period of time are identified as lapsed. !

Metrics to Prove SuccessWhatever your KPIs, we provide you deep insights into your campaign’s success.Sales lift*, Brand awareness lift, Purchase intent lift, CTR, Moments delivered.
* Sales volume data can be provided by IRi, an independent 3rd party vendor.

Q&A

MATTHEW DAVISVP [email protected]
CAMERON VAN [email protected]
MOBILE LOCATION AND THE TALE OF RETAIL ROI
MOBILE LOCATION AND THE TALE OF RETAIL ROI


![UserPlane Location Protocol - Open Mobile · PDF file[3GPP RRLP] 3GPP TS 44.031, “Location Services (LCS); Mobile Station (MS) – Serving Mobile Location](https://img.dokumen.tips/doc/110x75/5aa2788a7f8b9a80378d0a83/userplane-location-protocol-open-mobile-3gpp-rrlp-3gpp-ts-44031-location.jpg)