Embed Size (px)
DESCRIPTION
“Mixed layer” models. - PowerPoint PPT Presentation
Citation preview
“Mixed layer” models
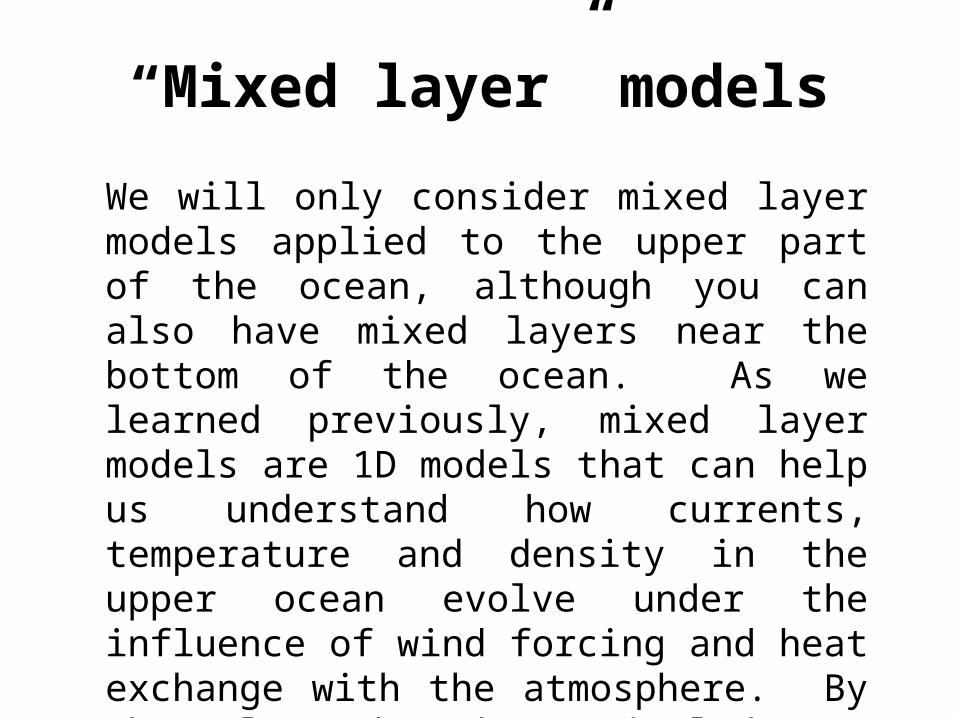
We will only consider mixed layer models applied to the upper part of the ocean, although you can also have mixed layers near the bottom of the ocean. As we learned previously, mixed layer models are 1D models that can help us understand how currents, temperature and density in the upper ocean evolve under the influence of wind forcing and heat exchange with the atmosphere. By themselves they do not include any effects due to coastal boundaries, tides, fronts etc.
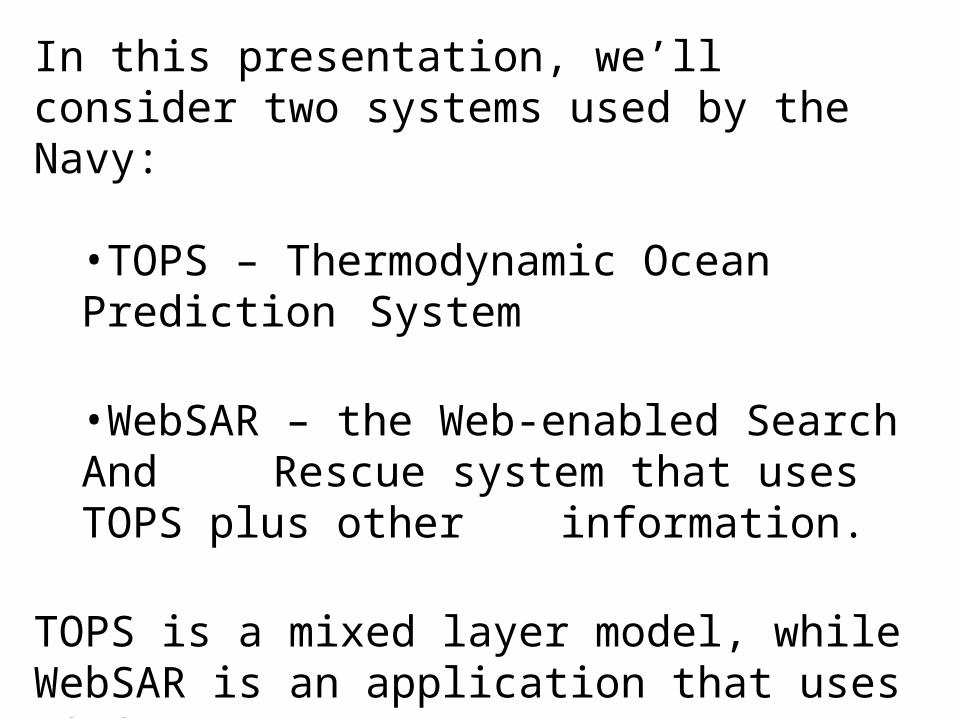
In this presentation, we’ll consider two systems used by the Navy:
•TOPS – Thermodynamic Ocean Prediction System
•WebSAR – the Web-enabled Search And Rescue system that uses TOPS plus other information.
TOPS is a mixed layer model, while WebSAR is an application that uses TOPS.
TOPSThermodynamic Ocean Prediction System
Primary contacts: Webb Dewitt (FNMOC)
TOPS was developed by the Navy and has been running at FNMOC, or its predecessors, since the 1980s. It is currently used primarily for estimates of surface drift. Regional TOPS is scheduled to be phased out in the near future, but global TOPS will be run until replaced by another global model.
TOPS, the upper ocean mixed layer prediction model currently operational at FNMOC, “is essentially a synoptic mixed-layer model that consists of conservation equations for T, S, and momentum in the upper 400 m of the ocean” (Clancy and Sadler 1992; Clancy and Pollack 1983).
TOPShttp://www.fnmoc.navy.mil/
Physics
• 1D mixed layer model• 2nd order closure scheme for vertical mixing• Includes horizontal and vertical advection of
T and S (so it’s not strictly 1D) (Clancy and Sadler 1992)
• Ekman and inertial currents generated by TOPS
• Surface geostrophic currents, based on OTIS dynamic sea surface height field, are included in the regional, but not the global, version.
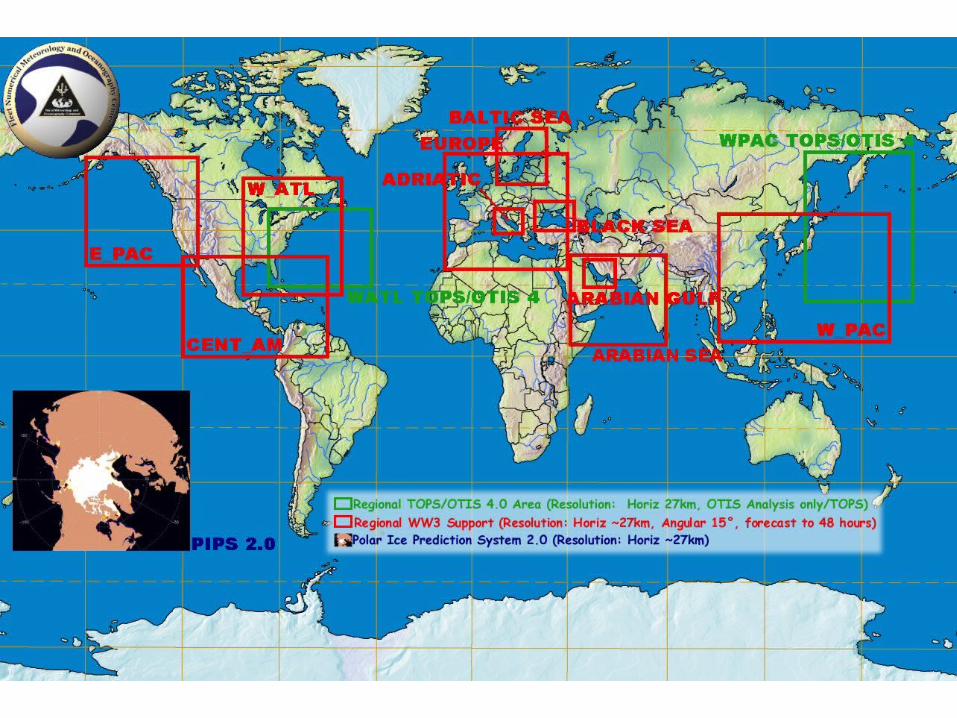
Domain
• Global
• Regional– West Atlantic– West Pacific
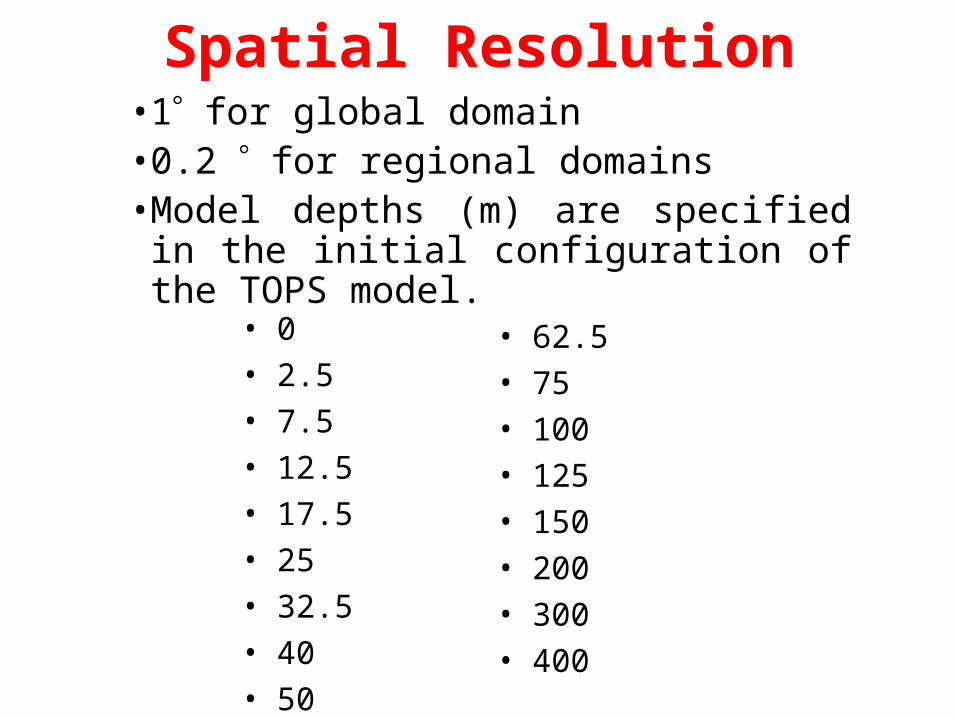
Spatial Resolution• 1 for global domain• 0.2 for regional domains• Model depths (m) are specified in the
initial configuration of the TOPS model.• 0
• 2.5
• 7.5
• 12.5
• 17.5
• 25
• 32.5
• 40
• 50
• 62.5
• 75
• 100
• 125
• 150
• 200
• 300
• 400
Temporal resolution
• TOPS uses a 1 hr time step
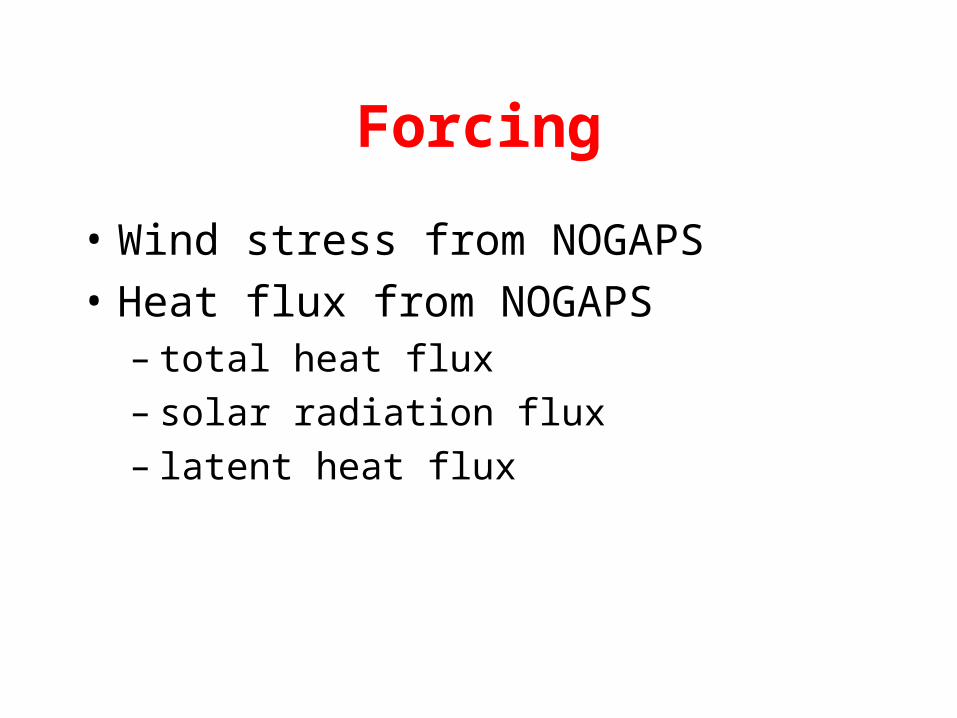
Forcing
• Wind stress from NOGAPS
• Heat flux from NOGAPS– total heat flux– solar radiation flux– latent heat flux
Initialization• OTIS provides initial conditions
– T and S fields at all depths at which the forecast is run
• 24-hr forecast currents at all model depths from the previous day's forecast are saved to local disk files in order to keep a history of the ocean momentum and assure continuity of the forecasts. In this manner, the model "restarts" each day from previously forecast momentum fields and updated T and S fields.
• If the forecast velocity is not available, the model initializes the velocity to zero.
Data Assimilation
• See OTIS description for data assimilated into T and S fields used for initialization.
• No data is assimilated during the forecast.
Implementation
• Global domain runs daily on the Cray C90.
• Regional forecasts are run daily on an SGI.
Output• Global: 72-hr forecast of upper ocean (surface – 400 m)
V, T, and S. • Regional: 48-hr forecasts• Forecasts are in 6-hr time steps• Surface current and temperature, and MLD, fields in .dat
format thumbnails for viewing in JMV• For the most part, if thumbnails include TOPS at all, it is
just SST at 12 hr intervals. Only a few currently include currents.
• TOPS currents are used to drive search and rescue model.
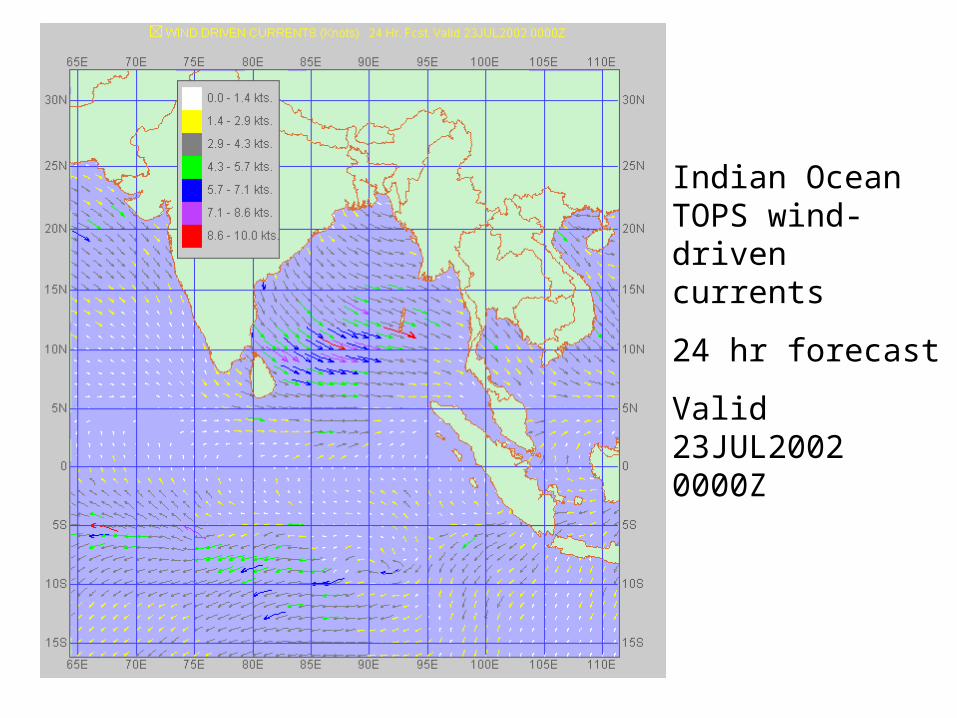
Indian Ocean TOPS wind-driven currents
24 hr forecast
Valid 23JUL2002 0000Z
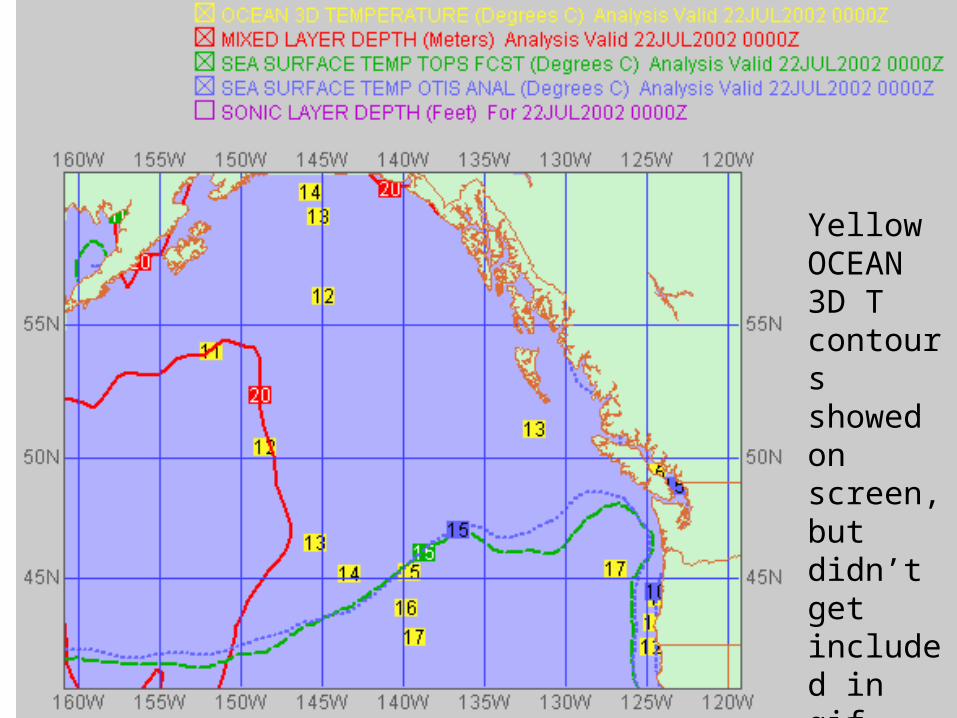
Yellow OCEAN 3D T contours showed on screen, but didn’t get included in gif file
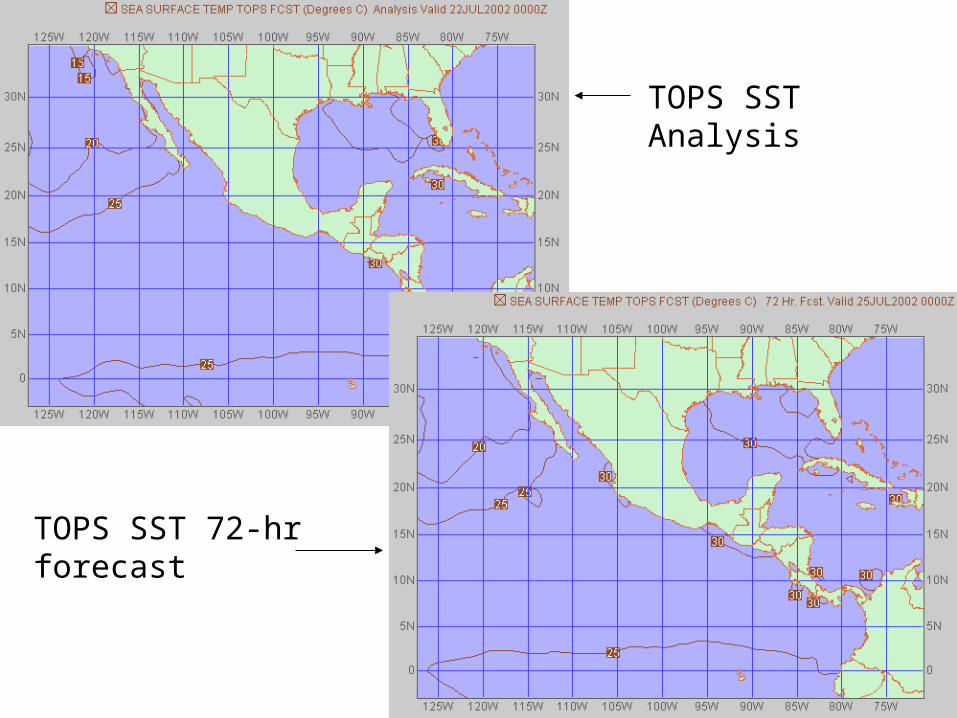
TOPS SST Analysis
TOPS SST 72-hr forecast
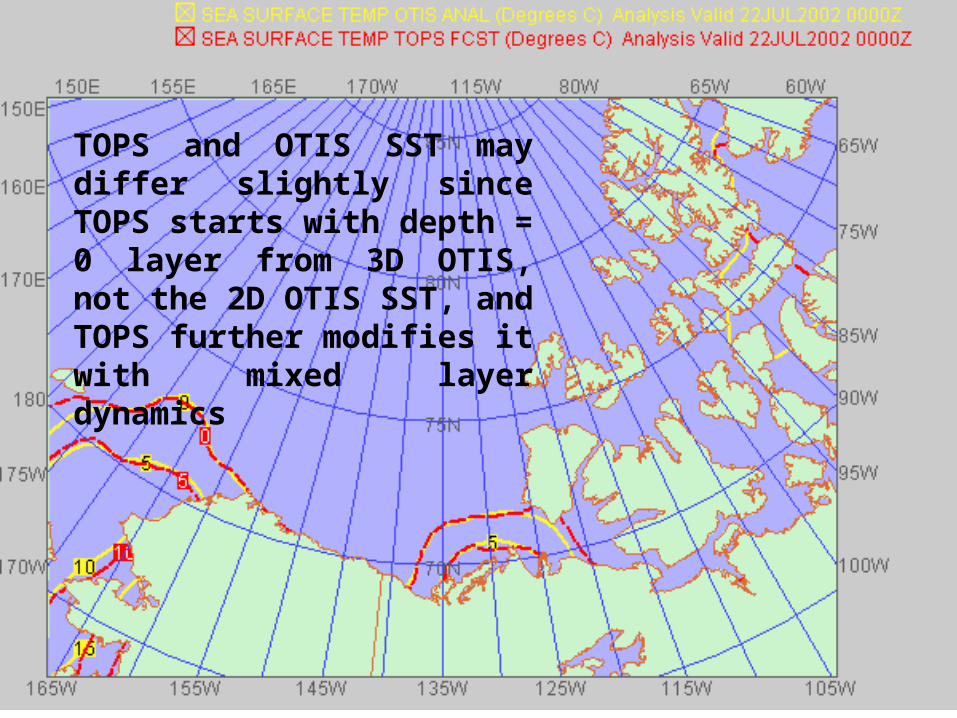
TOPS and OTIS SST may differ slightly since TOPS starts with depth = 0 layer from 3D OTIS, not the 2D OTIS SST, and TOPS further modifies it with mixed layer dynamics
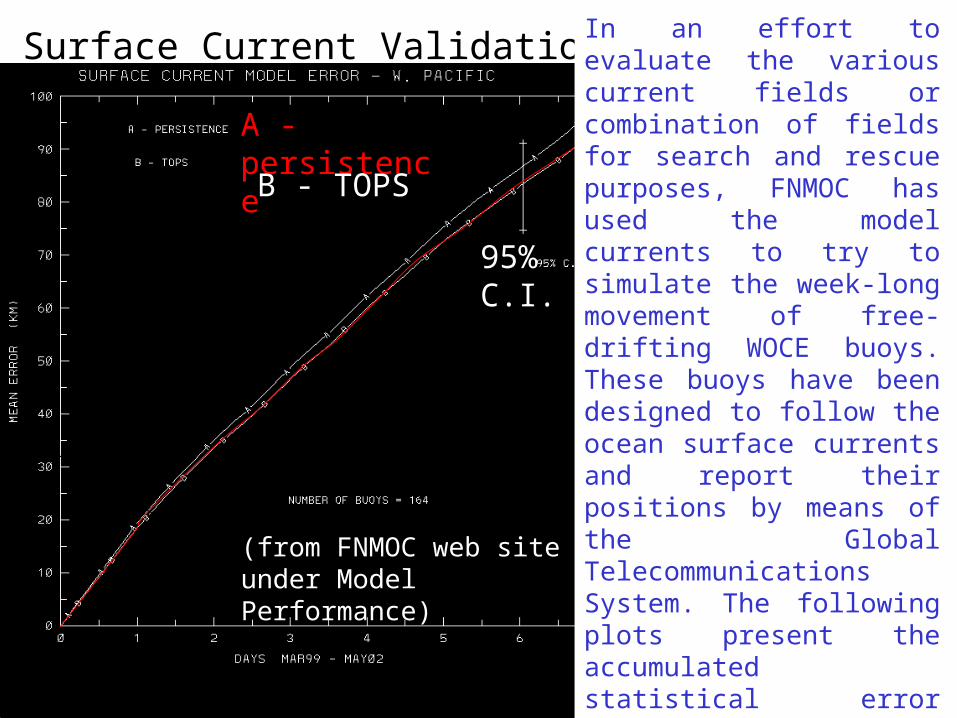
A - persistence
Model Surface Current Validation
(from FNMOC web site under Model Performance)
B - TOPS
In an effort to evaluate the various current fields or combination of fields for search and rescue purposes, FNMOC has used the model currents to try to simulate the week-long movement of free-drifting WOCE buoys. These buoys have been designed to follow the ocean surface currents and report their positions by means of the Global Telecommunications System. The following plots present the accumulated statistical error (starting Apr. 99) between the simulated buoy tracks for various ocean areas and the actual buoy positions. The persistence curve represents the mean distance between initial buoy positions and the subsequent locations.
95% C.I.
References
Clancy, R.M., and W.D. Sadler, The Fleet Numerical Oceanography Center suite of oceanographic models and products, Weather and Forecasting, 7, 307-327, 1992.
Clancy, R.M., and K.D. Pollak, A real-time synoptic ocean thermal analysis/forecast system, Progress in Oceanography, 12, 383-424, 1983.
Documents on FNMOC web site.
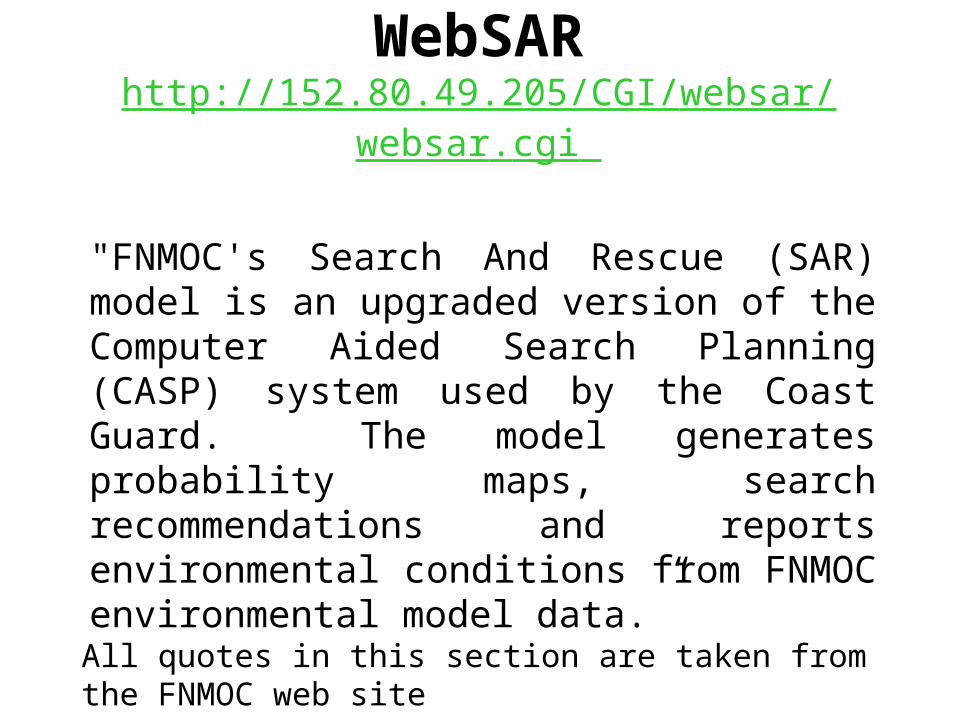
WebSARhttp://152.80.49.205/CGI/websar/websar.cgi
"FNMOC's Search And Rescue (SAR) model is an upgraded version of the Computer Aided Search Planning (CASP) system used by the Coast Guard. The model generates probability maps, search recommendations and reports environmental conditions from FNMOC environmental model data.”
All quotes in this section are taken from the FNMOC web site
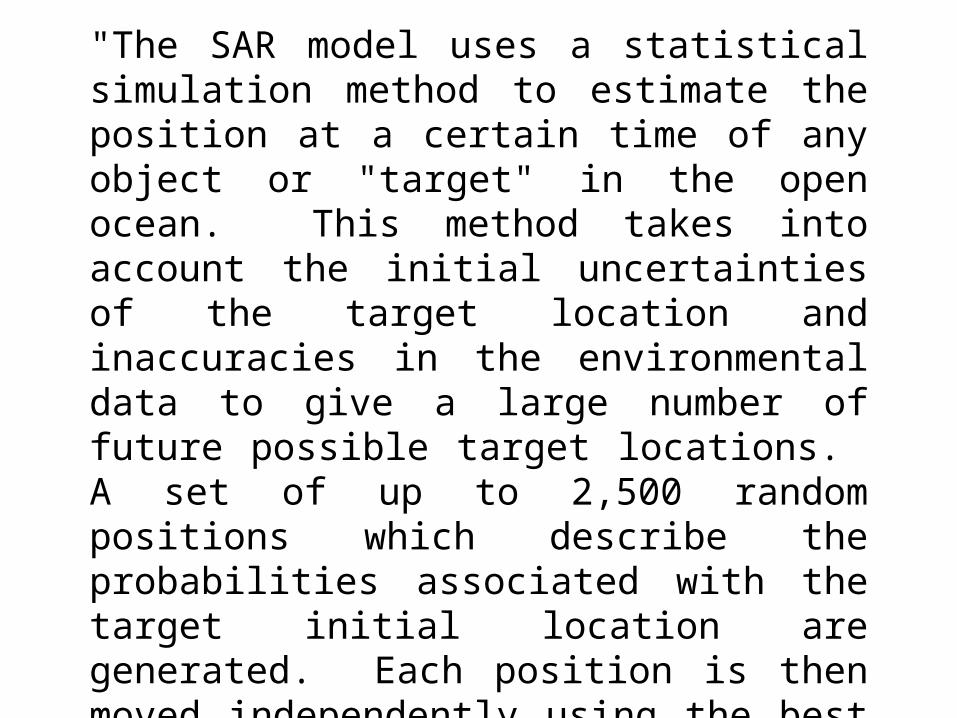
"The SAR model uses a statistical simulation method to estimate the position at a certain time of any object or "target" in the open ocean. This method takes into account the initial uncertainties of the target location and inaccuracies in the environmental data to give a large number of future possible target locations. A set of up to 2,500 random positions which describe the probabilities associated with the target initial location are generated. Each position is then moved independently using the best estimate of marine wind and wind-driven surface current data available in one-hour steps. At any selected time, the multiple position locations are assembled into a distribution or "probability of containment" map."
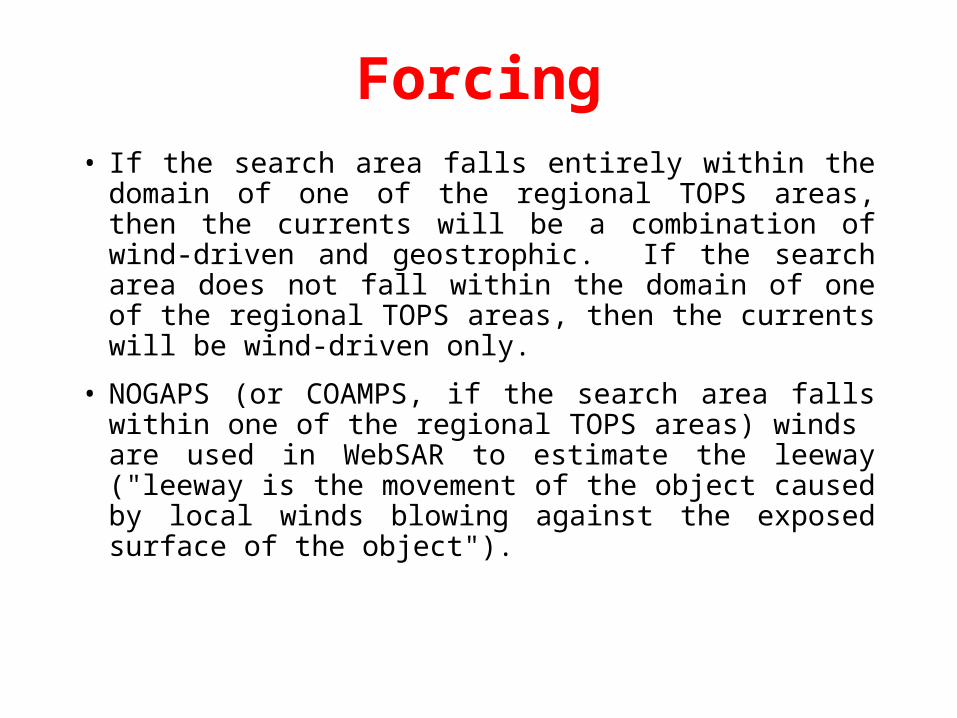
Forcing• If the search area falls entirely within the domain of
one of the regional TOPS areas, then the currents will be a combination of wind-driven and geostrophic. If the search area does not fall within the domain of one of the regional TOPS areas, then the currents will be wind-driven only.
• NOGAPS (or COAMPS, if the search area falls within one of the regional TOPS areas) winds are used in WebSAR to estimate the leeway ("leeway is the movement of the object caused by local winds blowing against the exposed surface of the object").
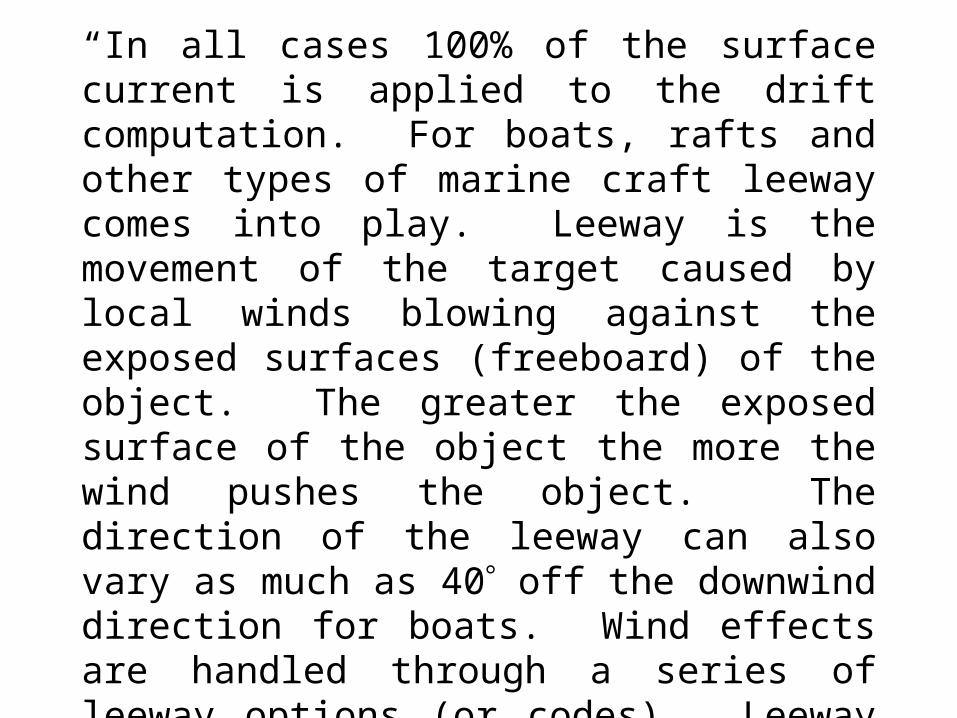
“In all cases 100% of the surface current is applied to the drift computation. For boats, rafts and other types of marine craft leeway comes into play. Leeway is the movement of the target caused by local winds blowing against the exposed surfaces (freeboard) of the object. The greater the exposed surface of the object the more the wind pushes the object. The direction of the leeway can also vary as much as 40 off the downwind direction for boats. Wind effects are handled through a series of leeway options (or codes). Leeway codes provide two values to the model. The first digit is the percent of wind speed at which the object will drift and the second digit is the angular error, in tens of degrees (1 = 10 degrees), from the downwind course.”
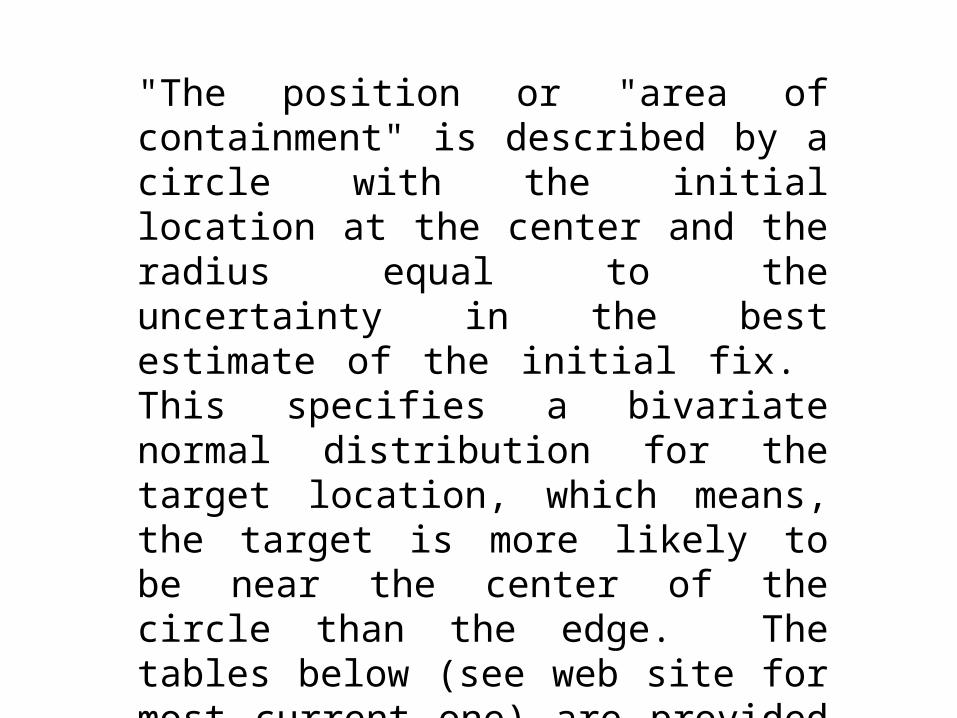
"The position or "area of containment" is described by a circle with the initial location at the center and the radius equal to the uncertainty in the best estimate of the initial fix. This specifies a bivariate normal distribution for the target location, which means, the target is more likely to be near the center of the circle than the edge. The tables below (see web site for most current one) are provided to assist in defining the uncertainty (or Navigational Error) to the model. The model assumes a confidence level of 86% that the object is contained in the area described by the circle."
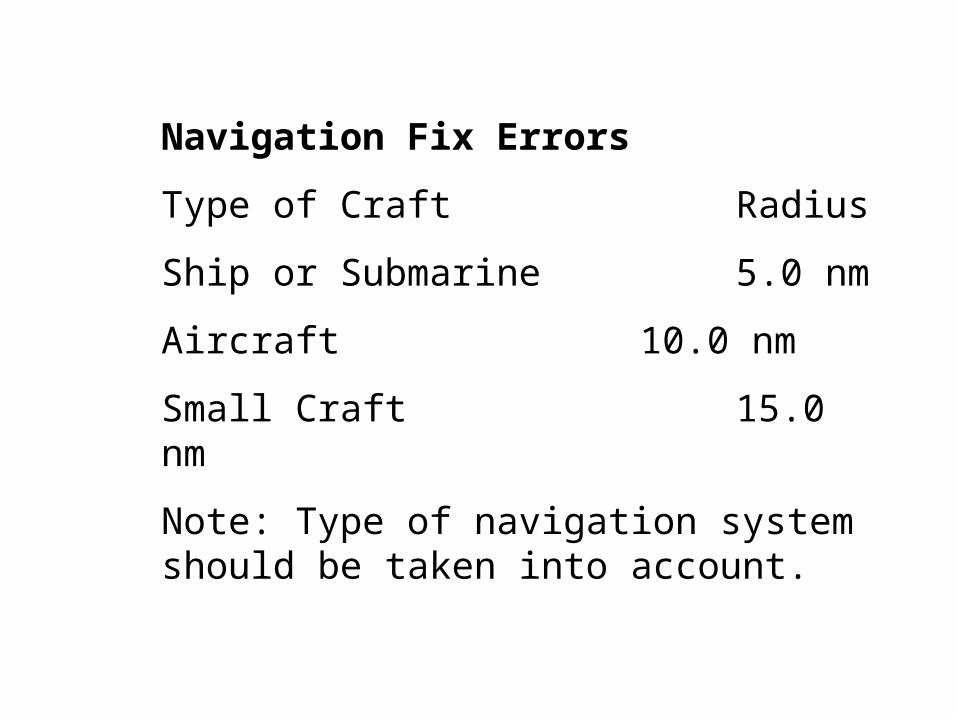
Navigation Fix Errors
Type of Craft Radius
Ship or Submarine 5.0 nm
Aircraft 10.0 nm
Small Craft 15.0 nm
Note: Type of navigation system should be taken into account.
SAR is recommended for use only in open ocean situations, that is, more than 100 nm from any coast line. Since SAR is driven by the TOPS model, local coastal effects and tidal effects, among other things, are not included in the applied current fields. Due to the coarse grid spacing the effects of islands and complex coastal topography are also smoothed out.
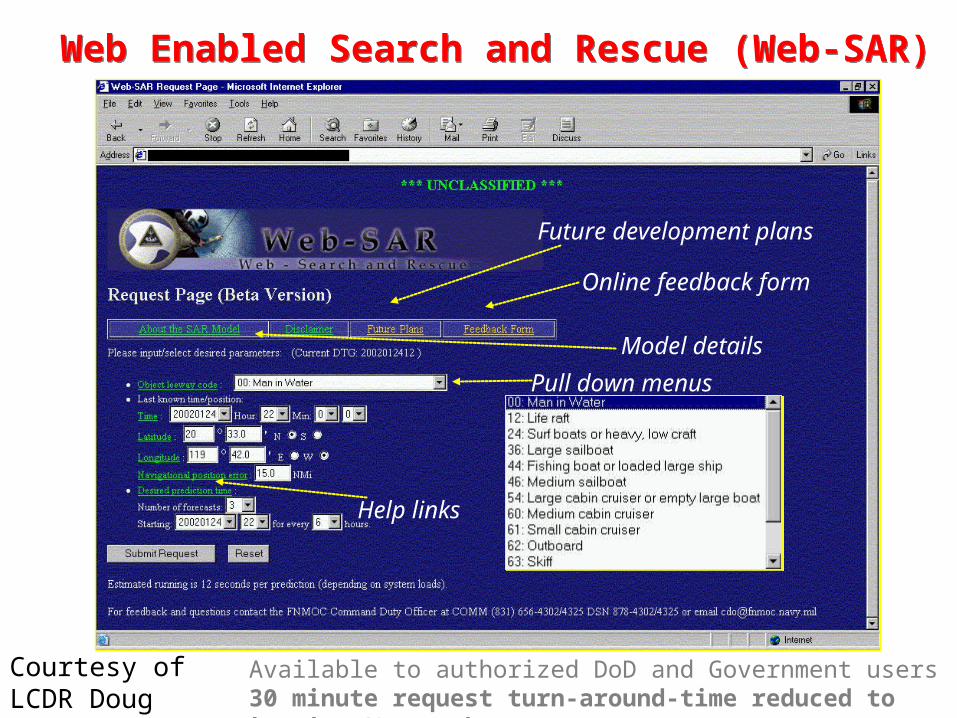
Web Enabled Search and Rescue (Web-SAR)Web Enabled Search and Rescue (Web-SAR)
Available to authorized DoD and Government users 30 minute request turn-around-time reduced to less than 60 seconds
Pull down menus
Help links
Model details
Future development plans
Online feedback form
Courtesy of LCDR Doug Marble
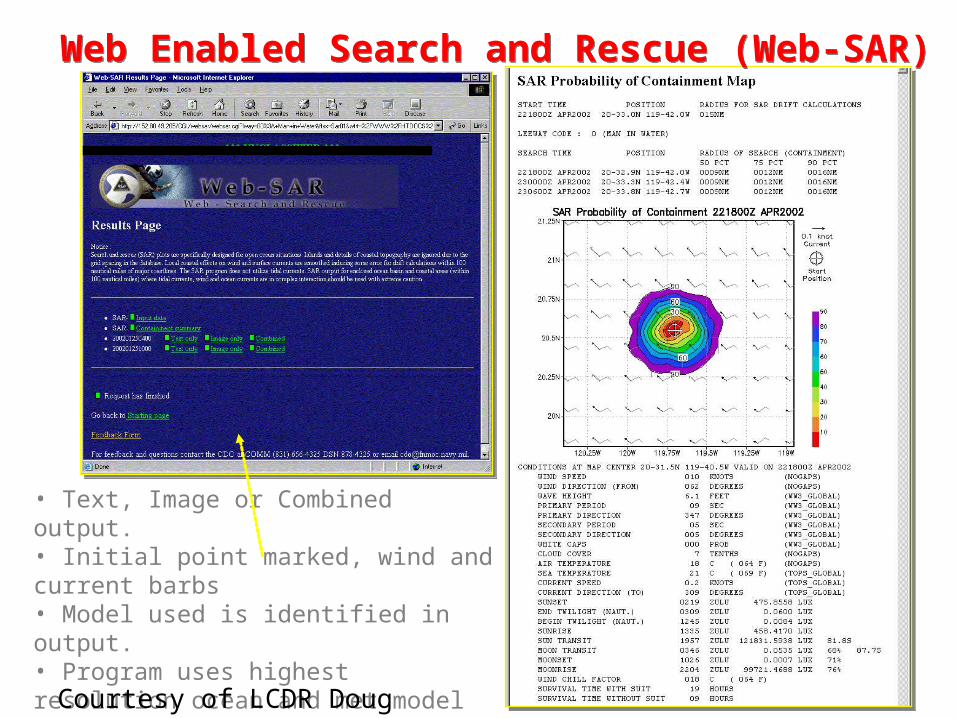
• Text, Image or Combined output.• Initial point marked, wind and current barbs• Model used is identified in output.• Program uses highest resolution ocean and met model forecast data (COAMPS, NOGAPS or WW3/TOPS) available in SAR area.
Web Enabled Search and Rescue (Web-SAR)Web Enabled Search and Rescue (Web-SAR)
Courtesy of LCDR Doug Marble