Embed Size (px)
DESCRIPTION
f
Citation preview
Innovative Methodology
An adaptive transfer function for deriving the aortic pressure waveform froma peripheral artery pressure waveform
Gokul Swamy,1 Da Xu,1 N. Bari Olivier,2 and Ramakrishna Mukkamala1
1Department of Electrical and Computer Engineering and 2Department of Small Animal Clinical Sciences, Michigan StateUniversity, East Lansing, Michigan
Submitted 17 February 2009; accepted in final form 14 September 2009
Swamy G, Xu D, Olivier NB, Mukkamala R. An adaptivetransfer function for deriving the aortic pressure waveform from aperipheral artery pressure waveform. Am J Physiol Heart CircPhysiol 297: H1956 –H1963, 2009. First published September 25,2009; doi:10.1152/ajpheart.00155.2009.—We developed a new tech-nique to mathematically transform a peripheral artery pressure (PAP)waveform distorted by wave reflections into the physiologically morerelevant aortic pressure (AP) waveform. First, a transfer functionrelating PAP to AP is defined in terms of the unknown parameters ofa parallel tube model of pressure and flow in the arterial tree. Theparameters are then estimated from the measured PAP waveformalong with a one-time measurement of the wave propagation delaytime between the aorta and peripheral artery measurement site (whichmay be accomplished noninvasively) by exploiting preknowledge ofaortic flow. Finally, the transfer function with its estimated parametersis applied to the measured waveform so as to derive the AP waveform.Thus, in contrast to the conventional generalized transfer function, thetransfer function is able to adapt to the intersubject and temporalvariability of the arterial tree. To demonstrate the feasibility of thisadaptive transfer function technique, we performed experiments in 6healthy dogs in which PAP and reference AP waveforms weresimultaneously recorded during 12 different hemodynamic interven-tions. The AP waveforms derived by the technique showed agreementwith the measured AP waveforms (overall total waveform, systolicpressure, and pulse pressure root mean square errors of 3.7, 4.3, and3.4 mmHg, respectively) statistically superior to the unprocessed PAPwaveforms (corresponding errors of 8.6, 17.1, and 20.3 mmHg) andthe AP waveforms derived by two previously proposed transferfunctions developed with a subset of the same canine data (corre-sponding errors of, on average, 5.0, 6.3, and 6.7 mmHg).
arterial tree; blood pressure; generalized transfer function; model;wave reflection
SINCE ITS INTRODUCTION by O’Rourke and coworkers in 1993 (3),the generalized transfer function has received attention forproviding a convenient and safe means for monitoring centralaortic pressure (AP) by mathematical transformation of aperipheral artery pressure (PAP) waveform. The basic premiseof the transformation is that a single, universal transfer func-tion exists that can faithfully relate the PAP waveform to theAP waveform of all individuals for all time. However, thetransfer function linking PAP to AP would ideally be able toadapt to the intersubject and temporal variability of the arterialtree due to, for example, age-related arterial compliance dif-ferences, disease-induced peripheral resistance variations,baro- and thermoregulatory modulation of peripheral resistancein response to physiological perturbations, and therapeuticadministration of vasoactive agents. To this end, Sugimachi
et al. (12) and Westerhof et al. (18) previously proposed atechnique to partially adapt the transfer function by defining itthrough an arterial tube model with a personalized value for amodel parameter reflecting the wave propagation delay timeand population averages for the remaining parameters. Werecently introduced (13, 14) perhaps the first entirely adaptivetechnique for mathematically deriving the AP waveform byexploiting the commonality in multiple PAP waveformsthrough the powerful multichannel blind system identificationapproach. However, the requirement of more than one PAPwaveform is a practical disadvantage of this technique.
In this study, we conceived a fully adaptive technique forderiving the AP waveform from only one PAP waveform. Thenew technique similarly defines the transfer function relatingPAP to AP through a parallel tube model of pressure and flowin the arterial tree but then estimates all of its parameters bycapitalizing on preknowledge of aortic flow. The parametersare periodically reestimated for each subject so as to yield anadaptive transfer function (ATF). We performed canine exper-iments in order to test the ATF technique as well as compareit with previous transfer function techniques over a broad arrayof controlled and significant hemodynamic perturbations. Apreliminary version of this study has been reported in abbre-viated form (15).
METHODS
Adaptive transfer function technique. Figure 1 illustrates the majorsteps of the ATF technique. As shown in Fig. 1A, the arterial tree ismodeled as a parallel arrangement of m uniform tubes in series withterminal loads. The ith tube represents the path between the aorta andthe ith peripheral artery. Each tube is frictionless and therefore hasconstant characteristic impedance [Zci � �(li/ci), where li and ci arethe tube’s total inertance and compliance] and allows waves topropagate with constant delay time from one end of the tube to theother [Tdi � �(lici)]. Thus, consistent with Poiseuille’s law, meanpressure is identical throughout the tubes. The ith terminal loadsignifies the arterial bed distal to the ith peripheral artery. Like thestudies of Sugimachi et al. (12) and Westerhof et al. (18), eachterminal load has a frequency-dependent impedance [Zi(�), where �is frequency] characterized by two parameters that are dependent onthe peripheral resistance and compliance (Ai and Bi, where 0 � Ai �Bi) as well as the characteristic impedance of the corresponding tube(i.e., Zci). Thus the wave reflection coefficient at each terminal load isalso frequency dependent {�i(�) � [Zi(�) � Zci]/[Zi(�) � Zci]}.
Generally speaking, as shown for the mth tube and terminal load inFig. 1A, forward pressure and flow waves [pf(t) and qf(t)] propagatefrom left to right along each tube without distortion and are propor-tional to each other through the tube characteristic impedance. Thesewaves are reflected in the opposite direction at the terminal load withrelative magnitude and phase based on the frequency according to thewave reflection coefficient. The resulting backward pressure and flowwaves [pb(t) and qb(t)] likewise travel along the tube without distor-
Address for reprint requests and other correspondence: R. Mukkamala, Dept. ofElectrical and Computer Engineering, Michigan State Univ., 2120 EngineeringBldg., East Lansing, MI 48824-1226 (e-mail: [email protected]).
Am J Physiol Heart Circ Physiol 297: H1956–H1963, 2009.First published September 25, 2009; doi:10.1152/ajpheart.00155.2009.
0363-6135/09 $8.00 Copyright © 2009 the American Physiological Society http://www.ajpheart.orgH1956
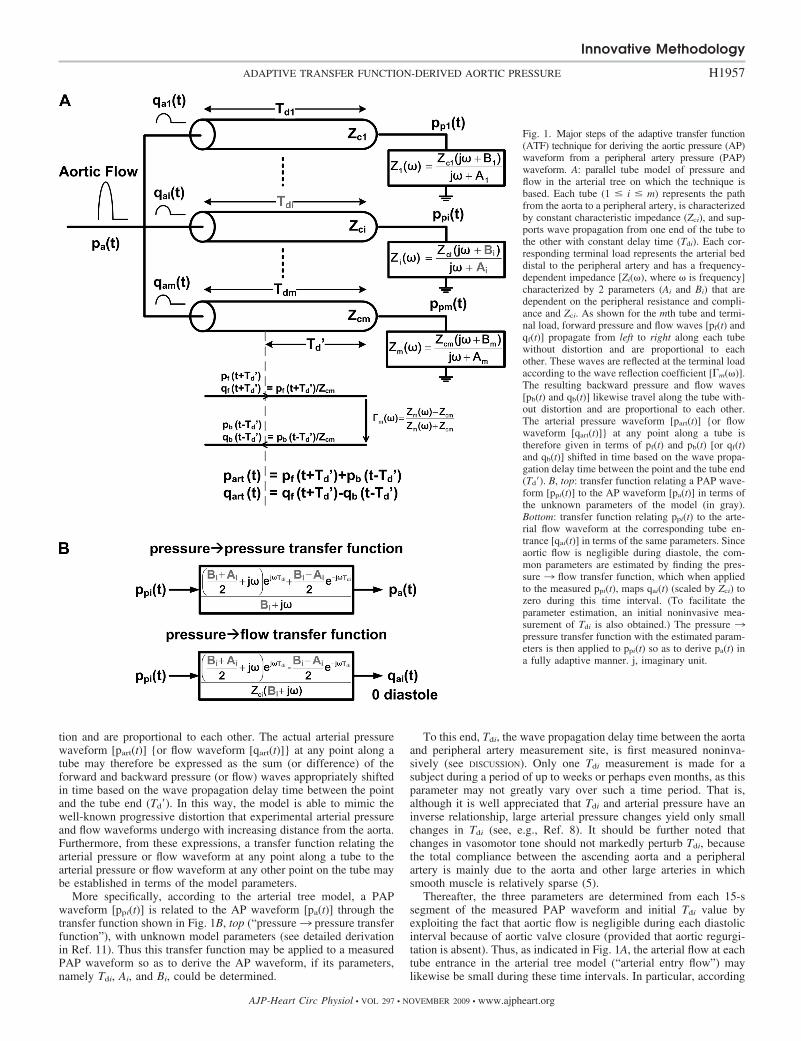
tion and are proportional to each other. The actual arterial pressurewaveform [part(t)] {or flow waveform [qart(t)]} at any point along atube may therefore be expressed as the sum (or difference) of theforward and backward pressure (or flow) waves appropriately shiftedin time based on the wave propagation delay time between the pointand the tube end (Td�). In this way, the model is able to mimic thewell-known progressive distortion that experimental arterial pressureand flow waveforms undergo with increasing distance from the aorta.Furthermore, from these expressions, a transfer function relating thearterial pressure or flow waveform at any point along a tube to thearterial pressure or flow waveform at any other point on the tube maybe established in terms of the model parameters.
More specifically, according to the arterial tree model, a PAPwaveform [ppi(t)] is related to the AP waveform [pa(t)] through thetransfer function shown in Fig. 1B, top (“pressure3 pressure transferfunction”), with unknown model parameters (see detailed derivationin Ref. 11). Thus this transfer function may be applied to a measuredPAP waveform so as to derive the AP waveform, if its parameters,namely Tdi, Ai, and Bi, could be determined.
To this end, Tdi, the wave propagation delay time between the aortaand peripheral artery measurement site, is first measured noninva-sively (see DISCUSSION). Only one Tdi measurement is made for asubject during a period of up to weeks or perhaps even months, as thisparameter may not greatly vary over such a time period. That is,although it is well appreciated that Tdi and arterial pressure have aninverse relationship, large arterial pressure changes yield only smallchanges in Tdi (see, e.g., Ref. 8). It should be further noted thatchanges in vasomotor tone should not markedly perturb Tdi, becausethe total compliance between the ascending aorta and a peripheralartery is mainly due to the aorta and other large arteries in whichsmooth muscle is relatively sparse (5).
Thereafter, the three parameters are determined from each 15-ssegment of the measured PAP waveform and initial Tdi value byexploiting the fact that aortic flow is negligible during each diastolicinterval because of aortic valve closure (provided that aortic regurgi-tation is absent). Thus, as indicated in Fig. 1A, the arterial flow at eachtube entrance in the arterial tree model (“arterial entry flow”) maylikewise be small during these time intervals. In particular, according
Fig. 1. Major steps of the adaptive transfer function(ATF) technique for deriving the aortic pressure (AP)waveform from a peripheral artery pressure (PAP)waveform. A: parallel tube model of pressure andflow in the arterial tree on which the technique isbased. Each tube (1 � i � m) represents the pathfrom the aorta to a peripheral artery, is characterizedby constant characteristic impedance (Zci), and sup-ports wave propagation from one end of the tube tothe other with constant delay time (Tdi). Each cor-responding terminal load represents the arterial beddistal to the peripheral artery and has a frequency-dependent impedance [Zi(�), where � is frequency]characterized by 2 parameters (Ai and Bi) that aredependent on the peripheral resistance and compli-ance and Zci. As shown for the mth tube and termi-nal load, forward pressure and flow waves [pf(t) andqf(t)] propagate from left to right along each tubewithout distortion and are proportional to eachother. These waves are reflected at the terminal loadaccording to the wave reflection coefficient [�m(�)].The resulting backward pressure and flow waves[pb(t) and qb(t)] likewise travel along the tube with-out distortion and are proportional to each other.The arterial pressure waveform [part(t)] {or flowwaveform [qart(t)]} at any point along a tube istherefore given in terms of pf(t) and pb(t) [or qf(t)and qb(t)] shifted in time based on the wave propa-gation delay time between the point and the tube end(Td�). B, top: transfer function relating a PAP wave-form [ppi(t)] to the AP waveform [pa(t)] in terms ofthe unknown parameters of the model (in gray).Bottom: transfer function relating ppi(t) to the arte-rial flow waveform at the corresponding tube en-trance [qai(t)] in terms of the same parameters. Sinceaortic flow is negligible during diastole, the com-mon parameters are estimated by finding the pres-sure 3 flow transfer function, which when appliedto the measured ppi(t), maps qai(t) (scaled by Zci) tozero during this time interval. (To facilitate theparameter estimation, an initial noninvasive mea-surement of Tdi is also obtained.) The pressure 3pressure transfer function with the estimated param-eters is then applied to ppi(t) so as to derive pa(t) ina fully adaptive manner. j, imaginary unit.
Innovative Methodology
H1957ADAPTIVE TRANSFER FUNCTION-DERIVED AORTIC PRESSURE
AJP-Heart Circ Physiol • VOL 297 • NOVEMBER 2009 • www.ajpheart.org
to this model, the PAP waveform is related to the arterial entry flowwaveform to the corresponding peripheral artery [qai(t)] through thetransfer function shown in Fig. 1B, bottom (“pressure 3 flow transferfunction”) with the same unknown model parameters as the pres-sure 3 pressure transfer function. The common parameters are thenestimated by finding the pressure 3 flow transfer function, whichwhen applied to the PAP waveform segment, minimizes the energy(sum of squares) of the arterial entry flow waveform (scaled by Zci)output over its diastolic intervals. In other words, as indicated in Fig.1B, bottom, the parameters are selected so as to map the PAPwaveform to an arterial entry flow of zero during diastole.
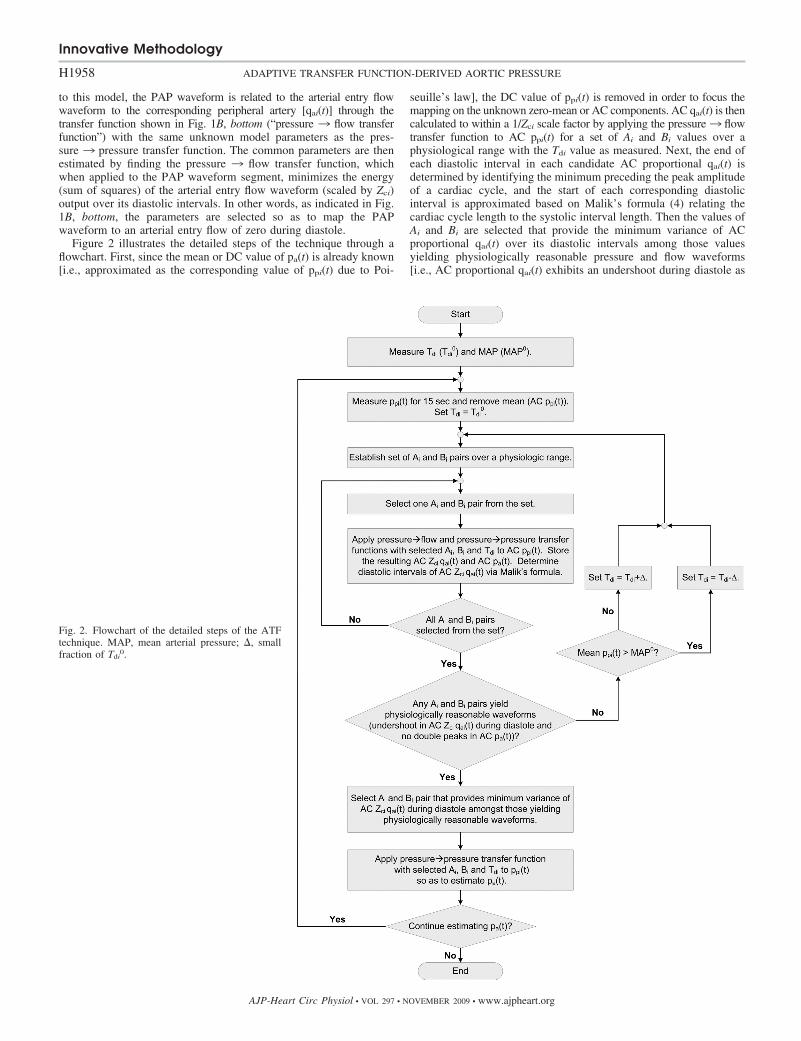
Figure 2 illustrates the detailed steps of the technique through aflowchart. First, since the mean or DC value of pa(t) is already known[i.e., approximated as the corresponding value of ppi(t) due to Poi-
seuille’s law], the DC value of ppi(t) is removed in order to focus themapping on the unknown zero-mean or AC components. AC qai(t) is thencalculated to within a 1/Zci scale factor by applying the pressure3 flowtransfer function to AC ppi(t) for a set of Ai and Bi values over aphysiological range with the Tdi value as measured. Next, the end ofeach diastolic interval in each candidate AC proportional qai(t) isdetermined by identifying the minimum preceding the peak amplitudeof a cardiac cycle, and the start of each corresponding diastolicinterval is approximated based on Malik’s formula (4) relating thecardiac cycle length to the systolic interval length. Then the values ofAi and Bi are selected that provide the minimum variance of ACproportional qai(t) over its diastolic intervals among those valuesyielding physiologically reasonable pressure and flow waveforms[i.e., AC proportional qai(t) exhibits an undershoot during diastole as
Fig. 2. Flowchart of the detailed steps of the ATFtechnique. MAP, mean arterial pressure; , smallfraction of Tdi
0.
Innovative Methodology
H1958 ADAPTIVE TRANSFER FUNCTION-DERIVED AORTIC PRESSURE
AJP-Heart Circ Physiol • VOL 297 • NOVEMBER 2009 • www.ajpheart.org
typically seen in experimental waveforms (6), and pa(t), computed asdescribed below, does not reveal double peaks]. In the event that noneof the Ai and Bi values in the set results in physiologically reasonablewaveforms, Tdi is successively incremented when mean pressuredecreases relative to the Tdi measurement period or decremented whenmean pressure increases relative to this period until the criterion issatisfied. Finally, the pressure 3 pressure transfer function, with theselected values for Ai, Bi, and Tdi, is applied to ppi(t) (including its DCvalue) so as to derive pa(t). [Note that the DC value of proportionalqai(t) may be determined by shifting the diastolic intervals of the ACwaveform to zero amplitude.]
Data collection. Data were collected from six healthy adult beagles(10–12 kg) under an experimental protocol approved by the MichiganState University All-University Committee on Animal Use and Care.For each dog, general anesthesia was induced by an intravenousinjection of propofol (2.2–6.6 mg/kg) and maintained with an inhaledmixture of oxygen and isoflurane (1.5–2.5%). A micromanometer-tipped catheter (Millar Instruments, Houston, TX) was placed in afemoral artery for the PAP waveform for analysis. A similar catheterwas inserted in the opposite femoral artery or a carotid artery andpositioned in the ascending aorta for the reference AP waveform. Acatheter was also placed in a cephalic vein for drug and isotonic fluidadministration, and electrodes were positioned for standard ECGmeasurements. In the fifth dog, a bipolar electrode catheter (EPTechnologies, Boston Scientific, Sunnyvale, CA) was inserted into ajugular vein and advanced to the right atrium for high-rate pacing withan external pulse generator (Medtronic, Minneapolis, MN). In thesixth dog, a quadrapolar ablation catheter (EP Technologies) wasinserted into a femoral vein and positioned to ablate the atrioventric-ular (AV) node and to then apply bipolar electrical stimulation to theHis bundle as previously described (10) for low-rate pacing with theexternal pulse generator. (Additional instrumentation was also in-stalled in the fifth and sixth dogs to address different specific aims.)Placement of all central catheters was accomplished by guidance witha single-plane lateral projection fluoroscopic imaging unit (GE, Mil-waukee, WI). The analog transducer outputs were interfaced to apersonal computer via an analog-to-digital conversion system (DataQInstruments, Akron, OH). The arterial pressure waveforms and ECGmeasurements were recorded at a sampling rate of 1,000 Hz during abaseline period and after infusions of phenylephrine and nitroglycerinin the first dog; dobutamine and esmolol in the second dog; norepi-nephrine and xylazine in the third dog; saline and progressive hem-orrhage in the fourth dog; verapamil and high-rate pacing in the fifthdog; and vasopressin (before AV node ablation) and low-rate pacingin the sixth dog. Several infusion and pacing rates were employed,followed by recovery periods.
Data analysis. The ATF technique was applied to 260 min ofrecorded PAP waveforms resampled to 250 Hz, with Tdi measured foreach dog as the time interval between the onsets of upstroke of the APand PAP waveforms during the initial beats of the baseline period.The resulting derived AP waveforms were low-pass filtered with acutoff frequency of 15 Hz as previously justified (2) and then quan-titatively evaluated against the (unfiltered) reference AP waveforms interms of the sample-to-sample (total waveform, TW), beat-to-beatsystolic pressure (SP), and beat-to-beat pulse pressure (PP) root meansquare errors (RMSEs) for each experimental condition and overall.The unprocessed PAP waveforms were likewise assessed with respectto the reference AP waveforms after time aligning the two waveformsto eliminate error due merely to the wave propagation delay.
For further comparison, AP waveforms were also derived by anautoregressive exogenous input-based generalized transfer function(GTFARX) technique (2) (which was shown to be the most accurateamong 3 generalized transfer function techniques) and the tube model-based partially adaptive transfer function (PATFtube) technique (12, 18)(i.e., the transfer function shown in Fig. 1B, top, with Tdi measured foreach dog as described above and the same values for the Ai and Bi
parameters for all dogs). More specifically, the two previous transfer
functions were established by averaging over a set of transfer func-tions computed from each 15-s segment of the PAP and AP wave-forms of one of the dogs and then applied to the PAP waveforms ofthe remaining dogs (see DISCUSSION). The resulting derived AP wave-forms were then similarly low-pass filtered and evaluated. Thisprocedure was repeated for each dog in order to avoid any bias, andthe results were averaged.
Finally, the TW, SP, and PP RMSEs in the AP waveforms derivedby the ATF technique were statistically compared with the corre-sponding errors in the time-aligned PAP waveforms and the APwaveforms derived by the GTFARX and PATFtube techniques over allthe experimental conditions. In particular, paired t-tests were per-formed after log transformation to make the data more normallydistributed. A P value of �0.05 was considered statistically signifi-cant.
RESULTS
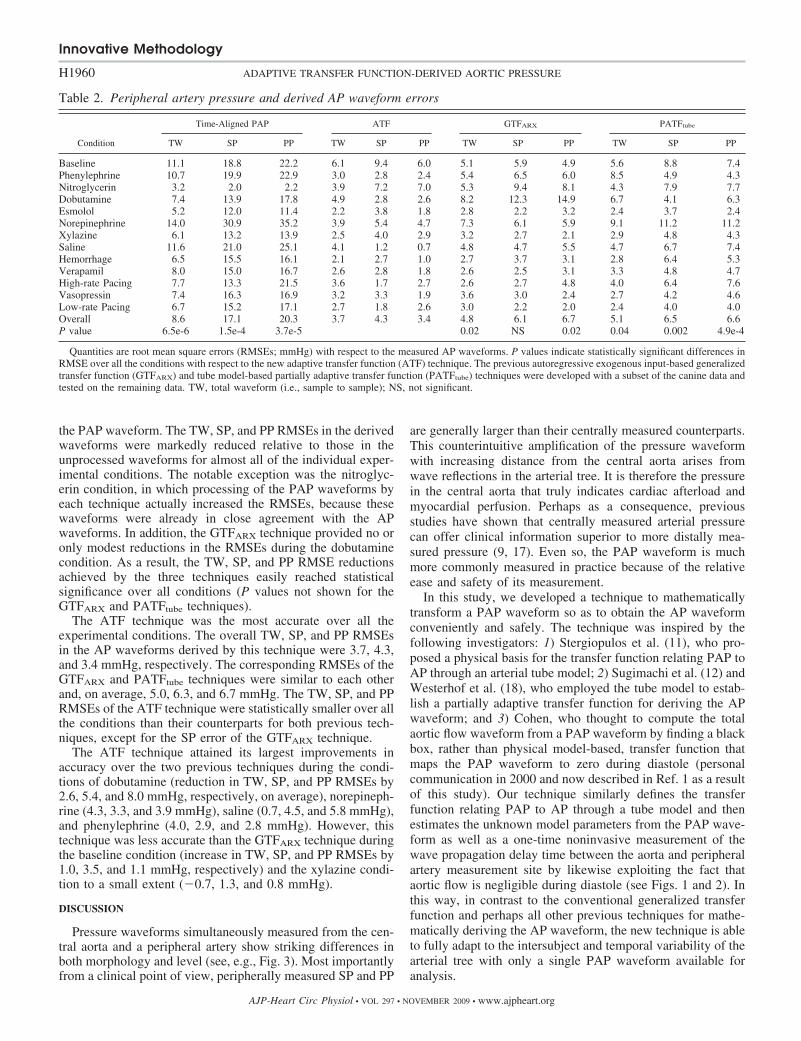
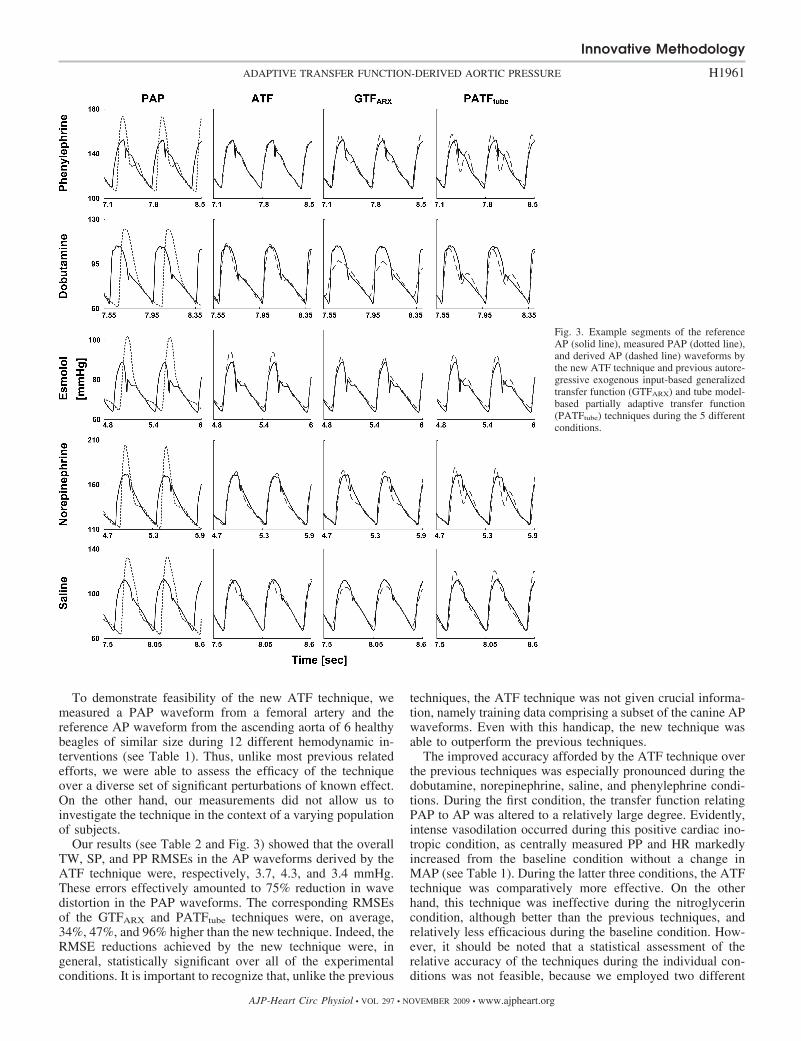
Table 1 illustrates the AP and heart rate (HR) levels duringeach of the experimental conditions. Table 2 shows the TW,SP, and PP RMSEs in the PAP waveforms after time alignmentand the AP waveforms derived by the new ATF technique aswell as the previous GTFARX and PATFtube techniques for eachcondition and overall along with P values indicating statisti-cally significant differences. Figure 3 provides visual examplesof the measured AP and PAP waveform segments and thecorresponding derived AP waveform segments during fivedifferent conditions.
AP and HR levels (means SD) varied widely over thevarious experimental conditions. Mean arterial pressure (MAP)ranged from 62 3 to 134 15 mmHg, SP from 78 8 to162 22 mmHg, PP from 18 1 to 55 11 mmHg, and HRfrom 73 20 to 197 16 beats/min.
On the whole, the PAP waveforms were markedly differentfrom the reference AP waveforms, especially in terms of SPand PP. The overall TW, SP, and PP RMSEs in the time-aligned waveforms were 8.6, 17.1, and 20.3 mmHg, respec-tively. The level of discrepancy between the unprocessed PAPand reference AP waveforms likewise varied over the differentexperimental conditions. The TW, SP, and PP RMSEs were byfar the smallest during the nitroglycerin condition (3.2, 2.0, and2.2 mmHg) and largest during the norepinephrine condition(14.0, 30.9, and 35.2 mmHg).
All three techniques were able to derive the AP waveformwith considerably greater accuracy than merely time aligning
Table 1. AP and HR levels
Condition MAP, mmHg SP, mmHg PP, mmHg HR, bpm
Baseline 8820 10424 349 1277Phenylephrine 13214 15819 499 989Nitroglycerin 623 793 271 961Dobutamine 892 1163 512 1728Esmolol 713 853 240 1131Norepinephrine 13415 16222 5511 11713Xylazine 658 788 251 10010Saline 981 1191 451 1371Hemorrhage 665 805 251 1054Verapamil 7410 9011 333 11510High-rate pacing 753 852 181 19716Vasopressin 9415 10816 283 1034Low-rate pacing 737 955 426 7320
Quantities are expressed as means SD. AP, aortic pressure; MAP, meanarterial pressure; SP, systolic pressure; PP, pulse pressure; HR, heart rate; bpm,beats per minute.
Innovative Methodology
H1959ADAPTIVE TRANSFER FUNCTION-DERIVED AORTIC PRESSURE
AJP-Heart Circ Physiol • VOL 297 • NOVEMBER 2009 • www.ajpheart.org
the PAP waveform. The TW, SP, and PP RMSEs in the derivedwaveforms were markedly reduced relative to those in theunprocessed waveforms for almost all of the individual exper-imental conditions. The notable exception was the nitroglyc-erin condition, in which processing of the PAP waveforms byeach technique actually increased the RMSEs, because thesewaveforms were already in close agreement with the APwaveforms. In addition, the GTFARX technique provided no oronly modest reductions in the RMSEs during the dobutaminecondition. As a result, the TW, SP, and PP RMSE reductionsachieved by the three techniques easily reached statisticalsignificance over all conditions (P values not shown for theGTFARX and PATFtube techniques).
The ATF technique was the most accurate over all theexperimental conditions. The overall TW, SP, and PP RMSEsin the AP waveforms derived by this technique were 3.7, 4.3,and 3.4 mmHg, respectively. The corresponding RMSEs of theGTFARX and PATFtube techniques were similar to each otherand, on average, 5.0, 6.3, and 6.7 mmHg. The TW, SP, and PPRMSEs of the ATF technique were statistically smaller over allthe conditions than their counterparts for both previous tech-niques, except for the SP error of the GTFARX technique.
The ATF technique attained its largest improvements inaccuracy over the two previous techniques during the condi-tions of dobutamine (reduction in TW, SP, and PP RMSEs by2.6, 5.4, and 8.0 mmHg, respectively, on average), norepineph-rine (4.3, 3.3, and 3.9 mmHg), saline (0.7, 4.5, and 5.8 mmHg),and phenylephrine (4.0, 2.9, and 2.8 mmHg). However, thistechnique was less accurate than the GTFARX technique duringthe baseline condition (increase in TW, SP, and PP RMSEs by1.0, 3.5, and 1.1 mmHg, respectively) and the xylazine condi-tion to a small extent (�0.7, 1.3, and 0.8 mmHg).
DISCUSSION
Pressure waveforms simultaneously measured from the cen-tral aorta and a peripheral artery show striking differences inboth morphology and level (see, e.g., Fig. 3). Most importantlyfrom a clinical point of view, peripherally measured SP and PP
are generally larger than their centrally measured counterparts.This counterintuitive amplification of the pressure waveformwith increasing distance from the central aorta arises fromwave reflections in the arterial tree. It is therefore the pressurein the central aorta that truly indicates cardiac afterload andmyocardial perfusion. Perhaps as a consequence, previousstudies have shown that centrally measured arterial pressurecan offer clinical information superior to more distally mea-sured pressure (9, 17). Even so, the PAP waveform is muchmore commonly measured in practice because of the relativeease and safety of its measurement.
In this study, we developed a technique to mathematicallytransform a PAP waveform so as to obtain the AP waveformconveniently and safely. The technique was inspired by thefollowing investigators: 1) Stergiopulos et al. (11), who pro-posed a physical basis for the transfer function relating PAP toAP through an arterial tube model; 2) Sugimachi et al. (12) andWesterhof et al. (18), who employed the tube model to estab-lish a partially adaptive transfer function for deriving the APwaveform; and 3) Cohen, who thought to compute the totalaortic flow waveform from a PAP waveform by finding a blackbox, rather than physical model-based, transfer function thatmaps the PAP waveform to zero during diastole (personalcommunication in 2000 and now described in Ref. 1 as a resultof this study). Our technique similarly defines the transferfunction relating PAP to AP through a tube model and thenestimates the unknown model parameters from the PAP wave-form as well as a one-time noninvasive measurement of thewave propagation delay time between the aorta and peripheralartery measurement site by likewise exploiting the fact thataortic flow is negligible during diastole (see Figs. 1 and 2). Inthis way, in contrast to the conventional generalized transferfunction and perhaps all other previous techniques for mathe-matically deriving the AP waveform, the new technique is ableto fully adapt to the intersubject and temporal variability of thearterial tree with only a single PAP waveform available foranalysis.
Table 2. Peripheral artery pressure and derived AP waveform errors
Time-Aligned PAP ATF GTFARX PATFtube
Condition TW SP PP TW SP PP TW SP PP TW SP PP
Baseline 11.1 18.8 22.2 6.1 9.4 6.0 5.1 5.9 4.9 5.6 8.8 7.4Phenylephrine 10.7 19.9 22.9 3.0 2.8 2.4 5.4 6.5 6.0 8.5 4.9 4.3Nitroglycerin 3.2 2.0 2.2 3.9 7.2 7.0 5.3 9.4 8.1 4.3 7.9 7.7Dobutamine 7.4 13.9 17.8 4.9 2.8 2.6 8.2 12.3 14.9 6.7 4.1 6.3Esmolol 5.2 12.0 11.4 2.2 3.8 1.8 2.8 2.2 3.2 2.4 3.7 2.4Norepinephrine 14.0 30.9 35.2 3.9 5.4 4.7 7.3 6.1 5.9 9.1 11.2 11.2Xylazine 6.1 13.2 13.9 2.5 4.0 2.9 3.2 2.7 2.1 2.9 4.8 4.3Saline 11.6 21.0 25.1 4.1 1.2 0.7 4.8 4.7 5.5 4.7 6.7 7.4Hemorrhage 6.5 15.5 16.1 2.1 2.7 1.0 2.7 3.7 3.1 2.8 6.4 5.3Verapamil 8.0 15.0 16.7 2.6 2.8 1.8 2.6 2.5 3.1 3.3 4.8 4.7High-rate Pacing 7.7 13.3 21.5 3.6 1.7 2.7 2.6 2.7 4.8 4.0 6.4 7.6Vasopressin 7.4 16.3 16.9 3.2 3.3 1.9 3.6 3.0 2.4 2.7 4.2 4.6Low-rate Pacing 6.7 15.2 17.1 2.7 1.8 2.6 3.0 2.2 2.0 2.4 4.0 4.0Overall 8.6 17.1 20.3 3.7 4.3 3.4 4.8 6.1 6.7 5.1 6.5 6.6P value 6.5e-6 1.5e-4 3.7e-5 0.02 NS 0.02 0.04 0.002 4.9e-4
Quantities are root mean square errors (RMSEs; mmHg) with respect to the measured AP waveforms. P values indicate statistically significant differences inRMSE over all the conditions with respect to the new adaptive transfer function (ATF) technique. The previous autoregressive exogenous input-based generalizedtransfer function (GTFARX) and tube model-based partially adaptive transfer function (PATFtube) techniques were developed with a subset of the canine data andtested on the remaining data. TW, total waveform (i.e., sample to sample); NS, not significant.
Innovative Methodology
H1960 ADAPTIVE TRANSFER FUNCTION-DERIVED AORTIC PRESSURE
AJP-Heart Circ Physiol • VOL 297 • NOVEMBER 2009 • www.ajpheart.org
To demonstrate feasibility of the new ATF technique, wemeasured a PAP waveform from a femoral artery and thereference AP waveform from the ascending aorta of 6 healthybeagles of similar size during 12 different hemodynamic in-terventions (see Table 1). Thus, unlike most previous relatedefforts, we were able to assess the efficacy of the techniqueover a diverse set of significant perturbations of known effect.On the other hand, our measurements did not allow us toinvestigate the technique in the context of a varying populationof subjects.
Our results (see Table 2 and Fig. 3) showed that the overallTW, SP, and PP RMSEs in the AP waveforms derived by theATF technique were, respectively, 3.7, 4.3, and 3.4 mmHg.These errors effectively amounted to 75% reduction in wavedistortion in the PAP waveforms. The corresponding RMSEsof the GTFARX and PATFtube techniques were, on average,34%, 47%, and 96% higher than the new technique. Indeed, theRMSE reductions achieved by the new technique were, ingeneral, statistically significant over all of the experimentalconditions. It is important to recognize that, unlike the previous
techniques, the ATF technique was not given crucial informa-tion, namely training data comprising a subset of the canine APwaveforms. Even with this handicap, the new technique wasable to outperform the previous techniques.
The improved accuracy afforded by the ATF technique overthe previous techniques was especially pronounced during thedobutamine, norepinephrine, saline, and phenylephrine condi-tions. During the first condition, the transfer function relatingPAP to AP was altered to a relatively large degree. Evidently,intense vasodilation occurred during this positive cardiac ino-tropic condition, as centrally measured PP and HR markedlyincreased from the baseline condition without a change inMAP (see Table 1). During the latter three conditions, the ATFtechnique was comparatively more effective. On the otherhand, this technique was ineffective during the nitroglycerincondition, although better than the previous techniques, andrelatively less efficacious during the baseline condition. How-ever, it should be noted that a statistical assessment of therelative accuracy of the techniques during the individual con-ditions was not feasible, because we employed two different
Fig. 3. Example segments of the referenceAP (solid line), measured PAP (dotted line),and derived AP (dashed line) waveforms bythe new ATF technique and previous autore-gressive exogenous input-based generalizedtransfer function (GTFARX) and tube model-based partially adaptive transfer function(PATFtube) techniques during the 5 differentconditions.
Innovative Methodology
H1961ADAPTIVE TRANSFER FUNCTION-DERIVED AORTIC PRESSURE
AJP-Heart Circ Physiol • VOL 297 • NOVEMBER 2009 • www.ajpheart.org
interventions in each dog. Thus our canine experimental designrepresents a study limitation.
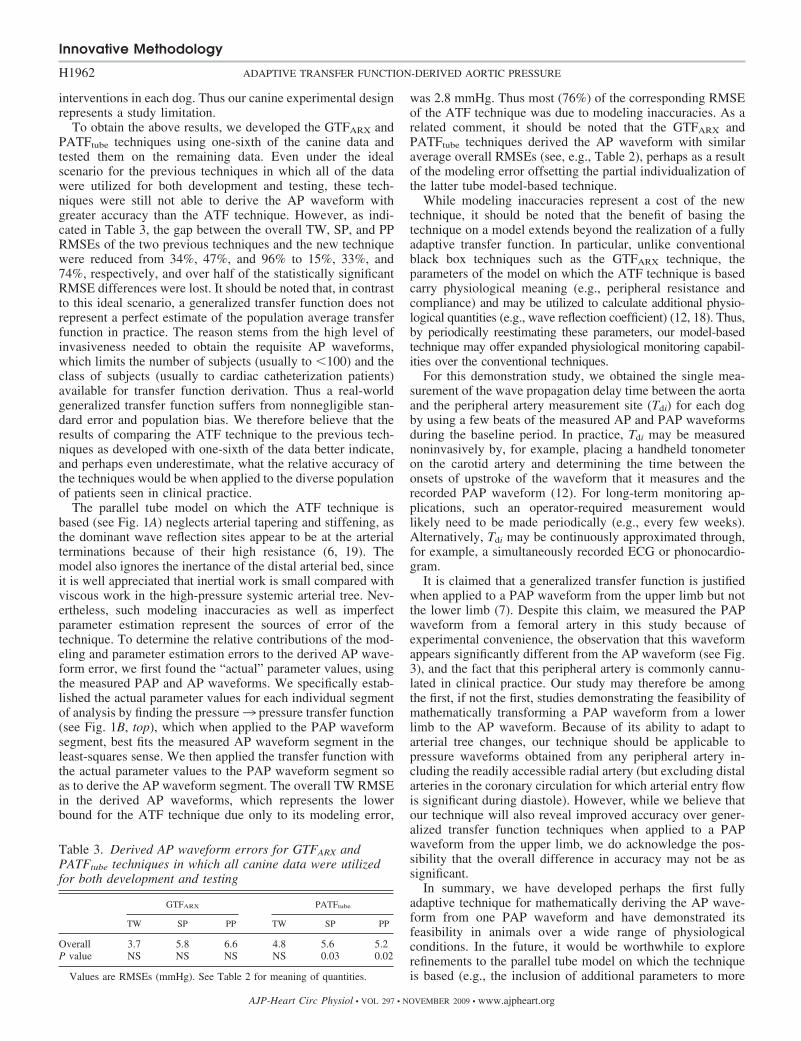
To obtain the above results, we developed the GTFARX andPATFtube techniques using one-sixth of the canine data andtested them on the remaining data. Even under the idealscenario for the previous techniques in which all of the datawere utilized for both development and testing, these tech-niques were still not able to derive the AP waveform withgreater accuracy than the ATF technique. However, as indi-cated in Table 3, the gap between the overall TW, SP, and PPRMSEs of the two previous techniques and the new techniquewere reduced from 34%, 47%, and 96% to 15%, 33%, and74%, respectively, and over half of the statistically significantRMSE differences were lost. It should be noted that, in contrastto this ideal scenario, a generalized transfer function does notrepresent a perfect estimate of the population average transferfunction in practice. The reason stems from the high level ofinvasiveness needed to obtain the requisite AP waveforms,which limits the number of subjects (usually to �100) and theclass of subjects (usually to cardiac catheterization patients)available for transfer function derivation. Thus a real-worldgeneralized transfer function suffers from nonnegligible stan-dard error and population bias. We therefore believe that theresults of comparing the ATF technique to the previous tech-niques as developed with one-sixth of the data better indicate,and perhaps even underestimate, what the relative accuracy ofthe techniques would be when applied to the diverse populationof patients seen in clinical practice.
The parallel tube model on which the ATF technique isbased (see Fig. 1A) neglects arterial tapering and stiffening, asthe dominant wave reflection sites appear to be at the arterialterminations because of their high resistance (6, 19). Themodel also ignores the inertance of the distal arterial bed, sinceit is well appreciated that inertial work is small compared withviscous work in the high-pressure systemic arterial tree. Nev-ertheless, such modeling inaccuracies as well as imperfectparameter estimation represent the sources of error of thetechnique. To determine the relative contributions of the mod-eling and parameter estimation errors to the derived AP wave-form error, we first found the “actual” parameter values, usingthe measured PAP and AP waveforms. We specifically estab-lished the actual parameter values for each individual segmentof analysis by finding the pressure3 pressure transfer function(see Fig. 1B, top), which when applied to the PAP waveformsegment, best fits the measured AP waveform segment in theleast-squares sense. We then applied the transfer function withthe actual parameter values to the PAP waveform segment soas to derive the AP waveform segment. The overall TW RMSEin the derived AP waveforms, which represents the lowerbound for the ATF technique due only to its modeling error,
was 2.8 mmHg. Thus most (76%) of the corresponding RMSEof the ATF technique was due to modeling inaccuracies. As arelated comment, it should be noted that the GTFARX andPATFtube techniques derived the AP waveform with similaraverage overall RMSEs (see, e.g., Table 2), perhaps as a resultof the modeling error offsetting the partial individualization ofthe latter tube model-based technique.
While modeling inaccuracies represent a cost of the newtechnique, it should be noted that the benefit of basing thetechnique on a model extends beyond the realization of a fullyadaptive transfer function. In particular, unlike conventionalblack box techniques such as the GTFARX technique, theparameters of the model on which the ATF technique is basedcarry physiological meaning (e.g., peripheral resistance andcompliance) and may be utilized to calculate additional physio-logical quantities (e.g., wave reflection coefficient) (12, 18). Thus,by periodically reestimating these parameters, our model-basedtechnique may offer expanded physiological monitoring capabil-ities over the conventional techniques.
For this demonstration study, we obtained the single mea-surement of the wave propagation delay time between the aortaand the peripheral artery measurement site (Tdi) for each dogby using a few beats of the measured AP and PAP waveformsduring the baseline period. In practice, Tdi may be measurednoninvasively by, for example, placing a handheld tonometeron the carotid artery and determining the time between theonsets of upstroke of the waveform that it measures and therecorded PAP waveform (12). For long-term monitoring ap-plications, such an operator-required measurement wouldlikely need to be made periodically (e.g., every few weeks).Alternatively, Tdi may be continuously approximated through,for example, a simultaneously recorded ECG or phonocardio-gram.
It is claimed that a generalized transfer function is justifiedwhen applied to a PAP waveform from the upper limb but notthe lower limb (7). Despite this claim, we measured the PAPwaveform from a femoral artery in this study because ofexperimental convenience, the observation that this waveformappears significantly different from the AP waveform (see Fig.3), and the fact that this peripheral artery is commonly cannu-lated in clinical practice. Our study may therefore be amongthe first, if not the first, studies demonstrating the feasibility ofmathematically transforming a PAP waveform from a lowerlimb to the AP waveform. Because of its ability to adapt toarterial tree changes, our technique should be applicable topressure waveforms obtained from any peripheral artery in-cluding the readily accessible radial artery (but excluding distalarteries in the coronary circulation for which arterial entry flowis significant during diastole). However, while we believe thatour technique will also reveal improved accuracy over gener-alized transfer function techniques when applied to a PAPwaveform from the upper limb, we do acknowledge the pos-sibility that the overall difference in accuracy may not be assignificant.
In summary, we have developed perhaps the first fullyadaptive technique for mathematically deriving the AP wave-form from one PAP waveform and have demonstrated itsfeasibility in animals over a wide range of physiologicalconditions. In the future, it would be worthwhile to explorerefinements to the parallel tube model on which the techniqueis based (e.g., the inclusion of additional parameters to more
Table 3. Derived AP waveform errors for GTFARX andPATFtube techniques in which all canine data were utilizedfor both development and testing
GTFARX PATFtube
TW SP PP TW SP PP
Overall 3.7 5.8 6.6 4.8 5.6 5.2P value NS NS NS NS 0.03 0.02
Values are RMSEs (mmHg). See Table 2 for meaning of quantities.
Innovative Methodology
H1962 ADAPTIVE TRANSFER FUNCTION-DERIVED AORTIC PRESSURE
AJP-Heart Circ Physiol • VOL 297 • NOVEMBER 2009 • www.ajpheart.org
accurately represent the terminal loads) as well as continuousapproximation of the wave propagation delay time from simul-taneously recorded noninvasive measurements. In addition,further testing of the technique is needed to establish itsrelative efficacy during different experimental conditions andto assess its applicability to PAP waveforms measured nonin-vasively, from the upper limb, and from humans. Such testingshould involve side-by-side comparisons with the previoustransfer function techniques in terms of not only AP waveformderivation accuracy but also cardiovascular risk stratificationcapabilities (see, e.g., Refs. 9, 17) in order to convincinglydemonstrate the added value of the new technique. If suchfollow-up studies prove successful, then the technique could beemployed for more precise arterial pressure monitoring, titra-tion of therapy, and cardiovascular risk stratification in inten-sive care and surgical units in which PAP catheters are rou-tinely inserted and other clinical environments such as outpa-tient clinics and home in conjunction with noninvasive PAPdevices. Finally, subsequent combination of the technique withan AP waveform analysis technique that we have also recentlydeveloped (16) may ultimately permit continuous monitoringof cardiac output and left ventricular ejection fraction inaddition to AP from just a single PAP waveform.
ACKNOWLEDGMENTS
The authors thank Thoralf Hoelzer-Maddox for his technical contributionsto the data collection.
GRANTS
This work was supported by the National Science Foundation CAREERGrant 0643477 and an award from the American Heart Association.
REFERENCES
1. Cohen RJ. Flow Estimation. Cambridge, MA: Massachusetts Institute ofTechnology, Case No. 13176, 2008.
2. Fetics B, Nevo C, Chen H, Kass DA. Parametric model derivation oftransfer function for noninvasive estimation of aortic pressure by radialtonometry. IEEE Trans Biomed Eng 46: 698–706, 1999.
3. Karamanoglu M, O’Rourke MF, Avolio AP, Kelly RP. An analysis ofthe relationship between central aortic and peripheral upper limb pressurewaves in man. Eur Heart J 14: 160–167, 1993.
4. Malik M. If Dr Bazett had a computer. Pacing Clin Electrophysiol 19:1635–1639, 1996.
5. McDonald DA. Regional pulse-wave velocity in the arterial tree. J ApplPhysiol 24: 73–78, 1968.
6. McDonald DA. Blood Flow in the Arteries. London: Edward Arnold,1974.
7. O’Rourke MF, Avolio AP. Arterial transfer functions: background,applications and reservations. J Hypertens 26: 8–10, 2008.
8. Pruett JD, Bourland JD, Geddes LA. Measurement of pulse-wavevelocity using a beat-sampling technique. Ann Biomed Eng 16: 341–347,1988.
9. Safar ME, Blacher J, Pannier B, Guerin AP, Marchais SJ,Guyonvarc’h PM, London GM. Central pulse pressure and mortality inend-stage renal disease. Hypertension 39: 735–738, 2009.
10. Sanders R, Bailie M, Olivier NB. Stability of ventricular depolarizationin conscious dogs with chronic atrioventricular dissociation and his-bundlepacing. Pacing Clin Electrophysiol 27: 1475–1483, 2004.
11. Stergiopulos N, Westerhof BE, Westerhof N. Physical basis of pressuretransfer from periphery to aorta: a model-based study. Am J Physiol HeartCirc Physiol 274: H1386–H1392, 1998.
12. Sugimachi M, Shishido T, Miyatake K, Sunagawa K. A new model-based method of reconstructing central aortic pressure from peripheralarterial pressure. Jpn J Physiol 51: 217–222, 2001.
13. Swamy G, Ling Q, Li T, Mukkamala R. Blind identification of the aorticpressure waveform from multiple peripheral artery pressure waveforms.Am J Physiol Heart Circ Physiol 292: H2257–H2264, 2007.
14. Swamy G, Mukkamala R. Estimation of the aortic pressure waveformand beat-to-beat cardiac output from multiple peripheral artery pressurewaveforms. IEEE Trans Biomed Eng 55: 1521–1529, 2008.
15. Swamy G, Mukkamala R, Olivier NB. Estimation of the aortic pressurewaveform from a peripheral artery pressure waveform via an adaptivetransfer function. 30th Annu IEEE EMBS Conf 1: 1385–1388, 2008.
16. Swamy G, Kuiper J, Gudur M, Olivier NB, Mukkamala R. Continuousleft ventricular ejection fraction monitoring by aortic pressure waveformanalysis. Ann Biomed Eng 37: 1055–1068, 2009.
17. Wadell TK, Dart AM, Medley TL, Cameron JD, Kingwell BA. Carotidpressure is a better predictor of coronary artery disease severity thanbrachial pressure. Hypertension 38: 927–931, 2001.
18. Westerhof BE, Guelen I, Stok WJ, Wesseling KH, Spaan JA, Wester-hof N, Bos WJ, Stergiopulos N. Arterial pressure transfer characteristics:effects of travel time. Am J Physiol Heart Circ Physiol 292: H800–H807,2007.
19. Westerhof N, Sipkema P, Van Den Bos GC, Elzinga G. Forward andbackward waves in the arterial system. Cardiovasc Res 6: 648 – 656,1972.
Innovative Methodology
H1963ADAPTIVE TRANSFER FUNCTION-DERIVED AORTIC PRESSURE
AJP-Heart Circ Physiol • VOL 297 • NOVEMBER 2009 • www.ajpheart.org


![An automatic method for arterial pulse waveform …...pulse waveform analysis [4544]. The PWV is defined as , the speed at which the pulse pressure propagates along the arterial tree](https://img.dokumen.tips/doc/110x75/5fd258de55c945193d342bd5/an-automatic-method-for-arterial-pulse-waveform-pulse-waveform-analysis-4544.jpg)


