Embed Size (px)
Citation preview
www.elsevier.com/locate/epsl
Earth and Planetary Science Le
Miocene magnetostratigraphy from Equatorial Pacific sediments
(ODP Site 1218, Leg 199)
Luca Lancia,b,*, Josep M. Paresc, James E.T. Channelld, Dennis V. Kente
aFacolta di Scienze Ambientali, Universita di Urbino, Campus scientifico SOGESTA, Urbino, PU 61029, ItalybDepartment of Geological Sciences, Rutgers University, Piscataway, NJ 08854, USA
cDepartment of Geological Sciences, University of Michigan, 2534 C.C. Little Building, Ann Arbor, MI 48109, USAdDepartment of Geological Sciences, University of Florida, 241 Williamson Hall, Gainesville, FL 32611, USA
eDepartment of Geological Sciences, Rutgers University, Piscataway, NJ 08854 USA,
and Lamont-Doherty Earth Observatory, Palisades, NY 10964, USA
Received 29 March 2004; received in revised form 16 July 2004; accepted 17 July 2004
Editor: V. Courtillot
Abstract
Pliocene and Miocene magnetostratigraphy from ODP Site 1218 (Equatorial Pacific) has been obtained by measurements
made on u-channel samples, augmented by about 50 discrete samples. U-channel samples were measured at 1 cm intervals and
stepwise demagnetized in alternating fields up to a maximum peak field of 80 mT. The component magnetization directions
were determined by principal component analysis for demagnetization steps in the 20–60 mT peak field range. A relatively
small number of discrete samples were subject to both thermal and alternating field (AF) demagnetization and gave results
compatible with u-channel measurements.
Magnetostratigraphy from u-channel samples are compared with shipboard data that were based on blanket
demagnetization at peak AF fields of 20 mT. U-channel measurements add more detail to the magnetostratigraphic
record and allow identification of thin polarity zones especially in the upper part of the section were the sedimentation
rates are very low (~2 m/Myr). The component magnetization directions determined from u-channel measurements also
gave more reliable and precise estimates of inclination (paleolatitude). The magnetostratigraphy from Site 1218 can be
unambiguously correlated with the reference geomagnetic polarity time scale and gives a means of dating the sedimentary
sequence. Both Miocene–Pliocene and Oligocene–Miocene stage boundaries were easily identified from the magneto-
stratigraphic record.
Although calculation of paleomagnetic poles is hindered by the low precision of the cores’ azimuthal orientation, the data
from both u-channel and discrete samples allow determination of the paleolatitude of the Site through time with good precision.
Paleomagnetic data indicate that the paleolatitude of Site 1218 has increased form nearly equatorial latitude in the Oligocene to
0012-821X/$ - s
doi:10.1016/j.ep
* Correspon
Tel./fax: +39 07
E-mail addr
tters 226 (2004) 207–224
ee front matter D 2004 Elsevier B.V. All rights reserved.
sl.2004.07.025
ding author. Facolta di Scienze Ambientali, Universita di Urbino, Campus scientifico SOGESTA, Urbino, PU 61029, Italy.
22 304295.
ess: [email protected] (L. Lanci).
L. Lanci et al. / Earth and Planetary Science Letters 226 (2004) 207–224208
its present-day latitude close to 98N. Within the precision of the paleomagnetic data, this is in agreement with current
predictions of plate motion models based on fixed hotspots.
D 2004 Elsevier B.V. All rights reserved.
Keywords: Miocene; magnetostratigraphy; equatorial Pacific; Ocean Drilling Program
1. Introduction
The geomagnetic polarity time scale (GPTS) based
on oceanic magnetic anomalies and magnetostratig-
raphy in deep-sea sediments has become fundamental
in correlating biozonations and absolute ages (i.e.,
[1]). Deep-sea sediment cores may provide long and
continuous sedimentary records that are not affected
by deformation or diagenesis. If drilling does not
excessively disturb the sediments, they can also give
records of geomagnetic polarity that can be used for
global correlation and dating. The Advanced Piston
Corer (APC) used by the Ocean Drilling Program
(ODP) has been very effective for sampling uncon-
solidated sediments with minimum disturbance, and
the resulting cores often give excellent results in
paleomagnetic studies. Moreover, the sediment cores
can be azimuthally oriented preserving declination
information, which is very important at low latitude
where inclination is close to horizontal for both
normal and reversed polarities.
The top 165 m of sediment at ODP Site 1218,
drilled during ODP Leg 199, was cored using the
APC technique and gave a particularly continuous
record of Earth’s magnetic field at a single site. The
record from Site 1218 spans from Late Pleistocene to
middle Eocene including the Oligocene/Miocene
boundary, and has good biostratigraphic control [2].
Combined with that from nearby Site 1219, the
magnetostratigraphic record can be extended into the
Early Oligocene.
Shipboard magnetostratigraphy at Site 1218 con-
stituted the basis of the chronology for this site, and
was the means of precise correlation among the sites
of Leg 199. The shipboard polarity stratigraphy was
determined from bblanketQ demagnetization at a single
peak field (20 mT) and the results were clear enough
to allow interpretation of most of the polarity
sequence. However, many features of the initial
polarity record were obscured by the relatively low
resolution of the shipboard pass-through magneto-
meter. To improve the quality of the magnetostratig-
raphy, we have carried out stepwise demagnetization
of u-channel samples, accompanied by rock magnetic
studies. In this paper, we present a high-resolution
paleomagnetic record, based on u-channel measure-
ments, from the Miocene section of Site 1218.
2. Materials and sampling
2.1. Drilling Sites
ODP Site 1218 was cored in the equatorial Pacific
Ocean during Leg 199 at 8853.378VN, 135822.00VWin a water depth of 4811 m. Site 1218 is located on
~40-Myr-old crust, and is situated on a basement
swell ~38 north of the Clipperton Fracture Zone in the
central tropical Pacific (Fig. 1). Pacific plate motion
carried the site across the equator at ~40 Ma based
upon a fixed hotspot model (see [3] for 0–5 Ma
Pacific hotspot rotation pole and [4] for older poles).
Based on this model, the site remained within 28 of
the equator from the time the basaltic crust was
formed until 27 Ma. The sediments recovered from
Site 1218 should therefore record equatorial paleo-
ceanographic conditions from the middle Eocene until
the early Oligocene. At Site 1218, a complete sedi-
ment sequence was recovered to within 15 m of
basaltic basement. The top 165 m were cored using
the APC system and sediment cores could be
azimuthally oriented preserving the declination infor-
mation. The sediments from this site yielded an
excellent record of geomagnetic polarity reversals
for the entire Miocene and most of the Oligocene at a
single site. Nannofossils and radiolarians indicate that
the section is biostratigraphically complete with no
apparent hiatuses [2].
The Pleistocene and Miocene sediments at Site
1218 comprise two main sedimentary units [2]. At the
top of the sedimentary column is 59 m of yellowish
brown clay with some nannofossils and occasional
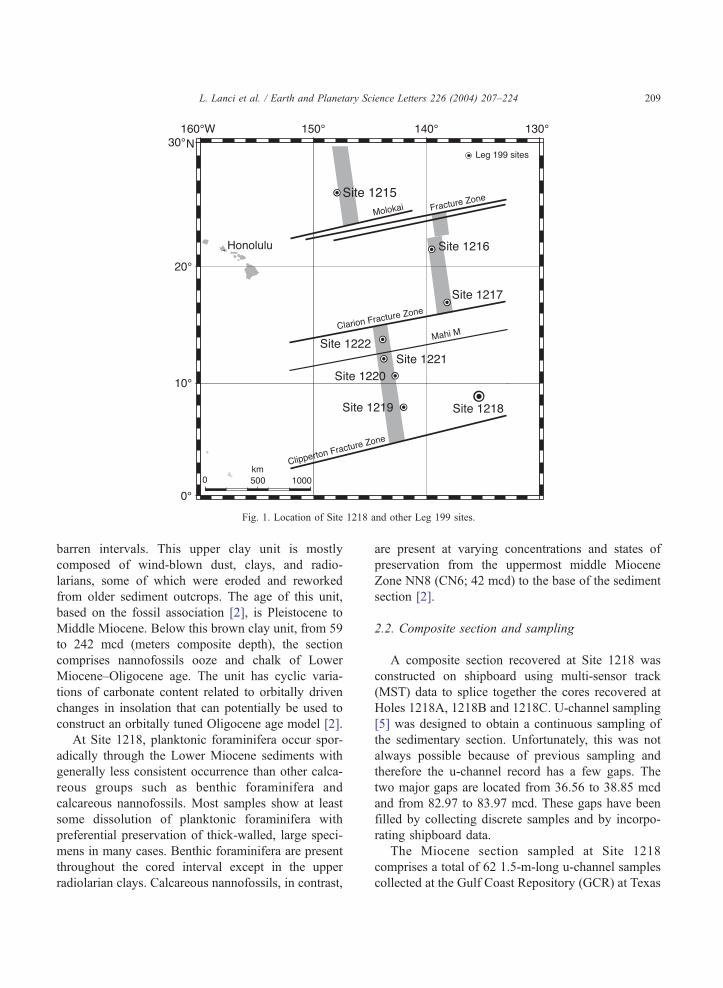
Fig. 1. Location of Site 1218 and other Leg 199 sites.
L. Lanci et al. / Earth and Planetary Science Letters 226 (2004) 207–224 209
barren intervals. This upper clay unit is mostly
composed of wind-blown dust, clays, and radio-
larians, some of which were eroded and reworked
from older sediment outcrops. The age of this unit,
based on the fossil association [2], is Pleistocene to
Middle Miocene. Below this brown clay unit, from 59
to 242 mcd (meters composite depth), the section
comprises nannofossils ooze and chalk of Lower
Miocene–Oligocene age. The unit has cyclic varia-
tions of carbonate content related to orbitally driven
changes in insolation that can potentially be used to
construct an orbitally tuned Oligocene age model [2].
At Site 1218, planktonic foraminifera occur spor-
adically through the Lower Miocene sediments with
generally less consistent occurrence than other calca-
reous groups such as benthic foraminifera and
calcareous nannofossils. Most samples show at least
some dissolution of planktonic foraminifera with
preferential preservation of thick-walled, large speci-
mens in many cases. Benthic foraminifera are present
throughout the cored interval except in the upper
radiolarian clays. Calcareous nannofossils, in contrast,
are present at varying concentrations and states of
preservation from the uppermost middle Miocene
Zone NN8 (CN6; 42 mcd) to the base of the sediment
section [2].
2.2. Composite section and sampling
A composite section recovered at Site 1218 was
constructed on shipboard using multi-sensor track
(MST) data to splice together the cores recovered at
Holes 1218A, 1218B and 1218C. U-channel sampling
[5] was designed to obtain a continuous sampling of
the sedimentary section. Unfortunately, this was not
always possible because of previous sampling and
therefore the u-channel record has a few gaps. The
two major gaps are located from 36.56 to 38.85 mcd
and from 82.97 to 83.97 mcd. These gaps have been
filled by collecting discrete samples and by incorpo-
rating shipboard data.
The Miocene section sampled at Site 1218
comprises a total of 62 1.5-m-long u-channel samples
collected at the Gulf Coast Repository (GCR) at Texas
L. Lanci et al. / Earth and Planetary Science Letters 226 (2004) 207–224210
A and M University from Holes 1218A, 1218B, and
1218C. A set of 39 discrete samples (7 cm3 plastic
cubes) collected shipboard from Hole 1218Awere AF
demagnetized and another 29 discrete samples col-
lected at the GCR in the Miocene section of Site 1218
were either thermally or AF demagnetized. In total, 51
discrete samples gave acceptable paleomagnetic
directions.
The depth scale used in the paper is the mcd scale
used in [2] with minor modifications from the results
of the magnetostratigraphy, which allowed a better
match between cores. Since the mcd scale is subject to
interpretation, we also report the depth of polarity
reversals using the standard ODP notation of Site–
Hole–Core–Section number, and centimeter position
relative to the Section top, that unequivocally identi-
fies each specimen.
3. Magnetic measurements
3.1. NRM measurements
Natural Remanent Magnetization (NRM) in u-
channel samples was measured at 1-cm intervals and
subjected to progressive alternating field (AF) demag-
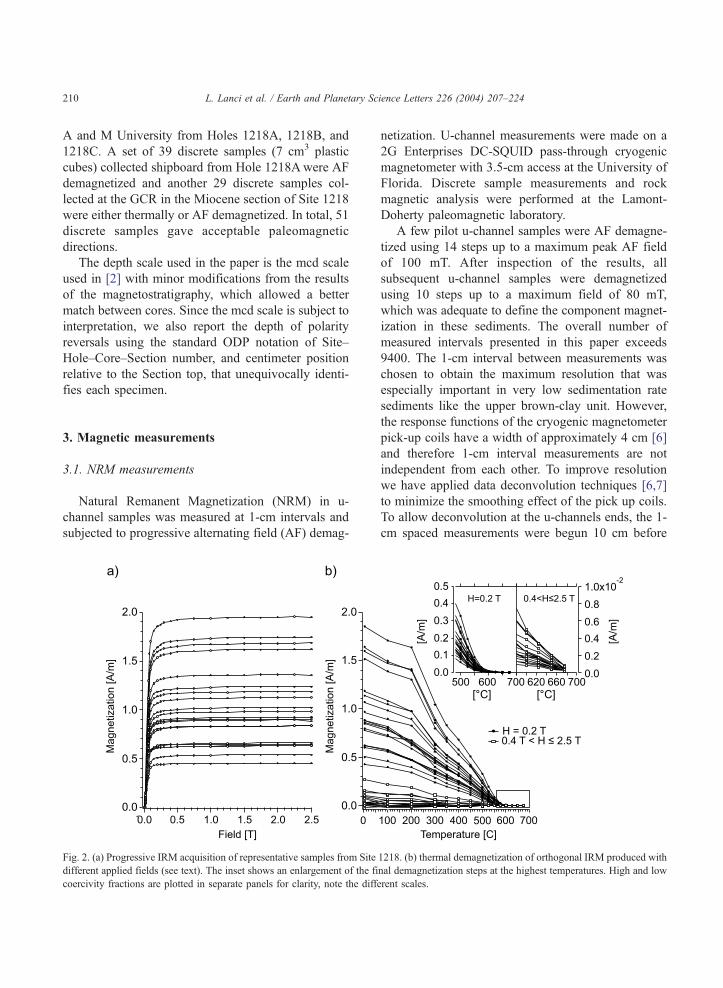
Fig. 2. (a) Progressive IRM acquisition of representative samples from Site
different applied fields (see text). The inset shows an enlargement of the fi
coercivity fractions are plotted in separate panels for clarity, note the diff
netization. U-channel measurements were made on a
2G Enterprises DC-SQUID pass-through cryogenic
magnetometer with 3.5-cm access at the University of
Florida. Discrete sample measurements and rock
magnetic analysis were performed at the Lamont-
Doherty paleomagnetic laboratory.
A few pilot u-channel samples were AF demagne-
tized using 14 steps up to a maximum peak AF field
of 100 mT. After inspection of the results, all
subsequent u-channel samples were demagnetized
using 10 steps up to a maximum field of 80 mT,
which was adequate to define the component magnet-
ization in these sediments. The overall number of
measured intervals presented in this paper exceeds
9400. The 1-cm interval between measurements was
chosen to obtain the maximum resolution that was
especially important in very low sedimentation rate
sediments like the upper brown-clay unit. However,
the response functions of the cryogenic magnetometer
pick-up coils have a width of approximately 4 cm [6]
and therefore 1-cm interval measurements are not
independent from each other. To improve resolution
we have applied data deconvolution techniques [6,7]
to minimize the smoothing effect of the pick up coils.
To allow deconvolution at the u-channels ends, the 1-
cm spaced measurements were begun 10 cm before
1218. (b) thermal demagnetization of orthogonal IRM produced with
nal demagnetization steps at the highest temperatures. High and low
erent scales.
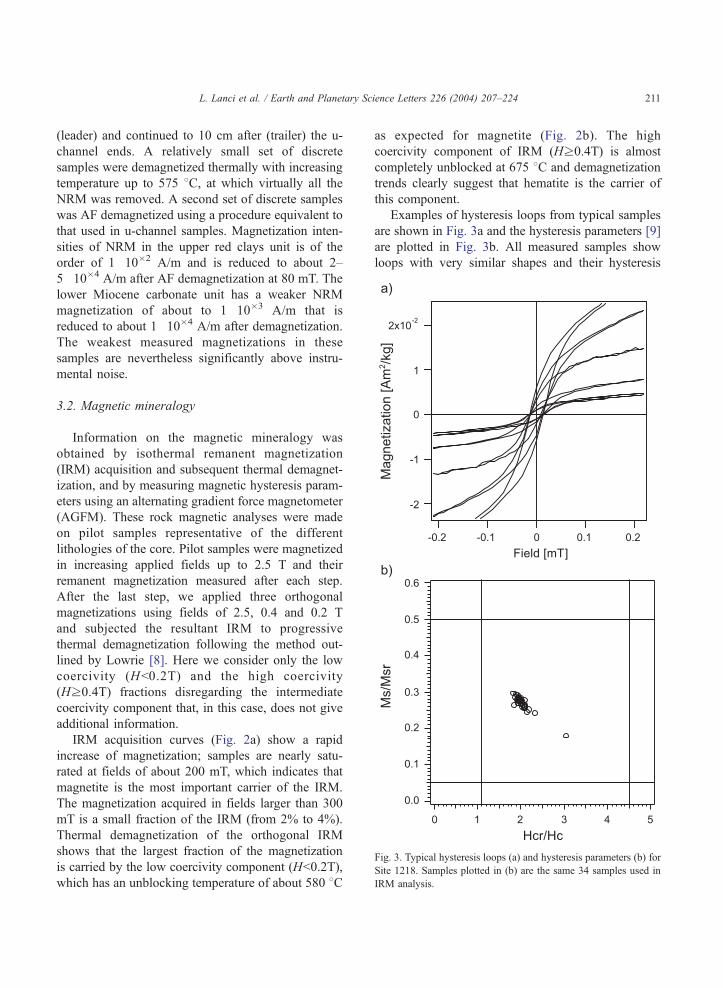
Fig. 3. Typical hysteresis loops (a) and hysteresis parameters (b) fo
Site 1218. Samples plotted in (b) are the same 34 samples used in
IRM analysis.
L. Lanci et al. / Earth and Planetary Science Letters 226 (2004) 207–224 211
(leader) and continued to 10 cm after (trailer) the u-
channel ends. A relatively small set of discrete
samples were demagnetized thermally with increasing
temperature up to 575 8C, at which virtually all the
NRM was removed. A second set of discrete samples
was AF demagnetized using a procedure equivalent to
that used in u-channel samples. Magnetization inten-
sities of NRM in the upper red clays unit is of the
order of 1�10�2 A/m and is reduced to about 2–
5�10�4 A/m after AF demagnetization at 80 mT. The
lower Miocene carbonate unit has a weaker NRM
magnetization of about to 1�10�3 A/m that is
reduced to about 1�10�4 A/m after demagnetization.
The weakest measured magnetizations in these
samples are nevertheless significantly above instru-
mental noise.
3.2. Magnetic mineralogy
Information on the magnetic mineralogy was
obtained by isothermal remanent magnetization
(IRM) acquisition and subsequent thermal demagnet-
ization, and by measuring magnetic hysteresis param-
eters using an alternating gradient force magnetometer
(AGFM). These rock magnetic analyses were made
on pilot samples representative of the different
lithologies of the core. Pilot samples were magnetized
in increasing applied fields up to 2.5 T and their
remanent magnetization measured after each step.
After the last step, we applied three orthogonal
magnetizations using fields of 2.5, 0.4 and 0.2 T
and subjected the resultant IRM to progressive
thermal demagnetization following the method out-
lined by Lowrie [8]. Here we consider only the low
coercivity (Hb0.2T) and the high coercivity
(Hz0.4T) fractions disregarding the intermediate
coercivity component that, in this case, does not give
additional information.
IRM acquisition curves (Fig. 2a) show a rapid
increase of magnetization; samples are nearly satu-
rated at fields of about 200 mT, which indicates that
magnetite is the most important carrier of the IRM.
The magnetization acquired in fields larger than 300
mT is a small fraction of the IRM (from 2% to 4%).
Thermal demagnetization of the orthogonal IRM
shows that the largest fraction of the magnetization
is carried by the low coercivity component (Hb0.2T),
which has an unblocking temperature of about 580 8C
as expected for magnetite (Fig. 2b). The high
coercivity component of IRM (Hz0.4T) is almost
completely unblocked at 675 8C and demagnetization
trends clearly suggest that hematite is the carrier of
this component.
Examples of hysteresis loops from typical samples
are shown in Fig. 3a and the hysteresis parameters [9]
are plotted in Fig. 3b. All measured samples show
loops with very similar shapes and their hysteresis
r
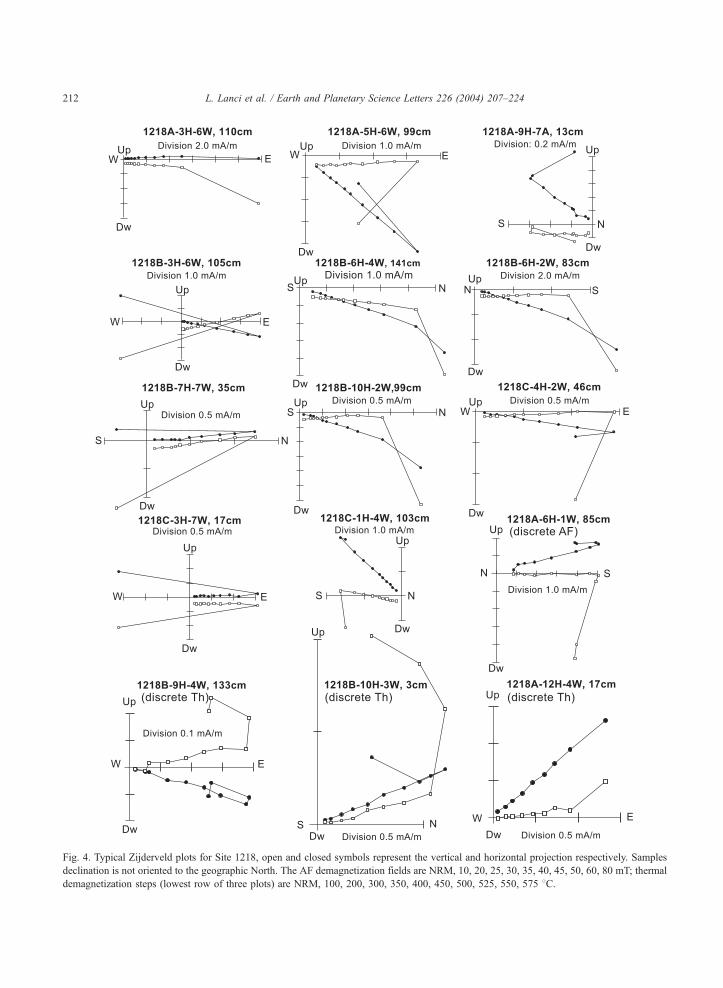
Fig. 4. Typical Zijderveld plots for Site 1218, open and closed symbols represent the vertical and horizontal projection respectively. Samples
declination is not oriented to the geographic North. The AF demagnetization fields are NRM, 10, 20, 25, 30, 35, 40, 45, 50, 60, 80 mT; thermal
demagnetization steps (lowest row of three plots) are NRM, 100, 200, 300, 350, 400, 450, 500, 525, 550, 575 8C.
L. Lanci et al. / Earth and Planetary Science Letters 226 (2004) 207–224212
L. Lanci et al. / Earth and Planetary Science Letters 226 (2004) 207–224 213
parameters are well grouped in the pseudo single-
domain field with a Mr/Ms value of about 0.3. This
suggests a uniform grain size of the magnetite
particles along the sediment column with a little
apparent influence of differing lithologies.
4. Paleomagnetic directions
4.1. Core orientation
Because of the nearly equatorial present-day
(8853VN) and expected paleolatitude of Site 1218,
azimuthal orientation of cores is of the utmost
importance for interpretation of magnetic polarity.
The APC cores collected from Site 1218 were
oriented using the btensor toolQ. For technical reasons,as is standard practice, the cores from Holes A and B
were oriented starting from core number 3. Since the
first two cores, constituting approximately 17 m of
sediments, could not be azimuthally oriented, they
were not sampled.
The tensor tool provided a good first-order
orientation for most of the cores with errors up to
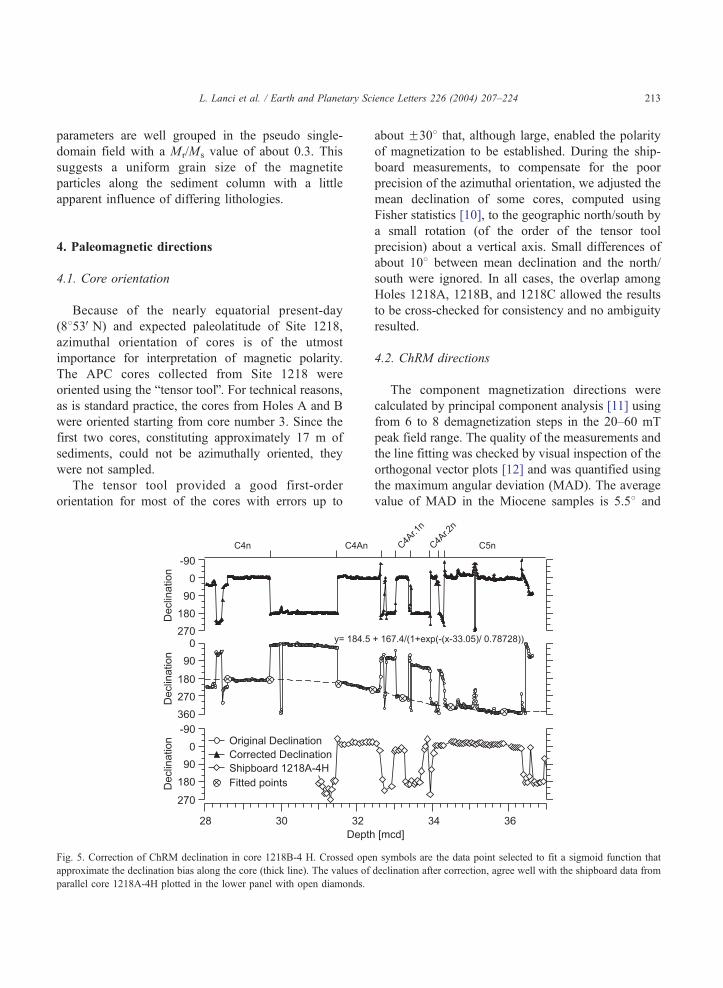
Fig. 5. Correction of ChRM declination in core 1218B-4 H. Crossed ope
approximate the declination bias along the core (thick line). The values of
parallel core 1218A-4H plotted in the lower panel with open diamonds.
about F308 that, although large, enabled the polarity
of magnetization to be established. During the ship-
board measurements, to compensate for the poor
precision of the azimuthal orientation, we adjusted the
mean declination of some cores, computed using
Fisher statistics [10], to the geographic north/south by
a small rotation (of the order of the tensor tool
precision) about a vertical axis. Small differences of
about 108 between mean declination and the north/
south were ignored. In all cases, the overlap among
Holes 1218A, 1218B, and 1218C allowed the results
to be cross-checked for consistency and no ambiguity
resulted.
4.2. ChRM directions
The component magnetization directions were
calculated by principal component analysis [11] using
from 6 to 8 demagnetization steps in the 20–60 mT
peak field range. The quality of the measurements and
the line fitting was checked by visual inspection of the
orthogonal vector plots [12] and was quantified using
the maximum angular deviation (MAD). The average
value of MAD in the Miocene samples is 5.58 and
n symbols are the data point selected to fit a sigmoid function that
declination after correction, agree well with the shipboard data from
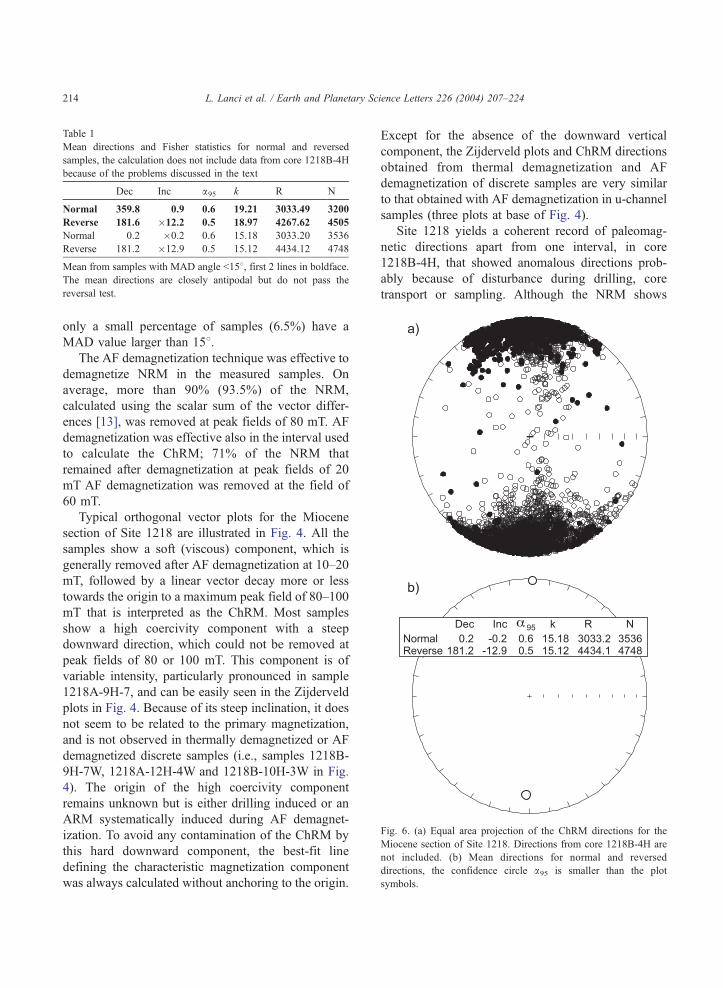
Table 1
Mean directions and Fisher statistics for normal and reversed
samples, the calculation does not include data from core 1218B-4H
because of the problems discussed in the text
Dec Inc a95 k R N
Normal 359.8 0.9 0.6 19.21 3033.49 3200
Reverse 181.6 �12.2 0.5 18.97 4267.62 4505
Normal 0.2 �0.2 0.6 15.18 3033.20 3536
Reverse 181.2 �12.9 0.5 15.12 4434.12 4748
Mean from samples with MAD angle b158, first 2 lines in boldface.
The mean directions are closely antipodal but do not pass the
reversal test.
Fig. 6. (a) Equal area projection of the ChRM directions for the
Miocene section of Site 1218. Directions from core 1218B-4H are
not included. (b) Mean directions for normal and reversed
directions, the confidence circle a95 is smaller than the plo
symbols.
L. Lanci et al. / Earth and Planetary Science Letters 226 (2004) 207–224214
only a small percentage of samples (6.5%) have a
MAD value larger than 158.The AF demagnetization technique was effective to
demagnetize NRM in the measured samples. On
average, more than 90% (93.5%) of the NRM,
calculated using the scalar sum of the vector differ-
ences [13], was removed at peak fields of 80 mT. AF
demagnetization was effective also in the interval used
to calculate the ChRM; 71% of the NRM that
remained after demagnetization at peak fields of 20
mT AF demagnetization was removed at the field of
60 mT.
Typical orthogonal vector plots for the Miocene
section of Site 1218 are illustrated in Fig. 4. All the
samples show a soft (viscous) component, which is
generally removed after AF demagnetization at 10–20
mT, followed by a linear vector decay more or less
towards the origin to a maximum peak field of 80–100
mT that is interpreted as the ChRM. Most samples
show a high coercivity component with a steep
downward direction, which could not be removed at
peak fields of 80 or 100 mT. This component is of
variable intensity, particularly pronounced in sample
1218A-9H-7, and can be easily seen in the Zijderveld
plots in Fig. 4. Because of its steep inclination, it does
not seem to be related to the primary magnetization,
and is not observed in thermally demagnetized or AF
demagnetized discrete samples (i.e., samples 1218B-
9H-7W, 1218A-12H-4W and 1218B-10H-3W in Fig.
4). The origin of the high coercivity component
remains unknown but is either drilling induced or an
ARM systematically induced during AF demagnet-
ization. To avoid any contamination of the ChRM by
this hard downward component, the best-fit line
defining the characteristic magnetization component
was always calculated without anchoring to the origin.
Except for the absence of the downward vertical
component, the Zijderveld plots and ChRM directions
obtained from thermal demagnetization and AF
demagnetization of discrete samples are very similar
to that obtained with AF demagnetization in u-channel
samples (three plots at base of Fig. 4).
Site 1218 yields a coherent record of paleomag-
netic directions apart from one interval, in core
1218B-4H, that showed anomalous directions prob-
ably because of disturbance during drilling, core
transport or sampling. Although the NRM shows
t
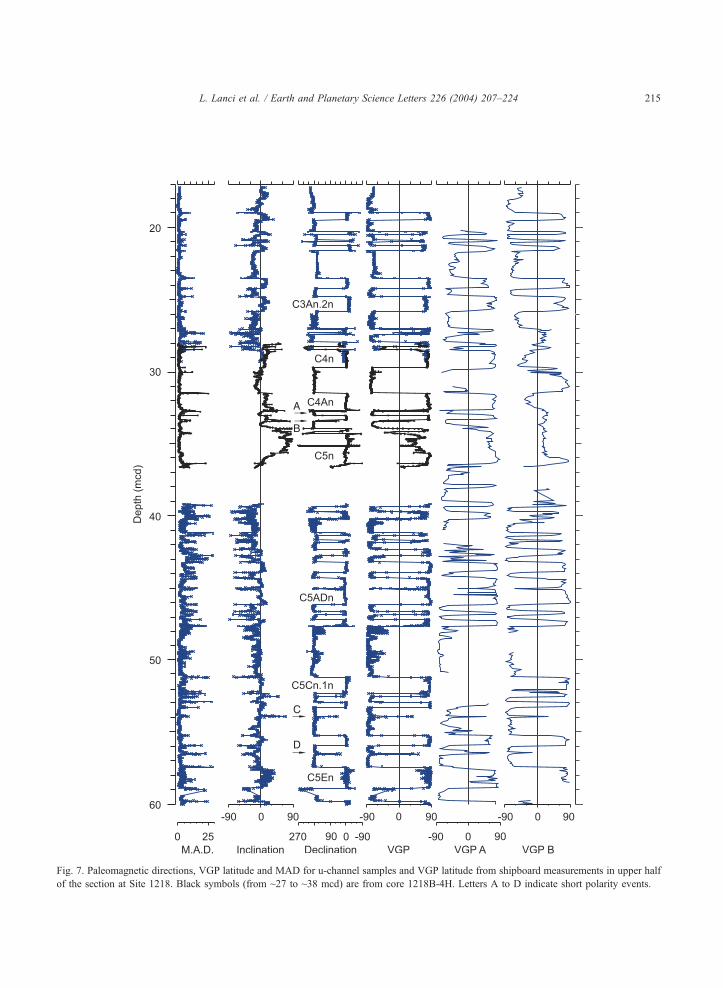
Fig. 7. Paleomagnetic directions, VGP latitude and MAD for u-channel samples and VGP latitude from shipboard measurements in upper half
of the section at Site 1218. Black symbols (from ~27 to ~38 mcd) are from core 1218B-4H. Letters A to D indicate short polarity events.
L. Lanci et al. / Earth and Planetary Science Letters 226 (2004) 207–224 215
L. Lanci et al. / Earth and Planetary Science Letters 226 (2004) 207–224216
well-defined vectors with low MAD values, the
ChRM declinations appear to be increasingly rotated
from the bottom to the top of the core. These
directions are clearly inconsistent with those
expected and with shipboard results from correlative
core 1218A-4H (Fig. 5). Unfortunately, the correla-
tive core in Hole 1218A (1218A-4H), which was not
disturbed and gave good shipboard results, could not
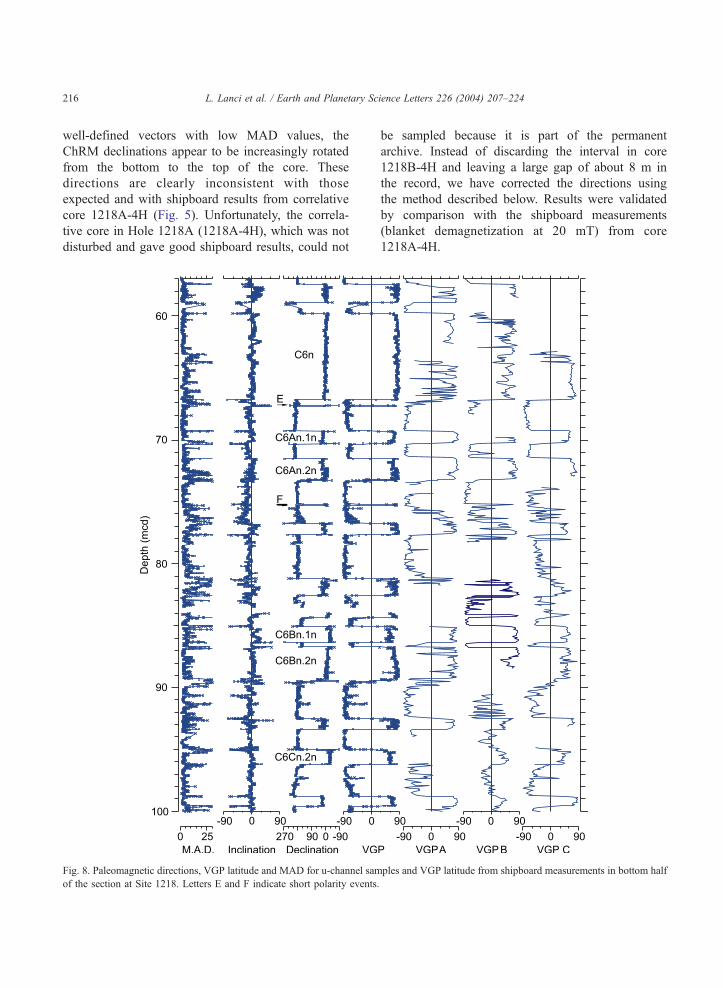
Fig. 8. Paleomagnetic directions, VGP latitude and MAD for u-channel sam
of the section at Site 1218. Letters E and F indicate short polarity events
be sampled because it is part of the permanent
archive. Instead of discarding the interval in core
1218B-4H and leaving a large gap of about 8 m in
the record, we have corrected the directions using
the method described below. Results were validated
by comparison with the shipboard measurements
(blanket demagnetization at 20 mT) from core
1218A-4H.
ples and VGP latitude from shipboard measurements in bottom half
.
L. Lanci et al. / Earth and Planetary Science Letters 226 (2004) 207–224 217
To correct the ChRM declinations for core 1218B-
4H, we selected a small number of declination points
that we believed represents the same (normal) polar-
ity. We then fit these points with a sigmoidal function
and we rotated all declinations by an angle equal to
the difference between the fitted function and the
North. The process is illustrated in Fig. 5. The
corrected ChRM declinations are in good agreement
with shipboard results from parallel core 1218A-4H.
We have plotted the modified data in subsequent
figures using a different symbol to clearly distinguish
them from the rest. An additional problem that we did
not correct is the abnormally high inclinations of
sections 1218B-4H-4 and 1218B-4H-5 in the 34–36
mcd interval.
Mean directions computed with Fisher statistics
separately for the normal and reverse polarity samples
are shown in Table 1 and in Fig. 6. The data set in Fig.
6 does not include directions from core 1218B-4H and
the discrete samples; note that the re-orientation of
cores does not induce biases in the reversal test
because both normal and reverse components are
rotated by the same angle. Although nearly antipodal,
the normal and reverse directions are significantly
different at the 95% confidence level because the very
small a95 confidence circles do not intersect. For this
reason, the data do not pass the reversal test. Failure of
reversal test is mostly due to the difference between
reverse and normal polarity inclinations, the former
being ~108 steeper than the later. This could be a
consequence of the influence of the high coercivity
component mentioned above or a characteristic of the
geomagnetic field (see discussion below).
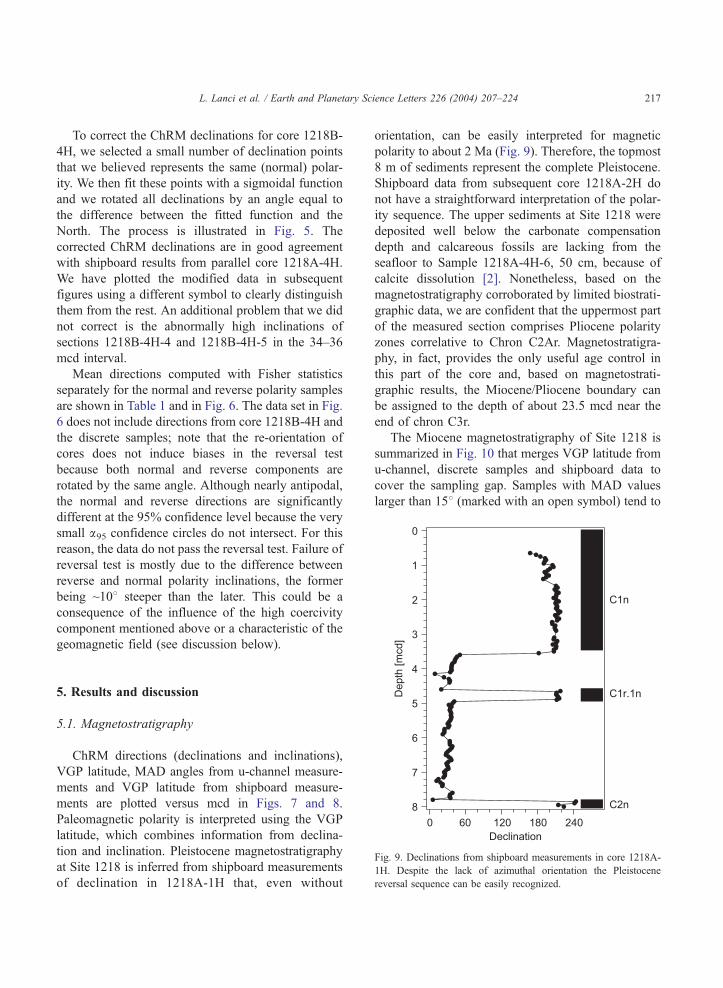
Fig. 9. Declinations from shipboard measurements in core 1218A
1H. Despite the lack of azimuthal orientation the Pleistocene
reversal sequence can be easily recognized.
5. Results and discussion
5.1. Magnetostratigraphy
ChRM directions (declinations and inclinations),
VGP latitude, MAD angles from u-channel measure-
ments and VGP latitude from shipboard measure-
ments are plotted versus mcd in Figs. 7 and 8.
Paleomagnetic polarity is interpreted using the VGP
latitude, which combines information from declina-
tion and inclination. Pleistocene magnetostratigraphy
at Site 1218 is inferred from shipboard measurements
of declination in 1218A-1H that, even without
orientation, can be easily interpreted for magnetic
polarity to about 2 Ma (Fig. 9). Therefore, the topmost
8 m of sediments represent the complete Pleistocene.
Shipboard data from subsequent core 1218A-2H do
not have a straightforward interpretation of the polar-
ity sequence. The upper sediments at Site 1218 were
deposited well below the carbonate compensation
depth and calcareous fossils are lacking from the
seafloor to Sample 1218A-4H-6, 50 cm, because of
calcite dissolution [2]. Nonetheless, based on the
magnetostratigraphy corroborated by limited biostrati-
graphic data, we are confident that the uppermost part
of the measured section comprises Pliocene polarity
zones correlative to Chron C2Ar. Magnetostratigra-
phy, in fact, provides the only useful age control in
this part of the core and, based on magnetostrati-
graphic results, the Miocene/Pliocene boundary can
be assigned to the depth of about 23.5 mcd near the
end of chron C3r.
The Miocene magnetostratigraphy of Site 1218 is
summarized in Fig. 10 that merges VGP latitude from
u-channel, discrete samples and shipboard data to
cover the sampling gap. Samples with MAD values
larger than 158 (marked with an open symbol) tend to
-
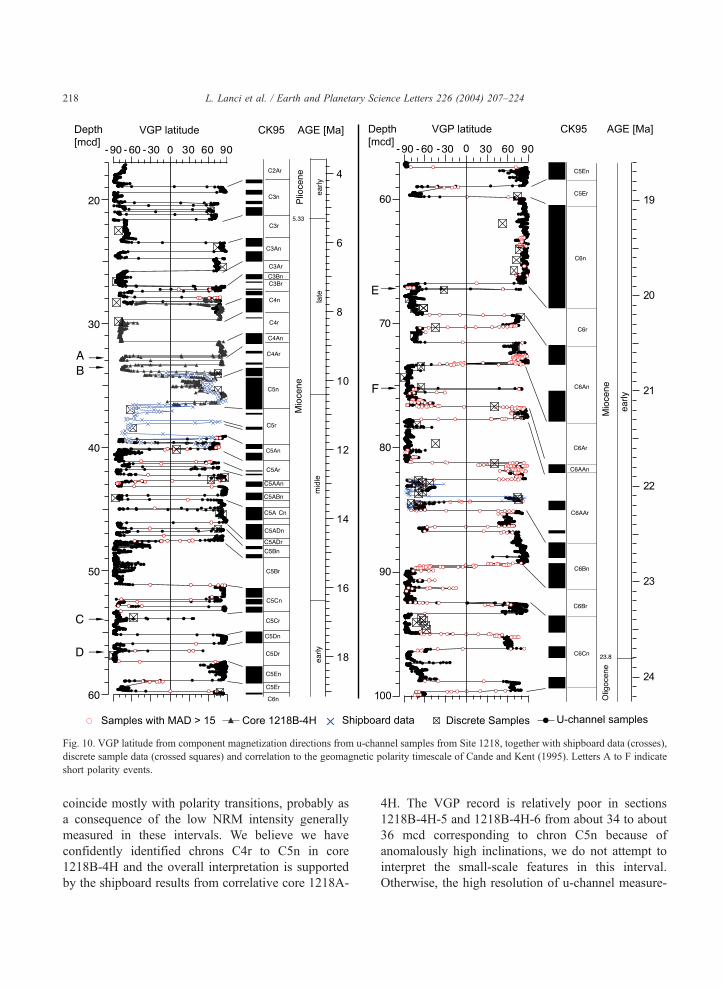
Fig. 10. VGP latitude from component magnetization directions from u-channel samples from Site 1218, together with shipboard data (crosses),
discrete sample data (crossed squares) and correlation to the geomagnetic polarity timescale of Cande and Kent (1995). Letters A to F indicate
short polarity events.
L. Lanci et al. / Earth and Planetary Science Letters 226 (2004) 207–224218
coincide mostly with polarity transitions, probably as
a consequence of the low NRM intensity generally
measured in these intervals. We believe we have
confidently identified chrons C4r to C5n in core
1218B-4H and the overall interpretation is supported
by the shipboard results from correlative core 1218A-
4H. The VGP record is relatively poor in sections
1218B-4H-5 and 1218B-4H-6 from about 34 to about
36 mcd corresponding to chron C5n because of
anomalously high inclinations, we do not attempt to
interpret the small-scale features in this interval.
Otherwise, the high resolution of u-channel measure-
L. Lanci et al. / Earth and Planetary Science Letters 226 (2004) 207–224 219
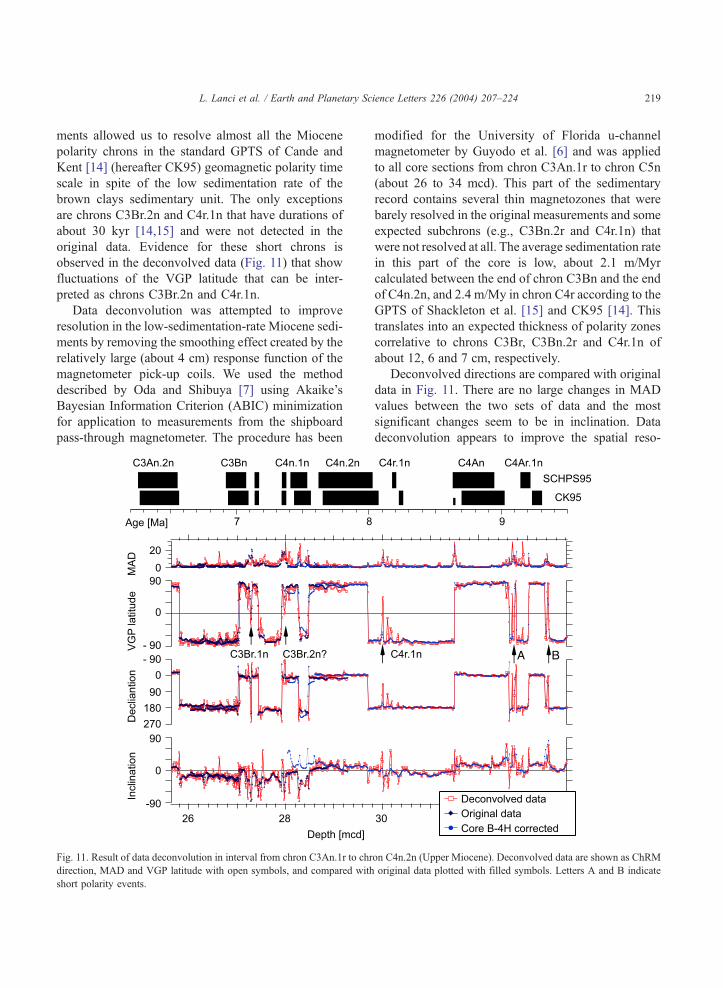
ments allowed us to resolve almost all the Miocene
polarity chrons in the standard GPTS of Cande and
Kent [14] (hereafter CK95) geomagnetic polarity time
scale in spite of the low sedimentation rate of the
brown clays sedimentary unit. The only exceptions
are chrons C3Br.2n and C4r.1n that have durations of
about 30 kyr [14,15] and were not detected in the
original data. Evidence for these short chrons is
observed in the deconvolved data (Fig. 11) that show
fluctuations of the VGP latitude that can be inter-
preted as chrons C3Br.2n and C4r.1n.
Data deconvolution was attempted to improve
resolution in the low-sedimentation-rate Miocene sedi-
ments by removing the smoothing effect created by the
relatively large (about 4 cm) response function of the
magnetometer pick-up coils. We used the method
described by Oda and Shibuya [7] using Akaike’s
Bayesian Information Criterion (ABIC) minimization
for application to measurements from the shipboard
pass-through magnetometer. The procedure has been
Fig. 11. Result of data deconvolution in interval from chron C3An.1r to chr
direction, MAD and VGP latitude with open symbols, and compared with
short polarity events.
modified for the University of Florida u-channel
magnetometer by Guyodo et al. [6] and was applied
to all core sections from chron C3An.1r to chron C5n
(about 26 to 34 mcd). This part of the sedimentary
record contains several thin magnetozones that were
barely resolved in the original measurements and some
expected subchrons (e.g., C3Bn.2r and C4r.1n) that
were not resolved at all. The average sedimentation rate
in this part of the core is low, about 2.1 m/Myr
calculated between the end of chron C3Bn and the end
of C4n.2n, and 2.4 m/My in chron C4r according to the
GPTS of Shackleton et al. [15] and CK95 [14]. This
translates into an expected thickness of polarity zones
correlative to chrons C3Br, C3Bn.2r and C4r.1n of
about 12, 6 and 7 cm, respectively.
Deconvolved directions are compared with original
data in Fig. 11. There are no large changes in MAD
values between the two sets of data and the most
significant changes seem to be in inclination. Data
deconvolution appears to improve the spatial reso-
on C4n.2n (Upper Miocene). Deconvolved data are shown as ChRM
original data plotted with filled symbols. Letters A and B indicate
L. Lanci et al. / Earth and Planetary Science Letters 226 (2004) 207–224220
lution by emphasizing the variation of VGP latitude at
C3Br and creating a pronounced variation of the VGP
latitude at 27.97 mcd that can be interpreted as
C3Bn.2r. The short variation of the VGP latitude up to
458N in chron C4r at 30.01 mcd can also be
interpreted as evidence of chron C4r.1n.
The results of data deconvolution are useful for
detecting short polarity zones in this section even
though the improvement is not substantial, possibly
due to amplification of the background noise using
this technique. Nevertheless, these observations can
be used to place some limits on the resolution of u-
channel measurements that can be expected from the
sediments at this site. Based on the examples of
chrons C3Br, C3Bn.2r and C4r.1n, we conclude that
polarity chrons with duration equivalent to the
deposition of a 5-cm stratigraphic interval may not
be recorded, whereas polarity chrons with duration
equivalent to a 10-cm or thicker stratigraphic interval
would most probably be recorded.
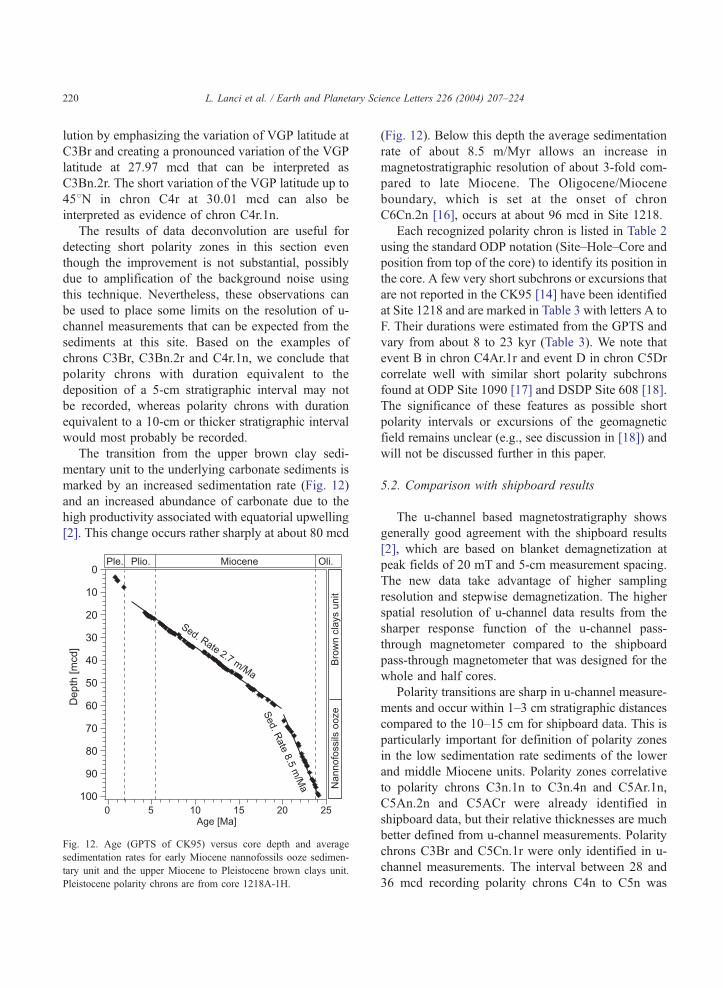
The transition from the upper brown clay sedi-
mentary unit to the underlying carbonate sediments is
marked by an increased sedimentation rate (Fig. 12)
and an increased abundance of carbonate due to the
high productivity associated with equatorial upwelling
[2]. This change occurs rather sharply at about 80 mcd
Fig. 12. Age (GPTS of CK95) versus core depth and average
sedimentation rates for early Miocene nannofossils ooze sedimen-
tary unit and the upper Miocene to Pleistocene brown clays unit.
Pleistocene polarity chrons are from core 1218A-1H.
(Fig. 12). Below this depth the average sedimentation
rate of about 8.5 m/Myr allows an increase in
magnetostratigraphic resolution of about 3-fold com-
pared to late Miocene. The Oligocene/Miocene
boundary, which is set at the onset of chron
C6Cn.2n [16], occurs at about 96 mcd in Site 1218.
Each recognized polarity chron is listed in Table 2
using the standard ODP notation (Site–Hole–Core and
position from top of the core) to identify its position in
the core. A few very short subchrons or excursions that
are not reported in the CK95 [14] have been identified
at Site 1218 and are marked in Table 3 with letters A to
F. Their durations were estimated from the GPTS and
vary from about 8 to 23 kyr (Table 3). We note that
event B in chron C4Ar.1r and event D in chron C5Dr
correlate well with similar short polarity subchrons
found at ODP Site 1090 [17] and DSDP Site 608 [18].
The significance of these features as possible short
polarity intervals or excursions of the geomagnetic
field remains unclear (e.g., see discussion in [18]) and
will not be discussed further in this paper.
5.2. Comparison with shipboard results
The u-channel based magnetostratigraphy shows
generally good agreement with the shipboard results
[2], which are based on blanket demagnetization at
peak fields of 20 mT and 5-cm measurement spacing.
The new data take advantage of higher sampling
resolution and stepwise demagnetization. The higher
spatial resolution of u-channel data results from the
sharper response function of the u-channel pass-
through magnetometer compared to the shipboard
pass-through magnetometer that was designed for the
whole and half cores.
Polarity transitions are sharp in u-channel measure-
ments and occur within 1–3 cm stratigraphic distances
compared to the 10–15 cm for shipboard data. This is
particularly important for definition of polarity zones
in the low sedimentation rate sediments of the lower
and middle Miocene units. Polarity zones correlative
to polarity chrons C3n.1n to C3n.4n and C5Ar.1n,
C5An.2n and C5ACr were already identified in
shipboard data, but their relative thicknesses are much
better defined from u-channel measurements. Polarity
chrons C3Br and C5Cn.1r were only identified in u-
channel measurements. The interval between 28 and
36 mcd recording polarity chrons C4n to C5n was
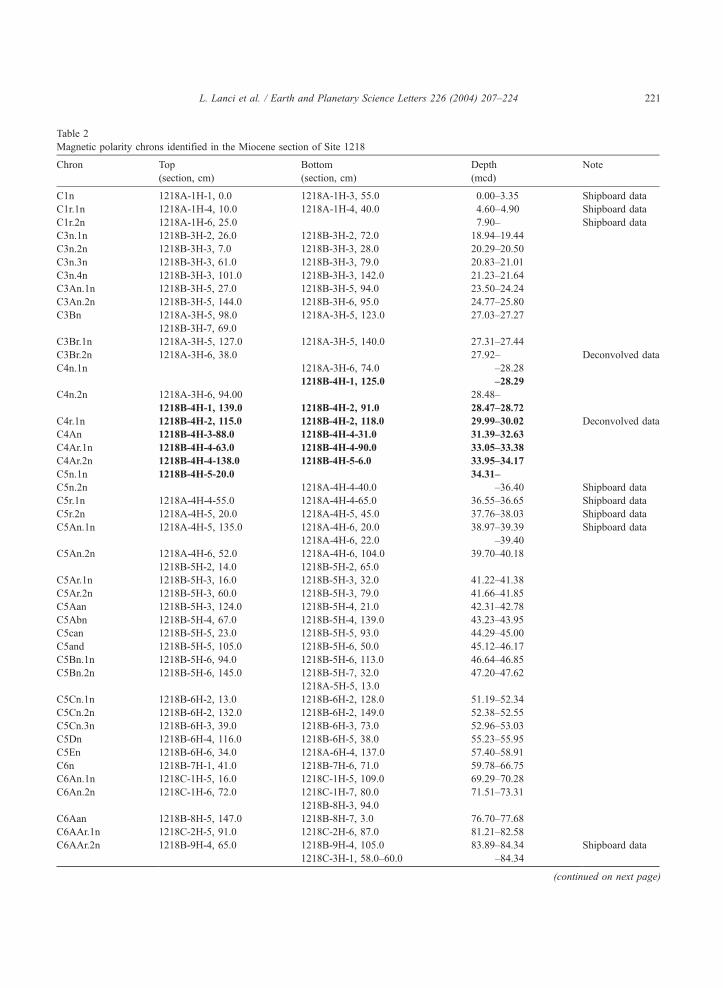
Table 2
Magnetic polarity chrons identified in the Miocene section of Site 1218
Chron Top
(section, cm)
Bottom
(section, cm)
Depth
(mcd)
Note
C1n 1218A-1H-1, 0.0 1218A-1H-3, 55.0 0.00–3.35 Shipboard data
C1r.1n 1218A-1H-4, 10.0 1218A-1H-4, 40.0 4.60–4.90 Shipboard data
C1r.2n 1218A-1H-6, 25.0 7.90– Shipboard data
C3n.1n 1218B-3H-2, 26.0 1218B-3H-2, 72.0 18.94–19.44
C3n.2n 1218B-3H-3, 7.0 1218B-3H-3, 28.0 20.29–20.50
C3n.3n 1218B-3H-3, 61.0 1218B-3H-3, 79.0 20.83–21.01
C3n.4n 1218B-3H-3, 101.0 1218B-3H-3, 142.0 21.23–21.64
C3An.1n 1218B-3H-5, 27.0 1218B-3H-5, 94.0 23.50–24.24
C3An.2n 1218B-3H-5, 144.0 1218B-3H-6, 95.0 24.77–25.80
C3Bn 1218A-3H-5, 98.0 1218A-3H-5, 123.0 27.03–27.27
1218B-3H-7, 69.0
C3Br.1n 1218A-3H-5, 127.0 1218A-3H-5, 140.0 27.31–27.44
C3Br.2n 1218A-3H-6, 38.0 27.92– Deconvolved data
C4n.1n 1218A-3H-6, 74.0 –28.28
1218B-4H-1, 125.0 –28.29
C4n.2n 1218A-3H-6, 94.00 28.48–
1218B-4H-1, 139.0 1218B-4H-2, 91.0 28.47–28.72
C4r.1n 1218B-4H-2, 115.0 1218B-4H-2, 118.0 29.99–30.02 Deconvolved data
C4An 1218B-4H-3-88.0 1218B-4H-4-31.0 31.39–32.63
C4Ar.1n 1218B-4H-4-63.0 1218B-4H-4-90.0 33.05–33.38
C4Ar.2n 1218B-4H-4-138.0 1218B-4H-5-6.0 33.95–34.17
C5n.1n 1218B-4H-5-20.0 34.31–
C5n.2n 1218A-4H-4-40.0 –36.40 Shipboard data
C5r.1n 1218A-4H-4-55.0 1218A-4H-4-65.0 36.55–36.65 Shipboard data
C5r.2n 1218A-4H-5, 20.0 1218A-4H-5, 45.0 37.76–38.03 Shipboard data
C5An.1n 1218A-4H-5, 135.0 1218A-4H-6, 20.0 38.97–39.39 Shipboard data
1218A-4H-6, 22.0 –39.40
C5An.2n 1218A-4H-6, 52.0 1218A-4H-6, 104.0 39.70–40.18
1218B-5H-2, 14.0 1218B-5H-2, 65.0
C5Ar.1n 1218B-5H-3, 16.0 1218B-5H-3, 32.0 41.22–41.38
C5Ar.2n 1218B-5H-3, 60.0 1218B-5H-3, 79.0 41.66–41.85
C5Aan 1218B-5H-3, 124.0 1218B-5H-4, 21.0 42.31–42.78
C5Abn 1218B-5H-4, 67.0 1218B-5H-4, 139.0 43.23–43.95
C5can 1218B-5H-5, 23.0 1218B-5H-5, 93.0 44.29–45.00
C5and 1218B-5H-5, 105.0 1218B-5H-6, 50.0 45.12–46.17
C5Bn.1n 1218B-5H-6, 94.0 1218B-5H-6, 113.0 46.64–46.85
C5Bn.2n 1218B-5H-6, 145.0 1218B-5H-7, 32.0 47.20–47.62
1218A-5H-5, 13.0
C5Cn.1n 1218B-6H-2, 13.0 1218B-6H-2, 128.0 51.19–52.34
C5Cn.2n 1218B-6H-2, 132.0 1218B-6H-2, 149.0 52.38–52.55
C5Cn.3n 1218B-6H-3, 39.0 1218B-6H-3, 73.0 52.96–53.03
C5Dn 1218B-6H-4, 116.0 1218B-6H-5, 38.0 55.23–55.95
C5En 1218B-6H-6, 34.0 1218A-6H-4, 137.0 57.40–58.91
C6n 1218B-7H-1, 41.0 1218B-7H-6, 71.0 59.78–66.75
C6An.1n 1218C-1H-5, 16.0 1218C-1H-5, 109.0 69.29–70.28
C6An.2n 1218C-1H-6, 72.0 1218C-1H-7, 80.0 71.51–73.31
1218B-8H-3, 94.0
C6Aan 1218B-8H-5, 147.0 1218B-8H-7, 3.0 76.70–77.68
C6AAr.1n 1218C-2H-5, 91.0 1218C-2H-6, 87.0 81.21–82.58
C6AAr.2n 1218B-9H-4, 65.0 1218B-9H-4, 105.0 83.89–84.34 Shipboard data
1218C-3H-1, 58.0–60.0 –84.34
(continued on next page)
L. Lanci et al. / Earth and Planetary Science Letters 226 (2004) 207–224 221
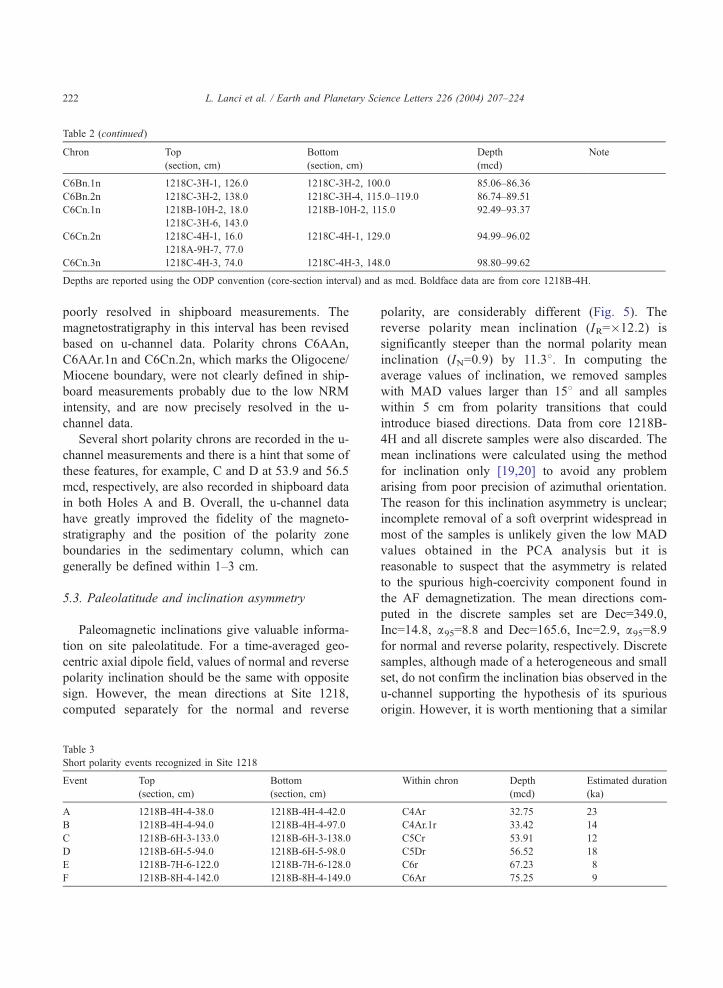
Table 2 (continued)
Chron Top
(section, cm)
Bottom
(section, cm)
Depth
(mcd)
Note
C6Bn.1n 1218C-3H-1, 126.0 1218C-3H-2, 100.0 85.06–86.36
C6Bn.2n 1218C-3H-2, 138.0 1218C-3H-4, 115.0–119.0 86.74–89.51
C6Cn.1n 1218B-10H-2, 18.0 1218B-10H-2, 115.0 92.49–93.37
1218C-3H-6, 143.0
C6Cn.2n 1218C-4H-1, 16.0 1218C-4H-1, 129.0 94.99–96.02
1218A-9H-7, 77.0
C6Cn.3n 1218C-4H-3, 74.0 1218C-4H-3, 148.0 98.80–99.62
Depths are reported using the ODP convention (core-section interval) and as mcd. Boldface data are from core 1218B-4H.
L. Lanci et al. / Earth and Planetary Science Letters 226 (2004) 207–224222
poorly resolved in shipboard measurements. The
magnetostratigraphy in this interval has been revised
based on u-channel data. Polarity chrons C6AAn,
C6AAr.1n and C6Cn.2n, which marks the Oligocene/
Miocene boundary, were not clearly defined in ship-
board measurements probably due to the low NRM
intensity, and are now precisely resolved in the u-
channel data.
Several short polarity chrons are recorded in the u-
channel measurements and there is a hint that some of
these features, for example, C and D at 53.9 and 56.5
mcd, respectively, are also recorded in shipboard data
in both Holes A and B. Overall, the u-channel data
have greatly improved the fidelity of the magneto-
stratigraphy and the position of the polarity zone
boundaries in the sedimentary column, which can
generally be defined within 1–3 cm.
5.3. Paleolatitude and inclination asymmetry
Paleomagnetic inclinations give valuable informa-
tion on site paleolatitude. For a time-averaged geo-
centric axial dipole field, values of normal and reverse
polarity inclination should be the same with opposite
sign. However, the mean directions at Site 1218,
computed separately for the normal and reverse
Table 3
Short polarity events recognized in Site 1218
Event Top
(section, cm)
Bottom
(section, cm)
A 1218B-4H-4-38.0 1218B-4H-4-42.0
B 1218B-4H-4-94.0 1218B-4H-4-97.0
C 1218B-6H-3-133.0 1218B-6H-3-138.0
D 1218B-6H-5-94.0 1218B-6H-5-98.0
E 1218B-7H-6-122.0 1218B-7H-6-128.0
F 1218B-8H-4-142.0 1218B-8H-4-149.0
polarity, are considerably different (Fig. 5). The
reverse polarity mean inclination (IR=�12.2) is
significantly steeper than the normal polarity mean
inclination (IN=0.9) by 11.38. In computing the
average values of inclination, we removed samples
with MAD values larger than 158 and all samples
within 5 cm from polarity transitions that could
introduce biased directions. Data from core 1218B-
4H and all discrete samples were also discarded. The
mean inclinations were calculated using the method
for inclination only [19,20] to avoid any problem
arising from poor precision of azimuthal orientation.
The reason for this inclination asymmetry is unclear;
incomplete removal of a soft overprint widespread in
most of the samples is unlikely given the low MAD
values obtained in the PCA analysis but it is
reasonable to suspect that the asymmetry is related
to the spurious high-coercivity component found in
the AF demagnetization. The mean directions com-
puted in the discrete samples set are Dec=349.0,
Inc=14.8, a95=8.8 and Dec=165.6, Inc=2.9, a95=8.9
for normal and reverse polarity, respectively. Discrete
samples, although made of a heterogeneous and small
set, do not confirm the inclination bias observed in the
u-channel supporting the hypothesis of its spurious
origin. However, it is worth mentioning that a similar
Within chron Depth
(mcd)
Estimated duration
(ka)
C4Ar 32.75 23
C4Ar.1r 33.42 14
C5Cr 53.91 12
C5Dr 56.52 18
C6r 67.23 8
C6Ar 75.25 9
L. Lanci et al. / Earth and Planetary Science Letters 226 (2004) 207–224 223
phenomenon has been observed by Pares and Lanci
[21] in ODP Site 1220, which also used AF
demagnetization techniques on u-channel samples,
and by Schneider and Kent [22,23] on discrete
samples in cores of Plio–Pleistocene equatorial sedi-
ment where the effect was ascribed to a non-reversing
quadrupole component of the geomagnetic field.
Whatever its cause, the inclination polarity bias
should be removed to calculate the site paleolatitude.
It is not possible to establish a priori if the bias in
inclination affects preferentially one polarity without
knowing the direction of the biasing component.
However, since the component of the magnetization
carrying the bias is a relatively small fraction of the
ChRM (the maximum possible bias is smaller than
108) we can assume, to the first order approximation,
that it affects normal and reverse polarity in the same
way. This assumption is especially appropriate if the
bias is due to the steep high-coercivity component,
which is nearly perpendicular to the directions. Using
this simple approach the inclination bias was cor-
rected by adding the values that restore the symmetry
between mean paleomagnetic inclinations calculated
within adjacent polarity chrons. The inclinations
obtained indicate a linear trend from present-day
inclination to near zero (equatorial) inclination in the
late Oligocene–early Miocene. This average trend is
slightly shallower than the value expected from
paleolatitude of the Pacific plate through time [3,4]
but the difference is well within the uncertainty of
about F38 in latitude (F68 in inclination) due to the
data scatter.
6. Conclusion
Site 1218 gave a continuous magnetostratigraphic
record of the Miocene from an equatorial site. The
magnetostratigraphy matches very closely the polarity
pattern of the GPTS providing an accurate time frame
for the Miocene at this site and the basis for future
cyclostratigraphic dating and precise global correla-
tions. The Pliocene–Miocene and Miocene–Oligocene
boundaries can be easily identified, based on the
magnetostratigraphy, at 22 and 96.5 mcd, respectively.
Six short-polarity intervals have been observed in
the Miocene section of Site 1218, which do not
have a counterpart in the CK95 GTPS and they do
not correspond to any of the bcryptochronsQ reportedin the CK95 GPTS. The significance of these events
as real geomagnetic reversals cannot be assessed
based solely on the data presented here; however
event B in chron C4Ar.1r and event D in chron
C5Dr have been found elsewhere [17,18] suggesting
that these two may represent true geomagnetic
polarity subchrons.
The analysis of paleomagnetic inclinations supports
current reconstruction models of Pacific plate move-
ments within the uncertainty of F68 in inclination.
Acknowledgments
We are grateful to Ann Hirt (ETH Zurich) and
Leonardo Sagnotti (INVG Rome) for support in the
measurement of part of the discrete samples and to
Helen Evans for help with u-channel measurements.
L. Sagnotti and an anonymous reviewer are thanked
for helping in improving the manuscript. Phil Rum-
ford and Bruce Horan, at the Gulf Coast Repository,
were very helpful and patient with core sampling.
This research used samples provided by the Ocean
Drilling Program (ODP). The ODP is sponsored by
the U.S. National Science Foundation (NSF) and
participating countries under management of Joint
Oceanographic Institutions (JOI), Inc. Funding for
this research was provided by USSAC. LDEO
contribution Number 6649.
References
[1] N.D. Opdyke, G. Channell, Magnetic Stratigraphy, Academic
Press, New York, 1996, p. 346.
[2] Shipboard Scientific Party, Leg 199 summary, in: M.W. Lyle,
P.A. Wilson, T.R. Janecek, et al., (Eds.), Proc. ODP, Init.
Repts., vol. 199, Ocean Drilling Program, College Station TX,
2002, pp. 1–87.
[3] A.E. Gripp, R.G. Gordon, Current plate velocities relative to
the hotspots incorporating the NUVEL-1 global plate motion
model, Geophys. Res. Lett. 17 (1990) 1109–1112.
[4] D.C. Engebretson, A. Cox, R.G. Gordon, Relative motions
between Oceanic and Continental plates in the Pacific Basin,
Spec. Pap. -Geol. Soc. Am. (1985) 206.
[5] L. Tauxe, J.L. LaBrecque, R. Dodson, M. Fuller, U-channels-a
new technique for paleomagnetic analysis of hydraulic piston
cores, EOS, Trans. Am. Geophys. Union 64 (1983) 219.
[6] Y. Guyodo, J.E.T. Channell, R. Thomas, Deconvolution of u-
channel paleomagnetic data near geomagnetic reversals and
L. Lanci et al. / Earth and Planetary Science Letters 226 (2004) 207–224224
short events, Geophys. Res. Lett. 29 (2002) 1845,
(doi:10.1029/2002GL014963).
[7] H. Oda, H. Shibuya, Deconvolution of long-core paleomag-
netic data of Ocean drilling program by Akaike’s Bayesian
information criterion minimization, J. Geophys. Res. 101
(1996) 2815–2834.
[8] W. Lowrie, Identification of ferromagnetic minerals in a rock
by coercivity and unblocking temperature properties, Geo-
phys. Res. Lett. 17 (1990) 159–162.
[9] R. Day, M. Fuller, V.A. Schmidt, Hysteresis properties of
titanomagnetites: grain-size and compositional dependence,
Phys. Earth Planet. Inter. 13 (1977) 260–267.
[10] R.A. Fisher, Dispersion on a sphere, Proc. R. Soc. Lond. A217
(1953) 295–305.
[11] J.L. Kirschvink, The least-squares line and plane and the
analysis of paleomagnetic data, Geophys. J. R. Astron. Soc. 62
(1980) 699–718.
[12] J.D.A. Zijderveld, A.C. demagnetization of rocks—analysis
of results, in: D.W. Collinson, K.M. Creer, S.K. Runcorn
(Eds.), Methods in Paleomagnetism, Elsevier, New York,
1967, pp. 254–286.
[13] J. Gee, H. Staudigel, L. Tauxe, T. Pick, Y. Gallet,
Magnetization of the La Palma Seamount Series: implica-
tions for seamount paleopoles, J. Geophys. Res. 98 11
(1993) 743–768.
[14] S.C. Cande, D.V. Kent, Revised calibration of the geomagnetic
polarity time scale for the Late Cretaceous and Cenozoic, J.
Geophys. Res. 100 (1995) 6093–6095.
[15] N.J. Shackleton, S. Crowhurst, T. Hagelberg, N.G. Pisias,
D.A. Schneider, A new Late Neogene time scale: application
to Leg 138 sites, Proceedings of the Ocean Drilling Program,
Sci. Res. 138 (1995) 73–90.
[16] F.F. Steininger, M.P. Aubrey, M. Biolzi, A.M. Borsetti, F.
Cati, F. Corfield, R. Gelati, S. Iaccarino, G. Napoleone, F.
Rogl, R. Rotzel, S. Spezzaferri, F. Tateo, G. Villa, D.
Zevenboom, Proposal for the global stratotype section and
point (GSSP) for the base of the Neogene (the Paleogene/
Neogene boundary), in: A. Montanari, et al. (Eds.), Miocene
Stratigraphy: An Integrated Approach, Elsevier, Amsterdam,
1997, pp. 125–147.
[17] E.T. Channell, S. Galeotti, E.E. Martin, K. Billups, H. Scher,
J.S. Stoner, Eocene to Miocene magnetostratigraphy, biostra-
tigraphy, and chemostratigraphy at ODP Site 1090 (sub-
Antarctic South Atlantic), Geol. Soc. Am. Bull. 115 (2003)
607–623.
[18] W. Krijgsmann, D.V. Kent, Non-uniform occurrence of short-
term fluctuations in geomagnetic field? New results from
Middle to Late Miocene sediments of the North Atlantic
(DSDP Site 608), AGU Monograph (2004) (in press).
[19] P.L. McFadden, A. Reid, Analysis of paleomagnetic inclina-
tion data, Geophys. J. R. Astron. Soc. 69 (1982) 307–319.
[20] D.A. Schneider, D.V. Kent, The time-averaged paleomagnetic
field, Rev. Geophys. 18 (1990) 71–96.
[21] M.J. Pares, L. Lanci, A complete Middle Eocene–Early
Miocene magnetic polarity stratigraphy in Equatorial Pacific
sediments (ODP Site 1220), AGU Monograph (2004) (in
press).
[22] D.A. Schneider, D.V. Kent, The paleomagnetic field from
equatorial deep-sea sediments: axial symmetry and polarity
asymmetry, Science 242 (1988) 252–256.
[23] D.A. Schneider, D.V. Kent, Inclination anomalies from Indian
Ocean sediments and the possibility of a standing nondipole
field, J. Geophys. Res. 93 (1988) 11621–11630.