Embed Size (px)
Citation preview

Total employment in Minnesota will expand by 370,000 jobs during
the 10-year period from 2004 to 2014, reaching 3.3 million jobs by 2014, according torecently released Minnesota employmentprojections.1 The projected increase is slightly morethan the 352,000 jobs added during the previous10-year period (1994-2004). The rate of job growth,however, is expected to be slightly slower during thenext 10 years compared to the previous 10 years. Jobgrowth averaged 1.3 percent each year between1994 and 2004 but is expected to be slightly lower,1.2 percent annually, between 2004 and 2014.
Minnesota's long-term employment projections(10-year timeframe) are based primarily on nationalprojections developed by the Bureau of LaborStatistics (BLS).2 The BLS projects GDP (GrossDomestic Product) growth will average 3.1 percentannually during the 2004-14 projection period,down from the 3.2 percent average annual increaseachieved over the 1994-2004 period.
Minnesota, like all other states, customizes nationalprojections to reflect the state's unique industrialand occupational mixes. Historical employmenttrends for 290 industries in Minnesota arecompared to corresponding national industryemployment trends using statistical models. Themodels are used in conjunction with BLS'sprojections of national industry employment toproduce industry projections for Minnesota.
Projected industry employment is converted intooccupational employment projections based onindustry staffing patterns—distribution of industryemployment across occupations. Staffing patterns forMinnesota industries are developed from estimates ofoccupational employment collected by the MinnesotaSalary Survey, which is a product of the OccupationalEmployment Statistics (OES) program.3
The main goal of employmentprojections is to provide details on projected jobgrowth and employment prospects for 780occupations in Minnesota. Projections of future jobgrowth at the national, state, and substate level arewidely used in career guidance, in planningeducation and training programs, and in workforcedevelopment efforts in the private and publicsectors.
Changes in the demand for goods and services,productivity advances, and shifts in businesspractices combine to alter occupationalemployment and affect job prospects. The expectedexpansion of health care services during the next 10 years is a reliable example of how changes in the demand for goods and services fuel demand for particular occupations. As the baby boomgeneration enters its senior years, demand forhealth care services will steadily increase.Expanding health care service will in turn boost thenumber of workers in health care related jobs likeregistered nurses, pharmacists, dental assistants,and home health aides.
While most occupations will experience varyingrates of employment growth over the next 10 years,15 percent of occupations concentrated in theoffice and administrative support and productionoccupational groups will decline. Occupationsexpected to see the most job decline over thenext 10 years are:
Farmers
Stock clerks
File clerks
Order clerks
1 Detailed 2004 - 2014 occupational and industry employment projections for Minnesota can be found at www.deed.state.mn.us/lmi/tools/projections.htm.
2 The BLS's main projection web site is www.bls.gov/emp/home.htm.
3 Information on the Minnesota Salary Survey is available at www.deed.state.mn.us/lmi/tools/oes.htm.
Minnesota Job Outlook to

2 Supplement to Minnesota Employment Review August 2006
Employment projections attempt to incorporate allthe demand, business practice, and technologytrends. But trends can and do change unexpectedly.Offshoring—the practice of U.S. firms sendingservice-related work overseas—is one such trendthat will affect job opportunities in a number ofoccupations in the future. Occupations that aremost likely to be at risk for offshoring have beenidentified by the BLS. Projected job growth rates foroccupations likely to be offshored, such asinformation technology occupations, have beenscaled back from previous projection rounds.
Minnesota's total employment is projected toincrease 12.8 percent over the 2004-14 period, justbelow the 13 percent projected increase for U.S.employment. During the previous 10-year period,Minnesota's employment expanded slightly morethan the nation's, increasing 13.8 percent inMinnesota and 12.7 percent nationally.
The two largest major occupational groups inMinnesota—professional and related occupationsand service occupations—will increase the fastestand add the most jobs in Minnesota from 2004 to2014 (see Table 1). These two major occupationalgroups, which tend to have occupations at theopposite ends of the educational attainment andearnings spectrum, are projected to account formore than half of all employment growth over thenext 10 years. Employment in management,business, and financial occupations is also projectedto grow faster than overall employment.
All major occupational groups are projected to addjobs between 2004 and 2014 but job growth in thestate's smallest occupational group, the farming,fishing, and forestry group, will be minimal.Production occupations constitute anotheroccupational group that is expected to experience slowgrowth over the next 10 years. Production occupationsare concentrated in Minnesota's manufacturing sectorwhich is expected to increase employment by only 1 percent over the projection period. Office andadministrative support occupations will increase halfas fast as overall job growth but employment willstill expand by nearly 27,000 jobs during the next 10 years since this occupational group is employedin almost every industrial corner in the state.
Sales and related occupations, construction andextraction occupations, and transportation andmaterial moving occupations are all projected togrow by more than 10 percent but below the state'sprojected 12.8 percent total employment increase.
Almost 80 percent of projected job growth ispredicted to occur across 377 occupations that areexpected to increase faster than the projected 12.8percent overall employment expansion. The remaining20 percent of employment growth will occur across278 occupations that are projected to increase butby less than 12.8 percent by 2014. Roughly 23,000positions are expected to be lost across 116occupations that are projected to decline in workersover the next 10 years. The occupations projectedto decline accounted for 272,000 jobs in 2004.
The top 50 occupations,in terms of the numberof workers, accountedfor roughly 50 percent ofall employment inMinnesota in 2004.Employment growth inthese large occupationswill generate roughly halfof the new jobs. Three ofthe largest occupations,however, are expected todecline in size—farmers,stock clerks and orderfillers, and secretaries
Table 1: Minnesota Employment Outlook by Major Occupational Group
2004 2014 2004-2014 2004-2014Estimated Projected Percent Numeric
Major Occupational Group Employment Employment Change Change
Total 2,895,658 3,265,658 12.8 370,000
Professional and Related Occupations 576,133 685,091 18.9 108,958Service Occupations 549,060 650,547 18.5 101,487Management, Business, and Financial 337,172 386,597 14.7 49,425Sales and Related Occupations 298,985 329,462 10.2 30,477Office and Administrative Support 449,733 476,423 5.9 26,690Transportation and Material Moving 182,646 200,840 10.0 18,194Construction and Extraction 139,262 156,196 12.2 16,934Installation, Maintenance, and Repair 104,791 115,125 9.9 10,334Production Occupations 237,254 244,334 3.0 7,080Farming, Fishing, and Forestry 20,622 21,043 2.0 421
Supplement to Minnesota Employment Review August 2006 3
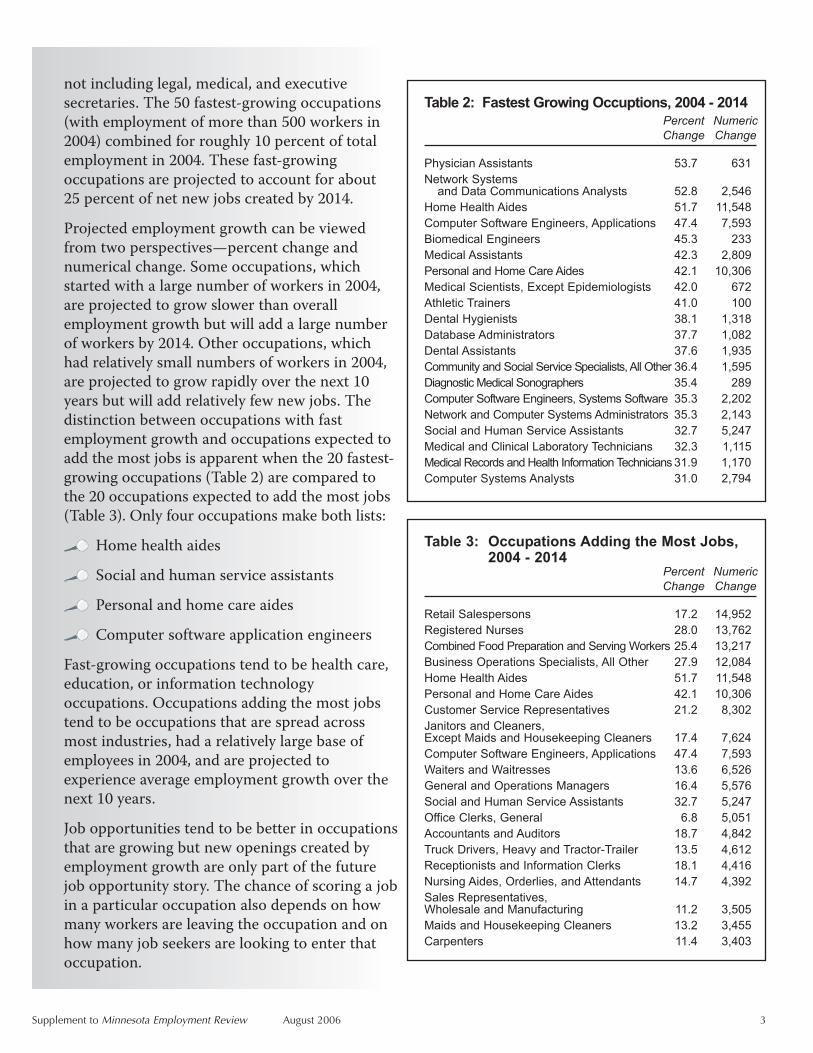
not including legal, medical, and executivesecretaries. The 50 fastest-growing occupations(with employment of more than 500 workers in2004) combined for roughly 10 percent of totalemployment in 2004. These fast-growingoccupations are projected to account for about 25 percent of net new jobs created by 2014.
Projected employment growth can be viewedfrom two perspectives—percent change andnumerical change. Some occupations, whichstarted with a large number of workers in 2004,are projected to grow slower than overallemployment growth but will add a large numberof workers by 2014. Other occupations, whichhad relatively small numbers of workers in 2004,are projected to grow rapidly over the next 10years but will add relatively few new jobs. Thedistinction between occupations with fastemployment growth and occupations expected toadd the most jobs is apparent when the 20 fastest-growing occupations (Table 2) are compared tothe 20 occupations expected to add the most jobs(Table 3). Only four occupations make both lists:
Home health aides
Social and human service assistants
Personal and home care aides
Computer software application engineers
Fast-growing occupations tend to be health care,education, or information technologyoccupations. Occupations adding the most jobstend to be occupations that are spread acrossmost industries, had a relatively large base ofemployees in 2004, and are projected toexperience average employment growth over thenext 10 years.
Job opportunities tend to be better in occupationsthat are growing but new openings created byemployment growth are only part of the futurejob opportunity story. The chance of scoring a jobin a particular occupation also depends on howmany workers are leaving the occupation and onhow many job seekers are looking to enter thatoccupation.
Table 2: Fastest Growing Occuptions, 2004 - 2014Percent NumericChange Change
Physician Assistants 53.7 631Network Systems
and Data Communications Analysts 52.8 2,546Home Health Aides 51.7 11,548Computer Software Engineers, Applications 47.4 7,593Biomedical Engineers 45.3 233Medical Assistants 42.3 2,809Personal and Home Care Aides 42.1 10,306Medical Scientists, Except Epidemiologists 42.0 672Athletic Trainers 41.0 100Dental Hygienists 38.1 1,318Database Administrators 37.7 1,082Dental Assistants 37.6 1,935Community and Social Service Specialists, All Other 36.4 1,595Diagnostic Medical Sonographers 35.4 289Computer Software Engineers, Systems Software 35.3 2,202Network and Computer Systems Administrators 35.3 2,143Social and Human Service Assistants 32.7 5,247Medical and Clinical Laboratory Technicians 32.3 1,115Medical Records and Health Information Technicians 31.9 1,170Computer Systems Analysts 31.0 2,794
Table 3: Occupations Adding the Most Jobs,2004 - 2014
Percent NumericChange Change
Retail Salespersons 17.2 14,952Registered Nurses 28.0 13,762Combined Food Preparation and Serving Workers 25.4 13,217Business Operations Specialists, All Other 27.9 12,084Home Health Aides 51.7 11,548Personal and Home Care Aides 42.1 10,306Customer Service Representatives 21.2 8,302Janitors and Cleaners, Except Maids and Housekeeping Cleaners 17.4 7,624Computer Software Engineers, Applications 47.4 7,593Waiters and Waitresses 13.6 6,526General and Operations Managers 16.4 5,576Social and Human Service Assistants 32.7 5,247Office Clerks, General 6.8 5,051Accountants and Auditors 18.7 4,842Truck Drivers, Heavy and Tractor-Trailer 13.5 4,612Receptionists and Information Clerks 18.1 4,416Nursing Aides, Orderlies, and Attendants 14.7 4,392Sales Representatives, Wholesale and Manufacturing 11.2 3,505Maids and Housekeeping Cleaners 13.2 3,455Carpenters 11.4 3,403
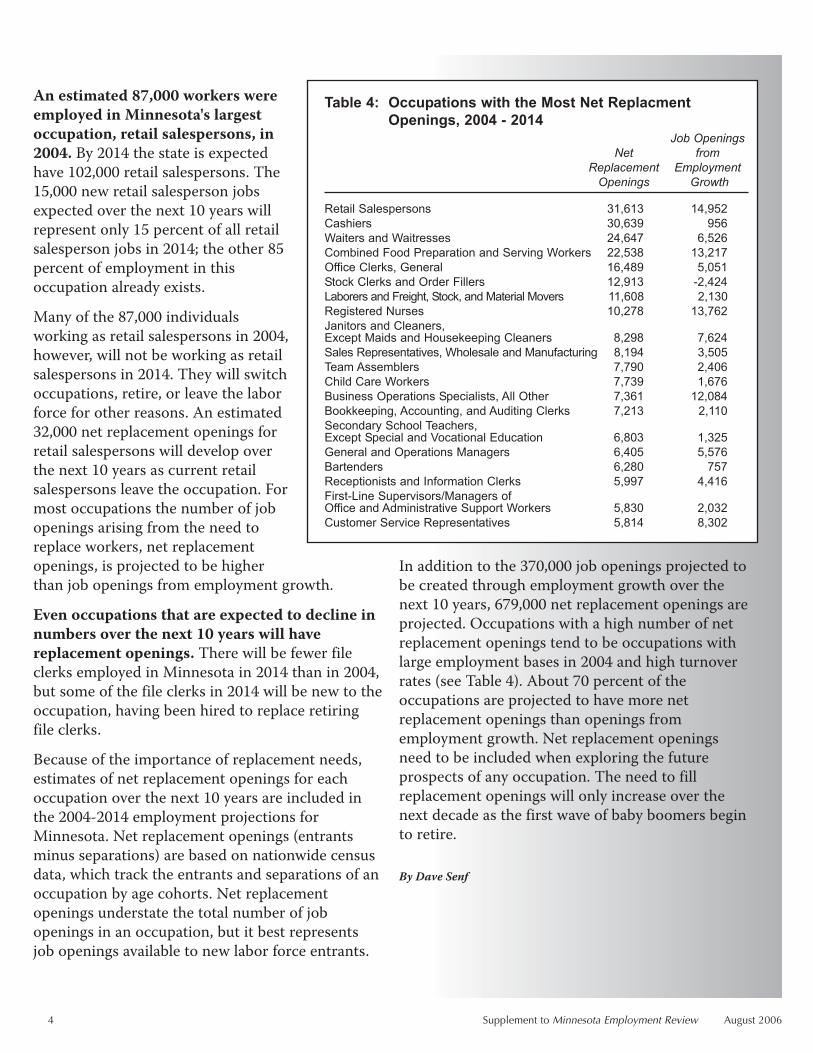
An estimated 87,000 workers wereemployed in Minnesota's largestoccupation, retail salespersons, in2004. By 2014 the state is expectedhave 102,000 retail salespersons. The15,000 new retail salesperson jobsexpected over the next 10 years willrepresent only 15 percent of all retailsalesperson jobs in 2014; the other 85percent of employment in thisoccupation already exists.
Many of the 87,000 individualsworking as retail salespersons in 2004,however, will not be working as retailsalespersons in 2014. They will switchoccupations, retire, or leave the laborforce for other reasons. An estimated32,000 net replacement openings forretail salespersons will develop overthe next 10 years as current retailsalespersons leave the occupation. Formost occupations the number of jobopenings arising from the need toreplace workers, net replacementopenings, is projected to be higherthan job openings from employment growth.
Even occupations that are expected to decline innumbers over the next 10 years will havereplacement openings. There will be fewer fileclerks employed in Minnesota in 2014 than in 2004,but some of the file clerks in 2014 will be new to theoccupation, having been hired to replace retiringfile clerks.
Because of the importance of replacement needs,estimates of net replacement openings for eachoccupation over the next 10 years are included inthe 2004-2014 employment projections forMinnesota. Net replacement openings (entrantsminus separations) are based on nationwide censusdata, which track the entrants and separations of anoccupation by age cohorts. Net replacementopenings understate the total number of jobopenings in an occupation, but it best representsjob openings available to new labor force entrants.
In addition to the 370,000 job openings projected tobe created through employment growth over thenext 10 years, 679,000 net replacement openings areprojected. Occupations with a high number of netreplacement openings tend to be occupations withlarge employment bases in 2004 and high turnoverrates (see Table 4). About 70 percent of theoccupations are projected to have more netreplacement openings than openings fromemployment growth. Net replacement openingsneed to be included when exploring the futureprospects of any occupation. The need to fillreplacement openings will only increase over thenext decade as the first wave of baby boomers beginto retire.
By Dave Senf
4 Supplement to Minnesota Employment Review August 2006
Table 4: Occupations with the Most Net ReplacmentOpenings, 2004 - 2014
Job OpeningsNet from
Replacement EmploymentOpenings Growth
Retail Salespersons 31,613 14,952Cashiers 30,639 956Waiters and Waitresses 24,647 6,526Combined Food Preparation and Serving Workers 22,538 13,217Office Clerks, General 16,489 5,051Stock Clerks and Order Fillers 12,913 -2,424Laborers and Freight, Stock, and Material Movers 11,608 2,130Registered Nurses 10,278 13,762Janitors and Cleaners, Except Maids and Housekeeping Cleaners 8,298 7,624Sales Representatives, Wholesale and Manufacturing 8,194 3,505Team Assemblers 7,790 2,406Child Care Workers 7,739 1,676Business Operations Specialists, All Other 7,361 12,084Bookkeeping, Accounting, and Auditing Clerks 7,213 2,110Secondary School Teachers, Except Special and Vocational Education 6,803 1,325General and Operations Managers 6,405 5,576Bartenders 6,280 757Receptionists and Information Clerks 5,997 4,416First-Line Supervisors/Managers of Office and Administrative Support Workers 5,830 2,032Customer Service Representatives 5,814 8,302


![Y] -rn lro 020:r54 JUL - leg.mn.gov](https://img.dokumen.tips/doc/110x75/625077c51dbca8451a56b3a3/y-rn-lro-020r54-jul-legmngov.jpg)