Embed Size (px)
Citation preview
MINE DEVELOPMENT ASSOCIATES
MINE ENGINEERING SERVICES
775-856-5700
210 South Rock Blvd.
Reno, Nevada 89502
FAX: 775-856-6053
Preliminary Economic Assessment and Updated Technical Report
on the Shafter Project, Presidio County, Texas
Prepared for
Aurcana Corporation Report Date: July 29, 2018
Effective Date of the Resource: December 11, 2015 Effective Date of the Report: July 11, 2018
Paul Tietz, CPG Neil Prenn, P.E.
Bill Tilley, P.E. Matt Bender, P.E.
Martin J. DeMarse, P.E.
Preliminary Economic Assessment and Updated Technical Report, Shafter Project, Texas, USA Aurcana Corporation Page ii
Mine Development Associates \\mda.com\users\Neil\shafter_2016_pea\2018_PEA\Shafter_2018_43-101_v13_pea.docx July 29, 2018 Print Date: 9/5/18 2:59 PM
TABLE OF CONTENTS
1.0 SUMMARY .................................................................................................................................... 1 1.1 Property Description and Ownership ................................................................................... 1 1.2 Exploration and Mining History .......................................................................................... 2 1.3 Geology and Mineralization ................................................................................................. 3 1.4 Mineral Resource Estimate .................................................................................................. 3
1.5 Metallurgical Testing ........................................................................................................... 5 1.6 Mine Design ......................................................................................................................... 6 1.7 Plant Design ......................................................................................................................... 9 1.8 Capital Cost Estimate ........................................................................................................... 9 1.9 Operating Cost Estimate .................................................................................................... 10
1.10 Cash Flow Analysis ............................................................................................................ 10
1.11 Conclusions and Recommendations .................................................................................. 14
2.0 INTRODUCTION AND TERMS OF REFERENCE ................................................................... 17 2.1 Project Scope and Terms of Reference .............................................................................. 17
2.2 Frequently Used Acronyms, Abbreviations, Definitions, and Units of Measure .............. 18
3.0 RELIANCE ON OTHER EXPERTS ............................................................................................ 20
4.0 PROPERTY DESCRIPTION AND LOCATION ......................................................................... 21 4.1 Location .............................................................................................................................. 21 4.2 Land Tenure in Texas and the Shafter Area ....................................................................... 22
4.3 Land Area ........................................................................................................................... 23
4.4 Environmental Liabilities ................................................................................................... 32 4.5 Environmental Permitting .................................................................................................. 32
5.0 ACCESSIBILITY, CLIMATE, LOCAL RESOURCES, INFRASTRUCTURE, AND PHYSIOGRAPHY ........................................................................................................................ 36 5.1 Access to Property .............................................................................................................. 36
5.2 Climate ............................................................................................................................... 36 5.3 Physiography ...................................................................................................................... 37 5.4 Local Resources and Infrastructure .................................................................................... 37
6.0 HISTORY ...................................................................................................................................... 39
6.1 Exploration and Mining History ........................................................................................ 39 Mining by Aurcana Corporation ........................................................................... 42
6.2 Historical Mineral Resource Estimates .............................................................................. 43 Gold Fields Mining Corp. ...................................................................................... 43 Rio Grande Mining Company 1995 ...................................................................... 44 Rio Grande Mining Co. and Pincock, Allen & Holt 1998 and 1999 ..................... 44 2001 Mineral Resource Estimate by Pincock, Allen & Holt for Silver Standard
Resources Inc. ........................................................................................................ 46
Preliminary Economic Assessment and Updated Technical Report, Shafter Project, Texas, USA Aurcana Corporation Page iii
Mine Development Associates \\mda.com\users\Neil\shafter_2016_pea\2018_PEA\Shafter_2018_43-101_v13_pea.docx July 29, 2018 Print Date: 9/5/18 2:59 PM
7.0 GEOLOGIC SETTING AND MINERALIZATION .................................................................... 47 7.1 Geologic Setting ................................................................................................................. 47
Regional Geology .................................................................................................. 47 Local Geology ....................................................................................................... 49
7.1.2.1 Permian Stratigraphy .......................................................................... 49 7.1.2.2 Cretaceous Stratigraphy ...................................................................... 51 7.1.2.3 Igneous Rocks ..................................................................................... 51
Property Geology ................................................................................................... 52 7.2 Mineralization .................................................................................................................... 53
Structure and Control of Mineralization ................................................................ 54 Additional Historical Prospects ............................................................................. 55
8.0 DEPOSIT TYPES ......................................................................................................................... 57
9.0 EXPLORATION ........................................................................................................................... 58
10.0 DRILLING .................................................................................................................................... 60 10.1 Summary ............................................................................................................................ 60
10.2 Drilling by Previous Operators .......................................................................................... 63 10.3 Drilling by Aurcana Corporation ....................................................................................... 63
10.4 Drill-Hole Collar Surveys .................................................................................................. 64 10.5 Down-Hole Surveys ........................................................................................................... 64 10.6 Core Recovery .................................................................................................................... 65
10.7 Summary Statement ........................................................................................................... 67
11.0 SAMPLE PREPARATION, ANALYSIS, AND SECURITY ...................................................... 68
11.1 Sampling Procedures .......................................................................................................... 68 11.2 Sample Preparation, Analysis, and Security ...................................................................... 69
Sampling by Previous Operators ........................................................................... 69 Sampling by Aurcana Corporation ........................................................................ 70
11.3 Quality Assurance and Quality Control ............................................................................. 71
Historical QA/QC Data ......................................................................................... 71 11.3.1.1 Skyline vs. Union Silver Checks ........................................................ 71
11.3.1.2 Gold Fields vs. Skyline Silver Checks................................................ 73 Aurcana/RGMC Mine Geology QA/QC Data ...................................................... 74 11.3.2.1 Standards ............................................................................................. 74
11.3.2.2 Pulp Duplicate Samples ...................................................................... 79
11.3.2.3 Coarse Blank ....................................................................................... 82 11.3.2.4 Checks at External Lab ....................................................................... 82
Exploration Geology QA/QC Data ....................................................................... 84
11.3.3.1 Standards ............................................................................................. 84 11.3.3.2 Pulp Duplicates ................................................................................... 84
11.3.3.2.1 Pulp Duplicates Fire Assay - Gravimetric ........................ 84 11.3.3.2.2 Pulp Duplicates ICPES/MS .............................................. 85
11.3.3.3 Field Duplicates .................................................................................. 86
Preliminary Economic Assessment and Updated Technical Report, Shafter Project, Texas, USA Aurcana Corporation Page iv
Mine Development Associates \\mda.com\users\Neil\shafter_2016_pea\2018_PEA\Shafter_2018_43-101_v13_pea.docx July 29, 2018 Print Date: 9/5/18 2:59 PM
11.3.3.4 Blanks ................................................................................................. 87 11.3.3.4.1 Blanks Analyzed at Pinnacle Analytical Laboratories ...... 87 11.3.3.4.2 Blanks Analyzed at American Assay Laboratories........... 87
11.4 Security .............................................................................................................................. 88
11.5 Summary ............................................................................................................................ 88
12.0 DATA VERIFICATION ............................................................................................................... 90 12.1 Database Audit ................................................................................................................... 90
Assay Table ........................................................................................................... 90 12.1.1.1 Historical Assays ................................................................................ 90
12.1.1.2 Audit of Recent RGMC Assays .......................................................... 92 Collar Locations .................................................................................................... 93
Historical Drill Data Added to Database ............................................................... 95 Verification of Historical Amax Drill Data ........................................................... 95
12.2 Data Verification Summary and Conclusions .................................................................... 96
13.0 MINERAL PROCESSING AND METALLURGICAL TESTWORK ........................................ 97
13.1 History of Operations ......................................................................................................... 97 13.2 Metallurgical Testwork ...................................................................................................... 98
Historical Testwork ............................................................................................... 98 Testwork Commissioned by Aurcana ................................................................. 100
13.3 PEA Flowsheet Development .......................................................................................... 101
14.0 MINERAL RESOURCE ESTIMATE ........................................................................................ 103 14.1 Introduction ...................................................................................................................... 103
14.2 Database ........................................................................................................................... 106 14.3 Geologic Background and Modeling ............................................................................... 106
14.4 Density ............................................................................................................................. 107 14.5 Sample Coding and Composites ...................................................................................... 108 14.6 Estimation ........................................................................................................................ 109
14.7 Mineral Resources ............................................................................................................ 110 14.8 Discussion of Resources .................................................................................................. 116
15.0 MINERAL RESERVE ESTIMATES ......................................................................................... 117
16.0 MINING METHODS .................................................................................................................. 118 16.1 Mining Method Selection ................................................................................................. 120
16.2 Mine Design ..................................................................................................................... 120 16.3 Cutoff Grade ..................................................................................................................... 122 16.4 Stope Design .................................................................................................................... 123 16.5 Dilution and Mining Extraction ....................................................................................... 124
16.6 Production Sequence ........................................................................................................ 125 16.7 Production Schedule ......................................................................................................... 125 16.8 Mine Development ........................................................................................................... 125 16.9 Safety and Emergency Egress .......................................................................................... 132 16.10 Productivity ...................................................................................................................... 132
Preliminary Economic Assessment and Updated Technical Report, Shafter Project, Texas, USA Aurcana Corporation Page v
Mine Development Associates \\mda.com\users\Neil\shafter_2016_pea\2018_PEA\Shafter_2018_43-101_v13_pea.docx July 29, 2018 Print Date: 9/5/18 2:59 PM
16.11 Manpower ........................................................................................................................ 133 16.12 Water Management .......................................................................................................... 133 16.13 Ventilation ........................................................................................................................ 134 16.14 Mobile Equipment ............................................................................................................ 134
16.15 Fixed Equipment .............................................................................................................. 135 16.16 Mine Power Supply and Distribution ............................................................................... 135
17.0 RECOVERY METHODS ........................................................................................................... 138 17.1 Process Design Criteria .................................................................................................... 140 17.2 Comminution .................................................................................................................... 141
Crushing .............................................................................................................. 141 Grinding ............................................................................................................... 141
17.3 Leach ................................................................................................................................ 142 17.4 Counter Current Decantation (CCD) ............................................................................... 142 17.5 Merrill Crowe ................................................................................................................... 142 17.6 Refinery ............................................................................................................................ 143
18.0 PROJECT INFRASTRUCTURE ................................................................................................ 144 18.1 Local Resources ............................................................................................................... 144
18.2 Roads and Earthwork ....................................................................................................... 144 18.3 Buildings .......................................................................................................................... 146 18.4 Mining Infrastructure ....................................................................................................... 148
18.5 Power ................................................................................................................................ 149 18.6 Water ................................................................................................................................ 150
18.7 Fuel ................................................................................................................................... 150
18.8 Fencing and Security ........................................................................................................ 150
18.9 Trans Pecos Pipeline ........................................................................................................ 151
19.0 MARKET STUDIES AND CONTRACTS ................................................................................ 152
20.0 ENVIRONMENTAL STUDIES, PERMITTING AND SOCIAL OR COMMUNITY IMPACT ...................................................................................................................................... 153 20.1 Introduction ...................................................................................................................... 153
20.2 Permits and Approvals ..................................................................................................... 153 20.3 Social and Community Issues .......................................................................................... 156 20.4 Reclamation and Closure ................................................................................................. 156
20.5 Financial Assurance ......................................................................................................... 156
21.0 CAPITAL AND OPERATING COSTS ..................................................................................... 160 21.1 Capital Cost Estimate ....................................................................................................... 160
Introduction ......................................................................................................... 160
Mine Capital Cost Estimate ................................................................................. 161 21.1.2.1 Mine Development ........................................................................... 163 21.1.2.2 Mine Equipment ............................................................................... 164 21.1.2.3 Mine Sustaining Capital .................................................................... 164
Preliminary Economic Assessment and Updated Technical Report, Shafter Project, Texas, USA Aurcana Corporation Page vi
Mine Development Associates \\mda.com\users\Neil\shafter_2016_pea\2018_PEA\Shafter_2018_43-101_v13_pea.docx July 29, 2018 Print Date: 9/5/18 2:59 PM
Process Plant Capital Cost Estimate .................................................................... 164 21.1.3.1 Objective and Summary .................................................................... 164 21.1.3.2 Scope ................................................................................................. 166 21.1.3.3 Currency ............................................................................................ 167
21.1.3.4 Estimating Methodology ................................................................... 168 21.1.3.5 Site Civil Work ................................................................................. 168 21.1.3.6 Concrete and Foundations ................................................................ 168 21.1.3.7 Structural Steel .................................................................................. 169 21.1.3.8 Buildings ........................................................................................... 169
21.1.3.9 Mechanical ........................................................................................ 169 21.1.3.10 Piping ................................................................................................ 171 21.1.3.11 Electrical ........................................................................................... 171
21.1.3.12 Instrumentation and Controls ............................................................ 172 21.1.3.13 Labor Rates and Productivity ........................................................... 173 21.1.3.14 Common Distributable and Contracted Indirect Costs ..................... 173
21.1.3.15 Construction Equipment ................................................................... 174 21.1.3.16 Building Permits ............................................................................... 174
21.1.3.17 Spare Parts ........................................................................................ 174 21.1.3.18 Initial Fills ......................................................................................... 174 21.1.3.19 Vendor Representatives .................................................................... 175
21.1.3.20 Third Party QA/QC and Testing ....................................................... 175 21.1.3.21 Freight ............................................................................................... 175
21.1.3.22 EP & CM Services ............................................................................ 176 21.1.3.23 Contractors Pre-Operational Testing and Start-up Support .............. 176
21.1.3.24 Owners Cost ...................................................................................... 176 21.1.3.25 Taxes ................................................................................................. 176 21.1.3.26 Contingency ...................................................................................... 176
21.1.3.27 Accuracy ........................................................................................... 177 Working Capital .................................................................................................. 177
21.2 Operating Cost Estimate .................................................................................................. 177 Mine Operating Cost Estimate ............................................................................ 177 Process Facility Operating Cost .......................................................................... 181
21.2.2.1 Exclusions and Clarifications ........................................................... 182 21.2.2.2 Currency ............................................................................................ 182 21.2.2.3 Labor ................................................................................................. 182 21.2.2.4 Consumables ..................................................................................... 185 21.2.2.5 Power and Energy ............................................................................. 186
21.2.2.6 Maintenance Supplies and Materials ................................................ 186 Hauling and Stacking Tailings ............................................................................ 187 General and Administrative Costs ....................................................................... 187
22.0 ECONOMIC ANALYSIS ........................................................................................................... 189
22.1 Project Pre-tax Cashflow .................................................................................................. 189 22.2 Pre-Tax Sensitivity ........................................................................................................... 190 22.3 After-Tax Cashflow ......................................................................................................... 193
Preliminary Economic Assessment and Updated Technical Report, Shafter Project, Texas, USA Aurcana Corporation Page vii
Mine Development Associates \\mda.com\users\Neil\shafter_2016_pea\2018_PEA\Shafter_2018_43-101_v13_pea.docx July 29, 2018 Print Date: 9/5/18 2:59 PM
23.0 ADJACENT PROPERTIES ........................................................................................................ 194
24.0 OTHER RELEVANT DATA AND INFORMATION ............................................................... 195
25.0 INTERPRETATION AND CONCLUSIONS ............................................................................ 196 25.1 Process .............................................................................................................................. 196
25.2 Risks ................................................................................................................................. 197 25.3 Opportunities .................................................................................................................... 198
26.0 RECOMMENDATIONS ............................................................................................................ 199
27.0 REFERENCES ............................................................................................................................ 201
28.0 DATE AND SIGNATURE PAGE .............................................................................................. 205
29.0 CERTIFICATE OF QUALIFIED PERSON ............................................................................... 206
TABLES Table 1.1 Shafter Reported Resources ................................................................................................... 5 Table 1.2 Mine Production Schedule ..................................................................................................... 7
Table 1.3 Mine Development Schedule ................................................................................................. 8 Table 1.4 Shafter PEA Estimated Capital Cost ...................................................................................... 9
Table 1.5 Estimated Operating Cost ..................................................................................................... 10 Table 1.6 PEA Pre-tax Cash Flow Estimate ......................................................................................... 11
Table 1.7 Pre-tax Project Sensitivity to Silver Price ............................................................................ 13 Table 1.8 Pre-tax Project Sensitivity to Operating Cost ....................................................................... 13
Table 1.9 Pre-tax Project Sensitivity to Capital Cost ........................................................................... 13 Table 1.10 After-tax Cashflow ............................................................................................................... 14 Table 1.11 After-tax Silver Price Sensitivity .......................................................................................... 14
Table 1.12 Estimated Cost of Recommended Work Program ................................................................ 16
Table 4.1 Aurcana’s Land Tenure at the Shafter Project ..................................................................... 24 Table 4.2 Permit Status ......................................................................................................................... 33 Table 5.1 Precipitation and Evaporation near Shafter .......................................................................... 36 Table 6.1 Rio Grande Mining Co. Historic Estimate of “Polygonal Silver Resources” ...................... 45 Table 6.2 1999 Historic Pincock, Allen & Holt “Resource” Estimation ............................................. 46
Table 6.3 2001 Historic Pincock, Allen & Holt Geologic Resource Estimation ................................. 46 Table 10.1 Summary of Drilling in the Shafter Project Mineral Resource Database ............................ 61
Table 11.1 Specifications and Results for Standards ............................................................................. 75 Table 11.2 Silver in Exploration Field Duplicates ................................................................................. 86 Table 12.1 Summary of Audit of Historical Assays ............................................................................... 92 Table 12.2 Summary of Audit of RGMC Assays ................................................................................... 93 Table 12.3 Coordinate Differences in SM Series Drill Holes ................................................................ 94
Table 13.1 Hazen 1982 Whole-Ore Leach Test ..................................................................................... 99 Table 13.2 KCA 1998 Whole-Ore Leach ............................................................................................. 100 Table 13.3 SGS 2013 Whole-Ore Leach .............................................................................................. 101
Preliminary Economic Assessment and Updated Technical Report, Shafter Project, Texas, USA Aurcana Corporation Page viii
Mine Development Associates \\mda.com\users\Neil\shafter_2016_pea\2018_PEA\Shafter_2018_43-101_v13_pea.docx July 29, 2018 Print Date: 9/5/18 2:59 PM
Table 13.4 Whole-Ore Leach vs Grind Size ......................................................................................... 101 Table 14.1 Shafter Tonnage Factors by Rock Type ............................................................................. 108 Table 14.2 Shafter Silver Mineral Domain Descriptive Statistics - Assays ......................................... 108 Table 14.3 Shafter Silver Mineral Domain Descriptive Statistics – Composites ................................. 109
Table 14.4 Shafter Estimation Parameters ........................................................................................... 110 Table 14.5 Shafter Search Ellipse Orientations .................................................................................... 110 Table 14.6 Criteria for Shafter Resource Classification ....................................................................... 110 Table 14.7 Shafter Reported Resources ............................................................................................... 111 Table 14.8 Shafter Mineral Resource ................................................................................................... 112
Table 14.9 Inferred Resources .............................................................................................................. 113 Table 16.1 Material in Planned Stopes ................................................................................................. 123 Table 16.2 Material in Mine Plan Summary ........................................................................................ 124
Table 16.3 Mine Production Schedule ................................................................................................. 125 Table 16.4 Mine Development and Rehabilitation Schedule ............................................................... 130 Table 16.5 Mine Development and Production Schedule .................................................................... 131
Table 16.6 Staffing Schedule ................................................................................................................ 133 Table 16.7 Mobile Equipment .............................................................................................................. 135
Table 16.8 Fixed Equipment ................................................................................................................ 135 Table 16.9 Preproduction Power Consumption .................................................................................... 136 Table 16.10 Year 1 and 2 Power Consumption ...................................................................................... 136
Table 16.11 Year 3 Power Consumption ................................................................................................ 137 Table 16.12 Year 4 Power Consumption ................................................................................................ 137
Table 17.1 Process Design Criteria ...................................................................................................... 140 Table 19.1 Standard and Poors Global Market Intelligence Consensus Silver Price for 2020 ............ 152
Table 20.1 Permit Status ....................................................................................................................... 157 Table 21.1 Shafter PEA Capital Cost Estimate ($000’s) ...................................................................... 160 Table 21.2 Shafter PEA Mine Capital Cost Estimate ........................................................................... 162
Table 21.3 Mine Preproduction Development Labor Rates ................................................................. 163 Table 21.4 Underground Mine Equipment ........................................................................................... 164
Table 21.5 Mine Sustaining Capital ..................................................................................................... 164 Table 21.6 Estimated Processing Facility Capital Costs ($000’s) ........................................................ 166 Table 21.7 Bank Owned Process Equipment ....................................................................................... 170
Table 21.8 Initial Fills .......................................................................................................................... 175 Table 21.9 Estimated Project Operating Cost ...................................................................................... 177 Table 21.10 Estimated Mine Operating Cost ......................................................................................... 178 Table 21.11 Mine Operating Labor Cost ................................................................................................ 181 Table 21.12 Process Facility Operating Cost Estimate .......................................................................... 182
Table 21.13 Process Facility Labor Cost Estimate ................................................................................. 184 Table 21.14 Grinding Media Cost Estimate ........................................................................................... 185 Table 21.15 Plant Reagent Cost ............................................................................................................. 186 Table 21.16 Shafter Project Annual Power Cost Estimate ..................................................................... 186
Table 21.17 General and Administrative Labor ..................................................................................... 187 Table 21.18 G & A General Expense and Summary .............................................................................. 188 Table 22.1 PEA Pre-Tax Cashflow ...................................................................................................... 190 Table 22.2 Silver Price Pre-Tax Sensitivity ......................................................................................... 191 Table 22.3 Operating Cost Pre-Tax Sensitivity .................................................................................... 191
Preliminary Economic Assessment and Updated Technical Report, Shafter Project, Texas, USA Aurcana Corporation Page ix
Mine Development Associates \\mda.com\users\Neil\shafter_2016_pea\2018_PEA\Shafter_2018_43-101_v13_pea.docx July 29, 2018 Print Date: 9/5/18 2:59 PM
Table 22.4 Capital Cost Pre-Tax Sensitivity ........................................................................................ 191 Table 22.5 After Tax Cashflow ............................................................................................................ 193 Table 22.6 Silver Price Sensitivity ....................................................................................................... 193 Table 26.1 Estimated Cost of Recommended Work Program .............................................................. 200
FIGURES Figure 1.1 Material Planned to be Mined ............................................................................................... 8 Figure 1.2 NPV(5 percent) Sensitivity ................................................................................................. 12 Figure 1.3 IRR Sensitivity .................................................................................................................... 12 Figure 4.1 Location of the Shafter Project ........................................................................................... 21
Figure 4.2 Aurcana’s Property Position at the Shafter Project ............................................................. 29 Figure 4.3 Detail of Part of Section 327 of Shafter Property Map ....................................................... 30
Figure 4.4 Detail of Part of Section 328 of Shafter Property Map ....................................................... 31 Figure 5.1 Infrastructure at the Shafter Project Site ............................................................................. 38
Figure 6.1 RGMC Block Locations for the Shafter Deposit ................................................................ 45 Figure 7.1 Regional Geologic Map of the Shafter Project ................................................................... 48
Figure 7.2 Geology of the Shafter Property ......................................................................................... 50 Figure 10.1 Location of Drill Holes Utilized in the Shafter Resource Estimate .................................... 62 Figure 10.2 Core Recovery versus Silver Grade – All Sample Intervals ............................................... 66
Figure 10.3 Core Recovery versus Silver Grade – Sample >1.0oz Ag/ton ............................................ 66 Figure 11.1 Skyline Silver Checks vs. Original ..................................................................................... 72
Figure 11.2 Silver Relative Percent Difference - Skyline Check vs. Original ....................................... 72 Figure 11.3 Gold Fields Silver Checks vs. Original ............................................................................... 73
Figure 11.4 Silver Relative Percent Difference - Gold Fields Check vs. Original ................................ 74 Figure 11.5 Control Chart, Silver in Standard MEG-Au.09.03.............................................................. 76
Figure 11.6 Control Chart, Silver in Standard MEG-Shafter-A ............................................................. 77 Figure 11.7 Control Chart, Silver in Standard MEG-Ag-2 ................................................................... 78 Figure 11.8 Silver in Control 1 ............................................................................................................... 78
Figure 11.9 Silver in Control 2 ............................................................................................................... 79
Figure 11.10 RGMC Silver Pulp Duplicate Scatterplot ........................................................................... 80 Figure 11.11 RGMC Pulp Duplicates - Relative Percent Difference ....................................................... 81
Figure 11.12 Silver Grades in Coarse Blank ............................................................................................ 82 Figure 11.13 Silver in Pinnacle Check vs. Shafter Original .................................................................... 83 Figure 11.14 Silver Relative Percent Difference - Pinnacle Check vs. Shafter Original ......................... 83
Figure 11.15 Control Chart, Silver in Standard CDN-ME-8.................................................................... 84 Figure 11.16 Exploration Silver Pulp Duplicates, FA-Gravimetric ......................................................... 85
Figure 11.17 Exploration Silver Pulp Duplicates, ICPES/MS ................................................................. 86 Figure 11.18 Silver in Exploration Blanks vs. Preceding Sample ........................................................... 88 Figure 14.1 Shafter Block Model with Silver Grades– Cross-Section 6100 ........................................ 114 Figure 14.2 Shafter Block Model with Silver Grades– Cross-Section 10500 ...................................... 115 Figure 16.1 Presidio and Shafter Underground Areas.......................................................................... 119
Figure 16.2 Resource Blocks Considered for Mine Design and Schedule .......................................... 119 Figure 16.3 Room and Pillar Mining with Benching in Thicker Areas ............................................... 120 Figure 16.4 Typical Primary Extraction Stope Layout for the Resource Areas ................................... 121
Preliminary Economic Assessment and Updated Technical Report, Shafter Project, Texas, USA Aurcana Corporation Page x
Mine Development Associates \\mda.com\users\Neil\shafter_2016_pea\2018_PEA\Shafter_2018_43-101_v13_pea.docx July 29, 2018 Print Date: 9/5/18 2:59 PM
Figure 16.5 Material Above Cutoff Grade by Zone ............................................................................. 122 Figure 16.6 Typical Stopes – Presidio Zone ........................................................................................ 124 Figure 16.7 Year -1 (Preproduction) Mine Development and Rehabilitation ...................................... 126 Figure 16.8 Year 1 Mine Development and Rehabilitation ................................................................. 127
Figure 16.9 Year 2 Mine Development and Rehabilitation ................................................................. 128 Figure 16.10 Year 3 Mine Development and Rehabilitation ................................................................. 129 Figure 16.11 One-way Haulage Distances ............................................................................................. 131 Figure 17.1 Shafter PEA Flowsheet ..................................................................................................... 139 Figure 18.1 Highway US 67 Near the Shafter Project ......................................................................... 145
Figure 18.2 Shafter Project General Arrangement Map ....................................................................... 146 Figure 18.3 Infrastructure Detail near the Process Plant ...................................................................... 147 Figure 18.4 Gold Fields Headframe and Shaft Area ............................................................................ 148
Figure 18.5 Aurcana Portal (north of the processing facility) .............................................................. 148 Figure 18.6 Number 3 Shaft Headframe and Hoist .............................................................................. 149 Figure 18.7 Shafter Substation ............................................................................................................. 150
Figure 21.1 Shafter Processing Facility ............................................................................................... 165 Figure 22.1 NPV (5 percent) Sensitivity .............................................................................................. 192
Figure 22.2 IRR Sensitivity .................................................................................................................. 192 Cover photo: Shafter Mineral Processing Plant.
MINE DEVELOPMENT ASSOCIATES
MINE ENGINEERING SERVICES
775-856-5700
210 South Rock Blvd.
Reno, Nevada 89502
FAX: 775-856-6053
1.0 SUMMARY Mine Development Associates (“MDA”) has prepared this technical report on the Shafter silver project, located in Presidio County, Texas, at the request of Aurcana Corporation (“Aurcana”). Aurcana owns 100 percent of the Shafter project through its wholly owned subsidiary, Rio Grande Mining Company (“RGMC”). The purpose of this report is to provide a technical summary of a Preliminary Economic Assessment (PEA) completed on the Shafter project. The current report and associated resource estimate have been prepared in accordance with the disclosure and reporting requirements set forth in the Canadian Securities Administrators’ National Instrument 43-101 (“NI 43-101”), Companion Policy 43-101CP, and Form 43-101F1, as well as with the Canadian Institute of Mining, Metallurgy and Petroleum’s “CIM Definition Standards - For Mineral Resources and Reserves, Definitions and Guidelines” (“CIM Standards”) adopted by the CIM Council on May 10, 2014. The Shafter project is focused on the Shafter silver deposit, which consists of replacement bodies, termed mantos, in a gently dipping to horizontal sequence of carbonate sedimentary rocks. The Shafter deposit was exploited by historic underground mining activity from 1881 through 1942, with further exploration and development work being conducted up through 1999. Aurcana commenced recent development in 2011 with underground and limited open-pit production starting in 2012 and ceasing in December 2013. The project has been on care and maintenance since December 2013. The effective date of this report is July11, 2018. The purpose of this report is to provide a technical summary of the Shafter project in support of an updated Preliminary Economic Assessment prepared by MDA. The purpose of the update is to incorporate updated costs and new mining plan into the PEA. The updated mine plan (Section 16) and estimated mine capital and mine operating cost estimate (Section 21.1.2 and 21.2.1) and portions of section 18 and 25 was prepared by Bill Tilley of Cementation USA Inc (Cementation). Matt Bender with Samuel Engineering (Samuel) prepared sections 13, 17, 18 and portions of Section 21 dealing with processing. Sections 4.4, 4.5 and 20 was prepared by Martin J. DeMarse with the Gault Group LLC. 1.1 Property Description and Ownership The Shafter project is located in south-central Presidio County in southwestern Texas. The sparsely inhabited town of Shafter is situated at the eastern end of the property, 40 miles south of Marfa and 18 miles north of the border town of Presidio, Texas. The Shafter project area consists of rugged high-desert terrain on the southern side of the Chinati Mountains, on the slopes above the Rio Grande Valley.
Preliminary Economic Assessment and Updated Technical Report, Shafter Project, Texas, USA Aurcana Corporation Page 2
Mine Development Associates \\mda.com\users\Neil\shafter_2016_pea\2018_PEA\Shafter_2018_43-101_v13_pea.docx July 29, 2018 Print Date: 9/5/18 2:59 PM
The Shafter property consists of a total of approximately 3,960 acres owned or controlled by RGMC. Surface and/or mineral rights may be deeded to or leased by RGMC. RGMC leases mineral rights from the State of Texas on 37 acres, with the remaining portions of Aurcana’s Shafter property being privately held. There are royalties of up to 6.25 percent for some of the parcels that comprise the Shafter property, including some, but not all, of the parcels that overlie the mineral resource described in this report. Most of the mineralization is on lands where the royalty is 2 percent or less, and most of the resource is not subject to a royalty. 1.2 Exploration and Mining History The mineralized areas in the Shafter district were first discovered in 1880 or 1881, and the Presidio Mining Company was formed in 1881. Silver was produced from the Presidio mine from 1883 to 1926, when the American Metal Co. acquired the Shafter property and continued production (American Metal Co. subsequently merged with Climax Molybdenum Company to form American Metal Climax, Inc. (“Amax”). From 1883 to 1942, when the Presidio mine was closed, total recorded production was 2.307 million tons of ore containing 35.153 million ounces of silver at an average grade of 15.24oz Ag/ton. Amax, Gold Fields Mining Corporation (“Gold Fields”), and Rio Grande Mining Company (“RGMC”) successively held the Shafter property and conducted extensive exploration programs from 1926 to 1999. Gold Fields identified the northeastern, down-dip extension of the Shafter deposit, extending more than 5,000ft from the deepest development workings in the Presidio mine, through a systematic surface-drilling program. During the 1970s, Gold Fields constructed a 1,052ft deep shaft to access and explore the northeastern extension. Aurcana purchased RGMC and the Shafter property in July 2008. RGMC is now a wholly owned subsidiary of Aurcana. Aurcana began exploration at Shafter in 2011 and has conducted geophysical surveying, drilling, mapping, and geochemical sampling since that time. Aurcana drilled 65 surface and 101 underground holes from 2011 through October 2013. A total of 1,694 drill holes are included in the resource database for the Shafter project, of which 1,048 were drilled by Amax, 403 were drilled by Gold Fields, 88 were drilled by RGMC prior to their acquisition by Aurcana, and 155 holes were drilled by RGMC since their acquisition by Aurcana. These holes include 435 surface core holes, 1,171 underground core holes, and 88 reverse circulation holes. An additional eleven underground core holes were drilled by Aurcana in late 2013 after the database was finalized for use in the resource estimate but before the resource estimate was completed. These holes are included in the 101 Aurcana underground holes as stated in the preceding paragraph. Aurcana drilled five exploration holes in 2017 outside of the current resource area. These holes do not impact the current resource estimate are not included within the current drill database. Aurcana reopened access into the Presidio mine on June 1, 2012, and production commenced on December 14, 2012. In conjunction with its underground operations, Aurcana began open-pit mining of lower-grade mineralization from the Mina Grande pit at the Presidio mine on April 23, 2012. This open-pit mining was discontinued after the plant commissioning and testing phase were complete. Due in part to lower silver prices, the mine was put on care and maintenance in December 2013. Aurcana reported
Preliminary Economic Assessment and Updated Technical Report, Shafter Project, Texas, USA Aurcana Corporation Page 3
Mine Development Associates \\mda.com\users\Neil\shafter_2016_pea\2018_PEA\Shafter_2018_43-101_v13_pea.docx July 29, 2018 Print Date: 9/5/18 2:59 PM
that from October 2012 through December 2013, mine production totaled 149,882 tons, and mill feed from the mine totaled 109,599 tons. A total of 134,557 ounces of doré was poured. 1.3 Geology and Mineralization In this part of southwestern Texas, a thick sequence of Jurassic-Cretaceous sedimentary basin rocks overlies older Paleozoic basement. The sedimentary basin sequence contains carbonate units that extend over 1,000 miles from southeastern Arizona and southern New Mexico, through northern Mexico and southwestern Texas, and were thrust faulted and folded during the Laramide orogeny. Silver-lead-zinc deposits, of which the Shafter deposit is an example, occur in Permian limestone, as well as these basinal, carbonate units. Deposits such as Shafter are referred to as “high-temperature, carbonate-hosted deposits” because of their irregular but sharp contacts with their enclosing carbonate host rocks. The Shafter mining district is located on the south flank of the Chinati Mountains, adjacent to a Tertiary-age volcanic caldera. Outcrops in the district are predominantly Permian and Cretaceous limestone, dolomite, siltstone, and sandstone, which were tilted by uplift during the Laramide orogeny in late Cretaceous to early Tertiary time and were later cut by Tertiary intrusions. The mineral deposits in the Shafter district occur mainly as silica-replacement bodies along bedding planes in the upper units of Permian limestone, usually just below the unconformity at the base of the Cretaceous rocks. The deposits, referred to as manto deposits, are generally parallel to the bedding which dips gently to the southeast. Manto thickness is generally 8-15 feet though can be highly irregular with increased thickness along localized near-vertical structures which appear to have served as fluid pathways. Veins containing the same minerals as the mantos are common in the western part of the Shafter district. Many of these veins are fissure fillings and have brecciated zones. At the Shafter silver deposit, the massive limestone at the top of the Permian Cibolo Formation was the most favorable to replacement by mineralizing solutions; in the vicinity of the Presidio mine, this unit is called the Mina Grande Formation. The erosional surface of the Mina Grande Formation developed karst topography, which provided large open spaces that served as channels for mineralizing solutions. Silver and base metals were deposited where conditions were favorable. The entire Shafter deposit is up to 1,500ft wide in a north-south direction and extends at least 2.5 miles on a northeast trend. Silver is present predominately as oxidized acanthite in fine-grained aggregates of quartz, calcite, and goethite, with lesser dolomite, hemimorphite, willemite, anglesite, galena, smithsonite, and sphalerite. Mineralogical studies on tailings suggest that non-recoverable silver occurs as fine grained, encapsulated native silver and as argento-jarosite. 1.4 Mineral Resource Estimate The Shafter resources reported here are based on Aurcana’s database as of October 15, 2013. The effective date of the mineral resource estimate is December 11, 2015. Upon completion of the database validation process, MDA constructed 150 cross sections spaced 50ft to 100ft apart and looking northeast at 70°. One set of sections was made for geology, which included lithology, faults, silica alteration, and clay/rubble areas just below the unconformity, and then another for
Preliminary Economic Assessment and Updated Technical Report, Shafter Project, Texas, USA Aurcana Corporation Page 4
Mine Development Associates \\mda.com\users\Neil\shafter_2016_pea\2018_PEA\Shafter_2018_43-101_v13_pea.docx July 29, 2018 Print Date: 9/5/18 2:59 PM
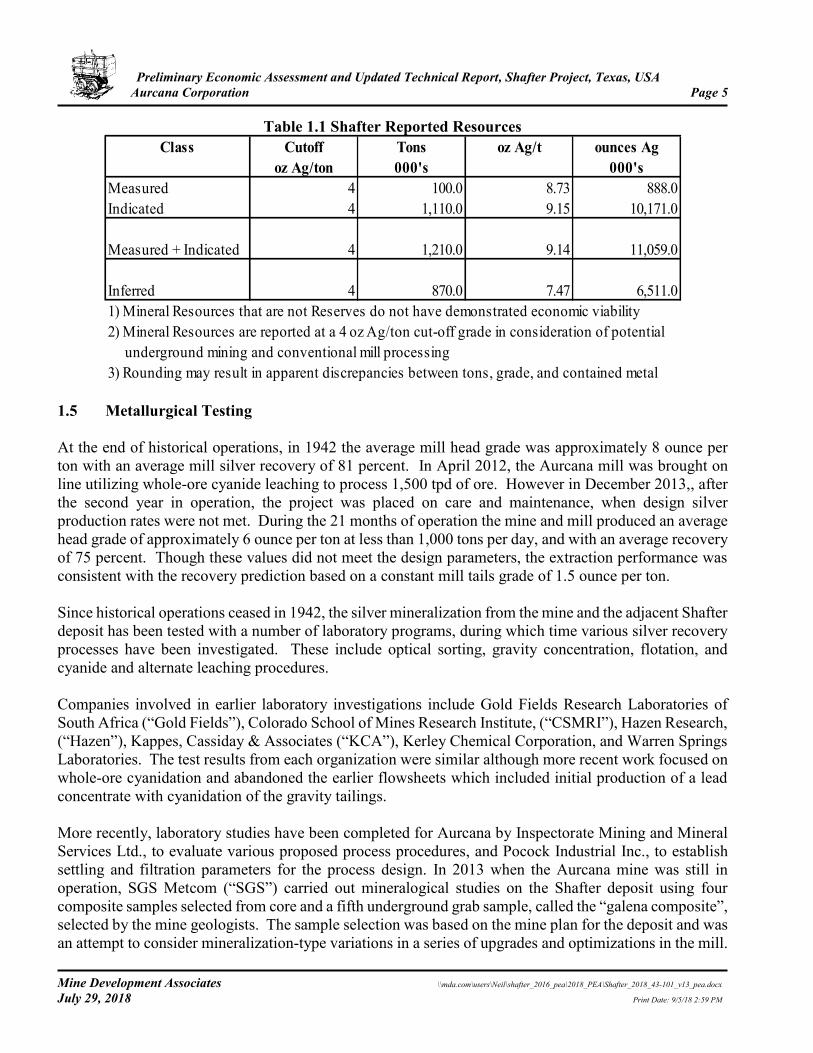
silver mineralization. High- and low-grade silver mineral domains were modeled, and each represents a distinct style of mineralization. The high-grade domain (>5.0oz Ag/ton) is associated with strongly silicified, fractured and brecciated limestone, generally with one to two percent lead and zinc mineralization, while the low-grade domain is associated with weakly fractured and silicified limestone, characterized by silver grades between 0.8oz Ag/ton and 5.0oz Ag/ton. The low-grade domain occurs outboard of the strongly silicified high-grade domain which occurs primarily as a sub-horizontal manto directly below the Cretaceous/Permian unconformity. The silver domains on cross sections were then used to code the drill samples. Quantile plots were made to assess validity of these domains and to determine capping levels. MDA capped 12 silver assays: two in the low-grade domain and 10 in the high-grade domain. Compositing was done to 4ft down-hole lengths (the model block size), honoring all mineral-domain boundaries. The cross-sectional geology and silver domains were rectified three-dimensionally to long-sections on 10ft intervals that coincide with the mid-width of the model blocks. The long sections of the clay/rubble zones and silver were used to code the block model to percent of block by clay/rubble alteration and silver domain. The clay/rubble zones were specifically modeled on long section due to their general inverse relationship with silver mineralization. Tonnage factors used for the resource estimate ranged from 12 to 14 cubic feet/ton. The factor of 12.7 cubic feet/ton was used for the low-grade silver domain, and 13.1cubic feet/ton was used for the high-grade silver domain. The underground workings were imported into the block model as a 3D solid, and resource blocks were coded by volume percentage within the underground solid. Those blocks coded at 5 percent or greater of underground workings were considered “mined out” and removed from the classified mineral resource. The reported resource estimate was made using inverse distance to the third power to estimate the grade of each block. Ordinary-kriging and nearest-neighbor estimates were also made for comparison and validation. MDA classified the Shafter silver resources by a combination of distance to the nearest sample, and the number of samples, while at the same time taking into account reliability of underlying data and understanding and use of the geology. The Shafter reported resources are tabulated in Table 1.1. The stated resources are fully diluted to 10ft by 10ft by 4ft blocks and are tabulated considering a silver cut-off grade of 4.0 oz Ag/ton. About 42 percent of the total resource at the 4 oz Ag/ton cut-off is in the inferred category.
Preliminary Economic Assessment and Updated Technical Report, Shafter Project, Texas, USA Aurcana Corporation Page 5
Mine Development Associates \\mda.com\users\Neil\shafter_2016_pea\2018_PEA\Shafter_2018_43-101_v13_pea.docx July 29, 2018 Print Date: 9/5/18 2:59 PM
Table 1.1 Shafter Reported Resources Class Cutoff Tons oz Ag/t ounces Ag
oz Ag/ton 000's 000'sMeasured 4 100.0 8.73 888.0Indicated 4 1,110.0 9.15 10,171.0
Measured + Indicated 4 1,210.0 9.14 11,059.0
Inferred 4 870.0 7.47 6,511.01) Mineral Resources that are not Reserves do not have demonstrated economic viability 2) Mineral Resources are reported at a 4 oz Ag/ton cut-off grade in consideration of potential underground mining and conventional mill processing3) Rounding may result in apparent discrepancies between tons, grade, and contained metal
1.5 Metallurgical Testing At the end of historical operations, in 1942 the average mill head grade was approximately 8 ounce per ton with an average mill silver recovery of 81 percent. In April 2012, the Aurcana mill was brought on line utilizing whole-ore cyanide leaching to process 1,500 tpd of ore. However in December 2013,, after the second year in operation, the project was placed on care and maintenance, when design silver production rates were not met. During the 21 months of operation the mine and mill produced an average head grade of approximately 6 ounce per ton at less than 1,000 tons per day, and with an average recovery of 75 percent. Though these values did not meet the design parameters, the extraction performance was consistent with the recovery prediction based on a constant mill tails grade of 1.5 ounce per ton. Since historical operations ceased in 1942, the silver mineralization from the mine and the adjacent Shafter deposit has been tested with a number of laboratory programs, during which time various silver recovery processes have been investigated. These include optical sorting, gravity concentration, flotation, and cyanide and alternate leaching procedures. Companies involved in earlier laboratory investigations include Gold Fields Research Laboratories of South Africa (“Gold Fields”), Colorado School of Mines Research Institute, (“CSMRI”), Hazen Research, (“Hazen”), Kappes, Cassiday & Associates (“KCA”), Kerley Chemical Corporation, and Warren Springs Laboratories. The test results from each organization were similar although more recent work focused on whole-ore cyanidation and abandoned the earlier flowsheets which included initial production of a lead concentrate with cyanidation of the gravity tailings. More recently, laboratory studies have been completed for Aurcana by Inspectorate Mining and Mineral Services Ltd., to evaluate various proposed process procedures, and Pocock Industrial Inc., to establish settling and filtration parameters for the process design. In 2013 when the Aurcana mine was still in operation, SGS Metcom (“SGS”) carried out mineralogical studies on the Shafter deposit using four composite samples selected from core and a fifth underground grab sample, called the “galena composite”, selected by the mine geologists. The sample selection was based on the mine plan for the deposit and was an attempt to consider mineralization-type variations in a series of upgrades and optimizations in the mill.
Preliminary Economic Assessment and Updated Technical Report, Shafter Project, Texas, USA Aurcana Corporation Page 6
Mine Development Associates \\mda.com\users\Neil\shafter_2016_pea\2018_PEA\Shafter_2018_43-101_v13_pea.docx July 29, 2018 Print Date: 9/5/18 2:59 PM
Given the current mine plan and the consistency of the leach residue grade from both early and most recent operations, as well as previous and recent labwork, the following general design criteria was used in this economic evaluation. Plant Throughput: 600 short tons per day Mine Plan Average Silver Head Grad: 10.3 troy ounces per ton Target Grind: P80 = 74 micron Leach Residency: 72 hours Leach Extraction: 85.7 percent Overall Recovery 85.4 percent (99.6 of Leach Extraction) NaCN Consumption: 1.58 lb/ton Lime Consumption: 5.0 lb/ton
Note that the PEA silver recovery based on the head grade and a constant 1.5 ounce mill tail.
Recovery predictions are dependent on the head grade due to a relatively constant mill tails grade. The consistency of the mill tails grade is due to occluded silver and silver mineral, locked in quartz or jarosite minerals at or below 10 micron range. This renders it inaccessible to cyanide leach without extensive and expensive grinding. Practically all the non-encapsulated Ag appears to be recoverable, making the recovery prediction highly dependent on the mill feed head grade: (Recovery = (Head grade-Tails grade)/Head grade). 1.6 Mine Design
Mining is planned by room and pillar methods for primary extraction and longhole slashing with partial pillar recovery for secondary extraction. The mine design is based on a 6.8 ounce silver per ton cutoff grade. Stope shapes include two types ofinternal dilution. First, a portion of the 10 ft x 10 ft x 8 ft mining block may be waste, but the entire block grade is above cutoff grade. Second, a block may be below the cutoff grade, but is required to be mined to mine the stope. Internal dilution can likely be reduced by detailed mine planning of the shapes mined based on more closely spaced drilling results.
External dilution is estimated to be 10% with and average grade of 5.1 ounce silver per ton.. Primary and secondary extraction account for 78 percent and 11 percent of the resource, respectively, providing an overall extraction of 89 percent. Extraction losses account for the remaining 11%. The extraction rate was developed using planned stopes with widths of 28 feet, with 24 feet by 24 feet pillars.
Vulcan mining software was used to outline and design the areas to be mined. A minimum mining height of 8 feet was used to define minable areas. The grade model used blocks that were 10 ft x 10 ft x 4 ft high. The outlines were done in plan views at 8 feet mid-block elevation intervals of the block-diluted resource model. The minimum mining height of 8 feet was used to allow mechanized mining. The outlines include all internal dilution (i.e. material below cutoff).
Production is planned to commence in the Presidio mine area that can be accessed by a decline that was established between 2011 and 2013. Mining will generally proceed from Presidio toward the Shafter area. The production schedule is presented in Table 1.2. The mine production rate is planned at 600 tons per day or 210,000 tons annually.
Preliminary Economic Assessment and Updated Technical Report, Shafter Project, Texas, USA Aurcana Corporation Page 7
Mine Development Associates \\mda.com\users\Neil\shafter_2016_pea\2018_PEA\Shafter_2018_43-101_v13_pea.docx July 29, 2018 Print Date: 9/5/18 2:59 PM
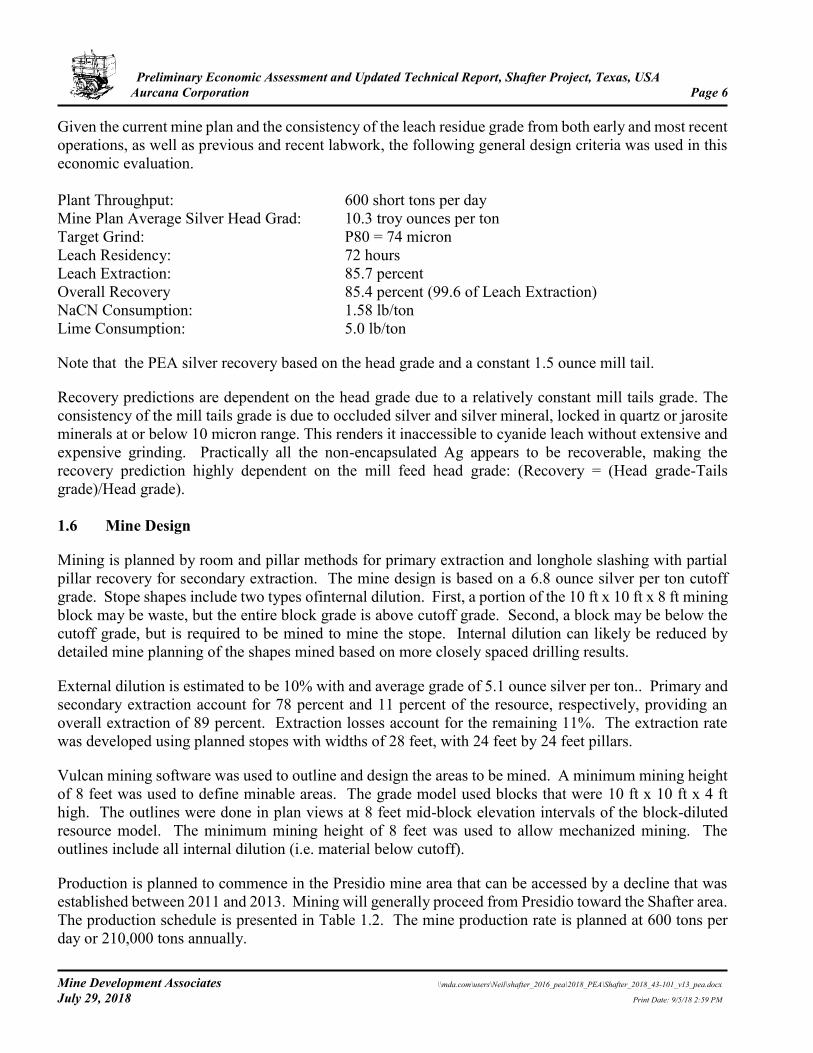
Table 1.2 Mine Production Schedule
Item Preproduction Year 1 Year 2 Year 3 Year 4 Totals
Stope Material above Cutoff GradeTons (000's) 190.9 190.9 190.9 107.9 680.6oz Ag/ton 11.32 10.74 10.14 11.02 10.78Oz Ag (000's) 2,160.6 2,049.6 1,936.4 1,188.5 7,335.1
External DilutionTons (000's) 19.1 19.1 19.1 10.8 68.1oz Ag/ton 5.10 5.10 5.10 5.10 5.10Oz Ag (000's) 97.4 97.4 97.4 55.0 347.1
Total Production MiningTons (000's) 210.0 210.0 210.0 118.7 748.7oz Ag/ton 10.75 10.22 9.68 10.48 10.26Oz Ag (000's) 2,257.9 2,147.0 2,033.7 1,243.6 7,682.2
DevelopmentLateral Tons (000's) 19.1 55.2 57.1 64.9 0.0 196.4
Vertical Tons (000's) 0.0 1.7 0.0 0.0 0.0 1.7
Rehabilitation Tons (000's) 26.0 17.5 16.7 15.5 0.0 75.7
Total Development Tons (000's) 45.1 74.5 73.8 80.4 0.0 273.8
Production + DevelopmentTotal Tons (000's) 45.1 284.5 283.8 290.4 118.7 1,022.4
Total Work Days 245 350 350 350 198 1493
Tons per day 184 813 811 830 599 685 Mine rehabilitation and development during Preproduction focuses on getting access to the bottom of the new vent/escape raise (#4 Shaft) as well as establishing access to key resource blocks along the way. The main decline is enlarged to be 14 ft by 14 ft to allow use of 30 ton trucks. Rehabilitation and development during subsequent years focuses on connecting up with the old Shafter workings and accessing targeted resource blocks as needed for production. The mine development schedule is summarized in Table 1.3.
Preliminary Economic Assessment and Updated Technical Report, Shafter Project, Texas, USA Aurcana Corporation Page 8
Mine Development Associates \\mda.com\users\Neil\shafter_2016_pea\2018_PEA\Shafter_2018_43-101_v13_pea.docx July 29, 2018 Print Date: 9/5/18 2:59 PM
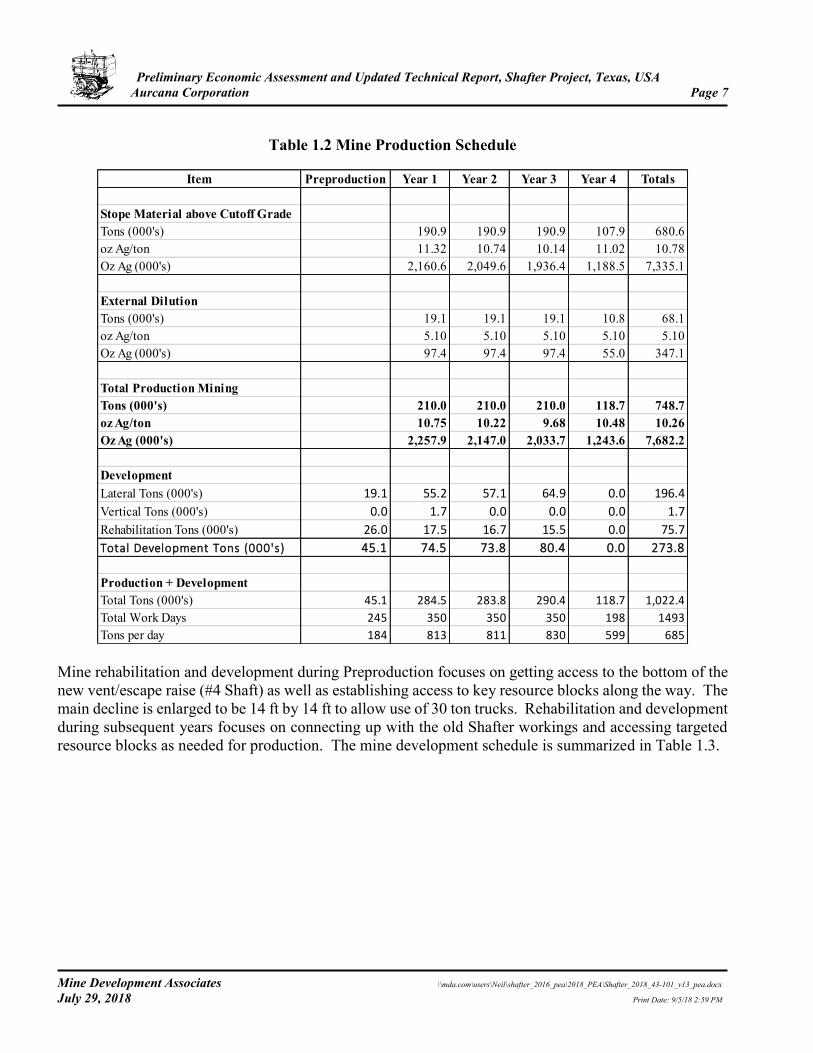
Table 1.3 Mine Development Schedule
Item Preproduction Year 1 Year 2 Year 3 Year 4 TotalsLateral and Decline DevelopmentDecline (ft) 361 2,000 1,925 1,069 5,355Stope Access (ft) 688 1,038 1,217 2,500 5,443Subtotals Lateral and Decline (ft) 1,049 3,038 3,142 3,569 10,798Vertical DevelopmentPresidio Vent Raise (ft) 0 720 0 0 720Subtotals Vertical (ft) 0 720 0 0 720RehabilitationDecline (ft) 6,482 0 0 0 6,482Primary Stope (ft) 3,001 3,001 2,582 2,732 11,316Secondary Stope (ft) 0 2,885 2,101 1,201 6,187Main Access (ft) 0 434 797 1,141 2,372Shaft Area (ft) 0 0 545 545 1,089Subtotals Rehabilitation (ft) 9,483 6,320 6,024 5,619 27,445
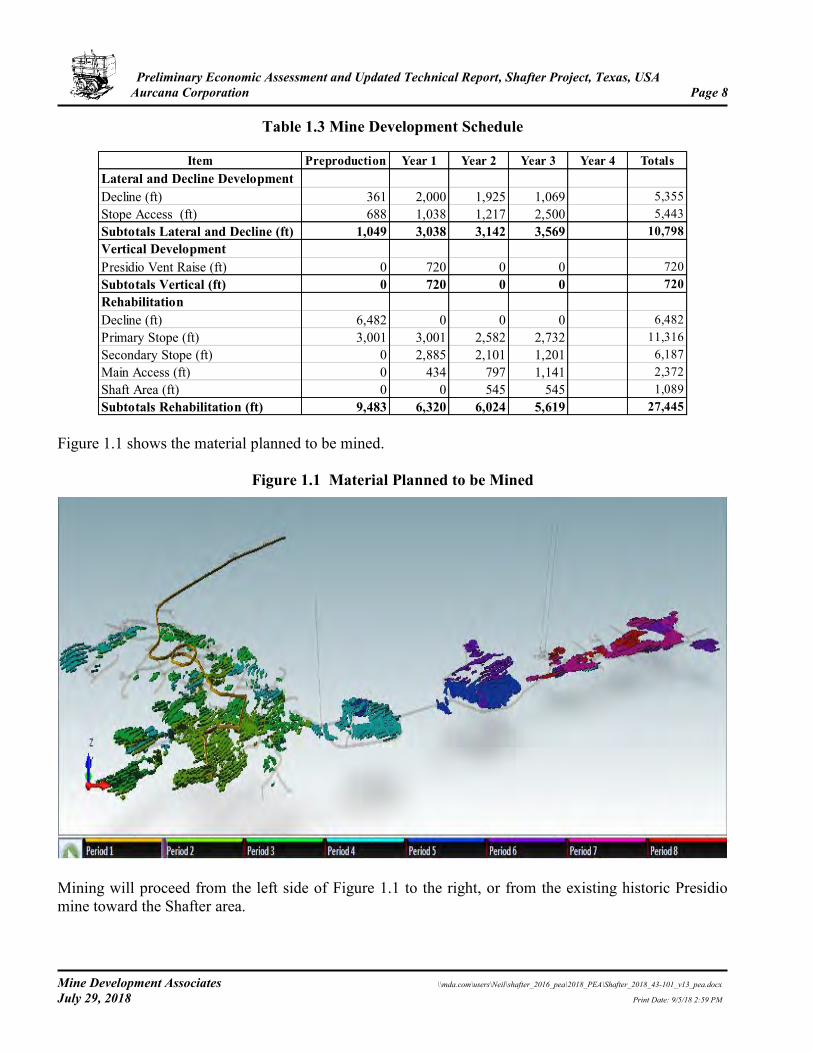
Figure 1.1 shows the material planned to be mined.
Figure 1.1 Material Planned to be Mined
Mining will proceed from the left side of Figure 1.1 to the right, or from the existing historic Presidio mine toward the Shafter area.
Preliminary Economic Assessment and Updated Technical Report, Shafter Project, Texas, USA Aurcana Corporation Page 9
Mine Development Associates \\mda.com\users\Neil\shafter_2016_pea\2018_PEA\Shafter_2018_43-101_v13_pea.docx July 29, 2018 Print Date: 9/5/18 2:59 PM
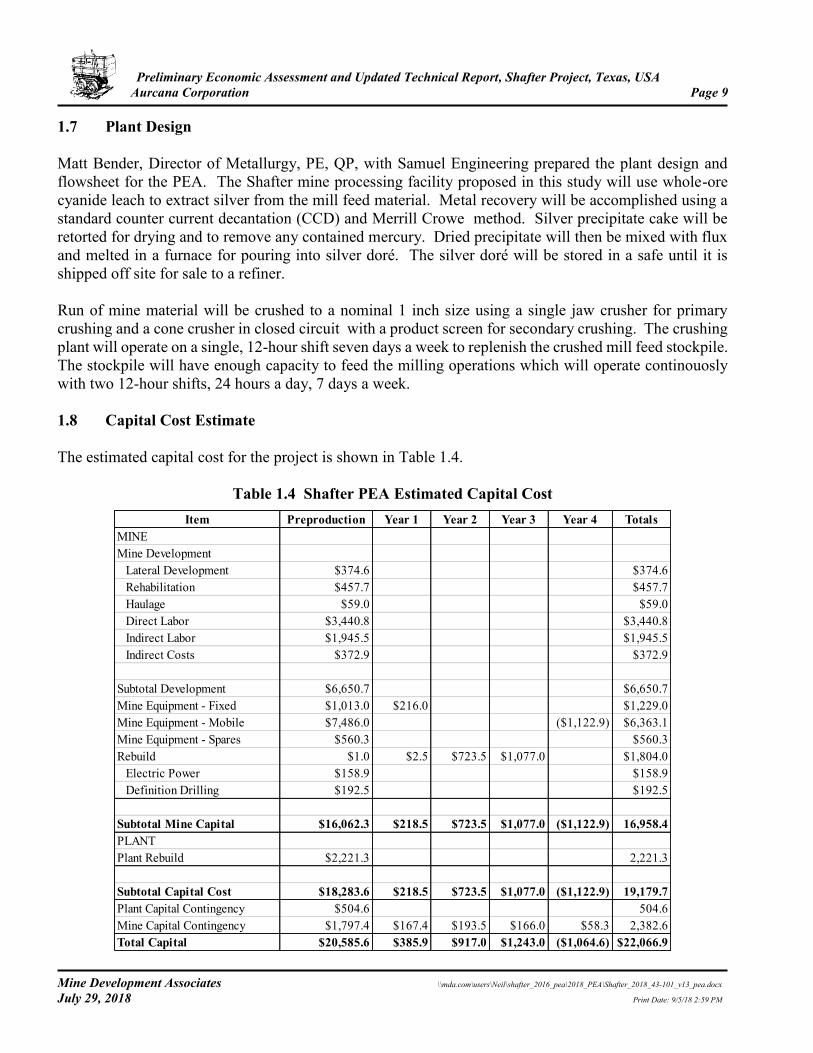
1.7 Plant Design Matt Bender, Director of Metallurgy, PE, QP, with Samuel Engineering prepared the plant design and flowsheet for the PEA. The Shafter mine processing facility proposed in this study will use whole-ore cyanide leach to extract silver from the mill feed material. Metal recovery will be accomplished using a standard counter current decantation (CCD) and Merrill Crowe method. Silver precipitate cake will be retorted for drying and to remove any contained mercury. Dried precipitate will then be mixed with flux and melted in a furnace for pouring into silver doré. The silver doré will be stored in a safe until it is shipped off site for sale to a refiner. Run of mine material will be crushed to a nominal 1 inch size using a single jaw crusher for primary crushing and a cone crusher in closed circuit with a product screen for secondary crushing. The crushing plant will operate on a single, 12-hour shift seven days a week to replenish the crushed mill feed stockpile. The stockpile will have enough capacity to feed the milling operations which will operate continouosly with two 12-hour shifts, 24 hours a day, 7 days a week. 1.8 Capital Cost Estimate The estimated capital cost for the project is shown in Table 1.4.
Table 1.4 Shafter PEA Estimated Capital Cost Item Preproduction Year 1 Year 2 Year 3 Year 4 Totals
MINEMine Development Lateral Development $374.6 $374.6 Rehabilitation $457.7 $457.7 Haulage $59.0 $59.0 Direct Labor $3,440.8 $3,440.8 Indirect Labor $1,945.5 $1,945.5 Indirect Costs $372.9 $372.9
Subtotal Development $6,650.7 $6,650.7Mine Equipment - Fixed $1,013.0 $216.0 $1,229.0Mine Equipment - Mobile $7,486.0 ($1,122.9) $6,363.1Mine Equipment - Spares $560.3 $560.3Rebuild $1.0 $2.5 $723.5 $1,077.0 $1,804.0 Electric Power $158.9 $158.9 Definition Drilling $192.5 $192.5
Subtotal Mine Capital $16,062.3 $218.5 $723.5 $1,077.0 ($1,122.9) 16,958.4PLANTPlant Rebuild $2,221.3 2,221.3
Subtotal Capital Cost $18,283.6 $218.5 $723.5 $1,077.0 ($1,122.9) 19,179.7Plant Capital Contingency $504.6 504.6Mine Capital Contingency $1,797.4 $167.4 $193.5 $166.0 $58.3 2,382.6Total Capital $20,585.6 $385.9 $917.0 $1,243.0 ($1,064.6) $22,066.9
Preliminary Economic Assessment and Updated Technical Report, Shafter Project, Texas, USA Aurcana Corporation Page 10
Mine Development Associates \\mda.com\users\Neil\shafter_2016_pea\2018_PEA\Shafter_2018_43-101_v13_pea.docx July 29, 2018 Print Date: 9/5/18 2:59 PM
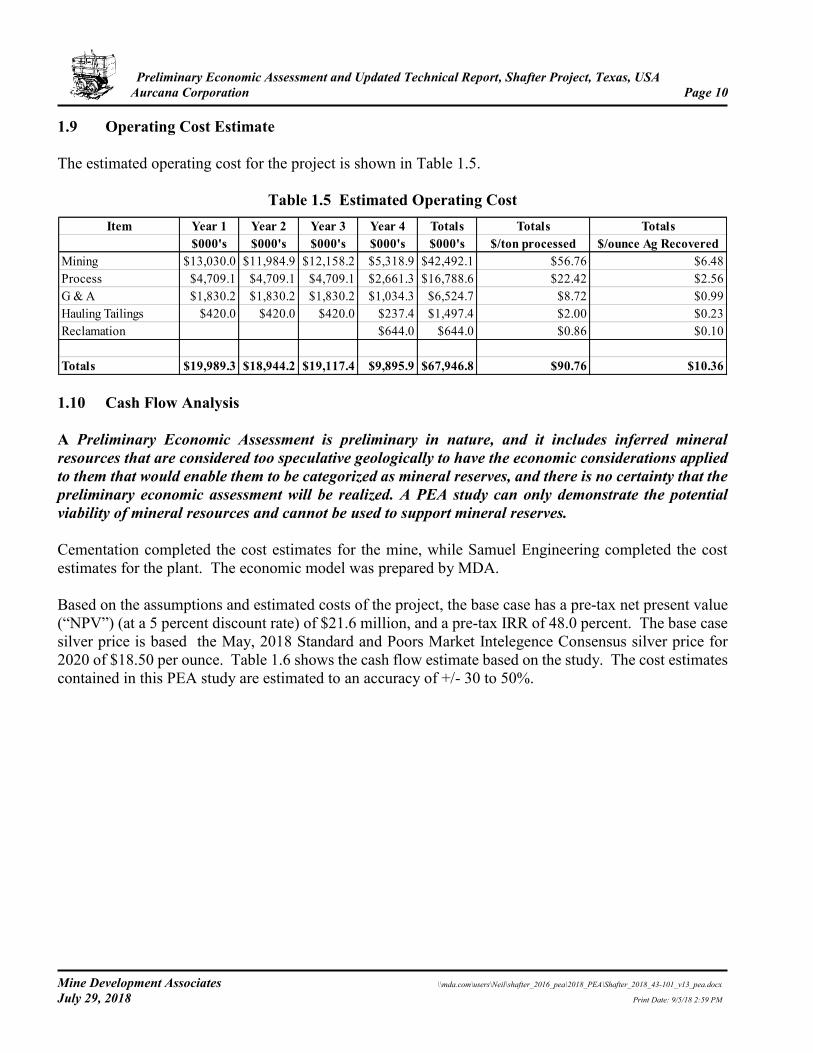
1.9 Operating Cost Estimate The estimated operating cost for the project is shown in Table 1.5.
Table 1.5 Estimated Operating Cost Item Year 1 Year 2 Year 3 Year 4 Totals Totals Totals
$000's $000's $000's $000's $000's $/ton processed $/ounce Ag RecoveredMining $13,030.0 $11,984.9 $12,158.2 $5,318.9 $42,492.1 $56.76 $6.48Process $4,709.1 $4,709.1 $4,709.1 $2,661.3 $16,788.6 $22.42 $2.56G & A $1,830.2 $1,830.2 $1,830.2 $1,034.3 $6,524.7 $8.72 $0.99Hauling Tailings $420.0 $420.0 $420.0 $237.4 $1,497.4 $2.00 $0.23Reclamation $644.0 $644.0 $0.86 $0.10
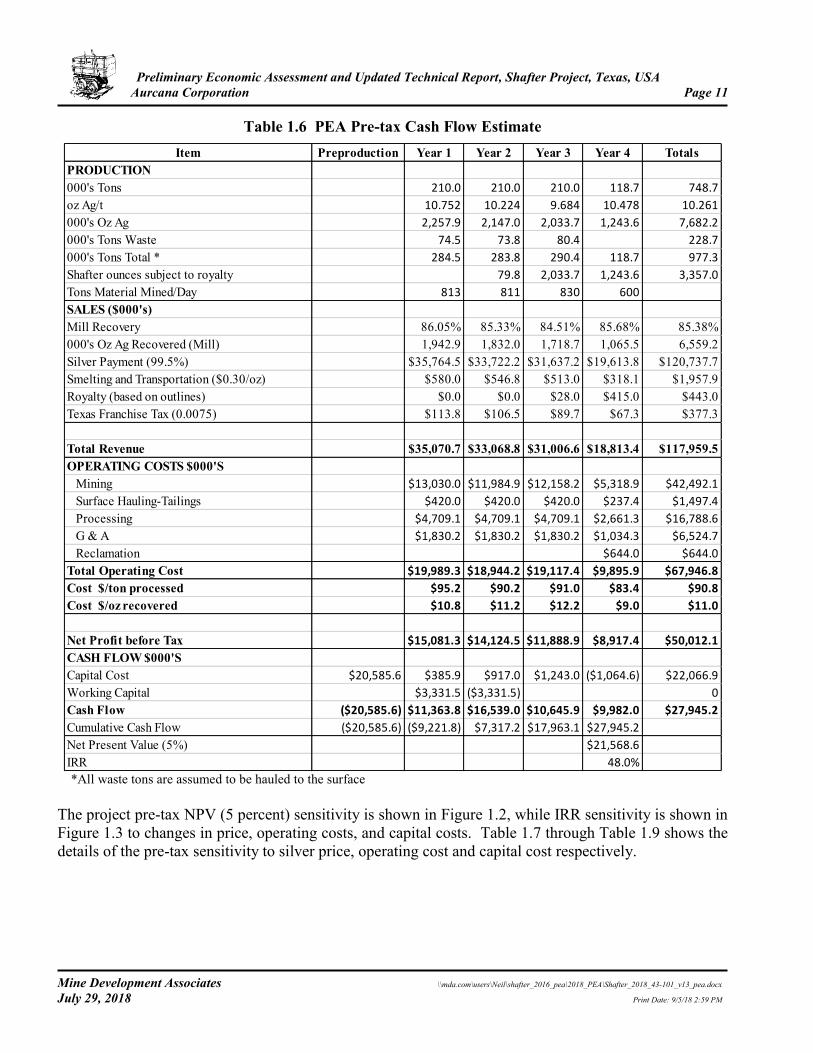
Totals $19,989.3 $18,944.2 $19,117.4 $9,895.9 $67,946.8 $90.76 $10.36 1.10 Cash Flow Analysis A Preliminary Economic Assessment is preliminary in nature, and it includes inferred mineral resources that are considered too speculative geologically to have the economic considerations applied to them that would enable them to be categorized as mineral reserves, and there is no certainty that the preliminary economic assessment will be realized. A PEA study can only demonstrate the potential viability of mineral resources and cannot be used to support mineral reserves. Cementation completed the cost estimates for the mine, while Samuel Engineering completed the cost estimates for the plant. The economic model was prepared by MDA. Based on the assumptions and estimated costs of the project, the base case has a pre-tax net present value (“NPV”) (at a 5 percent discount rate) of $21.6 million, and a pre-tax IRR of 48.0 percent. The base case silver price is based the May, 2018 Standard and Poors Market Intelegence Consensus silver price for 2020 of $18.50 per ounce. Table 1.6 shows the cash flow estimate based on the study. The cost estimates contained in this PEA study are estimated to an accuracy of +/- 30 to 50%.
Preliminary Economic Assessment and Updated Technical Report, Shafter Project, Texas, USA Aurcana Corporation Page 11
Mine Development Associates \\mda.com\users\Neil\shafter_2016_pea\2018_PEA\Shafter_2018_43-101_v13_pea.docx July 29, 2018 Print Date: 9/5/18 2:59 PM
Table 1.6 PEA Pre-tax Cash Flow Estimate Item Preproduction Year 1 Year 2 Year 3 Year 4 Totals
PRODUCTION000's Tons 210.0 210.0 210.0 118.7 748.7
oz Ag/t 10.752 10.224 9.684 10.478 10.261
000's Oz Ag 2,257.9 2,147.0 2,033.7 1,243.6 7,682.2
000's Tons Waste 74.5 73.8 80.4 228.7
000's Tons Total * 284.5 283.8 290.4 118.7 977.3
Shafter ounces subject to royalty 79.8 2,033.7 1,243.6 3,357.0
Tons Material Mined/Day 813 811 830 600
SALES ($000's)Mill Recovery 86.05% 85.33% 84.51% 85.68% 85.38%000's Oz Ag Recovered (Mill) 1,942.9 1,832.0 1,718.7 1,065.5 6,559.2Silver Payment (99.5%) $35,764.5 $33,722.2 $31,637.2 $19,613.8 $120,737.7Smelting and Transportation ($0.30/oz) $580.0 $546.8 $513.0 $318.1 $1,957.9Royalty (based on outlines) $0.0 $0.0 $28.0 $415.0 $443.0Texas Franchise Tax (0.0075) $113.8 $106.5 $89.7 $67.3 $377.3
Total Revenue $35,070.7 $33,068.8 $31,006.6 $18,813.4 $117,959.5OPERATING COSTS $000'S Mining $13,030.0 $11,984.9 $12,158.2 $5,318.9 $42,492.1
Surface Hauling-Tailings $420.0 $420.0 $420.0 $237.4 $1,497.4
Processing $4,709.1 $4,709.1 $4,709.1 $2,661.3 $16,788.6
G & A $1,830.2 $1,830.2 $1,830.2 $1,034.3 $6,524.7
Reclamation $644.0 $644.0
Total Operating Cost $19,989.3 $18,944.2 $19,117.4 $9,895.9 $67,946.8
Cost $/ton processed $95.2 $90.2 $91.0 $83.4 $90.8
Cost $/oz recovered $10.8 $11.2 $12.2 $9.0 $11.0
Net Profit before Tax $15,081.3 $14,124.5 $11,888.9 $8,917.4 $50,012.1
CASH FLOW $000'SCapital Cost $20,585.6 $385.9 $917.0 $1,243.0 ($1,064.6) $22,066.9
Working Capital $3,331.5 ($3,331.5) 0
Cash Flow ($20,585.6) $11,363.8 $16,539.0 $10,645.9 $9,982.0 $27,945.2
Cumulative Cash Flow ($20,585.6) ($9,221.8) $7,317.2 $17,963.1 $27,945.2
Net Present Value (5%) $21,568.6
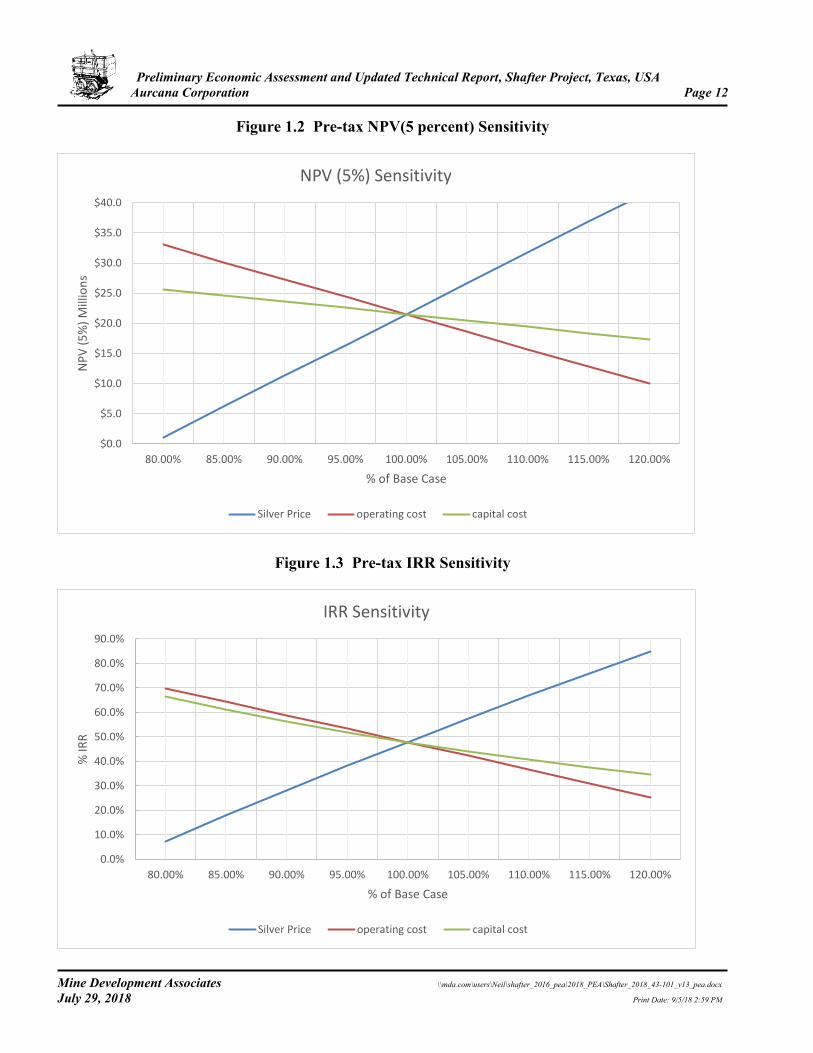
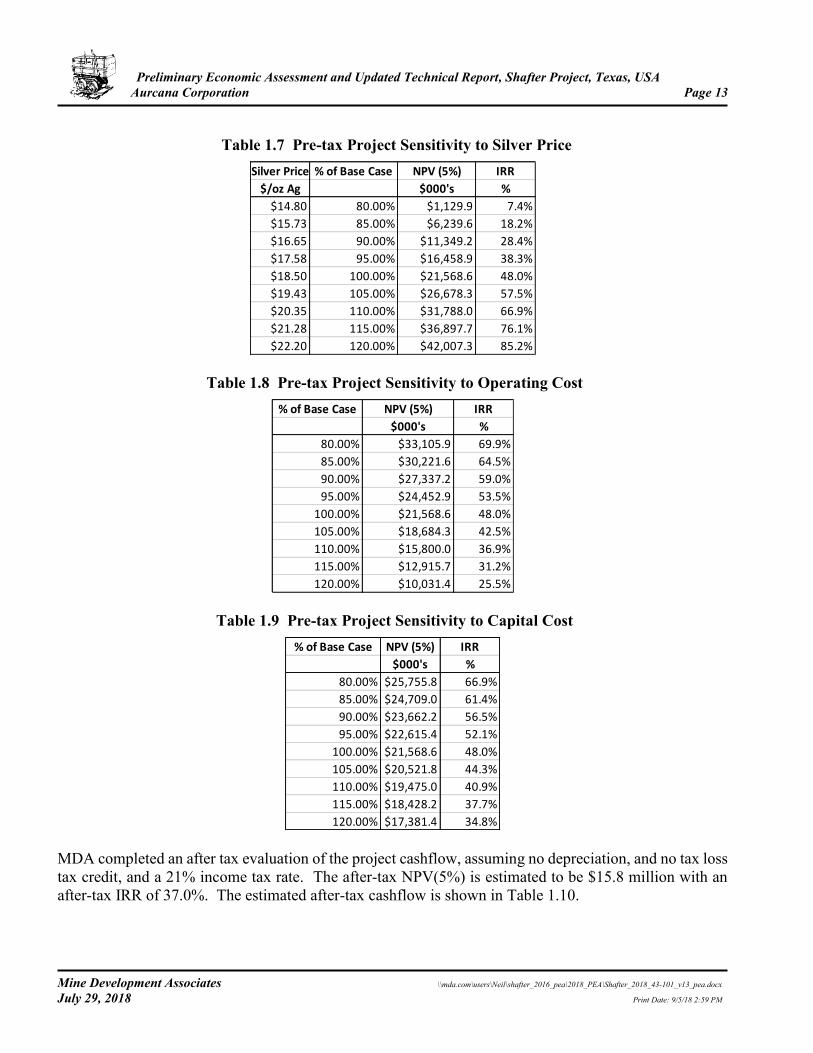
IRR 48.0% *All waste tons are assumed to be hauled to the surface The project pre-tax NPV (5 percent) sensitivity is shown in Figure 1.2, while IRR sensitivity is shown in Figure 1.3 to changes in price, operating costs, and capital costs. Table 1.7 through Table 1.9 shows the details of the pre-tax sensitivity to silver price, operating cost and capital cost respectively.
Preliminary Economic Assessment and Updated Technical Report, Shafter Project, Texas, USA Aurcana Corporation Page 12
Mine Development Associates \\mda.com\users\Neil\shafter_2016_pea\2018_PEA\Shafter_2018_43-101_v13_pea.docx July 29, 2018 Print Date: 9/5/18 2:59 PM
Figure 1.2 Pre-tax NPV(5 percent) Sensitivity
Figure 1.3 Pre-tax IRR Sensitivity
$0.0
$5.0
$10.0
$15.0
$20.0
$25.0
$30.0
$35.0
$40.0
80.00% 85.00% 90.00% 95.00% 100.00% 105.00% 110.00% 115.00% 120.00%
NP
V (
5%
) M
illio
ns
% of Base Case
NPV (5%) Sensitivity
Silver Price operating cost capital cost
0.0%
10.0%
20.0%
30.0%
40.0%
50.0%
60.0%
70.0%
80.0%
90.0%
80.00% 85.00% 90.00% 95.00% 100.00% 105.00% 110.00% 115.00% 120.00%
% IR
R
% of Base Case
IRR Sensitivity
Silver Price operating cost capital cost
Preliminary Economic Assessment and Updated Technical Report, Shafter Project, Texas, USA Aurcana Corporation Page 13
Mine Development Associates \\mda.com\users\Neil\shafter_2016_pea\2018_PEA\Shafter_2018_43-101_v13_pea.docx July 29, 2018 Print Date: 9/5/18 2:59 PM
Table 1.7 Pre-tax Project Sensitivity to Silver Price
Silver Price % of Base Case NPV (5%) IRR
$/oz Ag $000's %
$14.80 80.00% $1,129.9 7.4%
$15.73 85.00% $6,239.6 18.2%
$16.65 90.00% $11,349.2 28.4%
$17.58 95.00% $16,458.9 38.3%
$18.50 100.00% $21,568.6 48.0%
$19.43 105.00% $26,678.3 57.5%
$20.35 110.00% $31,788.0 66.9%
$21.28 115.00% $36,897.7 76.1%
$22.20 120.00% $42,007.3 85.2%
Table 1.8 Pre-tax Project Sensitivity to Operating Cost % of Base Case NPV (5%) IRR
$000's %
80.00% $33,105.9 69.9%
85.00% $30,221.6 64.5%
90.00% $27,337.2 59.0%
95.00% $24,452.9 53.5%
100.00% $21,568.6 48.0%
105.00% $18,684.3 42.5%
110.00% $15,800.0 36.9%
115.00% $12,915.7 31.2%
120.00% $10,031.4 25.5%
Table 1.9 Pre-tax Project Sensitivity to Capital Cost % of Base Case NPV (5%) IRR
$000's %
80.00% $25,755.8 66.9%
85.00% $24,709.0 61.4%
90.00% $23,662.2 56.5%
95.00% $22,615.4 52.1%
100.00% $21,568.6 48.0%
105.00% $20,521.8 44.3%
110.00% $19,475.0 40.9%
115.00% $18,428.2 37.7%
120.00% $17,381.4 34.8% MDA completed an after tax evaluation of the project cashflow, assuming no depreciation, and no tax loss tax credit, and a 21% income tax rate. The after-tax NPV(5%) is estimated to be $15.8 million with an after-tax IRR of 37.0%. The estimated after-tax cashflow is shown in Table 1.10.
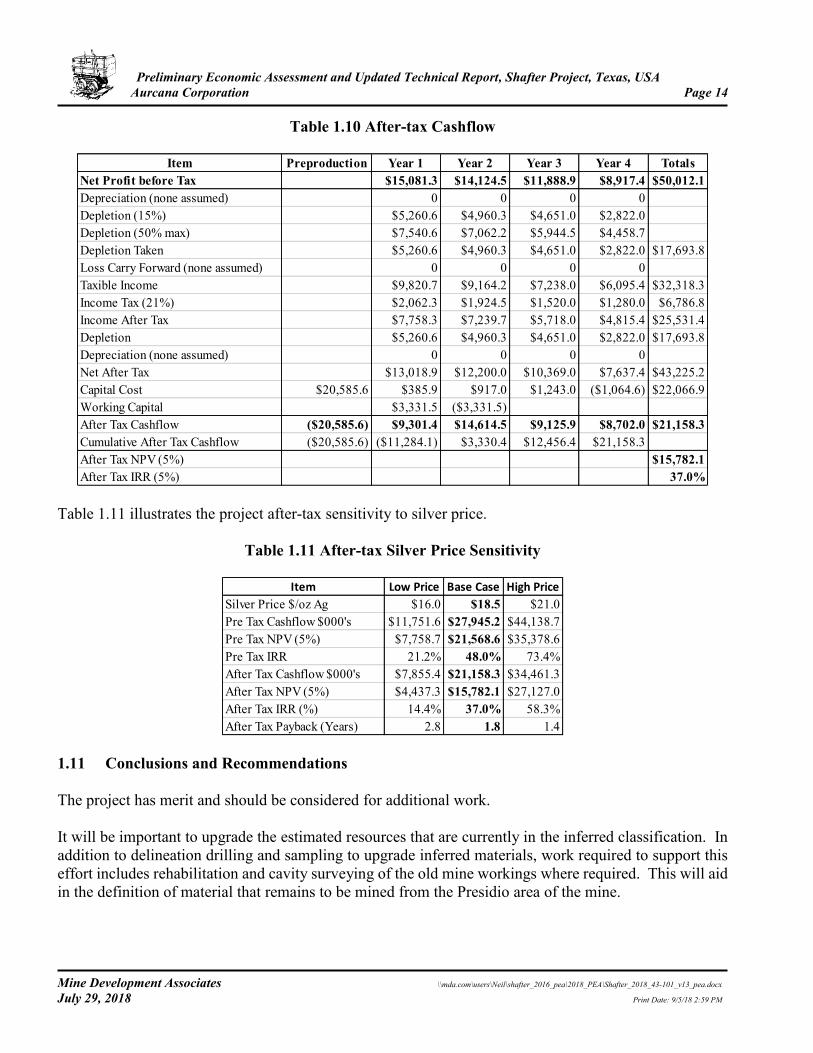
Preliminary Economic Assessment and Updated Technical Report, Shafter Project, Texas, USA Aurcana Corporation Page 14
Mine Development Associates \\mda.com\users\Neil\shafter_2016_pea\2018_PEA\Shafter_2018_43-101_v13_pea.docx July 29, 2018 Print Date: 9/5/18 2:59 PM
Table 1.10 After-tax Cashflow
Item Preproduction Year 1 Year 2 Year 3 Year 4 TotalsNet Profit before Tax $15,081.3 $14,124.5 $11,888.9 $8,917.4 $50,012.1Depreciation (none assumed) 0 0 0 0Depletion (15%) $5,260.6 $4,960.3 $4,651.0 $2,822.0Depletion (50% max) $7,540.6 $7,062.2 $5,944.5 $4,458.7Depletion Taken $5,260.6 $4,960.3 $4,651.0 $2,822.0 $17,693.8Loss Carry Forward (none assumed) 0 0 0 0Taxible Income $9,820.7 $9,164.2 $7,238.0 $6,095.4 $32,318.3Income Tax (21%) $2,062.3 $1,924.5 $1,520.0 $1,280.0 $6,786.8Income After Tax $7,758.3 $7,239.7 $5,718.0 $4,815.4 $25,531.4Depletion $5,260.6 $4,960.3 $4,651.0 $2,822.0 $17,693.8Depreciation (none assumed) 0 0 0 0Net After Tax $13,018.9 $12,200.0 $10,369.0 $7,637.4 $43,225.2Capital Cost $20,585.6 $385.9 $917.0 $1,243.0 ($1,064.6) $22,066.9Working Capital $3,331.5 ($3,331.5)After Tax Cashflow ($20,585.6) $9,301.4 $14,614.5 $9,125.9 $8,702.0 $21,158.3Cumulative After Tax Cashflow ($20,585.6) ($11,284.1) $3,330.4 $12,456.4 $21,158.3After Tax NPV (5%) $15,782.1After Tax IRR (5%) 37.0%
Table 1.11 illustrates the project after-tax sensitivity to silver price.
Table 1.11 After-tax Silver Price Sensitivity
Item Low Price Base Case High Price
Silver Price $/oz Ag $16.0 $18.5 $21.0Pre Tax Cashflow $000's $11,751.6 $27,945.2 $44,138.7Pre Tax NPV (5%) $7,758.7 $21,568.6 $35,378.6Pre Tax IRR 21.2% 48.0% 73.4%After Tax Cashflow $000's $7,855.4 $21,158.3 $34,461.3After Tax NPV (5%) $4,437.3 $15,782.1 $27,127.0After Tax IRR (%) 14.4% 37.0% 58.3%After Tax Payback (Years) 2.8 1.8 1.4
1.11 Conclusions and Recommendations The project has merit and should be considered for additional work. It will be important to upgrade the estimated resources that are currently in the inferred classification. In addition to delineation drilling and sampling to upgrade inferred materials, work required to support this effort includes rehabilitation and cavity surveying of the old mine workings where required. This will aid in the definition of material that remains to be mined from the Presidio area of the mine.
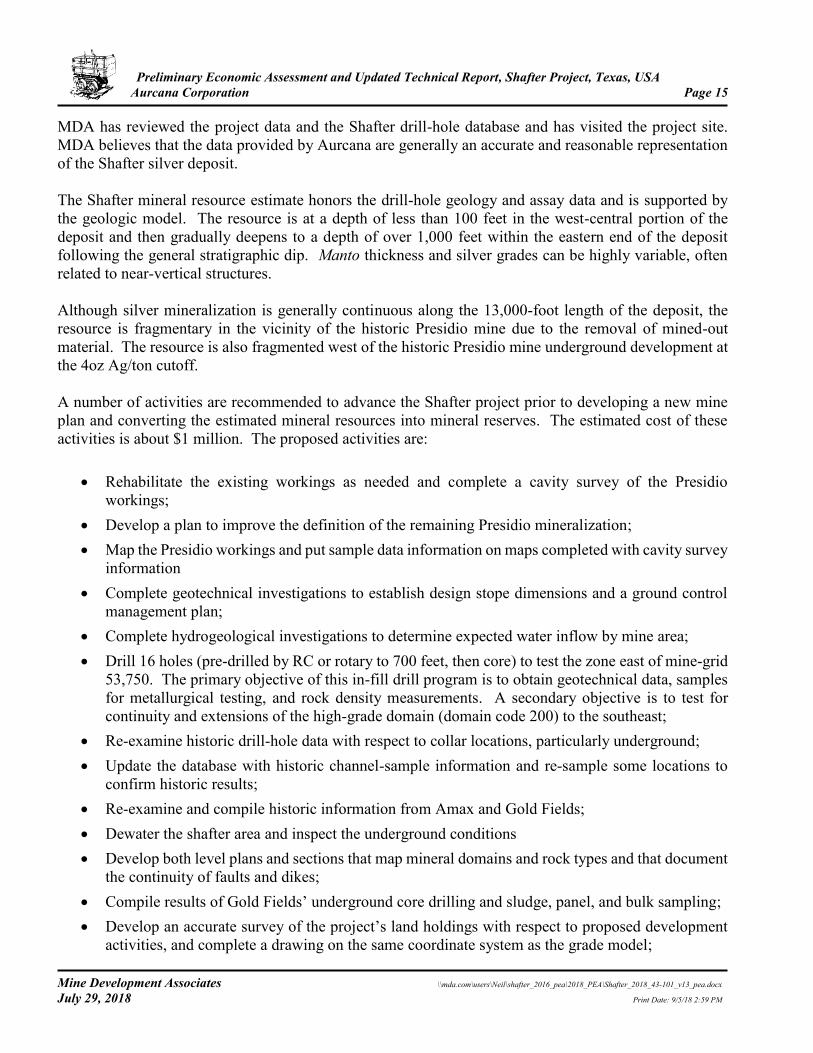
Preliminary Economic Assessment and Updated Technical Report, Shafter Project, Texas, USA Aurcana Corporation Page 15
Mine Development Associates \\mda.com\users\Neil\shafter_2016_pea\2018_PEA\Shafter_2018_43-101_v13_pea.docx July 29, 2018 Print Date: 9/5/18 2:59 PM
MDA has reviewed the project data and the Shafter drill-hole database and has visited the project site. MDA believes that the data provided by Aurcana are generally an accurate and reasonable representation of the Shafter silver deposit. The Shafter mineral resource estimate honors the drill-hole geology and assay data and is supported by the geologic model. The resource is at a depth of less than 100 feet in the west-central portion of the deposit and then gradually deepens to a depth of over 1,000 feet within the eastern end of the deposit following the general stratigraphic dip. Manto thickness and silver grades can be highly variable, often related to near-vertical structures. Although silver mineralization is generally continuous along the 13,000-foot length of the deposit, the resource is fragmentary in the vicinity of the historic Presidio mine due to the removal of mined-out material. The resource is also fragmented west of the historic Presidio mine underground development at the 4oz Ag/ton cutoff. A number of activities are recommended to advance the Shafter project prior to developing a new mine plan and converting the estimated mineral resources into mineral reserves. The estimated cost of these activities is about $1 million. The proposed activities are:
• Rehabilitate the existing workings as needed and complete a cavity survey of the Presidio workings;
• Develop a plan to improve the definition of the remaining Presidio mineralization; • Map the Presidio workings and put sample data information on maps completed with cavity survey
information • Complete geotechnical investigations to establish design stope dimensions and a ground control
management plan; • Complete hydrogeological investigations to determine expected water inflow by mine area; • Drill 16 holes (pre-drilled by RC or rotary to 700 feet, then core) to test the zone east of mine-grid
53,750. The primary objective of this in-fill drill program is to obtain geotechnical data, samples for metallurgical testing, and rock density measurements. A secondary objective is to test for continuity and extensions of the high-grade domain (domain code 200) to the southeast;
• Re-examine historic drill-hole data with respect to collar locations, particularly underground; • Update the database with historic channel-sample information and re-sample some locations to
confirm historic results; • Re-examine and compile historic information from Amax and Gold Fields; • Dewater the shafter area and inspect the underground conditions • Develop both level plans and sections that map mineral domains and rock types and that document
the continuity of faults and dikes; • Compile results of Gold Fields’ underground core drilling and sludge, panel, and bulk sampling; • Develop an accurate survey of the project’s land holdings with respect to proposed development
activities, and complete a drawing on the same coordinate system as the grade model;
Preliminary Economic Assessment and Updated Technical Report, Shafter Project, Texas, USA Aurcana Corporation Page 16
Mine Development Associates \\mda.com\users\Neil\shafter_2016_pea\2018_PEA\Shafter_2018_43-101_v13_pea.docx July 29, 2018 Print Date: 9/5/18 2:59 PM
• SE recommends that testing be performed on samples representative of the mine plan. Since extensive test-work has been very consistent on comminution studies as well as tailings observations that have established occlude silver in the sub 10 micron solids, SE recommends that a bottle roll leach campaign be performed on these composite samples at the recommended grind size. Bottle roll testing at one grind size (P80=74 µm) on 4 composite samples by year (i.e. year 1 composite, year 2-3 composite, year 4-5 composite, and year 6+ composite). Pricing for three bottle rolls on each of composites (12 bottle rolls) is expected to be in the range of $20,000 to $30,000. SE recommends that the client consider further testing on the same composites to examine the benefits and disadvantages of finer grinding since that option is available with the current mill proposed in this study. Grind size versus recovery bottle roll testing, as well as thickening and pressure filtration testwork should be performed to examine this opportunity. Grind size versus recovery should include a minimum of the achievable grind P80 characteristic distributions of 43 and 53 micrometers. This would require 24 grind and bottle roll test which would cost in the range of $40,000 to $60,000;
• SE recommends that liquid solid separation testing on the different grind sizes of each of the composites should also be performed. The cost for 8 samples will be about $ 43,200;
• SE recommends that a qualified person be consulted to evaluate the thickeners to determine if refurbishment and/or upgrading of key components is necessary to achieve the thickening performance predicted by the Pocock testwork; and
The estimated cost of this work program is $1 million, as detailed in Table 1.12.
Table 1.12 Estimated Cost of Recommended Work Program
Item Estimated CostPreliminary Mine Rehabilitation & Mapping $100,000Mine and Cavity Survey $100,000Goldfield Shaft Dewatering $50,000Hydrological Studies $50,000Metallurgical Testwork $100,000Geotechnical Studies $50,000Drilling $500,000Surveying and Geological Services $50,000
Totals $1,000,000 The project should be re-evaluated at the conclusion of the suggested work program. Additional drilling may be necessary to complete the program. If the project continues to appear positive, a pre-feasibility or feasibility study for the project should be completed. MDA believes that the Shafter project is a project of merit and warrants the program proposed by Aurcana and the level of expenditures outlined above.
Preliminary Economic Assessment and Updated Technical Report, Shafter Project, Texas, USA Aurcana Corporation Page 17
Mine Development Associates \\mda.com\users\Neil\shafter_2016_pea\2018_PEA\Shafter_2018_43-101_v13_pea.docx July 29, 2018 Print Date: 9/5/18 2:59 PM
2.0 INTRODUCTION AND TERMS OF REFERENCE Mine Development Associates (“MDA”) has prepared this Technical Report on the Shafter silver project, located in Presidio County, Texas, at the request of Aurcana Corporation (“Aurcana”), a Canadian company listed on the TSX Venture Exchange (TSX.V:AUN) and the OTC US exchange (AUNFF). Aurcana owns 100 percent of the Shafter project through its wholly owned subsidiary Rio Grande Mining Company (“RGMC”). The current report and associated resource estimate have been prepared in accordance with the disclosure and reporting requirements set forth in the Canadian Securities Administrators’ National Instrument 43-101 (“NI 43-101”), Companion Policy 43-101CP, and Form 43-101F1, as well as with the Canadian Institute of Mining, Metallurgy and Petroleum’s “CIM Definition Standards - For Mineral Resources and Reserves, Definitions and Guidelines” (“CIM Standards”) adopted by the CIM Council on May 10, 2014. The Shafter silver deposit consists of replacement bodies, termed mantos, in a horizontal to gently dipping sequence of carbonate sedimentary rocks. The Shafter deposit was exploited by historic underground mining activity from 1881 through 1942, with further exploration and development work conducted through 1999. Aurcana commenced recent development in 2011 with underground and limited open-pit production commencing in 2012 and terminating in December of 2013. The project has been on care and maintenance since December 2013. 2.1 Project Scope and Terms of Reference The purpose of this report is to provide a technical summary and Preliminary Economic Assessment (“PEA”) of the Shafter project. It builds on MDA’s updated resource estimate and Technical Report with an effective date of December 11, 2015, by Tietz and MacFarlane (2016). The mineral resources described in the current Technical Report were estimated and classified under the supervision of Paul Tietz, C.P.G. and Senior Geologist for MDA. Mr. Tietz is a qualified person under NI 43-101 and has no affiliation with Aurcana or any of its subsidiaries except that of independent consultant/client relationship. Mr. Tietz had prior experience with the Shafter project in the early 1980s while an employee of a previous operator. Peter Ronning, P.E., an associate of MDA, performed the quality assurance/quality control analysis as described in Section 12.0. Neil Prenn, P.E. and Principal Engineer for MDA, described Aurcana’s mining at Shafter from December 2012 to December 2013 in Section 6.1.1, and performed the economic analysis described in the PEA. Mr. Matt Bender, P.E., Director of Metallurgy for Samuel Engineering Inc., Denver, Colorado, contributed Section 13.0 Mineral Processing, and Metallurgical Testwork, Section 17.0 Recovery Methods, Section 18.0 Project Infrastructure, and portions of Section 21.0, 25.0, and 26.0 pertaining to the process plant. Mr. Bill Tilley, P.E., Director of Engineering for Cementation prepared section 16, and portions of section 21 regarding the mine plan and costs. Mr. Martin J. DeMarse, P.E., with Gault Group, contributed Section 20.0 and the permit status shown in Section 4.0 and 4.5. The scope of this study included a review of pertinent technical reports and data provided to MDA by Aurcana relative to the general setting, geology, project history, exploration activities and results, methodology, quality assurance, interpretations, drilling programs, and metallurgy. The author’s mandate
Preliminary Economic Assessment and Updated Technical Report, Shafter Project, Texas, USA Aurcana Corporation Page 18
Mine Development Associates \\mda.com\users\Neil\shafter_2016_pea\2018_PEA\Shafter_2018_43-101_v13_pea.docx July 29, 2018 Print Date: 9/5/18 2:59 PM
was to comment on substantive public or private documents and technical information listed in Section 27.0.
Mr. Tietz visited the Shafter project on January 30 and 31, 2013. This visit included a review of exploration data and associated drilling, logging and sampling procedures. Mr. Tietz toured the underground workings and the open pit, examined existing core, and reviewed the sampling procedures of the underground mine and the mill. In addition, MDA reviewed previous block models. Mr. Tietz visited the Shafter project again on May 21 through May 25, 2013. During the May 2013 site visit, additional historical drill data were discovered, compiled, and added to the project database. Mr. Tietz also worked with the Shafter geologic staff to develop a cross-sectional geologic model and made a brief underground tour of some of the working faces that were active at the time Mr. Prenn visited the Shafter project during the week of April 1, 2013 to review mine plans and operations at Shafter. His observations are included in Section 6.1.1. A more recent site visit was completed on June 10, 2016 by Mr. Prenn with Mr. Burgermeister, a senior process engineer with Samuel Engineering, under the direction of Matt Bender. During the site visit of June 10th, Mr. Prenn and Mr. Burgermeister toured the processing facility and inspected the existing equipment and buildings, including the crushing circuit, the leach and reagents circuits, the thickening and filtration equipment, Merrill Crowe equipment, and the refinery. Infrastructure was toured, including the hoist room, the substation, warehouse, laboratory, administration facilities, and the tailings facility. Mr. Burgermeister spent time with onsite personnel gathering historical operational data from the archives. Equipment list and inventories were also obtained during the visit. Mr. Tilley (and Mr. Greg Sutton), mining engineers with Cementation, visited the Shafter project on July 25, 2017. The visit included an assessment of the existing underground mine workings everywhere that safe access would allow, a visual assessment of surface facilities, historic operational discussions with the current Aurcana employees on site, and data collection from the Aurcana data base. MDA has relied almost entirely on data and information derived from work done by Aurcana and predecessor owner/operators of the Shafter project. MDA has reviewed much of the available data and made site visits and has made judgments about the general reliability of the underlying data. Where deemed either inadequate or unreliable, the data were either eliminated from use, or procedures were modified to account for lack of confidence in that specific information. MDA has made such independent investigations as deemed necessary in the professional judgment of the author to be able to reasonably present the conclusions discussed herein. The effective date of this report is July, 11, 2018. The effective date of the mineral resource estimate is December 11, 2015. There has been no material work on the project resource area since the effective date of the mineral resource and therefore the resource is considered current. 2.2 Frequently Used Acronyms, Abbreviations, Definitions, and Units of Measure In this report, measurements are generally reported in Imperial units. Currency: Unless otherwise indicated, all references to dollars ($) in this report refer to currency of the United States.
Preliminary Economic Assessment and Updated Technical Report, Shafter Project, Texas, USA Aurcana Corporation Page 19
Mine Development Associates \\mda.com\users\Neil\shafter_2016_pea\2018_PEA\Shafter_2018_43-101_v13_pea.docx July 29, 2018 Print Date: 9/5/18 2:59 PM
Frequently used acronyms and abbreviations AA atomic absorption spectrometry ACOE Army Corp of Engineers Ag silver ATF Bureau of Alcohol, Tobacco, Firearms and Explosives Au gold core diamond core-drilling method °F degrees Fahrenheit ft foot or feet ft2 square foot gpm gallons per minute g/t grams per ton h hours hp horsepower ICP inductively coupled plasma analytical method ICPES/MS inductively coupled plasma emission and mass spectrometry ICP-OES inductively coupled plasma-optical emission spectrometry analytical
method In inch kg kilograms kV kilovolt KW Kilowatt L liter M2 square meter Ma million years old mi mile or miles NSAMT Natural Source Audio-frequency Magnetotellurics – type of geophysical
survey that reads natural earth currents generated by lightning strikes NSR net smelter return oz ounce ppm parts per million QA/QC quality assurance and quality control RC reverse-circulation drilling method RQD rock-quality designation SHPO State Historic Preservation Office t metric tonne ton short ton TCEQ Texas Commission on Environmental Quality TNRCC Texas Natural Resource Conservation Commission tpd tons per day tph tons per hour (dtph=dry tons per hour) tpy tons per year um micron USFWS United States Fish and Wildlife Service Zn Zinc
Preliminary Economic Assessment and Updated Technical Report, Shafter Project, Texas, USA Aurcana Corporation Page 20
Mine Development Associates \\mda.com\users\Neil\shafter_2016_pea\2018_PEA\Shafter_2018_43-101_v13_pea.docx July 29, 2018 Print Date: 9/5/18 2:59 PM
3.0 RELIANCE ON OTHER EXPERTS The authors have fully relied on Aurcana and Rio Grande Mining Company, through a series of communications occurring over a period of three years from January 2013 through 2018, to provide information pertaining to land ownership and the obligations incurred from any related underlying agreements, as described in Items 4.2 (Land Tenure in Texas and the Shafter area) and 4.3 (Land Area).
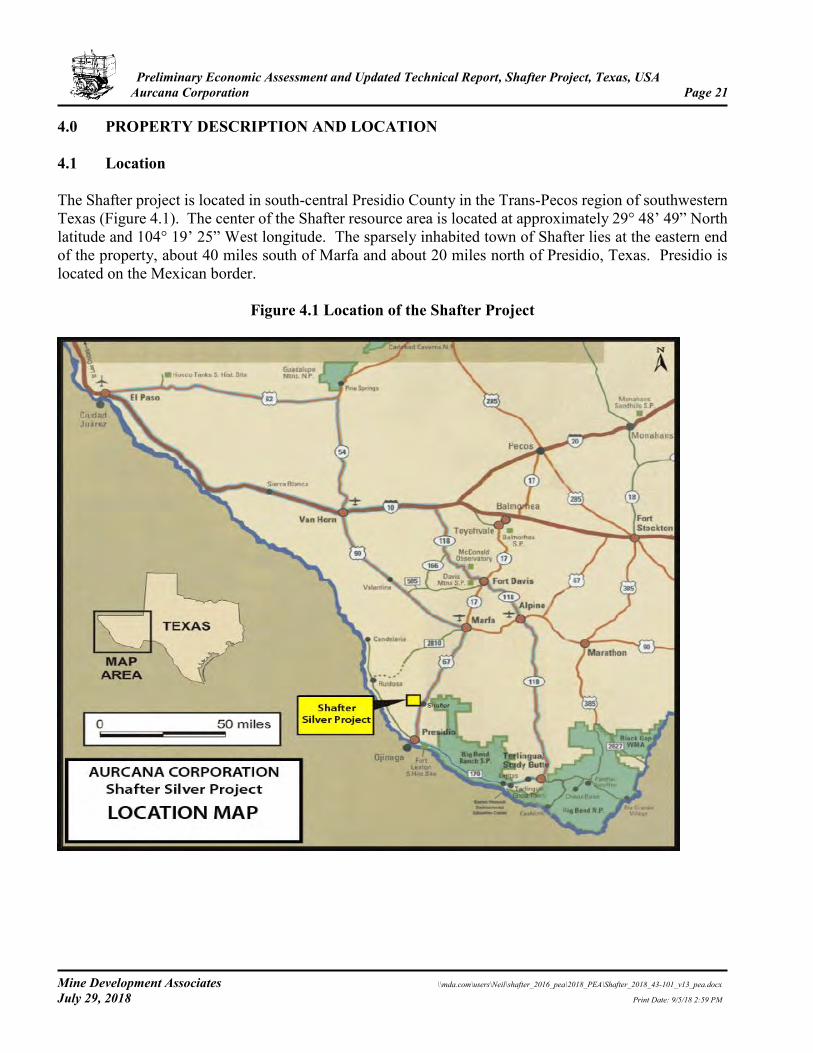
Preliminary Economic Assessment and Updated Technical Report, Shafter Project, Texas, USA Aurcana Corporation Page 21
Mine Development Associates \\mda.com\users\Neil\shafter_2016_pea\2018_PEA\Shafter_2018_43-101_v13_pea.docx July 29, 2018 Print Date: 9/5/18 2:59 PM
4.0 PROPERTY DESCRIPTION AND LOCATION 4.1 Location The Shafter project is located in south-central Presidio County in the Trans-Pecos region of southwestern Texas (Figure 4.1). The center of the Shafter resource area is located at approximately 29° 48’ 49” North latitude and 104° 19’ 25” West longitude. The sparsely inhabited town of Shafter lies at the eastern end of the property, about 40 miles south of Marfa and about 20 miles north of Presidio, Texas. Presidio is located on the Mexican border.
Figure 4.1 Location of the Shafter Project
Preliminary Economic Assessment and Updated Technical Report, Shafter Project, Texas, USA Aurcana Corporation Page 22
Mine Development Associates \\mda.com\users\Neil\shafter_2016_pea\2018_PEA\Shafter_2018_43-101_v13_pea.docx July 29, 2018 Print Date: 9/5/18 2:59 PM
4.2 Land Tenure in Texas and the Shafter Area Section 4.2 is based on information provided by Aurcana. Private title to land in Texas has been granted by the central governing body (historically by Spain, then Mexico, then the Republic of Texas, and currently the State of Texas). Mineral rights have not always been conveyed with the surface rights unless expressly stated. Consequently, mineral rights may be held by private land owners or the State of Texas. Where the State retains the mineral rights, the benefits thereof are often allocated to various charities and educational institutions. When a landowner owns both the surface and the mineral rights to his tract, he may legally sever the mineral rights from the surface rights. Although lease agreements vary, in Texas they typically permit the lessee to develop the mineral resources in order to earn a 7/8 interest; the landowner or lessor retains a 1/8 carried interest. Since 1955, the basic royalty on oil and gas on State lands has increased from 1/8 to 1/6, and since 1995, royalties for state-run lands of the Permanent School Fund have a minimum standard of 6.25 percent of the gross value. The Shafter project includes two parcels whose mineral rights Aurcana leases in this manner from the State, Section 10 of Block 23 and Section 320 of Block C-3. Private landowners may have similar royalty expectations, but royalties with private landowners are negotiable. The State of Texas does not differentiate between metallic, non-metallic, oil, gas, and aggregate resources; they are all “minerals.” In 1854, the Texas legislature offered an incentive to build railroad lines. Sixteen sections (10,240 acres) of land were available to the railroad companies for every mile of railroad contracted and put into operation. For each section the railroad companies surveyed, a second survey was done on a duplicate parcel of adjacent land. The second parcel was owned by the State, but the original by the railroad company, who usually sold the land immediately in order to construct more railroad line. This practice continued until 1882. In western Texas, land is described in terms of “blocks” (usually surveyed by one entity, often a railroad company), and within the blocks are “sections.” Subsequent subdivisions of sections are into tracts or lots (in town sites, for example). Surface and mineral rights of sections and tracts or lots may or may not be held by the same entity. Surveying was done using “metes and bounds,” a method using a landmark as a point of origin (often a pile of stones), a series of compass bearings and distances from a sequence of turning points that determine corners of the property (at best, but sometimes a creek or a road), then back to the point of origin. Units of measure could be in feet, yards, miles, and acres, or in Spanish units of varas or leagues, labors, and lots. Sometimes all appear in the same survey notes. Geographic co-ordinates are usually in latitude/longitude. There are no reliable, comprehensive survey maps of the old Shafter town site. Some mineral and surface titles at Shafter date back as far as 1884, although most are more recent. Both surface and mineral rights may be “leased” (whereby the rights are held by virtue of a lease agreement requiring annual payments or possibly work commitments) or “deeded” (purchased outright and title conveyed by a public deed). Title is recorded in county records by volume, abstract, and certificate number. An abstract number is assigned to a piece of land by the General Land Office of Texas when it is first granted or sold and is unique within the survey or league/labor to which it is assigned. Abstracts are associated only with surveys and league/labor land survey types, not for block/tract. The abstract
Preliminary Economic Assessment and Updated Technical Report, Shafter Project, Texas, USA Aurcana Corporation Page 23
Mine Development Associates \\mda.com\users\Neil\shafter_2016_pea\2018_PEA\Shafter_2018_43-101_v13_pea.docx July 29, 2018 Print Date: 9/5/18 2:59 PM
number is assigned in perpetuity. All title documents and plats refer back to the original survey and original owner(s). Individual lots maybe surveyed (a “plat”), and the map may show the location of the lot with respect to a nearby pile of stones, a steel rod or brass pin, or the corner of a landmark such as the abandoned jailhouse. Adjacent lots are rarely included on the same plat, and detailed examinations of the records indicate numerous inconsistencies between plats and reveal surveying errors. To make matters more confusing, most of the infrastructure of the town of Shafter is in disrepair or has disappeared; landmarks are destroyed; and only a few long-time or multi-generation residents remain. All these aspects make the location of lots in the Shafter town site in Section 327 uncertain. In order to track tenure, Gold Fields developed an indexing system for each parcel of land with an “L” (lease) or “D” (deed) followed by a 4-digit number (10XX). This internal filing system remains in use. At Shafter, as with many areas in Texas, there are numerous right-of-ways for highways, roads, utility lines, and easements that allow the passage of people and goods or to facilitate hunting and grazing activities. The preceding description is based upon internet research and private company materials. Important reference materials may be found at: http://www.p2energysolutions.com/tobin-talk/land-survey-west-texas-vs-east-texas http://www.rrc.state.tx.us/about/faqs/royaltiesleases.php http://www.tshaonline.org/handbook/online/articles/gym01 http://www.glo.texas.gov/what-we-do/energy-and-minerals/hard-minerals/index.html http://www.surveyhistory.org/metes_&_bounds_vs__public_lands.htm http://www.mineralhub.com/2010/04/how-can-i-locate-who-owns-the-mineral-rights-under-my-land/ http://www.tobin.com/documents/TechWhitePaper8.pdf, and http://www.tlma.org/resources.htm. 4.3 Land Area Section 4.3 is based on information provided by Aurcana. Through its wholly owned subsidiary, RGMC, Aurcana owns or controls about 3,960 acres of property at Shafter, including eight sections or half sections, 13 parcels of Shafter town lots in two additional sections, and one additional half-section consisting of leased mineral claims.. All but one section consists of private land for which Aurcana holds either deeded surface rights or no surface rights, and deeded, leased, or no mineral rights. The mineral resources described in Section 14.0 are located on private land. Table 4.1 lists the parcels that comprise Aurcana’s Shafter property, including the nature of Aurcana’s interests, applicable royalties, and annual holding costs for each parcel. Figure 4.2 shows an overview of Aurcana’s property holdings at Shafter. Figure 4.3 shows more detail of Aurcana’s holdings in the vicinity of the Shafter town site in Section 327. Figure 4.4 shows greater detail of Aurcana’s holdings in Section 328.
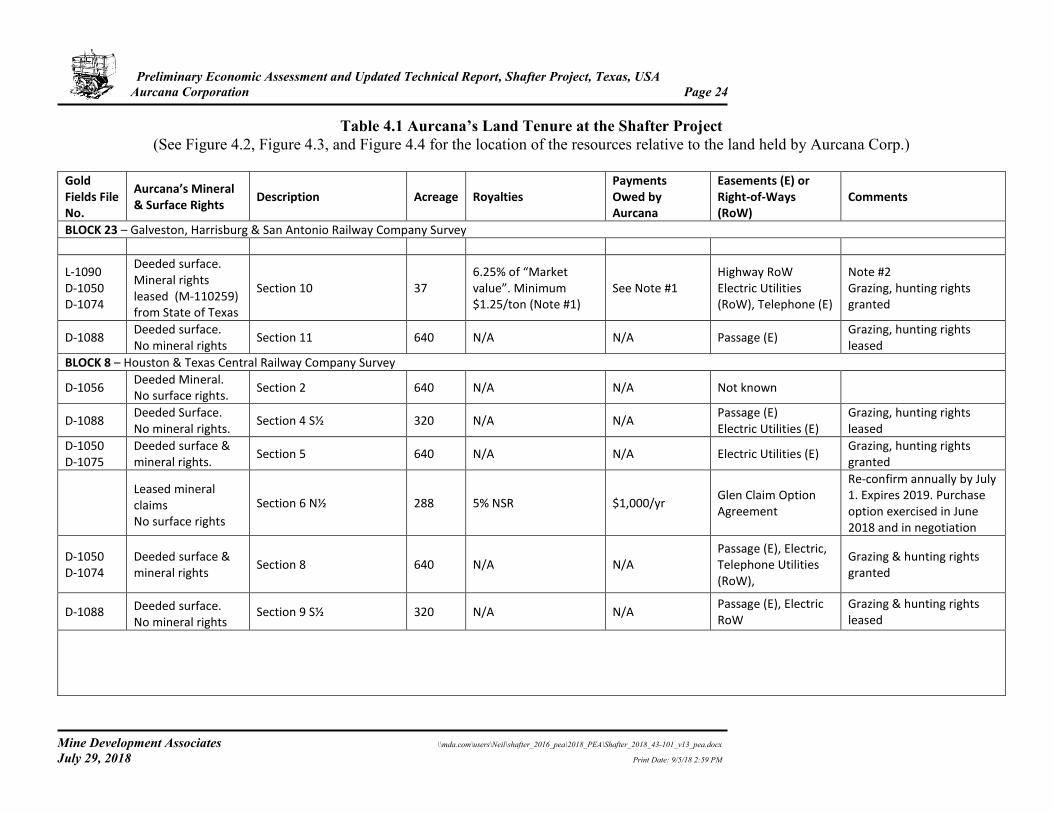
Preliminary Economic Assessment and Updated Technical Report, Shafter Project, Texas, USA Aurcana Corporation Page 24
Mine Development Associates \\mda.com\users\Neil\shafter_2016_pea\2018_PEA\Shafter_2018_43-101_v13_pea.docx July 29, 2018 Print Date: 9/5/18 2:59 PM
Table 4.1 Aurcana’s Land Tenure at the Shafter Project (See Figure 4.2, Figure 4.3, and Figure 4.4 for the location of the resources relative to the land held by Aurcana Corp.)
Gold Fields File No.
Aurcana’s Mineral & Surface Rights
Description Acreage Royalties Payments Owed by Aurcana
Easements (E) or Right-of-Ways (RoW)
Comments
BLOCK 23 – Galveston, Harrisburg & San Antonio Railway Company Survey
L-1090 D-1050 D-1074
Deeded surface. Mineral rights leased (M-110259) from State of Texas
Section 10 37 6.25% of “Market value”. Minimum $1.25/ton (Note #1)
See Note #1 Highway RoW Electric Utilities (RoW), Telephone (E)
Note #2 Grazing, hunting rights granted
D-1088 Deeded surface. No mineral rights
Section 11 640 N/A N/A Passage (E) Grazing, hunting rights leased
BLOCK 8 – Houston & Texas Central Railway Company Survey
D-1056 Deeded Mineral. No surface rights.
Section 2 640 N/A N/A Not known
D-1088 Deeded Surface. No mineral rights.
Section 4 S½ 320 N/A N/A Passage (E) Electric Utilities (E)
Grazing, hunting rights leased
D-1050 D-1075
Deeded surface & mineral rights.
Section 5 640 N/A N/A Electric Utilities (E) Grazing, hunting rights granted
Leased mineral claims No surface rights
Section 6 N½ 288 5% NSR $1,000/yr Glen Claim Option Agreement
Re-confirm annually by July 1. Expires 2019. Purchase option exercised in June 2018 and in negotiation
D-1050 D-1074
Deeded surface & mineral rights
Section 8 640 N/A N/A Passage (E), Electric, Telephone Utilities (RoW),
Grazing & hunting rights granted
D-1088 Deeded surface. No mineral rights
Section 9 S½ 320 N/A N/A Passage (E), Electric RoW
Grazing & hunting rights leased
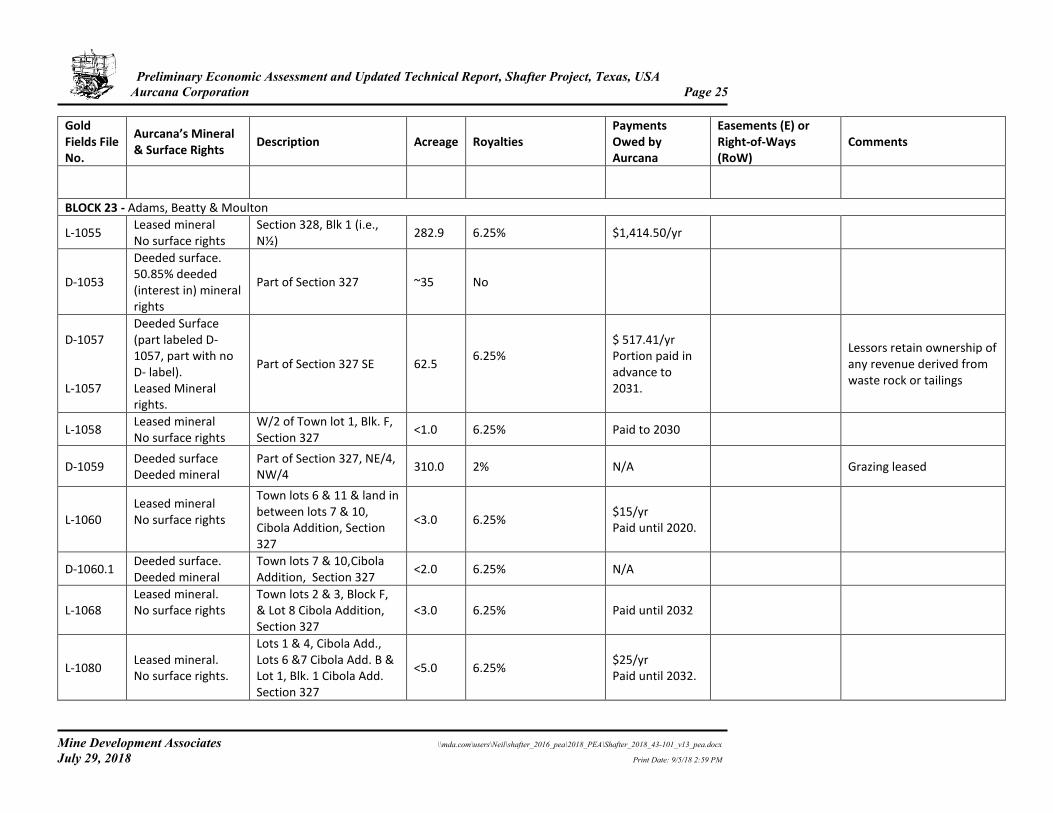
Preliminary Economic Assessment and Updated Technical Report, Shafter Project, Texas, USA Aurcana Corporation Page 25
Mine Development Associates \\mda.com\users\Neil\shafter_2016_pea\2018_PEA\Shafter_2018_43-101_v13_pea.docx July 29, 2018 Print Date: 9/5/18 2:59 PM
Gold Fields File No.
Aurcana’s Mineral & Surface Rights
Description Acreage Royalties Payments Owed by Aurcana
Easements (E) or Right-of-Ways (RoW)
Comments
BLOCK 23 - Adams, Beatty & Moulton
L-1055 Leased mineral No surface rights
Section 328, Blk 1 (i.e., N½)
282.9 6.25% $1,414.50/yr
D-1053
Deeded surface. 50.85% deeded (interest in) mineral rights
Part of Section 327 ~35 No
D-1057 L-1057
Deeded Surface (part labeled D-1057, part with no D- label). Leased Mineral rights.
Part of Section 327 SE 62.5 6.25%
$ 517.41/yr Portion paid in advance to 2031.
Lessors retain ownership of any revenue derived from waste rock or tailings
L-1058 Leased mineral No surface rights
W/2 of Town lot 1, Blk. F, Section 327
<1.0 6.25% Paid to 2030
D-1059 Deeded surface Deeded mineral
Part of Section 327, NE/4, NW/4
310.0 2% N/A Grazing leased
L-1060 Leased mineral No surface rights
Town lots 6 & 11 & land in between lots 7 & 10, Cibola Addition, Section 327
<3.0 6.25% $15/yr Paid until 2020.
D-1060.1 Deeded surface. Deeded mineral
Town lots 7 & 10,Cibola Addition, Section 327
<2.0 6.25% N/A
L-1068 Leased mineral. No surface rights
Town lots 2 & 3, Block F, & Lot 8 Cibola Addition, Section 327
<3.0 6.25% Paid until 2032
L-1080 Leased mineral. No surface rights.
Lots 1 & 4, Cibola Add., Lots 6 &7 Cibola Add. B & Lot 1, Blk. 1 Cibola Add. Section 327
<5.0 6.25% $25/yr Paid until 2032.
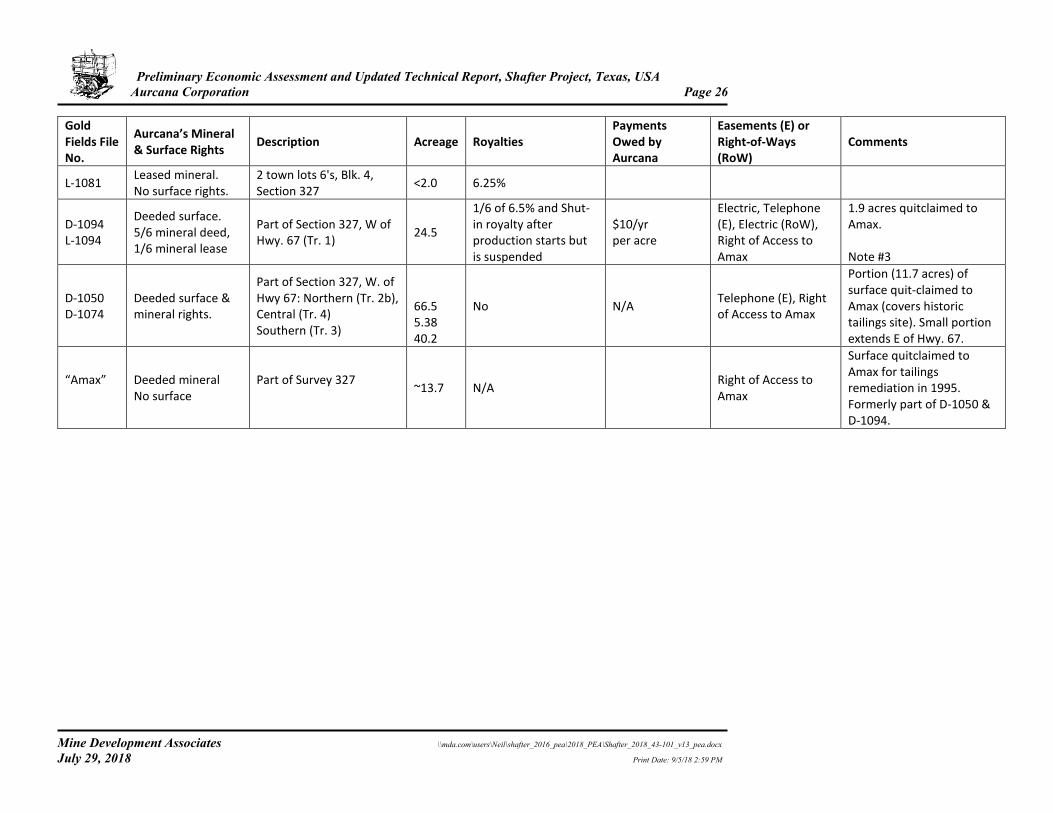
Preliminary Economic Assessment and Updated Technical Report, Shafter Project, Texas, USA Aurcana Corporation Page 26
Mine Development Associates \\mda.com\users\Neil\shafter_2016_pea\2018_PEA\Shafter_2018_43-101_v13_pea.docx July 29, 2018 Print Date: 9/5/18 2:59 PM
Gold Fields File No.
Aurcana’s Mineral & Surface Rights
Description Acreage Royalties Payments Owed by Aurcana
Easements (E) or Right-of-Ways (RoW)
Comments
L-1081 Leased mineral. No surface rights.
2 town lots 6's, Blk. 4, Section 327
<2.0 6.25%
D-1094 L-1094
Deeded surface. 5/6 mineral deed, 1/6 mineral lease
Part of Section 327, W of Hwy. 67 (Tr. 1)
24.5
1/6 of 6.5% and Shut-in royalty after production starts but is suspended
$10/yr per acre
Electric, Telephone (E), Electric (RoW), Right of Access to Amax
1.9 acres quitclaimed to Amax. Note #3
D-1050 D-1074
Deeded surface & mineral rights.
Part of Section 327, W. of Hwy 67: Northern (Tr. 2b), Central (Tr. 4) Southern (Tr. 3)
66.5 5.38 40.2
No N/A Telephone (E), Right of Access to Amax
Portion (11.7 acres) of surface quit-claimed to Amax (covers historic tailings site). Small portion extends E of Hwy. 67.
“Amax”
Deeded mineral No surface
Part of Survey 327
~13.7 N/A Right of Access to Amax
Surface quitclaimed to Amax for tailings remediation in 1995. Formerly part of D-1050 & D-1094.
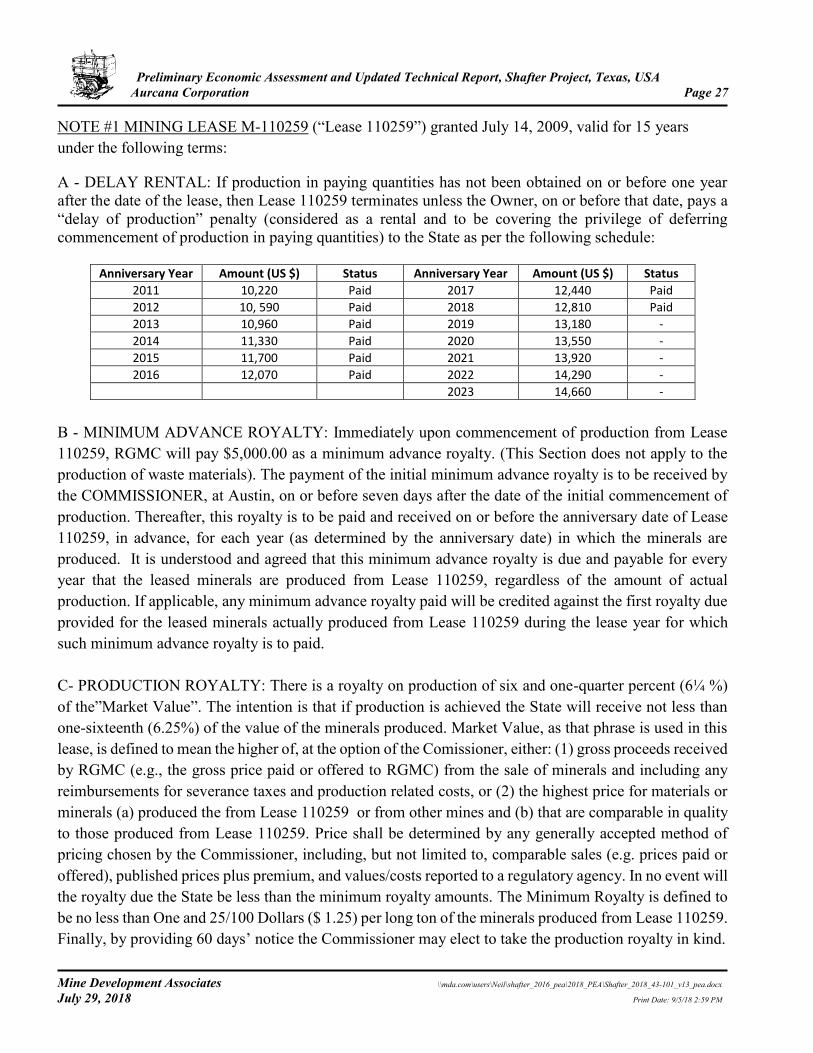
Preliminary Economic Assessment and Updated Technical Report, Shafter Project, Texas, USA Aurcana Corporation Page 27
Mine Development Associates \\mda.com\users\Neil\shafter_2016_pea\2018_PEA\Shafter_2018_43-101_v13_pea.docx July 29, 2018 Print Date: 9/5/18 2:59 PM
NOTE #1 MINING LEASE M-110259 (“Lease 110259”) granted July 14, 2009, valid for 15 years under the following terms:
A - DELAY RENTAL: If production in paying quantities has not been obtained on or before one year after the date of the lease, then Lease 110259 terminates unless the Owner, on or before that date, pays a “delay of production” penalty (considered as a rental and to be covering the privilege of deferring commencement of production in paying quantities) to the State as per the following schedule:
Anniversary Year Amount (US $) Status Anniversary Year Amount (US $) Status
2011 10,220 Paid 2017 12,440 Paid
2012 10, 590 Paid 2018 12,810 Paid
2013 10,960 Paid 2019 13,180 -
2014 11,330 Paid 2020 13,550 -
2015 11,700 Paid 2021 13,920 -
2016 12,070 Paid 2022 14,290 -
2023 14,660 -
B - MINIMUM ADVANCE ROYALTY: Immediately upon commencement of production from Lease 110259, RGMC will pay $5,000.00 as a minimum advance royalty. (This Section does not apply to the production of waste materials). The payment of the initial minimum advance royalty is to be received by the COMMISSIONER, at Austin, on or before seven days after the date of the initial commencement of production. Thereafter, this royalty is to be paid and received on or before the anniversary date of Lease 110259, in advance, for each year (as determined by the anniversary date) in which the minerals are produced. It is understood and agreed that this minimum advance royalty is due and payable for every year that the leased minerals are produced from Lease 110259, regardless of the amount of actual production. If applicable, any minimum advance royalty paid will be credited against the first royalty due provided for the leased minerals actually produced from Lease 110259 during the lease year for which such minimum advance royalty is to paid. C- PRODUCTION ROYALTY: There is a royalty on production of six and one-quarter percent (6¼ %) of the”Market Value”. The intention is that if production is achieved the State will receive not less than one-sixteenth (6.25%) of the value of the minerals produced. Market Value, as that phrase is used in this lease, is defined to mean the higher of, at the option of the Comissioner, either: (1) gross proceeds received by RGMC (e.g., the gross price paid or offered to RGMC) from the sale of minerals and including any reimbursements for severance taxes and production related costs, or (2) the highest price for materials or minerals (a) produced the from Lease 110259 or from other mines and (b) that are comparable in quality to those produced from Lease 110259. Price shall be determined by any generally accepted method of pricing chosen by the Commissioner, including, but not limited to, comparable sales (e.g. prices paid or offered), published prices plus premium, and values/costs reported to a regulatory agency. In no event will the royalty due the State be less than the minimum royalty amounts. The Minimum Royalty is defined to be no less than One and 25/100 Dollars ($ 1.25) per long ton of the minerals produced from Lease 110259. Finally, by providing 60 days’ notice the Commissioner may elect to take the production royalty in kind.
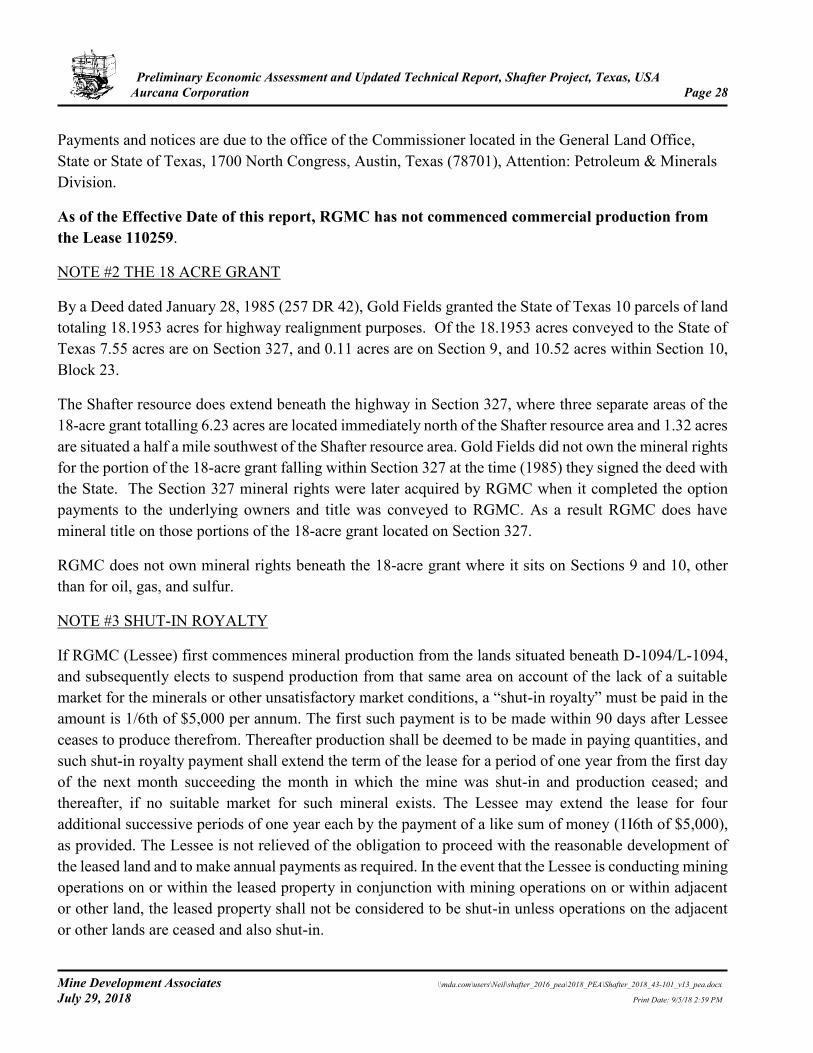
Preliminary Economic Assessment and Updated Technical Report, Shafter Project, Texas, USA Aurcana Corporation Page 28
Mine Development Associates \\mda.com\users\Neil\shafter_2016_pea\2018_PEA\Shafter_2018_43-101_v13_pea.docx July 29, 2018 Print Date: 9/5/18 2:59 PM
Payments and notices are due to the office of the Commissioner located in the General Land Office, State or State of Texas, 1700 North Congress, Austin, Texas (78701), Attention: Petroleum & Minerals Division. As of the Effective Date of this report, RGMC has not commenced commercial production from the Lease 110259. NOTE #2 THE 18 ACRE GRANT By a Deed dated January 28, 1985 (257 DR 42), Gold Fields granted the State of Texas 10 parcels of land totaling 18.1953 acres for highway realignment purposes. Of the 18.1953 acres conveyed to the State of Texas 7.55 acres are on Section 327, and 0.11 acres are on Section 9, and 10.52 acres within Section 10, Block 23.
The Shafter resource does extend beneath the highway in Section 327, where three separate areas of the 18-acre grant totalling 6.23 acres are located immediately north of the Shafter resource area and 1.32 acres are situated a half a mile southwest of the Shafter resource area. Gold Fields did not own the mineral rights for the portion of the 18-acre grant falling within Section 327 at the time (1985) they signed the deed with the State. The Section 327 mineral rights were later acquired by RGMC when it completed the option payments to the underlying owners and title was conveyed to RGMC. As a result RGMC does have mineral title on those portions of the 18-acre grant located on Section 327.
RGMC does not own mineral rights beneath the 18-acre grant where it sits on Sections 9 and 10, other than for oil, gas, and sulfur.
NOTE #3 SHUT-IN ROYALTY
If RGMC (Lessee) first commences mineral production from the lands situated beneath D-1094/L-1094, and subsequently elects to suspend production from that same area on account of the lack of a suitable market for the minerals or other unsatisfactory market conditions, a “shut-in royalty” must be paid in the amount is 1/6th of $5,000 per annum. The first such payment is to be made within 90 days after Lessee ceases to produce therefrom. Thereafter production shall be deemed to be made in paying quantities, and such shut-in royalty payment shall extend the term of the lease for a period of one year from the first day of the next month succeeding the month in which the mine was shut-in and production ceased; and thereafter, if no suitable market for such mineral exists. The Lessee may extend the lease for four additional successive periods of one year each by the payment of a like sum of money (1I6th of $5,000), as provided. The Lessee is not relieved of the obligation to proceed with the reasonable development of the leased land and to make annual payments as required. In the event that the Lessee is conducting mining operations on or within the leased property in conjunction with mining operations on or within adjacent or other land, the leased property shall not be considered to be shut-in unless operations on the adjacent or other lands are ceased and also shut-in.
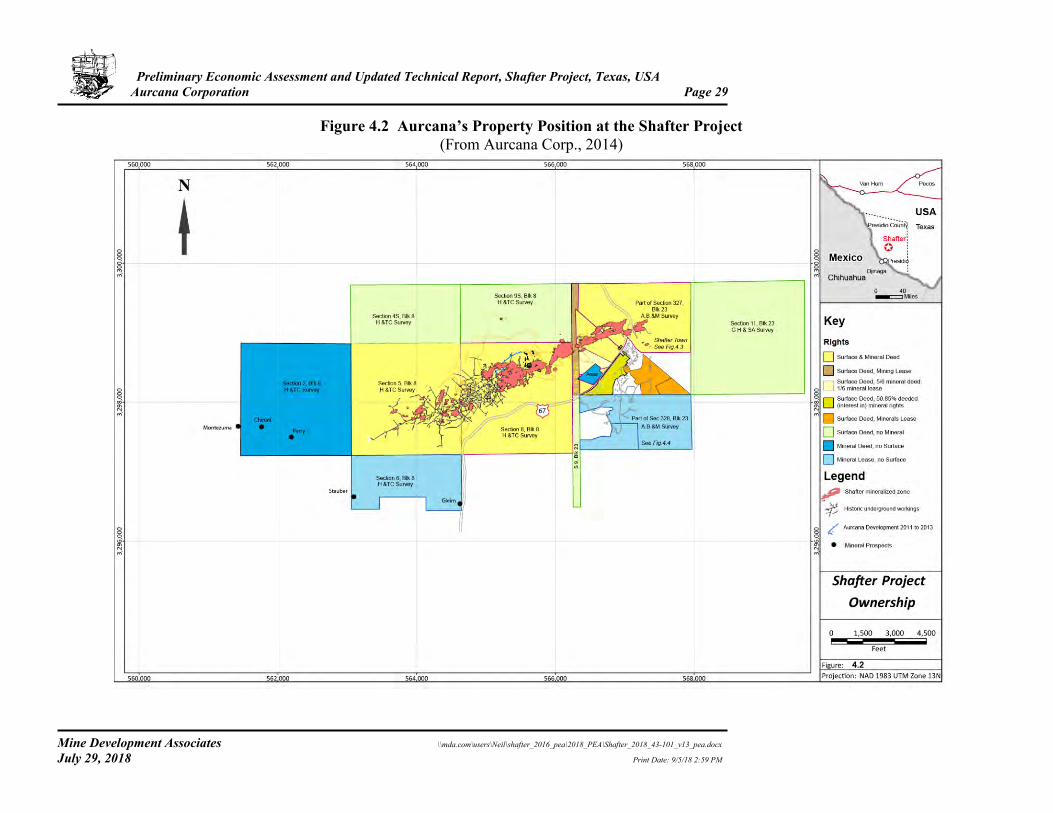
Preliminary Economic Assessment and Updated Technical Report, Shafter Project, Texas, USA Aurcana Corporation Page 29
Mine Development Associates \\mda.com\users\Neil\shafter_2016_pea\2018_PEA\Shafter_2018_43-101_v13_pea.docx July 29, 2018 Print Date: 9/5/18 2:59 PM
Figure 4.2 Aurcana’s Property Position at the Shafter Project (From Aurcana Corp., 2014)
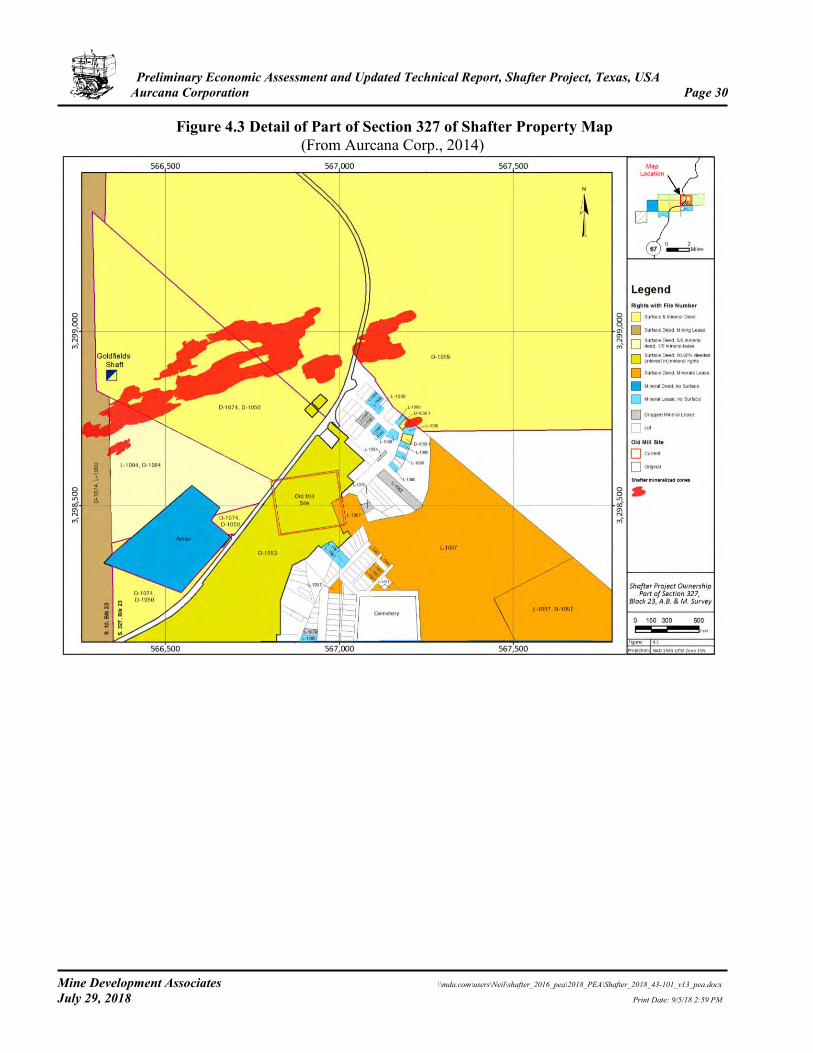
Preliminary Economic Assessment and Updated Technical Report, Shafter Project, Texas, USA Aurcana Corporation Page 30
Mine Development Associates \\mda.com\users\Neil\shafter_2016_pea\2018_PEA\Shafter_2018_43-101_v13_pea.docx July 29, 2018 Print Date: 9/5/18 2:59 PM
Figure 4.3 Detail of Part of Section 327 of Shafter Property Map (From Aurcana Corp., 2014)
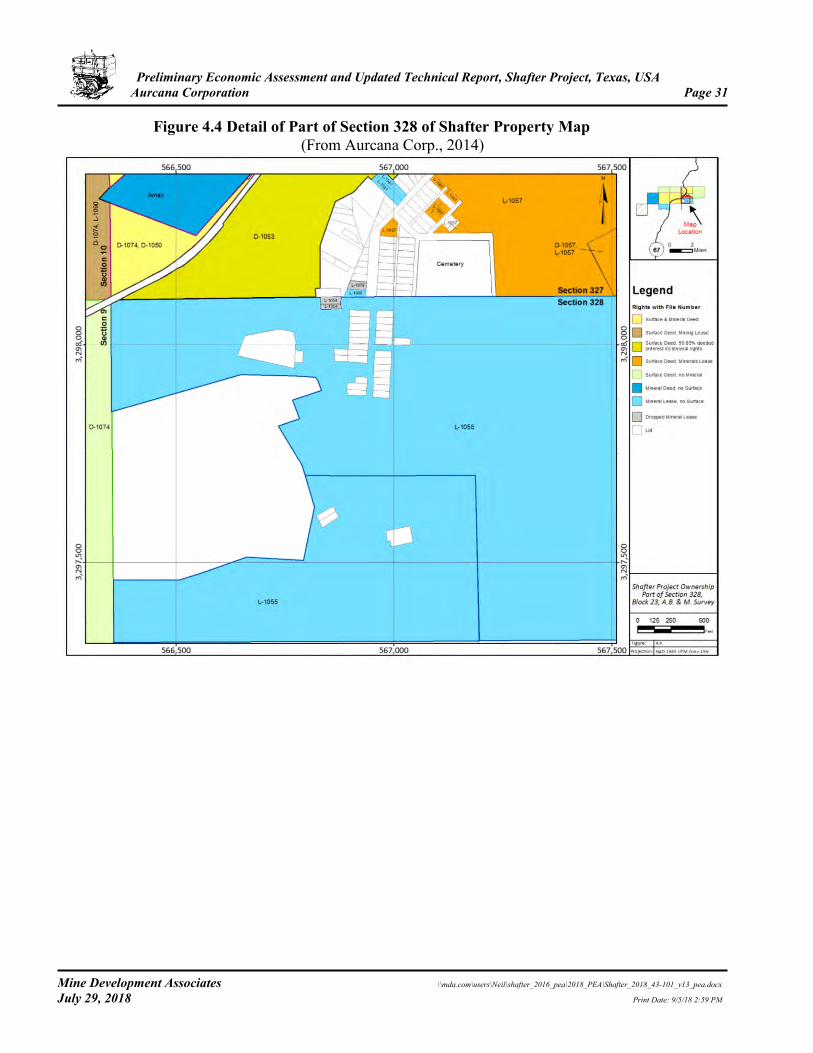
Preliminary Economic Assessment and Updated Technical Report, Shafter Project, Texas, USA Aurcana Corporation Page 31
Mine Development Associates \\mda.com\users\Neil\shafter_2016_pea\2018_PEA\Shafter_2018_43-101_v13_pea.docx July 29, 2018 Print Date: 9/5/18 2:59 PM
Figure 4.4 Detail of Part of Section 328 of Shafter Property Map (From Aurcana Corp., 2014)
Preliminary Economic Assessment and Updated Technical Report, Shafter Project, Texas, USA Aurcana Corporation Page 32
Mine Development Associates \\mda.com\users\Neil\shafter_2016_pea\2018_PEA\Shafter_2018_43-101_v13_pea.docx July 29, 2018 Print Date: 9/5/18 2:59 PM
4.4 Environmental Liabilities The information in Sections 4.4 and 4.5 has been supplied by employees of Rio Grande Mining Company, as well as their environmental and reclamation consultants. Known environmental liabilities for the Shafter mine are limited to reclamation responsibilities for the tailing disposal area and mill bleed water pond. RGMC requested, and received, concurrence from the Texas Commission on Environmental Quality, that waste from these two facilities qualifies as exempt from hazardous designation pursuant to the Bevill Amendment (42 U.S.C. § 6921(b)(2)(A)). At closure, the remaining active portion of the tailing disposal facility will be capped with an average of three feet of alluvium and seeded with a mix recommended by the Natural Resources Conservation Service. Utilization of native material for capping will promote growth of vegetation that results from the dry seeding and facilitate natural colonization of the area from the surrounding biotic communities. The plant bleed water is managed through a state-approved Plant Bleed Water Management Plan. Excess barren leaching solution (known as “plant bleed water”) is discharged to a waste-management unit (surface impoundment) known as the Bleed Water Pond. The pond is required through the operational life of the Shafter project. Following completion of any mining activities, the pond will be closed by removal and off-site disposal of residual sludge and the primary impoundment liner in accordance with state regulations. Reclamation at the Shafter mine required by regulation or statute is limited to the two above described facilities. Reclamation and disposal costs are estimated at $644,000.00. Further discussion of the tailing facility and bleed water pond may be found in Section 20.0 of this document. 4.5 Environmental Permitting Permitting for the Shafter project is regulated by state (Texas) and local (Presidio County) agencies. State agencies include the above-mentioned TCEQ having primary responsibility, Texas Health Department, Texas Historical Commission, Texas Parks and Wildlife, and Texas Department of Transportation. Local agencies include the County of Presidio and the Presidio County Underground Water Conservation District. Federal regulatory programs to which the Shafter mine is subject are limited to the U.S. Army Corps of Engineers (ACOE) implementing the Clean Water Act, and programs that demonstrate ACOE compliance with the National Historic Preservation Act and Endangered Species Act. As a result of the development and exploration activities conducted by Aurcana, and its predecessors, between 1999 and 2018, all necessary permits and approvals are current and in good standing. Numerous permits, approvals, and operating plans are required to permit mining operations at Shafter, plus numerous supporting studies. A comprehensive list of permits and approvals required by regulatory authorities may be found in Table 4.2, and Table 20.1 of this document. Section 20.0 contains additional details on each permit. The activities and work recommended in Section 26 of this report can be completed with existing permits. The authors are not aware of any other significant factors or risks that may affect access, title or the right or ability to preform work on the Shafter property.
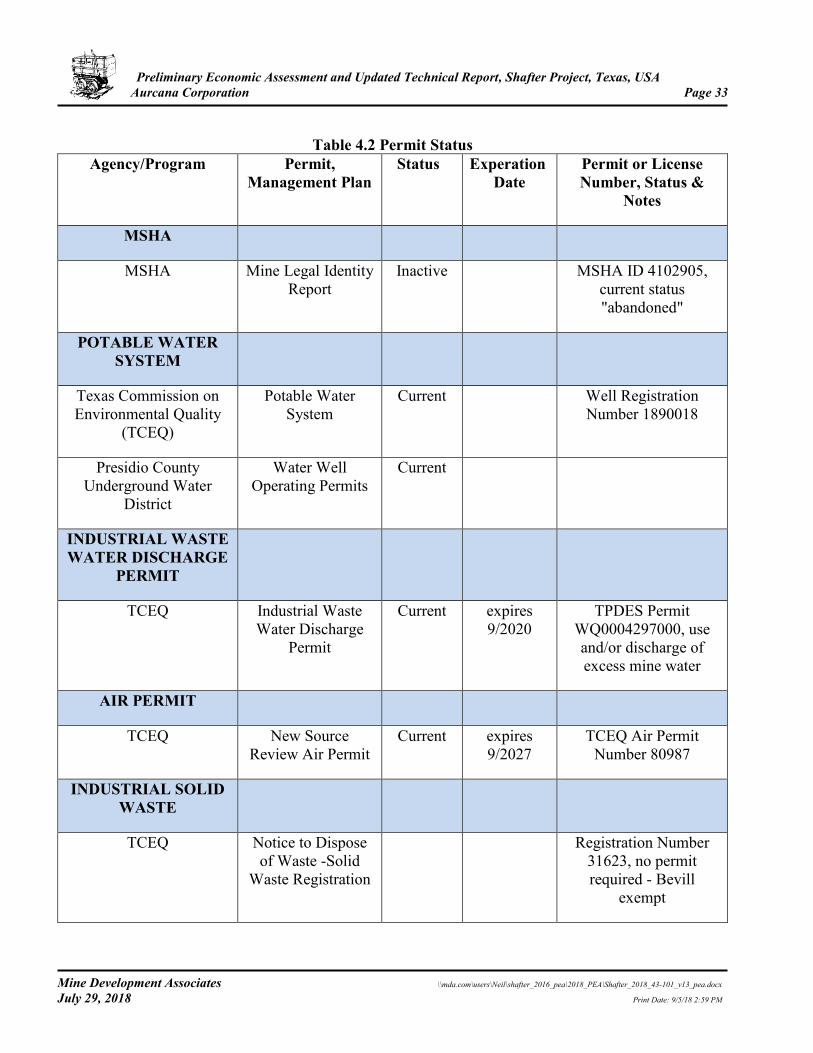
Preliminary Economic Assessment and Updated Technical Report, Shafter Project, Texas, USA Aurcana Corporation Page 33
Mine Development Associates \\mda.com\users\Neil\shafter_2016_pea\2018_PEA\Shafter_2018_43-101_v13_pea.docx July 29, 2018 Print Date: 9/5/18 2:59 PM
Table 4.2 Permit Status
Agency/Program Permit, Management Plan
Status Experation Date
Permit or License Number, Status &
Notes
MSHA
MSHA Mine Legal Identity Report
Inactive MSHA ID 4102905, current status "abandoned"
POTABLE WATER SYSTEM
Texas Commission on Environmental Quality
(TCEQ)
Potable Water System
Current Well Registration Number 1890018
Presidio County Underground Water
District
Water Well Operating Permits
Current
INDUSTRIAL WASTE WATER DISCHARGE
PERMIT
TCEQ Industrial Waste Water Discharge
Permit
Current expires 9/2020
TPDES Permit WQ0004297000, use and/or discharge of excess mine water
AIR PERMIT
TCEQ New Source Review Air Permit
Current expires 9/2027
TCEQ Air Permit Number 80987
INDUSTRIAL SOLID WASTE
TCEQ Notice to Dispose of Waste -Solid
Waste Registration
Registration Number 31623, no permit required - Bevill
exempt
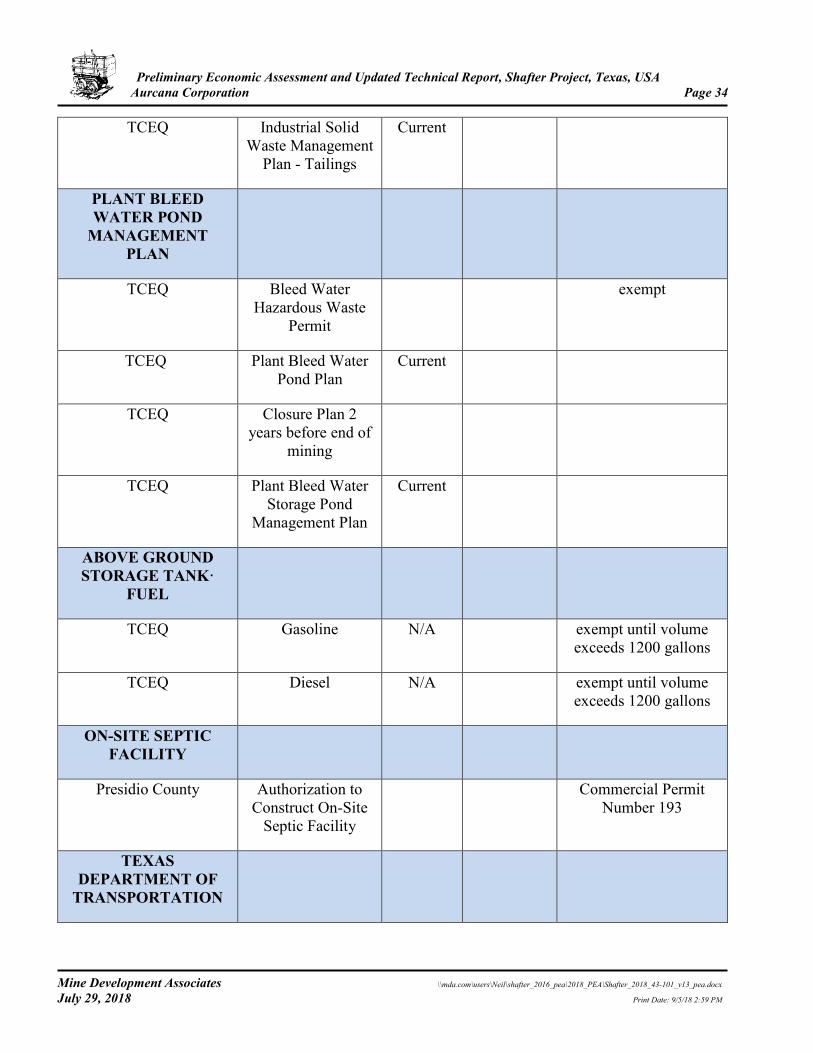
Preliminary Economic Assessment and Updated Technical Report, Shafter Project, Texas, USA Aurcana Corporation Page 34
Mine Development Associates \\mda.com\users\Neil\shafter_2016_pea\2018_PEA\Shafter_2018_43-101_v13_pea.docx July 29, 2018 Print Date: 9/5/18 2:59 PM
TCEQ Industrial Solid Waste Management
Plan - Tailings
Current
PLANT BLEED WATER POND
MANAGEMENT PLAN
TCEQ Bleed Water Hazardous Waste
Permit
exempt
TCEQ Plant Bleed Water Pond Plan
Current
TCEQ Closure Plan 2 years before end of
mining
TCEQ Plant Bleed Water Storage Pond
Management Plan
Current
ABOVE GROUND STORAGE TANK·
FUEL
TCEQ Gasoline N/A exempt until volume exceeds 1200 gallons
TCEQ Diesel N/A exempt until volume exceeds 1200 gallons
ON-SITE SEPTIC FACILITY
Presidio County Authorization to Construct On-Site
Septic Facility
Commercial Permit Number 193
TEXAS DEPARTMENT OF
TRANSPORTATION
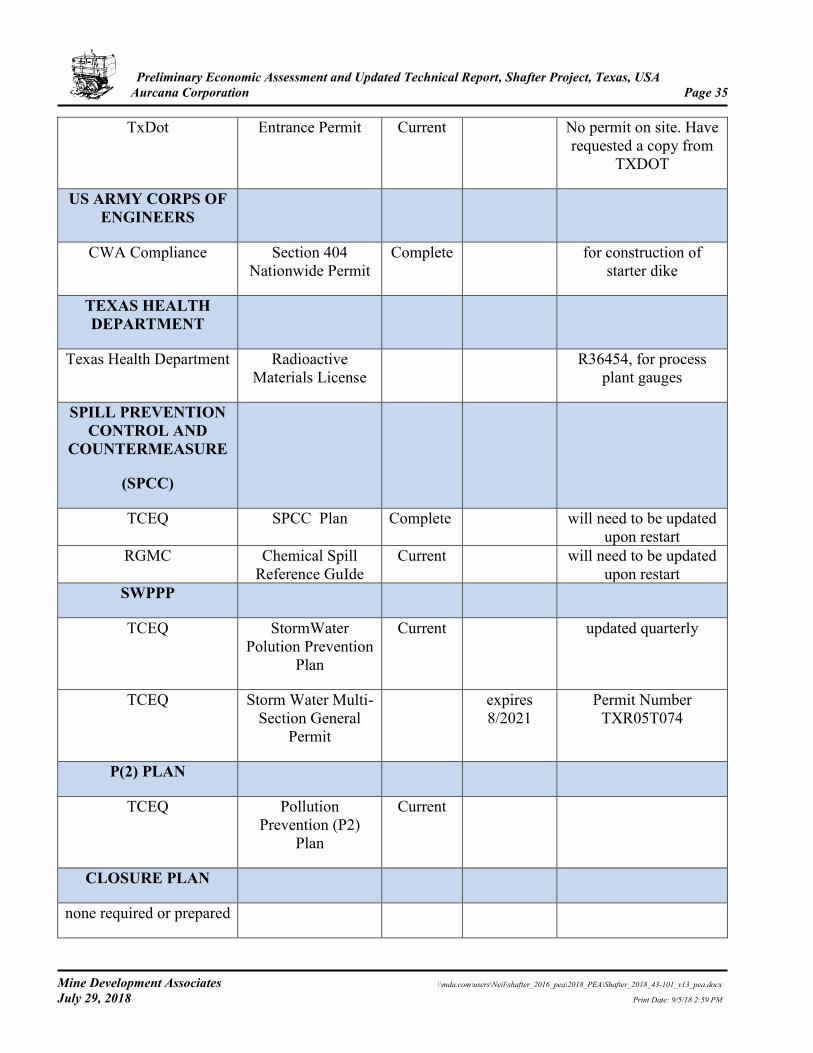
Preliminary Economic Assessment and Updated Technical Report, Shafter Project, Texas, USA Aurcana Corporation Page 35
Mine Development Associates \\mda.com\users\Neil\shafter_2016_pea\2018_PEA\Shafter_2018_43-101_v13_pea.docx July 29, 2018 Print Date: 9/5/18 2:59 PM
TxDot Entrance Permit Current No permit on site. Have requested a copy from
TXDOT
US ARMY CORPS OF ENGINEERS
CWA Compliance Section 404 Nationwide Permit
Complete for construction of starter dike
TEXAS HEALTH DEPARTMENT
Texas Health Department Radioactive Materials License
R36454, for process plant gauges
SPILL PREVENTION CONTROL AND
COUNTERMEASURE
(SPCC)
TCEQ SPCC Plan Complete will need to be updated upon restart
RGMC Chemical Spill Reference GuIde
Current will need to be updated upon restart
SWPPP
TCEQ StormWater Polution Prevention
Plan
Current updated quarterly
TCEQ Storm Water Multi-Section General
Permit
expires 8/2021
Permit Number TXR05T074
P(2) PLAN
TCEQ Pollution Prevention (P2)
Plan
Current
CLOSURE PLAN
none required or prepared
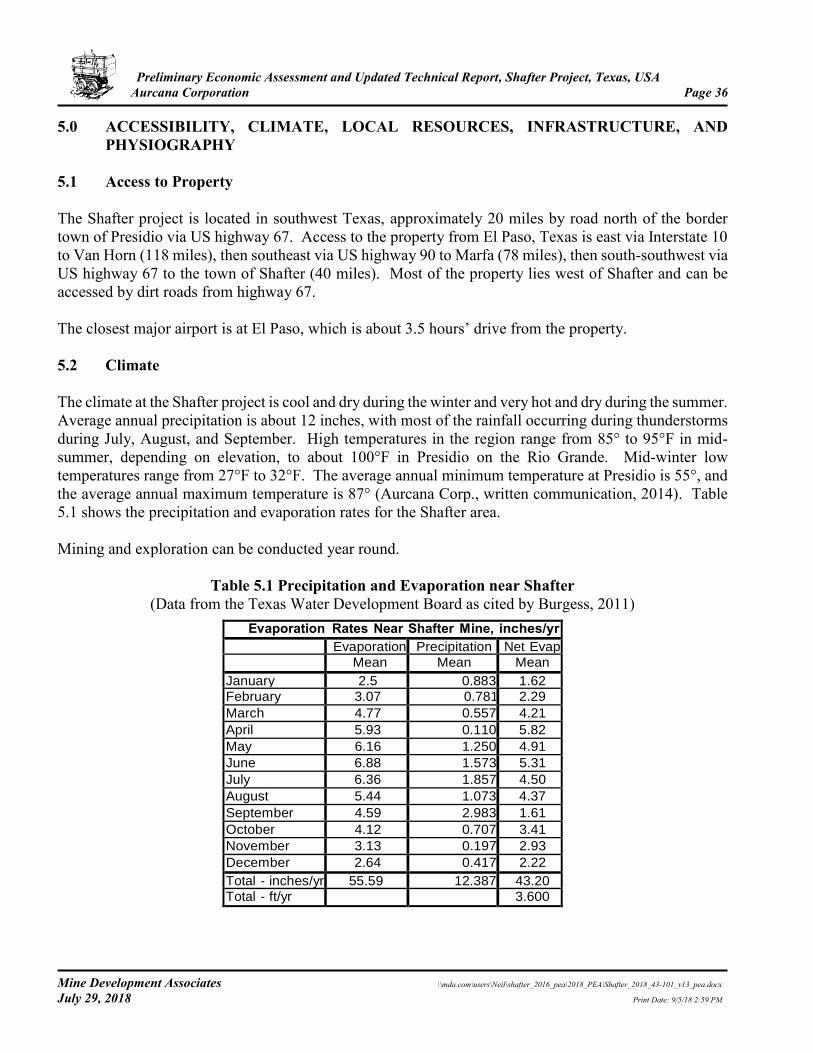
Preliminary Economic Assessment and Updated Technical Report, Shafter Project, Texas, USA Aurcana Corporation Page 36
Mine Development Associates \\mda.com\users\Neil\shafter_2016_pea\2018_PEA\Shafter_2018_43-101_v13_pea.docx July 29, 2018 Print Date: 9/5/18 2:59 PM
5.0 ACCESSIBILITY, CLIMATE, LOCAL RESOURCES, INFRASTRUCTURE, AND PHYSIOGRAPHY
5.1 Access to Property The Shafter project is located in southwest Texas, approximately 20 miles by road north of the border town of Presidio via US highway 67. Access to the property from El Paso, Texas is east via Interstate 10 to Van Horn (118 miles), then southeast via US highway 90 to Marfa (78 miles), then south-southwest via US highway 67 to the town of Shafter (40 miles). Most of the property lies west of Shafter and can be accessed by dirt roads from highway 67. The closest major airport is at El Paso, which is about 3.5 hours’ drive from the property. 5.2 Climate The climate at the Shafter project is cool and dry during the winter and very hot and dry during the summer. Average annual precipitation is about 12 inches, with most of the rainfall occurring during thunderstorms during July, August, and September. High temperatures in the region range from 85° to 95°F in mid-summer, depending on elevation, to about 100°F in Presidio on the Rio Grande. Mid-winter low temperatures range from 27°F to 32°F. The average annual minimum temperature at Presidio is 55°, and the average annual maximum temperature is 87° (Aurcana Corp., written communication, 2014). Table 5.1 shows the precipitation and evaporation rates for the Shafter area. Mining and exploration can be conducted year round.
Table 5.1 Precipitation and Evaporation near Shafter (Data from the Texas Water Development Board as cited by Burgess, 2011)
Evaporation Rates Near Shafter Mine, inches/yr Evaporation Precipitation Net Evap
Mean Mean Mean
January 2.5 0.883 1.62
February 3.07 0.781 2.29
March 4.77 0.557 4.21
April 5.93 0.110 5.82
May 6.16 1.250 4.91
June 6.88 1.573 5.31
July 6.36 1.857 4.50
August 5.44 1.073 4.37
September 4.59 2.983 1.61
October 4.12 0.707 3.41
November 3.13 0.197 2.93
December 2.64 0.417 2.22
Total - inches/yr 55.59 12.387 43.20
Total - ft/yr 3.600
Preliminary Economic Assessment and Updated Technical Report, Shafter Project, Texas, USA Aurcana Corporation Page 37
Mine Development Associates \\mda.com\users\Neil\shafter_2016_pea\2018_PEA\Shafter_2018_43-101_v13_pea.docx July 29, 2018 Print Date: 9/5/18 2:59 PM
5.3 Physiography The Shafter project area is located on the southern side of the Chinati Mountains in rugged, high-desert terrain, on the slopes above the Rio Grande valley to the south. Cibolo Creek is the major perennial stream in the area, which joins the Rio Grande at Presidio. Elevations range from 3,800ft at the town of Shafter, on Cibolo Creek, to 4,200ft at the western end of the property. Vegetation in this rugged, high-desert terrain is mainly cactus and succulents. 5.4 Local Resources and Infrastructure Presidio, Texas, is the nearest population center and a source of supplies and labor, with a population of 3,959 in 2016 (U.S. Census Bureau). Cibolo Creek flows year-round through Shafter (Kastelic, 1983). Mine-water inflow is estimated to be approximately 350 gpm, based on measurements made by Gold Fields Mining Corporation between 1979 and 1982 (Balfour Holdings, Inc., 2000; Burgess, 2011). This amount was expected to be sufficient for mill processing requirements, with any excess disposed of pursuant to permit requirements (Balfour Holdings, Inc., 2000; Burgess, 2011). American Electric Power (“AEP”) generates and transmits electricity in the region. Electric power at Shafter is supplied by a north-south transmission line installed by AEP parallel to an existing 69kV electric line (West Texas County Courier, 2012). A high-voltage substation owned by AEP is situated on the northwestern part of the Shafter property but will require larger-capacity transformers to meet future needs of the project (Burgess, 2011). Gold Fields Mining Corporation built a 7ft-diameter exploration and production shaft and a separate rescue-ventilation shaft, two hoists, and shop buildings at Shafter (Balfour Holdings, Inc., 2000; Burgess, 2011). In addition, there are an air compressor and mine pumps at the site. In 2003, Silver Standard relocated a 900-ton-per-day mill to the site. In 2011 Aurcana constructed a 1,500 ton-per-day mill on site. Section 18 describes the site infrastructure in more detail.
During 2015 the Company was approached by representatives of Trans Pecos Pipeline LLC who have constructed a buried 42-inch natural gas pipeline from the Permian Basin of west-central Texas to Presidio, Texas, for delivery in to customers in Chihuahua, Mexico. The route of the pipeline passes through the Shafter property. As currently surveyed (Figure 5.1), the pileline route should not materially impact any resumption of near-term mining activities. Figure 5.1 shows the site infrastructure, with the pipeling shown in magenta.
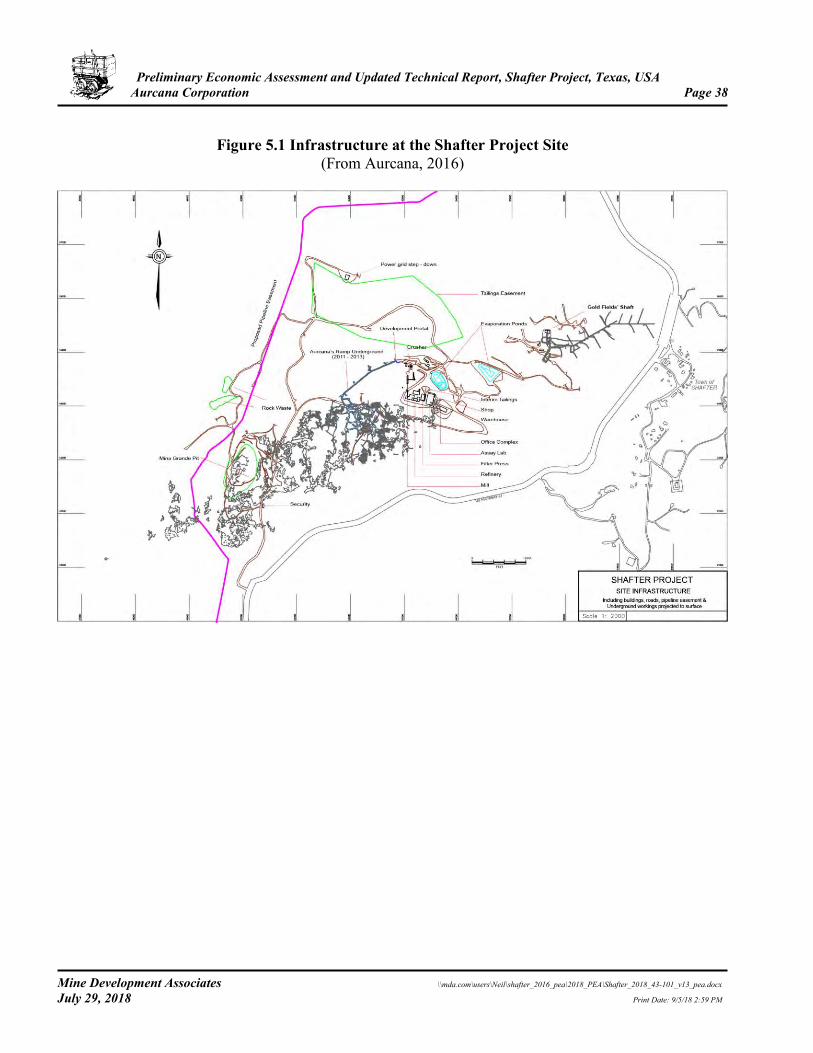
Preliminary Economic Assessment and Updated Technical Report, Shafter Project, Texas, USA Aurcana Corporation Page 38
Mine Development Associates \\mda.com\users\Neil\shafter_2016_pea\2018_PEA\Shafter_2018_43-101_v13_pea.docx July 29, 2018 Print Date: 9/5/18 2:59 PM
Figure 5.1 Infrastructure at the Shafter Project Site
(From Aurcana, 2016)
Preliminary Economic Assessment and Updated Technical Report, Shafter Project, Texas, USA Aurcana Corporation Page 39
Mine Development Associates \\mda.com\users\Neil\shafter_2016_pea\2018_PEA\Shafter_2018_43-101_v13_pea.docx July 29, 2018 Print Date: 9/5/18 2:59 PM
6.0 HISTORY The information provided is based on a review of the reports cited. The authors have determined that the information provided fairly represents the project history. 6.1 Exploration and Mining History The following information has been reviewed and summarized from Ross (1943), Kastelic (1983), Rio Grande Mining Co. (1998a, 1998b), Rossi and Springett (1995), Rozelle (2001), Rozelle and Tschabrun (2008), Balfour Holdings, Inc. (2000, including parts of a report by Pincock, Allen & Holt dated 2000b), and Smith (2011), with additional information as cited. It is thought that some old workings in the Shafter district may date back to early prospecting by Spanish explorers. Post-colonial mining in the Chinati Mountains began about 1860, when rancher John Spencer freighted several cartloads of silver ore to Mexico for smelting (Smith, 2011). The mineralized areas in the Shafter district were first discovered in 1880 or 1881 by Spencer or his Mexican workers. Spencer interested a group of U.S. Army officers stationed at Fort Davis in his discoveries, including Capt. (and later General) William R. Shafter. The first official mining company was the Presidio Mining Company, organized by these officers and others in 1881. Mining of the only exposed mineralized rock at the Mina Grande open pit began in 1883 but was not profitable until 1888. Mining continued underground at what became known as the Presidio mine and was continuous until 1913, with grades of 20 to 30oz Ag/ton as estimated from annual mine output, which averaged about 20,000 tons per year from 1898 to 1913. The mercury-based pan-amalgamation mill had 82 percent recovery. Mining methods were updated, and a cyanide mill was built in 1913. Mine output increased to more than 84,000 tons per year through to 1926, but grade decreased to about 10oz Ag/ton. From 1913 to 1926, total recorded production from Shafter was 1,150,000 tons grading 17oz Ag/ton for a total of 19,550,000 ounces of silver (Pincock, Allen & Holt, 2000b, included in part as an appendix in Balfour Holdings, Inc., 2000). The American Metal Company of Texas acquired the Shafter property in 1926 and subsequently merged with Climax Molybdenum Company to form American Metal Climax, Inc. (“Amax”); throughout the rest of this report, “Amax” will be used to refer to American Metal Co. as well as American Metal Climax, Inc. Amax conducted both surface and underground drilling; the database used for the estimate described in this technical report includes 1,048 Amax drill holes totaling 178,634 feet. Amax’s annual production from the Presidio mine decreased to 50,000 tons, but at a grade of over 20oz Ag/ton from 1927 to 1929. Much of Amax’s and also Presidio’s earlier production was based on processing hand-cobbed, sorted ore. Production continued through 1940, except for a period in 1930 to 1934 when the price of silver decreased. When operations resumed in 1934, the facilities were expanded to a capacity of milling approximately 140,000 tons per year. An average grade of nearly 20oz Ag/ton was maintained at first, but the grade declined with an increase in the mined tonnage. In the final full year of production, the mine produced 140,503 tons at an average grade of 9.39oz Ag/ton. The mine was closed in August 1942 due to the War Production Board Limitation Order L-208, and at that time the mill feed grades had dropped to an average of 8.5oz Ag/ton. Upon closure in 1942, the rails and hand carts were pulled and shipped for scrap metal as part of the war effort. Smith (2011) cited the apparent decline of the deposit’s silver grade, diminished reserves, water flooding in the lower levels, and a wartime shortage of miners as other reasons for closure. Kastelic (1983) reported that the Presidio mine was dry to the 950 level, but after the operations ceased,
Preliminary Economic Assessment and Updated Technical Report, Shafter Project, Texas, USA Aurcana Corporation Page 40
Mine Development Associates \\mda.com\users\Neil\shafter_2016_pea\2018_PEA\Shafter_2018_43-101_v13_pea.docx July 29, 2018 Print Date: 9/5/18 2:59 PM
the workings were flooded back to the 850 level. From 1926 to 1942, Amax mined 1,156,800 tons of material grading 13.49oz Ag/ton and containing 15.6 million ounces of silver, of which they recovered 13.57 million ounces of silver, 5,982 ounces of gold, and 4, 195 tons of lead. This implies a silver recovery rate of 87% (Pincock, Allen & Holt, 2000b, included in part as an appendix in Balfour Holdings, Inc., 2000). Total recorded production from the Presidio mine from 1883 to 1942 was 2,306,800 tons of ore containing 35,153,466 ounces of silver, for an average grade of 15.2oz Ag/ton. Recovery from the mill was 82 percent from 1883 to about 1912, increasing to 84 percent until about 1926, when it increased again to 90 percent, until the mine closed in 1930. When the mine reopened in 1934, recovery from the mill was 85 percent until the mine closed in 1942 (Balfour Holdings, Inc., 2000). By 1942, the Presidio mine had been developed to the 900 level. Elsewhere in the Shafter district about 14 smaller lead-silver + zinc and gold mines and prospects operated west of the Presidio mine from about 1890 to the 1930s. The Stauber and Gleim mines appear to be on Aurcana’s property in Section 6, southwest of the Presidio mine. The Perry and Chinati mines are also within Aurcana’s property, in Section 2, west of the Presidio mine. In 1946, M. F. Drunzer leased the Presidio mine and mined ore from the supporting pillars until 1947. The district was quiet until Phelps Dodge commenced evaluation of the Red Hills intrusion, five miles west of the Presidio mine, when copper prices increased in the 1950s. In the 1970s, Duval Corporation (“Duval”) drilled approximately 80 holes into the Red Hills intrusion and outlined a copper-molybdenum porphyry zone. Duval also undertook a regional exploration program involving geochemical and geophysical surveys to search for other mineralized zones. Teton Exploration Drilling Company drilled about seven rotary holes near the Presidio mine in the early 1970s, hoping to find silver-lead-zinc mineralization west and south of the old workings along the Mina Grande fault. Although they intersected silver-lead-zinc mineralization in some of their holes, especially near old workings, the results were generally inconclusive (Kastelic, 19893). They abandoned the project in 1974. Osceola Metals Corporation drilled eight air-hammer holes totaling 6,000ft about 3,000ft west-southwest of the Presidio mine, but not on property currently controlled by Aurcana, in 1970. Two of the eight holes intersected strong lead-zinc mineralization with weak silver and gold, generally as fracture/vein-related mineralization in Cretaceous sedimentary rocks (Kastelic, 1983). Gold Fields Mining Corporation (“Gold Fields”) (then called Azcon Corporation’s Mining and Exploration Division, a subsidiary of Consolidated Gold Fields Ltd.) acquired the Shafter property in 1977 from Amax. From 1977 to 1983, Gold Fields spent over $20 million on exploration and development work in the Shafter silver district that included surface and underground mapping, sampling, and drilling, as well as extensive metallurgical test work. They drilled 355 core holes totaling 307,925ft from October 1977 to April 1983 (Kastelic, 1983); MDA notes that the 2013 database contains a total of 403 surface and underground core holes attributed to Gold Fields, totaling 218,855ft but cannot account for the difference. About 30 of these holes were drilled on the regional trend extending from the Presidio mine four miles west to the Red Hills. Through a systematic surface-drilling program, Gold Fields identified

Preliminary Economic Assessment and Updated Technical Report, Shafter Project, Texas, USA Aurcana Corporation Page 41
Mine Development Associates \\mda.com\users\Neil\shafter_2016_pea\2018_PEA\Shafter_2018_43-101_v13_pea.docx July 29, 2018 Print Date: 9/5/18 2:59 PM
the northeastern, down-dip extension of the Shafter deposit, extending the deposit more than 5,000ft from the lowest development work in the Presidio mine. (The name “Shafter deposit” as used in this report refers to the entire deposit, of which part was previously mined at the old Presidio mine.) Gold Fields sank two 1,000ft-deep shafts, conducted 5,100ft of underground drifting, performed 9,510ft of underground core and 1,346ft of underground percussion drilling, and mined 8,000 tons of material for metallurgical testing to confirm tonnages and grades (Rossi and Springett, 1995; Pincock, Allen & Holt, 2000b). MDA notes that the database contains 7,719ft of underground core drilling done by Gold Fields, but no percussion drilling data. A comparison between the results of detailed underground sampling and diamond drilling from the surface indicated that the actual silver grade may be as much as 10 percent higher than the grade determined by surface drilling (Gold Fields, 1982). Gold Fields’ underground work in Block I (see Figure 6.1) found silver grades to be 15 percent higher than what had been indicated by surface drilling in the same area (Balfour Holdings, Inc., 2000). Gold Fields conducted extensive geophysical work in an attempt to acquire a geophysical signature of the deposit that could be used to generate additional targets (Kastelic, 1983). Audio-magneto tellurics (“AMT”) gave a distinct anomaly, but other methods failed to detect the Shafter deposit. Gravity surveying identified an east-trending ridge, generally coincident with the deposit, that probably represented a deep-seated feature such as a lineament or an old shoreline. Induced polarization and dipole-dipole resistivity surveying failed to show anomalies over the Shafter deposit, probably due to strong oxidation of the mineralization. Ground magnetometer surveys located dikes but did not detect the deposit. Two seismic reflection lines were run over the deposit, but results were ambiguous because shot-holes were not deep enough to impart sufficient energy into the ground. A deep-level gradient-array resistivity survey was conducted in early 1981, which showed an anomaly coincident with the erosional edge of the Mina Grande Formation, but poor results were obtained from several holes drilled on other anomalies. An AMT survey initiated in January 1983 produced an anomaly that was generally coincident with the Shafter silver deposit, and subsequent surveys were conducted over large tracts of Duval and Gold Fields land in the Red Hills area. Six north-south lines were run across Sections 33, 34, 186, 187, and 2. Several of the additional anomalies were drilled, but no mineralization similar to that in the Shafter deposit was intersected. Gold Fields also carried out detailed mapping and soil-grid, rock-chip, and fault sampling on the property. Surface geochemical sampling generally did not detect the Shafter deposit, probably due to its great depth from the surface (about 1,000ft) (Kastelic, 1983). Limited large-scale mapping and sampling were carried out in specific areas of interest, such as the Montezuma prospect, which is located within the current property boundary, and the Sullivan mine, located outside the current property boundary. A photo-geological study of much of Presidio County was completed in 1981 and identified several structural and alteration features that were examined on the ground. In addition to their work in the vicinity of the Presidio mine, from April 1980 to March 1983 Gold Fields conducted regional mapping, soil sampling, and drilling between Shafter and the Sullivan mine, located about 5.25 miles west of the Presidio mine. This work identified scattered occurrences of silver, zinc, and gold mineralization within the Shafter district and was part of a joint venture with Duval, with Gold Fields as the operator. The joint venture obtained two north-trending gravity profiles – one over the Red Hills stock and one just west of Section 34 – in October 1982 in an attempt to define the lateral limits of the Red Hills stock under Quaternary gravels (Naylor, 1982). The joint venture also engaged EM Technology, of Boulder, Colorado, to conduct controlled-source AMT surveys in the Shafter and Red Hills areas in
Preliminary Economic Assessment and Updated Technical Report, Shafter Project, Texas, USA Aurcana Corporation Page 42
Mine Development Associates \\mda.com\users\Neil\shafter_2016_pea\2018_PEA\Shafter_2018_43-101_v13_pea.docx July 29, 2018 Print Date: 9/5/18 2:59 PM
early 1983, whose results are described above (Helming, 1983; Knox, 1983). Although Gold Fields stopped work on the Shafter deposit in April 1983 due to the collapse of silver prices, they held the property through most of 1994. In October 1994, Rio Grande Mining Company (“RGMC”), then a subsidiary of Belcor, Inc., and Silver Assets, Inc. (“Silver Assets”) acquired the Shafter project from Gold Fields. RGMC mapped and sampled the 40 and 80 levels of the old Presidio mine workings, sampled the stopes down to the 300 level, conducted additional drilling and sampling, and obtained all major permits necessary for commencement of operations by 2000 (Rozelle and Tschabrun, 2008; Rio Grande Mining Co., 1998a, 1998b). The drill-hole database used for the resource estimate described in this technical report includes 88 shallow reverse circulation (“RC”) holes drilled in 1999 by RGMC over the near-surface mineralization above the Presidio workings. They reported that hundreds of Amax and Gold Fields sample results painted on the ribs and back of the old workings showed that many significant areas with 5 to 15oz Ag/ton remained in the old workings (Rio Grande Mining Co., 1998a). Silver Assets acquired Belcor, Inc. and its subsidiary, Rio Grande, through a number of stock transactions in 1996, 1999, and 2002. Silver Assets was acquired by Silver Standard Resources Inc. (“Silver Standard”) through stock purchases in 2000. Aurcana purchased RGMC and thereby the Shafter property from Silver Standard in July 2008. Aurcana’s exploration of the project is described in Section 9.0.
Mining by Aurcana Corporation Aurcana re-entered the old Presidio mine through a new decline on June 1, 2012, and commercial production commenced on December 14, 2012, from material adjacent to and between Amax’s old stopes. In conjunction with its underground operations, Aurcana began open-pit mining of lower-grade material from the old Mina Grande pit at the Presidio mine on April 23, 2012. This open-pit mining was discontinued after the plant commissioning and testing phase were complete (Aurcana news releases, June 6, 2012; December 14, 2012). In addition to the mine and mill, Aurcana operated an on-site assay laboratory. Aurcana reported that from October 2012 through December 2013, mine production totaled 149,882 tons and mill feed from the mine totaled 109,599 tons. A total of 134,557 ounces of doré was poured. Due in part to a decline in silver prices, production ceased, and the mine was put on care and maintenance in December 2013. Aurcana’s underground operation consisted of cut-and fill and room-and-pillar methods. The size of the development headings was reduced in 2013 from 15ft x 15ft to 12ft x 12ft, cutting the size of a typical round from 216 tons to about 115 tons. At the time of MDA’s site visit in April 2013, mining averaged over 400 tons per day of material averaging 5oz Ag/ton based on mine channel samples, and two stopes were available for production. Water was said to be present on or below the 600-foot level in the area Aurcana was mining and at the 770 level in the Gold Fields’ shaft. Ore stockpiled at the surface of the mine was transported by 30-ton haul trucks to the processing plant, where crushing, grinding, leaching, and smelting were conducted. Ore was crushed in two stages, using a jaw crusher and a cone crusher. Crushed ore was fed to the grinding circuit and ground in a ball mill. Ground ore was conveyed to the leach circuit to undergo cyanide leaching. The pregnant solution passed
Preliminary Economic Assessment and Updated Technical Report, Shafter Project, Texas, USA Aurcana Corporation Page 43
Mine Development Associates \\mda.com\users\Neil\shafter_2016_pea\2018_PEA\Shafter_2018_43-101_v13_pea.docx July 29, 2018 Print Date: 9/5/18 2:59 PM
through filter presses on the way to a Merrill-Crowe precipitation circuit, where silver was precipitated by the addition of zinc dust. Precipitates were transferred to a smelter to separate silver from zinc. 6.2 Historical Mineral Resource Estimates The following has been modified from Tietz and MacFarlane (2016): The Shafter deposit has been divided along its east-west trend into five exploration sectors, called blocks (see Figure 6.1). These blocks were defined by RGMC based on topography, the old Presidio workings, and the primary drill targets of Gold Fields (Balfour Holdings, Inc., 2000). Block I, farthest to the east, includes the Shafter deposit from 53,750 East to 59,000 East; it includes the underground development by Gold Fields but has had no previous production. Block II includes the Shafter deposit from 52,300 East to 53,750 East; it had a limited amount of production from the deepest workings of Amax’s Presidio mine. Block III extends from 51,000 East to 52,300 East and includes extensive areas of production by Amax in the Presidio mine along with the 2013 and 2013 RGMC production. Block IV includes mineralized rock immediately east of the Mina Grande fault and extends from 49,600 East to 51,000 East; it was also mined extensively from Amax’s Presidio mine. Block V, the westernmost block, extends from 45,500 East to 49,600 East and includes mineralized areas immediately west of the Mina Grande fault; this part of the deposit was mined to a limited degree by Amax. Various historical mineral resource and reserve estimates are described in Section 6.2. Terminology shown in quotation marks is as described by the original authors and may not represent current classifications. A qualified person has not done sufficient work to classify the historical estimates described in this section as current mineral resources or mineral reserves, and Aurcana is not treating the historical estimates as current mineral resources or mineral reserves. These historical resource estimates should not be relied upon. These historical estimates are superseded by the current mineral resource estimate described in Section 14.0.
Gold Fields Mining Corp. The following information is taken from an economic feasibility study conducted by Gold Fields in 1982 (Gold Fields Mining Corp., 1982), with additional information from Cracraft and Williams (1982) and Rossi and Springett (1995). Gold Fields drilled the down-dip extension of the Shafter deposit from the surface and partially developed it with a shaft and underground workings in the late 1970s and early 1980s; the down-dip extension is shown as Blocks I and II on Figure 6.1. The first “ore reserve calculations” were made in 1979 using data from 44 surface core holes. Kriging was used for the estimate, and the results were compared with results derived from conventional polygonal analysis. This first estimate yielded “reserves” of 4.175 million tons at an average grade of 6.40oz Ag/ton (elsewhere in the Gold Fields report these “reserves” are said to total 4.275 million tons; MDA cannot reconcile this conflict).
Gold Fields completed an in-house economic feasibility study of the Shafter deposit in 1982. Based on this study, they reported a “geologic silver resource” of 4.47 million tons at an average grade of 6.32oz Ag/ton, for a total of approximately 28 million ounces of silver. Gold Fields estimated a “geologic ore reserve” of 4.49 million tons averaging 6.32oz Ag/ton using block kriging; a second estimate using the
Preliminary Economic Assessment and Updated Technical Report, Shafter Project, Texas, USA Aurcana Corporation Page 44
Mine Development Associates \\mda.com\users\Neil\shafter_2016_pea\2018_PEA\Shafter_2018_43-101_v13_pea.docx July 29, 2018 Print Date: 9/5/18 2:59 PM
polygonal method yielded 4.08 million tons grading 6.03oz Ag/ton. The estimates were based on an 8ft minimum mining height with a cutoff grade of 3oz Ag/ton. The “total ore reserve” based on block kriging was based on 52 surface core holes and was estimated by Gold Fields’ Lakewood staff. The “reserve” based on the polygonal method used 57 surface core holes and was performed by the Shafter geological staff. The “geologic ore reserve” was diluted to a “mineable reserve” of 4.675 million tons at an average mill-head grade of 5.65oz Ag/ton, containing 26,406,409 ounces of silver. The 1982 “mineable reserve” included only the mineralization in the Shafter deposit discovered by Gold Fields and did not include an additional 1.2 million tons of “inferred ore” in unmined areas of the old Presidio mine. In 1982, the COMEX average silver price was $7.93 per ounce. Gold Fields used a tonnage factor of 11.65 cubic feet/ton to calculate their resource and reserve estimates (Rozelle and Tschabrun, 2008).
Rio Grande Mining Company 1995 GeoSystems International, Inc. and Altamira Mining and Exploration LLC. prepared a “resource estimate” for the Shafter project in December 1995 (Rossi and Springett, 1995). Only Gold Fields’ surface and underground drill-hole samples and some older Amax surface holes were used. Rossi and Springett (1995) noted that there were a significant number of sample intervals with poor recoveries, many of which correspond to higher-grade mineralization that is typically more friable than the rest. They developed a geologic block model of the Shafter deposit and used multiple indicator kriging to estimate the grade of the blocks. A polygonal technique was also used as a separate check on the grade estimates. The geologic model was based on envelopes drawn at a 3.0oz Ag/ton cutoff, using a minimum 6ft thickness. The envelopes were developed on section and then wire-framed to create a three-dimensional volume of the mineralization. Mineralized blocks measured 50 by 20 by 6ft. Contact dilution, internal dilution, and ore loss were not considered. At a cutoff of 3.0oz Ag/ton, they estimated “global in situ resources” of approximately 3.57 million tons with a grade of 6.36oz Ag/ton for approximately 22.7 million contained ounces of silver.
Rio Grande Mining Co. and Pincock, Allen & Holt 1998 and 1999 RGMC made several estimates of the Shafter silver deposit in 1998 and 1999 that are described by Balfour Holdings, Inc. (2000). The most recent “polygonal silver resources” estimated by RGMC as of 2000 are shown on Table 6.1, using cutoffs that can be compared to other historical estimates. This estimate (Table 6.1) assumed a 6ft minimum height for underground mining and included Blocks I through V, which extended from east of Highway 67 to west of the Mina Grande fault (Figure 6.1). No date for this estimate in Table 6.1 is given by Balfour Holdings, Inc. except that it is more recent than the 1999 estimate that is described below and shown on Table 6.2. The polygonal dimensions used by Gold Fields in their 1982 “reserve” estimates were used by RGMC for the estimate in Table 6.1.
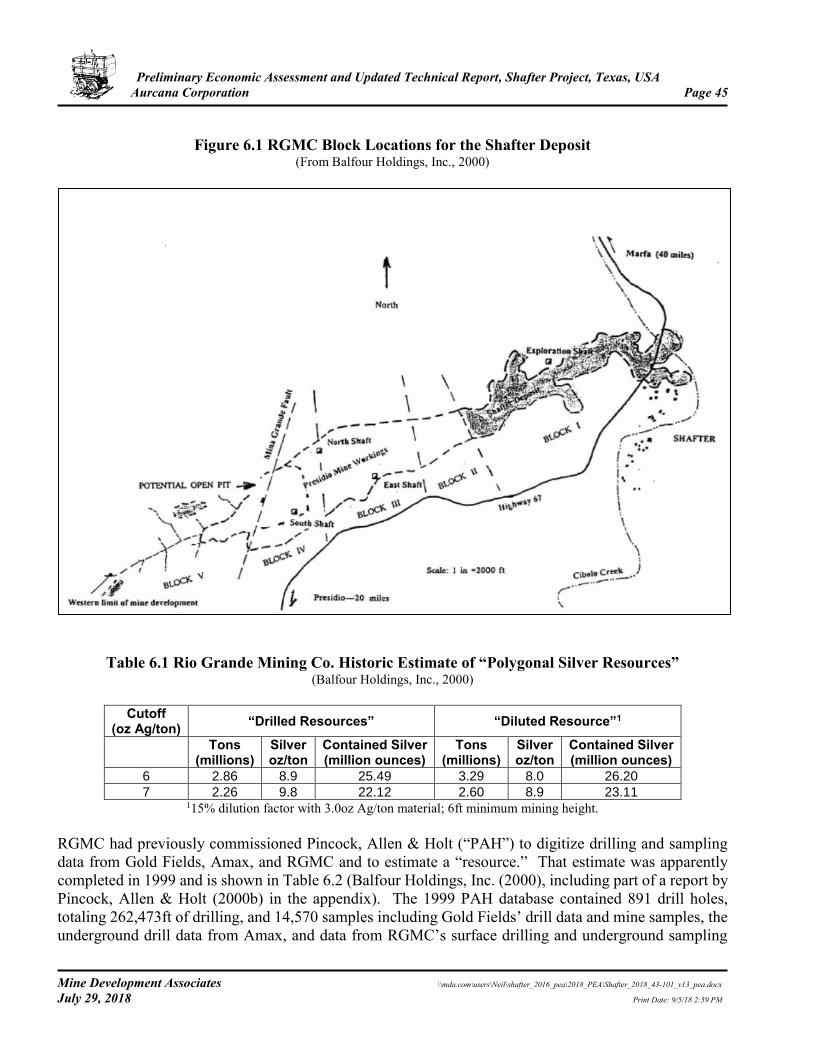
Preliminary Economic Assessment and Updated Technical Report, Shafter Project, Texas, USA Aurcana Corporation Page 45
Mine Development Associates \\mda.com\users\Neil\shafter_2016_pea\2018_PEA\Shafter_2018_43-101_v13_pea.docx July 29, 2018 Print Date: 9/5/18 2:59 PM
Figure 6.1 RGMC Block Locations for the Shafter Deposit
(From Balfour Holdings, Inc., 2000)
Table 6.1 Rio Grande Mining Co. Historic Estimate of “Polygonal Silver Resources” (Balfour Holdings, Inc., 2000)
Cutoff
(oz Ag/ton) “Drilled Resources” “Diluted Resource”1
Tons (millions)
Silver oz/ton
Contained Silver (million ounces)
Tons (millions)
Silver oz/ton
Contained Silver (million ounces)
6 2.86 8.9 25.49 3.29 8.0 26.20
7 2.26 9.8 22.12 2.60 8.9 23.11 115% dilution factor with 3.0oz Ag/ton material; 6ft minimum mining height.
RGMC had previously commissioned Pincock, Allen & Holt (“PAH”) to digitize drilling and sampling data from Gold Fields, Amax, and RGMC and to estimate a “resource.” That estimate was apparently completed in 1999 and is shown in Table 6.2 (Balfour Holdings, Inc. (2000), including part of a report by Pincock, Allen & Holt (2000b) in the appendix). The 1999 PAH database contained 891 drill holes, totaling 262,473ft of drilling, and 14,570 samples including Gold Fields’ drill data and mine samples, the underground drill data from Amax, and data from RGMC’s surface drilling and underground sampling
Preliminary Economic Assessment and Updated Technical Report, Shafter Project, Texas, USA Aurcana Corporation Page 46
Mine Development Associates \\mda.com\users\Neil\shafter_2016_pea\2018_PEA\Shafter_2018_43-101_v13_pea.docx July 29, 2018 Print Date: 9/5/18 2:59 PM
programs.. Using the inverse distance cubed method to create a silver block model, PAH estimated the “geologic resource,” which included “measured, indicated, and inferred confidence categories” shown in Table 6.2. The estimation did not provide for any dilutional effects of mining and was based on a density factor of 12.0 cubic feet/ton.
Table 6.2 1999 Historic Pincock, Allen & Holt “Resource” Estimation (Balfour Holdings, Inc., 2000)
Cutoff
(oz Ag/ton) Tons
(millions) Silver oz/ton
Contained Silver (million ounces)
6 2.76 13.2 36.26
7 2.16 15.0 32.43
Balfour Holdings, Inc. (2000) noted that the main differences between the 1999 estimates of PAH (Table 6.2) and the presumably later “drilled resources” estimate of RGMC (Table 6.1) were in Block I, which contained the largest portion of the mineralization and which was based on a drill-hole spacing of 200ft. PAH did not assume continuity of mineralization between holes, but the polygonal method used by RGMC assumed continuity to the next hole along the strike of the deposit.
2001 Mineral Resource Estimate by Pincock, Allen & Holt for Silver Standard Resources Inc.
PAH prepared a technical report for Silver Standard in 2001 (Rozelle, 2001) that included a geologic resource estimate. Resources were estimated inside of a mineralized boundary that was developed using a 1.0oz Ag/ton limiting boundary and the drill-hole data. Individual model blocks were 25ft by 25ft in plan, with a block height of 3ft. Underground stopes, drifts, and cross-cuts were incorporated into the model to account for material removed by previous underground mining. The resources were estimated using polygonal and inverse distance to the third power methods and were based on a density factor of 12.0 cubic feet/ton applied to all material. Table 6.3 shows the 2001 geologic resource estimate for the total of all five exploration blocks at cutoffs of 6.0 and 7.0oz Ag/ton.
Table 6.3 2001 Historic Pincock, Allen & Holt Geologic Resource Estimation (From Rozelle, 2001)
Measured Indicated Measured + Indicated Inferred Cutoff
(oz Ag/ton)
Tons (thousands)
Ag oz/ton
Tons (thousands)
Ag oz/ton
Tons (thousands)
Ag oz/ton
Tons (thousands)
Ag oz/ton
6.0 503 11.26 1,061 11.76 1,564 11.60 1,191 15.20
7.0 388 12.68 788 13.60 1,176 13.30 986 17.03
MDA has not done sufficient work to classify these historical estimates as current mineral resources or mineral reserves, and Aurcana is not treating these historical estimates as current estimates. These historical resource estimates should not be relied upon. These historical estimates are superseded by the current mineral resource estimate described in Section 14.0.
Preliminary Economic Assessment and Updated Technical Report, Shafter Project, Texas, USA Aurcana Corporation Page 47
Mine Development Associates \\mda.com\users\Neil\shafter_2016_pea\2018_PEA\Shafter_2018_43-101_v13_pea.docx July 29, 2018 Print Date: 9/5/18 2:59 PM
7.0 GEOLOGIC SETTING AND MINERALIZATION The following information is the interpretation and conclusions of the qualified person. The authors have determined that the information provided fairly represents the project geologic setting and mineralization. 7.1 Geologic Setting
Regional Geology The following reports have provided background information on the regional geology: Balfour Holdings, Inc. (2000), Rozelle (2001), Rozelle and Tschabrun (2008), Gilmer et al. (2003), and parts of a report by Pincock, Allen & Holt (2000b) that were included in Balfour Holdings, Inc. (2000). Many of the world’s largest carbonate-hosted silver-lead-zinc deposits occur in northern Mexico, and some have been in production since the 1600s. These deposits were formed in thick carbonate-dominant Jurassic to Cretaceous basinal sedimentary sequences underlain by Paleozoic or older crust. The Mexican districts lie within, or on the margins of, a major fold and thrust zone. The areas of mineralization appear to be controlled by structures parallel to the trend of the fold and thrust belt. Mineralized and hydrothermally altered intrusive and volcanic rocks of Tertiary age are present in most districts. The styles of mineralization are characterized by geometrically irregular deposits that often have definite structural controls and are not conformable to stratigraphic contacts. All the carbonate-hosted deposits in northeastern Mexico lie in a tectono-stratigraphic terrain underlain by Paleozoic or older crust. There appears to be no consistent connection between carbonate rock type and mineralization. In some districts, mineralization occurred within numerous different carbonate strata and sedimentary facies through vertical intervals of over 3,000ft. In other places, specific strata or facies contain the bulk of the mineralized rocks. Overall, lithologic contrasts appear to be important, with many deposits containing mineralized zones in carbonate strata within, or below, relatively less-permeable rocks. Mineralization appears to have been controlled by a combination of folds, faults, fractures, fissures, and intrusive contacts that acted as structural conduits for mineralizing solutions. Mineralization apparently occurred between 47 and 26 Ma and is believed to be related to the mid-Tertiary Sierra Madre Occidental volcanic event (Megaw, Ruiz, and Titley, 1988). The regional geology of southwestern Texas is similar to that of northern Mexico, with a thick Jurassic-Cretaceous sedimentary basin overlying older Paleozoic basement (Figure 7.1). The sedimentary basin contains thick carbonate sequences which extend over 1,000 miles in length from southeastern Arizona and southern New Mexico through northern Mexico and southwestern Texas. This thick sequence of Mesozoic sedimentary rocks represents a transgressive succession deposited during the subsidence of the eastern part of the basin and the formation of an island-reef-basin environment. The carbonate rock formations in the basin sequence often exceed 10,000ft in thickness and consist of continuous sections of platform- and basin-deposited limestones with minor dolomite sequences. During the late Cretaceous-early Tertiary Laramide orogeny, the Jurassic-Cretaceous rocks in southwestern Texas were folded, overturned, and cut by thrust faults in the intensely deformed Chihuahua tectonic belt. To the east lies the relatively stable Diablo platform, where corresponding Cretaceous rocks
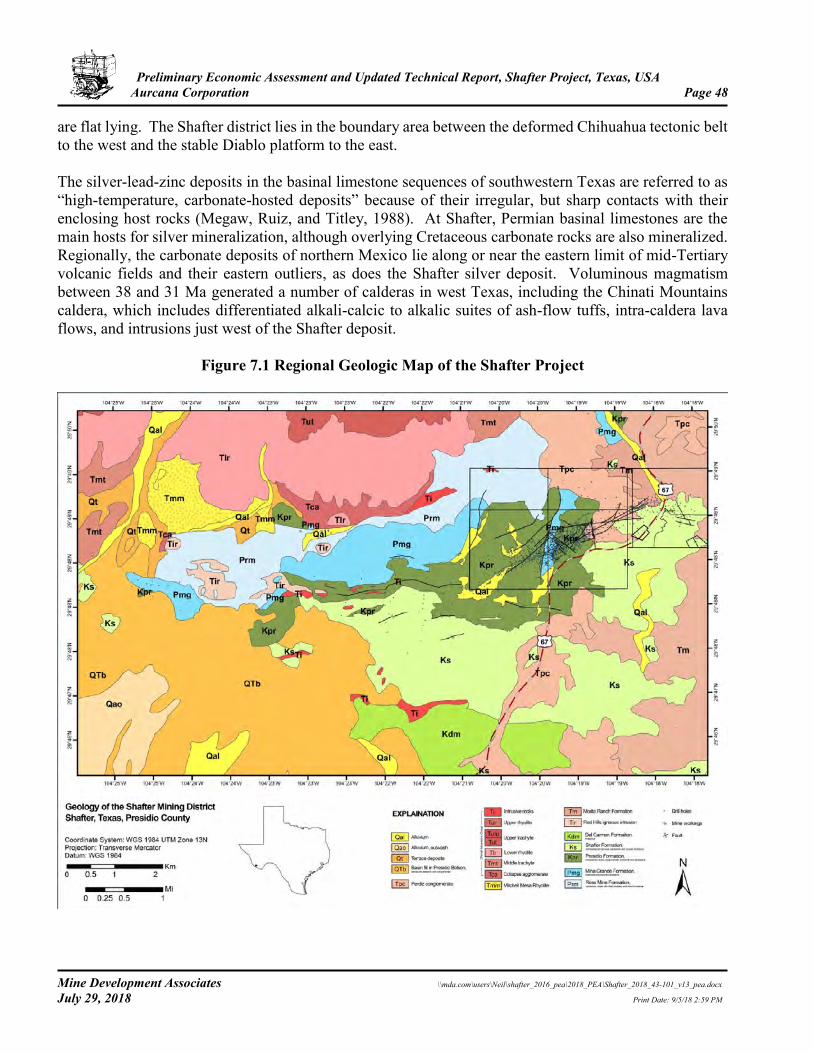
Preliminary Economic Assessment and Updated Technical Report, Shafter Project, Texas, USA Aurcana Corporation Page 48
Mine Development Associates \\mda.com\users\Neil\shafter_2016_pea\2018_PEA\Shafter_2018_43-101_v13_pea.docx July 29, 2018 Print Date: 9/5/18 2:59 PM
are flat lying. The Shafter district lies in the boundary area between the deformed Chihuahua tectonic belt to the west and the stable Diablo platform to the east. The silver-lead-zinc deposits in the basinal limestone sequences of southwestern Texas are referred to as “high-temperature, carbonate-hosted deposits” because of their irregular, but sharp contacts with their enclosing host rocks (Megaw, Ruiz, and Titley, 1988). At Shafter, Permian basinal limestones are the main hosts for silver mineralization, although overlying Cretaceous carbonate rocks are also mineralized. Regionally, the carbonate deposits of northern Mexico lie along or near the eastern limit of mid-Tertiary volcanic fields and their eastern outliers, as does the Shafter silver deposit. Voluminous magmatism between 38 and 31 Ma generated a number of calderas in west Texas, including the Chinati Mountains caldera, which includes differentiated alkali-calcic to alkalic suites of ash-flow tuffs, intra-caldera lava flows, and intrusions just west of the Shafter deposit.
Figure 7.1 Regional Geologic Map of the Shafter Project
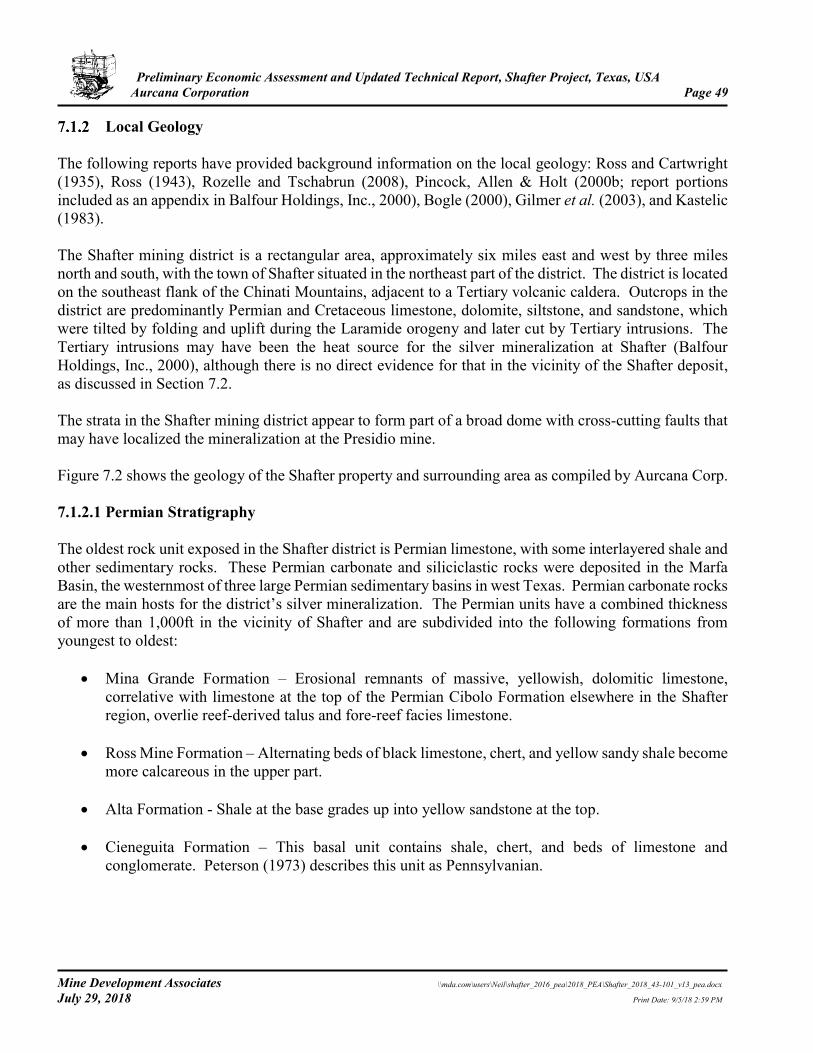
Preliminary Economic Assessment and Updated Technical Report, Shafter Project, Texas, USA Aurcana Corporation Page 49
Mine Development Associates \\mda.com\users\Neil\shafter_2016_pea\2018_PEA\Shafter_2018_43-101_v13_pea.docx July 29, 2018 Print Date: 9/5/18 2:59 PM
Local Geology The following reports have provided background information on the local geology: Ross and Cartwright (1935), Ross (1943), Rozelle and Tschabrun (2008), Pincock, Allen & Holt (2000b; report portions included as an appendix in Balfour Holdings, Inc., 2000), Bogle (2000), Gilmer et al. (2003), and Kastelic (1983). The Shafter mining district is a rectangular area, approximately six miles east and west by three miles north and south, with the town of Shafter situated in the northeast part of the district. The district is located on the southeast flank of the Chinati Mountains, adjacent to a Tertiary volcanic caldera. Outcrops in the district are predominantly Permian and Cretaceous limestone, dolomite, siltstone, and sandstone, which were tilted by folding and uplift during the Laramide orogeny and later cut by Tertiary intrusions. The Tertiary intrusions may have been the heat source for the silver mineralization at Shafter (Balfour Holdings, Inc., 2000), although there is no direct evidence for that in the vicinity of the Shafter deposit, as discussed in Section 7.2. The strata in the Shafter mining district appear to form part of a broad dome with cross-cutting faults that may have localized the mineralization at the Presidio mine. Figure 7.2 shows the geology of the Shafter property and surrounding area as compiled by Aurcana Corp. 7.1.2.1 Permian Stratigraphy The oldest rock unit exposed in the Shafter district is Permian limestone, with some interlayered shale and other sedimentary rocks. These Permian carbonate and siliciclastic rocks were deposited in the Marfa Basin, the westernmost of three large Permian sedimentary basins in west Texas. Permian carbonate rocks are the main hosts for the district’s silver mineralization. The Permian units have a combined thickness of more than 1,000ft in the vicinity of Shafter and are subdivided into the following formations from youngest to oldest:
• Mina Grande Formation – Erosional remnants of massive, yellowish, dolomitic limestone, correlative with limestone at the top of the Permian Cibolo Formation elsewhere in the Shafter region, overlie reef-derived talus and fore-reef facies limestone.
• Ross Mine Formation – Alternating beds of black limestone, chert, and yellow sandy shale become more calcareous in the upper part.
• Alta Formation - Shale at the base grades up into yellow sandstone at the top.
• Cieneguita Formation – This basal unit contains shale, chert, and beds of limestone and conglomerate. Peterson (1973) describes this unit as Pennsylvanian.
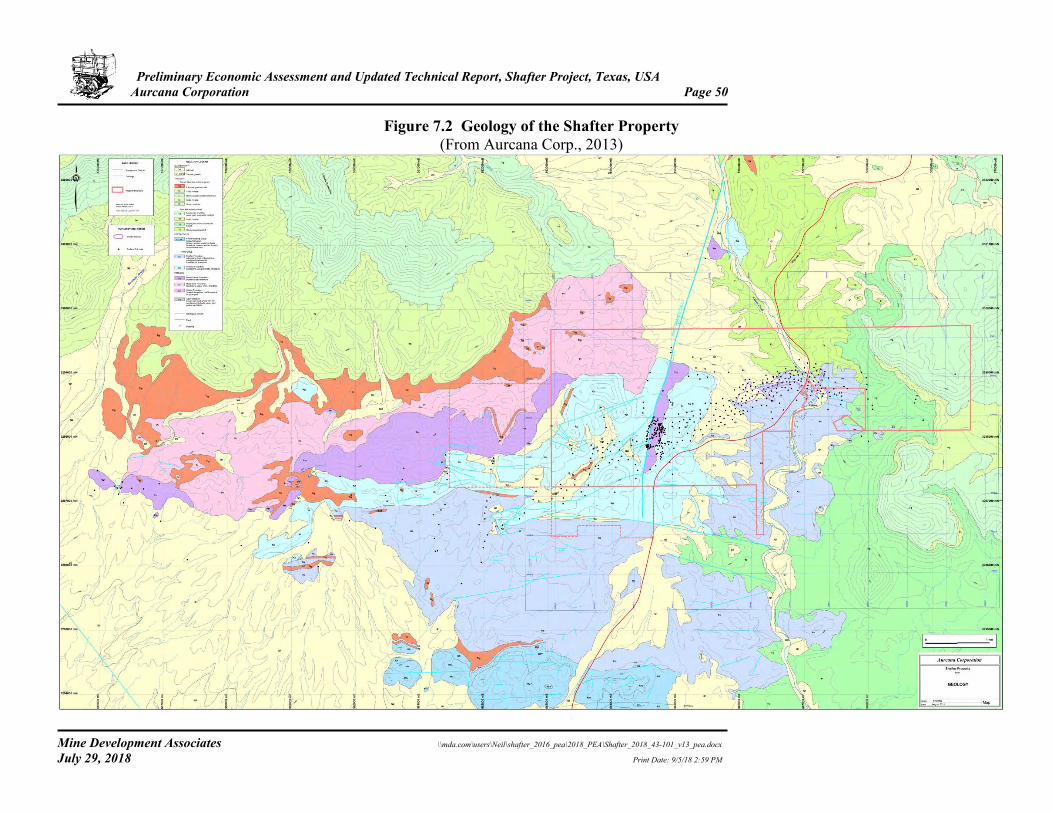
Preliminary Economic Assessment and Updated Technical Report, Shafter Project, Texas, USA Aurcana Corporation Page 50
Mine Development Associates \\mda.com\users\Neil\shafter_2016_pea\2018_PEA\Shafter_2018_43-101_v13_pea.docx July 29, 2018 Print Date: 9/5/18 2:59 PM
Figure 7.2 Geology of the Shafter Property (From Aurcana Corp., 2013)
Preliminary Economic Assessment and Updated Technical Report, Shafter Project, Texas, USA Aurcana Corporation Page 51
Mine Development Associates \\mda.com\users\Neil\shafter_2016_pea\2018_PEA\Shafter_2018_43-101_v13_pea.docx July 29, 2018 Print Date: 9/5/18 2:59 PM
7.1.2.2 Cretaceous Stratigraphy Cretaceous rocks of the Trinity Group unconformably overlie the Permian units in the Shafter district. The Trinity Group includes the Presidio Formation, which is 450ft thick, and the Shafter Limestone, which is greater than 1,000ft thick. The Cretaceous units cover much of the Permian strata and may be mineralized in places themselves. The Presidio Formation crops out near the Presidio mine and consists of five major subdivisions, although there is considerable lateral variation in lithology and thickness of the units:
• Cap Rock Unit - 25 to 50+ft thick with massive, hard, arenaceous limestone and some beds of calcareous sandstone
• Shell Breccia Unit - 110 to 165ft thick with soft sandstone, arenaceous limestone, and two rather thick shell breccias
• Tripartite Unit - 75ft+ thick with medium-bedded to massive limestone, shell breccia, and massive partly calcareous sandstone
• Conglomerate Unit - 90 to 120ft thick with arenaceous limestone, calcareous sandstone, and conglomerate
• Basal Unit - 50 to 90ft thick with soft marl, clay, arenaceous limestone, calcareous sandstone, and shell breccia.
The Shafter Limestone is exposed around the town of Shafter and forms a prominent range of hills about three miles southeast of Shafter. The unit rests unconformably on the Presidio Formation. The unit is of Upper Cretaceous age and is more than 1,000ft thick. The unit is primarily limestone with interlayers of marl and sandstone. The unit has less variation than the Presidio Formation, but facies changes from sandstone to limestone can be abrupt. Overlying the Shafter Limestone is the 80 to 120ft-thick Walnut Formation of the Fredericksburg Group. This unit is distinguished from the Shafter Limestone by having less limestone, a greater proportion of marl and clay, and very little sandstone. A thick succession of massive limestones overlies the Walnut Formation and was designated the Devils River Limestone (Ross, 1943). 7.1.2.3 Igneous Rocks Mid-Tertiary volcanic rocks are present along the edges of the Shafter district, and intrusions of andesite and diorite are present within the district, including at the Red Hills west of Aurcana’s property. In the central part of the Chinati Mountains and on the plateau east of Shafter, trachyte, rhyolite, andesite, and tuffs of Tertiary age are exposed. The Chinati Mountains Group of peralkaline rhyolite and trachyte flows and tuffs of Oligocene age is almost entirely confined to the Chinati Mountains caldera. The Chinati Mountains caldera, which has been dated at 32 Ma, was a major volcanic center that produced an alkali-calcic suite of ash-flow tuffs, flows ranging from basalt to rhyolite and trachyte, and intrusions of gabbro, alkali granite, and alkali granophyre. The Morita Ranch Formation, composed of basalt, rhyolite, and ash-flow tuff, lies east, south, and north of Shafter and is older than the Chinati Mountains Group. These volcanic rocks rest unconformably on the Cretaceous units and have undergone some faulting but only minor deformation.
Preliminary Economic Assessment and Updated Technical Report, Shafter Project, Texas, USA Aurcana Corporation Page 52
Mine Development Associates \\mda.com\users\Neil\shafter_2016_pea\2018_PEA\Shafter_2018_43-101_v13_pea.docx July 29, 2018 Print Date: 9/5/18 2:59 PM
Southeast of the Chinati Mountains, a circular intrusive stock, variously described as hornblende-augite andesite (diorite?), quartz monzonite, monzonite, or latite porphyry, crops out in the Red Hills. The Red Hills stock has been dated at 64 to 60 Ma (Gilmer et al., 2003). The Red Hills are less than a mile south of the structural margin of the Chinati Mountains caldera. However, the radiometric age of the Red Hills stock demonstrates that it pre-dates the Chinati Mountains caldera and is part of the older Laramide magmatic arc that accompanied Laramide deformation as far east as the Trans-Pecos region of southwest Texas (Gilmer et al., 2003). The Red Hills intrusion has been explored as a copper-molybdenum porphyry prospect. This stock is about four miles west of the Presidio mine and about one mile west of the western margin of the Shafter property described in this report. Andesitic and basaltic dikes are reported from the immediate vicinity of the Presidio mine, while farther west, basaltic and andesitic sills that are locally up to 100ft thick intrude the Permian and Cretaceous strata. Diorite porphyry intrudes the lower part of the Permian sequence and extends beneath the Tertiary flows west and north of Aurcana’s property.
Property Geology The following reports have provided background information on the property geology: Rossi and Springett (1995), Lambeck (2012), Ross and Cartwright (1935), Ross (1943), a portion of a report by Pincock, Allen & Holt dated 2000b that is included in the appendix of Balfour Holdings, Inc. (2000), and Rozelle (2001). At the Shafter deposit, the massive limestone at the top of the Permian Cibolo Formation, beneath the unconformable contact with the Cretaceous Presidio Formation, was the most favorable to replacement by solutions. In the vicinity of the mine, this unit is called the Mina Grande Formation. The erosional surface of the Mina Grande Formation developed karst topography, which provided large open areas that served as channels for mineralizing solutions. Silver and base metal minerals were deposited where conditions were favorable. The Mina Grande limestone formed as a Permian reef and has over two miles of mineralized strike length. It is up to 200ft thick and is composed of massive to thin-bedded wackestone to packstone and carbonate mudstone that have been divided into three broad units from bottom to top (Bogle, 2000, and Head, 2002): Basal unit consisting of unaltered or only slightly dolomitized wackestones to packstones (Fore Reef facies of Kastelic, 1983); Pseudobreccia unit of clasts of Mina Grande Formation in a matrix of orange-, red-, and brown-stained dolomite and fossiliferous limestone that shows evidence of dissolution during subaerial exposure (Reef Talus facies of Kastelic, 1983); and Massive unit directly below the Permian-Cretaceous unconformity that is a dolomitized unit with few to no original structures of fabrics evident (Massive Dolomite facies of Kastelic, 1983). The Mina Grande Formation is unconformably overlain by the Cretaceous Presidio Formation, which is in turn overlain by the Shafter Limestone. Narrow andesitic and basaltic dikes were reported by Ross (1943). Fissures and faults are present in all areas of the Presidio mine workings. Several high-angle faults in the area may have been the main channels for the mineralizing solutions, and high-grade pockets of mineralization occurred within the karsts (Silver, 1999). The mineralization appears to have been controlled by east-trending faults, often where intersected by strong north-south faults such as the Mina Grande fault. The Mina Grande fault strikes N10°E and has a displacement of 300 to 400ft. It is near the west end of the Shafter deposit and has displaced the mineralized horizons downward to the west (Kastelic, 1983). Northwest- and northeast-trending faults of regional extent also cross the Shafter property (Lambeck, 2012).
Preliminary Economic Assessment and Updated Technical Report, Shafter Project, Texas, USA Aurcana Corporation Page 53
Mine Development Associates \\mda.com\users\Neil\shafter_2016_pea\2018_PEA\Shafter_2018_43-101_v13_pea.docx July 29, 2018 Print Date: 9/5/18 2:59 PM
7.2 Mineralization The following reports have provided background information on the mineralization: Ross (1943), Corbett (1979), Kastelic (1983), Rossi and Springett (1995), Rozelle (2001), Head (2002), Rozelle and Tschabrun (2008), Shannon (2012), and Lambeck (2012), with additional information as cited. The Shafter deposit is hosted within the gently dipping beds of the Permian Mina Grande Formation, just below their contact with Cretaceous rocks. The reef-derived dolomite and limestone of the Mina Grande Formation were susceptible to differential weathering and karst activity at the upper level of the formation, and passageways for mineralizing solutions formed along facies contacts and bedding planes. The deposit is parallel to the bedding, has a tabular form, and is called a manto deposit, following colonial Spanish terminology for a blanket-like or tabular mineralized body. The deposit has some irregularities in its shape but dips generally east. Veins containing the same minerals as the manto are common in the eastern part of the Shafter district. Many of these veins are fissure fillings and have brecciated zones. Rozelle (2001) stated that the mineralization took place after the intrusion of dikes and sills of Tertiary age, and Ross (1943) reported that dikes in the Presidio mine are somewhat mineralized. In contrast, Lambeck (2012) reported that a dike in Aurcana’s drill hole 201200694 cross-cuts mineralization. There has been no radiometric dating of minerals associated with the Shafter deposit, and a source for the mineralizing fluids has not yet been identified.
Mineral deposition took place in four main phases: (1) a limited amount of dolomitization; (2) silicification; (3) deposition of calcite and metallic minerals including galena, sphalerite, and acanthite; and (4) supergene alteration. Aurcana identified two separate stages of metal mineralization on the Shafter property – an initial lead stage potentially associated with the north-trending Mina Grande fault, followed by a second stage consisting of silver and anomalous lead and zinc, thought to be associated with the Herculano fault system and multiple east-trending faults that served as distal feeder systems (Lambeck, 2012). Contacts of the mineralized zones with unaltered wall rocks are generally sharp. Based on drilling by Gold Fields, silver mineralization located to the east of the Presidio mine historical workings (designated Block Groups I and II in the historical reports and re-named the Shafter area for use in this report) appears to be continuous within the manto deposit, which extends over 6,000ft of strike length along a zone trending roughly N60°E and lies between 700 and 900ft below the surface. The entire Presidio/Shafter deposit is up to 1,500ft wide in a north-south direction and extends at least 2.5 miles on an east-west trend (Balfour Holdings, Inc., 2000). There appears to be a high-grade core within the broader mineralized zone located just below the Cretaceous-Permian unconformity. The high-grade core is very continuous east of the Presidio mine workings in the Shafter area and in the upper workings of the Presidio mine (Balfour Holdings, Inc., 2000). About 5,000ft northeast of the eastern limit of stoping in the Presidio mine, silver values decrease markedly. About 1,000ft further east, the favorable Basal and Pseudobreccia units of the Mina Grande Formation were removed by pre-Cretaceous erosion or dolomitization (Kastelic, 1983). West of the Presidio mine, dolomitization has also destroyed much of the favorable host rock for the Shafter-type mineralization (Kastelic, 1983).

Preliminary Economic Assessment and Updated Technical Report, Shafter Project, Texas, USA Aurcana Corporation Page 54
Mine Development Associates \\mda.com\users\Neil\shafter_2016_pea\2018_PEA\Shafter_2018_43-101_v13_pea.docx July 29, 2018 Print Date: 9/5/18 2:59 PM
The mineralized material consists of a massive aggregate of medium-grained, vuggy silica stained with varying amounts of iron and manganese oxides. Mineralogy is fairly consistent within the district. The mineralization originally consisted of sulfide minerals, which are now almost thoroughly oxidized. Secondary minerals include iron and manganese oxides, acanthite, hemimorphite, descloizite, embolite, plumbojarosite, cerargyrite, native silver, cerussite, anglesite, and small amounts of covellite, chrysocolla, and possibly other copper minerals. Primary minerals include dolomite, calcite, quartz, pyrite, sphalerite, galena, argentite, chalcopyrite, covellite, molybdenite, and tetrahedrite. Silver occurs predominately as oxidized acanthite in fine-grained aggregates of quartz, calcite, and goethite, with lesser dolomite, hemimorphite, willemite, anglesite, galena, smithsonite, and sphalerite. Lead and perhaps zinc appeared to be more plentiful relative to silver in the outlying mines of the district than in the Presidio mine, although the outlying mines are scattered and were poorly developed so generalizations are difficult (Ross, 1943).
Structure and Control of Mineralization The sequence of Late Carboniferous to Late Cretaceous sedimentary rocks in the Shafter mining district has been folded and forms a broad dome. The doming may be related to intrusive activity and is probably related to the Laramide orogeny. In the vicinity of the Presidio mine, beds dip southeast and south. Permian rocks in the Presidio mine are bounded on the west by a persistent fault, the Mina Grande fault, which strikes roughly north-south and drops beds about 270ft to the west (Balfour Holdings, Inc., 2000). Bodies of Permian rock are located along this fault zone, which has been traced at the surface for over a mile in length and cuts sharply across the trend of the Cretaceous rocks. Several other faults in the area parallel the Mina Grande fault.
Extensive alteration and silver mineralization with anomalous lead and zinc values were observed in the east-trending Herculano fault system, which lies east of the Mina Grande fault (Lambeck, 2012). The underground workings of the old Presidio mine lie south of the Herculano fault, while the northeastward extension of mineralization found by Gold Fields lies north of the Herculano fault. Faults and dikes are exceptionally numerous and closely spaced in the immediate vicinity of the Presidio mine. Mineralized bodies show more closely spaced fractures than the unaltered limestone nearby. Ross (1943) notes the following structural features in and near the Presidio mine that appear to determine the distribution of mineralization:
• Numerous steep faults, many of which do not have the same strike or dip as known faults in the surrounding region;
• Numerous narrow dikes in contrast to the sills in the region to the west; and • Relatively large amount of shattering in the mineralized rock.
The Mina Grande Formation in the vicinity of the Shafter deposit had both a diagenetic and structural history that prepared it for hydrothermal mineralization (Head, 2002). Multiple phases of dolomitization and calcification, karstification during post-Permian uplift, and multiple phases of fracturing all increased permeability, conducive to subsequent mineralization.
Preliminary Economic Assessment and Updated Technical Report, Shafter Project, Texas, USA Aurcana Corporation Page 55
Mine Development Associates \\mda.com\users\Neil\shafter_2016_pea\2018_PEA\Shafter_2018_43-101_v13_pea.docx July 29, 2018 Print Date: 9/5/18 2:59 PM
Additional Historical Prospects There are other prospects and occurrences of mineralization within and adjacent to Aurcana’s Shafter property, but they are well outside the boundaries of the mineral resource described in this report. Past production, if any, was small. Most of the following information has been summarized from Ross (1943), Rozelle (2001), and Rozelle and Tschabrun (2008). This information is included in the interest of full disclosure. Regional N70°E-trending structures are associated with a bedded zinc deposit and several high-grade lead-zinc veins (often with some minor gold values) at the Montezuma, Chinati, Perry, Stauber, and Gleim workings (see Figure 4.2 for locations). All of these workings lie within the boundaries of Aurcana’s Shafter property. The Gleim prospect is located about a mile south-southwest of the old Presidio mine, close to the highway to Presidio, on the eastern edge of Section 6 in the southern part of the Shafter property. Little is known about this prospect. The upper Presidio Formation is exposed at the surface, and there is a steeply dipping calcite vein that trends east to N70°E. Gold Fields drill hole SD 264 encountered seven feet of 10oz Ag/ton, 0.07oz Au/ton, 4 percent lead, and 2 percent zinc at 393ft. Samples containing high gold values were reportedly taken at the east edge of the Gleim property (Rozelle and Tschabrun, 2008). At the Stauber prospect west of the Gleim workings, in the western part of Section 6, silicified and otherwise altered rock containing silver and lead is associated with calcite veins in Cretaceous strata. Similar mineralization occurs south of the Perry prospect, which is located in Section 2. Surface exposures show considerable faulting at the Stauber prospect. Kastelic (1983) noted that other small deposits, situated west-southwest of the Shafter deposit, were prospected mostly for their lead and zinc values, with only minor amounts of silver and gold. The Perry, Chinati, and Montezuma prospects are located 1.5 to two miles west of the Mina Grande fault in an area that drilling has shown contains high zinc values (Kastelic, 1983). Mineralization occurred primarily along steep fracture planes in the Perry prospect in Section 2. Small masses of galena and its oxidation products were found in and near the Perry workings in limestone close to the top of the Cibolo Formation; some of the rock was said to contain as much as 15 percent lead (Ross, 1943). The main mineralization occurred along a fracture zone that trends N50°E and dips steeply northwest. Locally the mineralization spread along bedding at the top of the Permian limestone. At the Chinati and the Montezuma prospects in Section 2, west of the Perry prospect, workings explored thrust faults in a zone striking nearly east, with fracture planes dipping north generally 30-40°, but up to as much as 65°, opposite to the dip of the Permian limestone. These faults served as channels for mineralization. This is the only example of mineralization in the district known to be associated with thrust faults. Zinc was recovered from oxidized bodies in both mines. The Chinati and Montezuma prospects are in thick-bedded Permian limestone. Gold Fields discovered a large zone of bedding-controlled and oxidized zinc mineralization during their regional drill program. Their north-south drill fence with SD 313, SD 316, and SD 317 intersected six feet of 10 percent zinc mineralization extending 1,200ft down-dip from the Montezuma workings. Drill hole SD 313, located approximately 200ft south of the Montezuma prospect, encountered two six-foot

Preliminary Economic Assessment and Updated Technical Report, Shafter Project, Texas, USA Aurcana Corporation Page 56
Mine Development Associates \\mda.com\users\Neil\shafter_2016_pea\2018_PEA\Shafter_2018_43-101_v13_pea.docx July 29, 2018 Print Date: 9/5/18 2:59 PM
zones with 14 percent zinc, and the bottom horizon contained 0.03oz Au/ton. A 4 percent to 6 percent zinc zone was also encountered in Gold Fields’ drill holes along strike in fences 2,000ft to the east and 3,000ft to the west of the Montezuma workings.
Preliminary Economic Assessment and Updated Technical Report, Shafter Project, Texas, USA Aurcana Corporation Page 57
Mine Development Associates \\mda.com\users\Neil\shafter_2016_pea\2018_PEA\Shafter_2018_43-101_v13_pea.docx July 29, 2018 Print Date: 9/5/18 2:59 PM
8.0 DEPOSIT TYPES The Shafter silver deposit is considered an example of a polymetallic replacement deposit. Because of their irregular, but sharp contact with the enclosing carbonate host rocks, deposits of this type have been categorized as high-temperature, carbonate-hosted deposits. Other mining districts with examples of this deposit type are: Leadville, Colorado, Tintic, Utah, and Zacatecas, Mexico. Polymetallic deposits consist of massive lenses and (or) pipes, known as mantos or replacement orebodies, and veins of iron, lead, zinc, and copper sulfide minerals that are hosted by and replace limestone, dolomite, or other sedimentary rocks; most massive deposits contains more than 50 percent sulfide minerals. Sediment-hosted deposits commonly are intimately associated with igneous intrusions in the sedimentary rocks. Emplacement of these intrusions triggered mineral formation and they host polymetallic veins and disseminations that contain iron, lead, zinc, and copper sulfide minerals. Some polymetallic replacement deposits are associated with skarn deposits in which host carbonate rocks are replaced by calc-silicate±iron oxide mineral assemblages. Most polymetallic vein and replacement deposits are zoned such that copper-gold mineralization is proximal to intrusions, whereas lead-zinc-silver mineralization is laterally and vertically distal to intrusions. There is little evidence in the Shafter district to indicate the source of the mineralizing solutions. No evidence of contact metamorphism has been noted, and this may indicate that the mineralizing solutions had traveled some distance, either horizontally or vertically through the stratigraphy.
Preliminary Economic Assessment and Updated Technical Report, Shafter Project, Texas, USA Aurcana Corporation Page 58
Mine Development Associates \\mda.com\users\Neil\shafter_2016_pea\2018_PEA\Shafter_2018_43-101_v13_pea.docx July 29, 2018 Print Date: 9/5/18 2:59 PM
9.0 EXPLORATION The information is the interpretation and conclusions of the qualified person based on the reports cited. The exploration data have been reviewed and summarized from Lambeck (2012), Lambeck et al. (2013), and Aurcana news releases (March 5, 2012; June 6, 2012; April 3, 2013), with additional information provided by Aurcana. The authors have determined that the information provided fairly represents the exploration conducted by Aurcana on the Shafter property. Aurcana’s non-drilling exploration activities are relatively limited, and consist of geophysical surveys, geologic mapping, and limited rock and chip sampling. From acquisition of the property in 2008 to 2011, Aurcana’s work at the Shafter project was focused on completion of the permitting required to commence production and on initiating construction of a mine and mill. Aurcana began exploration at Shafter in May 2011 with creation of an updated database that included Gold Fields’ exploration data from 1977 to 1983. Geotech Ltd. performed a regional helicopter-borne ZTEM and aeromagnetic survey covering 51 square miles in May 2011 (Tong and Legault, 2011). A total of 748.7 line-kilometers of data were collected. The principal geophysical sensors were a Z-axis Tipper electromagnetic (“ZTEM”) system and a cesium magnetometer. The survey was flown in a northwest to southeast direction, with a flight-line spacing of 200m; tie lines were flown perpendicular to the traverse lines at a spacing of 2,350m. Aurcana reports that the survey tested for conductivity responses indicating sulfide mineralization, resistivity responses indicating silicification, and magnetic responses indicating potential buried intrusive source rocks. Strong resistivity responses were detected that mirrored the strike of the Shafter deposit and correlated with silicification surrounding known mineralized zones. While the ZTEM magnetic data were of interest from a regional perspective and indicated a number of broad, anomalous features, interference from power lines made the data difficult to interpret relative to geologic features found during drilling. Field mapping traverses were completed in the northwestern part of the property (sections 4 (S) and 9 (S)) in 2012 to investigate areas of silicification and alteration. Alteration was noted in the Mina Grande Formation, and siliceous veins and iron oxides were noted in outcrops of limestone (Lambeck, 2012). Zonge International Inc. (“Zonge”) of Tucson, Arizona, was contracted to conduct an NSAMT orientation survey over the Shafter deposit, with approximately 40 line-kilometers of survey conducted on 10 lines. However, the study was not completed due to technical reasons (Lambeck, 2012). Interpretation of results was hampered by interference from power lines and project infrastructure. The survey did indicate an anomalous zone striking north-south, parallel to the Mina Grande fault, locally known as the Presidio horst. Structural interpretation of Landsat data confirmed the presence of a parallel fault structure, but a hole drilled in 2012 to intersect the inferred anomaly did not intersect mineralized rocks or the fault structure (Lambeck, 2012). In 2012, historical workings of the Mina Grande open pit were surveyed and chip sampled on four levels to a depth of 80ft to determine the extent of the mineralized area. Also in 2012, a geochemical study was
Preliminary Economic Assessment and Updated Technical Report, Shafter Project, Texas, USA Aurcana Corporation Page 59
Mine Development Associates \\mda.com\users\Neil\shafter_2016_pea\2018_PEA\Shafter_2018_43-101_v13_pea.docx July 29, 2018 Print Date: 9/5/18 2:59 PM
completed on the intrusive rocks in the Herculano fault system based on 10 samples. The data suggest that the Herculano dike is a basaltic andesite. During 2013, Aurcana undertook field mapping to identify zones of favorable structural and stratigraphic settings for mineralization, especially in the southwest part of the property (von Fersen et al., 2013). Surface work included limited rock geochemical sampling of gossanous outcrops and goethitic fracture fillings. Underground reconnaissance was undertaken to investigate the extent of mine workings and stopes, as well as the structural framework of this same area and of the Presidio mine area. Selected intervals of historical Gold Fields drill core were re-assayed to determine a district-wide geochemical footprint of the Shafter deposit. Historical drill core near the Shafter deposit was re-logged to re-evaluate controls on mineralization. In addition, an ioGAS data analysis was undertaken using 2012 drill-core assay data, Gold Fields drill-core re-assay data, and historical Ag-Au-Pb-Zn data. During 2017, Aurcana undertook an exploration core drilling program 1.4 miles to the southwest of the Shafter mine. Five holes were drilled following up on anomalous gold intercepts in Goldfields drilling of the 1980’s. The program successfully encountered gold and silver mineralization in similar grades and thicknesses as prior drilling. Additional drilling will be necessary to determine the geologic context and style of mineralization encountered. This drilling is not material and will require further drilling and geologic investigation. Due to the sporadic and very limited nature of the geochemical sampling, the sampling is not considered relevant, nor are any of the results considered significant, to the current project and specifically to the mineral resource estimate described in Section 14.0. Therefore, further analyses on sampling methods, quality, and representativity were not conducted.
Preliminary Economic Assessment and Updated Technical Report, Shafter Project, Texas, USA Aurcana Corporation Page 60
Mine Development Associates \\mda.com\users\Neil\shafter_2016_pea\2018_PEA\Shafter_2018_43-101_v13_pea.docx July 29, 2018 Print Date: 9/5/18 2:59 PM
10.0 DRILLING The information provided is the interpretation and conclusions of the qualified person based on the reports cited. The authors have determined that the information provided fairly represents the drilling activities conducted by Aurcana and previous operators on the Shafter property. 10.1 Summary The following information has been reviewed and summarized from Tietz and MacFarlane (2016), which is still considered current since there has been no further drilling since 2013 on the Shafter property. The Shafter project has been drilled by three companies from both surface and underground locations – Amax, Gold Fields, and RGMC. A summary of the drilling conducted by the various companies is shown in Table 10.1. Drilling by RGMC both before its acquisition by Aurcana and after the acquisition is grouped under RGMC in Table 10.1. A total of 1,694 drill holes are included in the present database for the Shafter project. Of these, 1,606 are diamond core holes, and 88 are RC holes. Since publication of the previous technical reports, approximately 800 holes have been added to the database, including a considerable number of underground and surface holes drilled by Amax (Table 10.1), as well as holes drilled by Aurcana (RGMC 2011-2013 in Table 10.1) and a few additional Gold Fields holes. Most of the surface drill holes east of the Presidio mine workings in the Shafter area of the deposit were drilled by Gold Fields and spaced 100 to 300ft apart, with an average spacing of approximately 200ft. Underground holes by Gold Fields within the same area were drilled from stations at a variety of angles along lines spaced 50ft apart. Underground holes by Amax in the eastern portion of the Presidio mine workings were drilled from stations at a variety of angles, with stations spaced 100 to 200ft apart. Surface drill holes around the Presidio mine workings were drilled by Gold Fields, with some older holes by Amax, and some newer holes by RGMC/Aurcana. The surface holes in these blocks are more widely spaced, ranging from 100 to 400ft. Underground holes by Amax were drilled from stations along drifts at a variety of angles and spaced from 50 to 300ft apart. Drilling in 1998 by RGMC explored shallow mineralization immediately east of the Mina Grande fault based on mineralization of surface outcrops. Since its acquisition by Aurcana, RGMC has drilled 65 surface core holes and 90 underground core holes for a total of 63,087.5ft. Of the 65 surface holes, 29 were drilled for exploration, totaling 35,977ft. These holes were drilled at dips between -45° and -70°. The remaining 36 surface core holes totaling 11,874ft were drilled in 2012 and were designed by the mine geology department for a near-surface mine infill program; dips ranged from -65° to -90 °. Not included in the resource database or in the total RGMC drilling noted above are eleven underground core holes completed by Aurcana in late 2013 after the database was finalized for use in the resource estimate. Aurcana also completed five exploration holes in 2017 that are outside the current resource area and have no impact on the current resource estimate. Figure 10.1 shows the locations of drill holes used for the resource estimate described in Section 14.0.
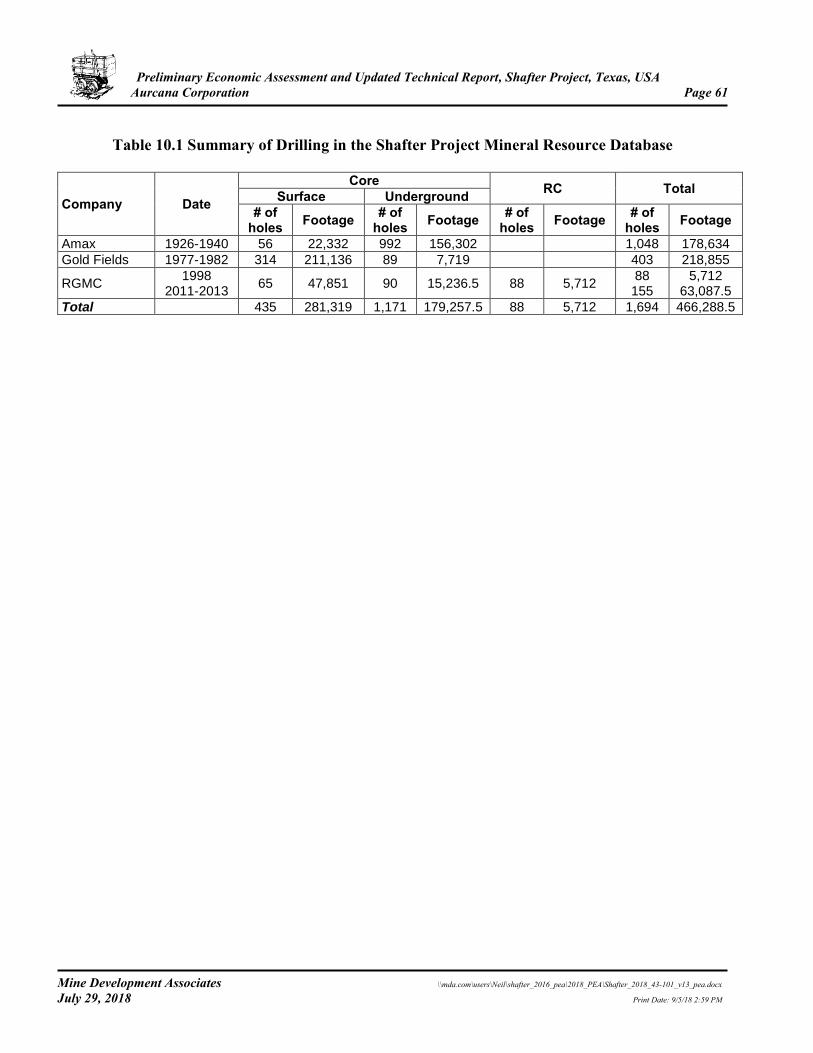
Preliminary Economic Assessment and Updated Technical Report, Shafter Project, Texas, USA Aurcana Corporation Page 61
Mine Development Associates \\mda.com\users\Neil\shafter_2016_pea\2018_PEA\Shafter_2018_43-101_v13_pea.docx July 29, 2018 Print Date: 9/5/18 2:59 PM
Table 10.1 Summary of Drilling in the Shafter Project Mineral Resource Database
Company Date Core RC Total Surface Underground
# of holes Footage # of
holes Footage # of holes Footage # of
holes Footage Amax 1926-1940 56 22,332 992 156,302 1,048 178,634
Gold Fields 1977-1982 314 211,136 89 7,719 403 218,855
RGMC 1998
2011-2013 65 47,851 90 15,236.5 88 5,712
88 155
5,712 63,087.5
Total 435 281,319 1,171 179,257.5 88 5,712 1,694 466,288.5
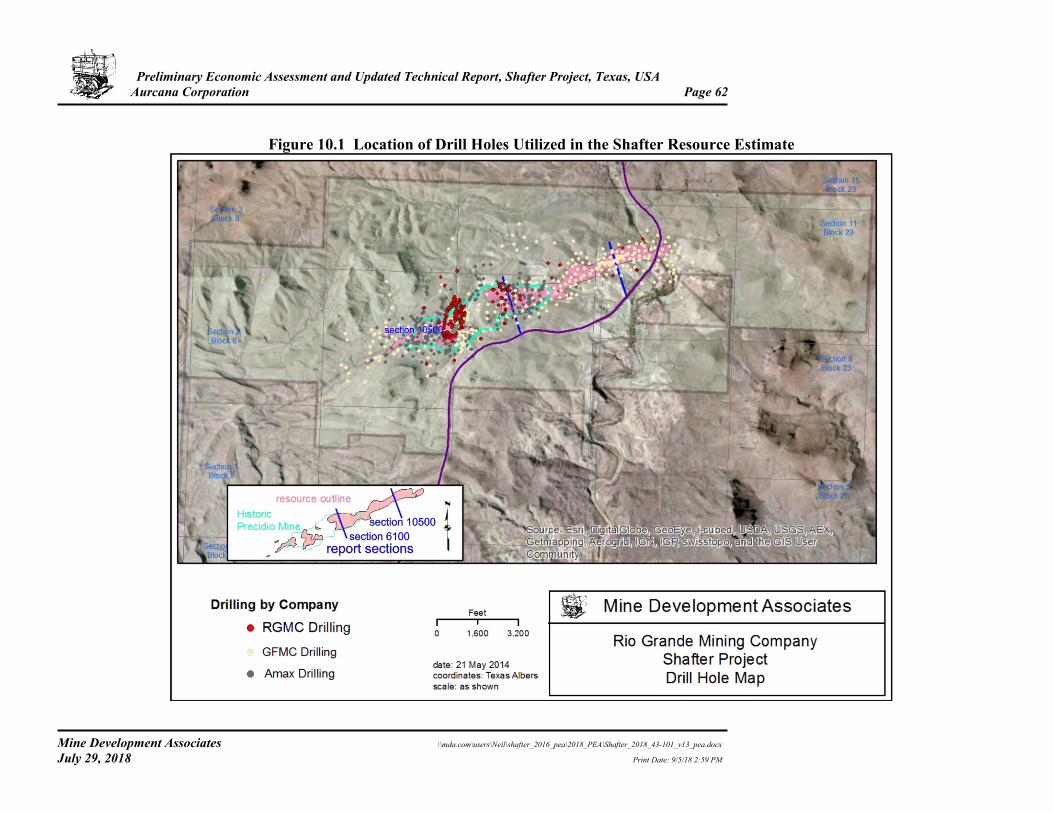
Preliminary Economic Assessment and Updated Technical Report, Shafter Project, Texas, USA Aurcana Corporation Page 62
Mine Development Associates \\mda.com\users\Neil\shafter_2016_pea\2018_PEA\Shafter_2018_43-101_v13_pea.docx July 29, 2018 Print Date: 9/5/18 2:59 PM
Figure 10.1 Location of Drill Holes Utilized in the Shafter Resource Estimate
Preliminary Economic Assessment and Updated Technical Report, Shafter Project, Texas, USA Aurcana Corporation Page 63
Mine Development Associates \\mda.com\users\Neil\shafter_2016_pea\2018_PEA\Shafter_2018_43-101_v13_pea.docx July 29, 2018 Print Date: 9/5/18 2:59 PM
10.2 Drilling by Previous Operators The Amax and Gold Fields drilling was by diamond core though there is limited information on drilling contractors, drill-rig types, and procedures used by Gold Fields (Springett, 1984) and RGMC (1998 drilling) and no such information for the Amax drilling. The database contains information on 56 surface core holes and 992 underground core holes drilled by Amax. In the process of reviewing and auditing the source information (detailed cross-sections and plan maps), it was realized that a significant number of Amax drill holes were missing from the database. The hole locations (to an approximate 5-10ft collar accuracy), downhole orientations, sample assays, and general geology of these missing holes were compiled by MDA resulting in the addition of 589 underground holes and 56 surface core holes to the database. The database contains information on 314 surface core holes and 89 underground core holes drilled by Gold Fields. For their surface drill holes, Gold Fields used Longyear Drilling Co. as the drill contractor for their SD-1 through SD-23 holes and Boyles Brothers for the remaining SD- series, SPMD (SM)- series, and SPSC- series holes. Boyles Brothers used a truck-mounted diamond core rig for all of the surface drilling. Drill logs for the SD-, SPMD (SM)-, and SPSC- series of Gold Fields’ surface holes indicate core was NC and NX size, but data are incomplete. It appears that NC holes were downsized to NX and BX as necessary. A few holes were started with a rotary drill, changing to NX coring. Drill logs for the SU- series of underground core holes drilled by Gold Fields in 1981-1982 indicate that American Mine Services Inc. was the drill contractor. Holes were drilled from a track-mounted rig and were of BX size (Springett, 1984). Although the database does not contain results from the percussion holes drilled by Gold Fields, Springett (1984) reported that they were drilled with a rubber-tired long-hole machine. A short, secondary percussion hole was drilled slightly below the collar of the percussion long-hole to enable sludge collection (Gold Fields Operating Co. – Shafter, undated). The percussion drill program has not been compiled and these samples are not part of the current database. RGMC drilled 88 RC holes in October and November 1998 prior to the company’s acquisition by Aurcana. Dateline Drilling, Inc. was the drill contractor, according to the drill logs. 10.3 Drilling by Aurcana Corporation The following information was taken from Aurcana news releases (March 5, 2012; June 1, 2012; April 3, 2013) with additional information from Lambeck (2012) and as provided by Aurcana. This section describes drilling by Aurcana that is shown in Table 10.1 as RGMC 2011-2013 drilling. Aurcana began drilling at Shafter in November 2011 (S-11-401 was the single hole drilled in 2011) and concluded in 2013 (Lambeck, 2012). Both surface and underground core drilling was conducted during this period. Of the 65 surface holes, 29 were drilled as part of the exploration program, while 36 were drilled by the mine geology department for mine infill drilling. Boart Longyear and Connors Drilling were the drill contractors for the surface holes drilled in 2011 and 2012, drilling HQ core holes with reduction to NQ core as necessary. Three drill rigs were used: one LY-44 and two LF-90s, one of which
Preliminary Economic Assessment and Updated Technical Report, Shafter Project, Texas, USA Aurcana Corporation Page 64
Mine Development Associates \\mda.com\users\Neil\shafter_2016_pea\2018_PEA\Shafter_2018_43-101_v13_pea.docx July 29, 2018 Print Date: 9/5/18 2:59 PM
was truck mounted and one track mounted. The Boart Longyear LF-90 truck-mounted rig was the most productive rig used, but their LY-44 rig was inefficient and unable to cope with the difficult drilling conditions. Connors used the track-mounted LF-90, which was deemed too slow to move around the property. Holes from the exploration program were drilled at angles from 45° to 70° in an attempt to identify a vertical feeder system for the mineralization (Lambeck, 2012). Of the 90 underground core holes in the database, five were drilled as part of the exploration program with the rest drilled by the mine geology department. Aurcana purchased a Boart Longyear Skid Steer LM 30 core drill in August 2012 for underground drilling that was put into use in mid-2013. Logs of the underground core holes show that some holes were also drilled by Connors Drilling; core size was NQ. Of 81 logs of the underground core holes reviewed by MDA, 24 holes were drilled by Connors Drilling, and 57 do not have the drilling company identified but may have been drilled by Aurcana. Not included in the resource database or in the total RGMC drilling noted above are eleven underground core holes completed by Aurcana in late 2013 after the database was finalized for use in the resource estimate. A 2015 review of these eleven drill holes indicates that their inclusion would not have a material impact on the resource model or the resource estimate. All core logging for the 2011-2012 surface drilling was completed with hand-held Trimble Juno Units using GeoInfo Mobile software and imported into a GeoInfo Tools database (Lambeck, 2012). Logging included lithology, formations, recovery, RQD, structures, alteration, mineralogy, intervals of silver-bearing clays and sand called the Jaboncillo interval, vuggy intervals, and in a few holes, fluorescence (Lambeck, 2012). In 2017, Aurcana completed five surface exploration core holes in the western portion of the property, approximately 1.4 miles west-southwest of the current mineral resource area. Altar Drilling was the drill contractor and core size was HQ. Two holes encountered significant silver and gold mineralization though true thickness and mineral orientation are not yet known; additional drilling is recommended. These core holes do not impact the current resource estimate and are not included in the current resource database. 10.4 Drill-Hole Collar Surveys Drill-hole collar locations for holes drilled prior to Aurcana’s drilling were reportedly (Rozelle, 2001) surveyed to determine the collar coordinates. Collars for Aurcana’s underground holes were surveyed by Aurcana staff. Collars for Aurcana’s surface holes were surveyed by Tony Trujillo Land Surveying. 10.5 Down-Hole Surveys Pincock, Allen & Holt (2000a; 2000b, portion of a report included in the appendix of Balfour Holdings, Inc., 2000) reported that most of the 891 holes in the database for the Shafter project at the time of their report had not been surveyed for down-hole deviations, and that for those holes for which down-hole surveys were recorded on the drill logs a “problematic degree of drift” was not indicated. The current database has no down-hole survey data for any of the Amax or Gold Fields holes. However, handwritten notes on drill logs for some of the SD- series holes, most of the SPMD- holes, and some of the holes from SPSC-217 to SPSC-309 indicate that these holes were down-hole surveyed, most likely
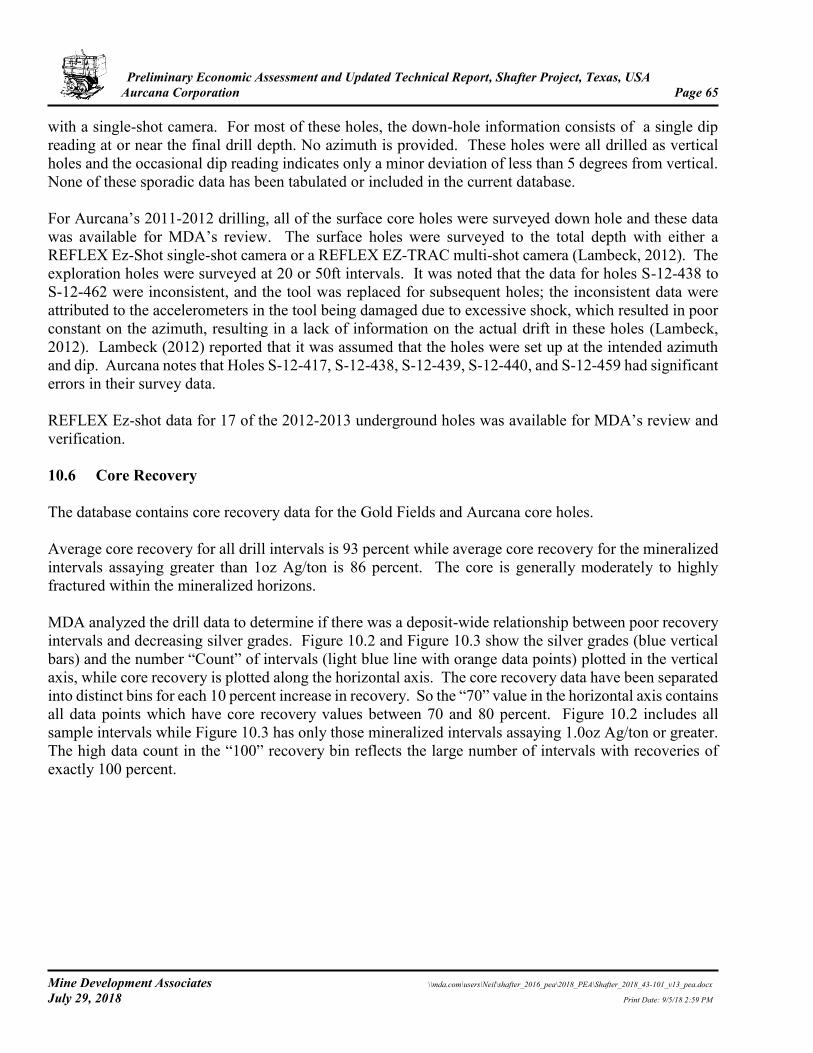
Preliminary Economic Assessment and Updated Technical Report, Shafter Project, Texas, USA Aurcana Corporation Page 65
Mine Development Associates \\mda.com\users\Neil\shafter_2016_pea\2018_PEA\Shafter_2018_43-101_v13_pea.docx July 29, 2018 Print Date: 9/5/18 2:59 PM
with a single-shot camera. For most of these holes, the down-hole information consists of a single dip reading at or near the final drill depth. No azimuth is provided. These holes were all drilled as vertical holes and the occasional dip reading indicates only a minor deviation of less than 5 degrees from vertical. None of these sporadic data has been tabulated or included in the current database. For Aurcana’s 2011-2012 drilling, all of the surface core holes were surveyed down hole and these data was available for MDA’s review. The surface holes were surveyed to the total depth with either a REFLEX Ez-Shot single-shot camera or a REFLEX EZ-TRAC multi-shot camera (Lambeck, 2012). The exploration holes were surveyed at 20 or 50ft intervals. It was noted that the data for holes S-12-438 to S-12-462 were inconsistent, and the tool was replaced for subsequent holes; the inconsistent data were attributed to the accelerometers in the tool being damaged due to excessive shock, which resulted in poor constant on the azimuth, resulting in a lack of information on the actual drift in these holes (Lambeck, 2012). Lambeck (2012) reported that it was assumed that the holes were set up at the intended azimuth and dip. Aurcana notes that Holes S-12-417, S-12-438, S-12-439, S-12-440, and S-12-459 had significant errors in their survey data. REFLEX Ez-shot data for 17 of the 2012-2013 underground holes was available for MDA’s review and verification. 10.6 Core Recovery The database contains core recovery data for the Gold Fields and Aurcana core holes. Average core recovery for all drill intervals is 93 percent while average core recovery for the mineralized intervals assaying greater than 1oz Ag/ton is 86 percent. The core is generally moderately to highly fractured within the mineralized horizons. MDA analyzed the drill data to determine if there was a deposit-wide relationship between poor recovery intervals and decreasing silver grades. Figure 10.2 and Figure 10.3 show the silver grades (blue vertical bars) and the number “Count” of intervals (light blue line with orange data points) plotted in the vertical axis, while core recovery is plotted along the horizontal axis. The core recovery data have been separated into distinct bins for each 10 percent increase in recovery. So the “70” value in the horizontal axis contains all data points which have core recovery values between 70 and 80 percent. Figure 10.2 includes all sample intervals while Figure 10.3 has only those mineralized intervals assaying 1.0oz Ag/ton or greater. The high data count in the “100” recovery bin reflects the large number of intervals with recoveries of exactly 100 percent.
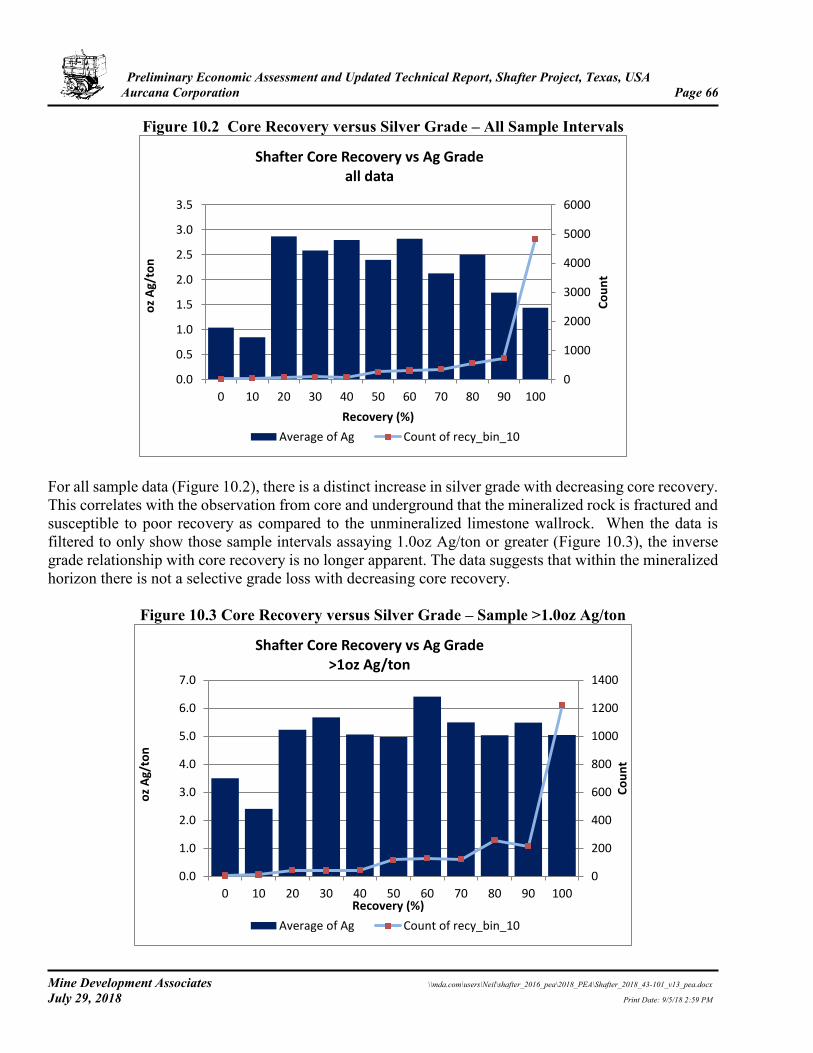
Preliminary Economic Assessment and Updated Technical Report, Shafter Project, Texas, USA Aurcana Corporation Page 66
Mine Development Associates \\mda.com\users\Neil\shafter_2016_pea\2018_PEA\Shafter_2018_43-101_v13_pea.docx July 29, 2018 Print Date: 9/5/18 2:59 PM
Figure 10.2 Core Recovery versus Silver Grade – All Sample Intervals
For all sample data (Figure 10.2), there is a distinct increase in silver grade with decreasing core recovery. This correlates with the observation from core and underground that the mineralized rock is fractured and susceptible to poor recovery as compared to the unmineralized limestone wallrock. When the data is filtered to only show those sample intervals assaying 1.0oz Ag/ton or greater (Figure 10.3), the inverse grade relationship with core recovery is no longer apparent. The data suggests that within the mineralized horizon there is not a selective grade loss with decreasing core recovery.
Figure 10.3 Core Recovery versus Silver Grade – Sample >1.0oz Ag/ton
0
1000
2000
3000
4000
5000
6000
0.0
0.5
1.0
1.5
2.0
2.5
3.0
3.5
0 10 20 30 40 50 60 70 80 90 100
Co
un
t
oz
Ag/
ton
Recovery (%)
Shafter Core Recovery vs Ag Gradeall data
Average of Ag Count of recy_bin_10
0
200
400
600
800
1000
1200
1400
0.0
1.0
2.0
3.0
4.0
5.0
6.0
7.0
0 10 20 30 40 50 60 70 80 90 100
Co
un
t
oz
Ag/
ton
Recovery (%)
Shafter Core Recovery vs Ag Grade>1oz Ag/ton
Average of Ag Count of recy_bin_10
Preliminary Economic Assessment and Updated Technical Report, Shafter Project, Texas, USA Aurcana Corporation Page 67
Mine Development Associates \\mda.com\users\Neil\shafter_2016_pea\2018_PEA\Shafter_2018_43-101_v13_pea.docx July 29, 2018 Print Date: 9/5/18 2:59 PM
10.7 Summary Statement MDA believes that the drill sampling procedures provided samples that are representative and of sufficient quality for use in the resource estimations discussed in Section 14.0. The current database does not include the Gold Fields underground percussion drilling noted in Section 10.2. These data, if available, should be added to the project database. There is some uncertainty associated with the Amax drilling due to the lack of information on drill procedures, drill type, and core recovery, and this uncertainty is reflected in the resource classification noted in Section 14.0. Confidence in the Amax drilling is provided by spatial and sample results comparisons with the more recent verified underground and surface drilling conducted by Gold Fields and Aurcana. The 2017 exploration drilling program is outside of the Shafter project resource model framework and is presently not material to the resource estimate. Additional drilling is recommended to follow-up on the positive 2017 results. MDA is unaware of any other drilling, sampling or recovery factors that materially impact the mineral resources discussed in Section 14.0.
Preliminary Economic Assessment and Updated Technical Report, Shafter Project, Texas, USA Aurcana Corporation Page 68
Mine Development Associates \\mda.com\users\Neil\shafter_2016_pea\2018_PEA\Shafter_2018_43-101_v13_pea.docx July 29, 2018 Print Date: 9/5/18 2:59 PM
11.0 SAMPLE PREPARATION, ANALYSIS, AND SECURITY The following information has been reviewed and summarized from Gold Fields Operating Co. – Shafter (undated), Kastelic (1983), Springett (1984), Rozelle (2001), and Lambeck (2012), with updated information provided by Aurcana. The interpretations and conclusions stated are those of the QP. 11.1 Sampling Procedures Sampling at the Shafter project has occurred over a considerable time period and was conducted by various companies. Most of the samples that were taken prior to the work of Gold Fields came from chip samples in the ribs and back of the underground openings along with underground core drilling by Amax. MDA has seen no information on sampling procedures used by Amax. The core sampling data in the current database, along with the original assay tables shown on the project cross-sections, indicate that Amax selectively sampled and assayed only those intervals with visual indications of mineralization. Many of the core holes have just a few individual samples with most of the hole length having no assay data. Although Gold Fields’ sampling included core, chip, channel, and underground bulk samples, only the core sample data were used in this resource estimate. Springett (1984) described the relative merits of different sampling methods that were examined during their underground test program: underground core drilling, sampling the cuttings from percussion holes, or developing raises and either bulk sampling or channel sampling the raise. A comparison of results from percussion drilling, bulk sampling, and core drilling indicated that the core results may be biased low, possibly due to washing out high-grade friable material during drilling (Springett, 1984). Gold Fields sampled core in lengths varying from 1ft to 5ft; it was generally sampled in 2ft to 3ft intervals in weakly mineralized areas, while 1ft samples were taken in strongly mineralized zones in order to minimize dilution (Kastelic, 1983). Although the protocols for sampling indicated sludge from the core drilling would be collected and assayed due to the fineness of the silver particles (Gold Fields Operating Co. – Shafter, undated), sludge was not collected from the core holes (Springett, 1984). Core from surface holes was generally NX or NC, but core from the underground holes was BX size. The core was logged geologically by the geologist. Visibly mineralized sections of core were selected and cut in half with a diamond saw in order to preserve loose fine material that contains many of the silver values. Standard 2ft intercepts were generally prepared for assay, but 1ft intercepts were utilized on certain sections (Springett, 1984). One half of the sawn core was placed in bags and shipped to the assay lab for sample preparation and assaying. For their underground percussion holes, which are not represented in the project database used for this report, Gold Fields collected the cuttings in either 5-gallon buckets for horizontal holes or in 32-gallon garbage cans for inclined holes. The excess water was carefully decanted, and the cuttings were stored in 10-inch by 16-inch plastic bags tied with a tagged wire and labeled with the hole number and footage increment. Cuttings were collected over 4ft increments corresponding to the drill-steel lengths. For Gold Fields’ underground bulk drift sampling, whose results are not included in the database used for the current resource estimate, each blasted round was mucked with a scoop tram and taken to the surface
Preliminary Economic Assessment and Updated Technical Report, Shafter Project, Texas, USA Aurcana Corporation Page 69
Mine Development Associates \\mda.com\users\Neil\shafter_2016_pea\2018_PEA\Shafter_2018_43-101_v13_pea.docx July 29, 2018 Print Date: 9/5/18 2:59 PM
for separate treatment through a bulk-sampling plant. A guide to sampling procedures used by Gold Fields provided further details on this sampling method (Gold Fields Operating Co. – Shafter, undated). Other than the drilling program carried out by RGMC in the late 1990s and Aurcana’s recent drilling, the majority of the samples in the drill-hole database were collected prior to 1982. Although there is limited information available on the sampling methodology employed by the previous mining companies that can be reviewed or verified, Amax and Gold Fields were well respected mining companies with a long history of operational experience. The results obtained by each company generally agreed with results from others who explored in the district, as well as with data from the historical mining records. RGMC’s samples from their 1998-1999 drilling were reported to be standard 5ft-long chip samples from RC drilling and were split using a cyclone splitter (Rozelle and Tschabrun, 2008). However, Aurcana noted that according to the drill logs, samples were collected mainly in 2.5ft increments (occasionally 5ft increments) where visual indications of mineralization and/or favorable lithology were noted by the rig geologist. The assay database indicates most of the samples were taken on 2.5ft intervals. For Aurcana’s 2011-2012 exploration surface drilling program, drill-core assay intervals were determined based on the geologist’s visual examination of the core for mineralization, which was then confirmed with a hand-held Delta x-ray fluorescence (“XRF”) instrument; intervals with silver greater than 20ppm by XRF and anomalous lead and zinc were selected for assay. A minimum of two XRF readings were obtained on each box of core. Sample intervals were normally 1ft for initial orientation purposes and later were 2ft intervals, with a barren sample selected above and below the mineralized zone to limit the mineralized zone. Core was sawn, and one half was placed into polyethylene sample bags along with a sample tag and secured with a zip-lock tie. For Aurcana’s underground drilling program, and the surface drilling by Aurcana’s mine geology department, sample intervals were generally 2ft. Core was sawn, and one half was placed into polyethylene sample bags along with a sample tag and secured with a zip-lock tie. For Aurcana’s 2017 exploration surface drilling program, drill-core assay intervals were determined based on the geologist’s visual examination of the core for mineralization. Sample intervals were normally 2ft intervals, with a barren sample selected above and below the mineralized zone to limit the mineralized zone. Core was sawn, and one half was placed into polyethylene sample bags along with a sample tag and secured with a zip-lock tie. Bags were sealed in five gallon buckets with tamper resistant tape and driven by company employees to Alpine, Texas where they were shipped to ALS Global in Tucson, Arizona via UPS. 11.2 Sample Preparation, Analysis, and Security
Sampling by Previous Operators Very little documentation exists regarding the sample preparation or security procedures used by former operators of the property. Gold Fields analyzed all mineralized core samples by fire assay for gold and silver; lead and zinc analyses were done by titration at first and later by atomic absorption (Kastelic, 1983). Gold Fields used Union Assay Office in Salt Lake City, Utah for sample preparation and assaying of all core samples until mid-1981 (Kastelic, 1983). Check samples were assayed by Skyline Labs, Inc. (now
Preliminary Economic Assessment and Updated Technical Report, Shafter Project, Texas, USA Aurcana Corporation Page 70
Mine Development Associates \\mda.com\users\Neil\shafter_2016_pea\2018_PEA\Shafter_2018_43-101_v13_pea.docx July 29, 2018 Print Date: 9/5/18 2:59 PM
Skyline Assayers & Laboratories; “Skyline”) in Wheat Ridge, Colorado. From 1981 until the end of Gold Fields’ work, core samples were analyzed by various labs, including Gold Fields’ own lab in Golden, Colorado, the Gold Fields Operating Co. – Shafter lab at the project, and Skyline. Soil and stream-sediment samples were screened to minus 80 mesh at Shafter and sent to Skyline in Tucson, Arizona, for analysis. Silver and gold grades were determined by standard fire assaying techniques. Since Union Assay is no longer in business, details of their sample preparation procedures are not available for review. RGMC used Actlabs-Skyline in Tucson, Arizona, as the assay laboratory for their 1998-1999 drilling program, based on copies of assay certificates in Aurcana’s files. Sample analysis for gold and silver was performed using standard, one assay-ton, fire-assay techniques with a gravimetric finish.
Sampling by Aurcana Corporation The following information was taken from Lambeck (2012), Aurcana news releases (March 5, 2012; April 3, 2013), and information provided by Aurcana. For their 2011-2012 exploration drilling program, Aurcana’s drill-core samples were dried and crushed to minus 10 mesh. A 250g subsample was pulverized to 90 percent passing 150 mesh using a ring and puck pulverizer. Samples taken in early 2012 were analyzed by Pinnacle Analytical Laboratories (“Pinnacle”) in Lovelock, Nevada (holes S-12-401, S-12-407, S-12-408, S-12-409, and, S-12-410 with S-12-412 not sampled). Duplicate samples on returned pulps for selected samples with high- and low-grade silver were sent to American Assay Labs (“American Assay”) in Sparks, Nevada, for check assaying. Pinnacle closed in 2012. Samples from surface holes S-12-417 to S-12-467 (which included both exploration and mine geology department surface holes) and from underground holes 201200602, 201200603, 201200604, 201200609, and 201200705 were sent to American Assay for analysis. Samples were delivered to the laboratories by courier. At Pinnacle, all samples were assayed for silver and gold by fire assay with gravimetric finish on a 30g sample. Samples from S-12-401 were assayed with fire assay for silver and gold and for 37 other elements using ICP-OES analysis with two-acid total digestion. Holes S-12-407 through S-12-410 were only assayed for silver and gold. For the holes analyzed by American Assay, multi-element analysis for 72 elements including gold was performed, consisting of two-acid digestion and analysis by ICP-OES. For hole S-12-417, four-acid total digestion and analysis by ICP-OES was used. Samples with silver values greater than 2.917oz/ton were analyzed by fire assay with a gravimetric finish on a 30g charge. Pulps and rejects were returned to Aurcana by courier. Pinnacle was accredited by the International Accreditation Service and complied with ANS/ISOIEC Standard 17025:2005, according to a copy of their accreditation certificate. American Assay is ISO 17025:2005 accredited, according to their website. For their 2012-2013 underground drill program, most of Aurcana’s drill samples were analyzed at their on-site laboratory. According to Aurcana, samples were crushed, pulverized, and screened, then subjected to multi-acid digestion. Silver was analyzed by atomic absorption spectrophotometry (“AA”). Samples with greater than 2.917oz Ag/ton were re-assayed using fire assay for gold and silver. MDA has not verified these procedures with Aurcana.
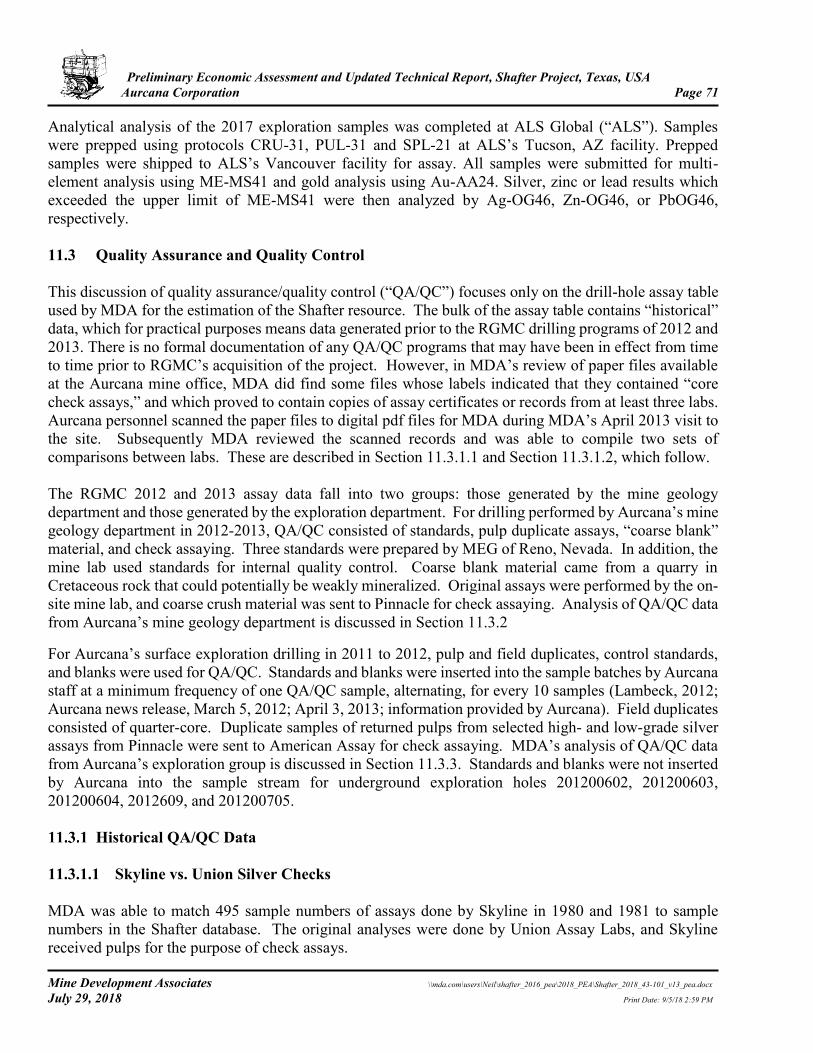
Preliminary Economic Assessment and Updated Technical Report, Shafter Project, Texas, USA Aurcana Corporation Page 71
Mine Development Associates \\mda.com\users\Neil\shafter_2016_pea\2018_PEA\Shafter_2018_43-101_v13_pea.docx July 29, 2018 Print Date: 9/5/18 2:59 PM
Analytical analysis of the 2017 exploration samples was completed at ALS Global (“ALS”). Samples were prepped using protocols CRU-31, PUL-31 and SPL-21 at ALS’s Tucson, AZ facility. Prepped samples were shipped to ALS’s Vancouver facility for assay. All samples were submitted for multi-element analysis using ME-MS41 and gold analysis using Au-AA24. Silver, zinc or lead results which exceeded the upper limit of ME-MS41 were then analyzed by Ag-OG46, Zn-OG46, or PbOG46, respectively. 11.3 Quality Assurance and Quality Control This discussion of quality assurance/quality control (“QA/QC”) focuses only on the drill-hole assay table used by MDA for the estimation of the Shafter resource. The bulk of the assay table contains “historical” data, which for practical purposes means data generated prior to the RGMC drilling programs of 2012 and 2013. There is no formal documentation of any QA/QC programs that may have been in effect from time to time prior to RGMC’s acquisition of the project. However, in MDA’s review of paper files available at the Aurcana mine office, MDA did find some files whose labels indicated that they contained “core check assays,” and which proved to contain copies of assay certificates or records from at least three labs. Aurcana personnel scanned the paper files to digital pdf files for MDA during MDA’s April 2013 visit to the site. Subsequently MDA reviewed the scanned records and was able to compile two sets of comparisons between labs. These are described in Section 11.3.1.1 and Section 11.3.1.2, which follow. The RGMC 2012 and 2013 assay data fall into two groups: those generated by the mine geology department and those generated by the exploration department. For drilling performed by Aurcana’s mine geology department in 2012-2013, QA/QC consisted of standards, pulp duplicate assays, “coarse blank” material, and check assaying. Three standards were prepared by MEG of Reno, Nevada. In addition, the mine lab used standards for internal quality control. Coarse blank material came from a quarry in Cretaceous rock that could potentially be weakly mineralized. Original assays were performed by the on-site mine lab, and coarse crush material was sent to Pinnacle for check assaying. Analysis of QA/QC data from Aurcana’s mine geology department is discussed in Section 11.3.2 For Aurcana’s surface exploration drilling in 2011 to 2012, pulp and field duplicates, control standards, and blanks were used for QA/QC. Standards and blanks were inserted into the sample batches by Aurcana staff at a minimum frequency of one QA/QC sample, alternating, for every 10 samples (Lambeck, 2012; Aurcana news release, March 5, 2012; April 3, 2013; information provided by Aurcana). Field duplicates consisted of quarter-core. Duplicate samples of returned pulps from selected high- and low-grade silver assays from Pinnacle were sent to American Assay for check assaying. MDA’s analysis of QA/QC data from Aurcana’s exploration group is discussed in Section 11.3.3. Standards and blanks were not inserted by Aurcana into the sample stream for underground exploration holes 201200602, 201200603, 201200604, 2012609, and 201200705.
Historical QA/QC Data 11.3.1.1 Skyline vs. Union Silver Checks MDA was able to match 495 sample numbers of assays done by Skyline in 1980 and 1981 to sample numbers in the Shafter database. The original analyses were done by Union Assay Labs, and Skyline received pulps for the purpose of check assays.
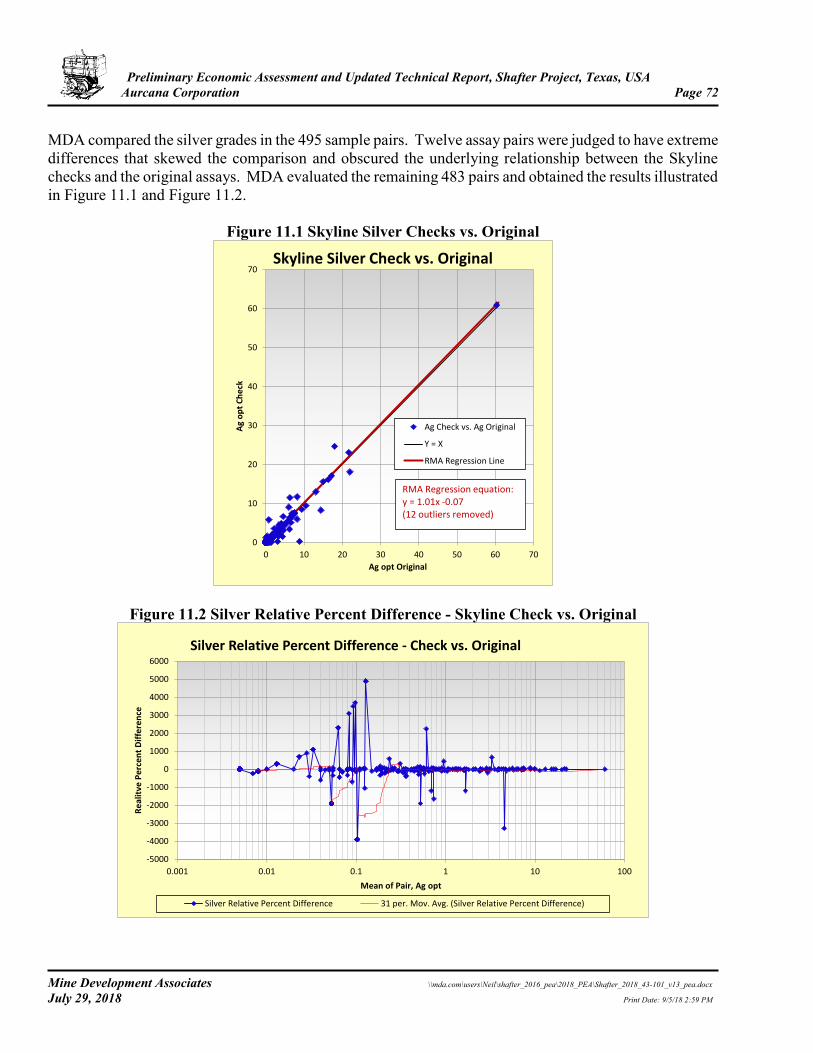
Preliminary Economic Assessment and Updated Technical Report, Shafter Project, Texas, USA Aurcana Corporation Page 72
Mine Development Associates \\mda.com\users\Neil\shafter_2016_pea\2018_PEA\Shafter_2018_43-101_v13_pea.docx July 29, 2018 Print Date: 9/5/18 2:59 PM
MDA compared the silver grades in the 495 sample pairs. Twelve assay pairs were judged to have extreme differences that skewed the comparison and obscured the underlying relationship between the Skyline checks and the original assays. MDA evaluated the remaining 483 pairs and obtained the results illustrated in Figure 11.1 and Figure 11.2.
Figure 11.1 Skyline Silver Checks vs. Original
Figure 11.2 Silver Relative Percent Difference - Skyline Check vs. Original
0
10
20
30
40
50
60
70
0 10 20 30 40 50 60 70
Ag
op
t C
he
ck
Ag opt Original
Skyline Silver Check vs. Original
Ag Check vs. Ag Original
Y = X
RMA Regression Line
RMA Regression equation:y = 1.01x -0.07(12 outliers removed)
-5000
-4000
-3000
-2000
-1000
0
1000
2000
3000
4000
5000
6000
0.001 0.01 0.1 1 10 100
Re
alit
ve P
erc
en
t D
iffe
ren
ce
Mean of Pair, Ag opt
Silver Relative Percent Difference - Check vs. Original
Silver Relative Percent Difference 31 per. Mov. Avg. (Silver Relative Percent Difference)
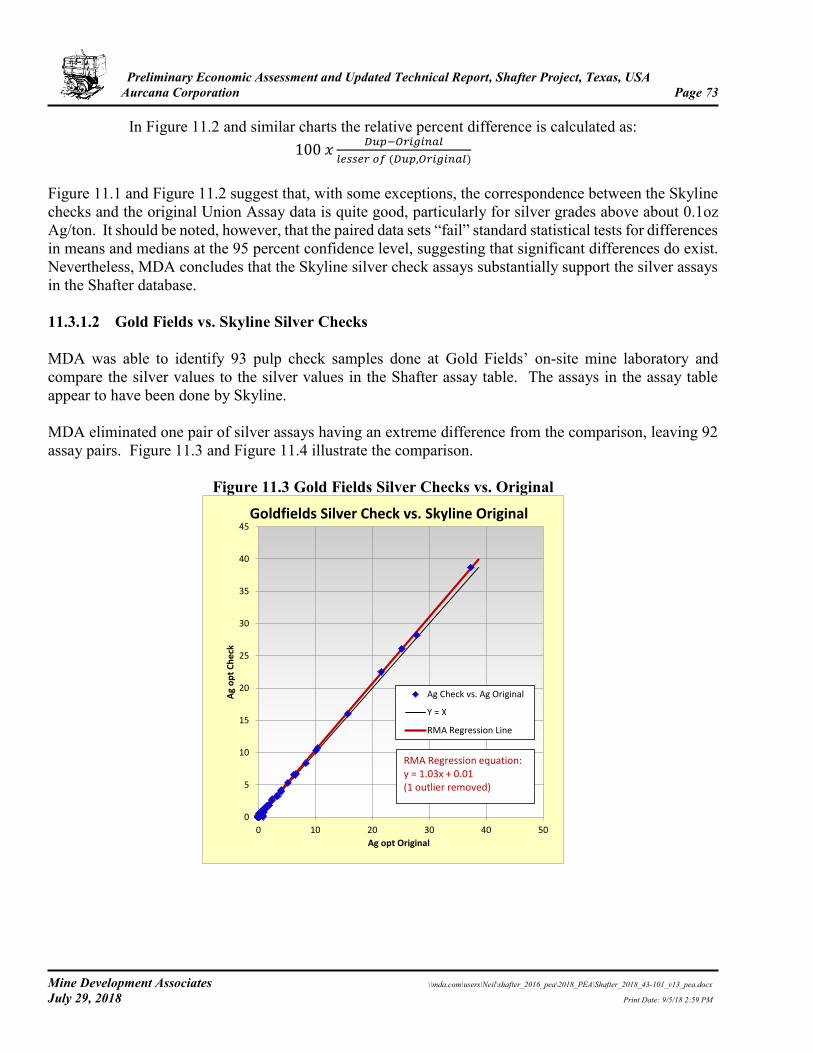
Preliminary Economic Assessment and Updated Technical Report, Shafter Project, Texas, USA Aurcana Corporation Page 73
Mine Development Associates \\mda.com\users\Neil\shafter_2016_pea\2018_PEA\Shafter_2018_43-101_v13_pea.docx July 29, 2018 Print Date: 9/5/18 2:59 PM
In Figure 11.2 and similar charts the relative percent difference is calculated as: 100 𝑥
𝐷𝑢𝑝−𝑂𝑟𝑖𝑔𝑖𝑛𝑎𝑙
𝑙𝑒𝑠𝑠𝑒𝑟 𝑜𝑓 (𝐷𝑢𝑝,𝑂𝑟𝑖𝑔𝑖𝑛𝑎𝑙)
Figure 11.1 and Figure 11.2 suggest that, with some exceptions, the correspondence between the Skyline checks and the original Union Assay data is quite good, particularly for silver grades above about 0.1oz Ag/ton. It should be noted, however, that the paired data sets “fail” standard statistical tests for differences in means and medians at the 95 percent confidence level, suggesting that significant differences do exist. Nevertheless, MDA concludes that the Skyline silver check assays substantially support the silver assays in the Shafter database. 11.3.1.2 Gold Fields vs. Skyline Silver Checks MDA was able to identify 93 pulp check samples done at Gold Fields’ on-site mine laboratory and compare the silver values to the silver values in the Shafter assay table. The assays in the assay table appear to have been done by Skyline. MDA eliminated one pair of silver assays having an extreme difference from the comparison, leaving 92 assay pairs. Figure 11.3 and Figure 11.4 illustrate the comparison.
Figure 11.3 Gold Fields Silver Checks vs. Original
0
5
10
15
20
25
30
35
40
45
0 10 20 30 40 50
Ag
op
t C
he
ck
Ag opt Original
Goldfields Silver Check vs. Skyline Original
Ag Check vs. Ag Original
Y = X
RMA Regression Line
RMA Regression equation:y = 1.03x + 0.01(1 outlier removed)
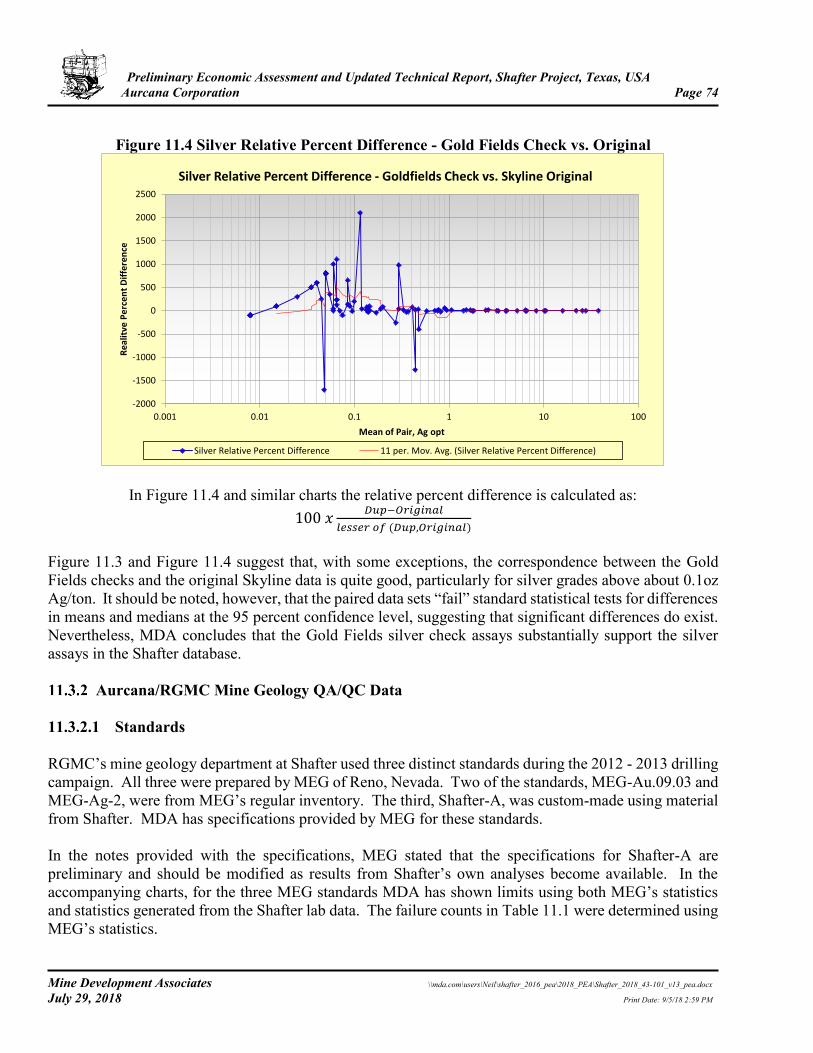
Preliminary Economic Assessment and Updated Technical Report, Shafter Project, Texas, USA Aurcana Corporation Page 74
Mine Development Associates \\mda.com\users\Neil\shafter_2016_pea\2018_PEA\Shafter_2018_43-101_v13_pea.docx July 29, 2018 Print Date: 9/5/18 2:59 PM
Figure 11.4 Silver Relative Percent Difference - Gold Fields Check vs. Original
In Figure 11.4 and similar charts the relative percent difference is calculated as: 100 𝑥
𝐷𝑢𝑝−𝑂𝑟𝑖𝑔𝑖𝑛𝑎𝑙
𝑙𝑒𝑠𝑠𝑒𝑟 𝑜𝑓 (𝐷𝑢𝑝,𝑂𝑟𝑖𝑔𝑖𝑛𝑎𝑙)
Figure 11.3 and Figure 11.4 suggest that, with some exceptions, the correspondence between the Gold Fields checks and the original Skyline data is quite good, particularly for silver grades above about 0.1oz Ag/ton. It should be noted, however, that the paired data sets “fail” standard statistical tests for differences in means and medians at the 95 percent confidence level, suggesting that significant differences do exist. Nevertheless, MDA concludes that the Gold Fields silver check assays substantially support the silver assays in the Shafter database.
Aurcana/RGMC Mine Geology QA/QC Data 11.3.2.1 Standards RGMC’s mine geology department at Shafter used three distinct standards during the 2012 - 2013 drilling campaign. All three were prepared by MEG of Reno, Nevada. Two of the standards, MEG-Au.09.03 and MEG-Ag-2, were from MEG’s regular inventory. The third, Shafter-A, was custom-made using material from Shafter. MDA has specifications provided by MEG for these standards. In the notes provided with the specifications, MEG stated that the specifications for Shafter-A are preliminary and should be modified as results from Shafter’s own analyses become available. In the accompanying charts, for the three MEG standards MDA has shown limits using both MEG’s statistics and statistics generated from the Shafter lab data. The failure counts in Table 11.1 were determined using MEG’s statistics.
-2000
-1500
-1000
-500
0
500
1000
1500
2000
2500
0.001 0.01 0.1 1 10 100
Re
alit
ve P
erc
en
t D
iffe
ren
ce
Mean of Pair, Ag opt
Silver Relative Percent Difference - Goldfields Check vs. Skyline Original
Silver Relative Percent Difference 11 per. Mov. Avg. (Silver Relative Percent Difference)
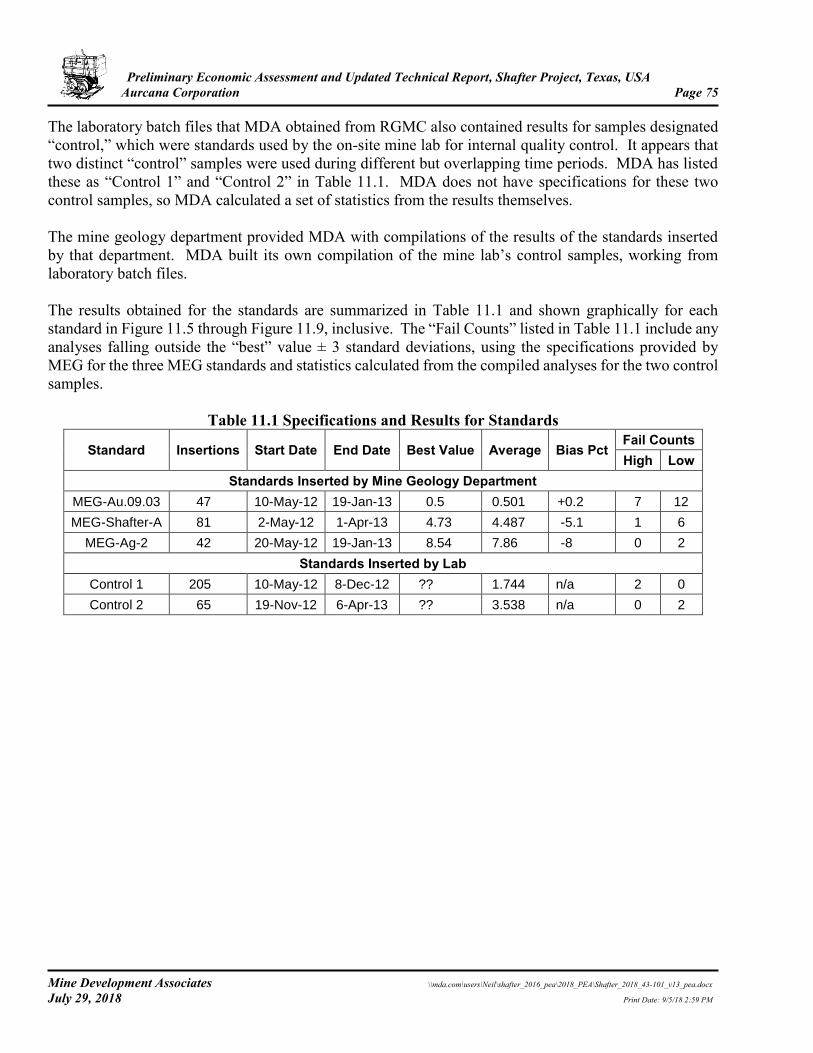
Preliminary Economic Assessment and Updated Technical Report, Shafter Project, Texas, USA Aurcana Corporation Page 75
Mine Development Associates \\mda.com\users\Neil\shafter_2016_pea\2018_PEA\Shafter_2018_43-101_v13_pea.docx July 29, 2018 Print Date: 9/5/18 2:59 PM
The laboratory batch files that MDA obtained from RGMC also contained results for samples designated “control,” which were standards used by the on-site mine lab for internal quality control. It appears that two distinct “control” samples were used during different but overlapping time periods. MDA has listed these as “Control 1” and “Control 2” in Table 11.1. MDA does not have specifications for these two control samples, so MDA calculated a set of statistics from the results themselves. The mine geology department provided MDA with compilations of the results of the standards inserted by that department. MDA built its own compilation of the mine lab’s control samples, working from laboratory batch files. The results obtained for the standards are summarized in Table 11.1 and shown graphically for each standard in Figure 11.5 through Figure 11.9, inclusive. The “Fail Counts” listed in Table 11.1 include any analyses falling outside the “best” value ± 3 standard deviations, using the specifications provided by MEG for the three MEG standards and statistics calculated from the compiled analyses for the two control samples.
Table 11.1 Specifications and Results for Standards
Standard Insertions Start Date End Date Best Value Average Bias Pct Fail Counts High Low
Standards Inserted by Mine Geology Department MEG-Au.09.03 47 10-May-12 19-Jan-13 0.5 0.501 +0.2 7 12
MEG-Shafter-A 81 2-May-12 1-Apr-13 4.73 4.487 -5.1 1 6
MEG-Ag-2 42 20-May-12 19-Jan-13 8.54 7.86 -8 0 2
Standards Inserted by Lab Control 1 205 10-May-12 8-Dec-12 ?? 1.744 n/a 2 0
Control 2 65 19-Nov-12 6-Apr-13 ?? 3.538 n/a 0 2
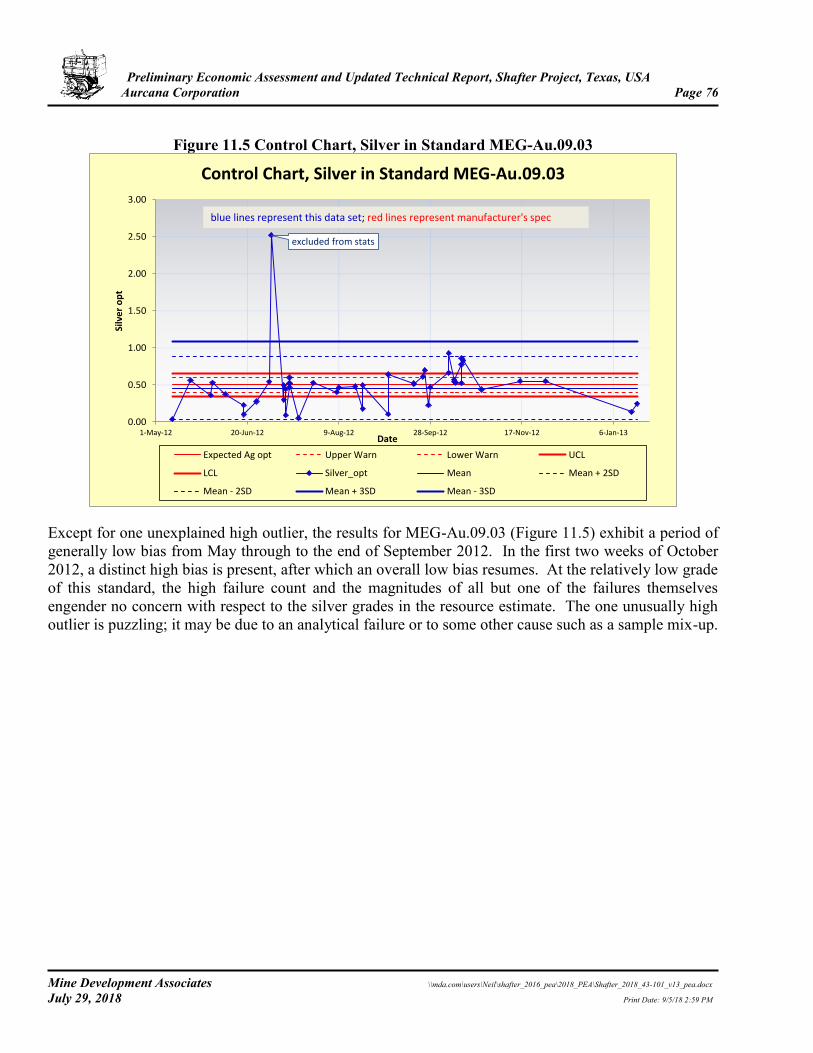
Preliminary Economic Assessment and Updated Technical Report, Shafter Project, Texas, USA Aurcana Corporation Page 76
Mine Development Associates \\mda.com\users\Neil\shafter_2016_pea\2018_PEA\Shafter_2018_43-101_v13_pea.docx July 29, 2018 Print Date: 9/5/18 2:59 PM
Figure 11.5 Control Chart, Silver in Standard MEG-Au.09.03
Except for one unexplained high outlier, the results for MEG-Au.09.03 (Figure 11.5) exhibit a period of generally low bias from May through to the end of September 2012. In the first two weeks of October 2012, a distinct high bias is present, after which an overall low bias resumes. At the relatively low grade of this standard, the high failure count and the magnitudes of all but one of the failures themselves engender no concern with respect to the silver grades in the resource estimate. The one unusually high outlier is puzzling; it may be due to an analytical failure or to some other cause such as a sample mix-up.
excluded from stats
0.00
0.50
1.00
1.50
2.00
2.50
3.00
1-May-12 20-Jun-12 9-Aug-12 28-Sep-12 17-Nov-12 6-Jan-13
Silv
er
op
t
Date
Control Chart, Silver in Standard MEG-Au.09.03
Expected Ag opt Upper Warn Lower Warn UCL
LCL Silver_opt Mean Mean + 2SD
Mean - 2SD Mean + 3SD Mean - 3SD
blue lines represent this data set; red lines represent manufacturer's spec
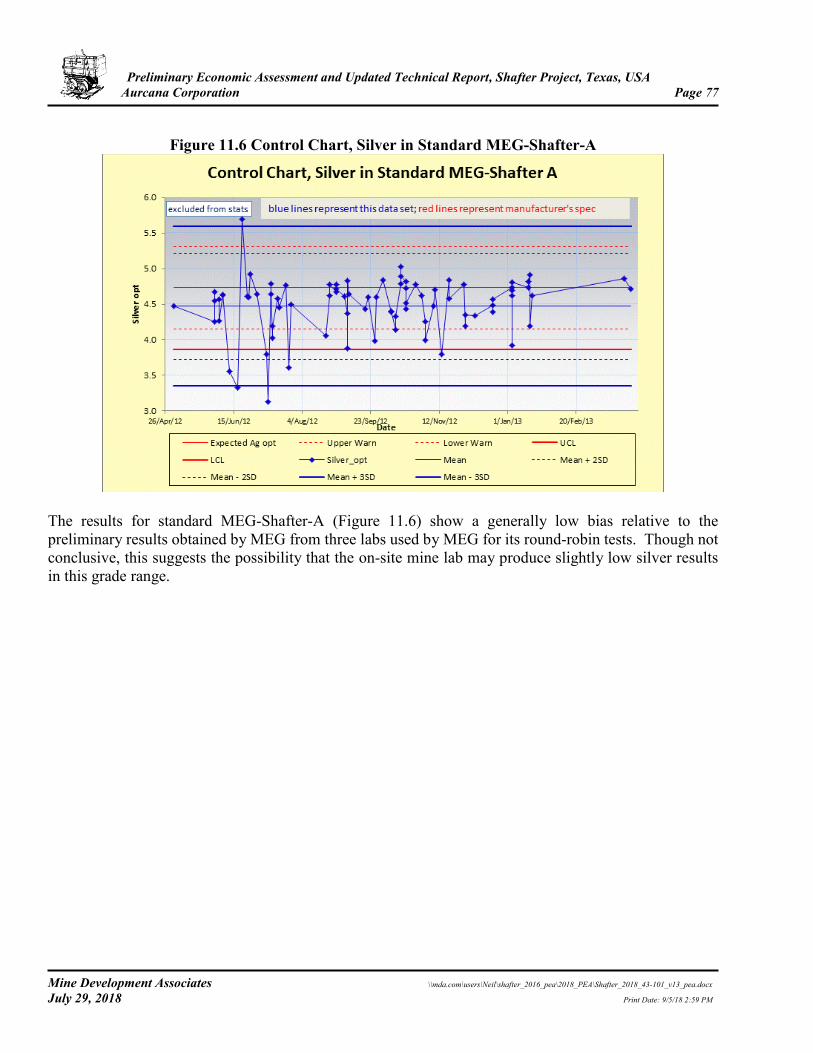
Preliminary Economic Assessment and Updated Technical Report, Shafter Project, Texas, USA Aurcana Corporation Page 77
Mine Development Associates \\mda.com\users\Neil\shafter_2016_pea\2018_PEA\Shafter_2018_43-101_v13_pea.docx July 29, 2018 Print Date: 9/5/18 2:59 PM
Figure 11.6 Control Chart, Silver in Standard MEG-Shafter-A
The results for standard MEG-Shafter-A (Figure 11.6) show a generally low bias relative to the preliminary results obtained by MEG from three labs used by MEG for its round-robin tests. Though not conclusive, this suggests the possibility that the on-site mine lab may produce slightly low silver results in this grade range.
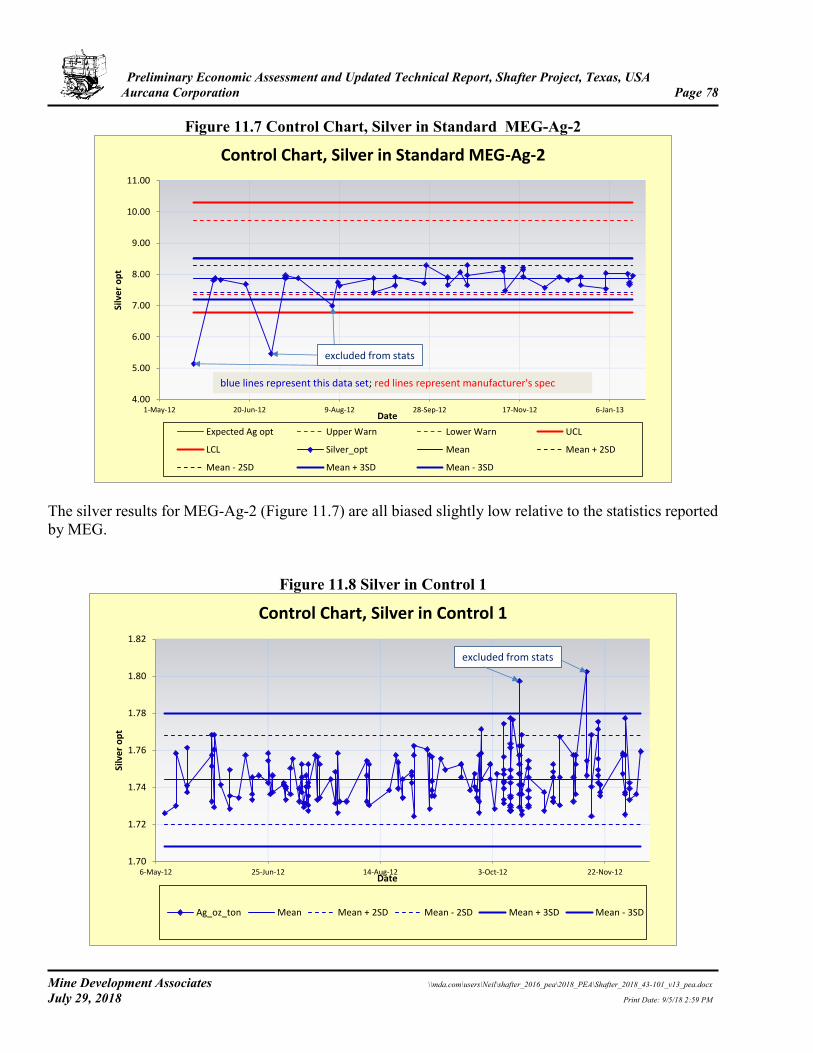
Preliminary Economic Assessment and Updated Technical Report, Shafter Project, Texas, USA Aurcana Corporation Page 78
Mine Development Associates \\mda.com\users\Neil\shafter_2016_pea\2018_PEA\Shafter_2018_43-101_v13_pea.docx July 29, 2018 Print Date: 9/5/18 2:59 PM
Figure 11.7 Control Chart, Silver in Standard MEG-Ag-2
The silver results for MEG-Ag-2 (Figure 11.7) are all biased slightly low relative to the statistics reported by MEG.
Figure 11.8 Silver in Control 1
4.00
5.00
6.00
7.00
8.00
9.00
10.00
11.00
1-May-12 20-Jun-12 9-Aug-12 28-Sep-12 17-Nov-12 6-Jan-13
Silv
er
op
t
Date
Control Chart, Silver in Standard MEG-Ag-2
Expected Ag opt Upper Warn Lower Warn UCL
LCL Silver_opt Mean Mean + 2SD
Mean - 2SD Mean + 3SD Mean - 3SD
blue lines represent this data set; red lines represent manufacturer's spec
excluded from stats
1.70
1.72
1.74
1.76
1.78
1.80
1.82
6-May-12 25-Jun-12 14-Aug-12 3-Oct-12 22-Nov-12
Silv
er
op
t
Date
Control Chart, Silver in Control 1
Ag_oz_ton Mean Mean + 2SD Mean - 2SD Mean + 3SD Mean - 3SD
excluded from stats
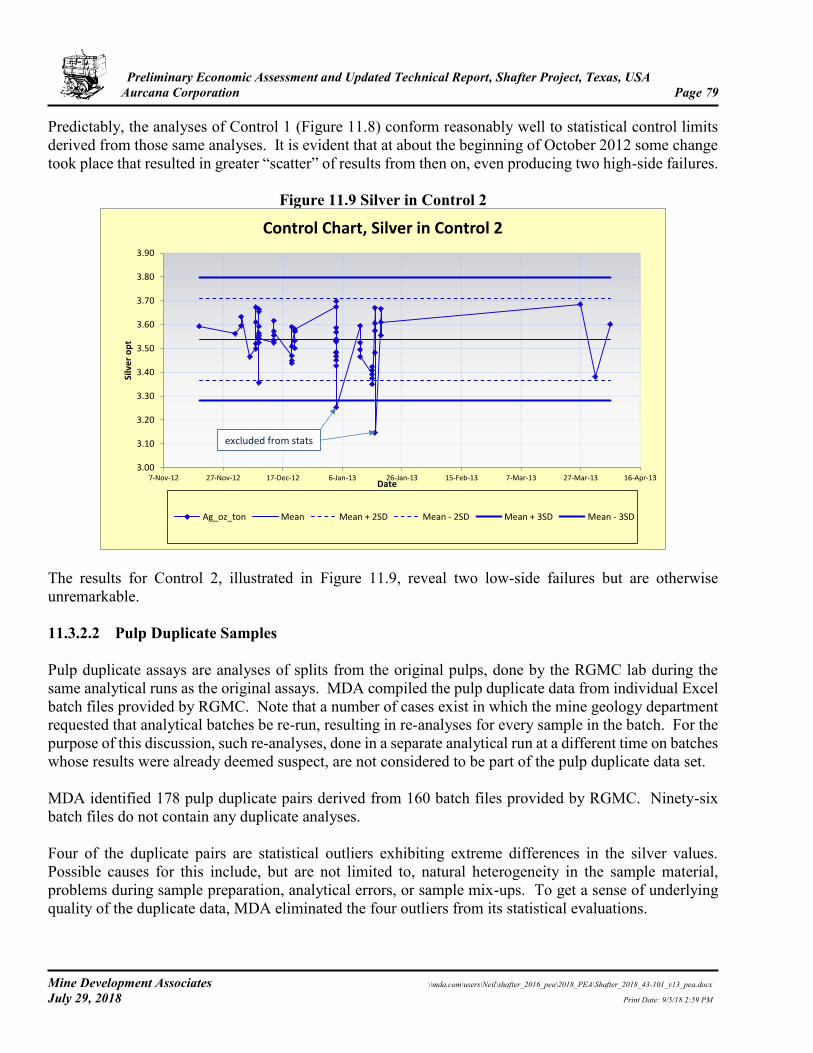
Preliminary Economic Assessment and Updated Technical Report, Shafter Project, Texas, USA Aurcana Corporation Page 79
Mine Development Associates \\mda.com\users\Neil\shafter_2016_pea\2018_PEA\Shafter_2018_43-101_v13_pea.docx July 29, 2018 Print Date: 9/5/18 2:59 PM
Predictably, the analyses of Control 1 (Figure 11.8) conform reasonably well to statistical control limits derived from those same analyses. It is evident that at about the beginning of October 2012 some change took place that resulted in greater “scatter” of results from then on, even producing two high-side failures.
Figure 11.9 Silver in Control 2
The results for Control 2, illustrated in Figure 11.9, reveal two low-side failures but are otherwise unremarkable. 11.3.2.2 Pulp Duplicate Samples Pulp duplicate assays are analyses of splits from the original pulps, done by the RGMC lab during the same analytical runs as the original assays. MDA compiled the pulp duplicate data from individual Excel batch files provided by RGMC. Note that a number of cases exist in which the mine geology department requested that analytical batches be re-run, resulting in re-analyses for every sample in the batch. For the purpose of this discussion, such re-analyses, done in a separate analytical run at a different time on batches whose results were already deemed suspect, are not considered to be part of the pulp duplicate data set. MDA identified 178 pulp duplicate pairs derived from 160 batch files provided by RGMC. Ninety-six batch files do not contain any duplicate analyses. Four of the duplicate pairs are statistical outliers exhibiting extreme differences in the silver values. Possible causes for this include, but are not limited to, natural heterogeneity in the sample material, problems during sample preparation, analytical errors, or sample mix-ups. To get a sense of underlying quality of the duplicate data, MDA eliminated the four outliers from its statistical evaluations.
3.00
3.10
3.20
3.30
3.40
3.50
3.60
3.70
3.80
3.90
7-Nov-12 27-Nov-12 17-Dec-12 6-Jan-13 26-Jan-13 15-Feb-13 7-Mar-13 27-Mar-13 16-Apr-13
Silv
er
op
t
Date
Control Chart, Silver in Control 2
Ag_oz_ton Mean Mean + 2SD Mean - 2SD Mean + 3SD Mean - 3SD
excluded from stats
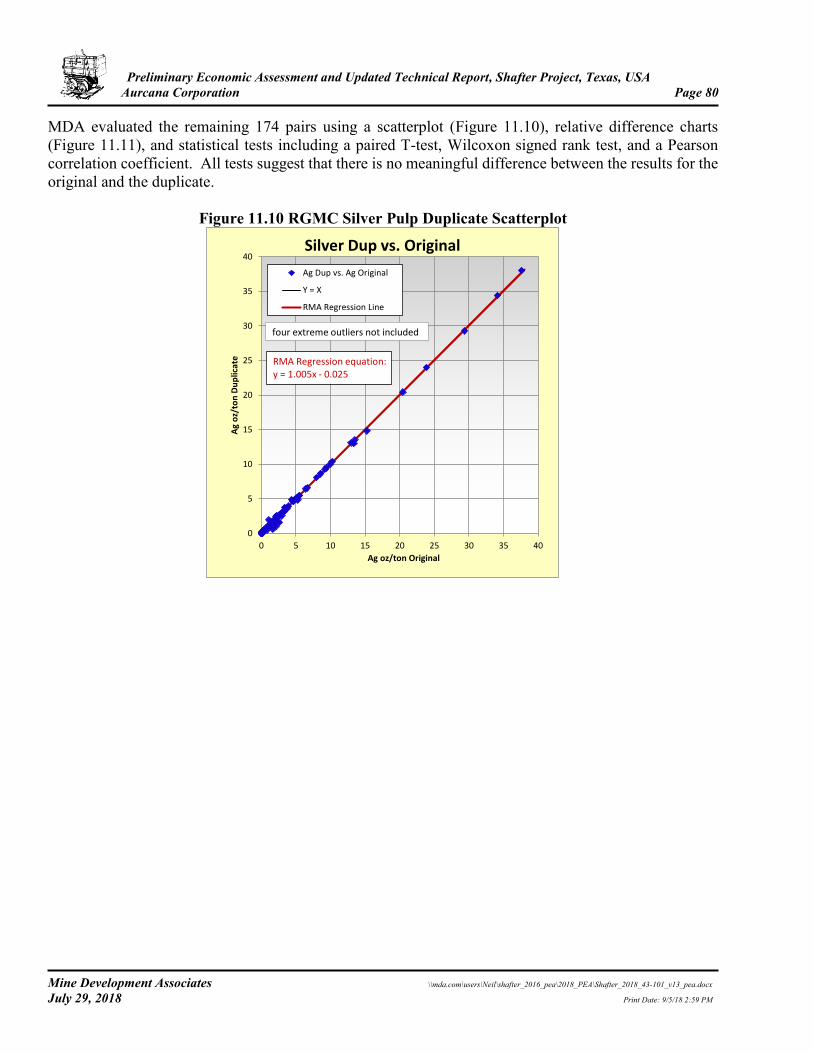
Preliminary Economic Assessment and Updated Technical Report, Shafter Project, Texas, USA Aurcana Corporation Page 80
Mine Development Associates \\mda.com\users\Neil\shafter_2016_pea\2018_PEA\Shafter_2018_43-101_v13_pea.docx July 29, 2018 Print Date: 9/5/18 2:59 PM
MDA evaluated the remaining 174 pairs using a scatterplot (Figure 11.10), relative difference charts (Figure 11.11), and statistical tests including a paired T-test, Wilcoxon signed rank test, and a Pearson correlation coefficient. All tests suggest that there is no meaningful difference between the results for the original and the duplicate.
Figure 11.10 RGMC Silver Pulp Duplicate Scatterplot
0
5
10
15
20
25
30
35
40
0 5 10 15 20 25 30 35 40
Ag
oz/
ton
Du
plic
ate
Ag oz/ton Original
Silver Dup vs. Original
Ag Dup vs. Ag Original
Y = X
RMA Regression Line
RMA Regression equation:y = 1.005x - 0.025
four extreme outliers not included
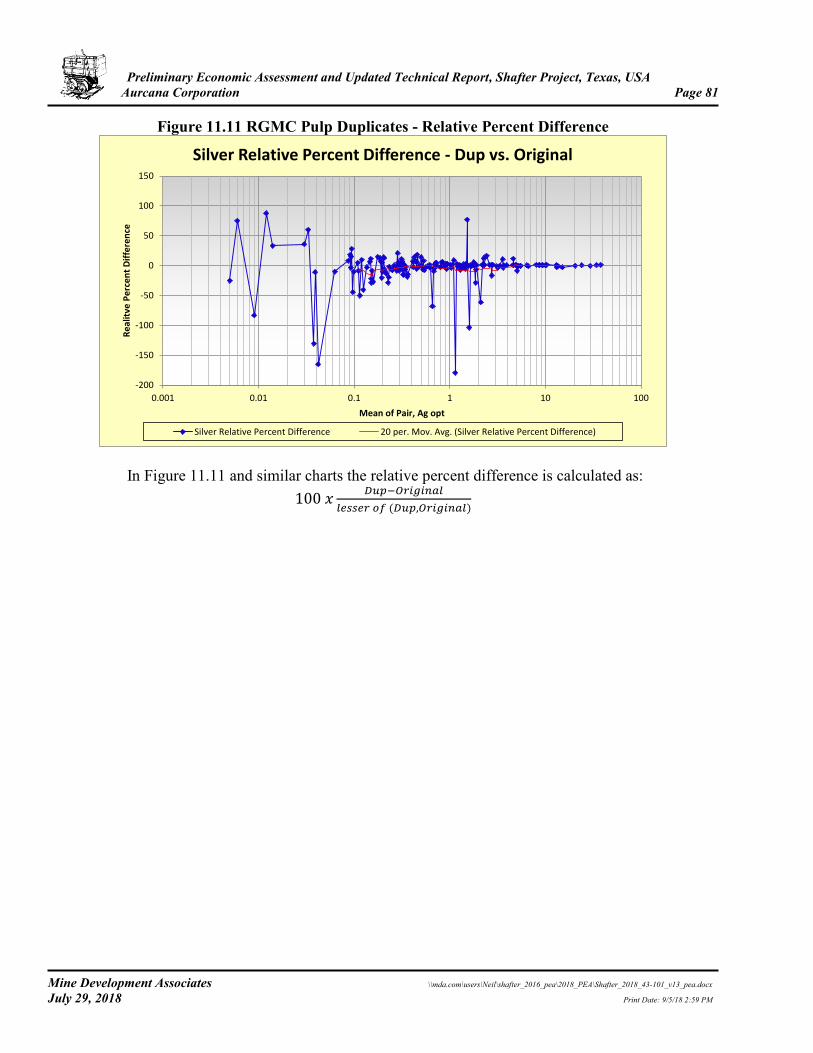
Preliminary Economic Assessment and Updated Technical Report, Shafter Project, Texas, USA Aurcana Corporation Page 81
Mine Development Associates \\mda.com\users\Neil\shafter_2016_pea\2018_PEA\Shafter_2018_43-101_v13_pea.docx July 29, 2018 Print Date: 9/5/18 2:59 PM
Figure 11.11 RGMC Pulp Duplicates - Relative Percent Difference
In Figure 11.11 and similar charts the relative percent difference is calculated as: 100 𝑥
𝐷𝑢𝑝−𝑂𝑟𝑖𝑔𝑖𝑛𝑎𝑙
𝑙𝑒𝑠𝑠𝑒𝑟 𝑜𝑓 (𝐷𝑢𝑝,𝑂𝑟𝑖𝑔𝑖𝑛𝑎𝑙)
-200
-150
-100
-50
0
50
100
150
0.001 0.01 0.1 1 10 100
Re
alit
ve P
erc
en
t D
iffe
ren
ce
Mean of Pair, Ag opt
Silver Relative Percent Difference - Dup vs. Original
Silver Relative Percent Difference 20 per. Mov. Avg. (Silver Relative Percent Difference)
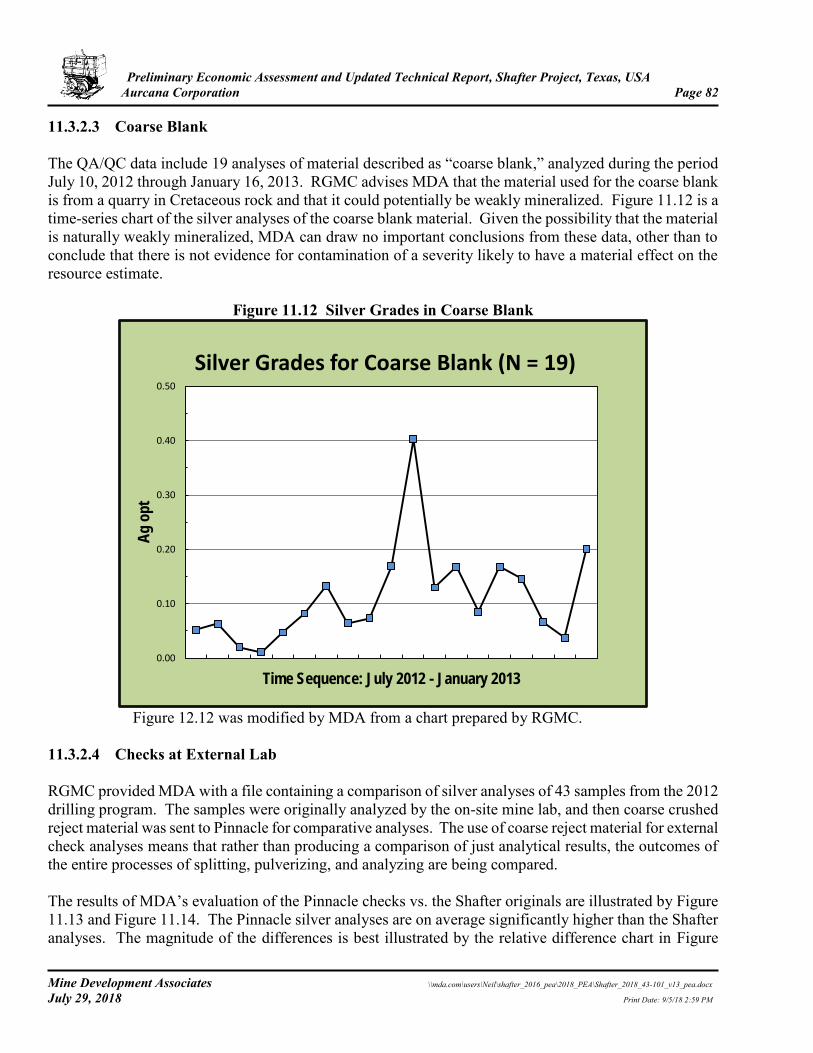
Preliminary Economic Assessment and Updated Technical Report, Shafter Project, Texas, USA Aurcana Corporation Page 82
Mine Development Associates \\mda.com\users\Neil\shafter_2016_pea\2018_PEA\Shafter_2018_43-101_v13_pea.docx July 29, 2018 Print Date: 9/5/18 2:59 PM
11.3.2.3 Coarse Blank The QA/QC data include 19 analyses of material described as “coarse blank,” analyzed during the period July 10, 2012 through January 16, 2013. RGMC advises MDA that the material used for the coarse blank is from a quarry in Cretaceous rock and that it could potentially be weakly mineralized. Figure 11.12 is a time-series chart of the silver analyses of the coarse blank material. Given the possibility that the material is naturally weakly mineralized, MDA can draw no important conclusions from these data, other than to conclude that there is not evidence for contamination of a severity likely to have a material effect on the resource estimate.
Figure 11.12 Silver Grades in Coarse Blank
Figure 12.12 was modified by MDA from a chart prepared by RGMC.
11.3.2.4 Checks at External Lab RGMC provided MDA with a file containing a comparison of silver analyses of 43 samples from the 2012 drilling program. The samples were originally analyzed by the on-site mine lab, and then coarse crushed reject material was sent to Pinnacle for comparative analyses. The use of coarse reject material for external check analyses means that rather than producing a comparison of just analytical results, the outcomes of the entire processes of splitting, pulverizing, and analyzing are being compared. The results of MDA’s evaluation of the Pinnacle checks vs. the Shafter originals are illustrated by Figure 11.13 and Figure 11.14. The Pinnacle silver analyses are on average significantly higher than the Shafter analyses. The magnitude of the differences is best illustrated by the relative difference chart in Figure
0.00
0.10
0.20
0.30
0.40
0.50
Ag
op
t
Time Sequence: July 2012 - January 2013
Silver Grades for Coarse Blank (N = 19)
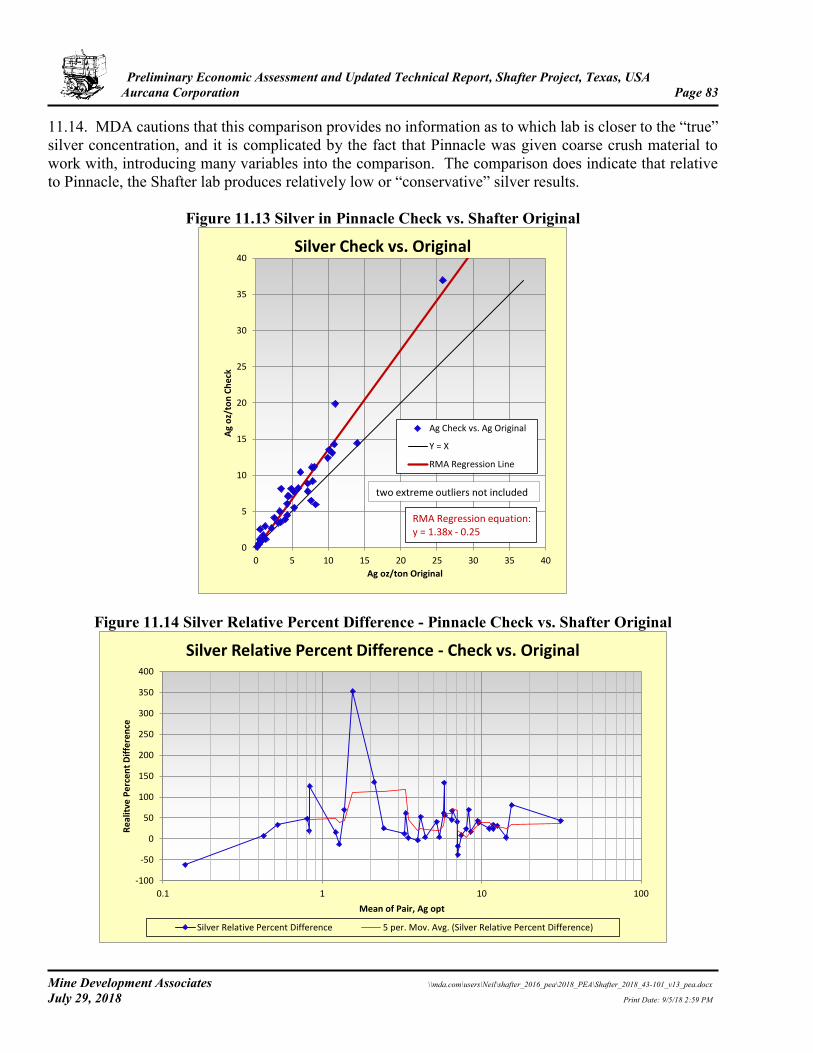
Preliminary Economic Assessment and Updated Technical Report, Shafter Project, Texas, USA Aurcana Corporation Page 83
Mine Development Associates \\mda.com\users\Neil\shafter_2016_pea\2018_PEA\Shafter_2018_43-101_v13_pea.docx July 29, 2018 Print Date: 9/5/18 2:59 PM
11.14. MDA cautions that this comparison provides no information as to which lab is closer to the “true” silver concentration, and it is complicated by the fact that Pinnacle was given coarse crush material to work with, introducing many variables into the comparison. The comparison does indicate that relative to Pinnacle, the Shafter lab produces relatively low or “conservative” silver results.
Figure 11.13 Silver in Pinnacle Check vs. Shafter Original
Figure 11.14 Silver Relative Percent Difference - Pinnacle Check vs. Shafter Original
0
5
10
15
20
25
30
35
40
0 5 10 15 20 25 30 35 40
Ag
oz/
ton
Ch
eck
Ag oz/ton Original
Silver Check vs. Original
Ag Check vs. Ag Original
Y = X
RMA Regression Line
RMA Regression equation:y = 1.38x - 0.25
two extreme outliers not included
-100
-50
0
50
100
150
200
250
300
350
400
0.1 1 10 100
Re
alit
ve P
erc
en
t D
iffe
ren
ce
Mean of Pair, Ag opt
Silver Relative Percent Difference - Check vs. Original
Silver Relative Percent Difference 5 per. Mov. Avg. (Silver Relative Percent Difference)
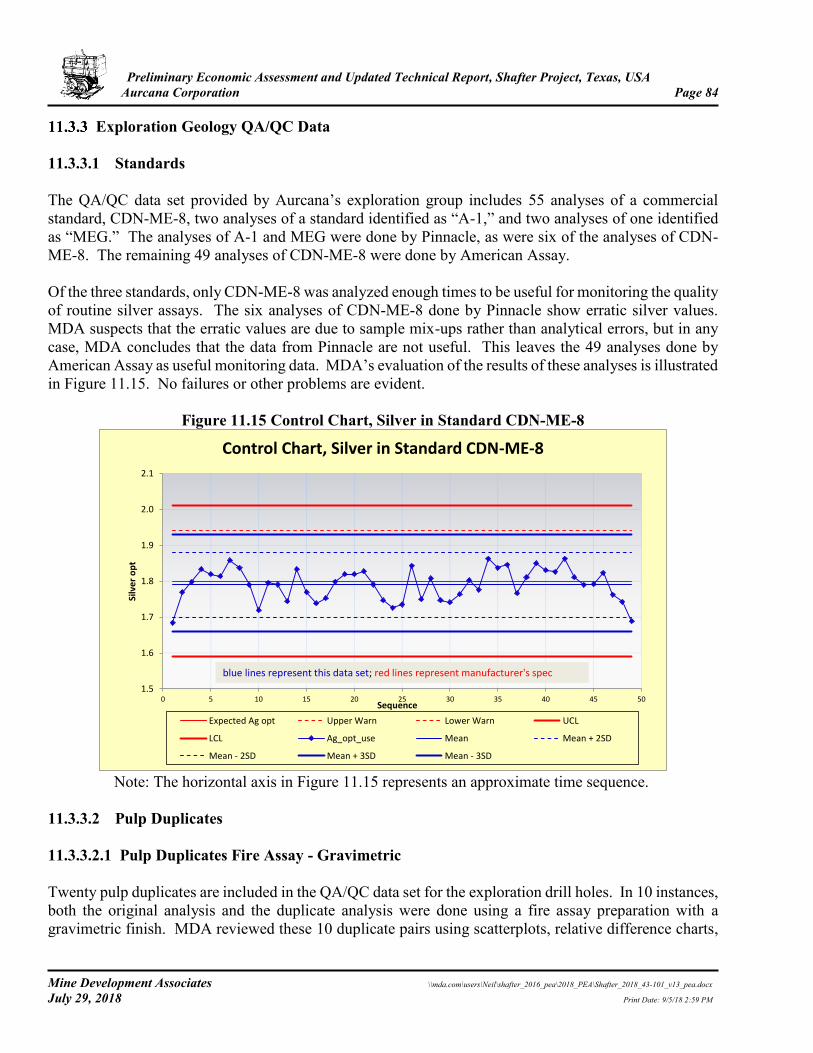
Preliminary Economic Assessment and Updated Technical Report, Shafter Project, Texas, USA Aurcana Corporation Page 84
Mine Development Associates \\mda.com\users\Neil\shafter_2016_pea\2018_PEA\Shafter_2018_43-101_v13_pea.docx July 29, 2018 Print Date: 9/5/18 2:59 PM
Exploration Geology QA/QC Data 11.3.3.1 Standards The QA/QC data set provided by Aurcana’s exploration group includes 55 analyses of a commercial standard, CDN-ME-8, two analyses of a standard identified as “A-1,” and two analyses of one identified as “MEG.” The analyses of A-1 and MEG were done by Pinnacle, as were six of the analyses of CDN-ME-8. The remaining 49 analyses of CDN-ME-8 were done by American Assay. Of the three standards, only CDN-ME-8 was analyzed enough times to be useful for monitoring the quality of routine silver assays. The six analyses of CDN-ME-8 done by Pinnacle show erratic silver values. MDA suspects that the erratic values are due to sample mix-ups rather than analytical errors, but in any case, MDA concludes that the data from Pinnacle are not useful. This leaves the 49 analyses done by American Assay as useful monitoring data. MDA’s evaluation of the results of these analyses is illustrated in Figure 11.15. No failures or other problems are evident.
Figure 11.15 Control Chart, Silver in Standard CDN-ME-8
Note: The horizontal axis in Figure 11.15 represents an approximate time sequence.
11.3.3.2 Pulp Duplicates 11.3.3.2.1 Pulp Duplicates Fire Assay - Gravimetric Twenty pulp duplicates are included in the QA/QC data set for the exploration drill holes. In 10 instances, both the original analysis and the duplicate analysis were done using a fire assay preparation with a gravimetric finish. MDA reviewed these 10 duplicate pairs using scatterplots, relative difference charts,
1.5
1.6
1.7
1.8
1.9
2.0
2.1
0 5 10 15 20 25 30 35 40 45 50
Silv
er
op
t
Sequence
Control Chart, Silver in Standard CDN-ME-8
Expected Ag opt Upper Warn Lower Warn UCL
LCL Ag_opt_use Mean Mean + 2SD
Mean - 2SD Mean + 3SD Mean - 3SD
blue lines represent this data set; red lines represent manufacturer's spec
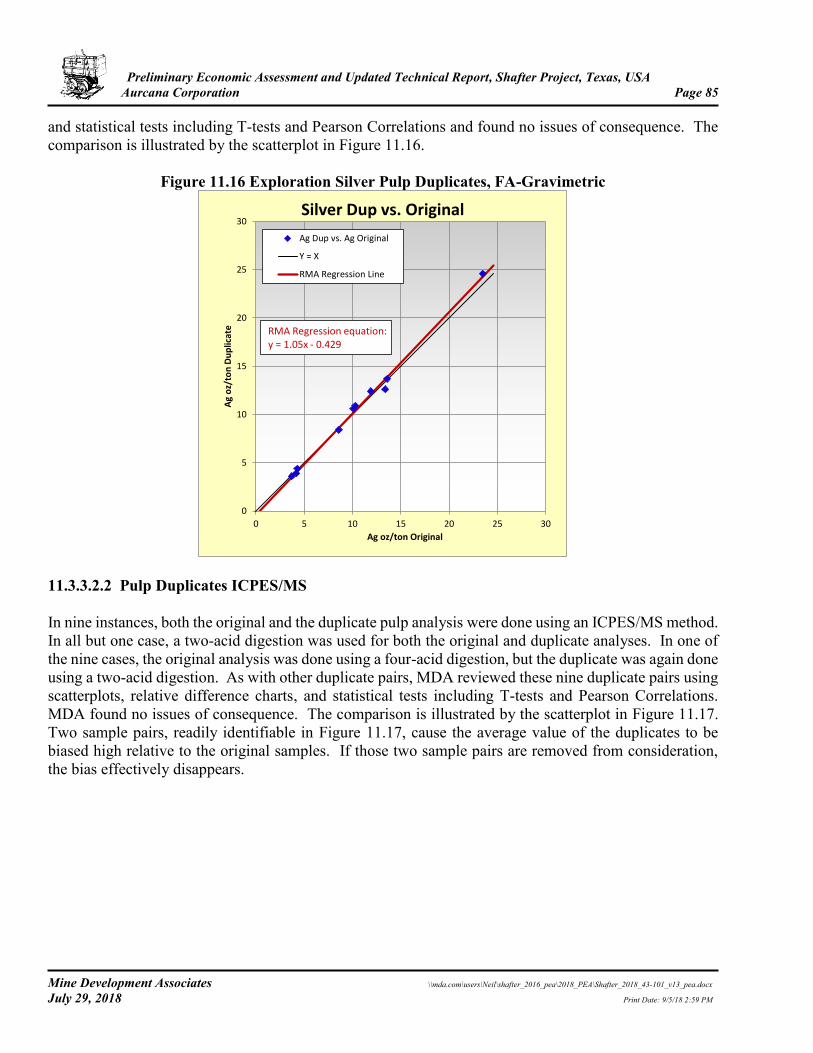
Preliminary Economic Assessment and Updated Technical Report, Shafter Project, Texas, USA Aurcana Corporation Page 85
Mine Development Associates \\mda.com\users\Neil\shafter_2016_pea\2018_PEA\Shafter_2018_43-101_v13_pea.docx July 29, 2018 Print Date: 9/5/18 2:59 PM
and statistical tests including T-tests and Pearson Correlations and found no issues of consequence. The comparison is illustrated by the scatterplot in Figure 11.16.
Figure 11.16 Exploration Silver Pulp Duplicates, FA-Gravimetric
11.3.3.2.2 Pulp Duplicates ICPES/MS In nine instances, both the original and the duplicate pulp analysis were done using an ICPES/MS method. In all but one case, a two-acid digestion was used for both the original and duplicate analyses. In one of the nine cases, the original analysis was done using a four-acid digestion, but the duplicate was again done using a two-acid digestion. As with other duplicate pairs, MDA reviewed these nine duplicate pairs using scatterplots, relative difference charts, and statistical tests including T-tests and Pearson Correlations. MDA found no issues of consequence. The comparison is illustrated by the scatterplot in Figure 11.17. Two sample pairs, readily identifiable in Figure 11.17, cause the average value of the duplicates to be biased high relative to the original samples. If those two sample pairs are removed from consideration, the bias effectively disappears.
0
5
10
15
20
25
30
0 5 10 15 20 25 30
Ag
oz/
ton
Du
plic
ate
Ag oz/ton Original
Silver Dup vs. Original
Ag Dup vs. Ag Original
Y = X
RMA Regression Line
RMA Regression equation:y = 1.05x - 0.429
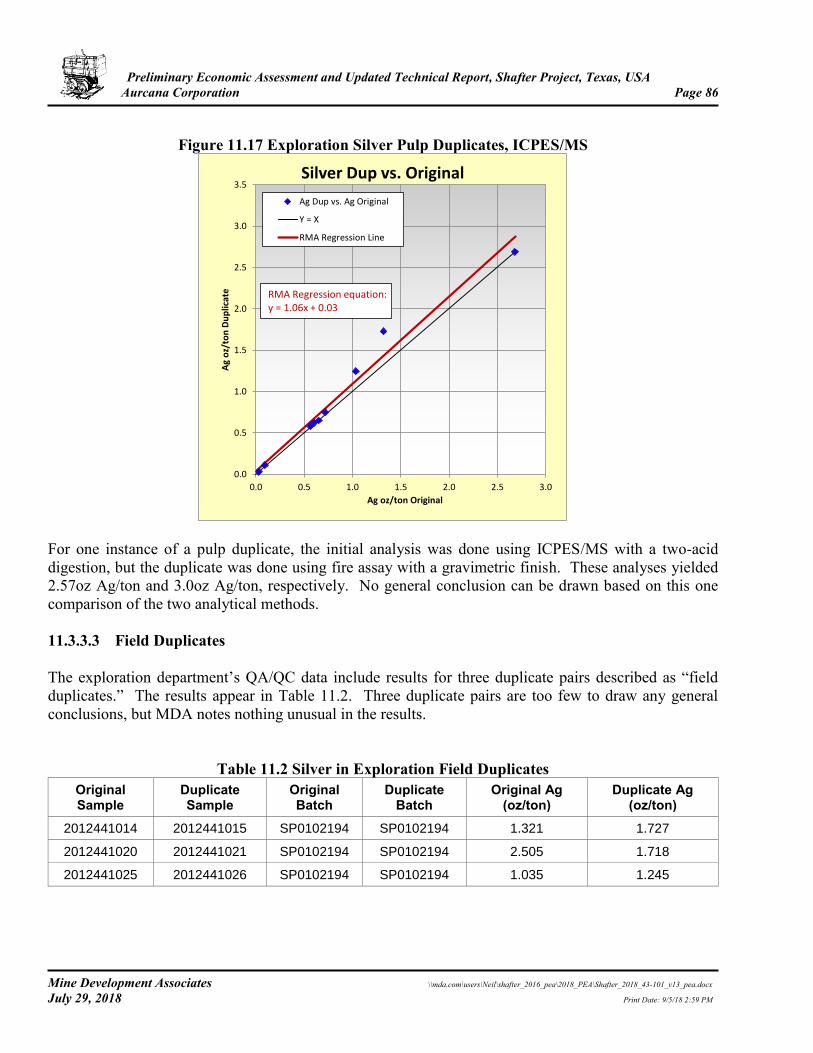
Preliminary Economic Assessment and Updated Technical Report, Shafter Project, Texas, USA Aurcana Corporation Page 86
Mine Development Associates \\mda.com\users\Neil\shafter_2016_pea\2018_PEA\Shafter_2018_43-101_v13_pea.docx July 29, 2018 Print Date: 9/5/18 2:59 PM
Figure 11.17 Exploration Silver Pulp Duplicates, ICPES/MS
For one instance of a pulp duplicate, the initial analysis was done using ICPES/MS with a two-acid digestion, but the duplicate was done using fire assay with a gravimetric finish. These analyses yielded 2.57oz Ag/ton and 3.0oz Ag/ton, respectively. No general conclusion can be drawn based on this one comparison of the two analytical methods. 11.3.3.3 Field Duplicates The exploration department’s QA/QC data include results for three duplicate pairs described as “field duplicates.” The results appear in Table 11.2. Three duplicate pairs are too few to draw any general conclusions, but MDA notes nothing unusual in the results.
Table 11.2 Silver in Exploration Field Duplicates
Original Sample
Duplicate Sample
Original Batch
Duplicate Batch
Original Ag (oz/ton)
Duplicate Ag (oz/ton)
2012441014 2012441015 SP0102194 SP0102194 1.321 1.727
2012441020 2012441021 SP0102194 SP0102194 2.505 1.718
2012441025 2012441026 SP0102194 SP0102194 1.035 1.245
0.0
0.5
1.0
1.5
2.0
2.5
3.0
3.5
0.0 0.5 1.0 1.5 2.0 2.5 3.0
Ag
oz/
ton
Du
plic
ate
Ag oz/ton Original
Silver Dup vs. Original
Ag Dup vs. Ag Original
Y = X
RMA Regression Line
RMA Regression equation:y = 1.06x + 0.03
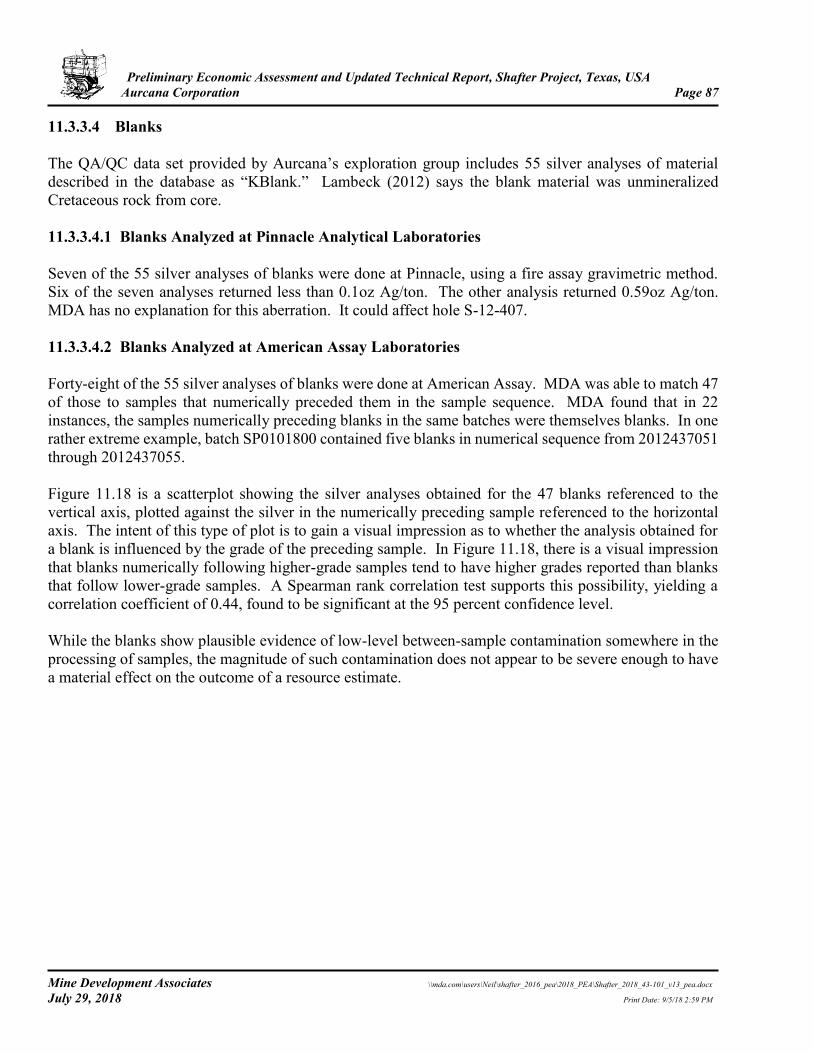
Preliminary Economic Assessment and Updated Technical Report, Shafter Project, Texas, USA Aurcana Corporation Page 87
Mine Development Associates \\mda.com\users\Neil\shafter_2016_pea\2018_PEA\Shafter_2018_43-101_v13_pea.docx July 29, 2018 Print Date: 9/5/18 2:59 PM
11.3.3.4 Blanks The QA/QC data set provided by Aurcana’s exploration group includes 55 silver analyses of material described in the database as “KBlank.” Lambeck (2012) says the blank material was unmineralized Cretaceous rock from core. 11.3.3.4.1 Blanks Analyzed at Pinnacle Analytical Laboratories Seven of the 55 silver analyses of blanks were done at Pinnacle, using a fire assay gravimetric method. Six of the seven analyses returned less than 0.1oz Ag/ton. The other analysis returned 0.59oz Ag/ton. MDA has no explanation for this aberration. It could affect hole S-12-407. 11.3.3.4.2 Blanks Analyzed at American Assay Laboratories Forty-eight of the 55 silver analyses of blanks were done at American Assay. MDA was able to match 47 of those to samples that numerically preceded them in the sample sequence. MDA found that in 22 instances, the samples numerically preceding blanks in the same batches were themselves blanks. In one rather extreme example, batch SP0101800 contained five blanks in numerical sequence from 2012437051 through 2012437055. Figure 11.18 is a scatterplot showing the silver analyses obtained for the 47 blanks referenced to the vertical axis, plotted against the silver in the numerically preceding sample referenced to the horizontal axis. The intent of this type of plot is to gain a visual impression as to whether the analysis obtained for a blank is influenced by the grade of the preceding sample. In Figure 11.18, there is a visual impression that blanks numerically following higher-grade samples tend to have higher grades reported than blanks that follow lower-grade samples. A Spearman rank correlation test supports this possibility, yielding a correlation coefficient of 0.44, found to be significant at the 95 percent confidence level. While the blanks show plausible evidence of low-level between-sample contamination somewhere in the processing of samples, the magnitude of such contamination does not appear to be severe enough to have a material effect on the outcome of a resource estimate.
Preliminary Economic Assessment and Updated Technical Report, Shafter Project, Texas, USA Aurcana Corporation Page 88
Mine Development Associates \\mda.com\users\Neil\shafter_2016_pea\2018_PEA\Shafter_2018_43-101_v13_pea.docx July 29, 2018 Print Date: 9/5/18 2:59 PM
Figure 11.18 Silver in Exploration Blanks vs. Preceding Sample
11.4 Security MDA has no information on sample security used by operators prior to Aurcana’s recent drilling. For the 2011-2012 drilling, Aurcana’s samples were sent to either Pinnacle or American Assay by courier, with pulps and rejects returned by courier. Drill core is stored within secure facilities within the the gated mine property. 11.5 Summary MDA is of the opinion that the sampling methods, security, analytical procedures, and QAQC procedures and results indicate that the data are adequate for mineral resource estimation. Principal findings from the data verification are:
• There is limited information available on the sampling methodology employed by Amax and Gold Fields. These were well respected mining companies with a long history of operational experience and the results obtained by each company generally agreed with the RGMC results.
• There is no QA/QC data on the Amax drilling which is reflected in the Mineral Resource classification.
• The limited Gold Fields QA/QC data indicate that these assay data are sufficiently accurate for use in Mineral Resource estimation.
0.001
0.01
0.1
1
0.001 0.01 0.1 1 10
Ag
op
t B
lan
k
Ag opt Preceding Sample
Silver in Blank vs. Preceding Sample
Ag Blank vs. Preceding
Ag_5x_det_lmt
Preliminary Economic Assessment and Updated Technical Report, Shafter Project, Texas, USA Aurcana Corporation Page 89
Mine Development Associates \\mda.com\users\Neil\shafter_2016_pea\2018_PEA\Shafter_2018_43-101_v13_pea.docx July 29, 2018 Print Date: 9/5/18 2:59 PM
• There is limited evidence from standard and second lab check analyses that the RGMC lab shows a low bias in the silver grades. MDA does not believe this bias has a material effect on the resource estimate.
The authors are not aware of any other sampling or assaying factors that may materially impact the mineral resources discussed in Section 14.0
Preliminary Economic Assessment and Updated Technical Report, Shafter Project, Texas, USA Aurcana Corporation Page 90
Mine Development Associates \\mda.com\users\Neil\shafter_2016_pea\2018_PEA\Shafter_2018_43-101_v13_pea.docx July 29, 2018 Print Date: 9/5/18 2:59 PM
12.0 DATA VERIFICATION The following section is derived from Tietz and MacFarlane (2016) which is still current as no new data has been added to the database. The data verification procedures described herein as being completed by MDA were devised, implemented and directly supervised by Paul Tietz. Data verification, as defined in NI 43-101, is the process of confirming that data has been generated with proper procedures, has been accurately transcribed from the original source and is suitable to be used. The drilling, sampling, and assay procedures used to generate the Shafter drill data, which are described in Sections 10.0 and 11.0, were reviewed and are considered to be proper and appropriate with no material concerns. The transcription of the data into the current digital database was verified through a detailed audit of the historical and Aurcana assay and collar drill data. The audit included a verification of about 40 percent of the project assay data. Drill hole geology was verified using geologic cross-sections and maps along with a visual inspection of select core intervals. The use of hand-drawn cross-sections and maps was a limitation on verifying the Amax drill data while there was a failure to audit some of the Gold Fields drill data due to a lack of source material. Further details on the data audit procedures and results are in Section 12.1. Additional confirmation on the drill data’s suitability for use are the analyses of the Gold Fields and Aurcana QA/QC procedures and results as described in Section 11.3. No material issues were noted in the QA/QC data which would cause concern with the use of the data. 12.1 Database Audit In April of 2013, Peter Ronning, an MDA associate working under the direction and supervision of the QP, visited the Shafter site for 4 ½ days and worked in the mine-site technical office. A principal task during that week was to search through 16 file cabinets and a dozen cardboard boxes that contain many of the historical records of the Shafter operation, looking for original sources of data to compare with the current digital database.
Assay Table The primary focus of MDA’s database audit was the assay table. There were two principal components of this work: the audit of the historical assays with reference to paper sources, and the audit of the assays produced by the drilling done by RGMC in the period 2011 to 2013 with reference to digital sources. 12.1.1.1 Historical Assays Large numbers of historical assay certificates and related records exist, in multiple files at several locations within the file cabinets and boxes at the mine-site office. MDA requested that RGMC scan these records to PDF files, a task that RGMC was able to complete during the week that MDA was at the site. There is considerable repetition of the same documents among different file folders, cabinets, and boxes, but MDA asked to have everything that seemed relevant scanned and sorted out duplications and redundancies after the site visit. In the assay certificates, it is usually, though not always, possible to ascertain from which drill hole samples originated. However, it is not common for the certificates to contain any information about
Preliminary Economic Assessment and Updated Technical Report, Shafter Project, Texas, USA Aurcana Corporation Page 91
Mine Development Associates \\mda.com\users\Neil\shafter_2016_pea\2018_PEA\Shafter_2018_43-101_v13_pea.docx July 29, 2018 Print Date: 9/5/18 2:59 PM
sample intervals. As sources for sample intervals, MDA resorted to hand-written drill-hole summary records, in which assays had been entered and matched to the sample intervals by the original workers. MDA used the combination of assay certificates and summary records to match assays to drill holes and intervals in the digital assay table. In a small number of cases, no summary records existed, so while MDA was able to verify that the assays for a hole in the database match the assays on a certificate, MDA was not able to verify that the assays were assigned to the correct intervals. Roughly a third of the historical assay records, and almost 60 percent of the historical records that MDA checked, have hole identifiers that consist only of numeric digits (e.g. “1095”). These holes are assigned to the “numeric” series in Table 12.1. Most, if not all, of these holes were drilled for Amax. All of the assay records in the “numeric” series were drilled for Amax. Assay certificates, or indeed even hand-written summaries of assays, are not available for these holes. However, the drill holes appear on a series of undated cross-sections with basic geological interpretations, and each cross section has in one corner a table setting out the assays for those holes that appear on the section. In reviewing these cross-sections, it was discovered that there were a significant number of AMAX drill holes that were on the cross-sections but not in the RGMC database. As described in Section 12.1.3, these drill holes were added to the database, getting locations from the cross sections and related plan views, and getting the assays from the tables on the cross-sections. Subsequently, different persons associated with MDA double-checked about 68 percent of the assay table records that MDA had entered, as indicated in Table 12.1.
One complicating factor that MDA encountered is that the historical drill-hole identifiers (names) used in the original typed assay certificates, hand-written logs, and hand-written summaries are very commonly not the same as the hole identifiers in the digital assay table, but are altered and usually shortened versions (see for example Table 12.3). It is likely that the digital assay table was first compiled at a time when computer memory and data storage capacity were very limited. It was common for software to impose limits on the sizes of data fields to conserve computing resources, and this is probably why many of the original Shafter hole identifiers were shortened. In most cases, the shortened identifiers are recognizably similar to the original long ones, but in a few cases, particularly those of underground drill holes, the identifiers in the database are quite unlike those in the original records. These could be matched to original ones only by matching the locations and orientations. In general, MDA found that the data entry in the historical database was very accurate. Table 12.1 summarizes the results of the checks. Note that for four of the drill-hole series listed in Table 12.1, MDA did not have original sources to use for checking the assays. This does not necessarily mean that original sources do not exist, only that they did not come to hand during MDA’s record search in April of 2013.
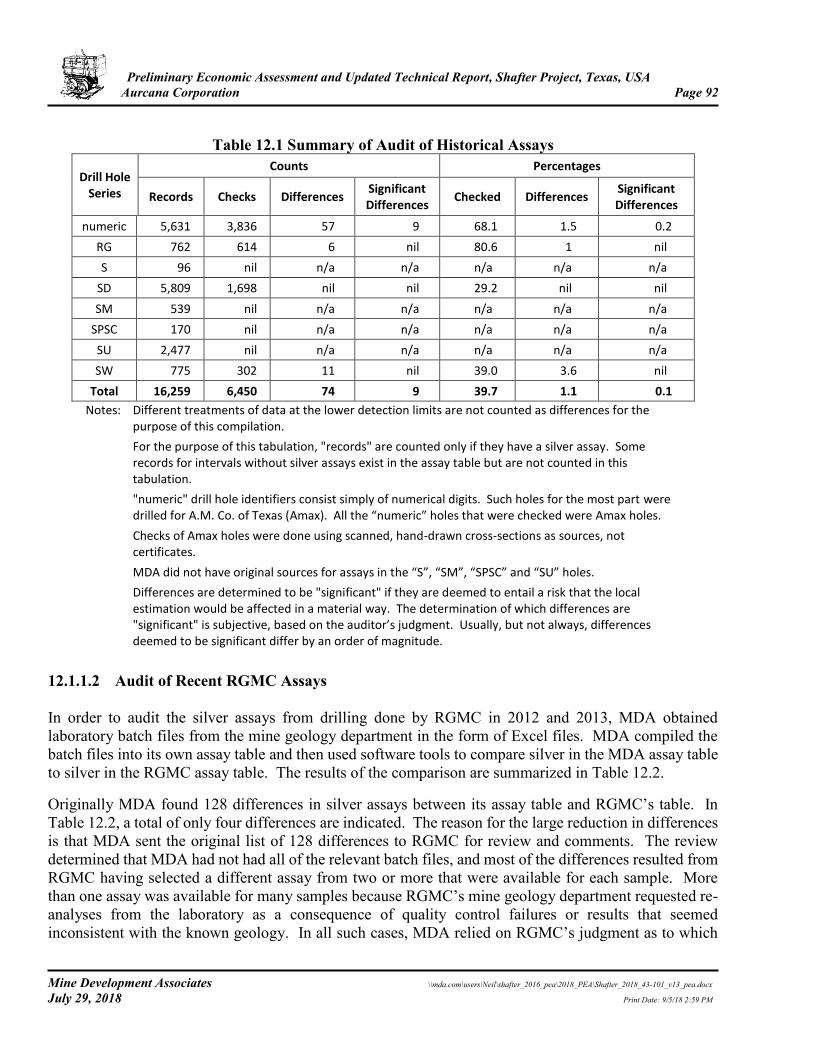
Preliminary Economic Assessment and Updated Technical Report, Shafter Project, Texas, USA Aurcana Corporation Page 92
Mine Development Associates \\mda.com\users\Neil\shafter_2016_pea\2018_PEA\Shafter_2018_43-101_v13_pea.docx July 29, 2018 Print Date: 9/5/18 2:59 PM
Table 12.1 Summary of Audit of Historical Assays
Drill Hole Series
Counts Percentages
Records Checks Differences Significant Differences
Checked Differences Significant Differences
numeric 5,631 3,836 57 9 68.1 1.5 0.2
RG 762 614 6 nil 80.6 1 nil
S 96 nil n/a n/a n/a n/a n/a
SD 5,809 1,698 nil nil 29.2 nil nil
SM 539 nil n/a n/a n/a n/a n/a
SPSC 170 nil n/a n/a n/a n/a n/a
SU 2,477 nil n/a n/a n/a n/a n/a
SW 775 302 11 nil 39.0 3.6 nil
Total 16,259 6,450 74 9 39.7 1.1 0.1
Notes: Different treatments of data at the lower detection limits are not counted as differences for the purpose of this compilation.
For the purpose of this tabulation, "records" are counted only if they have a silver assay. Some records for intervals without silver assays exist in the assay table but are not counted in this tabulation.
"numeric" drill hole identifiers consist simply of numerical digits. Such holes for the most part were drilled for A.M. Co. of Texas (Amax). All the “numeric” holes that were checked were Amax holes.
Checks of Amax holes were done using scanned, hand-drawn cross-sections as sources, not certificates.
MDA did not have original sources for assays in the “S”, “SM”, “SPSC” and “SU” holes.
Differences are determined to be "significant" if they are deemed to entail a risk that the local estimation would be affected in a material way. The determination of which differences are "significant" is subjective, based on the auditor’s judgment. Usually, but not always, differences deemed to be significant differ by an order of magnitude.
12.1.1.2 Audit of Recent RGMC Assays In order to audit the silver assays from drilling done by RGMC in 2012 and 2013, MDA obtained laboratory batch files from the mine geology department in the form of Excel files. MDA compiled the batch files into its own assay table and then used software tools to compare silver in the MDA assay table to silver in the RGMC assay table. The results of the comparison are summarized in Table 12.2. Originally MDA found 128 differences in silver assays between its assay table and RGMC’s table. In Table 12.2, a total of only four differences are indicated. The reason for the large reduction in differences is that MDA sent the original list of 128 differences to RGMC for review and comments. The review determined that MDA had not had all of the relevant batch files, and most of the differences resulted from RGMC having selected a different assay from two or more that were available for each sample. More than one assay was available for many samples because RGMC’s mine geology department requested re-analyses from the laboratory as a consequence of quality control failures or results that seemed inconsistent with the known geology. In all such cases, MDA relied on RGMC’s judgment as to which
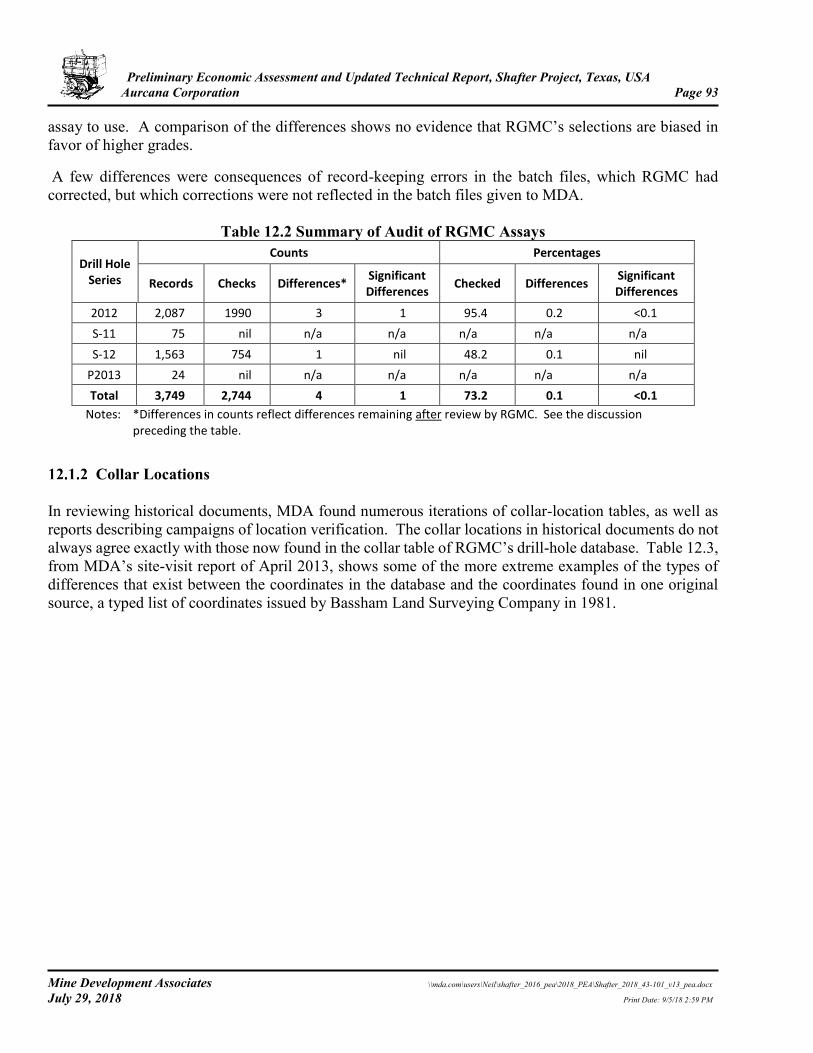
Preliminary Economic Assessment and Updated Technical Report, Shafter Project, Texas, USA Aurcana Corporation Page 93
Mine Development Associates \\mda.com\users\Neil\shafter_2016_pea\2018_PEA\Shafter_2018_43-101_v13_pea.docx July 29, 2018 Print Date: 9/5/18 2:59 PM
assay to use. A comparison of the differences shows no evidence that RGMC’s selections are biased in favor of higher grades. A few differences were consequences of record-keeping errors in the batch files, which RGMC had corrected, but which corrections were not reflected in the batch files given to MDA.
Table 12.2 Summary of Audit of RGMC Assays
Drill Hole Series
Counts Percentages
Records Checks Differences* Significant Differences
Checked Differences Significant Differences
2012 2,087 1990 3 1 95.4 0.2 <0.1
S-11 75 nil n/a n/a n/a n/a n/a
S-12 1,563 754 1 nil 48.2 0.1 nil
P2013 24 nil n/a n/a n/a n/a n/a
Total 3,749 2,744 4 1 73.2 0.1 <0.1
Notes: *Differences in counts reflect differences remaining after review by RGMC. See the discussion preceding the table.
Collar Locations
In reviewing historical documents, MDA found numerous iterations of collar-location tables, as well as reports describing campaigns of location verification. The collar locations in historical documents do not always agree exactly with those now found in the collar table of RGMC’s drill-hole database. Table 12.3, from MDA’s site-visit report of April 2013, shows some of the more extreme examples of the types of differences that exist between the coordinates in the database and the coordinates found in one original source, a typed list of coordinates issued by Bassham Land Surveying Company in 1981.
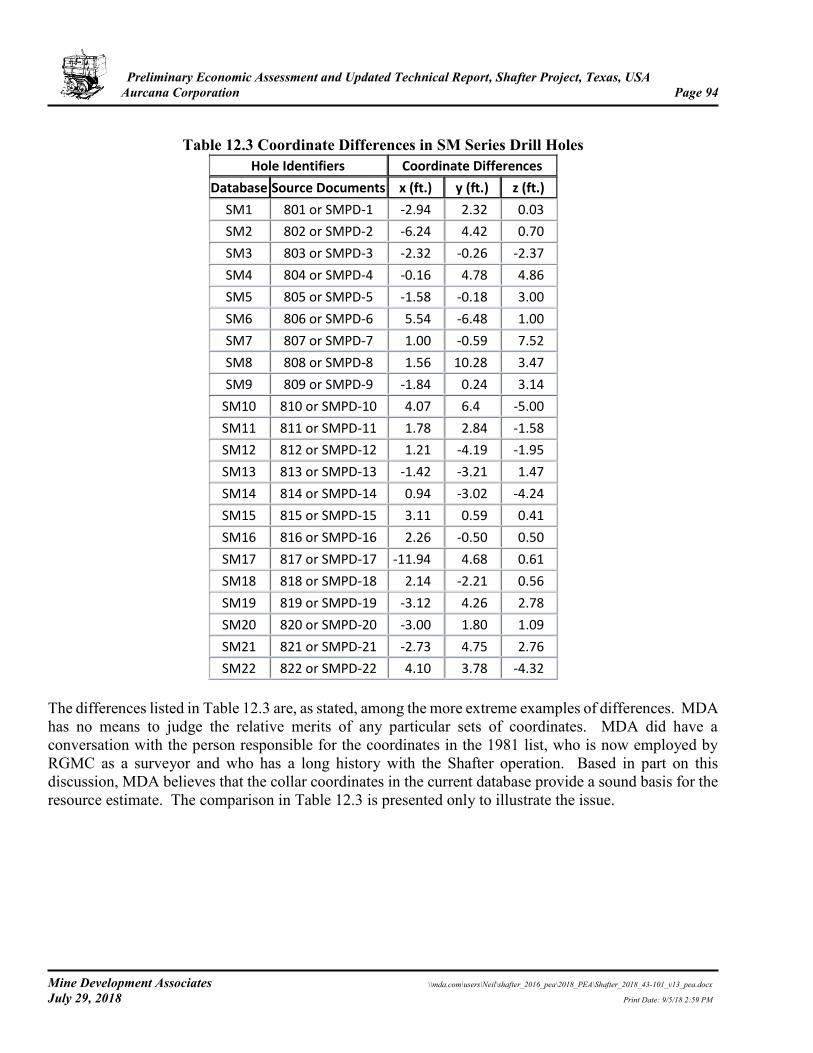
Preliminary Economic Assessment and Updated Technical Report, Shafter Project, Texas, USA Aurcana Corporation Page 94
Mine Development Associates \\mda.com\users\Neil\shafter_2016_pea\2018_PEA\Shafter_2018_43-101_v13_pea.docx July 29, 2018 Print Date: 9/5/18 2:59 PM
Table 12.3 Coordinate Differences in SM Series Drill Holes
Hole Identifiers Coordinate Differences
Database Source Documents x (ft.) y (ft.) z (ft.) SM1 801 or SMPD-1 -2.94 2.32 0.03
SM2 802 or SMPD-2 -6.24 4.42 0.70
SM3 803 or SMPD-3 -2.32 -0.26 -2.37
SM4 804 or SMPD-4 -0.16 4.78 4.86
SM5 805 or SMPD-5 -1.58 -0.18 3.00
SM6 806 or SMPD-6 5.54 -6.48 1.00
SM7 807 or SMPD-7 1.00 -0.59 7.52
SM8 808 or SMPD-8 1.56 10.28 3.47
SM9 809 or SMPD-9 -1.84 0.24 3.14
SM10 810 or SMPD-10 4.07 6.4 -5.00
SM11 811 or SMPD-11 1.78 2.84 -1.58
SM12 812 or SMPD-12 1.21 -4.19 -1.95
SM13 813 or SMPD-13 -1.42 -3.21 1.47
SM14 814 or SMPD-14 0.94 -3.02 -4.24
SM15 815 or SMPD-15 3.11 0.59 0.41
SM16 816 or SMPD-16 2.26 -0.50 0.50
SM17 817 or SMPD-17 -11.94 4.68 0.61
SM18 818 or SMPD-18 2.14 -2.21 0.56
SM19 819 or SMPD-19 -3.12 4.26 2.78
SM20 820 or SMPD-20 -3.00 1.80 1.09
SM21 821 or SMPD-21 -2.73 4.75 2.76
SM22 822 or SMPD-22 4.10 3.78 -4.32
The differences listed in Table 12.3 are, as stated, among the more extreme examples of differences. MDA has no means to judge the relative merits of any particular sets of coordinates. MDA did have a conversation with the person responsible for the coordinates in the 1981 list, who is now employed by RGMC as a surveyor and who has a long history with the Shafter operation. Based in part on this discussion, MDA believes that the collar coordinates in the current database provide a sound basis for the resource estimate. The comparison in Table 12.3 is presented only to illustrate the issue.
Preliminary Economic Assessment and Updated Technical Report, Shafter Project, Texas, USA Aurcana Corporation Page 95
Mine Development Associates \\mda.com\users\Neil\shafter_2016_pea\2018_PEA\Shafter_2018_43-101_v13_pea.docx July 29, 2018 Print Date: 9/5/18 2:59 PM
Historical Drill Data Added to Database The existing project database did not include data on many of the Amax drill holes found on the geologic cross-sections and/or plan maps. These drill holes had not been in the original collar or assay table that MDA received from RGMC. MDA and RGMC worked together to add these holes, getting locations and geology, if available, from the cross-sections and related plan views and getting the assays, if available, from the tables on the cross-sections. A total of 589 underground holes and 56 surface core holes were added to the database. Of this total, 464 of the Amax drill holes had no recorded assay data within the cross-section assay tables. In a similar manner as MDA treated the unsampled intervals in those Amax holes which had partial assay data, the unsampled drill holes were considered unmineralized in the database and in the resource estimate. In addition to the Amax drilling, 10 Gold Fields surface core holes, all within or adjacent to the current resource, were also added to the database.
Verification of Historical Amax Drill Data There are no original collar surveys or assay certificates for the historical Amax core drilling which makes up about 60 percent of the total project drill holes and about 45 percent of the samples used in the current resource estimate. To provide confidence in the drill data, during the audit process the drill holes were checked against the hand-drawn cross-sections and plan maps which provide locations and downhole survey information relative to known underground workings and development drifts. The sections and maps also have the historical mine grid so collar locations can be checked to within a 5 to 10 ft accuracy. MDA reviewed the Amax hole locations and made some minor edits so that the hole locations correlate in space with the underground workings. To provide confidence in the use of the Amax assay data, MDA audited a large portion of the sample data and also statistically compared the Amax composites used in the resource estimate against similar Gold Fields and Aurcana composite data. Only Gold Fields and Aurcana composites located within the historical Presidio mine area was used in the analyses so they would be generally spatially coincident with the Amax data. The analyses indicate that the Amax composites are about 13% higher in mean silver grade versus the more recent drill data but the median silver value is within 5%. Graphs of the population plots closely track each other with the higher difference in mean silver grade being a result of higher extreme silver values (>20oz Aug/ton) within the upper 2% of the composite data. It is not surprising that the Amax data would contain a larger proportion of higher grade samples since much of the Amax drilling is adjoining the historical mine stopes while the more recent drilling targeted areas between the historical workings or along possible extensions of mineralization away from the known areas of mineralization. The hole location verification and sample data comparisons provides confidence in the use of the Amax data. It also must be recognized that Amax was a large mining company with productive mining operations and it is expected that their drilling, sampling and assay procedures were of high quality.
Preliminary Economic Assessment and Updated Technical Report, Shafter Project, Texas, USA Aurcana Corporation Page 96
Mine Development Associates \\mda.com\users\Neil\shafter_2016_pea\2018_PEA\Shafter_2018_43-101_v13_pea.docx July 29, 2018 Print Date: 9/5/18 2:59 PM
12.2 Data Verification Summary and Conclusions MDA is of the opinion that the data verification procedures support the geologic interpretations and confirm the database quality. Therefore, the Shafter database is suitable for use in estimating and classifying a Mineral Resource. Principal findings from the data verification are:
o About 40 percent of the assay data was verified by MDA. Any errors found were corrected for use in the resource estimate.
o The use of hand-drawn cross-sections and maps was a limitation on verifying the Amax drill data while there was a failure to audit some of the Gold Fields drill data due to a lack of source material.
o A significant number of historical Amax drill holes were added to the project database as a result of MDA’s audit. Research efforts to ensure all Amax drill data is added to the database should be continued.
o Confidence in the use of the Amax assay data was provided after MDA audited a large portion of the sample data and also statistically compared the Amax composites used in the resource estimate against similar Gold Fields and Aurcana composite data. No material concerns were noted.
Preliminary Economic Assessment and Updated Technical Report, Shafter Project, Texas, USA Aurcana Corporation Page 97
Mine Development Associates \\mda.com\users\Neil\shafter_2016_pea\2018_PEA\Shafter_2018_43-101_v13_pea.docx July 29, 2018 Print Date: 9/5/18 2:59 PM
13.0 MINERAL PROCESSING AND METALLURGICAL TESTWORK This section was prepared by Matt Bender of Samuel Engineering, Inc., located in Denver, Colorado. The term “ore” is used in this section only in a metallurgical sense, to indicate mineralized material processed. The Shafter mine has a history of operations and testwork that prove the mineralization is amenable to several techniques of beneficiation and extraction. Though slight improvements in recovery can be achieved through concentration of the mill feed and focused leaching, the main factors for achieving desirable recovery is affected by grinding and cyanide leaching. Recovery predictions are dependent on the head grade due to a relatively constant tails grade. The consistency of the tails grade is due to occluded silver and silver minerals, locked in quartz or jarosite grains at or smaller than the 10 micron range. This renders that portion of the silver inaccessible to cyanide leach without extensive and expensive grinding. Practically all the non-encapsulated Ag appears to be recoverable, making the recovery prediction highly dependent on the mill feed head grade:
Recovery = (Head grade-Tails grade)/Head grade.
13.1 History of Operations The Shafter Silver deposit, located in Presidio County, Texas was discovered in 1880. In 1883 the Presidio Mining Company began operations and worked the property until 1926. In 1927, American Metals Company of Texas updated the mill and mine and operated it until 1942 when operations ceased due to shortages in equipment and labor brought on by the Second World War. At the end of American Metals Company of Texas’ operations, in 1942, the average mill head grade was about 8oz Ag/ton with an average mill silver recovery of about 81 percent. In 1977 Gold Fields Mining (then Azcon Mining and Exploration Division) entered into an agreement with Amax (successor to American Metals Company of Texas) leading to an exploration drilling campaign which indicated an extension to the old Presidio Mine. Rio Grande Mining Company took ownership of the property in 1993. Aurcana acquired Rio Grande Mining as a US based subsidiary and, thereby, ownership of the Shafter property in July of 2008. In December 2012, the Aurcana Mill was brought on line utilizing whole-ore leach to process 1,500 tpd of ore. However, after the about a year of operation, the project was placed on care and maintenance and the mill was shut down in December 2013, when design silver production rates were not met. During the operation the mine produced an average head grade of about 6oz Ag/ton at less than 1,000 tons per day, and with an average silver recovery of about 75 percent. Though these values did not meet the design parameters, the extraction performance was consistent with the recovery prediction based on a constant tails grade of 1.5oz Ag/ton.
Preliminary Economic Assessment and Updated Technical Report, Shafter Project, Texas, USA Aurcana Corporation Page 98
Mine Development Associates \\mda.com\users\Neil\shafter_2016_pea\2018_PEA\Shafter_2018_43-101_v13_pea.docx July 29, 2018 Print Date: 9/5/18 2:59 PM
13.2 Metallurgical Testwork
Historical Testwork Metallurgical testwork for the Shafter property is extensive and includes work done by Gold Fields, Colorado School of Mine Research Institute (“CSMRI”), Allis Chalmers, Hazen Research (“Hazen”), Kappes, Cassiday & Associates (“KCA”), Kerley Chemical Corporation, Warren Spring Laboratories, Inspectorate Mining and Mineral Services Ltd (“Inspectorate”), Pocock Industrial, Inc., and SGS Metcon/KD Engineering. The testwork combined with operating data from the historical workings, as well as recent operations in 2012 and 2013, form a good basis for the current flowsheet criteria. In 1978, Gold Fields began mineralogical and metallurgical testwork on the then new composite drill core samples, the old Presidio Mine ore, and mill tailings. Testwork for Gold Fields was performed by several laboratories described in the following paragraphs. CSMRI conducted testwork for Gold Fields between 1979 and 1982. They conducted leach testwork as well as gravity separation of silver, lead, and zinc minerals. In addition they studied the mineralogy and concluded that the old Presidio Mine ore and the core composites from the newly discovered extension had comparable properties. IN 1980 to 1982, Gold Fields Research Laboratories Limited (“GFRLL”) researched leach versus grind size. Results suggested that the optimal grind size would be approximately 30 percent passing 45 microns (P80 = 74 microns) with a grinding residence time of 24 hours. They also determined that a very fine dispersion that was not amenable to cyanide dissolution was present. GFRLL also investigated the effect of lime addition on silver dissolution and concluded that best results were obtained at a CaO addition of 2 kg/tonne. Allis Chalmers conducted abrasion index and bond mill work indices tests in 1982 determining the AI range of 0.115 to 0.4795 (grams) and Bond Ball Mill Work Index range between 12.4 and 12.7 kWh/ton. In 1982 Hazen was contracted to confirm the Gold Fields testwork as well as investigate the use of sodium carbonate as a substitute for lime. Hazen was successful in reproducing some of the previous leach recoveries at the 24 hour leach times, generating recoveries that pointed to an approach to a constant tails grade, shown in Table 13.1. At higher head grades, recoveries were reduced, but most likely due to the limited leach times. The tests did not prove sodium carbonate as a promising substitute for lime. Hazen also performed gravity and flotation testing as well as mineralogical examinations of the tailings. Flotation and gravity testing did not yield promising results as the overall recoveries were not significantly different from whole-ore leach and did not merit the added complication of the flowsheet. Hazen also identified that silver was locked in the tailings as silver bearing jarosite and as occlusions in quartz at size ranges between 2 and 10 microns.
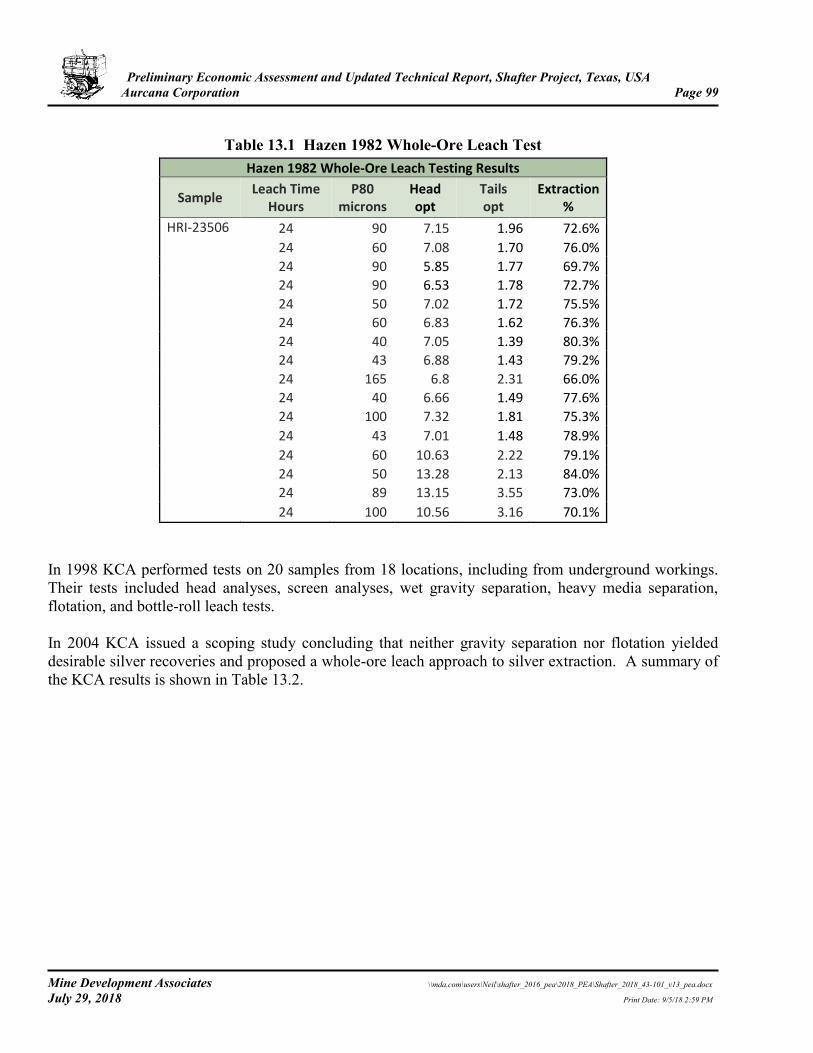
Preliminary Economic Assessment and Updated Technical Report, Shafter Project, Texas, USA Aurcana Corporation Page 99
Mine Development Associates \\mda.com\users\Neil\shafter_2016_pea\2018_PEA\Shafter_2018_43-101_v13_pea.docx July 29, 2018 Print Date: 9/5/18 2:59 PM
Table 13.1 Hazen 1982 Whole-Ore Leach Test
Hazen 1982 Whole-Ore Leach Testing Results
Sample Leach Time
Hours P80
microns Head opt
Tails opt
Extraction %
HRI-23506 24 90 7.15 1.96 72.6%
24 60 7.08 1.70 76.0% 24 90 5.85 1.77 69.7% 24 90 6.53 1.78 72.7% 24 50 7.02 1.72 75.5%
24 60 6.83 1.62 76.3%
24 40 7.05 1.39 80.3% 24 43 6.88 1.43 79.2%
24 165 6.8 2.31 66.0%
24 40 6.66 1.49 77.6% 24 100 7.32 1.81 75.3% 24 43 7.01 1.48 78.9%
24 60 10.63 2.22 79.1% 24 50 13.28 2.13 84.0%
24 89 13.15 3.55 73.0%
24 100 10.56 3.16 70.1%
In 1998 KCA performed tests on 20 samples from 18 locations, including from underground workings. Their tests included head analyses, screen analyses, wet gravity separation, heavy media separation, flotation, and bottle-roll leach tests. In 2004 KCA issued a scoping study concluding that neither gravity separation nor flotation yielded desirable silver recoveries and proposed a whole-ore leach approach to silver extraction. A summary of the KCA results is shown in Table 13.2.
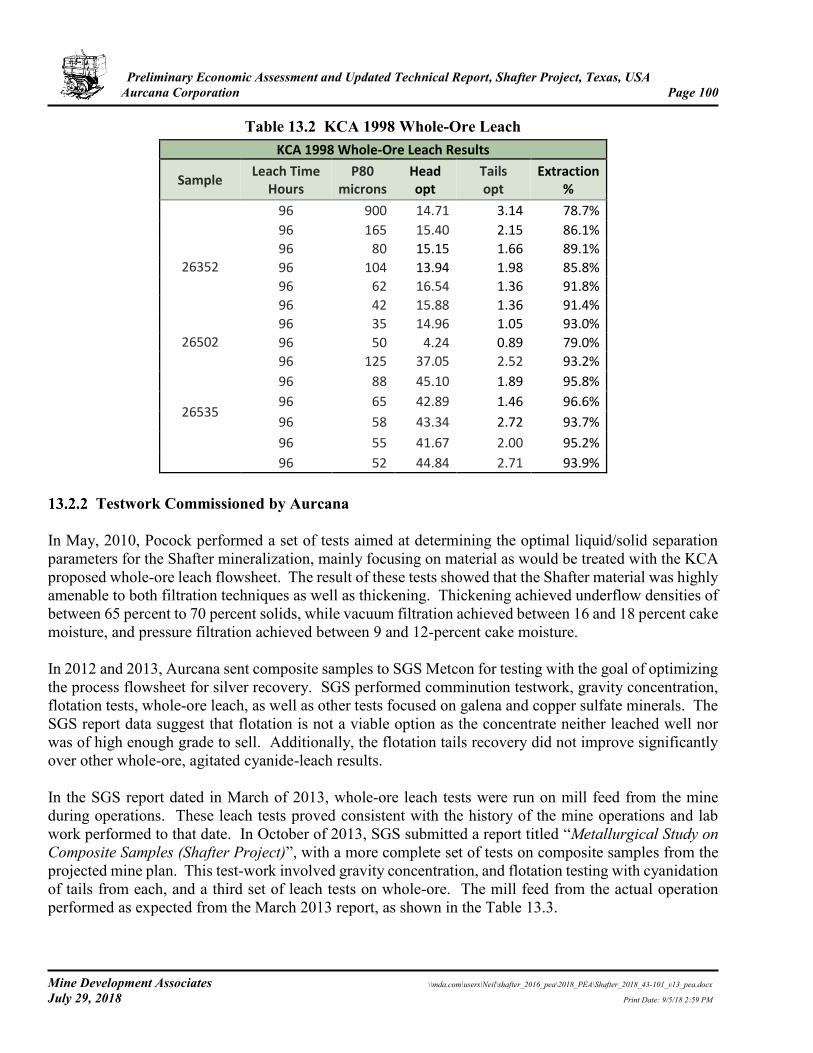
Preliminary Economic Assessment and Updated Technical Report, Shafter Project, Texas, USA Aurcana Corporation Page 100
Mine Development Associates \\mda.com\users\Neil\shafter_2016_pea\2018_PEA\Shafter_2018_43-101_v13_pea.docx July 29, 2018 Print Date: 9/5/18 2:59 PM
Table 13.2 KCA 1998 Whole-Ore Leach KCA 1998 Whole-Ore Leach Results
Sample Leach Time
Hours P80
microns Head opt
Tails opt
Extraction %
26352
96 900 14.71 3.14 78.7%
96 165 15.40 2.15 86.1%
96 80 15.15 1.66 89.1%
96 104 13.94 1.98 85.8%
96 62 16.54 1.36 91.8%
96 42 15.88 1.36 91.4%
96 35 14.96 1.05 93.0%
26502 96 50 4.24 0.89 79.0%
26535
96 125 37.05 2.52 93.2%
96 88 45.10 1.89 95.8%
96 65 42.89 1.46 96.6%
96 58 43.34 2.72 93.7%
96 55 41.67 2.00 95.2%
96 52 44.84 2.71 93.9%
Testwork Commissioned by Aurcana In May, 2010, Pocock performed a set of tests aimed at determining the optimal liquid/solid separation parameters for the Shafter mineralization, mainly focusing on material as would be treated with the KCA proposed whole-ore leach flowsheet. The result of these tests showed that the Shafter material was highly amenable to both filtration techniques as well as thickening. Thickening achieved underflow densities of between 65 percent to 70 percent solids, while vacuum filtration achieved between 16 and 18 percent cake moisture, and pressure filtration achieved between 9 and 12-percent cake moisture. In 2012 and 2013, Aurcana sent composite samples to SGS Metcon for testing with the goal of optimizing the process flowsheet for silver recovery. SGS performed comminution testwork, gravity concentration, flotation tests, whole-ore leach, as well as other tests focused on galena and copper sulfate minerals. The SGS report data suggest that flotation is not a viable option as the concentrate neither leached well nor was of high enough grade to sell. Additionally, the flotation tails recovery did not improve significantly over other whole-ore, agitated cyanide-leach results. In the SGS report dated in March of 2013, whole-ore leach tests were run on mill feed from the mine during operations. These leach tests proved consistent with the history of the mine operations and lab work performed to that date. In October of 2013, SGS submitted a report titled “Metallurgical Study on Composite Samples (Shafter Project)”, with a more complete set of tests on composite samples from the projected mine plan. This test-work involved gravity concentration, and flotation testing with cyanidation of tails from each, and a third set of leach tests on whole-ore. The mill feed from the actual operation performed as expected from the March 2013 report, as shown in the Table 13.3.
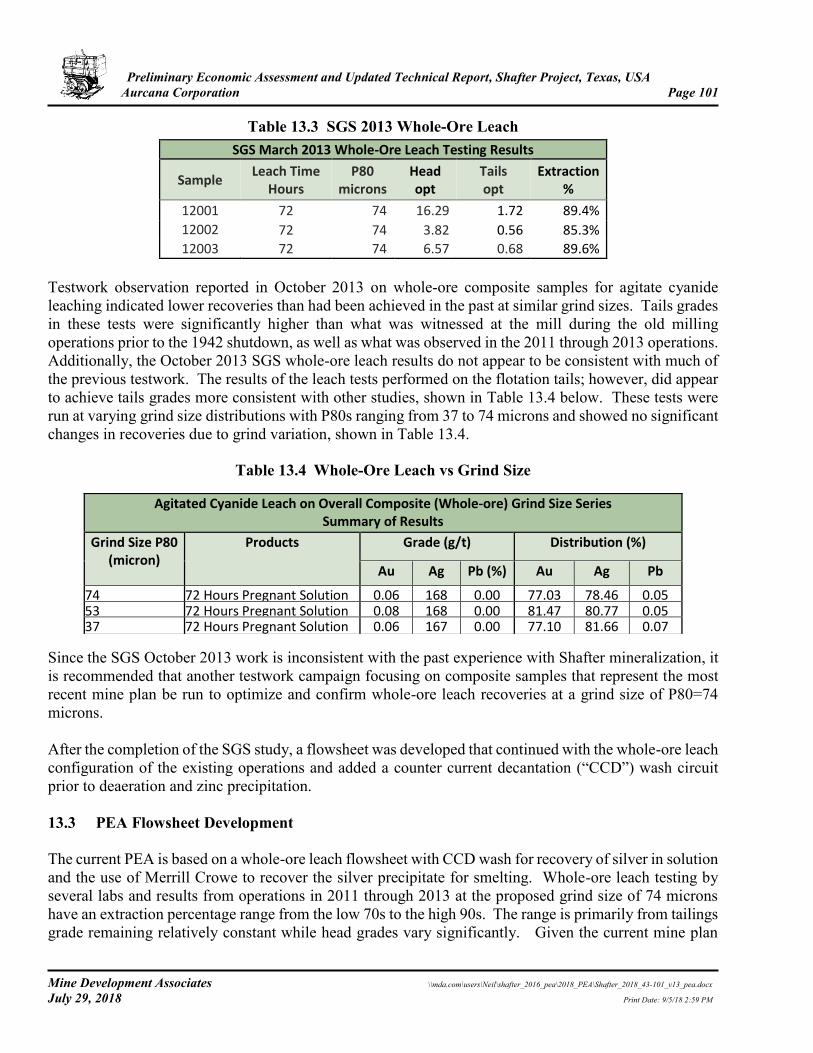
Preliminary Economic Assessment and Updated Technical Report, Shafter Project, Texas, USA Aurcana Corporation Page 101
Mine Development Associates \\mda.com\users\Neil\shafter_2016_pea\2018_PEA\Shafter_2018_43-101_v13_pea.docx July 29, 2018 Print Date: 9/5/18 2:59 PM
Table 13.3 SGS 2013 Whole-Ore Leach SGS March 2013 Whole-Ore Leach Testing Results
Sample Leach Time
Hours P80
microns Head opt
Tails opt
Extraction %
12001 72 74 16.29 1.72 89.4%
12002 72 74 3.82 0.56 85.3%
12003 72 74 6.57 0.68 89.6%
Testwork observation reported in October 2013 on whole-ore composite samples for agitate cyanide leaching indicated lower recoveries than had been achieved in the past at similar grind sizes. Tails grades in these tests were significantly higher than what was witnessed at the mill during the old milling operations prior to the 1942 shutdown, as well as what was observed in the 2011 through 2013 operations. Additionally, the October 2013 SGS whole-ore leach results do not appear to be consistent with much of the previous testwork. The results of the leach tests performed on the flotation tails; however, did appear to achieve tails grades more consistent with other studies, shown in Table 13.4 below. These tests were run at varying grind size distributions with P80s ranging from 37 to 74 microns and showed no significant changes in recoveries due to grind variation, shown in Table 13.4.
Table 13.4 Whole-Ore Leach vs Grind Size
Since the SGS October 2013 work is inconsistent with the past experience with Shafter mineralization, it is recommended that another testwork campaign focusing on composite samples that represent the most recent mine plan be run to optimize and confirm whole-ore leach recoveries at a grind size of P80=74 microns. After the completion of the SGS study, a flowsheet was developed that continued with the whole-ore leach configuration of the existing operations and added a counter current decantation (“CCD”) wash circuit prior to deaeration and zinc precipitation. 13.3 PEA Flowsheet Development
The current PEA is based on a whole-ore leach flowsheet with CCD wash for recovery of silver in solution and the use of Merrill Crowe to recover the silver precipitate for smelting. Whole-ore leach testing by several labs and results from operations in 2011 through 2013 at the proposed grind size of 74 microns have an extraction percentage range from the low 70s to the high 90s. The range is primarily from tailings grade remaining relatively constant while head grades vary significantly. Given the current mine plan
Agitated Cyanide Leach on Overall Composite (Whole-ore) Grind Size Series Summary of Results
Grind Size P80 (micron)
Products Grade (g/t) Distribution (%)
Au Ag Pb (%) Au Ag Pb
74 72 Hours Pregnant Solution 0.06 168 0.00 77.03 78.46 0.05 53 72 Hours Pregnant Solution 0.08 168 0.00 81.47 80.77 0.05 37 72 Hours Pregnant Solution 0.06 167 0.00 77.10 81.66 0.07
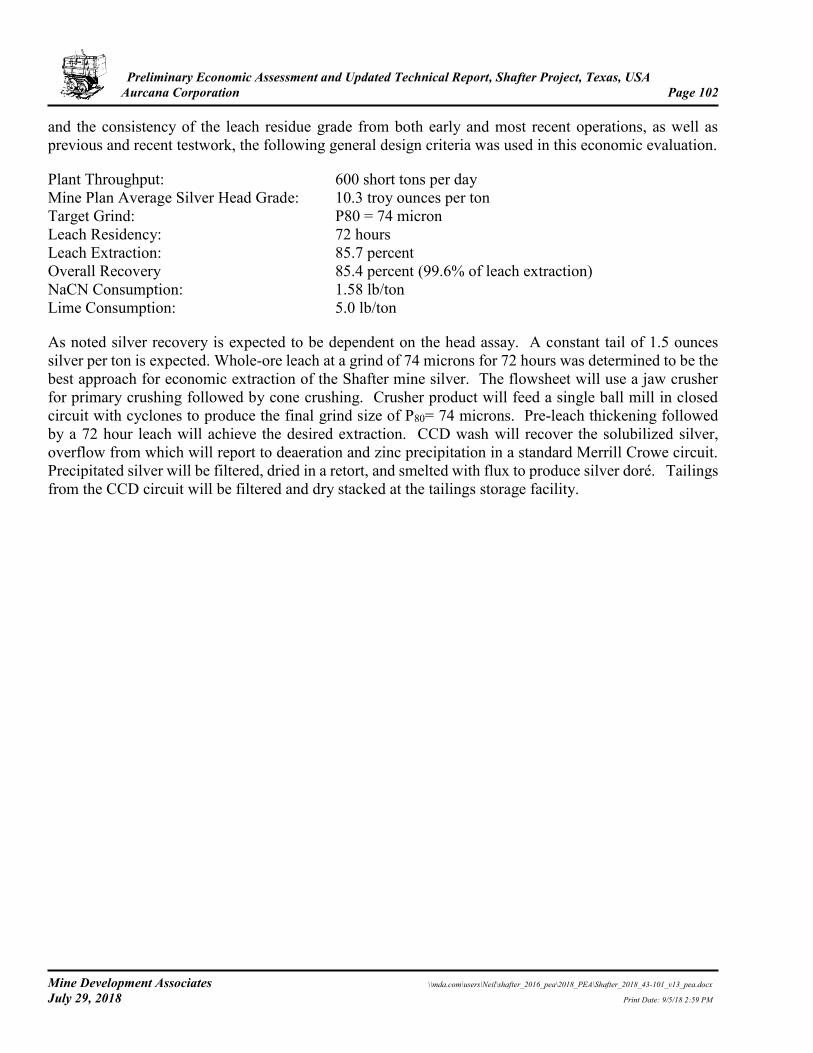
Preliminary Economic Assessment and Updated Technical Report, Shafter Project, Texas, USA Aurcana Corporation Page 102
Mine Development Associates \\mda.com\users\Neil\shafter_2016_pea\2018_PEA\Shafter_2018_43-101_v13_pea.docx July 29, 2018 Print Date: 9/5/18 2:59 PM
and the consistency of the leach residue grade from both early and most recent operations, as well as previous and recent testwork, the following general design criteria was used in this economic evaluation.
Plant Throughput: 600 short tons per day Mine Plan Average Silver Head Grade: 10.3 troy ounces per ton Target Grind: P80 = 74 micron Leach Residency: 72 hours Leach Extraction: 85.7 percent Overall Recovery 85.4 percent (99.6% of leach extraction) NaCN Consumption: 1.58 lb/ton Lime Consumption: 5.0 lb/ton
As noted silver recovery is expected to be dependent on the head assay. A constant tail of 1.5 ounces silver per ton is expected. Whole-ore leach at a grind of 74 microns for 72 hours was determined to be the best approach for economic extraction of the Shafter mine silver. The flowsheet will use a jaw crusher for primary crushing followed by cone crushing. Crusher product will feed a single ball mill in closed circuit with cyclones to produce the final grind size of P80= 74 microns. Pre-leach thickening followed by a 72 hour leach will achieve the desired extraction. CCD wash will recover the solubilized silver, overflow from which will report to deaeration and zinc precipitation in a standard Merrill Crowe circuit. Precipitated silver will be filtered, dried in a retort, and smelted with flux to produce silver doré. Tailings from the CCD circuit will be filtered and dry stacked at the tailings storage facility.
Preliminary Economic Assessment and Updated Technical Report, Shafter Project, Texas, USA Aurcana Corporation Page 103
Mine Development Associates \\mda.com\users\Neil\shafter_2016_pea\2018_PEA\Shafter_2018_43-101_v13_pea.docx July 29, 2018 Print Date: 9/5/18 2:59 PM
14.0 MINERAL RESOURCE ESTIMATE This section is taken from Tietz and MacFarlane (2016). The effective date of the database used for the mineral resource estimate is October 15, 2013. The effective date of the mineral resource estimate is December 11, 2015, and the current estimate reported herein is that which was presented by Tietz and MacFarlane (2016). 14.1 Introduction The modeling and estimation of silver resources were done under the supervision of Paul G. Tietz. Mr. Tietz is independent of Aurcana and there is no affiliation between Mr. Tietz and Aurcana except that of an independent consultant/client relationship. Mr. Tietz had prior experience with the Shafter project in the early 1980s while an employee of a previous operator (Gold Fields). Although MDA is not an expert with respect to any of the following aspects of the project, MDA is not aware of any unusual environmental, permitting, legal, title, taxation, socio-economic, marketing, or political factors that may materially affect the Shafter mineral resources as of the date of this report. MDA classifies resources in order of increasing geological and quantitative confidence into Inferred, Indicated, and Measured categories to be in compliance with the “CIM Definition Standards - For Mineral Resources and Mineral Reserves” (2014). CIM mineral resource definitions are given below, with CIM’s explanatory material shown in italics:
Mineral Resource
Mineral Resources are sub-divided, in order of increasing geological confidence, into Inferred, Indicated and Measured categories. An Inferred Mineral Resource has a lower level of confidence than that applied to an Indicated Mineral Resource. An Indicated Mineral Resource has a higher level of confidence than an Inferred Mineral Resource but has a lower level of confidence than a Measured Mineral Resource.
A Mineral Resource is a concentration or occurrence of solid material of economic interest in or on the Earth’s crust in such form, grade or quality and quantity that there are reasonable prospects for eventual economic extraction.
The location, quantity, grade or quality, continuity and other geological characteristics of a Mineral Resource are known, estimated or interpreted from specific geological evidence and knowledge, including sampling.
Material of economic interest refers to diamonds, natural solid inorganic material, or natural solid fossilized organic material including base and precious metals, coal, and industrial minerals.
The term Mineral Resource covers mineralization and natural material of intrinsic economic interest which has been identified and estimated through exploration and sampling and within which Mineral Reserves may subsequently be defined by the consideration and application of Modifying Factors. The phrase ‘reasonable prospects for eventual economic extraction’ implies a judgment by the Qualified Person in respect
Preliminary Economic Assessment and Updated Technical Report, Shafter Project, Texas, USA Aurcana Corporation Page 104
Mine Development Associates \\mda.com\users\Neil\shafter_2016_pea\2018_PEA\Shafter_2018_43-101_v13_pea.docx July 29, 2018 Print Date: 9/5/18 2:59 PM
of the technical and economic factors likely to influence the prospect of economic extraction. The Qualified Person should consider and clearly state the basis for determining that the material has reasonable prospects for eventual economic extraction. Assumptions should include estimates of cutoff grade and geological continuity at the selected cut-off, metallurgical recovery, smelter payments, commodity price or product value, mining and processing method and mining, processing and general and administrative costs. The Qualified Person should state if the assessment is based on any direct evidence and testing.
Interpretation of the word ‘eventual’ in this context may vary depending on the commodity or mineral involved. For example, for some coal, iron, potash deposits and other bulk minerals or commodities, it may be reasonable to envisage ‘eventual economic extraction’ as covering time periods in excess of 50 years. However, for many gold deposits, application of the concept would normally be restricted to perhaps 10 to 15 years, and frequently to much shorter periods of time.
Inferred Mineral Resource
An Inferred Mineral Resource is that part of a Mineral Resource for which quantity and grade or quality are estimated on the basis of limited geological evidence and sampling. Geological evidence is sufficient to imply but not verify geological and grade or quality continuity.
An Inferred Mineral Resource has a lower level of confidence than that applying to an Indicated Mineral Resource and must not be converted to a Mineral Reserve. It is reasonably expected that the majority of Inferred Mineral Resources could be upgraded to Indicated Mineral Resources with continued exploration.
An Inferred Mineral Resource is based on limited information and sampling gathered through appropriate sampling techniques from locations such as outcrops, trenches, pits, workings and drill holes. Inferred Mineral Resources must not be included in the economic analysis, production schedules, or estimated mine life in publicly disclosed Pre-Feasibility or Feasibility Studies, or in the Life of Mine plans and cash flow models of developed mines. Inferred Mineral Resources can only be used in economic studies as provided under NI 43-101.
There may be circumstances, where appropriate sampling, testing, and other measurements are sufficient to demonstrate data integrity, geological and grade/quality continuity of a Measured or Indicated Mineral Resource, however, quality assurance and quality control, or other information may not meet all industry norms for the disclosure of an Indicated or Measured Mineral Resource. Under these circumstances, it may be reasonable for the Qualified Person to report an Inferred Mineral Resource if the Qualified Person has taken steps to verify the information meets the requirements of an Inferred Mineral Resource.
Preliminary Economic Assessment and Updated Technical Report, Shafter Project, Texas, USA Aurcana Corporation Page 105
Mine Development Associates \\mda.com\users\Neil\shafter_2016_pea\2018_PEA\Shafter_2018_43-101_v13_pea.docx July 29, 2018 Print Date: 9/5/18 2:59 PM
Indicated Mineral Resource
An Indicated Mineral Resource is that part of a Mineral Resource for which quantity, grade or quality, densities, shape and physical characteristics are estimated with sufficient confidence to allow the application of Modifying Factors in sufficient detail to support mine planning and evaluation of the economic viability of the deposit.
Geological evidence is derived from adequately detailed and reliable exploration, sampling and testing and is sufficient to assume geological and grade or quality continuity between points of observation.
An Indicated Mineral Resource has a lower level of confidence than that applying to a Measured Mineral Resource and may only be converted to a Probable Mineral Reserve.
Mineralization may be classified as an Indicated Mineral Resource by the Qualified Person when the nature, quality, quantity and distribution of data are such as to allow confident interpretation of the geological framework and to reasonably assume the continuity of mineralization. The Qualified Person must recognize the importance of the Indicated Mineral Resource category to the advancement of the feasibility of the project. An Indicated Mineral Resource estimate is of sufficient quality to support a Pre-Feasibility Study which can serve as the basis for major development decisions.
Measured Mineral Resource
A Measured Mineral Resource is that part of a Mineral Resource for which quantity, grade or quality, densities, shape, and physical characteristics are estimated with confidence sufficient to allow the application of Modifying Factors to support detailed mine planning and final evaluation of the economic viability of the deposit.
Geological evidence is derived from detailed and reliable exploration, sampling and testing and is sufficient to confirm geological and grade or quality continuity between points of observation.
A Measured Mineral Resource has a higher level of confidence than that applying to either an Indicated Mineral Resource or an Inferred Mineral Resource. It may be converted to a Proven Mineral Reserve or to a Probable Mineral Reserve.
Mineralization or other natural material of economic interest may be classified as a Measured Mineral Resource by the Qualified Person when the nature, quality, quantity and distribution of data are such that the tonnage and grade or quality of the mineralization can be estimated to within close limits and that variation from the estimate would not significantly affect potential economic viability of the deposit. This category requires a high level of confidence in, and understanding of, the geology and controls of the mineral deposit.
Modifying Factors
Modifying Factors are considerations used to convert Mineral Resources to Mineral Reserves. These include, but are not restricted to, mining, processing, metallurgical, infrastructure, economic, marketing, legal, environmental, social and governmental factors.
Preliminary Economic Assessment and Updated Technical Report, Shafter Project, Texas, USA Aurcana Corporation Page 106
Mine Development Associates \\mda.com\users\Neil\shafter_2016_pea\2018_PEA\Shafter_2018_43-101_v13_pea.docx July 29, 2018 Print Date: 9/5/18 2:59 PM
MDA reports resources at cutoffs that are reasonable for deposits of this nature given anticipated mining methods and plant processing costs, while also considering economic conditions, because of the regulatory requirements that a resource exists “in such form and quantity and of such a grade or quality that it has reasonable prospects for eventual economic extraction.” 14.2 Database The Shafter database used in the current resource estimate contains 1,694 drill holes with a total footage of 466,288.5ft. Of these, 1,606 are diamond core holes, and 88 are RC holes. A summary of the drilling conducted by the various companies is shown in Table 10.1. The majority of drill holes (992 holes) are underground core holes completed by Amax in the 1940s. Since publication of the previous technical reports in 2008, approximately 800 holes have been added to the database, including a considerable number of underground and surface holes drilled by Amax as well as new holes drilled by Aurcana (RGMC 2011-2013 on Table 10.1) and a few additional Gold Fields holes. The Shafter drill-hole assay database contains 20,006 silver assays, 8,144 lead assays, and 5,584 zinc assays. Both lead and zinc are associated with the silver mineralization, though only silver was estimated due to the relative lack of lead and zinc data. The database contains down-hole survey information only for the recent RGMC surface and underground drilling. Drill-hole locations for the Amax drilling are approximate locations derived from both plan maps and underground cross-sections. The lack of down-hole survey data and the possible inaccuracies in the Amax hole locations create some risks in the current resource estimate. The project coordinates, including topography, are in a (50,000E, 50,000N) local grid using Imperial units (ft). 14.3 Geologic Background and Modeling Silver mineralization at Shafter occurs as a sub-horizontal manto within variably silicified Mina Grande limestone at or just below the Cretaceous/Permian unconformity. Mineralization occurs over a 13,000ft east-northeast strike length, is up to 1,200ft across, and is generally 10 to 20ft thick. The resource is at a depth of less than 100ft in the west-central portion of the deposit and then gradually deepens to a depth of over 1000ft within the eastern end of the deposit following the general stratigraphic dip. Manto thickness and silver grades can be highly variable, often related to near-vertical structures that served as fluid conduits and/or structural traps. Upon completion of the database validation process, MDA constructed 150 cross sections spaced 50ft to 100ft apart and looking northeast at 70°. The sections were spaced to best fit the existing drilling with the tighter spacing within the center of the deposit in the area of the recent RGMC underground development and drilling. One set of sections was made for lithology and then another for silver. Drill-hole information, including rock type and silver grades, along with the topographic surface were plotted on the cross sections. The
Preliminary Economic Assessment and Updated Technical Report, Shafter Project, Texas, USA Aurcana Corporation Page 107
Mine Development Associates \\mda.com\users\Neil\shafter_2016_pea\2018_PEA\Shafter_2018_43-101_v13_pea.docx July 29, 2018 Print Date: 9/5/18 2:59 PM
lithology cross sections were constructed with RGMC and MDA working in tandem, whereas the silver cross sections were constructed by MDA using the lithology sections as a guide. The lithology cross-sectional model includes the Cretaceous/Permian unconformity, the Mina Grande Formation/Ross Mine Formation contact, the dominant faults, the Herculano intrusive dike and associated intrusive dikes, the strong clay/rubble alteration along the unconformity, and the zones of silicified limestone. These modeled surfaces and rock types were used to guide the silver domain model and, in the case of the clay/rubble zones, assign densities into the block model.
Quantile plots of silver were made to help define the natural populations of silver grades to be shown on the silver-domain sections. The analytical population breaks indicated on the quantile plots were used to guide the creation of distinct low- and high-grade mineral domains. The silver domains as modeled and drawn on the cross sections are not strict grade shells but were created using geologic information such as orientation, geometry, lithologic contacts, and continuity. Each of these domains represents a distinct style of mineralization. The low-grade domain is associated with weakly fractured and silicified limestone characterized by silver grades between 0.8oz Ag/ton and 5.0oz Ag/ton (domain code 100). The high-grade domain (>5.0oz Ag/ton) is associated with strongly silicified, fracture/brecciated limestone that can contain a few percent lead and zinc (domain code 200).
The cross-sectional geology and silver domains were rectified three-dimensionally to long-sections on 10ft intervals that coincide with the mid-width of the model blocks. The long sections of the clay/rubble zones and silver were used to code the block model to percent of block by lithology and silver domain.
The underground workings were imported into the block model as a solid, and blocks were coded by volume percentage within the underground solid. As described in Section 14.7, those blocks coded at 5 percent or greater underground workings were considered “mined out” and removed from the classified mineral resource.
14.4 Density The Shafter density database consists of 59 specific gravity measurements on Gold Fields drill core. The analyses were completed by Kappes, Cassiday & Associates (“KCA”) in 1998 using the water-immersion method to calculate the specific gravity value. The core samples collected for testing were from moderately to strongly mineralized material predominantly within the eastern half of the deposit. In addition to the individual measurements on core, specific gravity and bulk density analyses were completed by SGS lab in 2013 on four composite samples of mineralized core collected by Aurcana. The composite samples were from both Gold Fields and Aurcana core holes in the vicinity and to the immediate east of Aurcana’s underground development. Four density (tonnage factor) values were used in the resource model as shown in Table 14.1. MDA’s analysis of all of the specific gravity data was done in the context of the geologic model, and a specific rock type and silver grade were assigned to each KCA density value. This analysis indicated that all of the density data are from within the modeled silver domains with no density data from the unmineralized limestone or from within the generally weakly mineralized, clay-dominant rubble zones. Due to the occasionally fractured nature of the deposit and to account for the unavoidable sample-selection bias, the
Preliminary Economic Assessment and Updated Technical Report, Shafter Project, Texas, USA Aurcana Corporation Page 108
Mine Development Associates \\mda.com\users\Neil\shafter_2016_pea\2018_PEA\Shafter_2018_43-101_v13_pea.docx July 29, 2018 Print Date: 9/5/18 2:59 PM
measured density values were factored down by 1 percent to 2 percent. The factored data, shown in Table 14.1, reflect the tonnage factor values assigned to the Shafter block model.
Table 14.1 Shafter Tonnage Factors by Rock Type
* no data; unmineralized tonnage factor uses general limestone value. ** no data; clay/rubble value is an estimate based on field observations
A single tonnage factor of 11.65 cubic feet/ton for all mineralized material was used by Gold Fields in their economic evaluation during the 1980s. This tonnage factor was determined from an underground bulk sample, but MDA has no knowledge of the material source or the type of analysis. This tonnage factor is significantly lower than all subsequent measurements and was not used in the current analysis. The relative lack of density data and the use of estimated values within the model introduce some risk into the resource estimate. MDA recommends that significantly more density data be collected and the density variability be better characterized, both spatially and by rock type. 14.5 Sample Coding and Composites The cross-sectional silver domains were used to code samples in the drill database. Quantile plots were made to assess validity of these domains and to determine capping levels. As a result, MDA chose to cap 12 silver assays: two in the low-grade domain and 10 in the high-grade domain. Assay statistics, including the capping grade, for the silver domains used in the resource estimate are presented in Table 14.2.
Table 14.2 Shafter Silver Mineral Domain Descriptive Statistics - Assays
Compositing was done to 4ft down-hole lengths (the model block size), honoring all mineral-domain boundaries. The composites were coded by the mineral-domain interpretations, and length-weighted composites were used in the block-model grade estimation. The volume inside each mineral domain was estimated using only composites from inside that domain. Composite descriptive statistics are presented in Table 14.3.
TF (cuft/ton)
outside Ag domains 12*
low-grade Ag (domain 100) 12.7
high-grade Ag (domain 200) 13.1
clay/rubble 14**
Rock Type
Domain Assays Count Mean(oz Ag/ton)
Median(oz Ag/ton) Std. Dev. CV Min.
(oz Ag/ton)Max.
(oz Ag/ton)Ag 6191 2.04 1.52 1.80 0.88 0.00 63.58
Ag Cap 6191 2.04 1.52 1.66 0.81 0.00 20.00
Ag 2196 13.70 9.23 16.76 1.22 0.00 310.44
Ag Cap 2196 13.45 9.23 13.93 1.04 0.00 120.00
Ag 8387 4.62 2.00 9.38 2.03 0.00 310.44
Ag Cap 8387 4.56 2.00 8.21 1.80 0.00 120.00
100
200
All
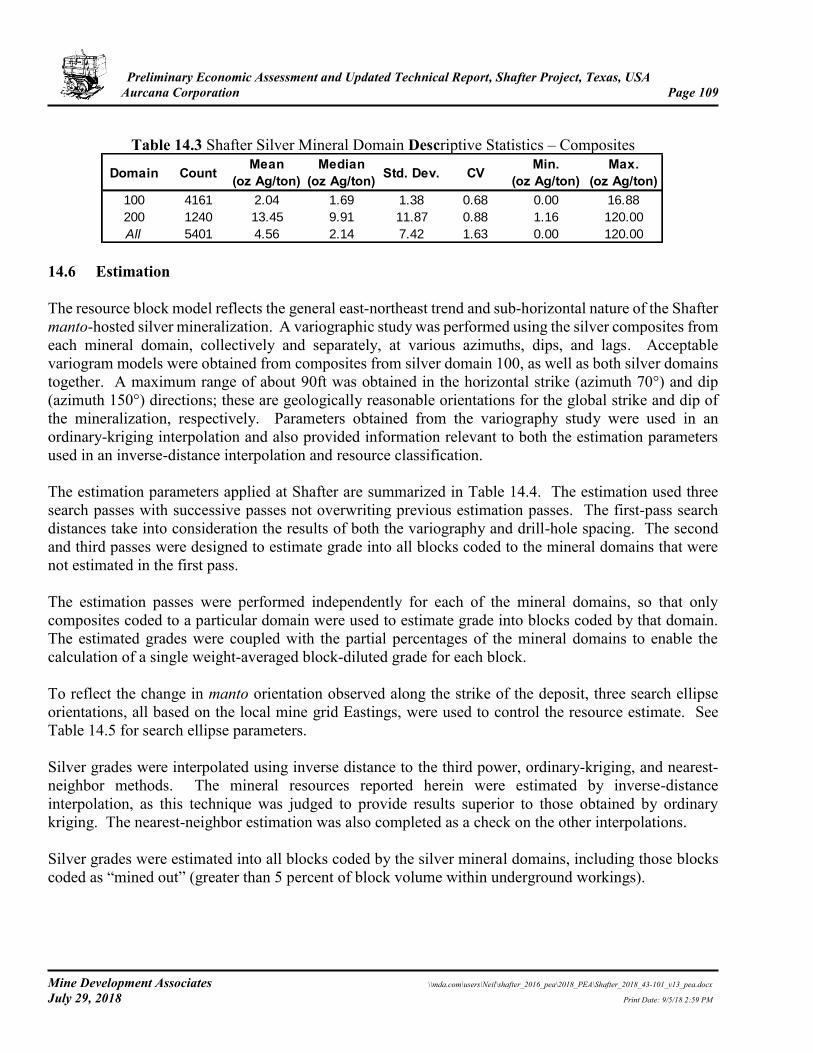
Preliminary Economic Assessment and Updated Technical Report, Shafter Project, Texas, USA Aurcana Corporation Page 109
Mine Development Associates \\mda.com\users\Neil\shafter_2016_pea\2018_PEA\Shafter_2018_43-101_v13_pea.docx July 29, 2018 Print Date: 9/5/18 2:59 PM
Table 14.3 Shafter Silver Mineral Domain Descriptive Statistics – Composites
14.6 Estimation The resource block model reflects the general east-northeast trend and sub-horizontal nature of the Shafter manto-hosted silver mineralization. A variographic study was performed using the silver composites from each mineral domain, collectively and separately, at various azimuths, dips, and lags. Acceptable variogram models were obtained from composites from silver domain 100, as well as both silver domains together. A maximum range of about 90ft was obtained in the horizontal strike (azimuth 70°) and dip (azimuth 150°) directions; these are geologically reasonable orientations for the global strike and dip of the mineralization, respectively. Parameters obtained from the variography study were used in an ordinary-kriging interpolation and also provided information relevant to both the estimation parameters used in an inverse-distance interpolation and resource classification. The estimation parameters applied at Shafter are summarized in Table 14.4. The estimation used three search passes with successive passes not overwriting previous estimation passes. The first-pass search distances take into consideration the results of both the variography and drill-hole spacing. The second and third passes were designed to estimate grade into all blocks coded to the mineral domains that were not estimated in the first pass. The estimation passes were performed independently for each of the mineral domains, so that only composites coded to a particular domain were used to estimate grade into blocks coded by that domain. The estimated grades were coupled with the partial percentages of the mineral domains to enable the calculation of a single weight-averaged block-diluted grade for each block. To reflect the change in manto orientation observed along the strike of the deposit, three search ellipse orientations, all based on the local mine grid Eastings, were used to control the resource estimate. See Table 14.5 for search ellipse parameters. Silver grades were interpolated using inverse distance to the third power, ordinary-kriging, and nearest-neighbor methods. The mineral resources reported herein were estimated by inverse-distance interpolation, as this technique was judged to provide results superior to those obtained by ordinary kriging. The nearest-neighbor estimation was also completed as a check on the other interpolations. Silver grades were estimated into all blocks coded by the silver mineral domains, including those blocks coded as “mined out” (greater than 5 percent of block volume within underground workings).
Domain Count Mean(oz Ag/ton)
Median(oz Ag/ton) Std. Dev. CV Min.
(oz Ag/ton)Max.
(oz Ag/ton)100 4161 2.04 1.69 1.38 0.68 0.00 16.88
200 1240 13.45 9.91 11.87 0.88 1.16 120.00
All 5401 4.56 2.14 7.42 1.63 0.00 120.00
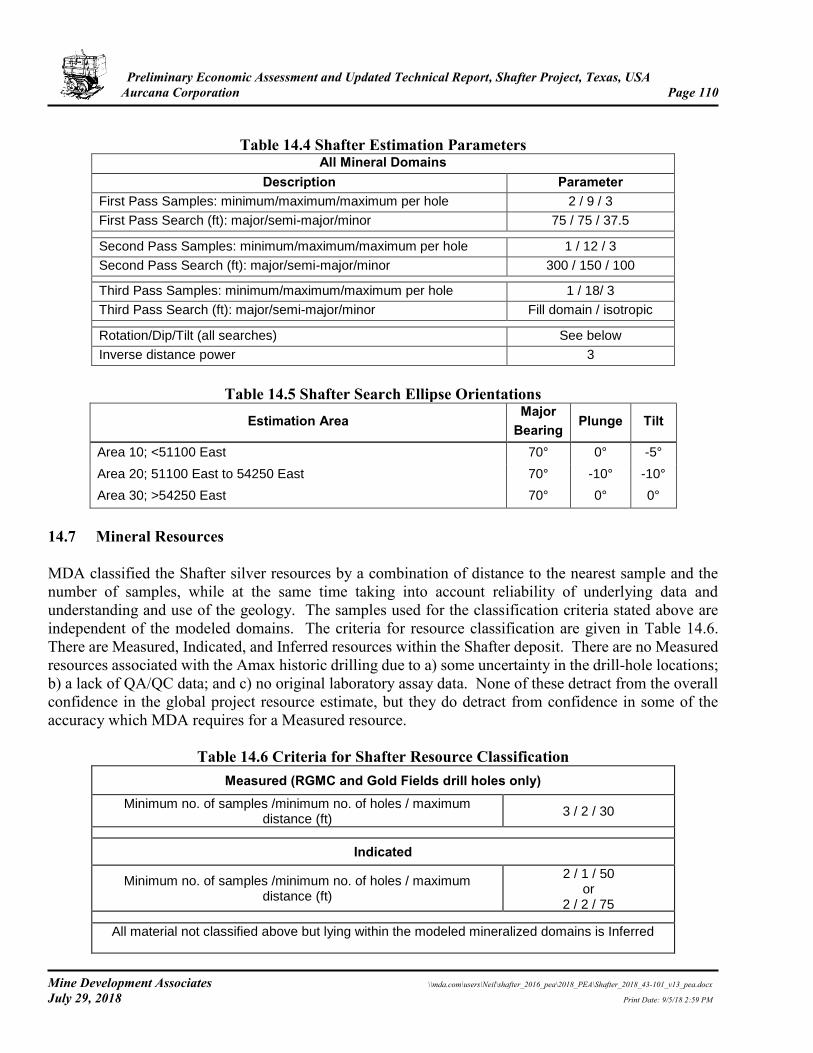
Preliminary Economic Assessment and Updated Technical Report, Shafter Project, Texas, USA Aurcana Corporation Page 110
Mine Development Associates \\mda.com\users\Neil\shafter_2016_pea\2018_PEA\Shafter_2018_43-101_v13_pea.docx July 29, 2018 Print Date: 9/5/18 2:59 PM
Table 14.4 Shafter Estimation Parameters
All Mineral Domains Description Parameter
First Pass Samples: minimum/maximum/maximum per hole 2 / 9 / 3
First Pass Search (ft): major/semi-major/minor 75 / 75 / 37.5
Second Pass Samples: minimum/maximum/maximum per hole 1 / 12 / 3
Second Pass Search (ft): major/semi-major/minor 300 / 150 / 100
Third Pass Samples: minimum/maximum/maximum per hole 1 / 18/ 3
Third Pass Search (ft): major/semi-major/minor Fill domain / isotropic
Rotation/Dip/Tilt (all searches) See below
Inverse distance power 3
Table 14.5 Shafter Search Ellipse Orientations
Estimation Area Major
Bearing Plunge Tilt
Area 10; <51100 East 70° 0° -5°
Area 20; 51100 East to 54250 East 70° -10° -10°
Area 30; >54250 East 70° 0° 0°
14.7 Mineral Resources MDA classified the Shafter silver resources by a combination of distance to the nearest sample and the number of samples, while at the same time taking into account reliability of underlying data and understanding and use of the geology. The samples used for the classification criteria stated above are independent of the modeled domains. The criteria for resource classification are given in Table 14.6. There are Measured, Indicated, and Inferred resources within the Shafter deposit. There are no Measured resources associated with the Amax historic drilling due to a) some uncertainty in the drill-hole locations; b) a lack of QA/QC data; and c) no original laboratory assay data. None of these detract from the overall confidence in the global project resource estimate, but they do detract from confidence in some of the accuracy which MDA requires for a Measured resource.
Table 14.6 Criteria for Shafter Resource Classification Measured (RGMC and Gold Fields drill holes only)
Minimum no. of samples /minimum no. of holes / maximum distance (ft) 3 / 2 / 30
Indicated
Minimum no. of samples /minimum no. of holes / maximum distance (ft)
2 / 1 / 50 or
2 / 2 / 75
All material not classified above but lying within the modeled mineralized domains is Inferred
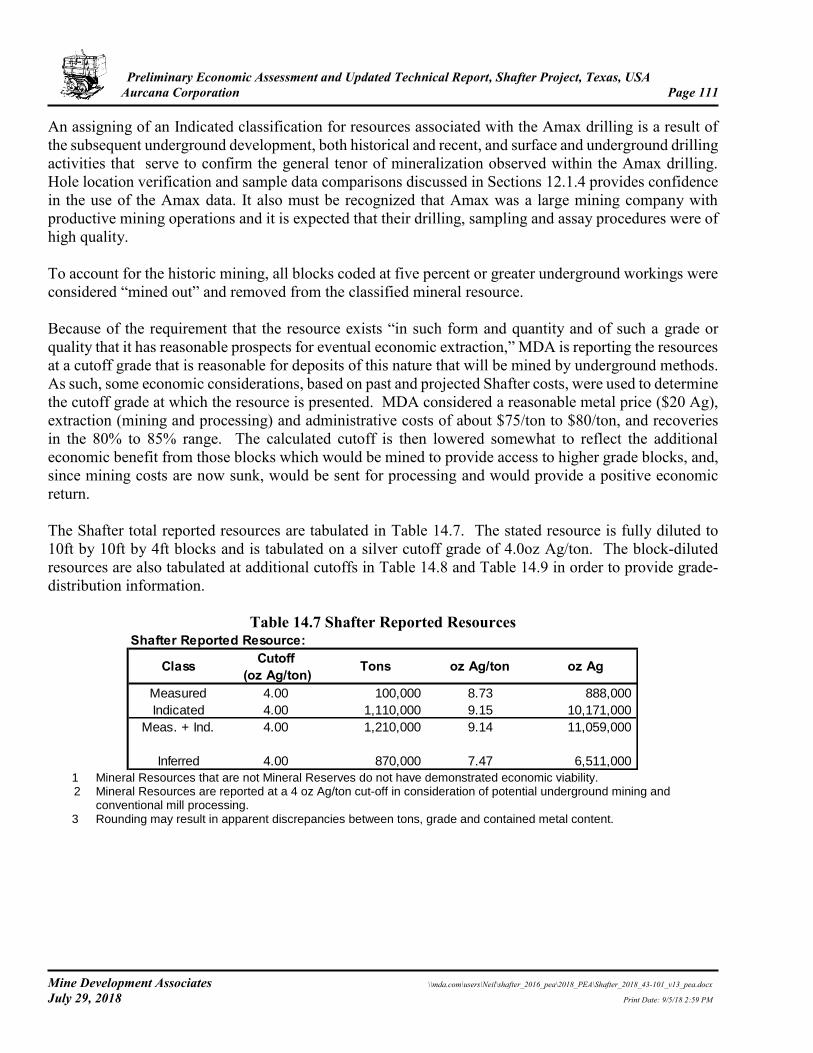
Preliminary Economic Assessment and Updated Technical Report, Shafter Project, Texas, USA Aurcana Corporation Page 111
Mine Development Associates \\mda.com\users\Neil\shafter_2016_pea\2018_PEA\Shafter_2018_43-101_v13_pea.docx July 29, 2018 Print Date: 9/5/18 2:59 PM
An assigning of an Indicated classification for resources associated with the Amax drilling is a result of the subsequent underground development, both historical and recent, and surface and underground drilling activities that serve to confirm the general tenor of mineralization observed within the Amax drilling. Hole location verification and sample data comparisons discussed in Sections 12.1.4 provides confidence in the use of the Amax data. It also must be recognized that Amax was a large mining company with productive mining operations and it is expected that their drilling, sampling and assay procedures were of high quality.
To account for the historic mining, all blocks coded at five percent or greater underground workings were considered “mined out” and removed from the classified mineral resource. Because of the requirement that the resource exists “in such form and quantity and of such a grade or quality that it has reasonable prospects for eventual economic extraction,” MDA is reporting the resources at a cutoff grade that is reasonable for deposits of this nature that will be mined by underground methods. As such, some economic considerations, based on past and projected Shafter costs, were used to determine the cutoff grade at which the resource is presented. MDA considered a reasonable metal price ($20 Ag), extraction (mining and processing) and administrative costs of about $75/ton to $80/ton, and recoveries in the 80% to 85% range. The calculated cutoff is then lowered somewhat to reflect the additional economic benefit from those blocks which would be mined to provide access to higher grade blocks, and, since mining costs are now sunk, would be sent for processing and would provide a positive economic return. The Shafter total reported resources are tabulated in Table 14.7. The stated resource is fully diluted to 10ft by 10ft by 4ft blocks and is tabulated on a silver cutoff grade of 4.0oz Ag/ton. The block-diluted resources are also tabulated at additional cutoffs in Table 14.8 and Table 14.9 in order to provide grade-distribution information.
Table 14.7 Shafter Reported Resources
1 Mineral Resources that are not Mineral Reserves do not have demonstrated economic viability. 2 Mineral Resources are reported at a 4 oz Ag/ton cut-off in consideration of potential underground mining and
conventional mill processing. 3 Rounding may result in apparent discrepancies between tons, grade and contained metal content.
Shafter Reported Resource:Cutoff
(oz Ag/ton)Measured 4.00 100,000 8.73 888,000
Indicated 4.00 1,110,000 9.15 10,171,000
Meas. + Ind. 4.00 1,210,000 9.14 11,059,000
Inferred 4.00 870,000 7.47 6,511,000
oz Ag/ton oz AgTonsClass
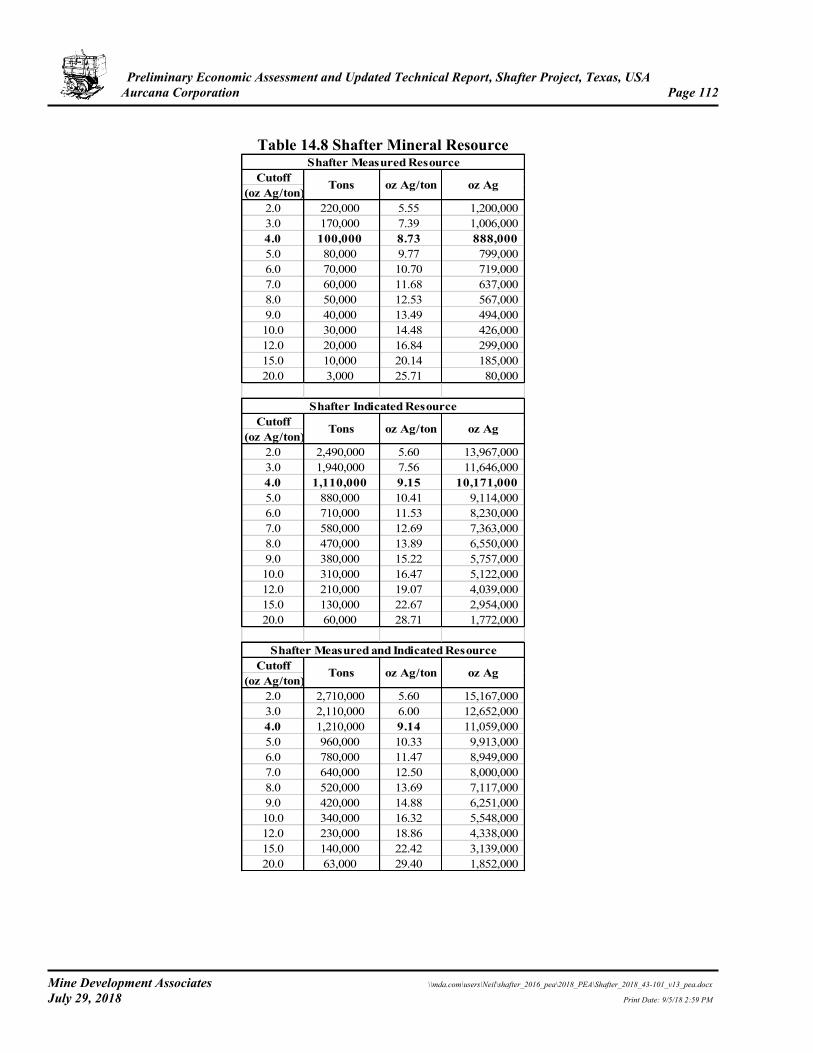
Preliminary Economic Assessment and Updated Technical Report, Shafter Project, Texas, USA Aurcana Corporation Page 112
Mine Development Associates \\mda.com\users\Neil\shafter_2016_pea\2018_PEA\Shafter_2018_43-101_v13_pea.docx July 29, 2018 Print Date: 9/5/18 2:59 PM
Table 14.8 Shafter Mineral Resource
Shafter Measured ResourceCutoff
(oz Ag/ton)2.0 220,000 5.55 1,200,000 3.0 170,000 7.39 1,006,000 4.0 100,000 8.73 888,000 5.0 80,000 9.77 799,000 6.0 70,000 10.70 719,000 7.0 60,000 11.68 637,000 8.0 50,000 12.53 567,000 9.0 40,000 13.49 494,000 10.0 30,000 14.48 426,000 12.0 20,000 16.84 299,000 15.0 10,000 20.14 185,000 20.0 3,000 25.71 80,000
Shafter Indicated ResourceCutoff
(oz Ag/ton)2.0 2,490,000 5.60 13,967,000 3.0 1,940,000 7.56 11,646,000 4.0 1,110,000 9.15 10,171,000 5.0 880,000 10.41 9,114,000 6.0 710,000 11.53 8,230,000 7.0 580,000 12.69 7,363,000 8.0 470,000 13.89 6,550,000 9.0 380,000 15.22 5,757,000 10.0 310,000 16.47 5,122,000 12.0 210,000 19.07 4,039,000 15.0 130,000 22.67 2,954,000 20.0 60,000 28.71 1,772,000
Shafter Measured and Indicated ResourceCutoff
(oz Ag/ton)2.0 2,710,000 5.60 15,167,000 3.0 2,110,000 6.00 12,652,000 4.0 1,210,000 9.14 11,059,000 5.0 960,000 10.33 9,913,000 6.0 780,000 11.47 8,949,000 7.0 640,000 12.50 8,000,000 8.0 520,000 13.69 7,117,000 9.0 420,000 14.88 6,251,000 10.0 340,000 16.32 5,548,000 12.0 230,000 18.86 4,338,000 15.0 140,000 22.42 3,139,000 20.0 63,000 29.40 1,852,000
Tons oz Ag/ton oz Ag
Tons oz Ag/ton oz Ag
Tons oz Ag/ton oz Ag
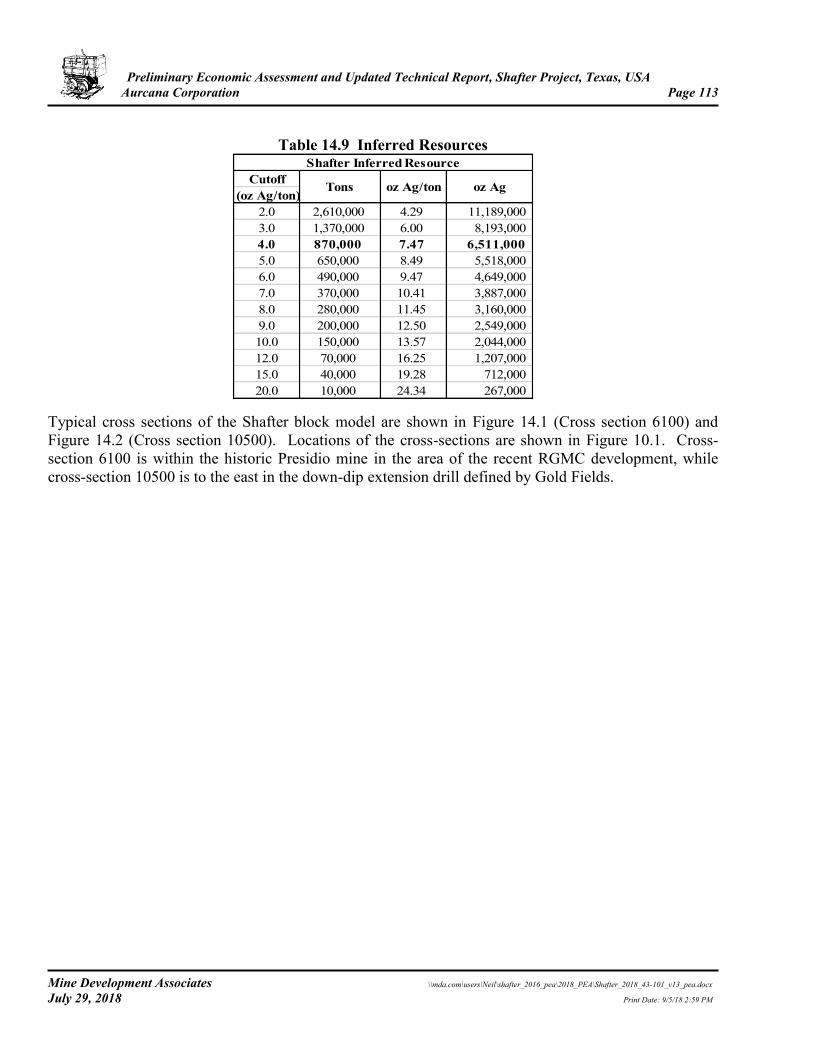
Preliminary Economic Assessment and Updated Technical Report, Shafter Project, Texas, USA Aurcana Corporation Page 113
Mine Development Associates \\mda.com\users\Neil\shafter_2016_pea\2018_PEA\Shafter_2018_43-101_v13_pea.docx July 29, 2018 Print Date: 9/5/18 2:59 PM
Table 14.9 Inferred Resources
Shafter Inferred ResourceCutoff
(oz Ag/ton)2.0 2,610,000 4.29 11,189,000 3.0 1,370,000 6.00 8,193,000 4.0 870,000 7.47 6,511,000 5.0 650,000 8.49 5,518,000 6.0 490,000 9.47 4,649,000 7.0 370,000 10.41 3,887,000 8.0 280,000 11.45 3,160,000 9.0 200,000 12.50 2,549,000 10.0 150,000 13.57 2,044,000 12.0 70,000 16.25 1,207,000 15.0 40,000 19.28 712,000 20.0 10,000 24.34 267,000
Tons oz Ag/ton oz Ag
Typical cross sections of the Shafter block model are shown in Figure 14.1 (Cross section 6100) and Figure 14.2 (Cross section 10500). Locations of the cross-sections are shown in Figure 10.1. Cross-section 6100 is within the historic Presidio mine in the area of the recent RGMC development, while cross-section 10500 is to the east in the down-dip extension drill defined by Gold Fields.
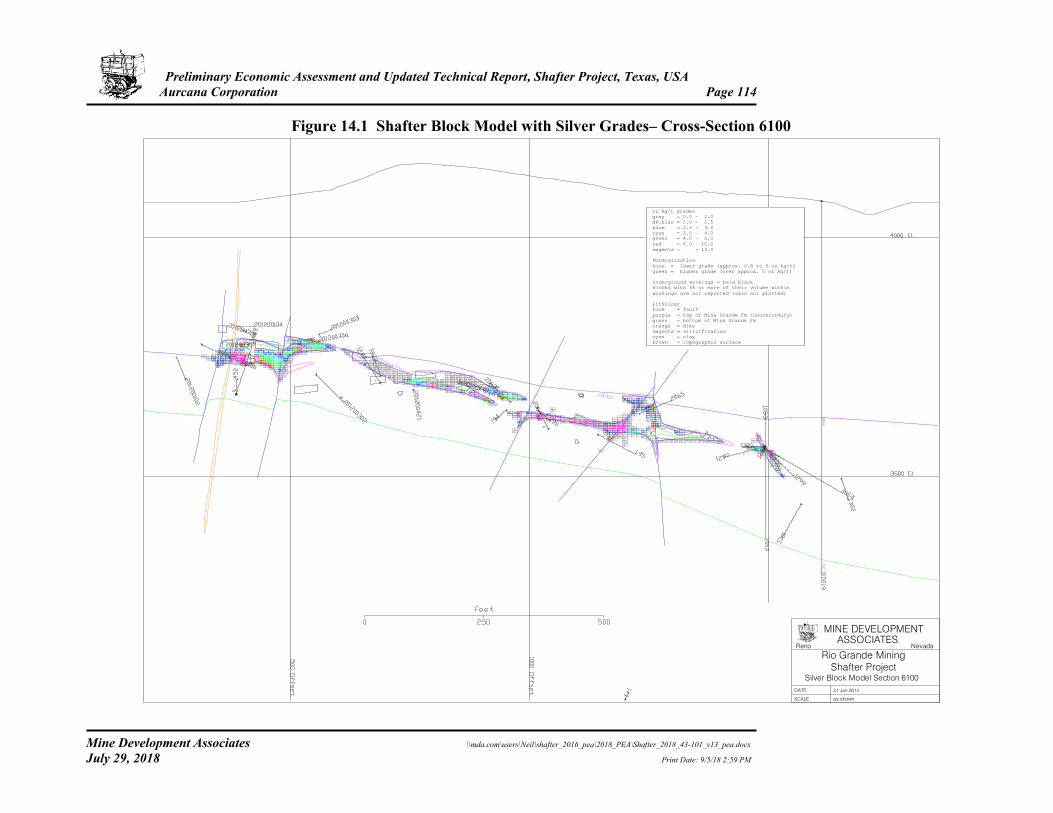
Preliminary Economic Assessment and Updated Technical Report, Shafter Project, Texas, USA Aurcana Corporation Page 114
Mine Development Associates \\mda.com\users\Neil\shafter_2016_pea\2018_PEA\Shafter_2018_43-101_v13_pea.docx July 29, 2018 Print Date: 9/5/18 2:59 PM
Figure 14.1 Shafter Block Model with Silver Grades– Cross-Section 6100
oz Ag/t grades
gray = 0.0 - 2.0
dk.blue = 2.0 - 2.5
blue = 2.5 - 3.0
cyan = 3.0 - 4.0
green = 4.0 - 6.0
red = 6.0 - 10.0
magenta = > 10.0
Mineralization
blue = lower grade (approx. 0.8 to 5 oz Ag/t)
green = higher grade (over approx. 5 oz Ag/t)
Underground workings = bold black
Blocks with 5% or more of their volume within
workings are not reported (also not plotted)
Lithology
blue = fault
purple = top of Mina Grande Fm (unconformity)
green = bottom of Mina Grande Fm
orange = dike
magenta = silicification
cyan = clay
brown = topographic surface
Reno
SCALE
Nevada
DATE
MINE DEVELOPMENT
ASSOCIATES
Silver Block Model Section 6100
Shafter Project
Rio Grande Mining
as shown
21 Jan 2014
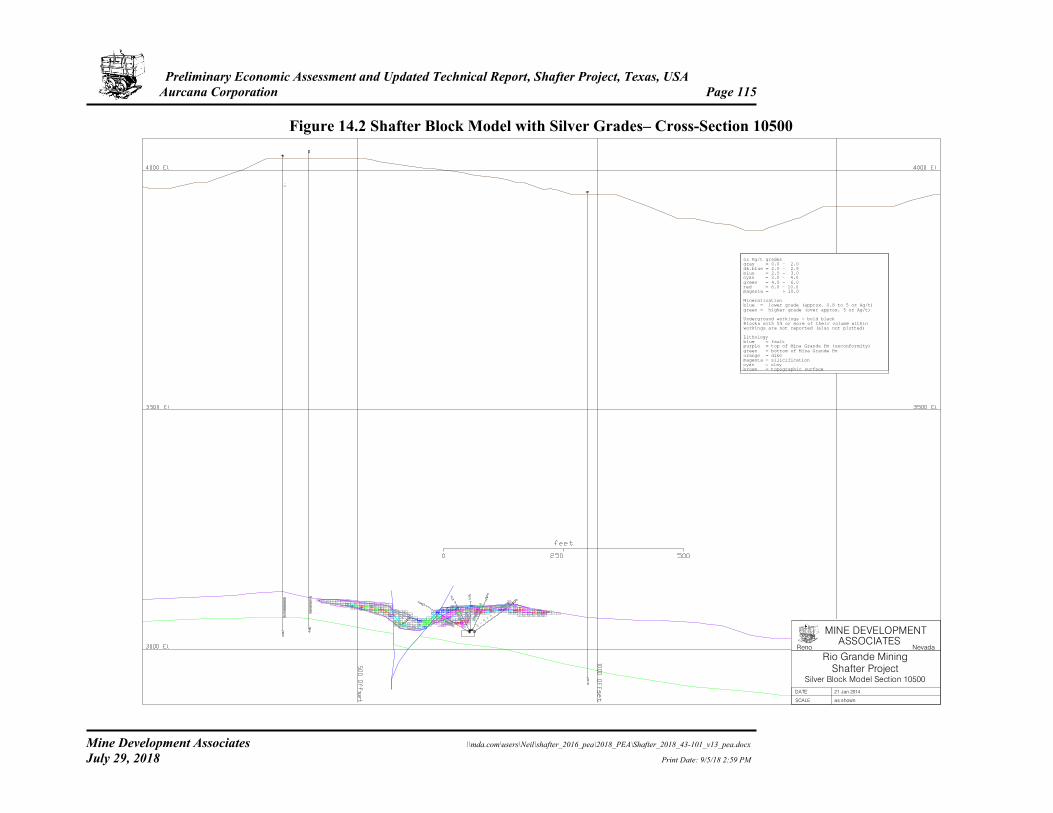
Preliminary Economic Assessment and Updated Technical Report, Shafter Project, Texas, USA Aurcana Corporation Page 115
Mine Development Associates \\mda.com\users\Neil\shafter_2016_pea\2018_PEA\Shafter_2018_43-101_v13_pea.docx July 29, 2018 Print Date: 9/5/18 2:59 PM
Figure 14.2 Shafter Block Model with Silver Grades– Cross-Section 10500
oz Ag/t gradesgray = 0.0 - 2.0dk.blue = 2.0 - 2.5blue = 2.5 - 3.0cyan = 3.0 - 4.0
green = 4.0 - 6.0red = 6.0 - 10.0magenta = > 10.0
Mineralizationblue = lower grade (approx. 0.8 to 5 oz Ag/t)
green = higher grade (over approx. 5 oz Ag/t)
Underground workings = bold blackBlocks with 5% or more of their volume withinworkings are not reported (also not plotted)
Lithologyblue = faultpurple = top of Mina Grande Fm (unconformity)
green = bottom of Mina Grande Fmorange = dikemagenta = silicificationcyan = claybrown = topographic surface
MINE DEVELOPMENT
ASSOCIATES
Silver Block Model Section 6100
Shafter Project
Rio Grande Mining
as shown
21 Jan 2014
SCALE
DATE
Reno Nevada
MINE DEVELOPMENT
Silver Block Model Section 10500
Shafter Project
Rio Grande Mining
as shown
21 Jan 2014
ASSOCIATES
Preliminary Economic Assessment and Updated Technical Report, Shafter Project, Texas, USA Aurcana Corporation Page 116
Mine Development Associates \\mda.com\users\Neil\shafter_2016_pea\2018_PEA\Shafter_2018_43-101_v13_pea.docx July 29, 2018 Print Date: 9/5/18 2:59 PM
Checks were made on the Shafter resource model in the following manner:
• Block-model information, such as mineral domains, metal grade, geology coding, and number of samples, was checked visually on the computer on sections and long-sections;
• Cross-section volumes to level-plan volumes to block-model volumes were checked;
• Nearest-neighbor and ordinary-kriging models were made for statistical and visual comparison;
• A simple polygonal model was made with the original modeled section domains; and
• Normal quantile distribution plots of assays, composites, and block-model grades were made to evaluate differences in distributions of silver grades.
14.8 Discussion of Resources The Shafter mineral resource estimate honors the drill-hole geology and assay data and is supported by the geologic model. Silver mineralization occurs as a sub-horizontal manto within variably silicified limestone at, or just below, the Cretaceous/Permian unconformity. The Shafter resource occurs over a 13,000ft east-northeast strike length, is up to 1,200ft wide, and is generally 10 to 20ft thick. The resource is at a depth of less than 100ft in the west-central portion of the deposit and then gradually deepens to a depth of over 1000ft within the eastern end of the deposit following the general stratigraphic dip. Manto thickness and silver grades can be highly variable, often related to near-vertical structures that served as conduits for mineralizing fluids and/or structural traps. Silver mineralization is generally continuous along the length of the deposit, though at the 4.0oz Ag/ton cutoff, the resource becomes fragmented to the west of the historic Presidio mine workings. The removal of the “mined out” material spatially associated with the underground workings also contributes to the fragmentary nature of the resource within the historic Presidio mine area. The use of the historic Amax drill data and the associated uncertainties in Amax’s drill locations and assay quality bring some risk to the resource estimate. This risk is somewhat ameliorated by the presence of the underground workings, which helps spatially define the mineralization, and the similar tenor of the more recent RGMC and Gold Fields assay data. Additional infill drilling, increased underground mapping and sampling, and significantly more density measurements are recommended to bring greater confidence to the current mineral resource estimate.
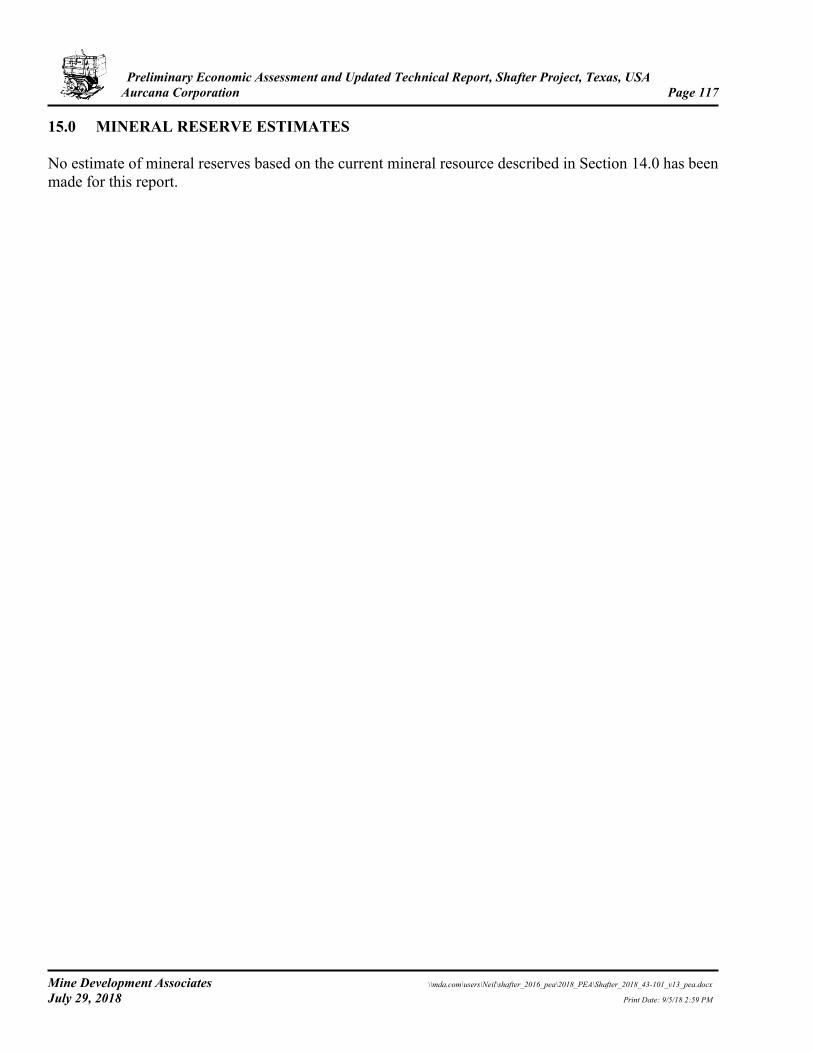
Preliminary Economic Assessment and Updated Technical Report, Shafter Project, Texas, USA Aurcana Corporation Page 117
Mine Development Associates \\mda.com\users\Neil\shafter_2016_pea\2018_PEA\Shafter_2018_43-101_v13_pea.docx July 29, 2018 Print Date: 9/5/18 2:59 PM
15.0 MINERAL RESERVE ESTIMATES No estimate of mineral reserves based on the current mineral resource described in Section 14.0 has been made for this report.
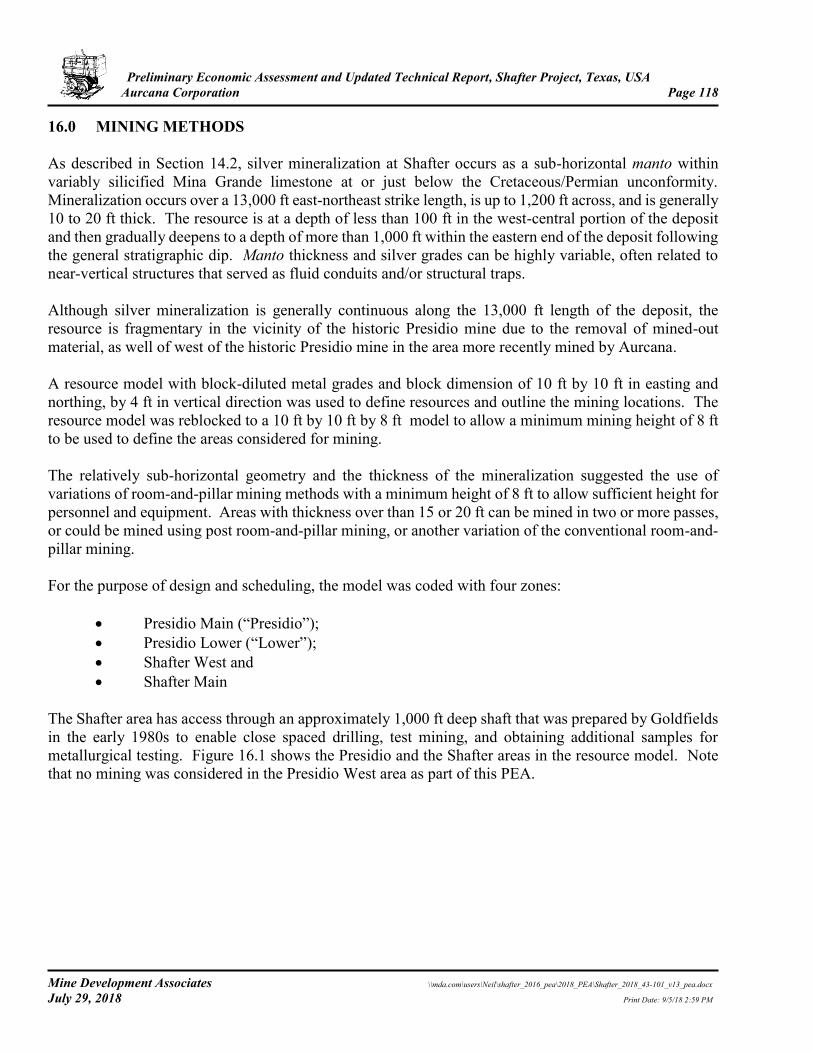
Preliminary Economic Assessment and Updated Technical Report, Shafter Project, Texas, USA Aurcana Corporation Page 118
Mine Development Associates \\mda.com\users\Neil\shafter_2016_pea\2018_PEA\Shafter_2018_43-101_v13_pea.docx July 29, 2018 Print Date: 9/5/18 2:59 PM
16.0 MINING METHODS As described in Section 14.2, silver mineralization at Shafter occurs as a sub-horizontal manto within variably silicified Mina Grande limestone at or just below the Cretaceous/Permian unconformity. Mineralization occurs over a 13,000 ft east-northeast strike length, is up to 1,200 ft across, and is generally 10 to 20 ft thick. The resource is at a depth of less than 100 ft in the west-central portion of the deposit and then gradually deepens to a depth of more than 1,000 ft within the eastern end of the deposit following the general stratigraphic dip. Manto thickness and silver grades can be highly variable, often related to near-vertical structures that served as fluid conduits and/or structural traps. Although silver mineralization is generally continuous along the 13,000 ft length of the deposit, the resource is fragmentary in the vicinity of the historic Presidio mine due to the removal of mined-out material, as well of west of the historic Presidio mine in the area more recently mined by Aurcana. A resource model with block-diluted metal grades and block dimension of 10 ft by 10 ft in easting and northing, by 4 ft in vertical direction was used to define resources and outline the mining locations. The resource model was reblocked to a 10 ft by 10 ft by 8 ft model to allow a minimum mining height of 8 ft to be used to define the areas considered for mining. The relatively sub-horizontal geometry and the thickness of the mineralization suggested the use of variations of room-and-pillar mining methods with a minimum height of 8 ft to allow sufficient height for personnel and equipment. Areas with thickness over than 15 or 20 ft can be mined in two or more passes, or could be mined using post room-and-pillar mining, or another variation of the conventional room-and-pillar mining. For the purpose of design and scheduling, the model was coded with four zones:
• Presidio Main (“Presidio”); • Presidio Lower (“Lower”); • Shafter West and • Shafter Main
The Shafter area has access through an approximately 1,000 ft deep shaft that was prepared by Goldfields in the early 1980s to enable close spaced drilling, test mining, and obtaining additional samples for metallurgical testing. Figure 16.1 shows the Presidio and the Shafter areas in the resource model. Note that no mining was considered in the Presidio West area as part of this PEA.
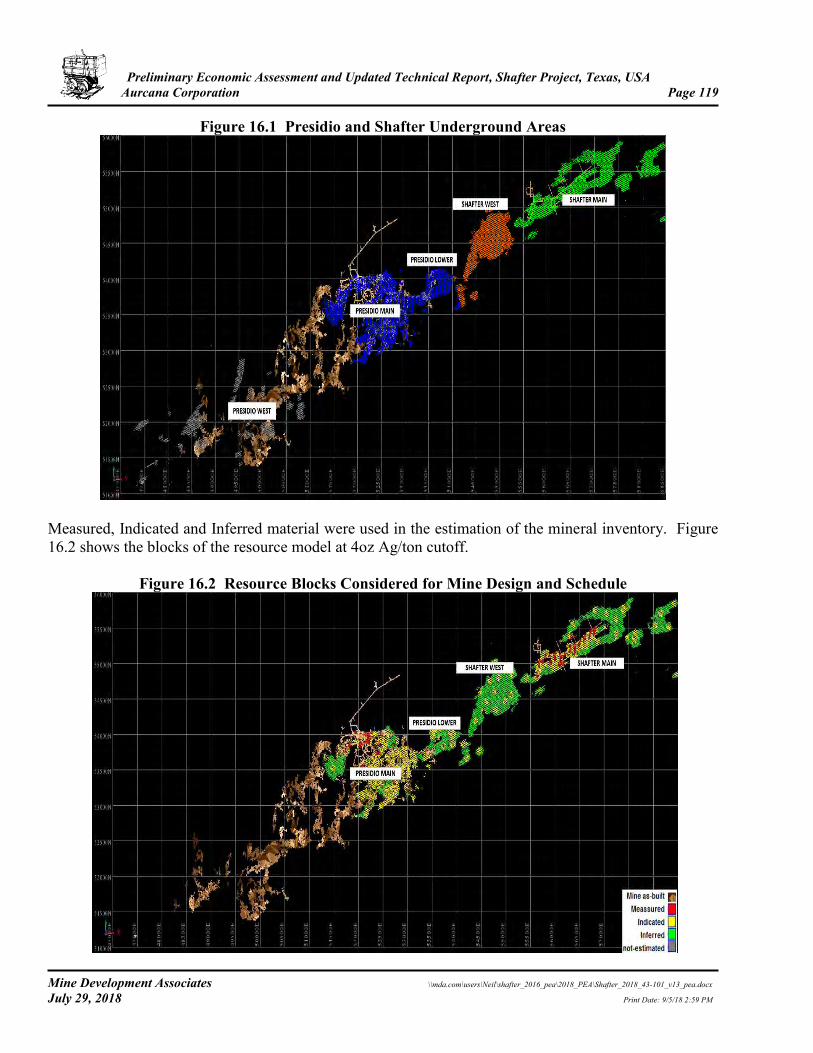
Preliminary Economic Assessment and Updated Technical Report, Shafter Project, Texas, USA Aurcana Corporation Page 119
Mine Development Associates \\mda.com\users\Neil\shafter_2016_pea\2018_PEA\Shafter_2018_43-101_v13_pea.docx July 29, 2018 Print Date: 9/5/18 2:59 PM
Figure 16.1 Presidio and Shafter Underground Areas
Measured, Indicated and Inferred material were used in the estimation of the mineral inventory. Figure 16.2 shows the blocks of the resource model at 4oz Ag/ton cutoff.
Figure 16.2 Resource Blocks Considered for Mine Design and Schedule
Preliminary Economic Assessment and Updated Technical Report, Shafter Project, Texas, USA Aurcana Corporation Page 120
Mine Development Associates \\mda.com\users\Neil\shafter_2016_pea\2018_PEA\Shafter_2018_43-101_v13_pea.docx July 29, 2018 Print Date: 9/5/18 2:59 PM
16.1 Mining Method Selection The relatively sub-horizontal geometry and the thickness of the mineralization suggested the use of room and pillar as the primary mining method. Longhole slashing, benching and partial pillar recovery would be employed as needed during the secondary extraction phase. A minimum mining height of 8 ft was included in the resource modeling to allow sufficient height for personnel and mechanized equipment. Areas with thickness over 15 or 20 ft can be mined using the secondary extraction methods listed above, or another variation of conventional room-and-pillar mining. A conceptual illustration of the selected mining method is shown in Figure 16.3.
Figure 16.3 Room and Pillar Mining with Benching in Thicker Areas
16.2 Mine Design Mine design for primary extraction is based on 6.8 oz Ag/ton cutoff grade. Block grades for the stopes is the block diluted grade of the 10 ft x 10 ft x 8 ft block with a cutoff of 6.8 oz Ag/ton. The minimum mining height is 8 feet with basic heading size of 28 ft wide. Average height for the above cutoff resource base is 12 ft. Stopes were formed by successive re-blocking of the block model at higher cutoffs. The average stope width is estimated to be 140 ft from the selected resource blocks. Pillars are planned to be 24 ft by 24 ft. These stope dimensions yield a primary extraction ratio of 78%. Secondary extraction involve mining half of the pillars. Overall extraction increases to 89%, assuming half the pillar marterial is recoverable. Figure 16.4 shows the overall stope layout.
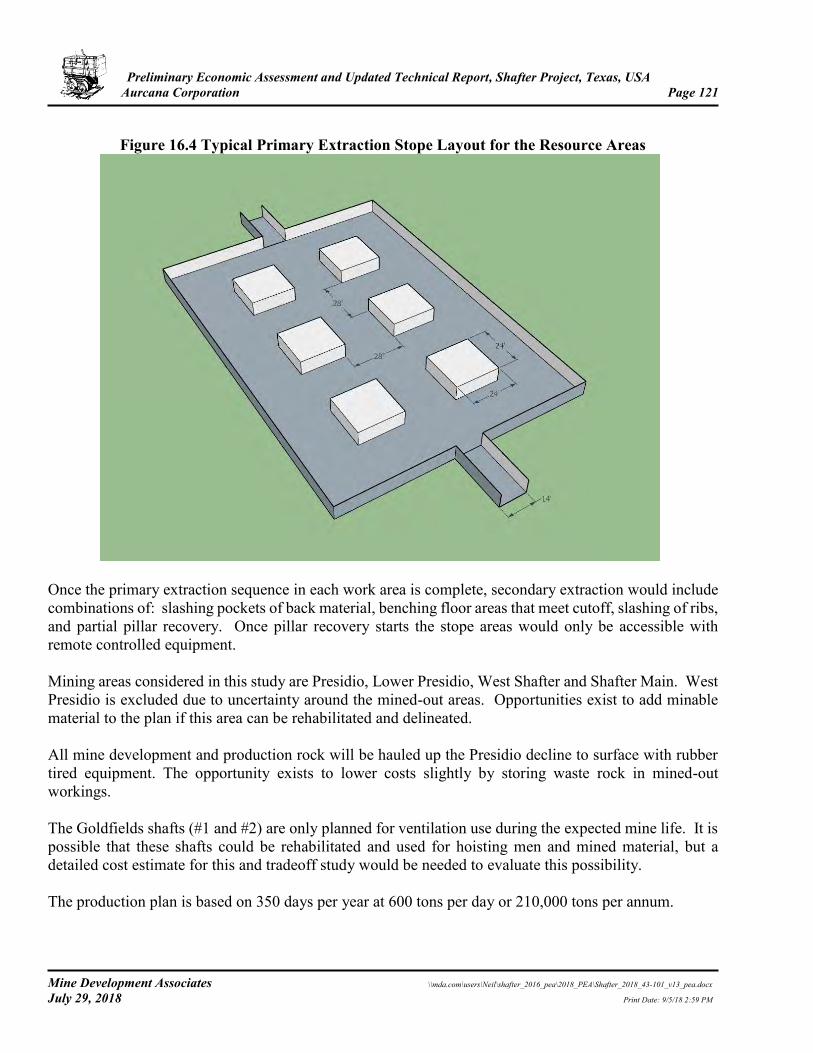
Preliminary Economic Assessment and Updated Technical Report, Shafter Project, Texas, USA Aurcana Corporation Page 121
Mine Development Associates \\mda.com\users\Neil\shafter_2016_pea\2018_PEA\Shafter_2018_43-101_v13_pea.docx July 29, 2018 Print Date: 9/5/18 2:59 PM
Figure 16.4 Typical Primary Extraction Stope Layout for the Resource Areas
Once the primary extraction sequence in each work area is complete, secondary extraction would include combinations of: slashing pockets of back material, benching floor areas that meet cutoff, slashing of ribs, and partial pillar recovery. Once pillar recovery starts the stope areas would only be accessible with remote controlled equipment. Mining areas considered in this study are Presidio, Lower Presidio, West Shafter and Shafter Main. West Presidio is excluded due to uncertainty around the mined-out areas. Opportunities exist to add minable material to the plan if this area can be rehabilitated and delineated. All mine development and production rock will be hauled up the Presidio decline to surface with rubber tired equipment. The opportunity exists to lower costs slightly by storing waste rock in mined-out workings. The Goldfields shafts (#1 and #2) are only planned for ventilation use during the expected mine life. It is possible that these shafts could be rehabilitated and used for hoisting men and mined material, but a detailed cost estimate for this and tradeoff study would be needed to evaluate this possibility. The production plan is based on 350 days per year at 600 tons per day or 210,000 tons per annum.
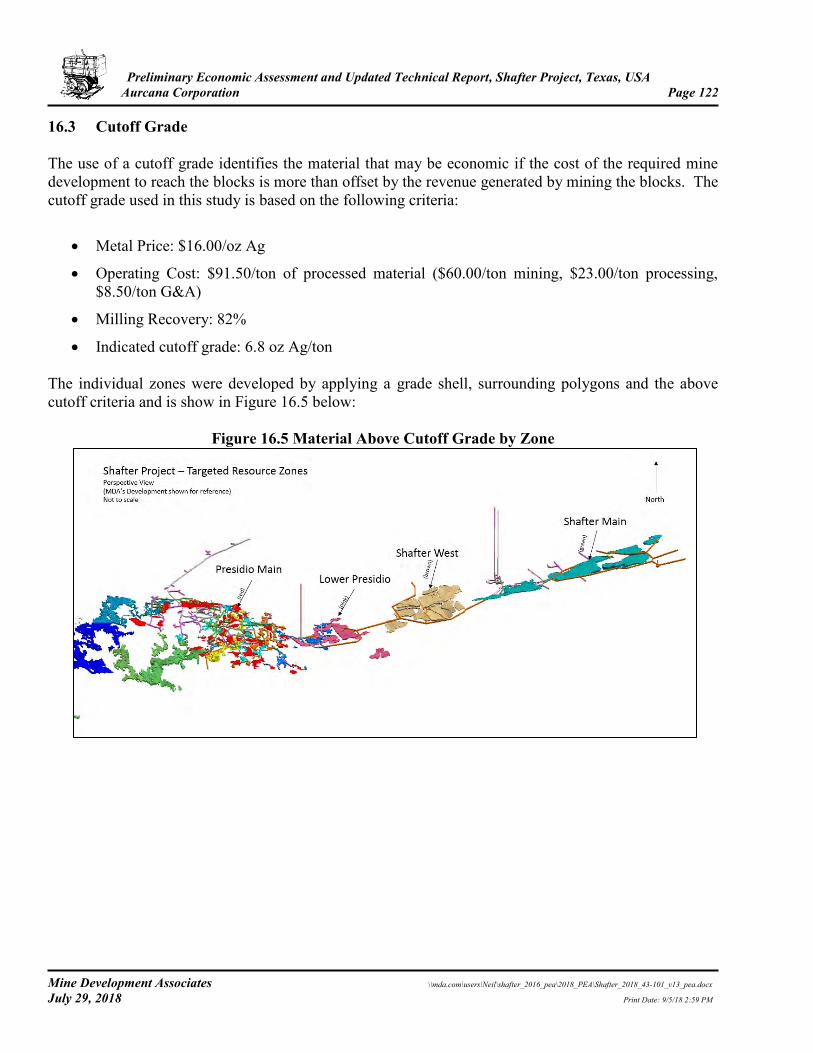
Preliminary Economic Assessment and Updated Technical Report, Shafter Project, Texas, USA Aurcana Corporation Page 122
Mine Development Associates \\mda.com\users\Neil\shafter_2016_pea\2018_PEA\Shafter_2018_43-101_v13_pea.docx July 29, 2018 Print Date: 9/5/18 2:59 PM
16.3 Cutoff Grade The use of a cutoff grade identifies the material that may be economic if the cost of the required mine development to reach the blocks is more than offset by the revenue generated by mining the blocks. The cutoff grade used in this study is based on the following criteria:
• Metal Price: $16.00/oz Ag
• Operating Cost: $91.50/ton of processed material ($60.00/ton mining, $23.00/ton processing, $8.50/ton G&A)
• Milling Recovery: 82%
• Indicated cutoff grade: 6.8 oz Ag/ton The individual zones were developed by applying a grade shell, surrounding polygons and the above cutoff criteria and is show in Figure 16.5 below:
Figure 16.5 Material Above Cutoff Grade by Zone
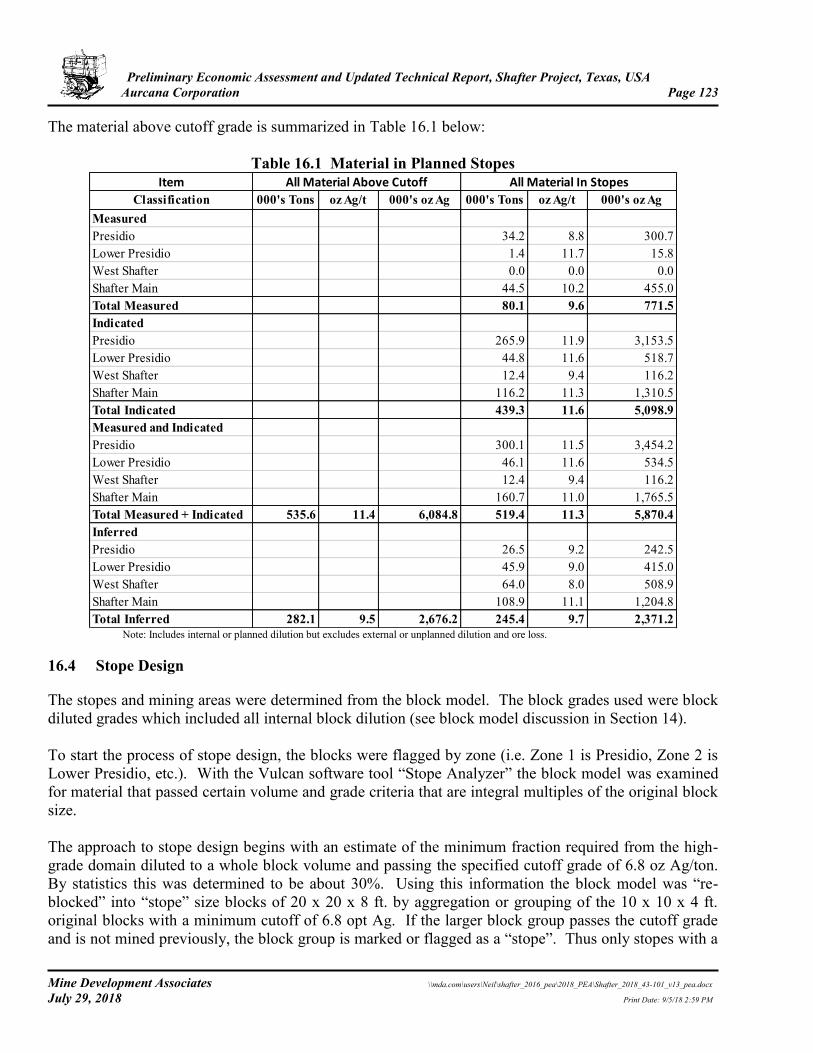
Preliminary Economic Assessment and Updated Technical Report, Shafter Project, Texas, USA Aurcana Corporation Page 123
Mine Development Associates \\mda.com\users\Neil\shafter_2016_pea\2018_PEA\Shafter_2018_43-101_v13_pea.docx July 29, 2018 Print Date: 9/5/18 2:59 PM
The material above cutoff grade is summarized in Table 16.1 below:
Table 16.1 Material in Planned Stopes Item
Classification 000's Tons oz Ag/t 000's oz Ag 000's Tons oz Ag/t 000's oz AgMeasuredPresidio 34.2 8.8 300.7Lower Presidio 1.4 11.7 15.8West Shafter 0.0 0.0 0.0Shafter Main 44.5 10.2 455.0Total Measured 80.1 9.6 771.5IndicatedPresidio 265.9 11.9 3,153.5Lower Presidio 44.8 11.6 518.7West Shafter 12.4 9.4 116.2Shafter Main 116.2 11.3 1,310.5Total Indicated 439.3 11.6 5,098.9Measured and IndicatedPresidio 300.1 11.5 3,454.2Lower Presidio 46.1 11.6 534.5West Shafter 12.4 9.4 116.2Shafter Main 160.7 11.0 1,765.5Total Measured + Indicated 535.6 11.4 6,084.8 519.4 11.3 5,870.4InferredPresidio 26.5 9.2 242.5Lower Presidio 45.9 9.0 415.0West Shafter 64.0 8.0 508.9Shafter Main 108.9 11.1 1,204.8Total Inferred 282.1 9.5 2,676.2 245.4 9.7 2,371.2
All Material Above Cutoff All Material In Stopes
Note: Includes internal or planned dilution but excludes external or unplanned dilution and ore loss.
16.4 Stope Design
The stopes and mining areas were determined from the block model. The block grades used were block diluted grades which included all internal block dilution (see block model discussion in Section 14). To start the process of stope design, the blocks were flagged by zone (i.e. Zone 1 is Presidio, Zone 2 is Lower Presidio, etc.). With the Vulcan software tool “Stope Analyzer” the block model was examined for material that passed certain volume and grade criteria that are integral multiples of the original block size. The approach to stope design begins with an estimate of the minimum fraction required from the high-grade domain diluted to a whole block volume and passing the specified cutoff grade of 6.8 oz Ag/ton. By statistics this was determined to be about 30%. Using this information the block model was “re-blocked” into “stope” size blocks of 20 x 20 x 8 ft. by aggregation or grouping of the 10 x 10 x 4 ft. original blocks with a minimum cutoff of 6.8 opt Ag. If the larger block group passes the cutoff grade and is not mined previously, the block group is marked or flagged as a “stope”. Thus only stopes with a
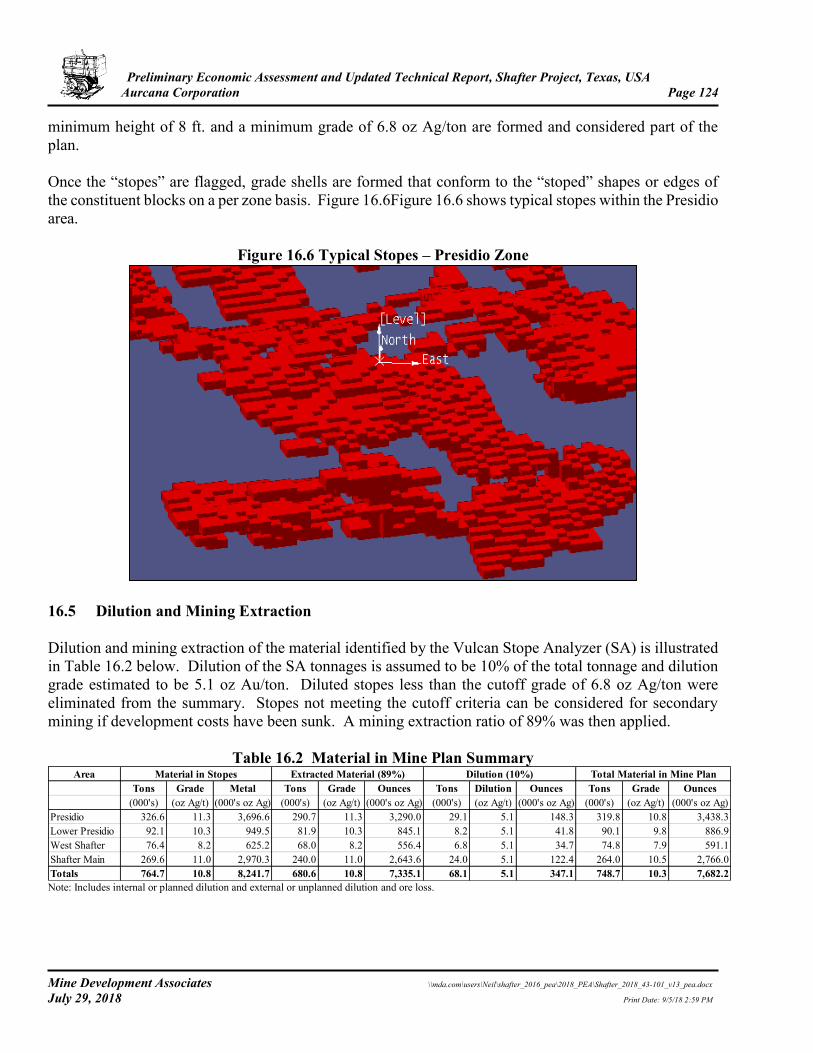
Preliminary Economic Assessment and Updated Technical Report, Shafter Project, Texas, USA Aurcana Corporation Page 124
Mine Development Associates \\mda.com\users\Neil\shafter_2016_pea\2018_PEA\Shafter_2018_43-101_v13_pea.docx July 29, 2018 Print Date: 9/5/18 2:59 PM
minimum height of 8 ft. and a minimum grade of 6.8 oz Ag/ton are formed and considered part of the plan. Once the “stopes” are flagged, grade shells are formed that conform to the “stoped” shapes or edges of the constituent blocks on a per zone basis. Figure 16.6Figure 16.6 shows typical stopes within the Presidio area.
Figure 16.6 Typical Stopes – Presidio Zone
16.5 Dilution and Mining Extraction Dilution and mining extraction of the material identified by the Vulcan Stope Analyzer (SA) is illustrated in Table 16.2 below. Dilution of the SA tonnages is assumed to be 10% of the total tonnage and dilution grade estimated to be 5.1 oz Au/ton. Diluted stopes less than the cutoff grade of 6.8 oz Ag/ton were eliminated from the summary. Stopes not meeting the cutoff criteria can be considered for secondary mining if development costs have been sunk. A mining extraction ratio of 89% was then applied.
Table 16.2 Material in Mine Plan Summary Area Material in Stopes Extracted Material (89%) Dilution (10%) Total Material in Mine Plan
Tons Grade Metal Tons Grade Ounces Tons Dilution Ounces Tons Grade Ounces(000's) (oz Ag/t) (000's oz Ag) (000's) (oz Ag/t) (000's oz Ag) (000's) (oz Ag/t) (000's oz Ag) (000's) (oz Ag/t) (000's oz Ag)
Presidio 326.6 11.3 3,696.6 290.7 11.3 3,290.0 29.1 5.1 148.3 319.8 10.8 3,438.3Lower Presidio 92.1 10.3 949.5 81.9 10.3 845.1 8.2 5.1 41.8 90.1 9.8 886.9West Shafter 76.4 8.2 625.2 68.0 8.2 556.4 6.8 5.1 34.7 74.8 7.9 591.1Shafter Main 269.6 11.0 2,970.3 240.0 11.0 2,643.6 24.0 5.1 122.4 264.0 10.5 2,766.0Totals 764.7 10.8 8,241.7 680.6 10.8 7,335.1 68.1 5.1 347.1 748.7 10.3 7,682.2 Note: Includes internal or planned dilution and external or unplanned dilution and ore loss.
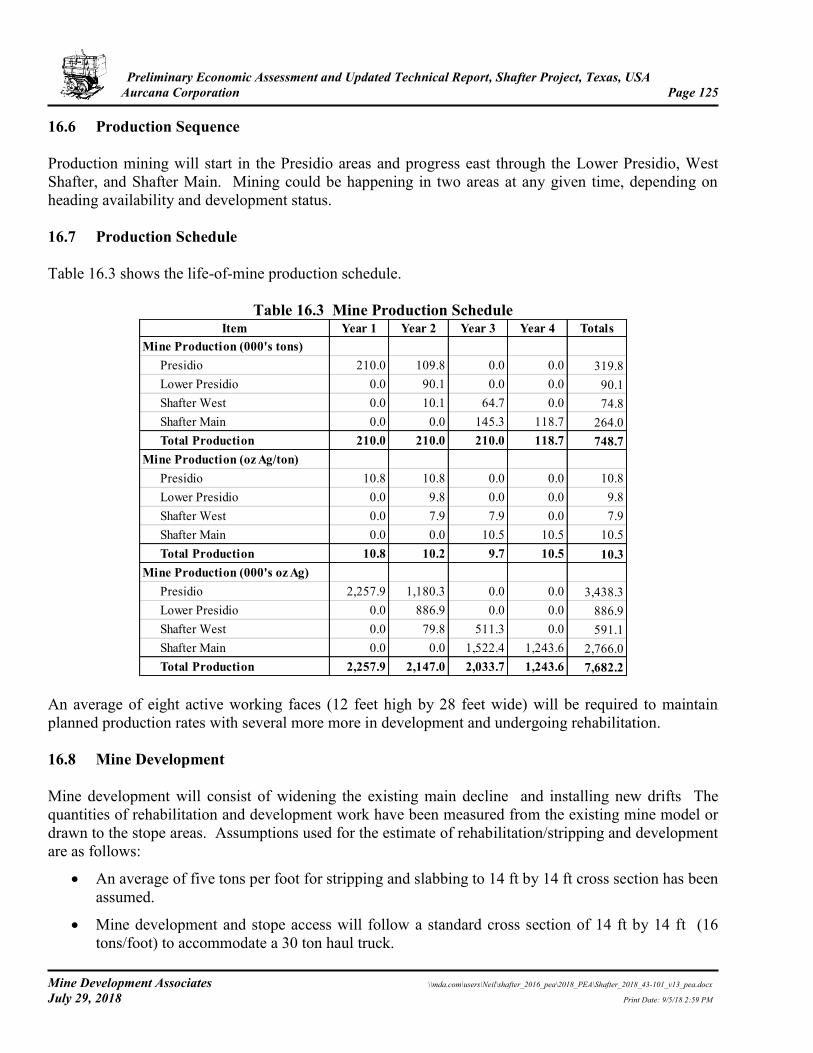
Preliminary Economic Assessment and Updated Technical Report, Shafter Project, Texas, USA Aurcana Corporation Page 125
Mine Development Associates \\mda.com\users\Neil\shafter_2016_pea\2018_PEA\Shafter_2018_43-101_v13_pea.docx July 29, 2018 Print Date: 9/5/18 2:59 PM
16.6 Production Sequence Production mining will start in the Presidio areas and progress east through the Lower Presidio, West Shafter, and Shafter Main. Mining could be happening in two areas at any given time, depending on heading availability and development status. 16.7 Production Schedule Table 16.3 shows the life-of-mine production schedule.
Table 16.3 Mine Production Schedule Item Year 1 Year 2 Year 3 Year 4 Totals
Mine Production (000's tons)Presidio 210.0 109.8 0.0 0.0 319.8Lower Presidio 0.0 90.1 0.0 0.0 90.1Shafter West 0.0 10.1 64.7 0.0 74.8Shafter Main 0.0 0.0 145.3 118.7 264.0Total Production 210.0 210.0 210.0 118.7 748.7
Mine Production (oz Ag/ton)Presidio 10.8 10.8 0.0 0.0 10.8Lower Presidio 0.0 9.8 0.0 0.0 9.8Shafter West 0.0 7.9 7.9 0.0 7.9Shafter Main 0.0 0.0 10.5 10.5 10.5Total Production 10.8 10.2 9.7 10.5 10.3
Mine Production (000's oz Ag)Presidio 2,257.9 1,180.3 0.0 0.0 3,438.3Lower Presidio 0.0 886.9 0.0 0.0 886.9Shafter West 0.0 79.8 511.3 0.0 591.1Shafter Main 0.0 0.0 1,522.4 1,243.6 2,766.0Total Production 2,257.9 2,147.0 2,033.7 1,243.6 7,682.2
An average of eight active working faces (12 feet high by 28 feet wide) will be required to maintain planned production rates with several more more in development and undergoing rehabilitation. 16.8 Mine Development Mine development will consist of widening the existing main decline and installing new drifts The quantities of rehabilitation and development work have been measured from the existing mine model or drawn to the stope areas. Assumptions used for the estimate of rehabilitation/stripping and development are as follows:
• An average of five tons per foot for stripping and slabbing to 14 ft by 14 ft cross section has been assumed.
• Mine development and stope access will follow a standard cross section of 14 ft by 14 ft (16 tons/foot) to accommodate a 30 ton haul truck.
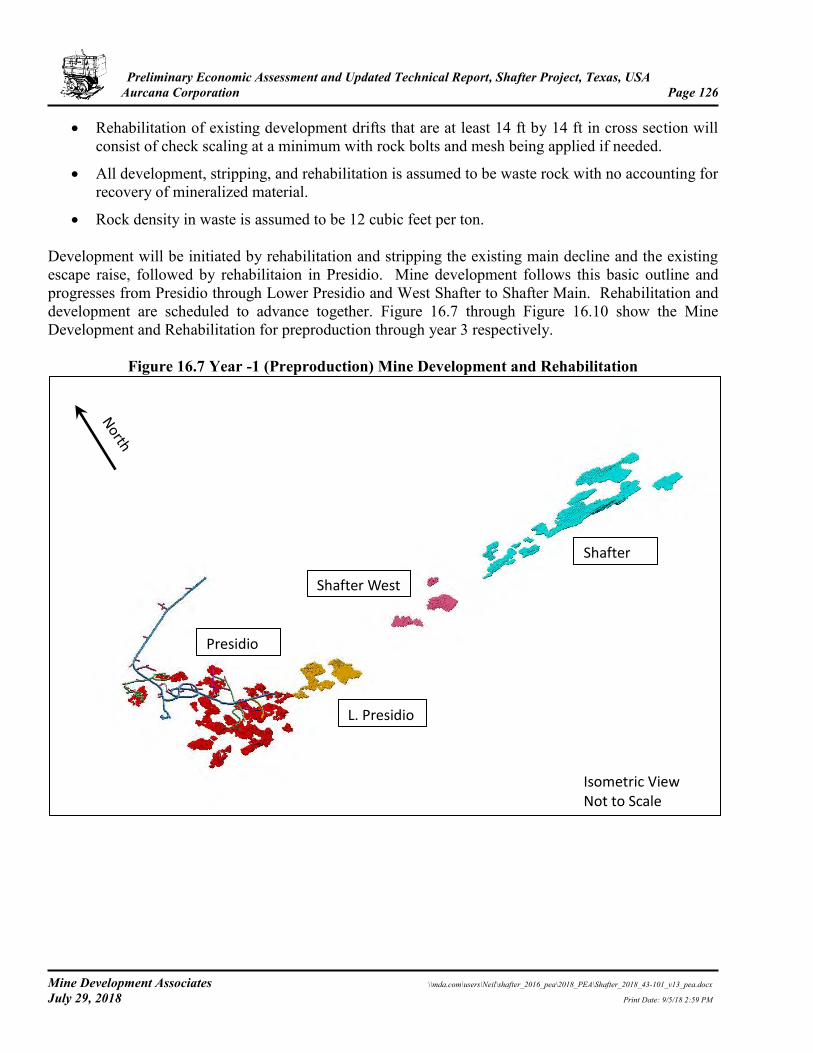
Preliminary Economic Assessment and Updated Technical Report, Shafter Project, Texas, USA Aurcana Corporation Page 126
Mine Development Associates \\mda.com\users\Neil\shafter_2016_pea\2018_PEA\Shafter_2018_43-101_v13_pea.docx July 29, 2018 Print Date: 9/5/18 2:59 PM
• Rehabilitation of existing development drifts that are at least 14 ft by 14 ft in cross section will consist of check scaling at a minimum with rock bolts and mesh being applied if needed.
• All development, stripping, and rehabilitation is assumed to be waste rock with no accounting for recovery of mineralized material.
• Rock density in waste is assumed to be 12 cubic feet per ton. Development will be initiated by rehabilitation and stripping the existing main decline and the existing escape raise, followed by rehabilitaion in Presidio. Mine development follows this basic outline and progresses from Presidio through Lower Presidio and West Shafter to Shafter Main. Rehabilitation and development are scheduled to advance together. Figure 16.7 through Figure 16.10 show the Mine Development and Rehabilitation for preproduction through year 3 respectively.
Figure 16.7 Year -1 (Preproduction) Mine Development and Rehabilitation
Isometric View Not to Scale
Presidio
Shafter
Shafter West
L. Presidio
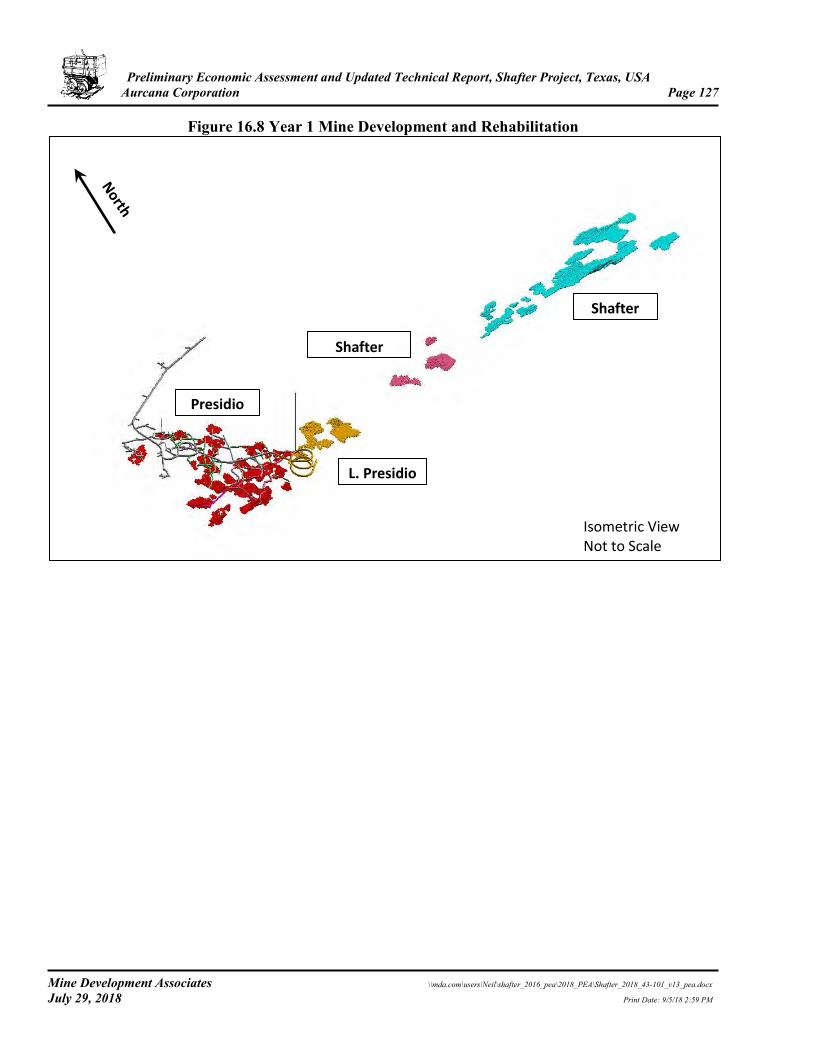
Preliminary Economic Assessment and Updated Technical Report, Shafter Project, Texas, USA Aurcana Corporation Page 127
Mine Development Associates \\mda.com\users\Neil\shafter_2016_pea\2018_PEA\Shafter_2018_43-101_v13_pea.docx July 29, 2018 Print Date: 9/5/18 2:59 PM
Figure 16.8 Year 1 Mine Development and Rehabilitation
Presidio
Shafter
Shafter West
L. Presidio
Isometric View Not to Scale
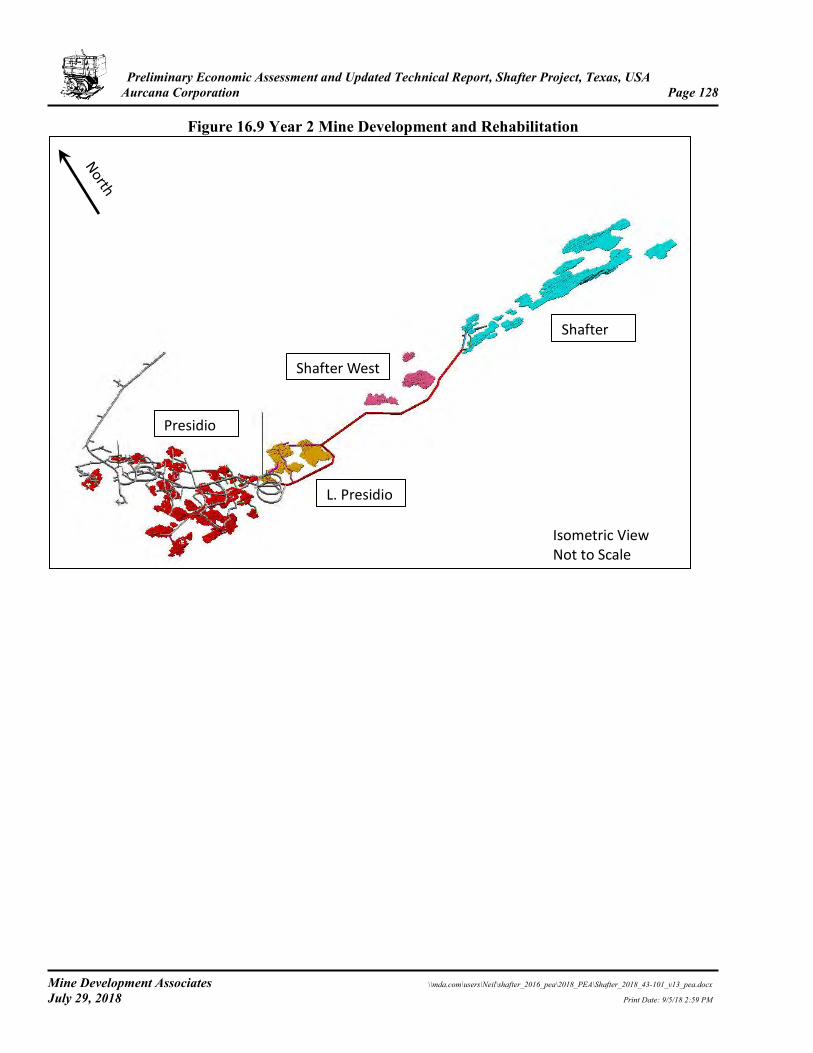
Preliminary Economic Assessment and Updated Technical Report, Shafter Project, Texas, USA Aurcana Corporation Page 128
Mine Development Associates \\mda.com\users\Neil\shafter_2016_pea\2018_PEA\Shafter_2018_43-101_v13_pea.docx July 29, 2018 Print Date: 9/5/18 2:59 PM
Figure 16.9 Year 2 Mine Development and Rehabilitation
Isometric View Not to Scale
Presidio
Shafter
Shafter West
L. Presidio
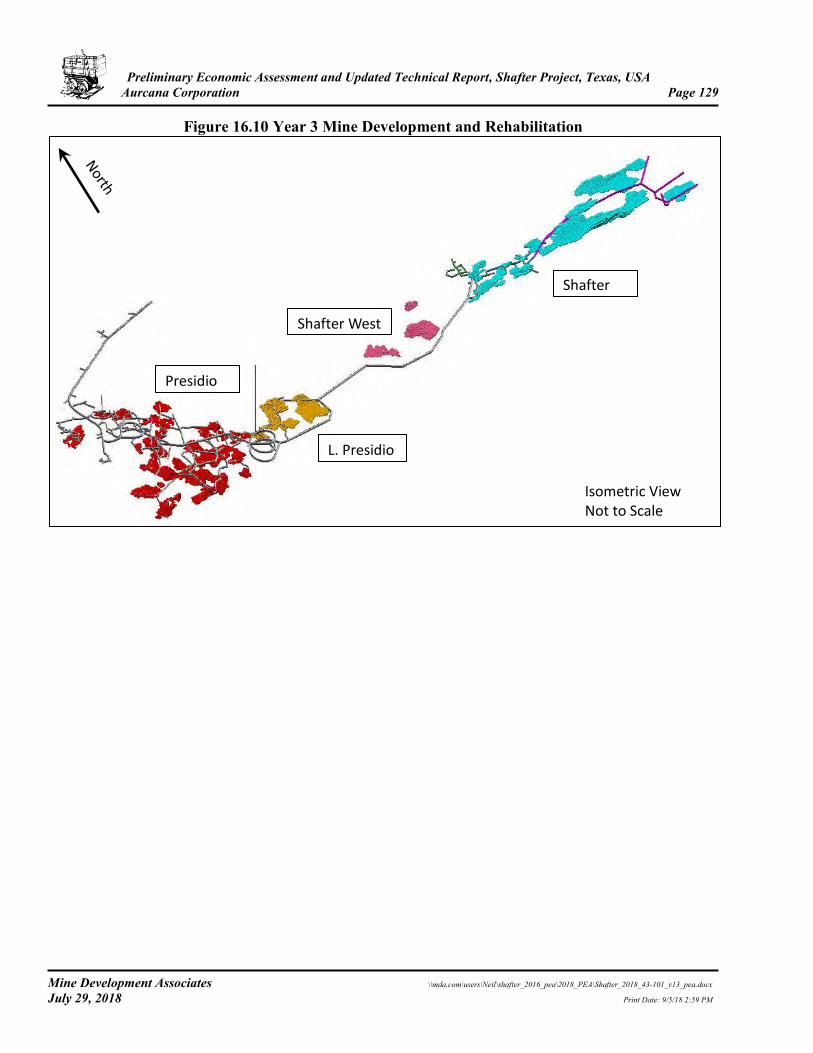
Preliminary Economic Assessment and Updated Technical Report, Shafter Project, Texas, USA Aurcana Corporation Page 129
Mine Development Associates \\mda.com\users\Neil\shafter_2016_pea\2018_PEA\Shafter_2018_43-101_v13_pea.docx July 29, 2018 Print Date: 9/5/18 2:59 PM
Figure 16.10 Year 3 Mine Development and Rehabilitation
Isometric View Not to Scale
Presidio
Shafter
Shafter West
L. Presidio
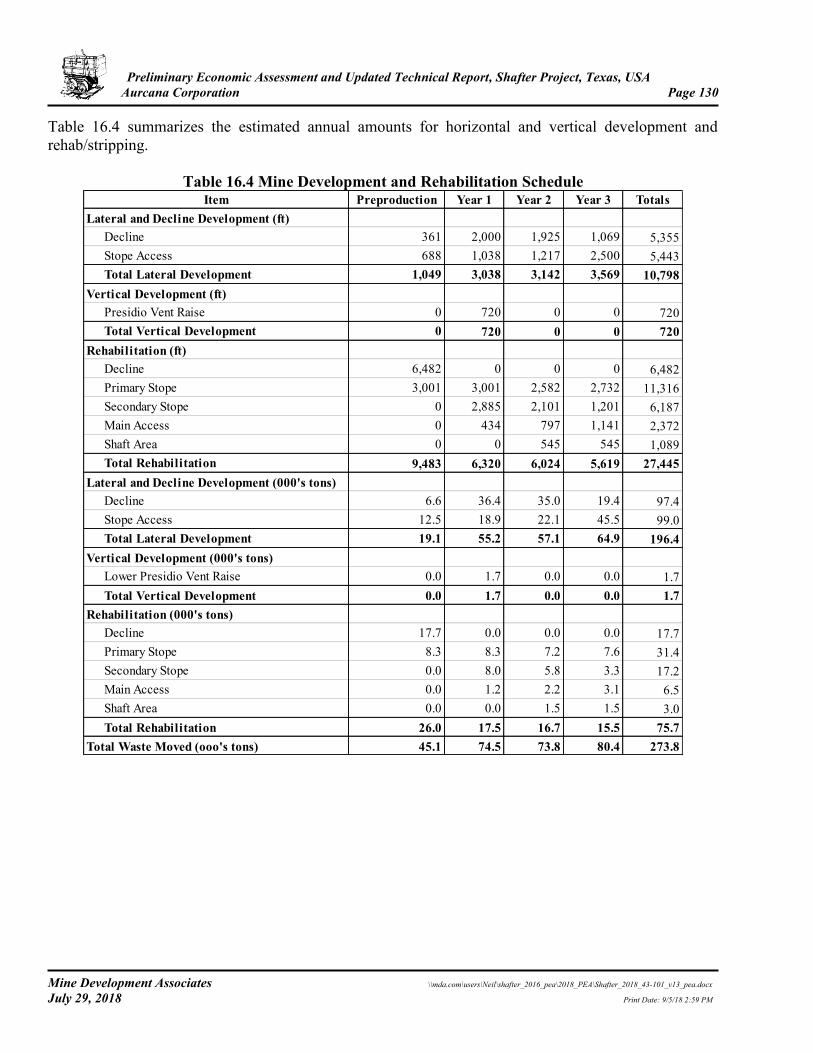
Preliminary Economic Assessment and Updated Technical Report, Shafter Project, Texas, USA Aurcana Corporation Page 130
Mine Development Associates \\mda.com\users\Neil\shafter_2016_pea\2018_PEA\Shafter_2018_43-101_v13_pea.docx July 29, 2018 Print Date: 9/5/18 2:59 PM
Table 16.4 summarizes the estimated annual amounts for horizontal and vertical development and rehab/stripping.
Table 16.4 Mine Development and Rehabilitation Schedule Item Preproduction Year 1 Year 2 Year 3 Totals
Lateral and Decline Development (ft)Decline 361 2,000 1,925 1,069 5,355Stope Access 688 1,038 1,217 2,500 5,443Total Lateral Development 1,049 3,038 3,142 3,569 10,798
Vertical Development (ft)Presidio Vent Raise 0 720 0 0 720Total Vertical Development 0 720 0 0 720
Rehabilitation (ft)Decline 6,482 0 0 0 6,482Primary Stope 3,001 3,001 2,582 2,732 11,316Secondary Stope 0 2,885 2,101 1,201 6,187Main Access 0 434 797 1,141 2,372Shaft Area 0 0 545 545 1,089Total Rehabilitation 9,483 6,320 6,024 5,619 27,445
Lateral and Decline Development (000's tons)Decline 6.6 36.4 35.0 19.4 97.4Stope Access 12.5 18.9 22.1 45.5 99.0Total Lateral Development 19.1 55.2 57.1 64.9 196.4
Vertical Development (000's tons)Lower Presidio Vent Raise 0.0 1.7 0.0 0.0 1.7Total Vertical Development 0.0 1.7 0.0 0.0 1.7
Rehabilitation (000's tons)Decline 17.7 0.0 0.0 0.0 17.7Primary Stope 8.3 8.3 7.2 7.6 31.4Secondary Stope 0.0 8.0 5.8 3.3 17.2Main Access 0.0 1.2 2.2 3.1 6.5Shaft Area 0.0 0.0 1.5 1.5 3.0Total Rehabilitation 26.0 17.5 16.7 15.5 75.7
Total Waste Moved (ooo's tons) 45.1 74.5 73.8 80.4 273.8
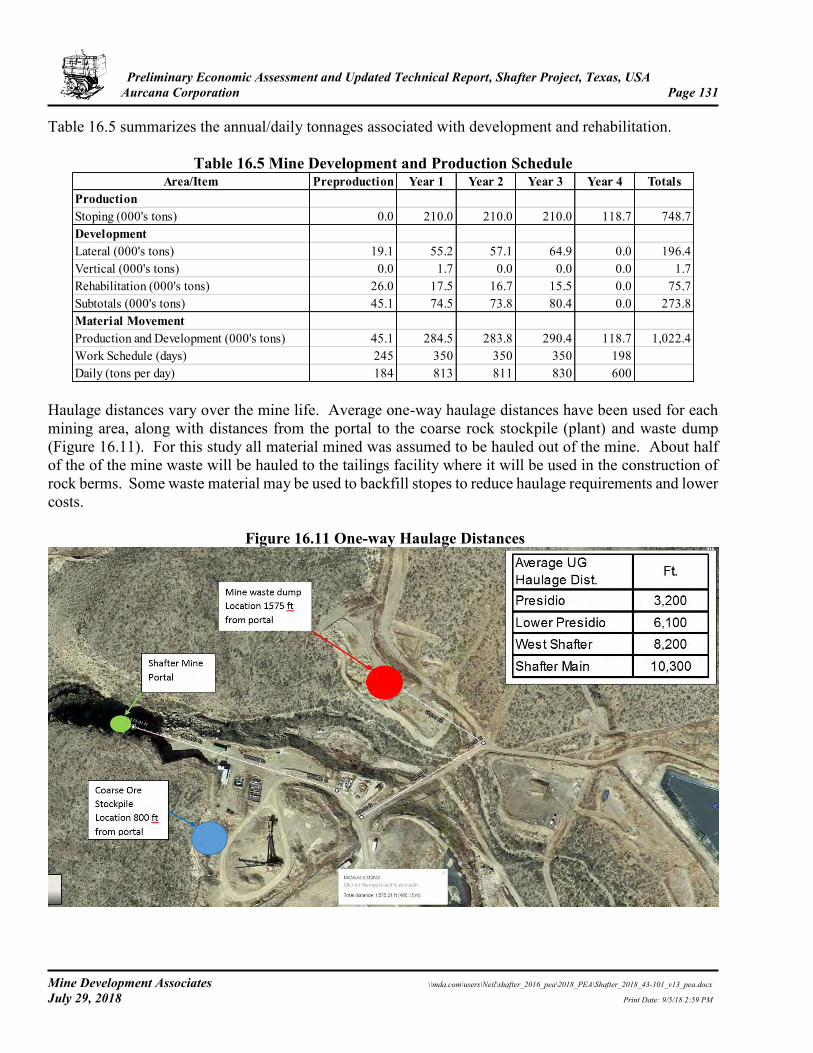
Preliminary Economic Assessment and Updated Technical Report, Shafter Project, Texas, USA Aurcana Corporation Page 131
Mine Development Associates \\mda.com\users\Neil\shafter_2016_pea\2018_PEA\Shafter_2018_43-101_v13_pea.docx July 29, 2018 Print Date: 9/5/18 2:59 PM
Table 16.5 summarizes the annual/daily tonnages associated with development and rehabilitation.
Table 16.5 Mine Development and Production Schedule Area/Item Preproduction Year 1 Year 2 Year 3 Year 4 Totals
ProductionStoping (000's tons) 0.0 210.0 210.0 210.0 118.7 748.7DevelopmentLateral (000's tons) 19.1 55.2 57.1 64.9 0.0 196.4Vertical (000's tons) 0.0 1.7 0.0 0.0 0.0 1.7Rehabilitation (000's tons) 26.0 17.5 16.7 15.5 0.0 75.7Subtotals (000's tons) 45.1 74.5 73.8 80.4 0.0 273.8Material MovementProduction and Development (000's tons) 45.1 284.5 283.8 290.4 118.7 1,022.4Work Schedule (days) 245 350 350 350 198Daily (tons per day) 184 813 811 830 600
Haulage distances vary over the mine life. Average one-way haulage distances have been used for each mining area, along with distances from the portal to the coarse rock stockpile (plant) and waste dump (Figure 16.11). For this study all material mined was assumed to be hauled out of the mine. About half of the of the mine waste will be hauled to the tailings facility where it will be used in the construction of rock berms. Some waste material may be used to backfill stopes to reduce haulage requirements and lower costs.
Figure 16.11 One-way Haulage Distances

Preliminary Economic Assessment and Updated Technical Report, Shafter Project, Texas, USA Aurcana Corporation Page 132
Mine Development Associates \\mda.com\users\Neil\shafter_2016_pea\2018_PEA\Shafter_2018_43-101_v13_pea.docx July 29, 2018 Print Date: 9/5/18 2:59 PM
16.9 Safety and Emergency Egress Budgetary allowances have been made for outfitting a mine rescue team during Year -1. Communications would need to occur with the district MSHA office to find out if any other mine rescue teams exists in the district to function as a back-up team. These could be from other mining companies or government organizations like the Waste Isolation Pilot Plant north of El Paso. Secondary escape during Year -1 will be via the existing escape shaft (#3) and hoist. This shaft is connected to the current access decline on lower levels via internal raises with ladderways. Budgetary allowances have been included to check and rehabilitate this hoist. A new raisebore shaft (#4) is planned for the end of Year 1 and it will provide intake air for Years 1 – 4 of production. Once complete, the existing hoist system from #3 Shaft will be moved over to #4 Shaft to provide emergency escape for the remainder of the mine life. The Goldfields (#1) Shaft could be used for secondary escape also later in the mine life if it proves to be economically feasible to rehabilitate the shaft. A refuge chamber will be purchased and kept within 1000 feet of the furthest east work area through out the mine life. This will provide a safe area for miners to retreat into during an emergency situation that keeps them from getting to surface via the designated primary or secondary escape route. #1 and #4 Shafts will be intake air and if a fire occurs between them and the access portal the miners east of the fire will all retreat to the refuge chamber to wait for instructions. 16.10 Productivity
Manpower needs for Year -1 are based on single heading advance rates for development and stripping from contractor’s experience. Manpower needs during Years 1 through 4 were based on productivities of 30 tons of material moved per production and maintenance manshift. This productivity is a reasonable assumption for headings of this size based on similar mines in Missouri and Tennessee.
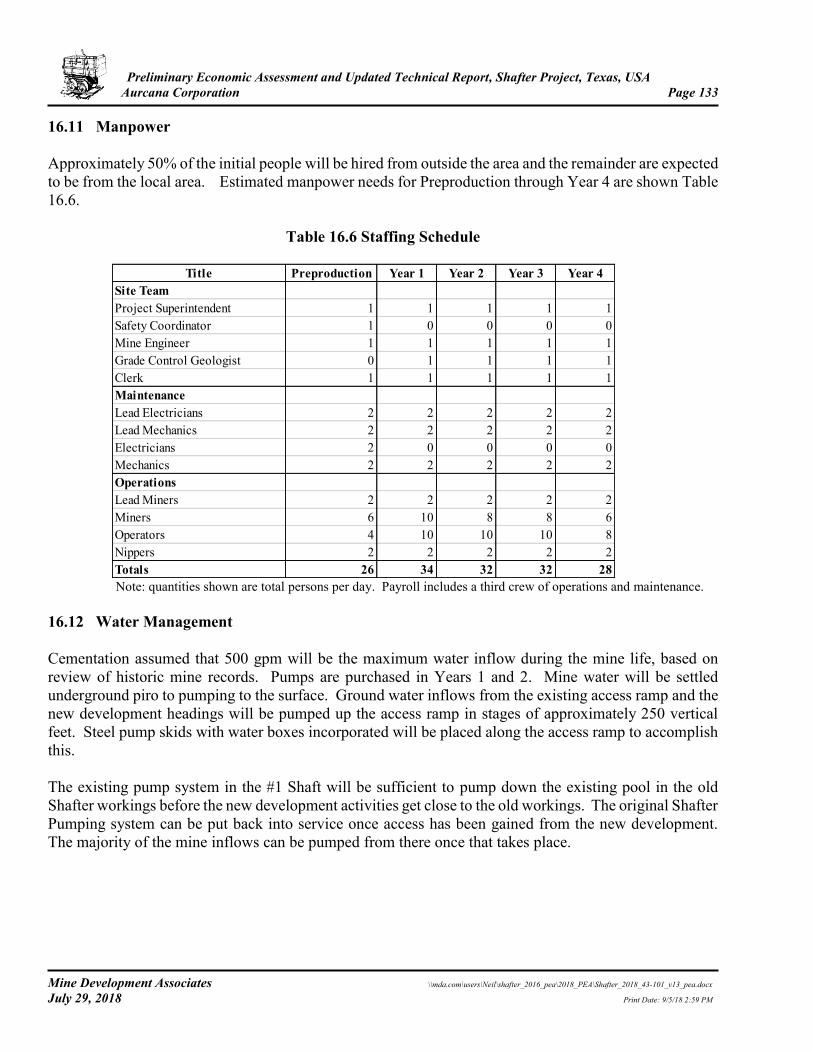
Preliminary Economic Assessment and Updated Technical Report, Shafter Project, Texas, USA Aurcana Corporation Page 133
Mine Development Associates \\mda.com\users\Neil\shafter_2016_pea\2018_PEA\Shafter_2018_43-101_v13_pea.docx July 29, 2018 Print Date: 9/5/18 2:59 PM
16.11 Manpower Approximately 50% of the initial people will be hired from outside the area and the remainder are expected to be from the local area. Estimated manpower needs for Preproduction through Year 4 are shown Table 16.6.
Table 16.6 Staffing Schedule
Title Preproduction Year 1 Year 2 Year 3 Year 4Site TeamProject Superintendent 1 1 1 1 1Safety Coordinator 1 0 0 0 0Mine Engineer 1 1 1 1 1Grade Control Geologist 0 1 1 1 1Clerk 1 1 1 1 1MaintenanceLead Electricians 2 2 2 2 2Lead Mechanics 2 2 2 2 2Electricians 2 0 0 0 0Mechanics 2 2 2 2 2OperationsLead Miners 2 2 2 2 2Miners 6 10 8 8 6Operators 4 10 10 10 8Nippers 2 2 2 2 2Totals 26 34 32 32 28
Note: quantities shown are total persons per day. Payroll includes a third crew of operations and maintenance. 16.12 Water Management Cementation assumed that 500 gpm will be the maximum water inflow during the mine life, based on review of historic mine records. Pumps are purchased in Years 1 and 2. Mine water will be settled underground piro to pumping to the surface. Ground water inflows from the existing access ramp and the new development headings will be pumped up the access ramp in stages of approximately 250 vertical feet. Steel pump skids with water boxes incorporated will be placed along the access ramp to accomplish this. The existing pump system in the #1 Shaft will be sufficient to pump down the existing pool in the old Shafter workings before the new development activities get close to the old workings. The original Shafter Pumping system can be put back into service once access has been gained from the new development. The majority of the mine inflows can be pumped from there once that takes place.
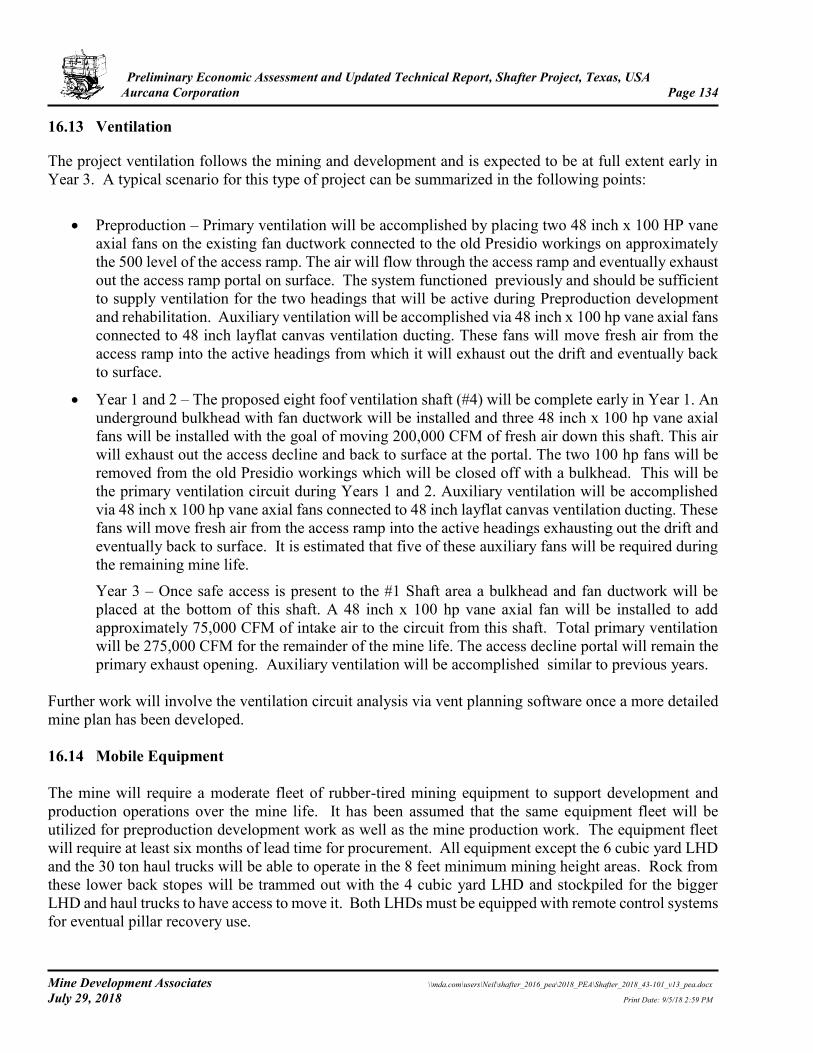
Preliminary Economic Assessment and Updated Technical Report, Shafter Project, Texas, USA Aurcana Corporation Page 134
Mine Development Associates \\mda.com\users\Neil\shafter_2016_pea\2018_PEA\Shafter_2018_43-101_v13_pea.docx July 29, 2018 Print Date: 9/5/18 2:59 PM
16.13 Ventilation
The project ventilation follows the mining and development and is expected to be at full extent early in Year 3. A typical scenario for this type of project can be summarized in the following points:
• Preproduction – Primary ventilation will be accomplished by placing two 48 inch x 100 HP vane axial fans on the existing fan ductwork connected to the old Presidio workings on approximately the 500 level of the access ramp. The air will flow through the access ramp and eventually exhaust out the access ramp portal on surface. The system functioned previously and should be sufficient to supply ventilation for the two headings that will be active during Preproduction development and rehabilitation. Auxiliary ventilation will be accomplished via 48 inch x 100 hp vane axial fans connected to 48 inch layflat canvas ventilation ducting. These fans will move fresh air from the access ramp into the active headings from which it will exhaust out the drift and eventually back to surface.
• Year 1 and 2 – The proposed eight foof ventilation shaft (#4) will be complete early in Year 1. An underground bulkhead with fan ductwork will be installed and three 48 inch x 100 hp vane axial fans will be installed with the goal of moving 200,000 CFM of fresh air down this shaft. This air will exhaust out the access decline and back to surface at the portal. The two 100 hp fans will be removed from the old Presidio workings which will be closed off with a bulkhead. This will be the primary ventilation circuit during Years 1 and 2. Auxiliary ventilation will be accomplished via 48 inch x 100 hp vane axial fans connected to 48 inch layflat canvas ventilation ducting. These fans will move fresh air from the access ramp into the active headings exhausting out the drift and eventually back to surface. It is estimated that five of these auxiliary fans will be required during the remaining mine life. Year 3 – Once safe access is present to the #1 Shaft area a bulkhead and fan ductwork will be placed at the bottom of this shaft. A 48 inch x 100 hp vane axial fan will be installed to add approximately 75,000 CFM of intake air to the circuit from this shaft. Total primary ventilation will be 275,000 CFM for the remainder of the mine life. The access decline portal will remain the primary exhaust opening. Auxiliary ventilation will be accomplished similar to previous years.
Further work will involve the ventilation circuit analysis via vent planning software once a more detailed mine plan has been developed. 16.14 Mobile Equipment The mine will require a moderate fleet of rubber-tired mining equipment to support development and production operations over the mine life. It has been assumed that the same equipment fleet will be utilized for preproduction development work as well as the mine production work. The equipment fleet will require at least six months of lead time for procurement. All equipment except the 6 cubic yard LHD and the 30 ton haul trucks will be able to operate in the 8 feet minimum mining height areas. Rock from these lower back stopes will be trammed out with the 4 cubic yard LHD and stockpiled for the bigger LHD and haul trucks to have access to move it. Both LHDs must be equipped with remote control systems for eventual pillar recovery use.
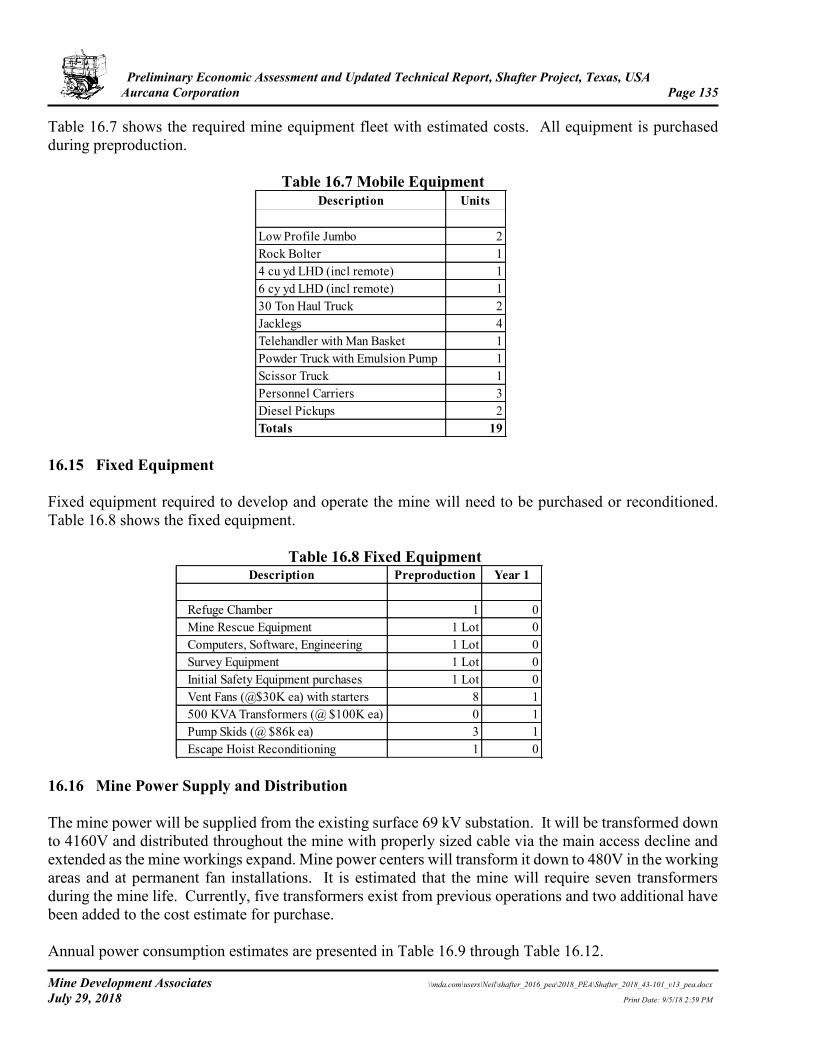
Preliminary Economic Assessment and Updated Technical Report, Shafter Project, Texas, USA Aurcana Corporation Page 135
Mine Development Associates \\mda.com\users\Neil\shafter_2016_pea\2018_PEA\Shafter_2018_43-101_v13_pea.docx July 29, 2018 Print Date: 9/5/18 2:59 PM
Table 16.7 shows the required mine equipment fleet with estimated costs. All equipment is purchased during preproduction.
Table 16.7 Mobile Equipment
Description Units
Low Profile Jumbo 2Rock Bolter 14 cu yd LHD (incl remote) 16 cy yd LHD (incl remote) 130 Ton Haul Truck 2Jacklegs 4Telehandler with Man Basket 1Powder Truck with Emulsion Pump 1Scissor Truck 1Personnel Carriers 3Diesel Pickups 2Totals 19
16.15 Fixed Equipment Fixed equipment required to develop and operate the mine will need to be purchased or reconditioned. Table 16.8 shows the fixed equipment.
Table 16.8 Fixed Equipment
Description Preproduction Year 1
Refuge Chamber 1 0Mine Rescue Equipment 1 Lot 0Computers, Software, Engineering 1 Lot 0Survey Equipment 1 Lot 0Initial Safety Equipment purchases 1 Lot 0Vent Fans (@$30K ea) with starters 8 1500 KVA Transformers (@ $100K ea) 0 1Pump Skids (@ $86k ea) 3 1Escape Hoist Reconditioning 1 0
16.16 Mine Power Supply and Distribution The mine power will be supplied from the existing surface 69 kV substation. It will be transformed down to 4160V and distributed throughout the mine with properly sized cable via the main access decline and extended as the mine workings expand. Mine power centers will transform it down to 480V in the working areas and at permanent fan installations. It is estimated that the mine will require seven transformers during the mine life. Currently, five transformers exist from previous operations and two additional have been added to the cost estimate for purchase. Annual power consumption estimates are presented in Table 16.9 through Table 16.12.
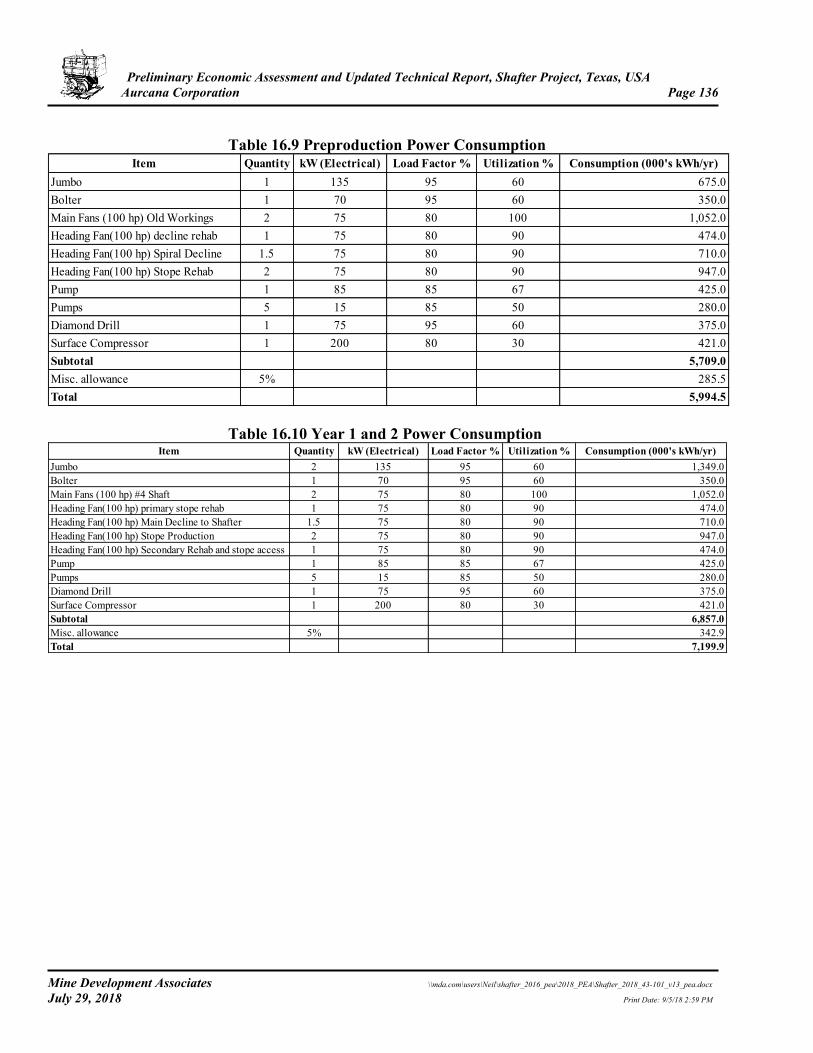
Preliminary Economic Assessment and Updated Technical Report, Shafter Project, Texas, USA Aurcana Corporation Page 136
Mine Development Associates \\mda.com\users\Neil\shafter_2016_pea\2018_PEA\Shafter_2018_43-101_v13_pea.docx July 29, 2018 Print Date: 9/5/18 2:59 PM
Table 16.9 Preproduction Power Consumption
Jumbo 1 135 95 60 675.0Bolter 1 70 95 60 350.0Main Fans (100 hp) Old Workings 2 75 80 100 1,052.0Heading Fan(100 hp) decline rehab 1 75 80 90 474.0Heading Fan(100 hp) Spiral Decline 1.5 75 80 90 710.0Heading Fan(100 hp) Stope Rehab 2 75 80 90 947.0Pump 1 85 85 67 425.0Pumps 5 15 85 50 280.0Diamond Drill 1 75 95 60 375.0Surface Compressor 1 200 80 30 421.0Subtotal 5,709.0Misc. allowance 5% 285.5Total 5,994.5
Item Consumption (000's kWh/yr)Quantity kW (Electrical) Load Factor % Utilization %
Table 16.10 Year 1 and 2 Power Consumption
Jumbo 2 135 95 60 1,349.0Bolter 1 70 95 60 350.0Main Fans (100 hp) #4 Shaft 2 75 80 100 1,052.0Heading Fan(100 hp) primary stope rehab 1 75 80 90 474.0Heading Fan(100 hp) Main Decline to Shafter 1.5 75 80 90 710.0Heading Fan(100 hp) Stope Production 2 75 80 90 947.0Heading Fan(100 hp) Secondary Rehab and stope access 1 75 80 90 474.0Pump 1 85 85 67 425.0Pumps 5 15 85 50 280.0Diamond Drill 1 75 95 60 375.0Surface Compressor 1 200 80 30 421.0Subtotal 6,857.0Misc. allowance 5% 342.9Total 7,199.9
Load Factor % Utilization %Item Consumption (000's kWh/yr)Quantity kW (Electrical)
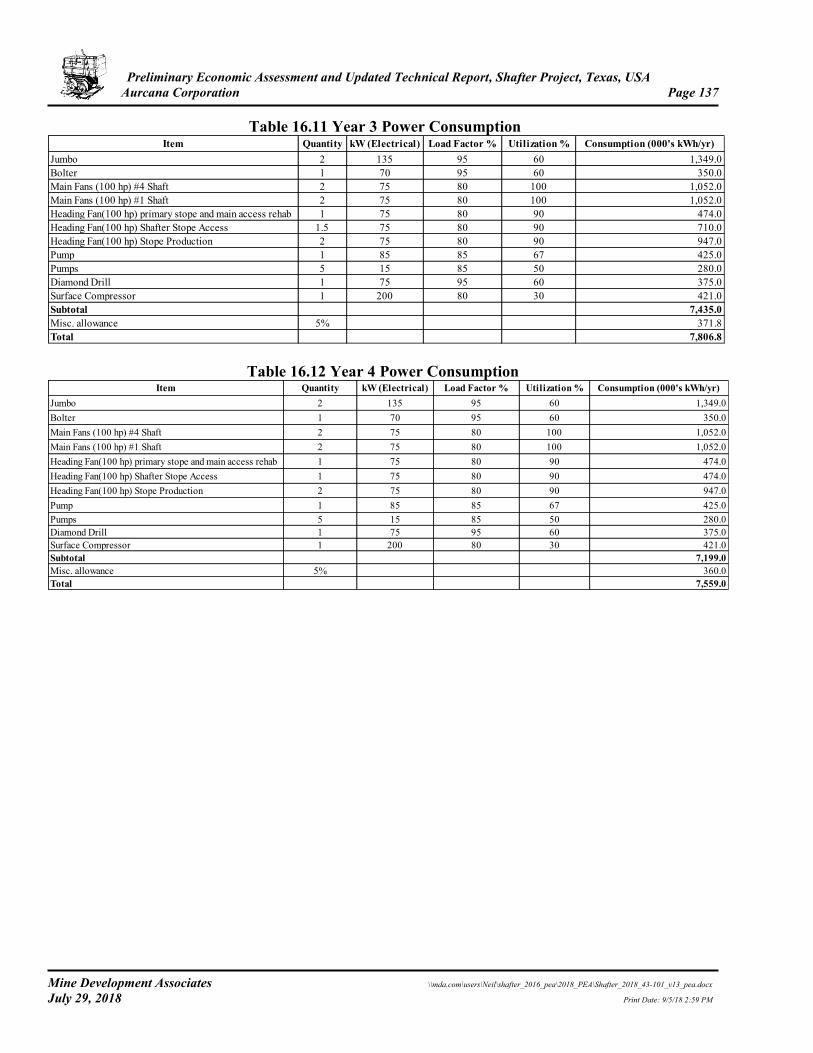
Preliminary Economic Assessment and Updated Technical Report, Shafter Project, Texas, USA Aurcana Corporation Page 137
Mine Development Associates \\mda.com\users\Neil\shafter_2016_pea\2018_PEA\Shafter_2018_43-101_v13_pea.docx July 29, 2018 Print Date: 9/5/18 2:59 PM
Table 16.11 Year 3 Power Consumption
Jumbo 2 135 95 60 1,349.0Bolter 1 70 95 60 350.0Main Fans (100 hp) #4 Shaft 2 75 80 100 1,052.0Main Fans (100 hp) #1 Shaft 2 75 80 100 1,052.0Heading Fan(100 hp) primary stope and main access rehab 1 75 80 90 474.0Heading Fan(100 hp) Shafter Stope Access 1.5 75 80 90 710.0Heading Fan(100 hp) Stope Production 2 75 80 90 947.0Pump 1 85 85 67 425.0Pumps 5 15 85 50 280.0Diamond Drill 1 75 95 60 375.0Surface Compressor 1 200 80 30 421.0Subtotal 7,435.0Misc. allowance 5% 371.8Total 7,806.8
Item Consumption (000's kWh/yr)Quantity kW (Electrical) Load Factor % Utilization %
Table 16.12 Year 4 Power Consumption
Jumbo 2 135 95 60 1,349.0Bolter 1 70 95 60 350.0Main Fans (100 hp) #4 Shaft 2 75 80 100 1,052.0Main Fans (100 hp) #1 Shaft 2 75 80 100 1,052.0Heading Fan(100 hp) primary stope and main access rehab 1 75 80 90 474.0Heading Fan(100 hp) Shafter Stope Access 1 75 80 90 474.0Heading Fan(100 hp) Stope Production 2 75 80 90 947.0Pump 1 85 85 67 425.0Pumps 5 15 85 50 280.0Diamond Drill 1 75 95 60 375.0Surface Compressor 1 200 80 30 421.0Subtotal 7,199.0Misc. allowance 5% 360.0Total 7,559.0
Item Consumption (000's kWh/yr)Quantity kW (Electrical) Load Factor % Utilization %
Preliminary Economic Assessment and Updated Technical Report, Shafter Project, Texas, USA Aurcana Corporation Page 138
Mine Development Associates \\mda.com\users\Neil\shafter_2016_pea\2018_PEA\Shafter_2018_43-101_v13_pea.docx July 29, 2018 Print Date: 9/5/18 2:59 PM
17.0 RECOVERY METHODS Matt Bender with Samuel Engineering in Denver, Colorado, prepared this section . The term “ore” is used in this section only in a metallurgical sense, to indicate mineralized material processed. The Shafter mine processing facility proposed in this study will use whole-ore cyanide leaching to extract silver from the mineralization. Metal recovery will be accomplished using a standard counter current decantation (CCD) and Merrill Crowe method. Run-of-mine (“ROM”) material will be crushed to a nominal 1 inch size using a single jaw crusher for primary crushing and a cone crusher in closed circuit with a product screen for secondary crushing. The crushing plant will operate on a single 12 hour shift, seven days a week, to replenish the crushed mill feed stockpile. The stockpile will have enough capacity to feed the milling operations, which will operate continuously with two, 12-hour shifts, 24 hours/day and 7 days a week. Milling to the final leach feed product size of 80 percent passing 74 microns will be achieved by a single ball mill in closed circuit with cyclones for classification. Cyclone overflow will feed into a pre-leach thickener. Thickened slurry, at 68 percent solids, will flow to the leach circuit where it will be diluted with returned filtrate from the zinc precipitation circuit and make up process water to a solids weight of 45 percent. The pre-leach thickener overflow will report to the process water tank for use in the grinding circuit and as wash water for the tailings filter. The leach tanks are designed for 72 hour retention to achieve an extraction of silver with a constant tail of 1.5 ounce per ton silver. The slurry from the leach circuit will report to the CCD circuit using four thickeners for cleaning of the slurry of pregnant leach solution at an anticipated wash efficiency of 99.6 percent. The pregnant solution from the CCD circuit will flow by pumps to the deaeration vessel and then to the zinc precipitation circuit. Cleaned residue from the CCD circuit will be pumped to the tailings plate and frame filters for one final wash before the residue cake is conveyed to a tailings load out area where it will be hauled to a lined, dry-stacked tailings storage facility. (Note: Tailings handling is not part the scope of this estimate. Filtered tailings cake will be conveyed to a tailings load out area to be hauled to the tailings storage facility or trucks for delivery to the mine operations as backfill feed. The battery limit for this estimate is the discharge end of the filter discharge conveyor). The zinc precipitation circuit will mix zinc with silver-bearing pregnant solution causing the silver to precipitate from solution. The silver precipitated slurry will be pumped through the zinc precipitation filters to capture the silver as a cake. The silver precipitated cake will be transferred to a retort for drying and to remove any contained mercury which will be collected for removal off site. The dried cake from the retort will then be mixed with flux and smelted in a gas fired furnace for pouring in silver doré. The silver doré will be stored in a safe until it is shipped off site to a refiner. Figure 17.1 illustrates the simlified Shafter flowsheet.
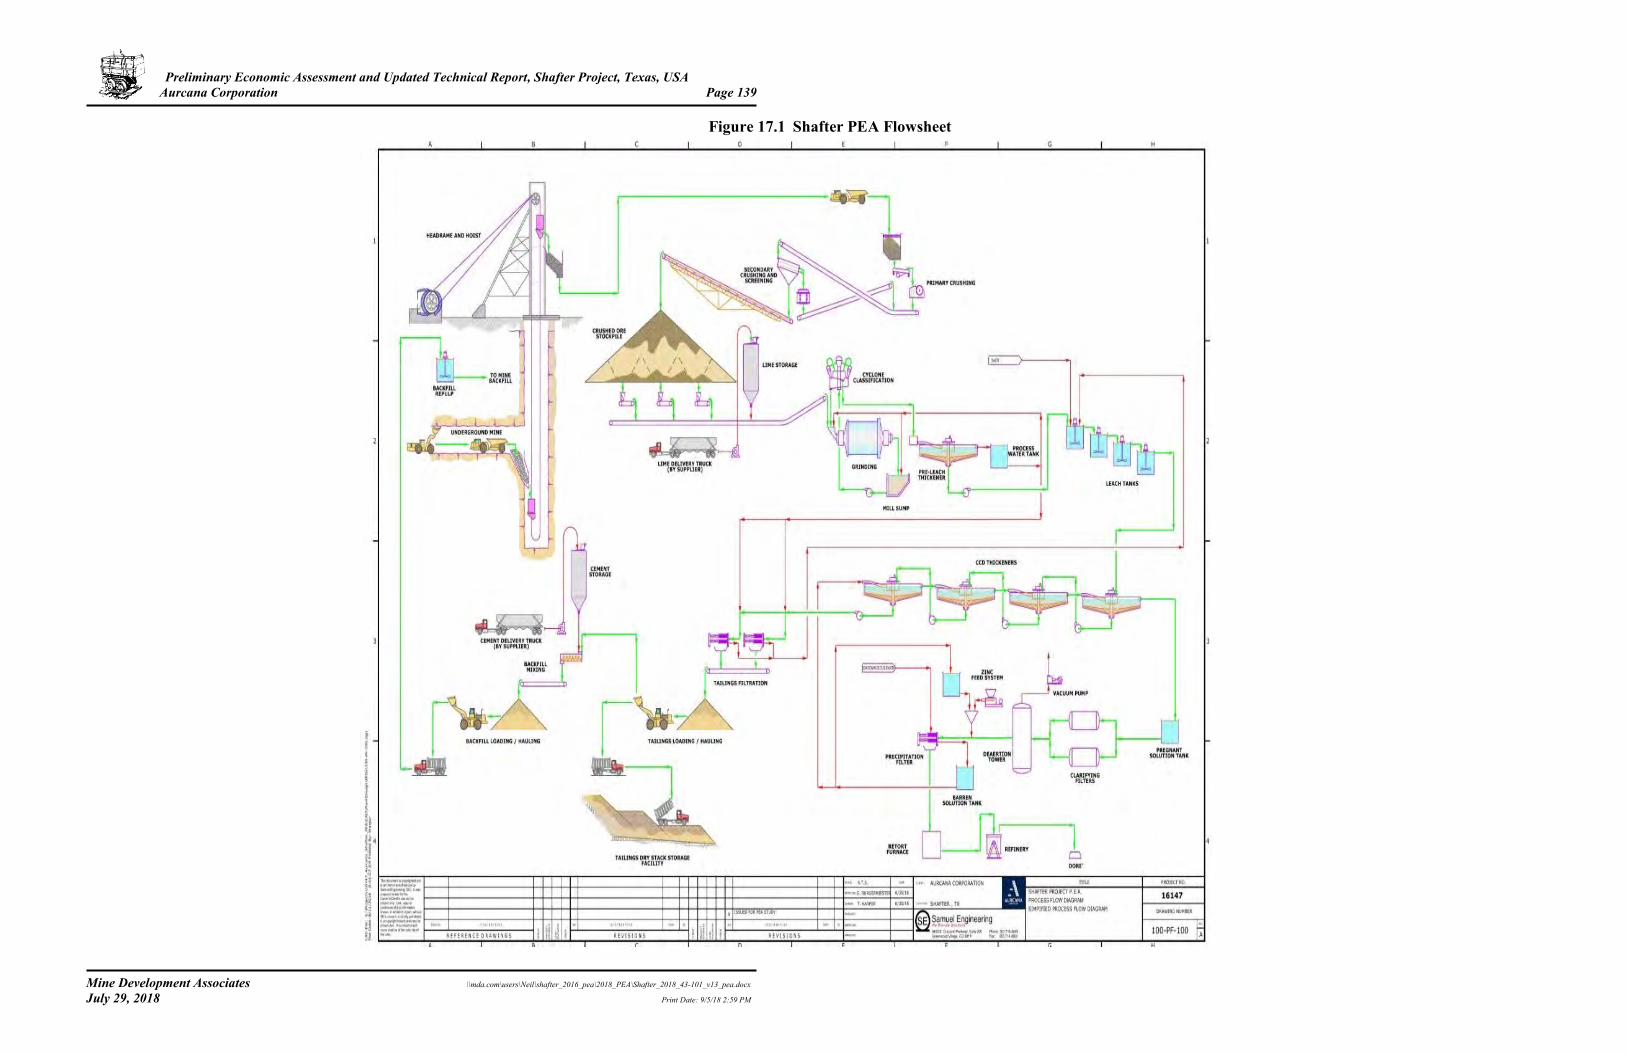
Preliminary Economic Assessment and Updated Technical Report, Shafter Project, Texas, USA Aurcana Corporation Page 139
Mine Development Associates \\mda.com\users\Neil\shafter_2016_pea\2018_PEA\Shafter_2018_43-101_v13_pea.docx July 29, 2018 Print Date: 9/5/18 2:59 PM
Figure 17.1 Shafter PEA Flowsheet
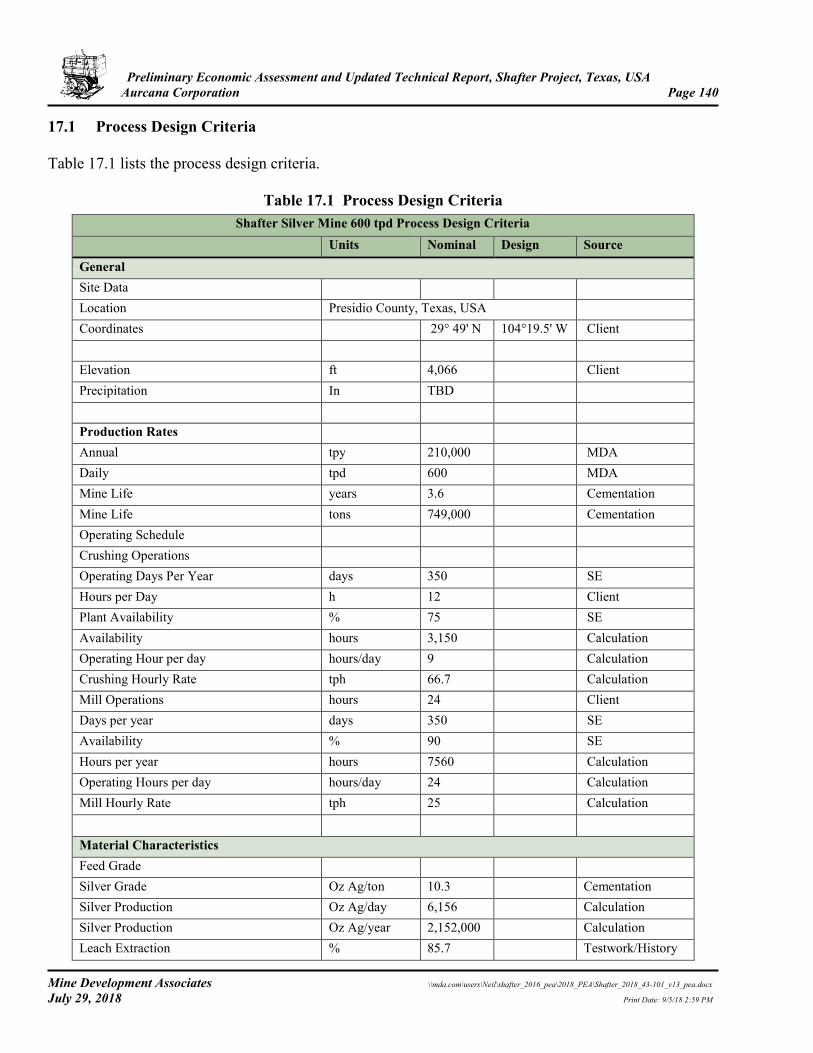
Preliminary Economic Assessment and Updated Technical Report, Shafter Project, Texas, USA Aurcana Corporation Page 140
Mine Development Associates \\mda.com\users\Neil\shafter_2016_pea\2018_PEA\Shafter_2018_43-101_v13_pea.docx July 29, 2018 Print Date: 9/5/18 2:59 PM
17.1 Process Design Criteria Table 17.1 lists the process design criteria.
Table 17.1 Process Design Criteria Shafter Silver Mine 600 tpd Process Design Criteria
Units Nominal Design Source
General Site Data
Location Presidio County, Texas, USA Coordinates
29° 49' N 104°19.5' W Client
Elevation ft 4,066 Client Precipitation In TBD
Production Rates
Annual tpy 210,000 MDA Daily tpd 600 MDA Mine Life years 3.6 Cementation Mine Life tons 749,000 Cementation Operating Schedule
Crushing Operations
Operating Days Per Year days 350 SE Hours per Day h 12 Client Plant Availability % 75 SE Availability hours 3,150 Calculation Operating Hour per day hours/day 9 Calculation Crushing Hourly Rate tph 66.7 Calculation Mill Operations hours 24 Client Days per year days 350 SE Availability % 90 SE Hours per year hours 7560 Calculation Operating Hours per day hours/day 24 Calculation Mill Hourly Rate tph 25 Calculation
Material Characteristics Feed Grade
Silver Grade Oz Ag/ton 10.3
Cementation Silver Production Oz Ag/day 6,156
Calculation
Silver Production Oz Ag/year 2,152,000
Calculation Leach Extraction % 85.7
Testwork/History
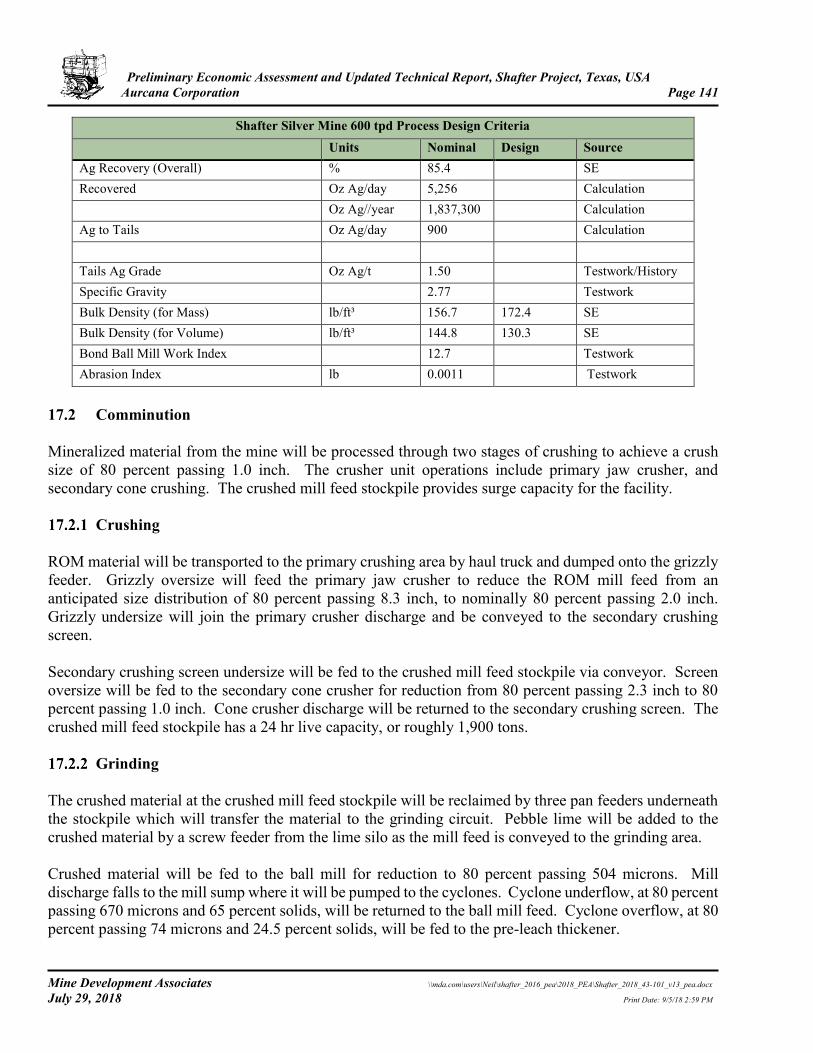
Preliminary Economic Assessment and Updated Technical Report, Shafter Project, Texas, USA Aurcana Corporation Page 141
Mine Development Associates \\mda.com\users\Neil\shafter_2016_pea\2018_PEA\Shafter_2018_43-101_v13_pea.docx July 29, 2018 Print Date: 9/5/18 2:59 PM
Shafter Silver Mine 600 tpd Process Design Criteria
Units Nominal Design Source Ag Recovery (Overall) % 85.4
SE
Recovered Oz Ag/day 5,256
Calculation Oz Ag//year 1,837,300
Calculation
Ag to Tails Oz Ag/day 900
Calculation
Tails Ag Grade Oz Ag/t 1.50
Testwork/History Specific Gravity
2.77
Testwork
Bulk Density (for Mass) lb/ft³ 156.7 172.4 SE Bulk Density (for Volume) lb/ft³ 144.8 130.3 SE Bond Ball Mill Work Index
12.7
Testwork
Abrasion Index lb 0.0011
Testwork
17.2 Comminution Mineralized material from the mine will be processed through two stages of crushing to achieve a crush size of 80 percent passing 1.0 inch. The crusher unit operations include primary jaw crusher, and secondary cone crushing. The crushed mill feed stockpile provides surge capacity for the facility.
Crushing ROM material will be transported to the primary crushing area by haul truck and dumped onto the grizzly feeder. Grizzly oversize will feed the primary jaw crusher to reduce the ROM mill feed from an anticipated size distribution of 80 percent passing 8.3 inch, to nominally 80 percent passing 2.0 inch. Grizzly undersize will join the primary crusher discharge and be conveyed to the secondary crushing screen.
Secondary crushing screen undersize will be fed to the crushed mill feed stockpile via conveyor. Screen oversize will be fed to the secondary cone crusher for reduction from 80 percent passing 2.3 inch to 80 percent passing 1.0 inch. Cone crusher discharge will be returned to the secondary crushing screen. The crushed mill feed stockpile has a 24 hr live capacity, or roughly 1,900 tons.
Grinding The crushed material at the crushed mill feed stockpile will be reclaimed by three pan feeders underneath the stockpile which will transfer the material to the grinding circuit. Pebble lime will be added to the crushed material by a screw feeder from the lime silo as the mill feed is conveyed to the grinding area. Crushed material will be fed to the ball mill for reduction to 80 percent passing 504 microns. Mill discharge falls to the mill sump where it will be pumped to the cyclones. Cyclone underflow, at 80 percent passing 670 microns and 65 percent solids, will be returned to the ball mill feed. Cyclone overflow, at 80 percent passing 74 microns and 24.5 percent solids, will be fed to the pre-leach thickener.
Preliminary Economic Assessment and Updated Technical Report, Shafter Project, Texas, USA Aurcana Corporation Page 142
Mine Development Associates \\mda.com\users\Neil\shafter_2016_pea\2018_PEA\Shafter_2018_43-101_v13_pea.docx July 29, 2018 Print Date: 9/5/18 2:59 PM
17.3 Leach Cyclone overflow will be pumped to the conventional pre-leach thickener. Thickener overflow will flow to the process water tank, which will distribute water back to the grinding circuit for dilution at the mill and the cyclone feed tank, and for final leach residue wash at the tailing filters. Thickener underflow, at 68 percent solids, will be pumped to the cyanide leach circuit. Dilution to the design 45 percent solids will be achieved primarily by filtrate returned from the tailings filters. Four existing leach tanks will provide for the total design, 72 hour leach time. The cyanide ion (“CN”) concentration will be 2,000 ppm in the first tank, with anticipated consumption to bring the CN concentration to approximately 100 ppm in the final tank. The leach circuit is planned to achieve 85.7 percent silver extraction. Leach slurry exiting the final leach tank will flow to the CCD circuit.
17.4 Counter Current Decantation (CCD) The CCD wash will recover the solubilized silver from the leach circuit at an expected efficiency of 99.6 percent. Slurry from the leach circuit will combine with the overflow from CCD #2 to feed CCD #1 with the overflow going to the pregnant solution tank. Underflow from CCD #1 will combine with overflow from CCD #3 to feed CCD #2. This mixing and thickening will continue with the slurry solution becoming more dilute as it passes from CCD #1 in sequence to CCD #4.
The CCD wash solution will be provided by barren filtrate from the precipitation filter and introduced to the CCD circuit at CCD #4. Wash solution from the precipitate filters will be combined with slurry from the underflow of CCD #4 to dilute the slurry prior to being thickened and sent to the tailings filters. The overflow from CCD #4 will combine with underflow slurry from CCD #2 to feed CCD #3, diluting the slurry prior to being thickened and pumped to CCD #4. This process will continue increasing the silver concentration in the overflow until the solution overflow from CCD #1 carries approximately 99.1 percent of the solubilized silver. Final pregnant solution leaving the CDD circuit will depend on the rate of wash solution and the grade of mill feed processed, and should be around the design tenor of 200 ppm Ag.
A final wash and capture of leached silver will be achieved at the tailings filter where barren fresh water will be combined with the underflow from CCD #4 to provided final dilution before the final press reduces the tailings cake moisture to 15 percent, in preparation for hauling to the dry tailings storage facility. Final washed tenor of the moisture in tailings cake will be around 11 ppm silver. 17.5 Merrill Crowe After the CCD circuit, the pregnant overflow from CCD #1 will flow to a pregnant solution tank for surge capacity. The pregnant solution will then be clarified using leaf type filters. After clarification the pregnant solution will be deaerated in the packed tower deaeration vessel where the dissolved oxygen concentration will be brought to below 6 ppm. The solution will then pumped to the precipitate filters. Between the filter feed pumps and the filters a zinc eductor will be used to introduce low solids zinc slurry (300 ppm zinc) to the deaerated pregnant solution. Inline mixers will insure adequate contact for the cementation process where silver will be precipitated as a solid while the fluid is transported to the filters.

Preliminary Economic Assessment and Updated Technical Report, Shafter Project, Texas, USA Aurcana Corporation Page 143
Mine Development Associates \\mda.com\users\Neil\shafter_2016_pea\2018_PEA\Shafter_2018_43-101_v13_pea.docx July 29, 2018 Print Date: 9/5/18 2:59 PM
The two precipitate filters are each designed to accommodate 24 hours worth of precipitate. The precipitate filters will be pre-coated with diatomaceous earth prior to the introduction of the precipitate slurry. Filtrate will be contained for the surge after the filter cycle in the barren solution tank. Barren solution will then be used as wash water for the CCD circuit and as mix water for the zinc mixing system. 17.6 Refinery Precipitate filter cake will drop from the filters into pans and be transferred to the mercury retort where it will be dried in a vacuum at 1350 °F for about 16 hours. The off gas will be cooled to allow any mercury to precipitate and be contained before the gas is vented to atmosphere. The dried cake from the retort will then be mixed with flux and melted in a gas fired furnace for pouring in silver dore. The silver dore is to be stored in a safe until it is shipped off site to a refiner.

Preliminary Economic Assessment and Updated Technical Report, Shafter Project, Texas, USA Aurcana Corporation Page 144
Mine Development Associates \\mda.com\users\Neil\shafter_2016_pea\2018_PEA\Shafter_2018_43-101_v13_pea.docx July 29, 2018 Print Date: 9/5/18 2:59 PM
18.0 PROJECT INFRASTRUCTURE The Shafter Project is in Presidio County, the two principal towns of which are Marfa and Presidio. Marfa, (population 1,800) is a local administrative center that relies on arts and culture, ranching, and tourism. Southeast of Marfa are several bentonite mines and numerous abandoned mercury and fluorite mines. Presidio (population 4,100) is an important administrative center for the U.S. Border Patrol, agriculture, ranching, tourism, and transportation. It is located across the Rio Grande River from Ojinaga, Chihuahua, Mexico (population 23,000).
Because Shafter has been in operation recently (2011-2013), the existing infrastructure for the project is extensive and will require relatively little cost to return to operational readiness. The infrastructure for the Shafter project includes:
• Local resources for labor and housing;
• Access and internal roadways;
• Buildings including maintenance shops, warehouses, offices, laboratory;
• Power supply and distribution;
• Utilities including water, sewage and garbage disposal; and
• Fencing and security systems.
18.1 Local Resources During development activities at Shafter in 2010 to 2013, employees resided in either Presidio, Marfa or Alpine, Texas, and commuted to the site daily. Experienced underground miners and mill operators were sourced mainly from outside the area, particularly Nevada, New Mexico, Canada, and Chihuahua. It is expected that this would also be the case for a restart of operations.
18.2 Roads and Earthwork Paved U.S. Highway 67 runs through the property between the mine facilities and the town of Shafter itself (population <20) shown in Figure 18.1. Access to the project site from U.S. 67 is by gravel road, which is currently gated to limit access.
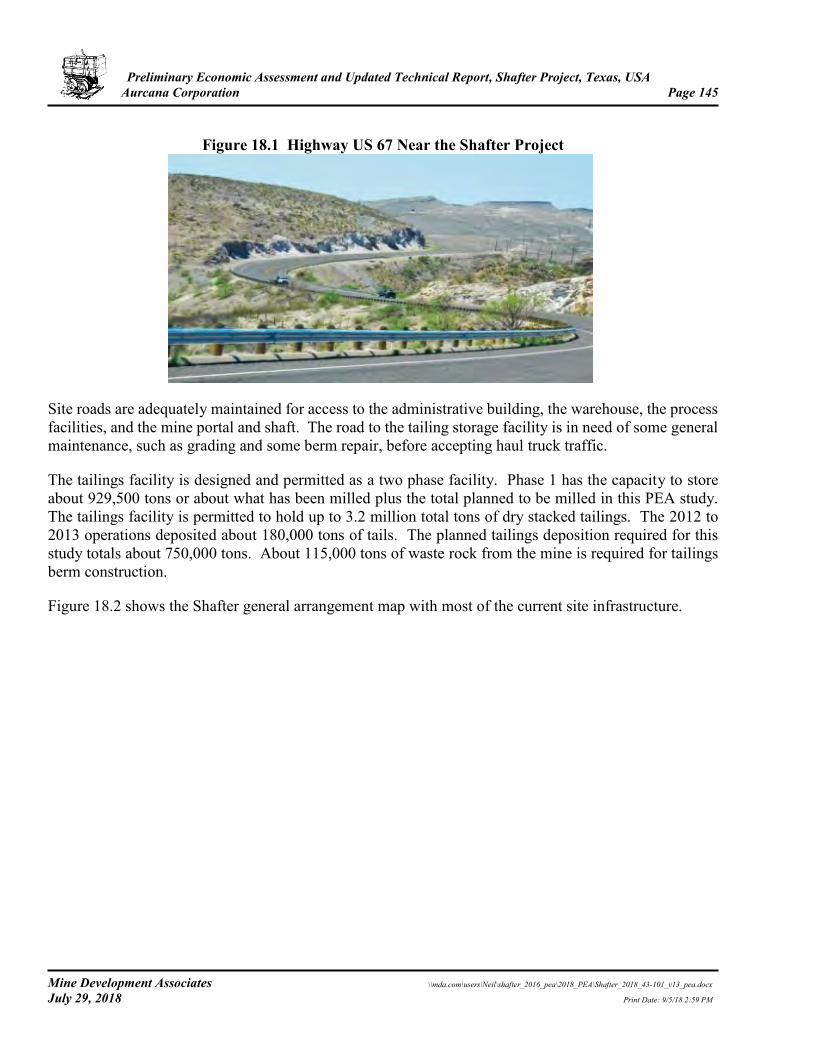
Preliminary Economic Assessment and Updated Technical Report, Shafter Project, Texas, USA Aurcana Corporation Page 145
Mine Development Associates \\mda.com\users\Neil\shafter_2016_pea\2018_PEA\Shafter_2018_43-101_v13_pea.docx July 29, 2018 Print Date: 9/5/18 2:59 PM
Figure 18.1 Highway US 67 Near the Shafter Project
Site roads are adequately maintained for access to the administrative building, the warehouse, the process facilities, and the mine portal and shaft. The road to the tailing storage facility is in need of some general maintenance, such as grading and some berm repair, before accepting haul truck traffic.
The tailings facility is designed and permitted as a two phase facility. Phase 1 has the capacity to store about 929,500 tons or about what has been milled plus the total planned to be milled in this PEA study. The tailings facility is permitted to hold up to 3.2 million total tons of dry stacked tailings. The 2012 to 2013 operations deposited about 180,000 tons of tails. The planned tailings deposition required for this study totals about 750,000 tons. About 115,000 tons of waste rock from the mine is required for tailings berm construction.
Figure 18.2 shows the Shafter general arrangement map with most of the current site infrastructure.
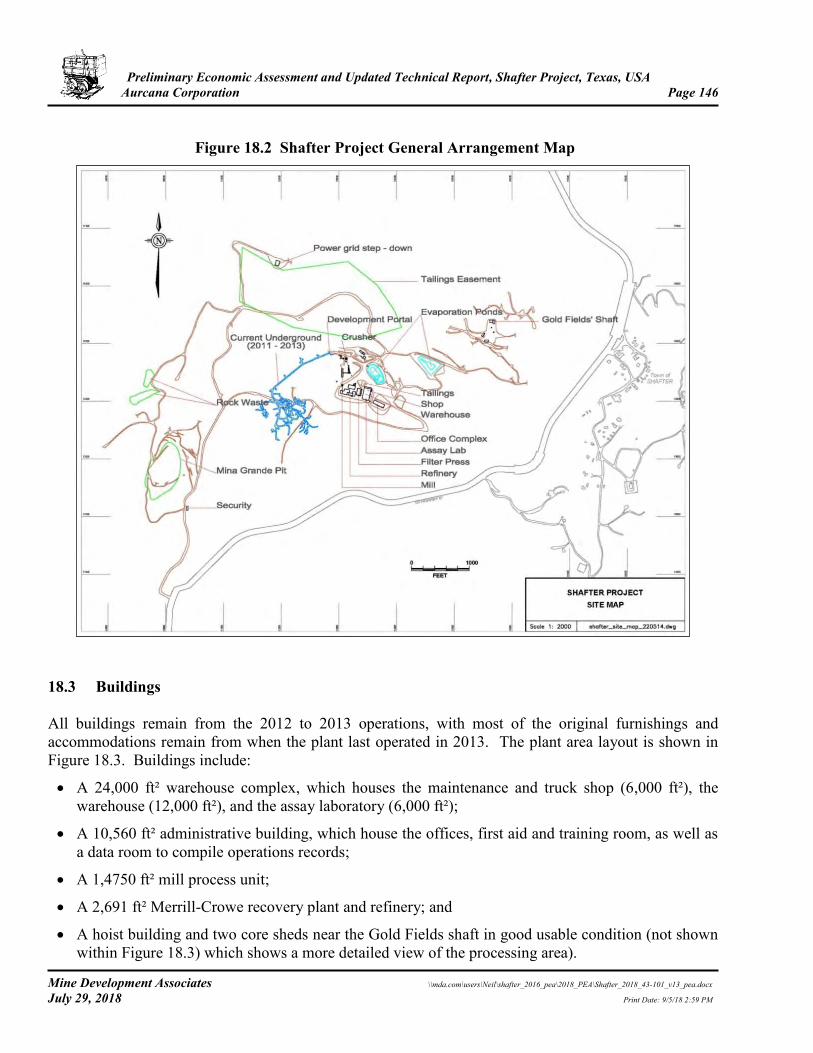
Preliminary Economic Assessment and Updated Technical Report, Shafter Project, Texas, USA Aurcana Corporation Page 146
Mine Development Associates \\mda.com\users\Neil\shafter_2016_pea\2018_PEA\Shafter_2018_43-101_v13_pea.docx July 29, 2018 Print Date: 9/5/18 2:59 PM
Figure 18.2 Shafter Project General Arrangement Map
18.3 Buildings All buildings remain from the 2012 to 2013 operations, with most of the original furnishings and accommodations remain from when the plant last operated in 2013. The plant area layout is shown in Figure 18.3. Buildings include:
• A 24,000 ft² warehouse complex, which houses the maintenance and truck shop (6,000 ft²), the warehouse (12,000 ft²), and the assay laboratory (6,000 ft²);
• A 10,560 ft² administrative building, which house the offices, first aid and training room, as well as a data room to compile operations records;
• A 1,4750 ft² mill process unit;
• A 2,691 ft² Merrill-Crowe recovery plant and refinery; and
• A hoist building and two core sheds near the Gold Fields shaft in good usable condition (not shown within Figure 18.3) which shows a more detailed view of the processing area).
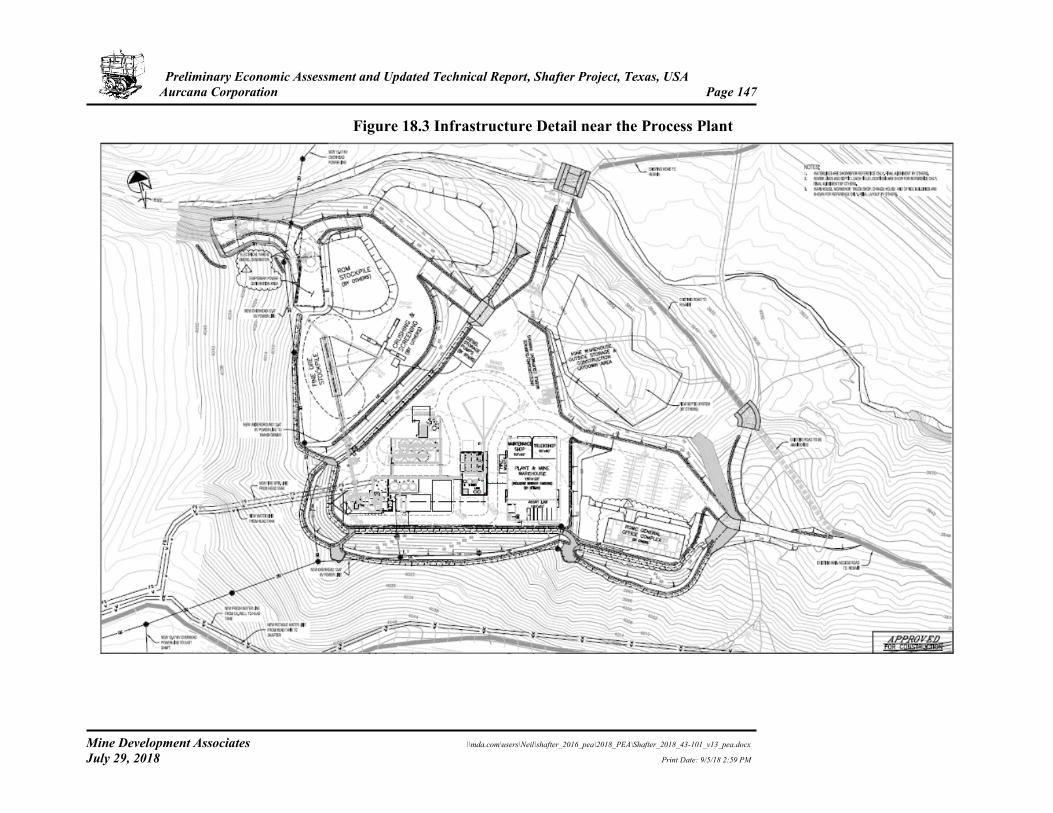
Preliminary Economic Assessment and Updated Technical Report, Shafter Project, Texas, USA Aurcana Corporation Page 147
Mine Development Associates \\mda.com\users\Neil\shafter_2016_pea\2018_PEA\Shafter_2018_43-101_v13_pea.docx July 29, 2018 Print Date: 9/5/18 2:59 PM
Figure 18.3 Infrastructure Detail near the Process Plant
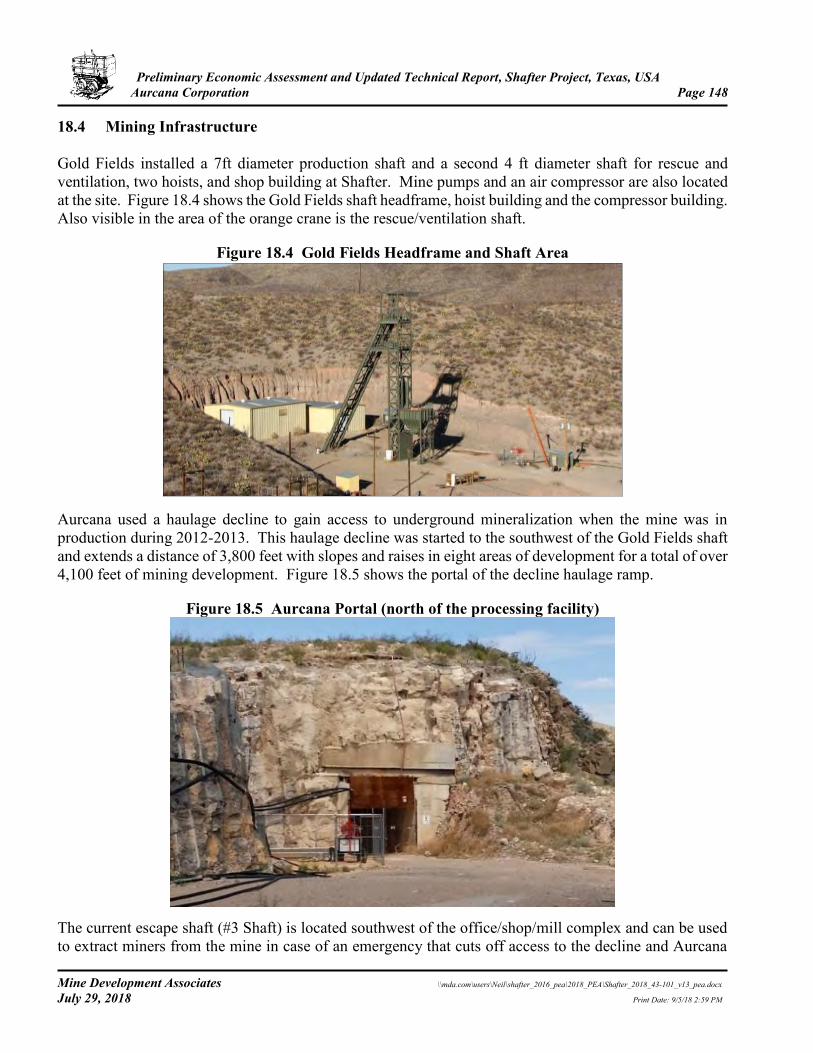
Preliminary Economic Assessment and Updated Technical Report, Shafter Project, Texas, USA Aurcana Corporation Page 148
Mine Development Associates \\mda.com\users\Neil\shafter_2016_pea\2018_PEA\Shafter_2018_43-101_v13_pea.docx July 29, 2018 Print Date: 9/5/18 2:59 PM
18.4 Mining Infrastructure Gold Fields installed a 7ft diameter production shaft and a second 4 ft diameter shaft for rescue and ventilation, two hoists, and shop building at Shafter. Mine pumps and an air compressor are also located at the site. Figure 18.4 shows the Gold Fields shaft headframe, hoist building and the compressor building. Also visible in the area of the orange crane is the rescue/ventilation shaft.
Figure 18.4 Gold Fields Headframe and Shaft Area
Aurcana used a haulage decline to gain access to underground mineralization when the mine was in production during 2012-2013. This haulage decline was started to the southwest of the Gold Fields shaft and extends a distance of 3,800 feet with slopes and raises in eight areas of development for a total of over 4,100 feet of mining development. Figure 18.5 shows the portal of the decline haulage ramp.
Figure 18.5 Aurcana Portal (north of the processing facility)
The current escape shaft (#3 Shaft) is located southwest of the office/shop/mill complex and can be used to extract miners from the mine in case of an emergency that cuts off access to the decline and Aurcana
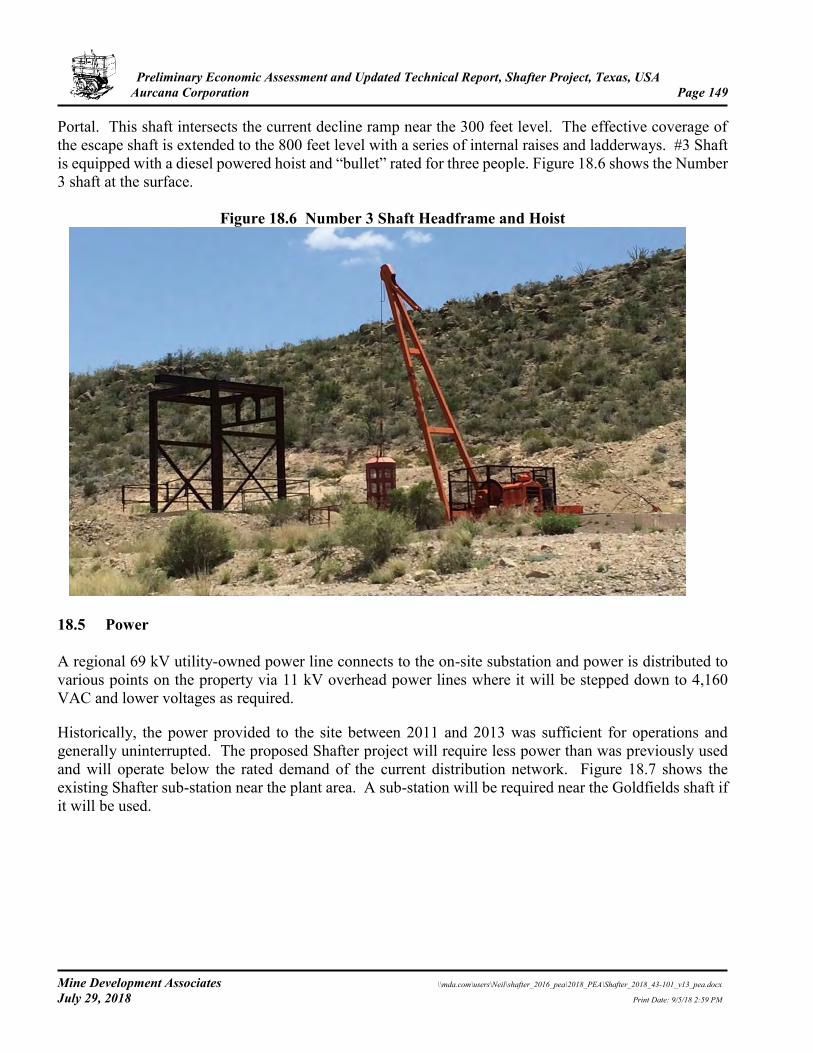
Preliminary Economic Assessment and Updated Technical Report, Shafter Project, Texas, USA Aurcana Corporation Page 149
Mine Development Associates \\mda.com\users\Neil\shafter_2016_pea\2018_PEA\Shafter_2018_43-101_v13_pea.docx July 29, 2018 Print Date: 9/5/18 2:59 PM
Portal. This shaft intersects the current decline ramp near the 300 feet level. The effective coverage of the escape shaft is extended to the 800 feet level with a series of internal raises and ladderways. #3 Shaft is equipped with a diesel powered hoist and “bullet” rated for three people. Figure 18.6 shows the Number 3 shaft at the surface.
Figure 18.6 Number 3 Shaft Headframe and Hoist
18.5 Power A regional 69 kV utility-owned power line connects to the on-site substation and power is distributed to various points on the property via 11 kV overhead power lines where it will be stepped down to 4,160 VAC and lower voltages as required.
Historically, the power provided to the site between 2011 and 2013 was sufficient for operations and generally uninterrupted. The proposed Shafter project will require less power than was previously used and will operate below the rated demand of the current distribution network. Figure 18.7 shows the existing Shafter sub-station near the plant area. A sub-station will be required near the Goldfields shaft if it will be used.
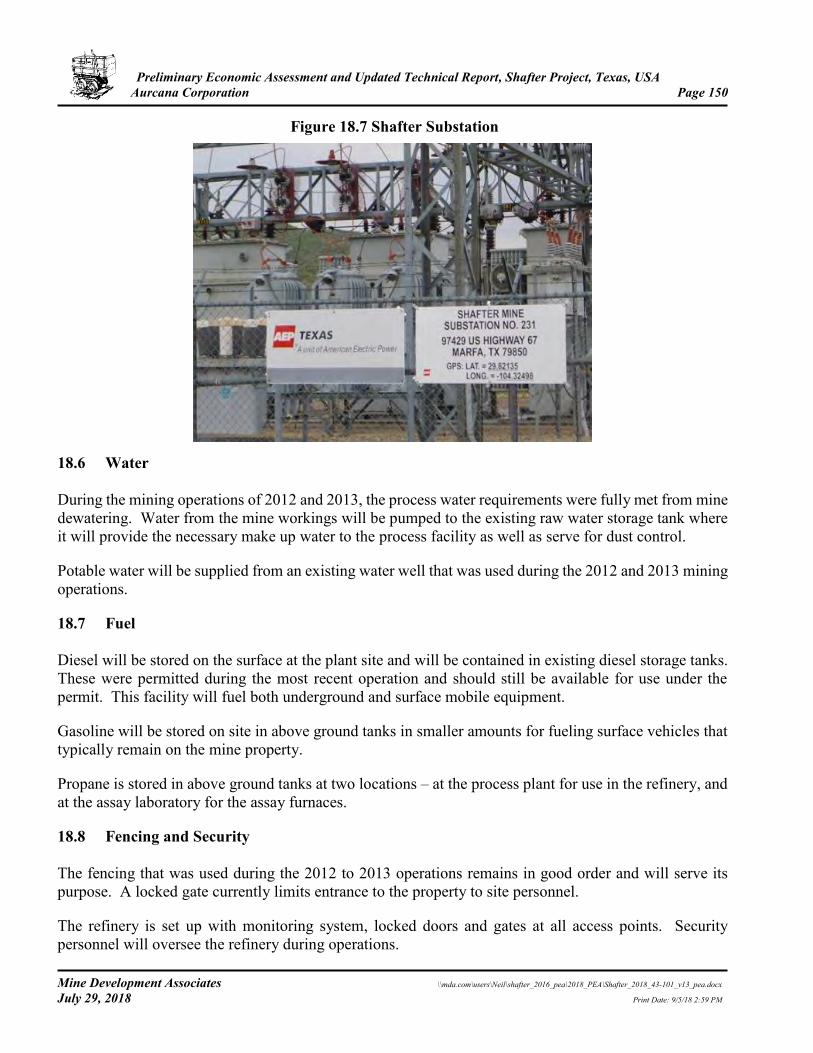
Preliminary Economic Assessment and Updated Technical Report, Shafter Project, Texas, USA Aurcana Corporation Page 150
Mine Development Associates \\mda.com\users\Neil\shafter_2016_pea\2018_PEA\Shafter_2018_43-101_v13_pea.docx July 29, 2018 Print Date: 9/5/18 2:59 PM
Figure 18.7 Shafter Substation
18.6 Water During the mining operations of 2012 and 2013, the process water requirements were fully met from mine dewatering. Water from the mine workings will be pumped to the existing raw water storage tank where it will provide the necessary make up water to the process facility as well as serve for dust control.
Potable water will be supplied from an existing water well that was used during the 2012 and 2013 mining operations.
18.7 Fuel Diesel will be stored on the surface at the plant site and will be contained in existing diesel storage tanks. These were permitted during the most recent operation and should still be available for use under the permit. This facility will fuel both underground and surface mobile equipment.
Gasoline will be stored on site in above ground tanks in smaller amounts for fueling surface vehicles that typically remain on the mine property.
Propane is stored in above ground tanks at two locations – at the process plant for use in the refinery, and at the assay laboratory for the assay furnaces.
18.8 Fencing and Security The fencing that was used during the 2012 to 2013 operations remains in good order and will serve its purpose. A locked gate currently limits entrance to the property to site personnel.
The refinery is set up with monitoring system, locked doors and gates at all access points. Security personnel will oversee the refinery during operations.
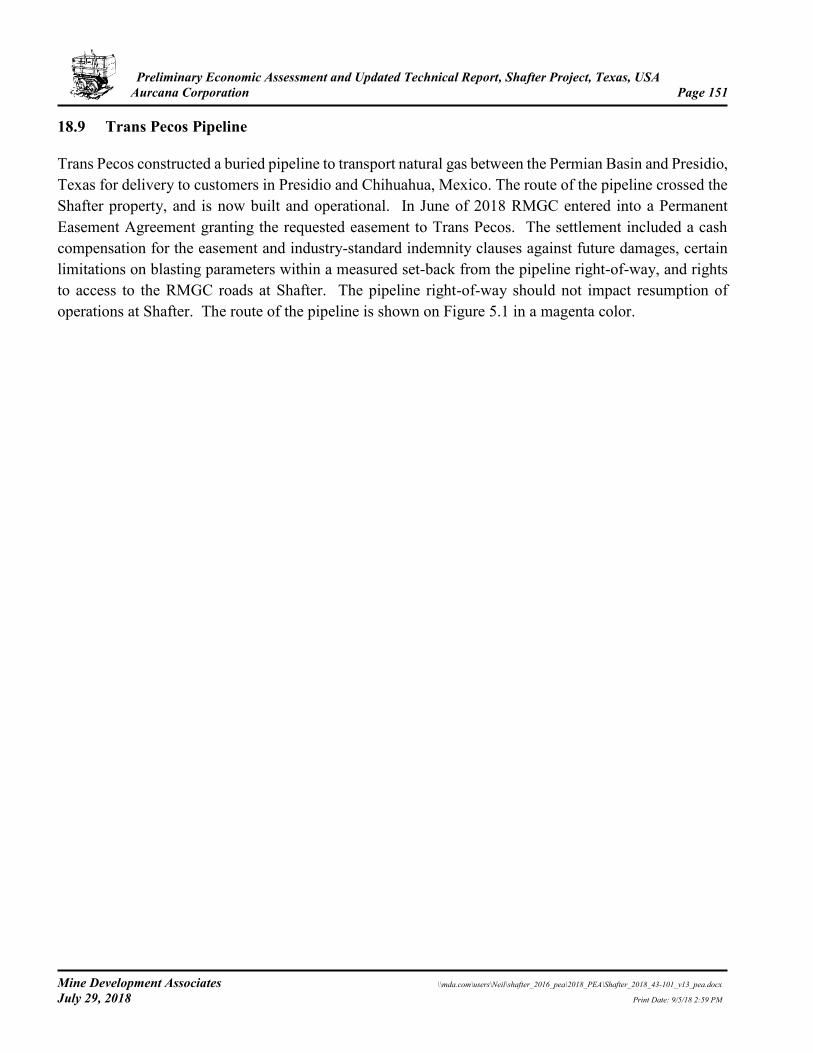
Preliminary Economic Assessment and Updated Technical Report, Shafter Project, Texas, USA Aurcana Corporation Page 151
Mine Development Associates \\mda.com\users\Neil\shafter_2016_pea\2018_PEA\Shafter_2018_43-101_v13_pea.docx July 29, 2018 Print Date: 9/5/18 2:59 PM
18.9 Trans Pecos Pipeline
Trans Pecos constructed a buried pipeline to transport natural gas between the Permian Basin and Presidio, Texas for delivery to customers in Presidio and Chihuahua, Mexico. The route of the pipeline crossed the Shafter property, and is now built and operational. In June of 2018 RMGC entered into a Permanent Easement Agreement granting the requested easement to Trans Pecos. The settlement included a cash compensation for the easement and industry-standard indemnity clauses against future damages, certain limitations on blasting parameters within a measured set-back from the pipeline right-of-way, and rights to access to the RMGC roads at Shafter. The pipeline right-of-way should not impact resumption of operations at Shafter. The route of the pipeline is shown on Figure 5.1 in a magenta color.
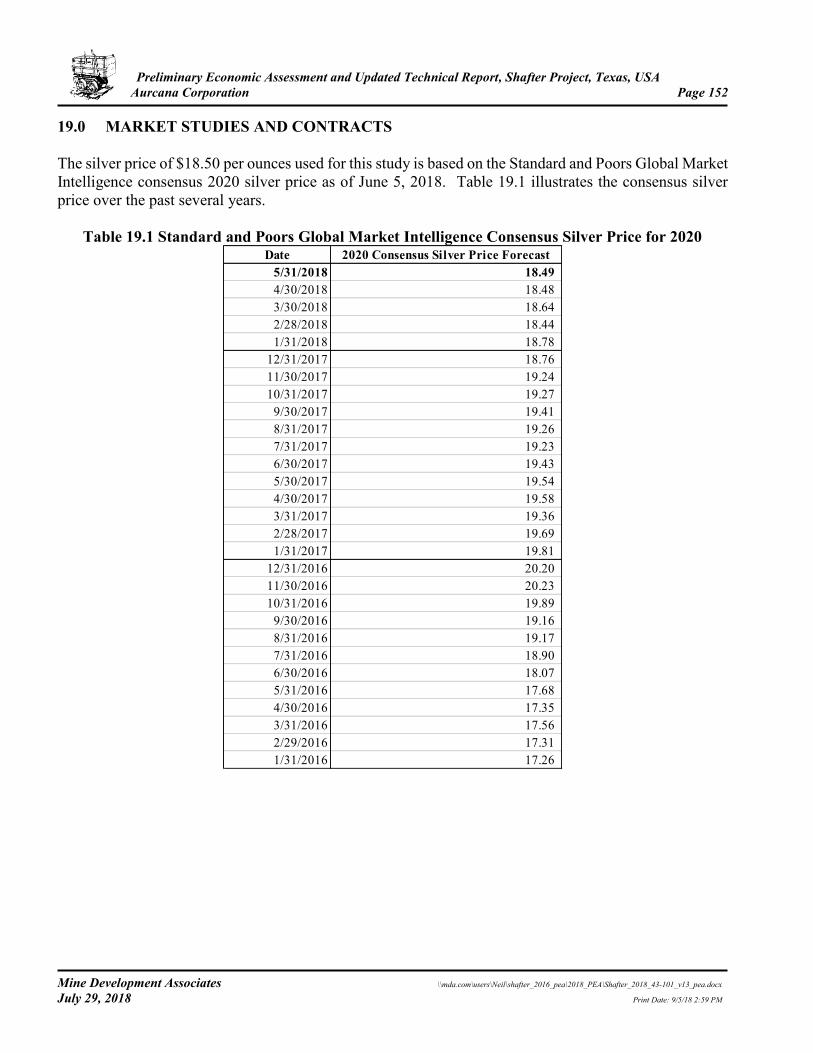
Preliminary Economic Assessment and Updated Technical Report, Shafter Project, Texas, USA Aurcana Corporation Page 152
Mine Development Associates \\mda.com\users\Neil\shafter_2016_pea\2018_PEA\Shafter_2018_43-101_v13_pea.docx July 29, 2018 Print Date: 9/5/18 2:59 PM
19.0 MARKET STUDIES AND CONTRACTS The silver price of $18.50 per ounces used for this study is based on the Standard and Poors Global Market Intelligence consensus 2020 silver price as of June 5, 2018. Table 19.1 illustrates the consensus silver price over the past several years.
Table 19.1 Standard and Poors Global Market Intelligence Consensus Silver Price for 2020 Date 2020 Consensus Silver Price Forecast
5/31/2018 18.49 4/30/2018 18.48 3/30/2018 18.64 2/28/2018 18.44 1/31/2018 18.78
12/31/2017 18.76 11/30/2017 19.24 10/31/2017 19.27
9/30/2017 19.41 8/31/2017 19.26 7/31/2017 19.23 6/30/2017 19.43 5/30/2017 19.54 4/30/2017 19.58 3/31/2017 19.36 2/28/2017 19.69 1/31/2017 19.81
12/31/2016 20.20 11/30/2016 20.23 10/31/2016 19.89
9/30/2016 19.16 8/31/2016 19.17 7/31/2016 18.90 6/30/2016 18.07 5/31/2016 17.68 4/30/2016 17.35 3/31/2016 17.56 2/29/2016 17.31 1/31/2016 17.26
Preliminary Economic Assessment and Updated Technical Report, Shafter Project, Texas, USA Aurcana Corporation Page 153
Mine Development Associates \\mda.com\users\Neil\shafter_2016_pea\2018_PEA\Shafter_2018_43-101_v13_pea.docx July 29, 2018 Print Date: 9/5/18 2:59 PM
20.0 ENVIRONMENTAL STUDIES, PERMITTING AND SOCIAL OR COMMUNITY IMPACT
20.1 Introduction The information in this section has been supplied by employees of Rio Grande Mining Company, as well as their environmental, engineering, and reclamation consultants. RGMC has extensive environmental baseline information in their possession collected by previous mine owners and their consultants. Ingress and egress to the property is from State Highway 67. While the Shafter project falls under state (Texas), county (Presidio), and limited federal agency purview with respect to environmental permits and approvals, primary permitting authority rests with the Texas Commission on Environmental Quality (“TCEQ”). The reader should note that while the Texas Natural Resource Conservation Commission (“TNRCC”) is cited occasionally in the following section with reference to historical facts, TNRCC has been renamed TCEQ. State agencies having regulatory authority over the Shafter project in addition to TCEQ include the Texas General Land Office, Texas Health Department, Texas Historical Commission, Texas Parks and Wildlife, and Texas Department of Transportation. Local agencies include the County of Presidio and the Presidio County Underground Water Conservation District. Direct Federal regulatory programs applicable to the Shafter project include Clean Water Act requirements administered by the U.S. Army Corps of Engineers (“COE”) and the U.S. Environmental Protection Agency (“EPA”), and associated compliance with the Endangered Species act and National Historic Preservation Act. These Federal requirements are described in greater detail below. Acquisition of permits and approvals for the Shafter project has been an on-going effort since 1998. These efforts, and the body of documentation and data developed in the process, have resulted in all permits and approvals necessary to operate being current and compliant as of July 11, 2018. An annotated list of primary permits follow. A comprehensive list of acquired permits and approvals, regulatory authorities, permit status, and summary monitoring requirements is included as Table 20.1. 20.2 Permits and Approvals Clean Water Act (CWA), Section 404 Permit and Section 401 State Water Quality Certification In 1998, RGMC applied for and was granted a Section 404 Nationwide #26 Permit and 401 Water Quality Certification to allow construction of a tailing disposal facility in Waters of the United States. In 1999-2000, disposal facility construction took place on the property pursuant to Permit guidelines, and the subject washes were consequently removed from jurisdiction. The 404 Permit formed the federal nexus for Federal compliance with the National Historic Preservation Act (“NHPA”) and the Endangered Species Act (“ESA”).
Preliminary Economic Assessment and Updated Technical Report, Shafter Project, Texas, USA Aurcana Corporation Page 154
Mine Development Associates \\mda.com\users\Neil\shafter_2016_pea\2018_PEA\Shafter_2018_43-101_v13_pea.docx July 29, 2018 Print Date: 9/5/18 2:59 PM
National Historic Preservation Act (NHPA), Section 106 In order to demonstrate Army Corp of Engineers (ACOE) compliance with NHPA Section 106 for the CWA 404 Permit, archaeological investigations were performed on the Area of Potential Effect (“APE”). The APE was limited to the area in which tailings are being deposited. Demonstration of archaeological clearance is evidenced by issuance of the Nationwide #26 Permit by the ACOE. Endangered Species Act (ESA) In order to demonstrate ACOE compliance with Endangered Species Act for the CWA 404 Permit, a records review and sensitive species survey was performed on the project area. No endangered species occur within the project area, and ESA compliance is evidenced by issuance of the Nationwide #26 Permit. Shaft Permit Waiver Texas regulations require a permit to construct a drilled or mined shaft. However, no permitting program was ever established in Texas to support this requirement. Because RGMC’s activities are subject to ground water protection under Title 26 water quality regulations, a permit waiver was issued to RGMC by TNRCC, which later became TCEQ. This waiver remains valid. Underground Workings Permit For the small portion of the mine occurring on leased lands, the General Land Office would normally require an Underground Workings Permit. Because RGMC’s activities are subject to Title 26 water quality regulations, RGMC’s activities on leased lands are exempt by statute from compliance with this requirement New Source Review Air Quality Permit #80987 RGMC requested and ultimately received approval from TCEQ to amend and convert their Flexible Air Permit #80987 to a New Source Review (NSR) Permit. The NSR permit is in place and in compliance. Permit to Discharge Waste #04297 This permit allows RGMC to discharge excess mine de-water into a dry arroyo west of the Cibolo Creek watershed. Water pumped from the underground workings is decanted to allow removal of suspended solids. Once the solids have been removed, the water is used as make-up water in the mill, fire suppression, dust suppression, and drilling water (both surface and underground). A mine de-water distribution pond, and the mill bleed water pond are identified by TCEQ as covered in this permit. Notice to Dispose of Waste – Solid Waste Registration #31623 RGMC disposed of tailing at the Shafter project via dry-stacking in an un-lined surface facility. Because the waste is not hazardous (Bevill exempted), generated by the property owner, and disposed of on-site, this disposal facility may be operated without permit under noticing requirements to TCEQ. Sediment
Preliminary Economic Assessment and Updated Technical Report, Shafter Project, Texas, USA Aurcana Corporation Page 155
Mine Development Associates \\mda.com\users\Neil\shafter_2016_pea\2018_PEA\Shafter_2018_43-101_v13_pea.docx July 29, 2018 Print Date: 9/5/18 2:59 PM
accumulating in RGMC’s mill bleed water pond is subject to the same noticing requirements. RGMC obtained concurrence from TCEQ of the Bevill exempt status of the material in both of these facilities. On-Site Sewage Facility (OSSF) Permit #193 Prior to construction of the septic facility at the Shafter project, Presidio County reviewed and approved RGMC’s facility design. Radioactive Materials License #R36454 A Radioactive Materials License for the gauges used in the Process Plant was issued by the Texas Bureau of Health Service, Division of Radiation Control. Storm Water Multi-Sector General Permit #TXR05T074 RGMC filed the required Notice-of-Intent, and a Storm Water Plan was developed pursuant to the Multi-sector General Permit. The Storm Water Plan is kept available for inspection at the mine site. Water Well Registration #1890018 RGMC’s water supply well, was constructed by Goldfields in 1979, and registered with TCEQ in 2010. Notification of historical well operations has been provided to the Presidio County Underground Water District. Public Water System (PWS) RGMC operates a Public Water System pursuant to Title 30 Texas Administrative Code, Sections §290.38-47. A TCEQ approved PWS is required of an entity that provides drinking water to 25 or more users. RGMC employs a licensed operator to operate and maintain the PWS. Mine Safety and Health Administration (MSHA) Compliance Prior to construction of the portal and ancillary facilities, RGMC obtained a MSHA mine Identification number, submitted the required legal identity report, and obtained approval for the mine site Training Plan. Explosive User’s License An Explosive User’s License was issued to RGMC by the Bureau of Alcohol, Tobacco, Firearms and Explosives. Additionally, RGMC’s contract miners maintained their own explosives licenses. Spill Pollution Control and Countermeasure Plan (“SPCC”) The requirement for an SPCC is stipulated by the volume of petroleum products stored on-site. RGMC developed and maintains an SPCC for inspection on-site.
Preliminary Economic Assessment and Updated Technical Report, Shafter Project, Texas, USA Aurcana Corporation Page 156
Mine Development Associates \\mda.com\users\Neil\shafter_2016_pea\2018_PEA\Shafter_2018_43-101_v13_pea.docx July 29, 2018 Print Date: 9/5/18 2:59 PM
20.3 Social and Community Issues There are no current community or social issues, or negotiation under way, associated with the Shafter project, that could potentially pose a material threat to operations or production from the facility. 20.4 Reclamation and Closure With the exception of the tailing disposal facility and mill bleed water pond, the Shafter project is not subject to typical legislated reclamation measures found in other political jurisdictions. Consistent with supporting information submitted to TCEQ, at final cessation of mining, the tailing will be capped, contoured, and vegetated. Any water remaining in the mill bleed water pond following cessation of mining will be allowed to evaporate. Once completely dry, residual materials in the pond will be removed, and transported to a licensed facility for disposal. The pond liner will be buried in place and the pond area re-contoured. 20.5 Financial Assurance Based on a March 2014 report on closure and reclamation at Shafter (Bokich, 2014), and updated by Gault Group, LLC (2018) the cost of mandated site reclamation is estimated to be approximately $644,000. At this time, no financial assurance is required by any agency to secure financial responsibility for a compliant, long-term closure of the Shafter project. The Shafter project has no requirements for post-closure monitoring. Federal and state laws and regulations are continually changing, and the operator at Shafter should anticipate continuing expenditures to remain in compliance, the cost of which cannot be predicted at this time. The permit status is shown in Table 20.1.
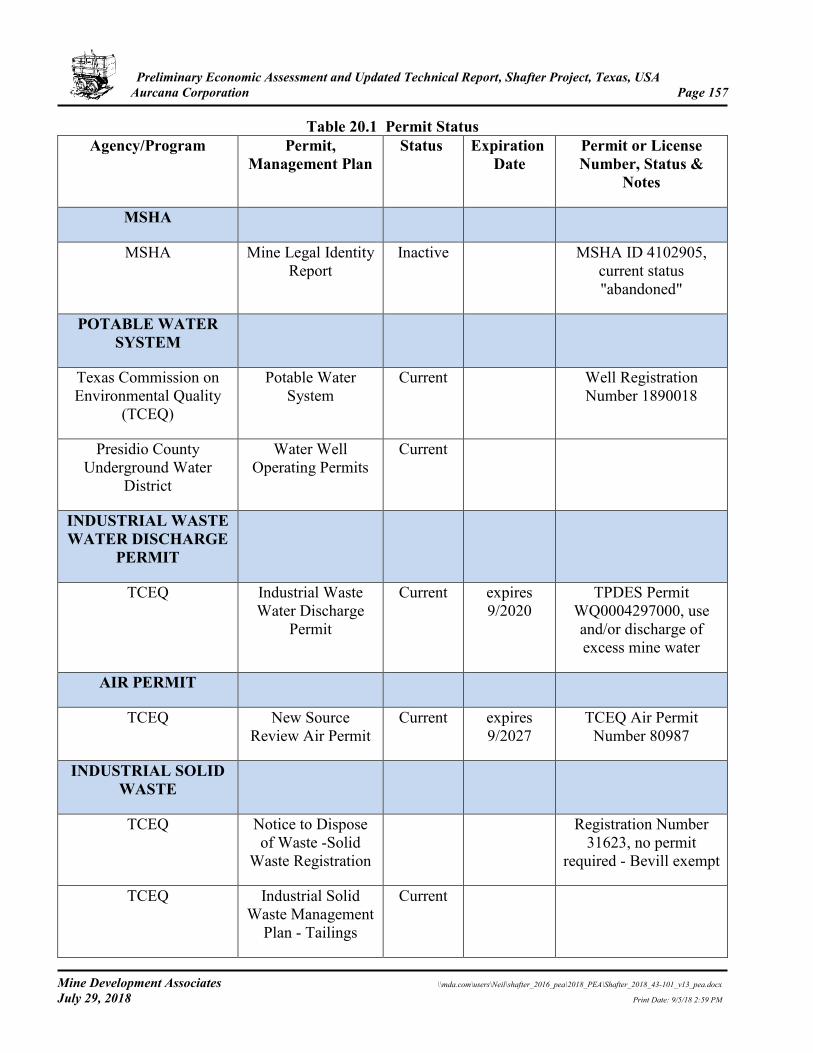
Preliminary Economic Assessment and Updated Technical Report, Shafter Project, Texas, USA Aurcana Corporation Page 157
Mine Development Associates \\mda.com\users\Neil\shafter_2016_pea\2018_PEA\Shafter_2018_43-101_v13_pea.docx July 29, 2018 Print Date: 9/5/18 2:59 PM
Table 20.1 Permit Status Agency/Program Permit,
Management Plan Status Expiration
Date Permit or License Number, Status &
Notes
MSHA
MSHA Mine Legal Identity Report
Inactive MSHA ID 4102905, current status "abandoned"
POTABLE WATER SYSTEM
Texas Commission on Environmental Quality
(TCEQ)
Potable Water System
Current Well Registration Number 1890018
Presidio County Underground Water
District
Water Well Operating Permits
Current
INDUSTRIAL WASTE WATER DISCHARGE
PERMIT
TCEQ Industrial Waste Water Discharge
Permit
Current expires 9/2020
TPDES Permit WQ0004297000, use and/or discharge of excess mine water
AIR PERMIT
TCEQ New Source Review Air Permit
Current expires 9/2027
TCEQ Air Permit Number 80987
INDUSTRIAL SOLID WASTE
TCEQ Notice to Dispose of Waste -Solid
Waste Registration
Registration Number 31623, no permit
required - Bevill exempt
TCEQ Industrial Solid Waste Management
Plan - Tailings
Current
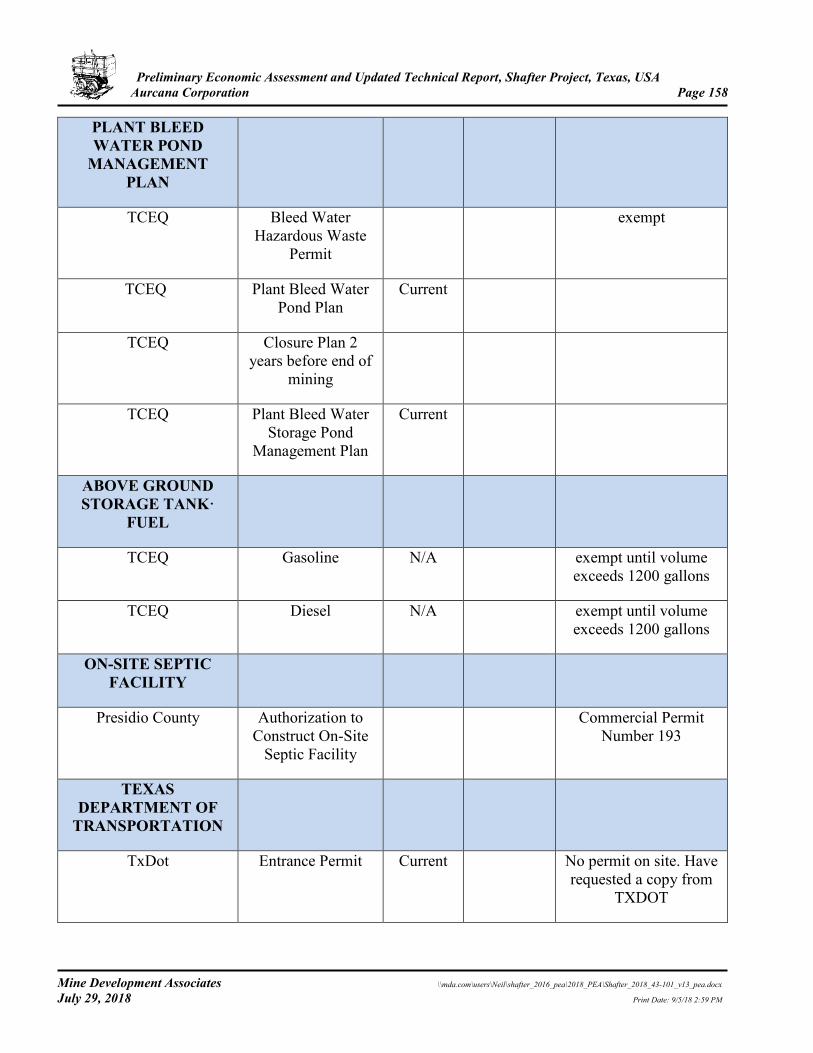
Preliminary Economic Assessment and Updated Technical Report, Shafter Project, Texas, USA Aurcana Corporation Page 158
Mine Development Associates \\mda.com\users\Neil\shafter_2016_pea\2018_PEA\Shafter_2018_43-101_v13_pea.docx July 29, 2018 Print Date: 9/5/18 2:59 PM
PLANT BLEED WATER POND
MANAGEMENT PLAN
TCEQ Bleed Water Hazardous Waste
Permit
exempt
TCEQ Plant Bleed Water Pond Plan
Current
TCEQ Closure Plan 2 years before end of
mining
TCEQ Plant Bleed Water Storage Pond
Management Plan
Current
ABOVE GROUND STORAGE TANK·
FUEL
TCEQ Gasoline N/A exempt until volume exceeds 1200 gallons
TCEQ Diesel N/A exempt until volume exceeds 1200 gallons
ON-SITE SEPTIC FACILITY
Presidio County Authorization to Construct On-Site
Septic Facility
Commercial Permit Number 193
TEXAS DEPARTMENT OF
TRANSPORTATION
TxDot Entrance Permit Current No permit on site. Have requested a copy from
TXDOT
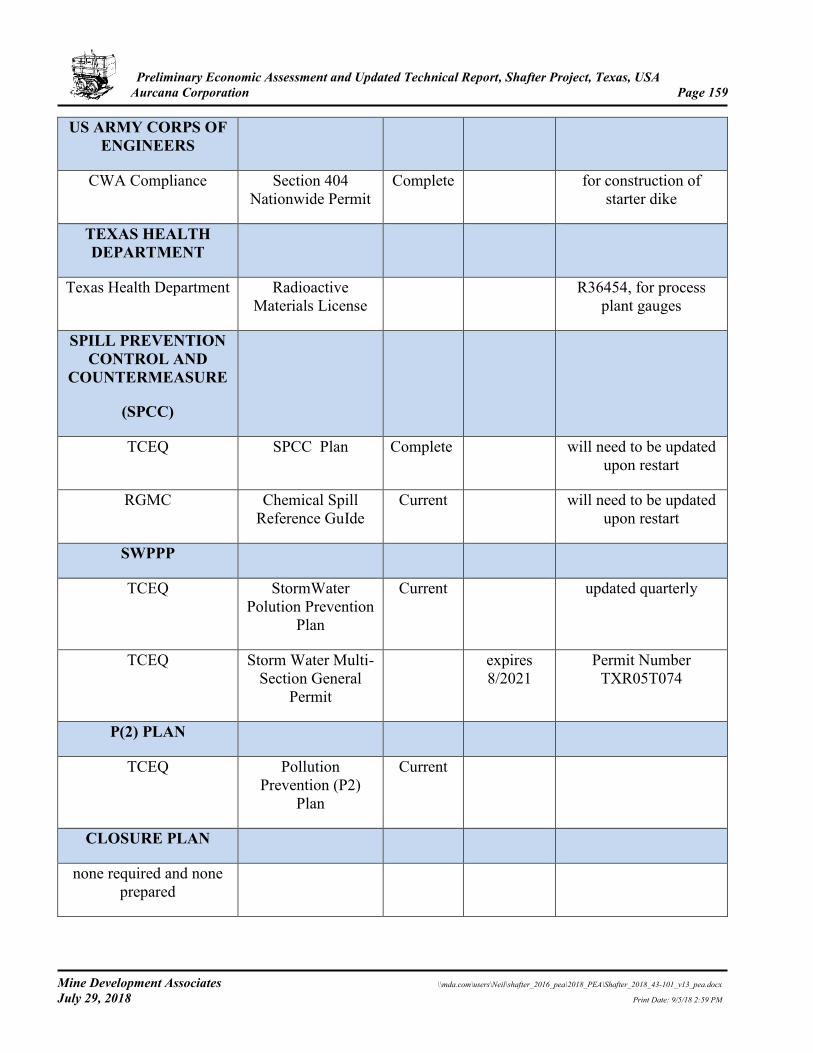
Preliminary Economic Assessment and Updated Technical Report, Shafter Project, Texas, USA Aurcana Corporation Page 159
Mine Development Associates \\mda.com\users\Neil\shafter_2016_pea\2018_PEA\Shafter_2018_43-101_v13_pea.docx July 29, 2018 Print Date: 9/5/18 2:59 PM
US ARMY CORPS OF ENGINEERS
CWA Compliance Section 404 Nationwide Permit
Complete for construction of starter dike
TEXAS HEALTH DEPARTMENT
Texas Health Department Radioactive Materials License
R36454, for process plant gauges
SPILL PREVENTION CONTROL AND
COUNTERMEASURE
(SPCC)
TCEQ SPCC Plan Complete will need to be updated upon restart
RGMC Chemical Spill Reference GuIde
Current will need to be updated upon restart
SWPPP
TCEQ StormWater Polution Prevention
Plan
Current updated quarterly
TCEQ Storm Water Multi-Section General
Permit
expires 8/2021
Permit Number TXR05T074
P(2) PLAN
TCEQ Pollution Prevention (P2)
Plan
Current
CLOSURE PLAN
none required and none prepared
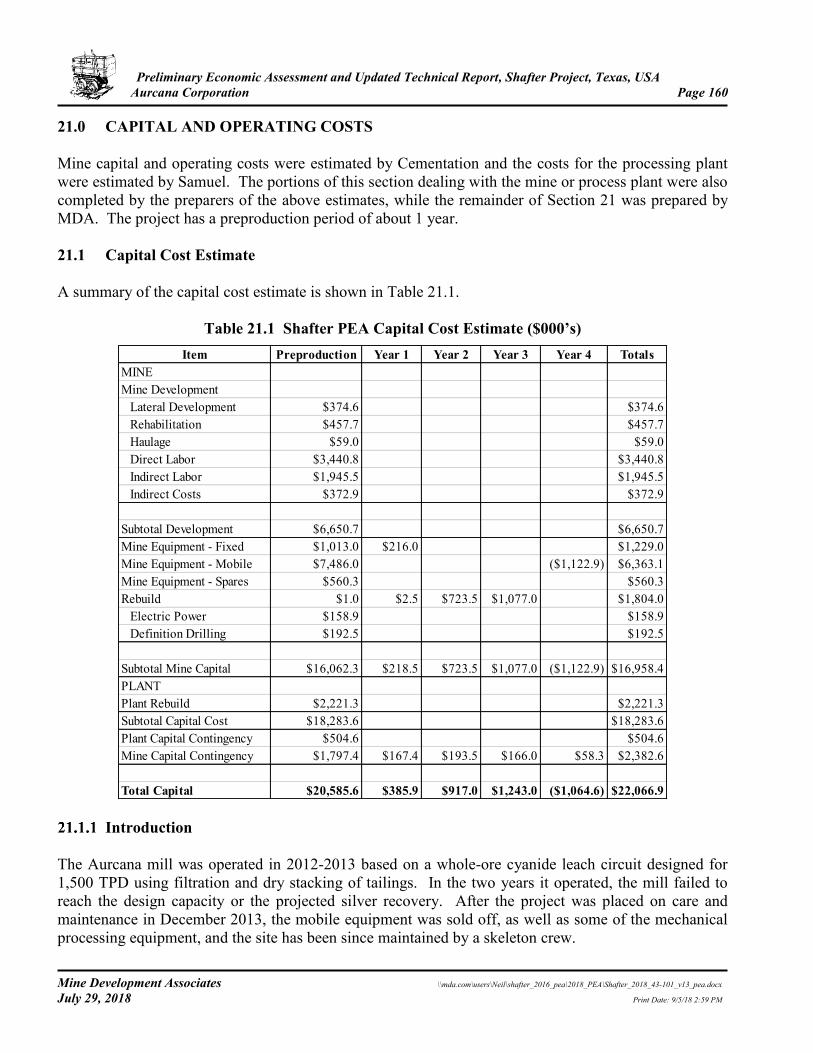
Preliminary Economic Assessment and Updated Technical Report, Shafter Project, Texas, USA Aurcana Corporation Page 160
Mine Development Associates \\mda.com\users\Neil\shafter_2016_pea\2018_PEA\Shafter_2018_43-101_v13_pea.docx July 29, 2018 Print Date: 9/5/18 2:59 PM
21.0 CAPITAL AND OPERATING COSTS Mine capital and operating costs were estimated by Cementation and the costs for the processing plant were estimated by Samuel. The portions of this section dealing with the mine or process plant were also completed by the preparers of the above estimates, while the remainder of Section 21 was prepared by MDA. The project has a preproduction period of about 1 year. 21.1 Capital Cost Estimate A summary of the capital cost estimate is shown in Table 21.1.
Table 21.1 Shafter PEA Capital Cost Estimate ($000’s) Item Preproduction Year 1 Year 2 Year 3 Year 4 Totals
MINEMine Development Lateral Development $374.6 $374.6 Rehabilitation $457.7 $457.7 Haulage $59.0 $59.0 Direct Labor $3,440.8 $3,440.8 Indirect Labor $1,945.5 $1,945.5 Indirect Costs $372.9 $372.9
Subtotal Development $6,650.7 $6,650.7Mine Equipment - Fixed $1,013.0 $216.0 $1,229.0Mine Equipment - Mobile $7,486.0 ($1,122.9) $6,363.1Mine Equipment - Spares $560.3 $560.3Rebuild $1.0 $2.5 $723.5 $1,077.0 $1,804.0 Electric Power $158.9 $158.9 Definition Drilling $192.5 $192.5
Subtotal Mine Capital $16,062.3 $218.5 $723.5 $1,077.0 ($1,122.9) $16,958.4PLANTPlant Rebuild $2,221.3 $2,221.3Subtotal Capital Cost $18,283.6 $18,283.6Plant Capital Contingency $504.6 $504.6Mine Capital Contingency $1,797.4 $167.4 $193.5 $166.0 $58.3 $2,382.6
Total Capital $20,585.6 $385.9 $917.0 $1,243.0 ($1,064.6) $22,066.9
Introduction The Aurcana mill was operated in 2012-2013 based on a whole-ore cyanide leach circuit designed for 1,500 TPD using filtration and dry stacking of tailings. In the two years it operated, the mill failed to reach the design capacity or the projected silver recovery. After the project was placed on care and maintenance in December 2013, the mobile equipment was sold off, as well as some of the mechanical processing equipment, and the site has been since maintained by a skeleton crew.
Preliminary Economic Assessment and Updated Technical Report, Shafter Project, Texas, USA Aurcana Corporation Page 161
Mine Development Associates \\mda.com\users\Neil\shafter_2016_pea\2018_PEA\Shafter_2018_43-101_v13_pea.docx July 29, 2018 Print Date: 9/5/18 2:59 PM
Since the shutdown, several problems have been identified as the main sources of operational deficiencies. These issues included a resource model that was unreliable at estimating the extent, complexity and location of mineralization, and a mill that was assembled partly from used equipment that in some cases was not fully suitable for the design parameters.
Mine Capital Cost Estimate Cementation estimated both the mine capital and operating cost for this study. This is based on owner mining for both the preproduction and production periods. The following outline summarizes the basic assumptions used to complete the cost estimate.
• Productivity Labor productivity based on historical benchmark of 30 tons/man shift; Crew size adjusted by year based on mix of development, rehabilitation of existing workings, and ore production needs; Crews will work in multiple headings beginning in Year 1 - 25% in new development and 75% in ore production; 350 days per year mine operation Years -1 to 4 with year end shutdown period 15 days every December;
• Wage Rates Wage rates based on Texas labor burdens; Standard Cementation benefit package modified to reflect Owner operation used as basis; Three crew rotation working 7 on/2 off and 7 on/5 off. Overtime factor is approx. 6%; Year -1 include subsistence, lodging and rotation travel allowances for select personnel; Years 1- 4 exclude subsistence, lodging or rotation allowances; assumed all staff will have relocated (costs carried elsewhere);
• Mobile Equipment Mining equipment quantities and models are based on equipment capacity, cycle calculations and historical experience operating in similar projects; Equipment prices are based on new vendor quotes and recent costs from equivalent projects; Owner purchased equipment; Equipment is salvaged with a value of 15% initial purchase cost at end of mining schedule Vendor commissioning is excluded;
• Other Capital Costs New unlined ventilation raise 8 ft diameter and 720 ft deep; Dewatering
· Water table projected to be encountered at approximately 900 ft; · Total required dewatering capacity based on Goldfield study is 500 gpm; · Total four dewatering skids with dual 58 hp slurry pumps in 1000 gallon tanks placed at intervals to leapfrog water inflows and process water to portal or Shafter dewater shaft line (500 gpm capacity per Goldfield FS);
Emergency egress hoist recondtioning and rope lengthening based on budgetary quote from Cementation Project Services;
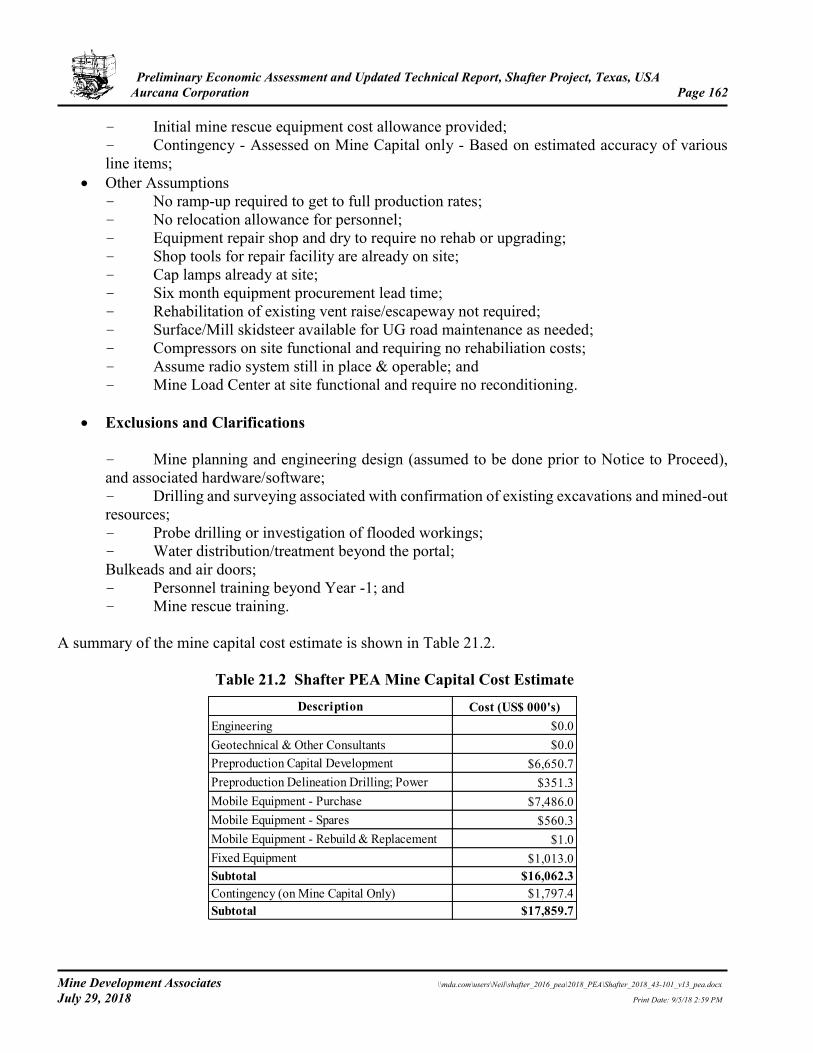
Preliminary Economic Assessment and Updated Technical Report, Shafter Project, Texas, USA Aurcana Corporation Page 162
Mine Development Associates \\mda.com\users\Neil\shafter_2016_pea\2018_PEA\Shafter_2018_43-101_v13_pea.docx July 29, 2018 Print Date: 9/5/18 2:59 PM
Initial mine rescue equipment cost allowance provided; Contingency - Assessed on Mine Capital only - Based on estimated accuracy of various line items;
• Other Assumptions No ramp-up required to get to full production rates; No relocation allowance for personnel; Equipment repair shop and dry to require no rehab or upgrading; Shop tools for repair facility are already on site; Cap lamps already at site; Six month equipment procurement lead time; Rehabilitation of existing vent raise/escapeway not required; Surface/Mill skidsteer available for UG road maintenance as needed; Compressors on site functional and requiring no rehabiliation costs; Assume radio system still in place & operable; and Mine Load Center at site functional and require no reconditioning.
• Exclusions and Clarifications
Mine planning and engineering design (assumed to be done prior to Notice to Proceed), and associated hardware/software; Drilling and surveying associated with confirmation of existing excavations and mined-out resources; Probe drilling or investigation of flooded workings; Water distribution/treatment beyond the portal; Bulkeads and air doors; Personnel training beyond Year -1; and Mine rescue training.
A summary of the mine capital cost estimate is shown in Table 21.2.
Table 21.2 Shafter PEA Mine Capital Cost Estimate Description Cost (US$ 000's)
Engineering $0.0Geotechnical & Other Consultants $0.0Preproduction Capital Development $6,650.7Preproduction Delineation Drilling; Power $351.3Mobile Equipment - Purchase $7,486.0Mobile Equipment - Spares $560.3Mobile Equipment - Rebuild & Replacement $1.0Fixed Equipment $1,013.0Subtotal $16,062.3Contingency (on Mine Capital Only) $1,797.4Subtotal $17,859.7
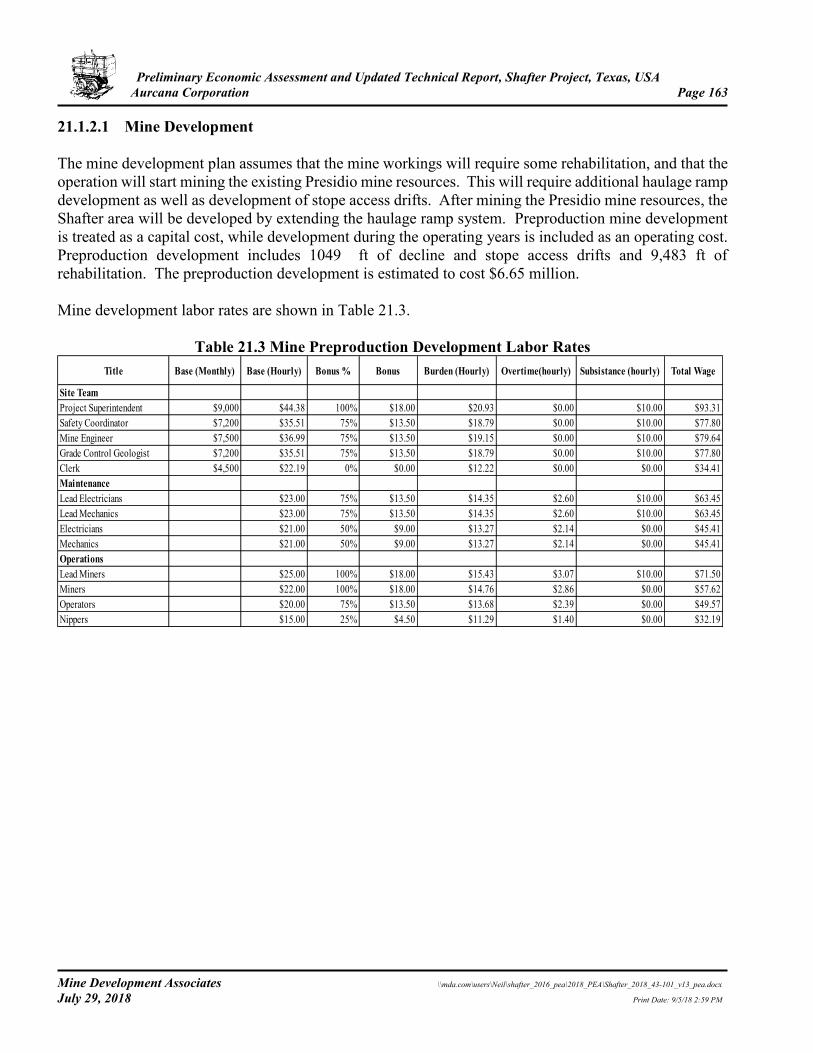
Preliminary Economic Assessment and Updated Technical Report, Shafter Project, Texas, USA Aurcana Corporation Page 163
Mine Development Associates \\mda.com\users\Neil\shafter_2016_pea\2018_PEA\Shafter_2018_43-101_v13_pea.docx July 29, 2018 Print Date: 9/5/18 2:59 PM
21.1.2.1 Mine Development The mine development plan assumes that the mine workings will require some rehabilitation, and that the operation will start mining the existing Presidio mine resources. This will require additional haulage ramp development as well as development of stope access drifts. After mining the Presidio mine resources, the Shafter area will be developed by extending the haulage ramp system. Preproduction mine development is treated as a capital cost, while development during the operating years is included as an operating cost. Preproduction development includes 1049 ft of decline and stope access drifts and 9,483 ft of rehabilitation. The preproduction development is estimated to cost $6.65 million. Mine development labor rates are shown in Table 21.3.
Table 21.3 Mine Preproduction Development Labor Rates Title Base (Monthly) Base (Hourly) Bonus % Bonus Burden (Hourly) Overtime(hourly) Subsistance (hourly) Total Wage
Site TeamProject Superintendent $9,000 $44.38 100% $18.00 $20.93 $0.00 $10.00 $93.31Safety Coordinator $7,200 $35.51 75% $13.50 $18.79 $0.00 $10.00 $77.80Mine Engineer $7,500 $36.99 75% $13.50 $19.15 $0.00 $10.00 $79.64Grade Control Geologist $7,200 $35.51 75% $13.50 $18.79 $0.00 $10.00 $77.80Clerk $4,500 $22.19 0% $0.00 $12.22 $0.00 $0.00 $34.41MaintenanceLead Electricians $23.00 75% $13.50 $14.35 $2.60 $10.00 $63.45Lead Mechanics $23.00 75% $13.50 $14.35 $2.60 $10.00 $63.45Electricians $21.00 50% $9.00 $13.27 $2.14 $0.00 $45.41Mechanics $21.00 50% $9.00 $13.27 $2.14 $0.00 $45.41OperationsLead Miners $25.00 100% $18.00 $15.43 $3.07 $10.00 $71.50Miners $22.00 100% $18.00 $14.76 $2.86 $0.00 $57.62Operators $20.00 75% $13.50 $13.68 $2.39 $0.00 $49.57Nippers $15.00 25% $4.50 $11.29 $1.40 $0.00 $32.19
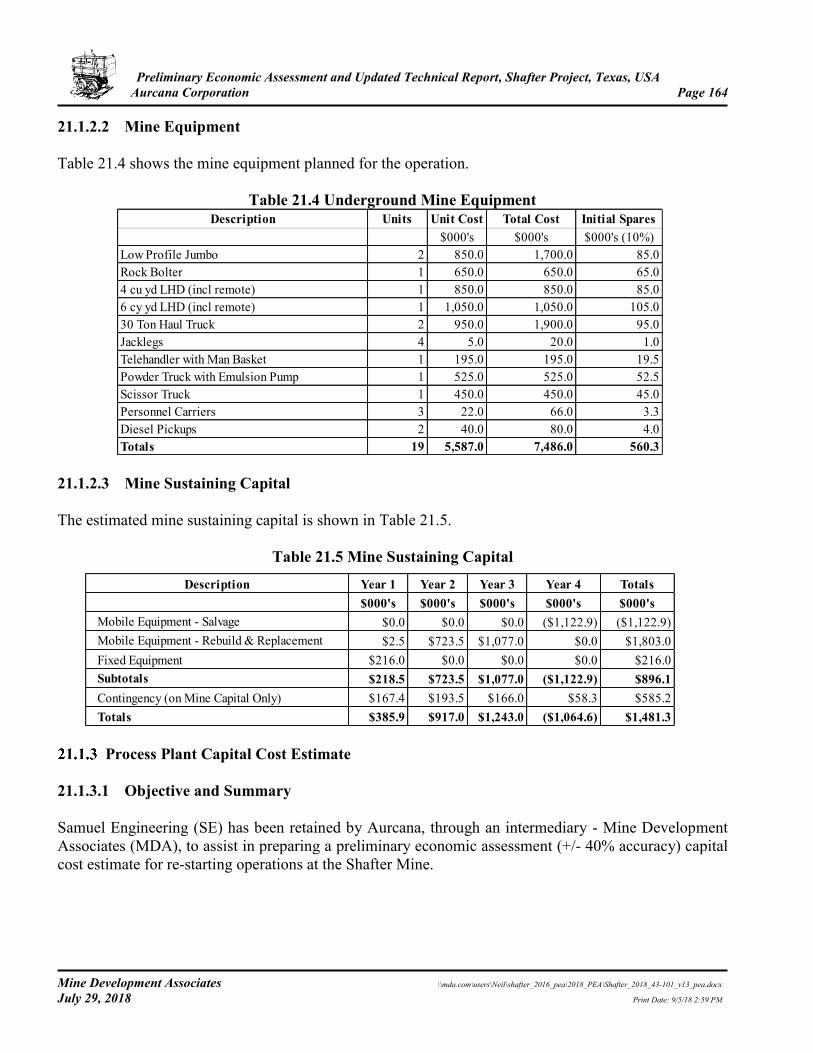
Preliminary Economic Assessment and Updated Technical Report, Shafter Project, Texas, USA Aurcana Corporation Page 164
Mine Development Associates \\mda.com\users\Neil\shafter_2016_pea\2018_PEA\Shafter_2018_43-101_v13_pea.docx July 29, 2018 Print Date: 9/5/18 2:59 PM
21.1.2.2 Mine Equipment Table 21.4 shows the mine equipment planned for the operation.
Table 21.4 Underground Mine Equipment
Description Units Unit Cost Total Cost Initial Spares$000's $000's $000's (10%)
Low Profile Jumbo 2 850.0 1,700.0 85.0Rock Bolter 1 650.0 650.0 65.04 cu yd LHD (incl remote) 1 850.0 850.0 85.06 cy yd LHD (incl remote) 1 1,050.0 1,050.0 105.030 Ton Haul Truck 2 950.0 1,900.0 95.0Jacklegs 4 5.0 20.0 1.0Telehandler with Man Basket 1 195.0 195.0 19.5Powder Truck with Emulsion Pump 1 525.0 525.0 52.5Scissor Truck 1 450.0 450.0 45.0Personnel Carriers 3 22.0 66.0 3.3Diesel Pickups 2 40.0 80.0 4.0Totals 19 5,587.0 7,486.0 560.3
21.1.2.3 Mine Sustaining Capital The estimated mine sustaining capital is shown in Table 21.5.
Table 21.5 Mine Sustaining Capital
Description Year 1 Year 2 Year 3 Year 4 Totals$000's $000's $000's $000's $000's
Mobile Equipment - Salvage $0.0 $0.0 $0.0 ($1,122.9) ($1,122.9)Mobile Equipment - Rebuild & Replacement $2.5 $723.5 $1,077.0 $0.0 $1,803.0Fixed Equipment $216.0 $0.0 $0.0 $0.0 $216.0Subtotals $218.5 $723.5 $1,077.0 ($1,122.9) $896.1Contingency (on Mine Capital Only) $167.4 $193.5 $166.0 $58.3 $585.2Totals $385.9 $917.0 $1,243.0 ($1,064.6) $1,481.3
Process Plant Capital Cost Estimate
21.1.3.1 Objective and Summary Samuel Engineering (SE) has been retained by Aurcana, through an intermediary - Mine Development Associates (MDA), to assist in preparing a preliminary economic assessment (+/- 40% accuracy) capital cost estimate for re-starting operations at the Shafter Mine.
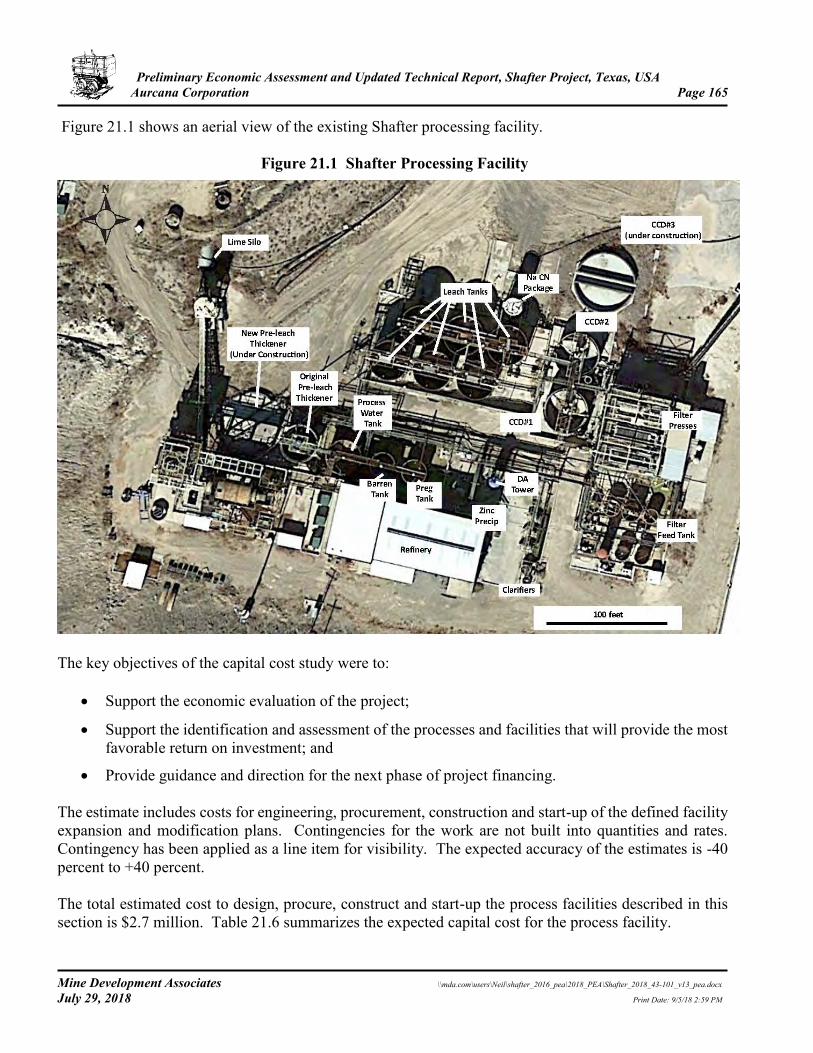
Preliminary Economic Assessment and Updated Technical Report, Shafter Project, Texas, USA Aurcana Corporation Page 165
Mine Development Associates \\mda.com\users\Neil\shafter_2016_pea\2018_PEA\Shafter_2018_43-101_v13_pea.docx July 29, 2018 Print Date: 9/5/18 2:59 PM
Figure 21.1 shows an aerial view of the existing Shafter processing facility.
Figure 21.1 Shafter Processing Facility
The key objectives of the capital cost study were to:
• Support the economic evaluation of the project;
• Support the identification and assessment of the processes and facilities that will provide the most favorable return on investment; and
• Provide guidance and direction for the next phase of project financing. The estimate includes costs for engineering, procurement, construction and start-up of the defined facility expansion and modification plans. Contingencies for the work are not built into quantities and rates. Contingency has been applied as a line item for visibility. The expected accuracy of the estimates is -40 percent to +40 percent. The total estimated cost to design, procure, construct and start-up the process facilities described in this section is $2.7 million. Table 21.6 summarizes the expected capital cost for the process facility.
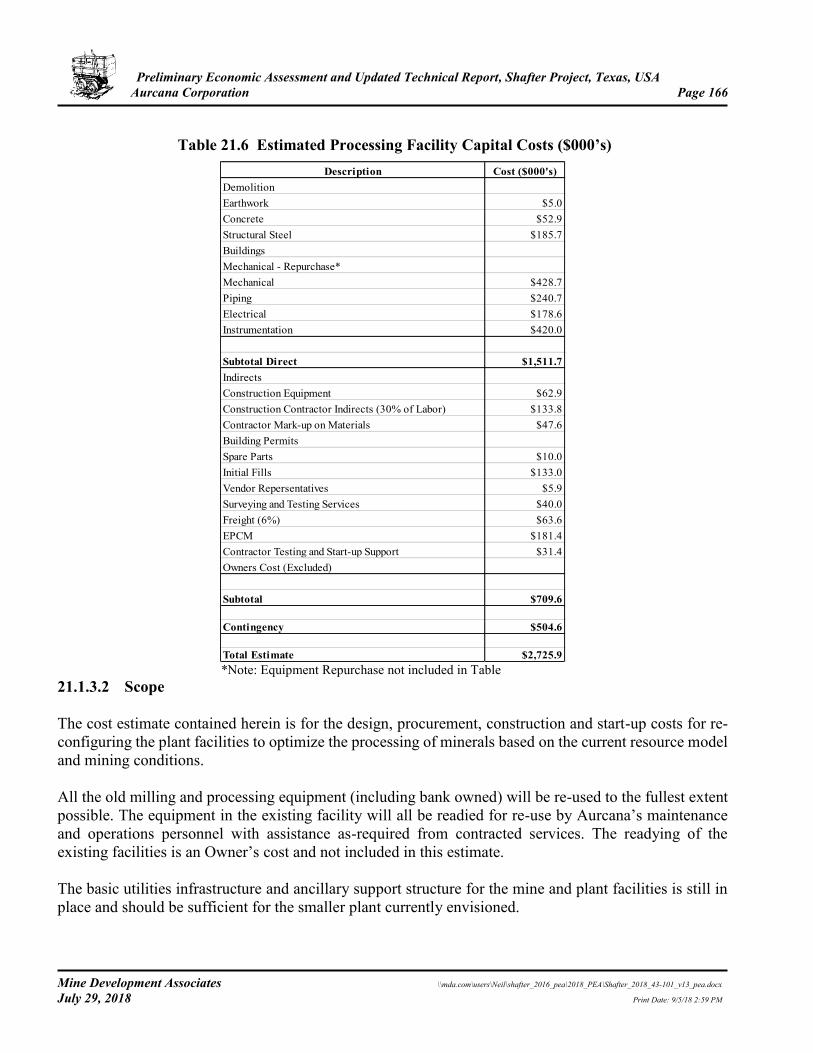
Preliminary Economic Assessment and Updated Technical Report, Shafter Project, Texas, USA Aurcana Corporation Page 166
Mine Development Associates \\mda.com\users\Neil\shafter_2016_pea\2018_PEA\Shafter_2018_43-101_v13_pea.docx July 29, 2018 Print Date: 9/5/18 2:59 PM
Table 21.6 Estimated Processing Facility Capital Costs ($000’s)
Description Cost ($000's)DemolitionEarthwork $5.0Concrete $52.9Structural Steel $185.7BuildingsMechanical - Repurchase*Mechanical $428.7Piping $240.7Electrical $178.6Instrumentation $420.0
Subtotal Direct $1,511.7IndirectsConstruction Equipment $62.9Construction Contractor Indirects (30% of Labor) $133.8Contractor Mark-up on Materials $47.6Building PermitsSpare Parts $10.0Initial Fills $133.0Vendor Repersentatives $5.9Surveying and Testing Services $40.0Freight (6%) $63.6EPCM $181.4Contractor Testing and Start-up Support $31.4Owners Cost (Excluded)
Subtotal $709.6
Contingency $504.6
Total Estimate $2,725.9 *Note: Equipment Repurchase not included in Table 21.1.3.2 Scope The cost estimate contained herein is for the design, procurement, construction and start-up costs for re-configuring the plant facilities to optimize the processing of minerals based on the current resource model and mining conditions. All the old milling and processing equipment (including bank owned) will be re-used to the fullest extent possible. The equipment in the existing facility will all be readied for re-use by Aurcana’s maintenance and operations personnel with assistance as-required from contracted services. The readying of the existing facilities is an Owner’s cost and not included in this estimate. The basic utilities infrastructure and ancillary support structure for the mine and plant facilities is still in place and should be sufficient for the smaller plant currently envisioned.
Preliminary Economic Assessment and Updated Technical Report, Shafter Project, Texas, USA Aurcana Corporation Page 167
Mine Development Associates \\mda.com\users\Neil\shafter_2016_pea\2018_PEA\Shafter_2018_43-101_v13_pea.docx July 29, 2018 Print Date: 9/5/18 2:59 PM
Water is obtained from the mine and wells (some of which is also apportioned to residents of Shafter) which are already in-place from the previous operation. American Electric Power (“AEP”) generates and transmits electricity in the region. The site is served by a 69 kV power line connected to an existing on-site substation. The existing on-site ancillary buildings which will support the mine and processing facilities including the Administration Building, Maintenance Shop, Warehousing and Assay Laboratory are all in useable condition and no new major structures should be needed. Cement will be used to prepare a paste backfill for the underground mine. The cost of the pug mill agglomerator is included with the mine capital; and it is assumed that the cement provider will supply, set-up and maintain an on-site storage silo, the cost of which will be include in the unit rate charged for cement. RGM currently owns and operates a front-end loader at the facility which is assumed will continue to serve the future operations with the following duties: feeding the crusher and grooming the crusher stockpile as needed. Items that are not be included in the capital estimates are as follows: • Sunk costs. • Costs to recoup bank owned equipment. (note: an arrangement to repurchase the bank owned
equipment has been agreed to in principal is expected to be finalized in the next 90 days and will require stockholder approval. This is treated as a sunk cost for this study. Should this arrangement fail to materialize in the short-term, additional capital cost may be required.)
• Demolition and disposal of existing facilities. • Removal of any existing equipment that is not required for the new operations. • Cleaning, lubricating, aligning, calibrating, testing or refurbishing of existing equipment. • Mobil equipment. • Allowance for special incentives (schedule, safety, etc.) • Force majeure occurrences, such as risk due to government policy changes, labor disputes, permitting
delays, etc. • Owner’s cost (pre-operations labor, refurbishment of existing facilities, project management,
insurances, corporate expenses, financial services, legal fees, etc.) • Risk analysis / Owner’s Reserve Funds • Interest and/or financing cost • Operating costs
21.1.3.3 Currency The estimate is expressed in second-quarter 2018 United States dollars. No provision has been included to offset future escalation.
Preliminary Economic Assessment and Updated Technical Report, Shafter Project, Texas, USA Aurcana Corporation Page 168
Mine Development Associates \\mda.com\users\Neil\shafter_2016_pea\2018_PEA\Shafter_2018_43-101_v13_pea.docx July 29, 2018 Print Date: 9/5/18 2:59 PM
21.1.3.4 Estimating Methodology The estimate is built up by prime commodity accounts, which include earthwork, concrete, structural steel, mechanical, piping, electrical and instrumentation. The following information was used in the development of this estimate:
• Shafter Fixed Asset Register (provided by Aurcana); • Budgetary Equipment Quotes; • Sketches for MTOs; and • Historical project costs and data.
Costs are based on the assumption that new equipment and materials will be purchased on a competitive basis, and installation contracts will be awarded in well-defined packages. Manufacturer’s standard warranties on equipment are assumed to be satisfactory. The man-hours associated with materials and equipment is intended to cover all required operations for the installation of individual components. This would include unloading from trucks, storing in storage yard or warehouse, unpacking, hauling to erection site, rigging, lifting, setting, welding, aligning, calibrating and checking out of all items included with the supply. 21.1.3.5 Site Civil Work All new work is within the confines of the existing facility and no new rough grading or additional security fencing will be required. Final grading and gravel surfacing around disturbed areas will be required and allowances for that have been made in the CCD thickening area where new containment structures will be built around the thickener foundations. It is assumed that there will be no buried utility interferences and no allowance is made in the estimate for any buried utility relocations. Additionally, no allowances have been made for encountering hazardous waste or other buried items. If the remaining mill feed in the existing stockpile needs to be removed (and later put back) in order to install the new reclaim belt feeders, it is assumed that RMGC personnel will perform this task with labor and machinery in the Owner’s care and maintenance budget. 21.1.3.6 Concrete and Foundations Most of the processing equipment will be re-used in-place at their current locations and therefore will not require any additional concrete. However, there will be some new equipment required for which foundations will be needed. While existing foundations will be used wherever possible, there will be some instances where they may need to be demolished and replaced. The CCD thickener area will require the most new concrete. Two thickeners are existing and the foundation for a third was in the process of being installed. The third foundation will require finishing and a fourth thickener foundation will be needed. There is an existing vacant pre-leach thickener

Preliminary Economic Assessment and Updated Technical Report, Shafter Project, Texas, USA Aurcana Corporation Page 169
Mine Development Associates \\mda.com\users\Neil\shafter_2016_pea\2018_PEA\Shafter_2018_43-101_v13_pea.docx July 29, 2018 Print Date: 9/5/18 2:59 PM
foundation built to accommodate a larger pre-leach thickener (which is no longer required). It is the same size as the CCD thickeners and it is hoped that this foundation can be used for the fourth thickener. In addition, there will need to be containment added for both new thickeners as they will hold cyanide. The new lime slaking system will require foundations and the existing cyanide system will be modified, which may need some foundations reconfigured as well.
An average total installed cost for concrete of $1,080/cy has been used. The price includes both labor and materials for structural excavation and backfill, formwork, rebar, embeds, anchor bolts, and additives. 21.1.3.7 Structural Steel Structural steel quantities have been allowed based on estimator judgement. Steel has been included for framing the new reclaim feeders, modifying the leach tanks to allow cascading between tanks and pipe racks in the CCD thickening area. A unit material cost of $3,800 per ton has been used as an average for all structural steel framing, stairs, handrail, grating, etc. This unit rate includes detailing, fabrication and prime coat painting and is based on recent in-house pricing. 21.1.3.8 Buildings There are no new buildings planned for the Shafter project. The existing buildings are anticipated to be sufficient to meet the needs of the new operations. Additionally, the buildings are not thought to require any modifications; they can be re-used as-is. The existing on-site ancillary buildings which will support the mine and processing facilities include:
• Administration Building, 10,560 ft2; • Maintenance Shop, 6,000 ft2; • Dry Warehousing, 12,000 ft2 and; • Assay Laboratory, 6,000 ft2.
21.1.3.9 Mechanical All the old milling and processing equipment will be re-used to the fullest extent possible. However, when the Shafter project ceased operations in 2013, some of the mechanical processing equipment was sold back to the bank (Orion) for $3.5 million. Fortunately, the bank never removed any of the equipment from site and it currently remains in-place on their foundations. All of the equipment that was sold to Orion is still available for re-purchase. Aurcana reports that an agreement with Orion has been made, using Aurcana stock with a $0.5 million down payment to repurchase the bank owned equipment, however stockholder approval is required for the agreement to be completed. Aurcana believes that the repurchase of process equipment will be approved by it’s shareholders. For the purposes of the estimate, SE has assumed that the equipment can be re-purchased in this transaction, and is not included in the economic evaluation of the project. Although not all of the Orion owned equipment will be re-used, it is assumed that all will be re-purchased. This estimate does not include any costs for removing superfluous equipment. Equipment items that will be re-purchased
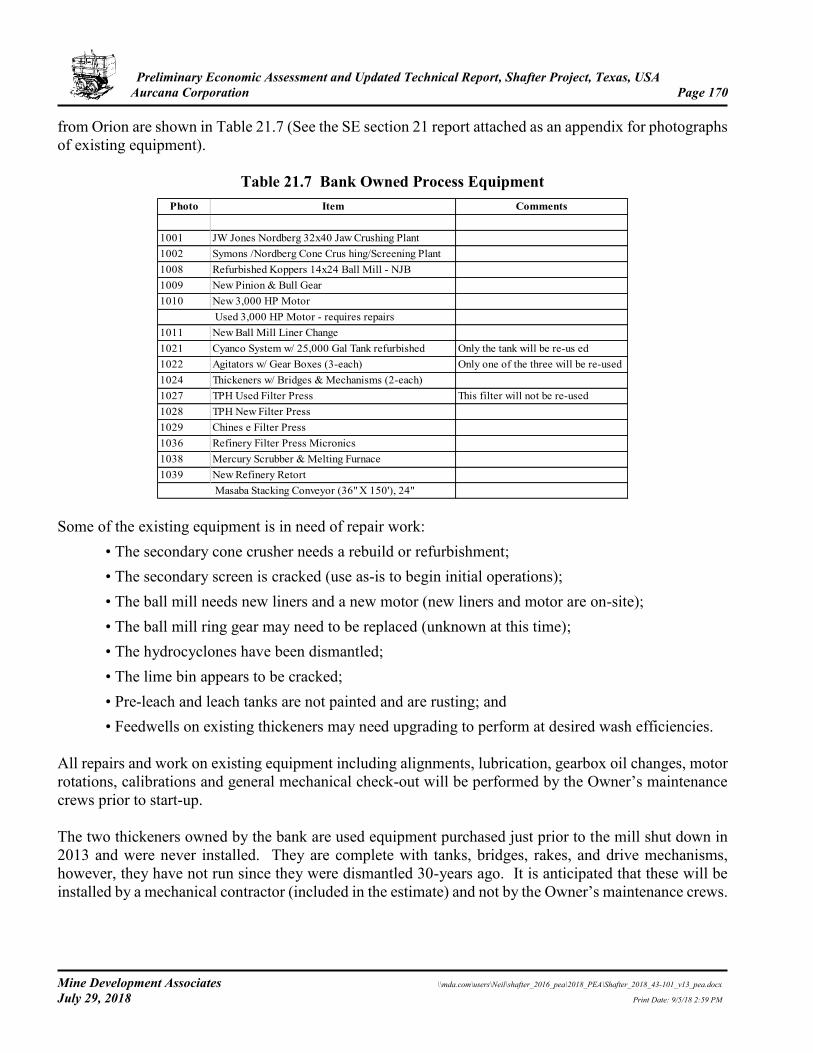
Preliminary Economic Assessment and Updated Technical Report, Shafter Project, Texas, USA Aurcana Corporation Page 170
Mine Development Associates \\mda.com\users\Neil\shafter_2016_pea\2018_PEA\Shafter_2018_43-101_v13_pea.docx July 29, 2018 Print Date: 9/5/18 2:59 PM
from Orion are shown in Table 21.7 (See the SE section 21 report attached as an appendix for photographs of existing equipment).
Table 21.7 Bank Owned Process Equipment Photo Item Comments
1001 JW Jones Nordberg 32x40 Jaw Crushing Plant1002 Symons /Nordberg Cone Crus hing/Screening Plant1008 Refurbished Koppers 14x24 Ball Mill - NJB1009 New Pinion & Bull Gear1010 New 3,000 HP Motor
1011 New Ball Mill Liner Change1021 Cyanco System w/ 25,000 Gal Tank refurbished Only the tank will be re-us ed1022 Agitators w/ Gear Boxes (3-each) Only one of the three will be re-used1024 Thickeners w/ Bridges & Mechanisms (2-each)1027 TPH Used Filter Press This filter will not be re-used1028 TPH New Filter Press1029 Chines e Filter Press1036 Refinery Filter Press Micronics1038 Mercury Scrubber & Melting Furnace1039 New Refinery Retort
Used 3,000 HP Motor - requires repairs
Masaba Stacking Conveyor (36" X 150'), 24"
Some of the existing equipment is in need of repair work: • The secondary cone crusher needs a rebuild or refurbishment; • The secondary screen is cracked (use as-is to begin initial operations); • The ball mill needs new liners and a new motor (new liners and motor are on-site); • The ball mill ring gear may need to be replaced (unknown at this time); • The hydrocyclones have been dismantled; • The lime bin appears to be cracked; • Pre-leach and leach tanks are not painted and are rusting; and • Feedwells on existing thickeners may need upgrading to perform at desired wash efficiencies.
All repairs and work on existing equipment including alignments, lubrication, gearbox oil changes, motor rotations, calibrations and general mechanical check-out will be performed by the Owner’s maintenance crews prior to start-up. The two thickeners owned by the bank are used equipment purchased just prior to the mill shut down in 2013 and were never installed. They are complete with tanks, bridges, rakes, and drive mechanisms, however, they have not run since they were dismantled 30-years ago. It is anticipated that these will be installed by a mechanical contractor (included in the estimate) and not by the Owner’s maintenance crews.
Preliminary Economic Assessment and Updated Technical Report, Shafter Project, Texas, USA Aurcana Corporation Page 171
Mine Development Associates \\mda.com\users\Neil\shafter_2016_pea\2018_PEA\Shafter_2018_43-101_v13_pea.docx July 29, 2018 Print Date: 9/5/18 2:59 PM
The following major equipment will be purchased new: • Reclaim Belt Feeders (existing pan feeders have already been removed from tunnel); • Cyanide Addition System with a bag breaker, mix tank, enclosure, metering pump, etc.; and • Lime Slaking Plant (including storage silo, hydrator, slurry tank, controls and accessories)
Pricing for the new equipment was obtained from a published cost database. No specifications were prepared for the equipment. It is assumed that vendor’s standard designs, painting systems and warranties for equipment are acceptable. Prices include vendor engineering, documentation and tagging. No freight costs are included with the equipment. Quotes are FOB factory, and freight has been allocated separately in the indirect section of the estimate. All new mechanical equipment is assumed to be procured by either the Engineer or the Owner and provided “free issue” to the construction contractor for installation, thereby avoiding any third party markup. The Construction Contractor(s) will be responsible for receiving, unloading, storing, unpacking and installing the equipment. Mechanical equipment installation man-hours cover all required operations for the installation of new equipment. This would include unloading from trucks, storing in storage yard or warehouse, unpacking, hauling to erection site, rigging, lifting, setting, anchoring, grouting, aligning, calibrating and checking out of all items included with the equipment supply. 21.1.3.10 Piping It is anticipated that the majority of the existing piping is still good and can continue to be used as-is. Some new plant piping will be needed (including pipe, flanges, fittings, connections and valves) in areas where new equipment will be deployed. In addition, pipe work will need to be performed to add new valves, meters and instrumentation. No material quantity take-offs have been performed at this stage for piping. The pipe cost are intended to include:
• Re-configure piping at leach tanks as required; • Piping for the two new CCD thickeners; • Reagents piping for the new cyanide system and lime slaking system; and • Hydrostatic testing for new pipe (Owner will perform hydro-testing on existing piping).
21.1.3.11 Electrical Since the new plant will be operating at a lower throughput than the previous period of commercial operation, the new installed electrical loads planned for the re-start of the facilities should be well within the capacity of the existing substation and grid power supply.
Preliminary Economic Assessment and Updated Technical Report, Shafter Project, Texas, USA Aurcana Corporation Page 172
Mine Development Associates \\mda.com\users\Neil\shafter_2016_pea\2018_PEA\Shafter_2018_43-101_v13_pea.docx July 29, 2018 Print Date: 9/5/18 2:59 PM
No material take-offs have been generated or equipment pricing obtained for electrical components necessary to power the new equipment/facilities downstream of the substation. It has been assumed that existing power distribution centers (“PDC”s) and motor control centers (“MCC”s) are in good working order and remain connected to the various equipment motors. Some motor starters may need to be replaced where equipment was downsized.
A new MCC has been allowed for the CCD thickener circuit as there may not be enough motor starter buckets in the existing MCC to accommodate the new pumps and thickener mechanisms. The existing MCC rooms are assumed to have adequate space for the new MCC line-up. Allowances have been made for electrical bulk materials and their installation, including raceway, wire, grounding and terminations for the new equipment. New construction is within an existing facility where it is assumed that no additional site lighting is necessary except possibly in the CCD thickener area. 21.1.3.12 Instrumentation and Controls The original plant did not have an abundance of instrumentation and automation. There was enough instrumentation that the operators could determine what was happening within the process, but the opening and shutting of valves and turning pumps on and off (aside from sump type operations) would be manual and left to the operators. An increased level of automation is planned for the basic control of the process in the new operation. This would include automation for items such as lime addition metering for pH control, density control in the grinding circuit, mass flow, etc. Flowmeters would be installed on at least all lines going in and out of the major equipment (leach circuits and CCD circuits can be looked at a single units), level indicators in tanks and thickeners, pH meters at the front and end of the leach circuits and the Merrill Crowe system. And a metal detector ahead of the secondary cone crusher is also planned (included with mechanical equipment). New instruments will be installed and calibrated by the installation contractor. However, the existing plant instrumentation will be calibrated and tested by the Owner’s maintenance and operations personnel prior to start-up and these costs are not included in the capital cost (Owner’s costs are excluded). The existing facility’s PLC system will be updated to include any new process equipment. It is assumed that the original station PLC was designed with sufficient I/O capacity to accommodate the new equipment. No material take-offs have been generated or equipment pricing obtained for instrumentation. The cost included is intended to cover instruments, instrument wiring bulk materials (wire, conduit, etc.) and installation.
Preliminary Economic Assessment and Updated Technical Report, Shafter Project, Texas, USA Aurcana Corporation Page 173
Mine Development Associates \\mda.com\users\Neil\shafter_2016_pea\2018_PEA\Shafter_2018_43-101_v13_pea.docx July 29, 2018 Print Date: 9/5/18 2:59 PM
21.1.3.13 Labor Rates and Productivity An average labor rate of $73 per hour has been used, which is intended to include basic wage, fringe benefits, compensation insurance, salary burdens including unemployment, social security, FICA, etc. The wages assume an open-shop workforce. Labor does not include contractor field indirect costs such as mobilization, demobilization, temporary facilities, temporary utilities, surveying or on-site administration. These items are included with the construction indirect cost. 21.1.3.14 Common Distributable and Contracted Indirect Costs Common distributable and contracted indirect costs apply to multiple parties (suppliers, contractors, service providers, etc.) across multiple areas of the project. These costs are typically calculated using percentages based on historical data of similar type projects. Percentages based on historical data of similar projects are applied to develop pricing for the following: Contractor’s indirect costs for the process facilities will be included at an overall rate of 30 percent of the direct field labor cost. Items included with contractor’s indirect costs include:
• Contractor’s mobilization and demobilization; • Supervision, safety and administrative support costs; • Temporary construction facilities (offices, fencing around work areas, etc.); • Warehousing and lay down area cost; • Temporary toilets; • Construction vehicles, fuel, and maintenance; • Construction power/utilities hook-up; • Cleanup and waste removal; • Bonds and insurances; • Temporary communications; • Construction surveying; and • Contractors’ overhead and profit.
It is assumed that construction power and water will be provided to the contractors by Aurcana free of charge. Contractors will be responsible for any temporary utility tie-ins and distribution to work areas. A mark-up of 12% has been applied to material cost expected to be provided by the contractor to cover their overhead and profit on the purchases.
Preliminary Economic Assessment and Updated Technical Report, Shafter Project, Texas, USA Aurcana Corporation Page 174
Mine Development Associates \\mda.com\users\Neil\shafter_2016_pea\2018_PEA\Shafter_2018_43-101_v13_pea.docx July 29, 2018 Print Date: 9/5/18 2:59 PM
21.1.3.15 Construction Equipment The construction equipment account is intended to cover the cost of lifting cranes, forklifts, man-lifts, flat-bed trucks, gensets, scissor lifts, dewatering pumps, light plants, scaffolding, etc. Construction equipment costs are added based on direct construction man-hours. This will cover equipment rental (both contractor owned and rented) plus fuel and maintenance. 21.1.3.16 Building Permits Building permits for the project are not required 21.1.3.17 Spare Parts Spare parts required for start-up and commissioning as well as critical spares are included in the estimate for the new equipment. The typical cost is in the range of 4% to 6% of mechanical equipment, however, it is assumed that there is still an inventory of spare parts available from the previous operations and for this estimate has been lowered to 3%. 21.1.3.18 Initial Fills Initial Fills (aka First Fill) includes grinding media for the mills and reagents. Reagents and grinding media have been quantified and priced for inclusion in the estimate based on the storage tank volumes or thirty days use. Pricing is based on recent in house data.
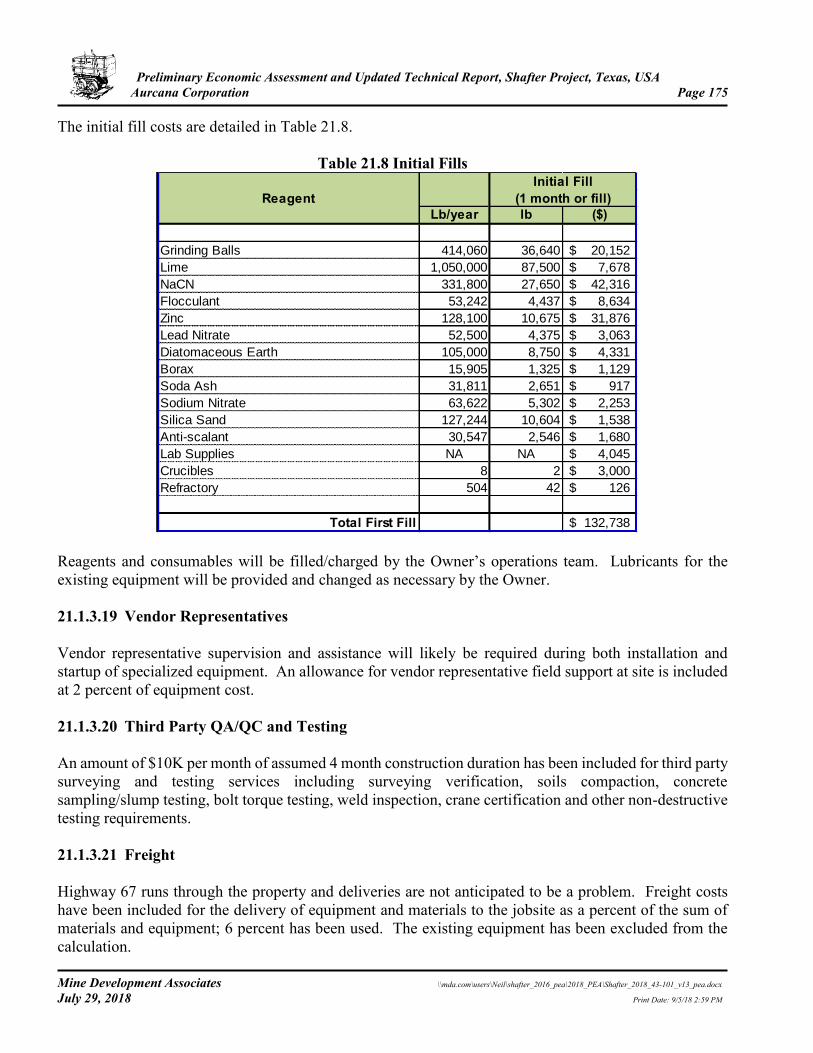
Preliminary Economic Assessment and Updated Technical Report, Shafter Project, Texas, USA Aurcana Corporation Page 175
Mine Development Associates \\mda.com\users\Neil\shafter_2016_pea\2018_PEA\Shafter_2018_43-101_v13_pea.docx July 29, 2018 Print Date: 9/5/18 2:59 PM
The initial fill costs are detailed in Table 21.8.
Table 21.8 Initial Fills
Reagents and consumables will be filled/charged by the Owner’s operations team. Lubricants for the existing equipment will be provided and changed as necessary by the Owner. 21.1.3.19 Vendor Representatives Vendor representative supervision and assistance will likely be required during both installation and startup of specialized equipment. An allowance for vendor representative field support at site is included at 2 percent of equipment cost. 21.1.3.20 Third Party QA/QC and Testing An amount of $10K per month of assumed 4 month construction duration has been included for third party surveying and testing services including surveying verification, soils compaction, concrete sampling/slump testing, bolt torque testing, weld inspection, crane certification and other non-destructive testing requirements. 21.1.3.21 Freight Highway 67 runs through the property and deliveries are not anticipated to be a problem. Freight costs have been included for the delivery of equipment and materials to the jobsite as a percent of the sum of materials and equipment; 6 percent has been used. The existing equipment has been excluded from the calculation.
Lb/year lb ($)
Grinding Balls 414,060 36,640 20,152$
Lime 1,050,000 87,500 7,678$
NaCN 331,800 27,650 42,316$
Flocculant 53,242 4,437 8,634$
Zinc 128,100 10,675 31,876$
Lead Nitrate 52,500 4,375 3,063$
Diatomaceous Earth 105,000 8,750 4,331$
Borax 15,905 1,325 1,129$
Soda Ash 31,811 2,651 917$
Sodium Nitrate 63,622 5,302 2,253$
Silica Sand 127,244 10,604 1,538$
Anti-scalant 30,547 2,546 1,680$
Lab Supplies NA NA 4,045$
Crucibles 8 2 3,000$
Refractory 504 42 126$
Total First Fill 132,738$
ReagentInitial Fill
(1 month or fill)
Preliminary Economic Assessment and Updated Technical Report, Shafter Project, Texas, USA Aurcana Corporation Page 176
Mine Development Associates \\mda.com\users\Neil\shafter_2016_pea\2018_PEA\Shafter_2018_43-101_v13_pea.docx July 29, 2018 Print Date: 9/5/18 2:59 PM
21.1.3.22 EP & CM Services EPCM services for the detailed design, procurement and construction management of the environmental facilities has been included at 12 percent of the cost for which the service provider will be responsible. 21.1.3.23 Contractors Pre-Operational Testing and Start-up Support Startup support services encompassing pre-operations testing will be included at 3 percent of the installation labor plus EPCM services. It is assumed that the Owner’s on-site operations staff will actually perform the start-up and commissioning of the plant; this account is for pre-operations checkout and support by construction craft labor and supervision.
21.1.3.24 Owners Cost It is assumed that the environmental permitting for original facilities is still valid and remains in-place. Any ongoing environmental requirements to maintain and re-start operations will be borne by the Owner. Project management and oversight will be required by Aurcana for the duration of construction; this and other corporate service charges, including time, travel, accounting and other expenses incurred on behalf of the project are included in the G&A cost. Aurcana has included costs for repair, alignment, lubrication, check-out, calibration and start-up of all existing equipment. This cost is included elsewhere in the Owner’s Cost. 21.1.3.25 Taxes Contractors who supply construction materials will pay sales tax to their suppliers and include that price in the charges they pass on to the Owner. While not listed as separate line items on invoices; that tax amount will be built into the rates they charge. For the purposes of the capital cost estimate, sales tax has been included at 6.75 percent against the cost of contractor supplied (purchased) materials. The rate consists of 6.25 percent Texas State Tax plus 0.5 percent Special Tax. There is no applicable county tax. It is assumed that Presidio City Tax (1.5 percent) does not apply. Labor related to installation of tangible personal property to real property is non-taxable. These charges are not subject to sales tax. No sales tax has been applied to labor. 21.1.3.26 Contingency An overall contingency of about twenty three percent (23 percent) has been included in the capital cost. Zero contingency dollars have been applied to the cost of equipment to be re-purchased by Aurcana from the bank. Contingency is an allowance to cover unforeseeable costs that may arise during the project execution, which reside within the scope-of-work but cannot be explicitly defined or described at the time of the estimate due to lack of information. It is assumed that contingency will be spent; however, it does not cover scope changes or project exclusions.
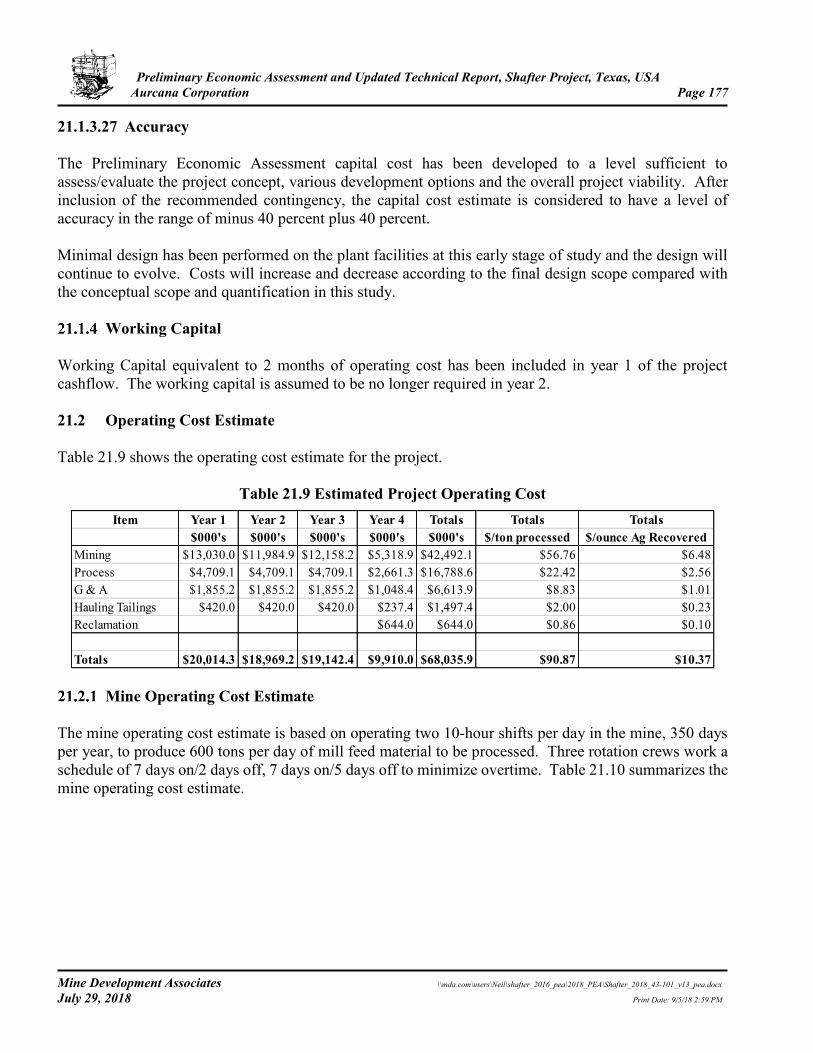
Preliminary Economic Assessment and Updated Technical Report, Shafter Project, Texas, USA Aurcana Corporation Page 177
Mine Development Associates \\mda.com\users\Neil\shafter_2016_pea\2018_PEA\Shafter_2018_43-101_v13_pea.docx July 29, 2018 Print Date: 9/5/18 2:59 PM
21.1.3.27 Accuracy The Preliminary Economic Assessment capital cost has been developed to a level sufficient to assess/evaluate the project concept, various development options and the overall project viability. After inclusion of the recommended contingency, the capital cost estimate is considered to have a level of accuracy in the range of minus 40 percent plus 40 percent. Minimal design has been performed on the plant facilities at this early stage of study and the design will continue to evolve. Costs will increase and decrease according to the final design scope compared with the conceptual scope and quantification in this study.
Working Capital Working Capital equivalent to 2 months of operating cost has been included in year 1 of the project cashflow. The working capital is assumed to be no longer required in year 2. 21.2 Operating Cost Estimate Table 21.9 shows the operating cost estimate for the project.
Table 21.9 Estimated Project Operating Cost Item Year 1 Year 2 Year 3 Year 4 Totals Totals Totals
$000's $000's $000's $000's $000's $/ton processed $/ounce Ag RecoveredMining $13,030.0 $11,984.9 $12,158.2 $5,318.9 $42,492.1 $56.76 $6.48Process $4,709.1 $4,709.1 $4,709.1 $2,661.3 $16,788.6 $22.42 $2.56G & A $1,855.2 $1,855.2 $1,855.2 $1,048.4 $6,613.9 $8.83 $1.01Hauling Tailings $420.0 $420.0 $420.0 $237.4 $1,497.4 $2.00 $0.23Reclamation $644.0 $644.0 $0.86 $0.10
Totals $20,014.3 $18,969.2 $19,142.4 $9,910.0 $68,035.9 $90.87 $10.37
Mine Operating Cost Estimate The mine operating cost estimate is based on operating two 10-hour shifts per day in the mine, 350 days per year, to produce 600 tons per day of mill feed material to be processed. Three rotation crews work a schedule of 7 days on/2 days off, 7 days on/5 days off to minimize overtime. Table 21.10 summarizes the mine operating cost estimate.
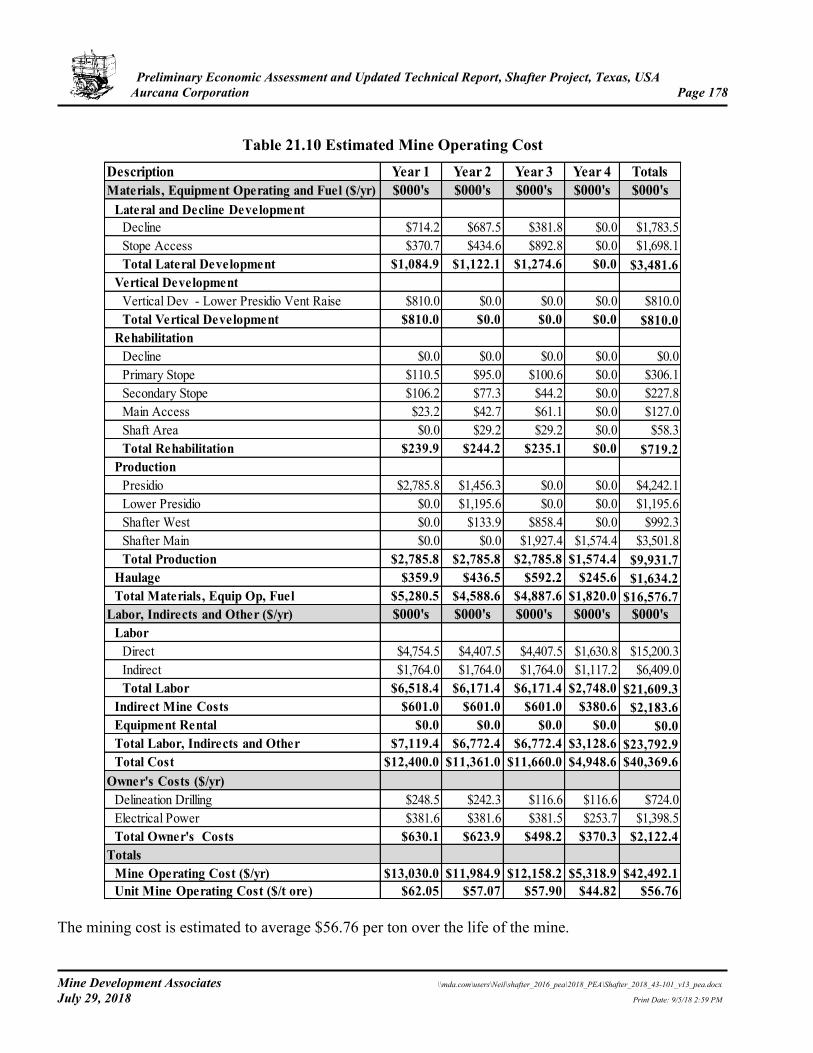
Preliminary Economic Assessment and Updated Technical Report, Shafter Project, Texas, USA Aurcana Corporation Page 178
Mine Development Associates \\mda.com\users\Neil\shafter_2016_pea\2018_PEA\Shafter_2018_43-101_v13_pea.docx July 29, 2018 Print Date: 9/5/18 2:59 PM
Table 21.10 Estimated Mine Operating Cost
Description Year 1 Year 2 Year 3 Year 4 TotalsMaterials, Equipment Operating and Fuel ($/yr) $000's $000's $000's $000's $000's
Lateral and Decline DevelopmentDecline $714.2 $687.5 $381.8 $0.0 $1,783.5Stope Access $370.7 $434.6 $892.8 $0.0 $1,698.1Total Lateral Development $1,084.9 $1,122.1 $1,274.6 $0.0 $3,481.6
Vertical DevelopmentVertical Dev - Lower Presidio Vent Raise $810.0 $0.0 $0.0 $0.0 $810.0Total Vertical Development $810.0 $0.0 $0.0 $0.0 $810.0
RehabilitationDecline $0.0 $0.0 $0.0 $0.0 $0.0Primary Stope $110.5 $95.0 $100.6 $0.0 $306.1Secondary Stope $106.2 $77.3 $44.2 $0.0 $227.8Main Access $23.2 $42.7 $61.1 $0.0 $127.0Shaft Area $0.0 $29.2 $29.2 $0.0 $58.3Total Rehabilitation $239.9 $244.2 $235.1 $0.0 $719.2
ProductionPresidio $2,785.8 $1,456.3 $0.0 $0.0 $4,242.1Lower Presidio $0.0 $1,195.6 $0.0 $0.0 $1,195.6Shafter West $0.0 $133.9 $858.4 $0.0 $992.3Shafter Main $0.0 $0.0 $1,927.4 $1,574.4 $3,501.8Total Production $2,785.8 $2,785.8 $2,785.8 $1,574.4 $9,931.7
Haulage $359.9 $436.5 $592.2 $245.6 $1,634.2Total Materials, Equip Op, Fuel $5,280.5 $4,588.6 $4,887.6 $1,820.0 $16,576.7
Labor, Indirects and Other ($/yr) $000's $000's $000's $000's $000'sLabor
Direct $4,754.5 $4,407.5 $4,407.5 $1,630.8 $15,200.3Indirect $1,764.0 $1,764.0 $1,764.0 $1,117.2 $6,409.0Total Labor $6,518.4 $6,171.4 $6,171.4 $2,748.0 $21,609.3
Indirect Mine Costs $601.0 $601.0 $601.0 $380.6 $2,183.6Equipment Rental $0.0 $0.0 $0.0 $0.0 $0.0Total Labor, Indirects and Other $7,119.4 $6,772.4 $6,772.4 $3,128.6 $23,792.9Total Cost $12,400.0 $11,361.0 $11,660.0 $4,948.6 $40,369.6
Owner's Costs ($/yr)Delineation Drilling $248.5 $242.3 $116.6 $116.6 $724.0Electrical Power $381.6 $381.6 $381.5 $253.7 $1,398.5Total Owner's Costs $630.1 $623.9 $498.2 $370.3 $2,122.4
TotalsMine Operating Cost ($/yr) $13,030.0 $11,984.9 $12,158.2 $5,318.9 $42,492.1Unit Mine Operating Cost ($/t ore) $62.05 $57.07 $57.90 $44.82 $56.76
The mining cost is estimated to average $56.76 per ton over the life of the mine.
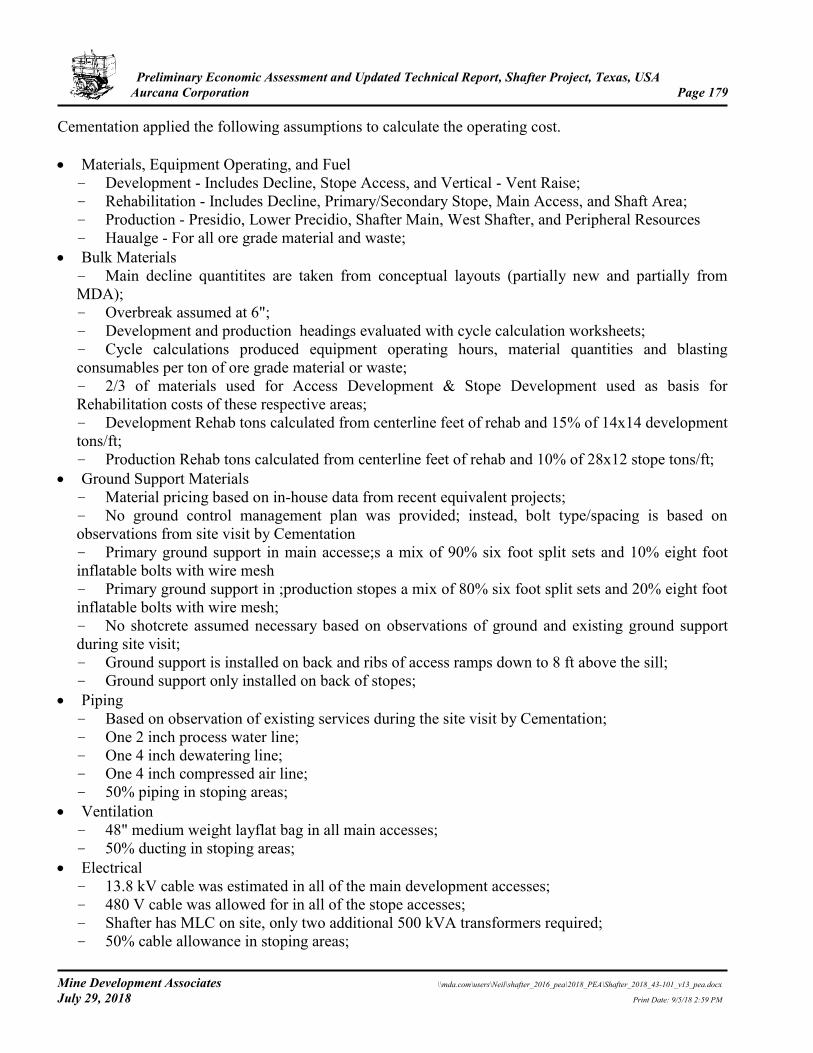
Preliminary Economic Assessment and Updated Technical Report, Shafter Project, Texas, USA Aurcana Corporation Page 179
Mine Development Associates \\mda.com\users\Neil\shafter_2016_pea\2018_PEA\Shafter_2018_43-101_v13_pea.docx July 29, 2018 Print Date: 9/5/18 2:59 PM
Cementation applied the following assumptions to calculate the operating cost. • Materials, Equipment Operating, and Fuel Development - Includes Decline, Stope Access, and Vertical - Vent Raise; Rehabilitation - Includes Decline, Primary/Secondary Stope, Main Access, and Shaft Area; Production - Presidio, Lower Precidio, Shafter Main, West Shafter, and Peripheral Resources Haualge - For all ore grade material and waste;
• Bulk Materials Main decline quantitites are taken from conceptual layouts (partially new and partially from MDA); Overbreak assumed at 6"; Development and production headings evaluated with cycle calculation worksheets; Cycle calculations produced equipment operating hours, material quantities and blasting consumables per ton of ore grade material or waste; 2/3 of materials used for Access Development & Stope Development used as basis for Rehabilitation costs of these respective areas; Development Rehab tons calculated from centerline feet of rehab and 15% of 14x14 development tons/ft; Production Rehab tons calculated from centerline feet of rehab and 10% of 28x12 stope tons/ft;
• Ground Support Materials Material pricing based on in-house data from recent equivalent projects; No ground control management plan was provided; instead, bolt type/spacing is based on observations from site visit by Cementation Primary ground support in main accesse;s a mix of 90% six foot split sets and 10% eight foot inflatable bolts with wire mesh Primary ground support in ;production stopes a mix of 80% six foot split sets and 20% eight foot inflatable bolts with wire mesh; No shotcrete assumed necessary based on observations of ground and existing ground support during site visit; Ground support is installed on back and ribs of access ramps down to 8 ft above the sill; Ground support only installed on back of stopes;
• Piping Based on observation of existing services during the site visit by Cementation; One 2 inch process water line; One 4 inch dewatering line; One 4 inch compressed air line; 50% piping in stoping areas;
• Ventilation 48" medium weight layflat bag in all main accesses; 50% ducting in stoping areas;
• Electrical 13.8 kV cable was estimated in all of the main development accesses; 480 V cable was allowed for in all of the stope accesses; Shafter has MLC on site, only two additional 500 kVA transformers required; 50% cable allowance in stoping areas;
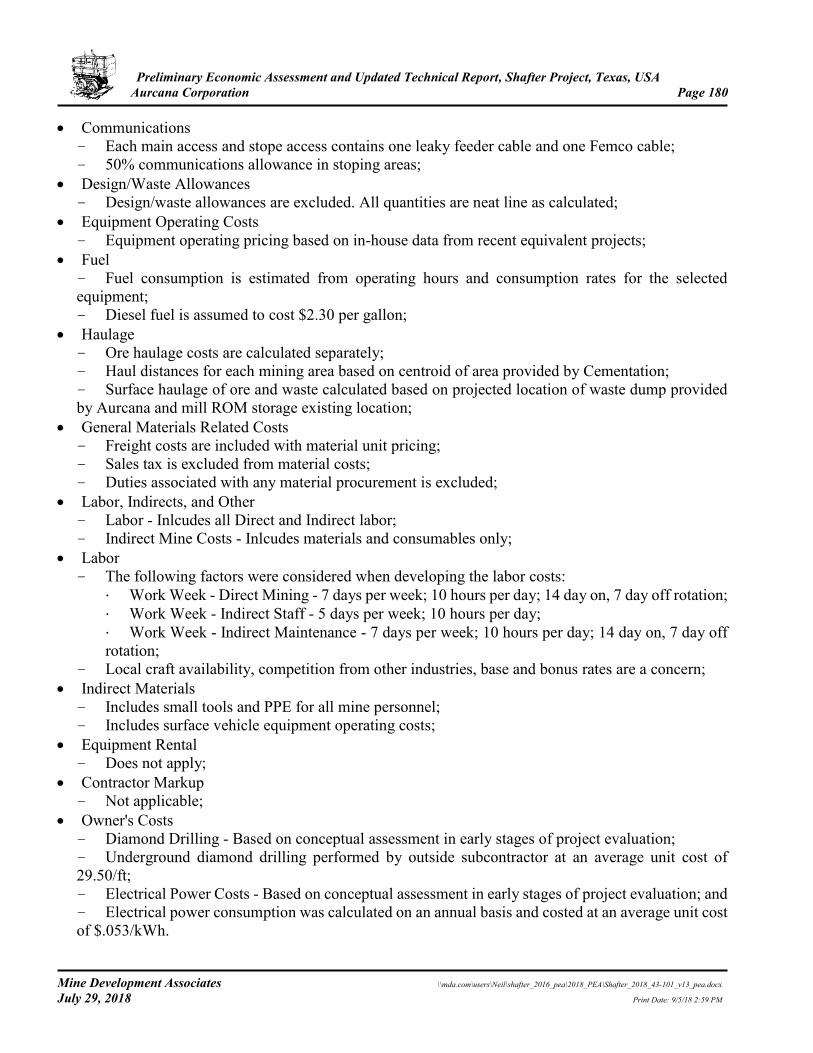
Preliminary Economic Assessment and Updated Technical Report, Shafter Project, Texas, USA Aurcana Corporation Page 180
Mine Development Associates \\mda.com\users\Neil\shafter_2016_pea\2018_PEA\Shafter_2018_43-101_v13_pea.docx July 29, 2018 Print Date: 9/5/18 2:59 PM
• Communications Each main access and stope access contains one leaky feeder cable and one Femco cable; 50% communications allowance in stoping areas;
• Design/Waste Allowances Design/waste allowances are excluded. All quantities are neat line as calculated;
• Equipment Operating Costs Equipment operating pricing based on in-house data from recent equivalent projects;
• Fuel Fuel consumption is estimated from operating hours and consumption rates for the selected equipment; Diesel fuel is assumed to cost $2.30 per gallon;
• Haulage Ore haulage costs are calculated separately; Haul distances for each mining area based on centroid of area provided by Cementation; Surface haulage of ore and waste calculated based on projected location of waste dump provided by Aurcana and mill ROM storage existing location;
• General Materials Related Costs Freight costs are included with material unit pricing; Sales tax is excluded from material costs; Duties associated with any material procurement is excluded;
• Labor, Indirects, and Other Labor - Inlcudes all Direct and Indirect labor; Indirect Mine Costs - Inlcudes materials and consumables only;
• Labor The following factors were considered when developing the labor costs:
· Work Week - Direct Mining - 7 days per week; 10 hours per day; 14 day on, 7 day off rotation; · Work Week - Indirect Staff - 5 days per week; 10 hours per day; · Work Week - Indirect Maintenance - 7 days per week; 10 hours per day; 14 day on, 7 day off rotation;
Local craft availability, competition from other industries, base and bonus rates are a concern; • Indirect Materials Includes small tools and PPE for all mine personnel; Includes surface vehicle equipment operating costs;
• Equipment Rental Does not apply;
• Contractor Markup Not applicable;
• Owner's Costs Diamond Drilling - Based on conceptual assessment in early stages of project evaluation; Underground diamond drilling performed by outside subcontractor at an average unit cost of 29.50/ft; Electrical Power Costs - Based on conceptual assessment in early stages of project evaluation; and Electrical power consumption was calculated on an annual basis and costed at an average unit cost of $.053/kWh.
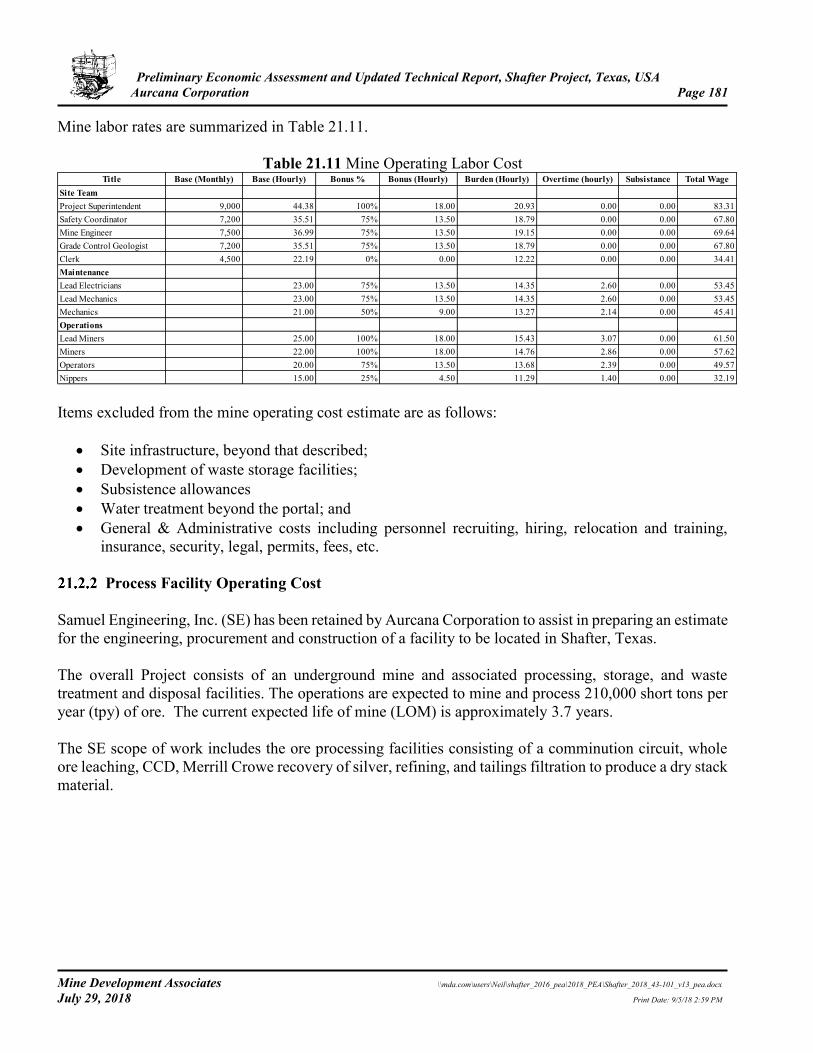
Preliminary Economic Assessment and Updated Technical Report, Shafter Project, Texas, USA Aurcana Corporation Page 181
Mine Development Associates \\mda.com\users\Neil\shafter_2016_pea\2018_PEA\Shafter_2018_43-101_v13_pea.docx July 29, 2018 Print Date: 9/5/18 2:59 PM
Mine labor rates are summarized in Table 21.11.
Table 21.11 Mine Operating Labor Cost Title Base (Monthly) Base (Hourly) Bonus % Bonus (Hourly) Burden (Hourly) Overtime (hourly) Subsistance Total Wage
Site TeamProject Superintendent 9,000 44.38 100% 18.00 20.93 0.00 0.00 83.31Safety Coordinator 7,200 35.51 75% 13.50 18.79 0.00 0.00 67.80Mine Engineer 7,500 36.99 75% 13.50 19.15 0.00 0.00 69.64Grade Control Geologist 7,200 35.51 75% 13.50 18.79 0.00 0.00 67.80Clerk 4,500 22.19 0% 0.00 12.22 0.00 0.00 34.41MaintenanceLead Electricians 23.00 75% 13.50 14.35 2.60 0.00 53.45Lead Mechanics 23.00 75% 13.50 14.35 2.60 0.00 53.45Mechanics 21.00 50% 9.00 13.27 2.14 0.00 45.41OperationsLead Miners 25.00 100% 18.00 15.43 3.07 0.00 61.50Miners 22.00 100% 18.00 14.76 2.86 0.00 57.62Operators 20.00 75% 13.50 13.68 2.39 0.00 49.57Nippers 15.00 25% 4.50 11.29 1.40 0.00 32.19 Items excluded from the mine operating cost estimate are as follows:
• Site infrastructure, beyond that described; • Development of waste storage facilities; • Subsistence allowances • Water treatment beyond the portal; and • General & Administrative costs including personnel recruiting, hiring, relocation and training,
insurance, security, legal, permits, fees, etc.
Process Facility Operating Cost Samuel Engineering, Inc. (SE) has been retained by Aurcana Corporation to assist in preparing an estimate for the engineering, procurement and construction of a facility to be located in Shafter, Texas. The overall Project consists of an underground mine and associated processing, storage, and waste treatment and disposal facilities. The operations are expected to mine and process 210,000 short tons per year (tpy) of ore. The current expected life of mine (LOM) is approximately 3.7 years. The SE scope of work includes the ore processing facilities consisting of a comminution circuit, whole ore leaching, CCD, Merrill Crowe recovery of silver, refining, and tailings filtration to produce a dry stack material.
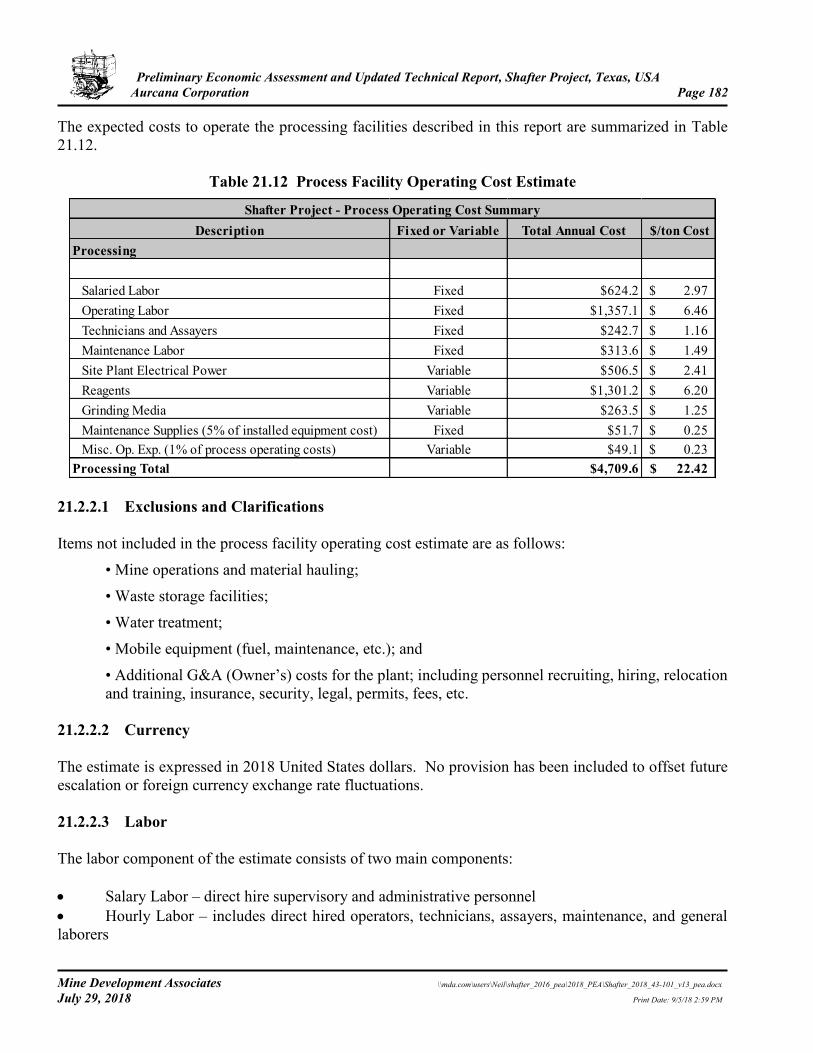
Preliminary Economic Assessment and Updated Technical Report, Shafter Project, Texas, USA Aurcana Corporation Page 182
Mine Development Associates \\mda.com\users\Neil\shafter_2016_pea\2018_PEA\Shafter_2018_43-101_v13_pea.docx July 29, 2018 Print Date: 9/5/18 2:59 PM
The expected costs to operate the processing facilities described in this report are summarized in Table 21.12.
Table 21.12 Process Facility Operating Cost Estimate
Description Fixed or Variable Total Annual Cost $/ton Cost Processing
Salaried Labor Fixed $624.2 2.97$ Operating Labor Fixed $1,357.1 6.46$ Technicians and Assayers Fixed $242.7 1.16$ Maintenance Labor Fixed $313.6 1.49$ Site Plant Electrical Power Variable $506.5 2.41$ Reagents Variable $1,301.2 6.20$ Grinding Media Variable $263.5 1.25$ Maintenance Supplies (5% of installed equipment cost) Fixed $51.7 0.25$ Misc. Op. Exp. (1% of process operating costs) Variable $49.1 0.23$
Processing Total $4,709.6 22.42$
Shafter Project - Process Operating Cost Summary
21.2.2.1 Exclusions and Clarifications Items not included in the process facility operating cost estimate are as follows:
• Mine operations and material hauling; • Waste storage facilities; • Water treatment; • Mobile equipment (fuel, maintenance, etc.); and • Additional G&A (Owner’s) costs for the plant; including personnel recruiting, hiring, relocation and training, insurance, security, legal, permits, fees, etc.
21.2.2.2 Currency The estimate is expressed in 2018 United States dollars. No provision has been included to offset future escalation or foreign currency exchange rate fluctuations. 21.2.2.3 Labor The labor component of the estimate consists of two main components: • Salary Labor – direct hire supervisory and administrative personnel • Hourly Labor – includes direct hired operators, technicians, assayers, maintenance, and general laborers

Preliminary Economic Assessment and Updated Technical Report, Shafter Project, Texas, USA Aurcana Corporation Page 183
Mine Development Associates \\mda.com\users\Neil\shafter_2016_pea\2018_PEA\Shafter_2018_43-101_v13_pea.docx July 29, 2018 Print Date: 9/5/18 2:59 PM
The direct hired personnel represent the direct labor necessary for day-to-day operations and maintenance of the process plant, including both hourly and salaried personnel. The proposed process facility will operate continuously with two twelve hour shifts (with the exception of the crushing circuit which will operate on a single twelve hour shift), seven days per week, for 350 days per year. Four shifts are included in the calculation so that the hourly personnel can be rotated and cover vacations, holidays and sick days. The labor rates used in the estimate are based on salary information from a similar project in Arizona. Overtime has been included. No special bonuses or incentives have been included.
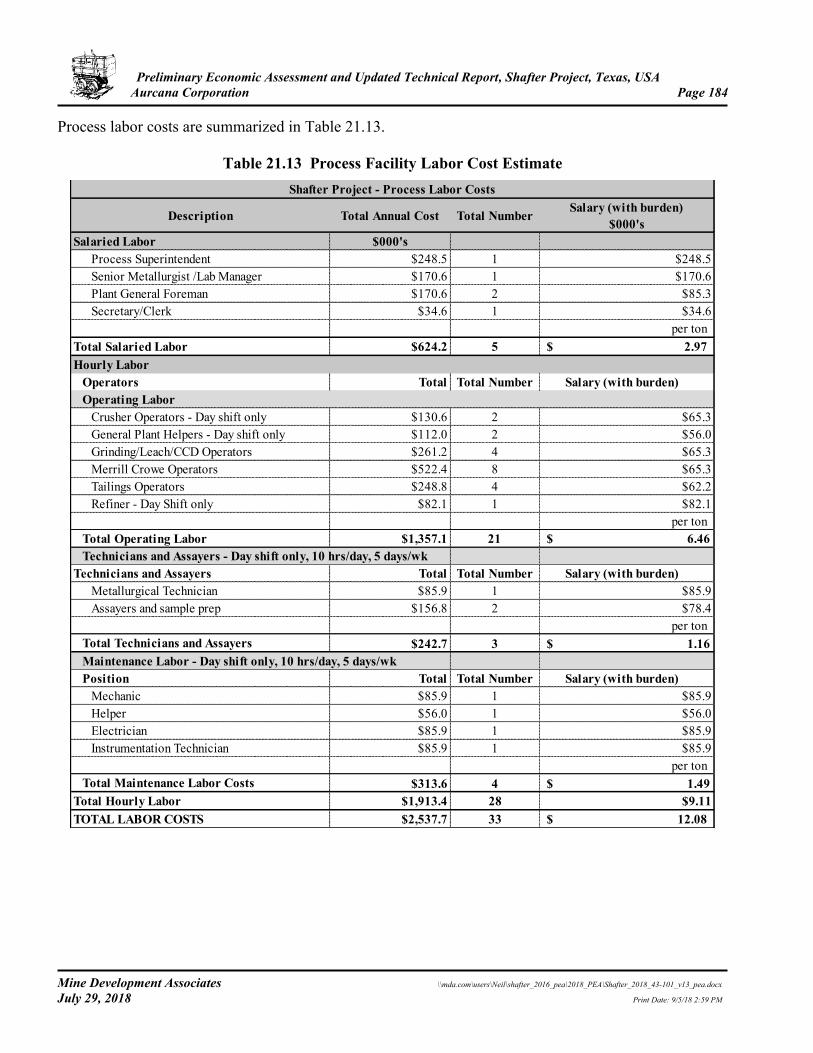
Preliminary Economic Assessment and Updated Technical Report, Shafter Project, Texas, USA Aurcana Corporation Page 184
Mine Development Associates \\mda.com\users\Neil\shafter_2016_pea\2018_PEA\Shafter_2018_43-101_v13_pea.docx July 29, 2018 Print Date: 9/5/18 2:59 PM
Process labor costs are summarized in Table 21.13.
Table 21.13 Process Facility Labor Cost Estimate
Description Total Annual Cost Total Number Salary (with burden)$000's
Salaried Labor $000'sProcess Superintendent $248.5 1 $248.5Senior Metallurgist /Lab Manager $170.6 1 $170.6Plant General Foreman $170.6 2 $85.3Secretary/Clerk $34.6 1 $34.6
per tonTotal Salaried Labor $624.2 5 2.97$ Hourly Labor
Operators Total Total Number Salary (with burden) Operating Labor
Crusher Operators - Day shift only $130.6 2 $65.3General Plant Helpers - Day shift only $112.0 2 $56.0Grinding/Leach/CCD Operators $261.2 4 $65.3Merrill Crowe Operators $522.4 8 $65.3Tailings Operators $248.8 4 $62.2Refiner - Day Shift only $82.1 1 $82.1
per tonTotal Operating Labor $1,357.1 21 $ 6.46 Technicians and Assayers - Day shift only, 10 hrs/day, 5 days/wk
Technicians and Assayers Total Total Number Salary (with burden) Metallurgical Technician $85.9 1 $85.9Assayers and sample prep $156.8 2 $78.4
per tonTotal Technicians and Assayers $242.7 3 $ 1.16 Maintenance Labor - Day shift only, 10 hrs/day, 5 days/wkPosition Total Total Number Salary (with burden)
Mechanic $85.9 1 $85.9Helper $56.0 1 $56.0Electrician $85.9 1 $85.9Instrumentation Technician $85.9 1 $85.9
per tonTotal Maintenance Labor Costs $313.6 4 $ 1.49
Total Hourly Labor $1,913.4 28 $9.11TOTAL LABOR COSTS $2,537.7 33 12.08$
Shafter Project - Process Labor Costs
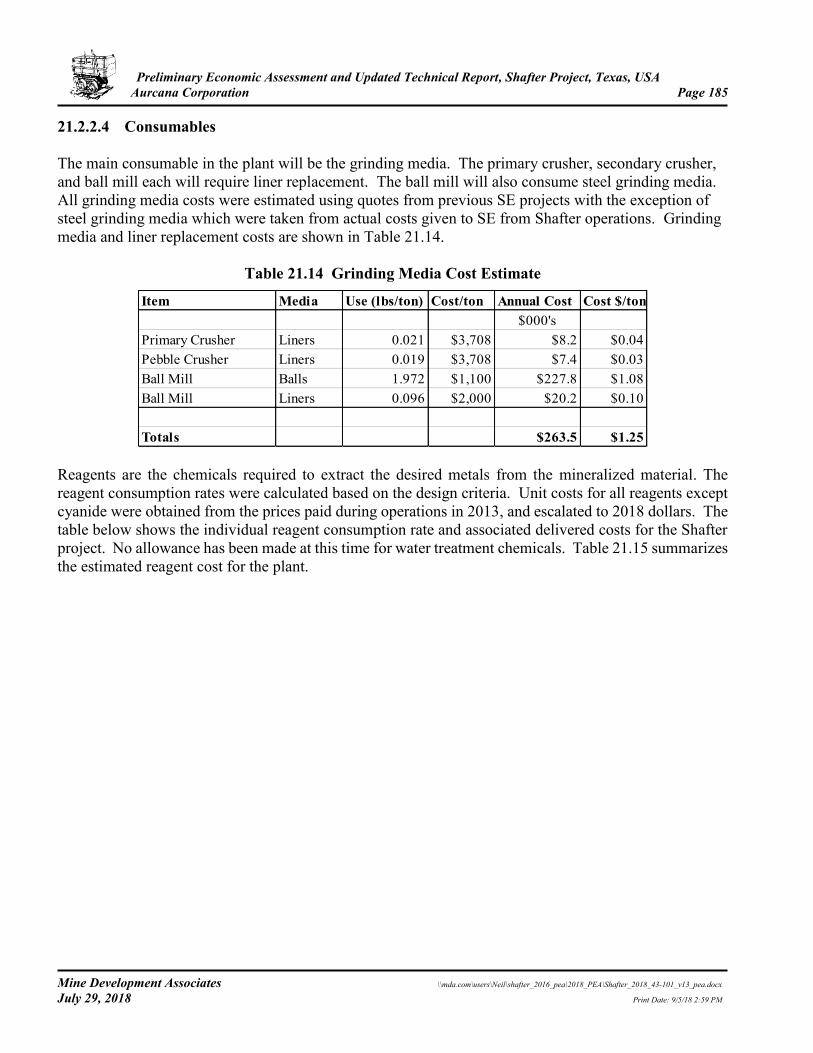
Preliminary Economic Assessment and Updated Technical Report, Shafter Project, Texas, USA Aurcana Corporation Page 185
Mine Development Associates \\mda.com\users\Neil\shafter_2016_pea\2018_PEA\Shafter_2018_43-101_v13_pea.docx July 29, 2018 Print Date: 9/5/18 2:59 PM
21.2.2.4 Consumables The main consumable in the plant will be the grinding media. The primary crusher, secondary crusher, and ball mill each will require liner replacement. The ball mill will also consume steel grinding media. All grinding media costs were estimated using quotes from previous SE projects with the exception of steel grinding media which were taken from actual costs given to SE from Shafter operations. Grinding media and liner replacement costs are shown in Table 21.14.
Table 21.14 Grinding Media Cost Estimate
Item Media Use (lbs/ton) Cost/ton Annual Cost Cost $/ton$000's
Primary Crusher Liners 0.021 $3,708 $8.2 $0.04Pebble Crusher Liners 0.019 $3,708 $7.4 $0.03Ball Mill Balls 1.972 $1,100 $227.8 $1.08Ball Mill Liners 0.096 $2,000 $20.2 $0.10
Totals $263.5 $1.25 Reagents are the chemicals required to extract the desired metals from the mineralized material. The reagent consumption rates were calculated based on the design criteria. Unit costs for all reagents except cyanide were obtained from the prices paid during operations in 2013, and escalated to 2018 dollars. The table below shows the individual reagent consumption rate and associated delivered costs for the Shafter project. No allowance has been made at this time for water treatment chemicals. Table 21.15 summarizes the estimated reagent cost for the plant.
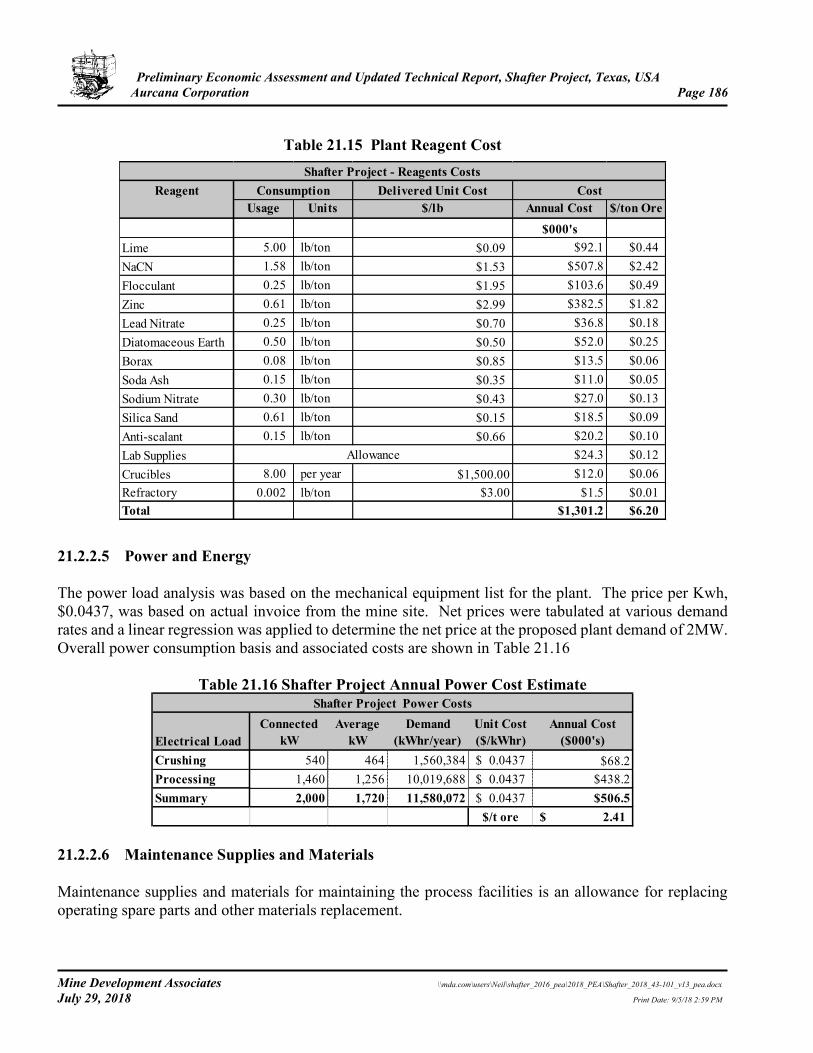
Preliminary Economic Assessment and Updated Technical Report, Shafter Project, Texas, USA Aurcana Corporation Page 186
Mine Development Associates \\mda.com\users\Neil\shafter_2016_pea\2018_PEA\Shafter_2018_43-101_v13_pea.docx July 29, 2018 Print Date: 9/5/18 2:59 PM
Table 21.15 Plant Reagent Cost
Reagent Consumption Delivered Unit Cost CostUsage Units $/lb Annual Cost $/ton Ore
$000'sLime 5.00 lb/ton $0.09 $92.1 $0.44NaCN 1.58 lb/ton $1.53 $507.8 $2.42Flocculant 0.25 lb/ton $1.95 $103.6 $0.49Zinc 0.61 lb/ton $2.99 $382.5 $1.82Lead Nitrate 0.25 lb/ton $0.70 $36.8 $0.18Diatomaceous Earth 0.50 lb/ton $0.50 $52.0 $0.25Borax 0.08 lb/ton $0.85 $13.5 $0.06Soda Ash 0.15 lb/ton $0.35 $11.0 $0.05Sodium Nitrate 0.30 lb/ton $0.43 $27.0 $0.13Silica Sand 0.61 lb/ton $0.15 $18.5 $0.09Anti-scalant 0.15 lb/ton $0.66 $20.2 $0.10Lab Supplies $24.3 $0.12Crucibles 8.00 per year $1,500.00 $12.0 $0.06Refractory 0.002 lb/ton $3.00 $1.5 $0.01Total $1,301.2 $6.20
Shafter Project - Reagents Costs
Allowance
21.2.2.5 Power and Energy The power load analysis was based on the mechanical equipment list for the plant. The price per Kwh, $0.0437, was based on actual invoice from the mine site. Net prices were tabulated at various demand rates and a linear regression was applied to determine the net price at the proposed plant demand of 2MW. Overall power consumption basis and associated costs are shown in Table 21.16
Table 21.16 Shafter Project Annual Power Cost Estimate Shafter Project Power Costs
Electrical LoadConnected
kWAverage
kWDemand
(kWhr/year)Unit Cost ($/kWhr)
Annual Cost($000's)
Crushing 540 464 1,560,384 0.0437$ $68.2Processing 1,460 1,256 10,019,688 0.0437$ $438.2Summary 2,000 1,720 11,580,072 0.0437$ $506.5
$/t ore 2.41$ 21.2.2.6 Maintenance Supplies and Materials Maintenance supplies and materials for maintaining the process facilities is an allowance for replacing operating spare parts and other materials replacement.
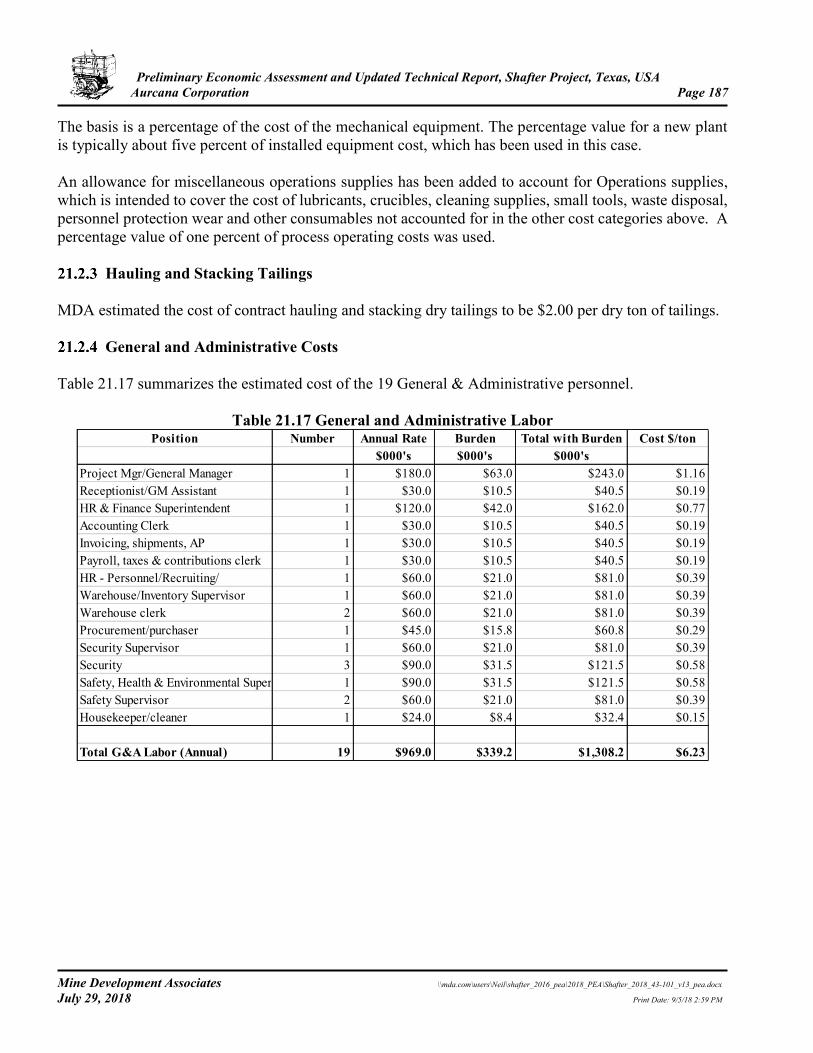
Preliminary Economic Assessment and Updated Technical Report, Shafter Project, Texas, USA Aurcana Corporation Page 187
Mine Development Associates \\mda.com\users\Neil\shafter_2016_pea\2018_PEA\Shafter_2018_43-101_v13_pea.docx July 29, 2018 Print Date: 9/5/18 2:59 PM
The basis is a percentage of the cost of the mechanical equipment. The percentage value for a new plant is typically about five percent of installed equipment cost, which has been used in this case. An allowance for miscellaneous operations supplies has been added to account for Operations supplies, which is intended to cover the cost of lubricants, crucibles, cleaning supplies, small tools, waste disposal, personnel protection wear and other consumables not accounted for in the other cost categories above. A percentage value of one percent of process operating costs was used.
Hauling and Stacking Tailings MDA estimated the cost of contract hauling and stacking dry tailings to be $2.00 per dry ton of tailings.
General and Administrative Costs Table 21.17 summarizes the estimated cost of the 19 General & Administrative personnel.
Table 21.17 General and Administrative Labor Position Number Annual Rate Burden Total with Burden Cost $/ton
$000's $000's $000'sProject Mgr/General Manager 1 $180.0 $63.0 $243.0 $1.16Receptionist/GM Assistant 1 $30.0 $10.5 $40.5 $0.19HR & Finance Superintendent 1 $120.0 $42.0 $162.0 $0.77Accounting Clerk 1 $30.0 $10.5 $40.5 $0.19Invoicing, shipments, AP 1 $30.0 $10.5 $40.5 $0.19Payroll, taxes & contributions clerk 1 $30.0 $10.5 $40.5 $0.19HR - Personnel/Recruiting/ 1 $60.0 $21.0 $81.0 $0.39Warehouse/Inventory Supervisor 1 $60.0 $21.0 $81.0 $0.39Warehouse clerk 2 $60.0 $21.0 $81.0 $0.39Procurement/purchaser 1 $45.0 $15.8 $60.8 $0.29Security Supervisor 1 $60.0 $21.0 $81.0 $0.39Security 3 $90.0 $31.5 $121.5 $0.58Safety, Health & Environmental Superintendent 1 $90.0 $31.5 $121.5 $0.58Safety Supervisor 2 $60.0 $21.0 $81.0 $0.39Housekeeper/cleaner 1 $24.0 $8.4 $32.4 $0.15
Total G&A Labor (Annual) 19 $969.0 $339.2 $1,308.2 $6.23
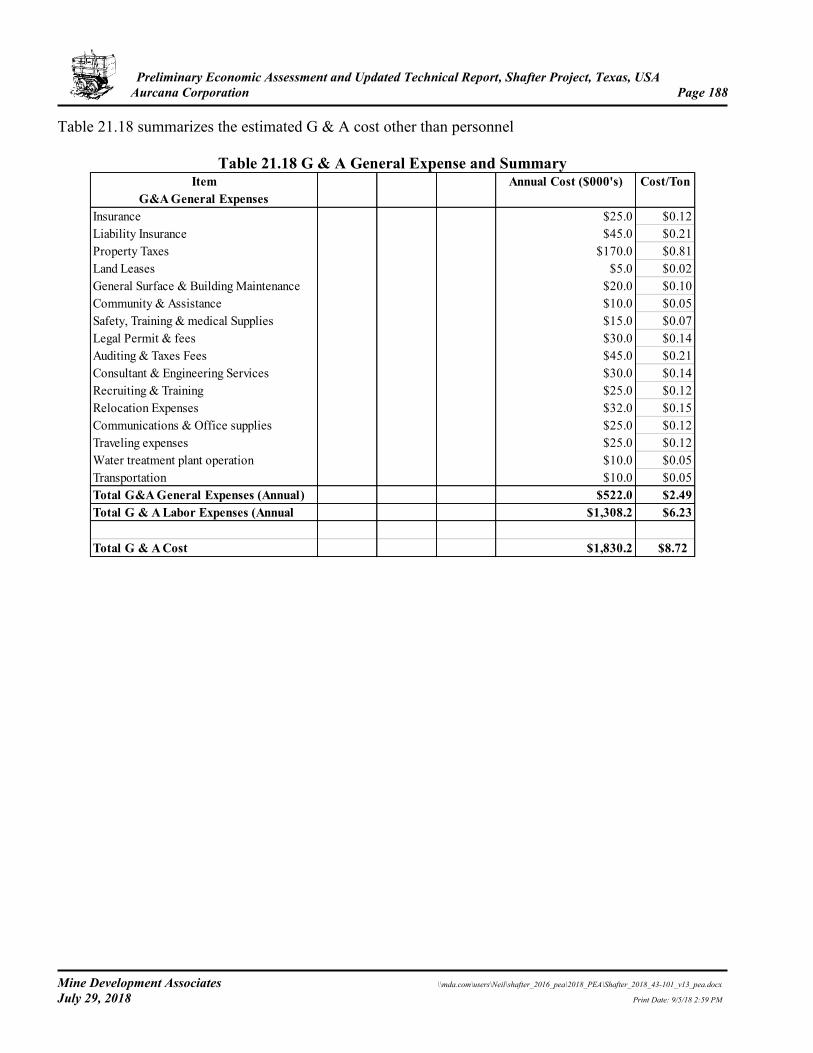
Preliminary Economic Assessment and Updated Technical Report, Shafter Project, Texas, USA Aurcana Corporation Page 188
Mine Development Associates \\mda.com\users\Neil\shafter_2016_pea\2018_PEA\Shafter_2018_43-101_v13_pea.docx July 29, 2018 Print Date: 9/5/18 2:59 PM
Table 21.18 summarizes the estimated G & A cost other than personnel
Table 21.18 G & A General Expense and Summary Item Annual Cost ($000's) Cost/Ton
G&A General ExpensesInsurance $25.0 $0.12Liability Insurance $45.0 $0.21Property Taxes $170.0 $0.81Land Leases $5.0 $0.02General Surface & Building Maintenance $20.0 $0.10Community & Assistance $10.0 $0.05Safety, Training & medical Supplies $15.0 $0.07Legal Permit & fees $30.0 $0.14Auditing & Taxes Fees $45.0 $0.21Consultant & Engineering Services $30.0 $0.14Recruiting & Training $25.0 $0.12Relocation Expenses $32.0 $0.15Communications & Office supplies $25.0 $0.12Traveling expenses $25.0 $0.12Water treatment plant operation $10.0 $0.05Transportation $10.0 $0.05Total G&A General Expenses (Annual) $522.0 $2.49Total G & A Labor Expenses (Annual $1,308.2 $6.23
Total G & A Cost $1,830.2 $8.72
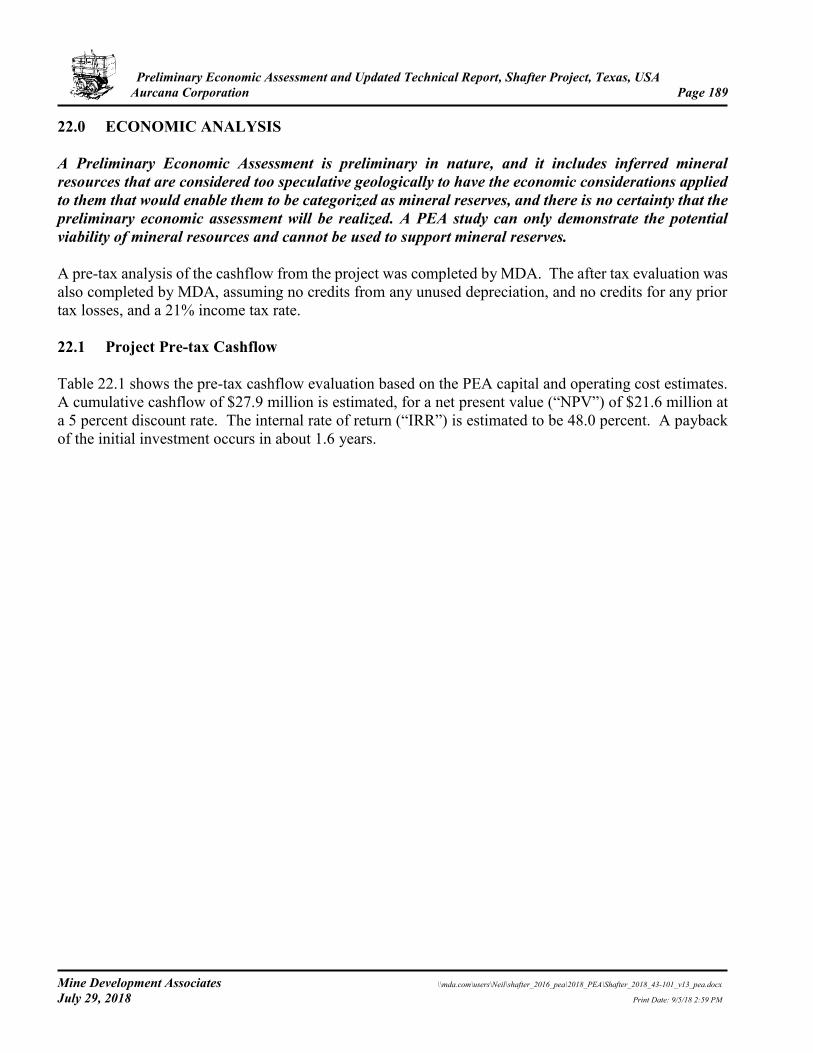
Preliminary Economic Assessment and Updated Technical Report, Shafter Project, Texas, USA Aurcana Corporation Page 189
Mine Development Associates \\mda.com\users\Neil\shafter_2016_pea\2018_PEA\Shafter_2018_43-101_v13_pea.docx July 29, 2018 Print Date: 9/5/18 2:59 PM
22.0 ECONOMIC ANALYSIS A Preliminary Economic Assessment is preliminary in nature, and it includes inferred mineral resources that are considered too speculative geologically to have the economic considerations applied to them that would enable them to be categorized as mineral reserves, and there is no certainty that the preliminary economic assessment will be realized. A PEA study can only demonstrate the potential viability of mineral resources and cannot be used to support mineral reserves. A pre-tax analysis of the cashflow from the project was completed by MDA. The after tax evaluation was also completed by MDA, assuming no credits from any unused depreciation, and no credits for any prior tax losses, and a 21% income tax rate. 22.1 Project Pre-tax Cashflow Table 22.1 shows the pre-tax cashflow evaluation based on the PEA capital and operating cost estimates. A cumulative cashflow of $27.9 million is estimated, for a net present value (“NPV”) of $21.6 million at a 5 percent discount rate. The internal rate of return (“IRR”) is estimated to be 48.0 percent. A payback of the initial investment occurs in about 1.6 years.
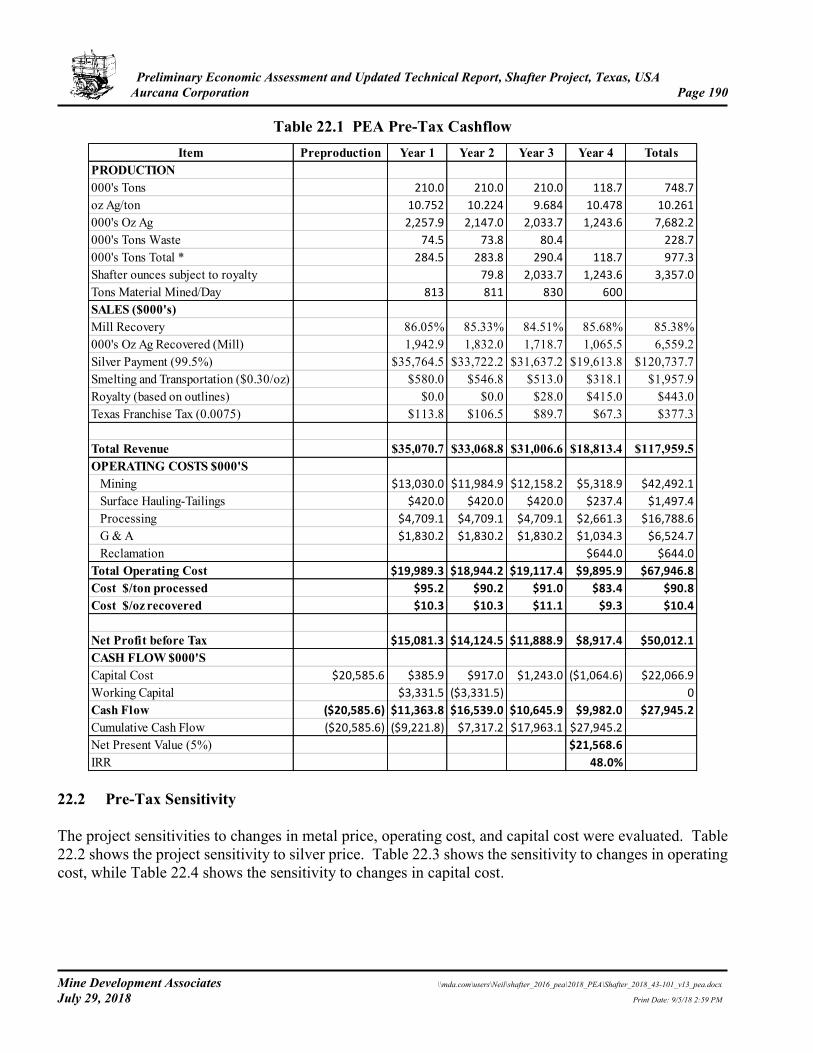
Preliminary Economic Assessment and Updated Technical Report, Shafter Project, Texas, USA Aurcana Corporation Page 190
Mine Development Associates \\mda.com\users\Neil\shafter_2016_pea\2018_PEA\Shafter_2018_43-101_v13_pea.docx July 29, 2018 Print Date: 9/5/18 2:59 PM
Table 22.1 PEA Pre-Tax Cashflow Item Preproduction Year 1 Year 2 Year 3 Year 4 Totals
PRODUCTION000's Tons 210.0 210.0 210.0 118.7 748.7
oz Ag/ton 10.752 10.224 9.684 10.478 10.261
000's Oz Ag 2,257.9 2,147.0 2,033.7 1,243.6 7,682.2
000's Tons Waste 74.5 73.8 80.4 228.7
000's Tons Total * 284.5 283.8 290.4 118.7 977.3
Shafter ounces subject to royalty 79.8 2,033.7 1,243.6 3,357.0
Tons Material Mined/Day 813 811 830 600
SALES ($000's)Mill Recovery 86.05% 85.33% 84.51% 85.68% 85.38%000's Oz Ag Recovered (Mill) 1,942.9 1,832.0 1,718.7 1,065.5 6,559.2Silver Payment (99.5%) $35,764.5 $33,722.2 $31,637.2 $19,613.8 $120,737.7Smelting and Transportation ($0.30/oz) $580.0 $546.8 $513.0 $318.1 $1,957.9Royalty (based on outlines) $0.0 $0.0 $28.0 $415.0 $443.0Texas Franchise Tax (0.0075) $113.8 $106.5 $89.7 $67.3 $377.3
Total Revenue $35,070.7 $33,068.8 $31,006.6 $18,813.4 $117,959.5OPERATING COSTS $000'S Mining $13,030.0 $11,984.9 $12,158.2 $5,318.9 $42,492.1
Surface Hauling-Tailings $420.0 $420.0 $420.0 $237.4 $1,497.4
Processing $4,709.1 $4,709.1 $4,709.1 $2,661.3 $16,788.6
G & A $1,830.2 $1,830.2 $1,830.2 $1,034.3 $6,524.7
Reclamation $644.0 $644.0
Total Operating Cost $19,989.3 $18,944.2 $19,117.4 $9,895.9 $67,946.8
Cost $/ton processed $95.2 $90.2 $91.0 $83.4 $90.8
Cost $/oz recovered $10.3 $10.3 $11.1 $9.3 $10.4
Net Profit before Tax $15,081.3 $14,124.5 $11,888.9 $8,917.4 $50,012.1
CASH FLOW $000'SCapital Cost $20,585.6 $385.9 $917.0 $1,243.0 ($1,064.6) $22,066.9
Working Capital $3,331.5 ($3,331.5) 0
Cash Flow ($20,585.6) $11,363.8 $16,539.0 $10,645.9 $9,982.0 $27,945.2
Cumulative Cash Flow ($20,585.6) ($9,221.8) $7,317.2 $17,963.1 $27,945.2
Net Present Value (5%) $21,568.6
IRR 48.0% 22.2 Pre-Tax Sensitivity The project sensitivities to changes in metal price, operating cost, and capital cost were evaluated. Table 22.2 shows the project sensitivity to silver price. Table 22.3 shows the sensitivity to changes in operating cost, while Table 22.4 shows the sensitivity to changes in capital cost.
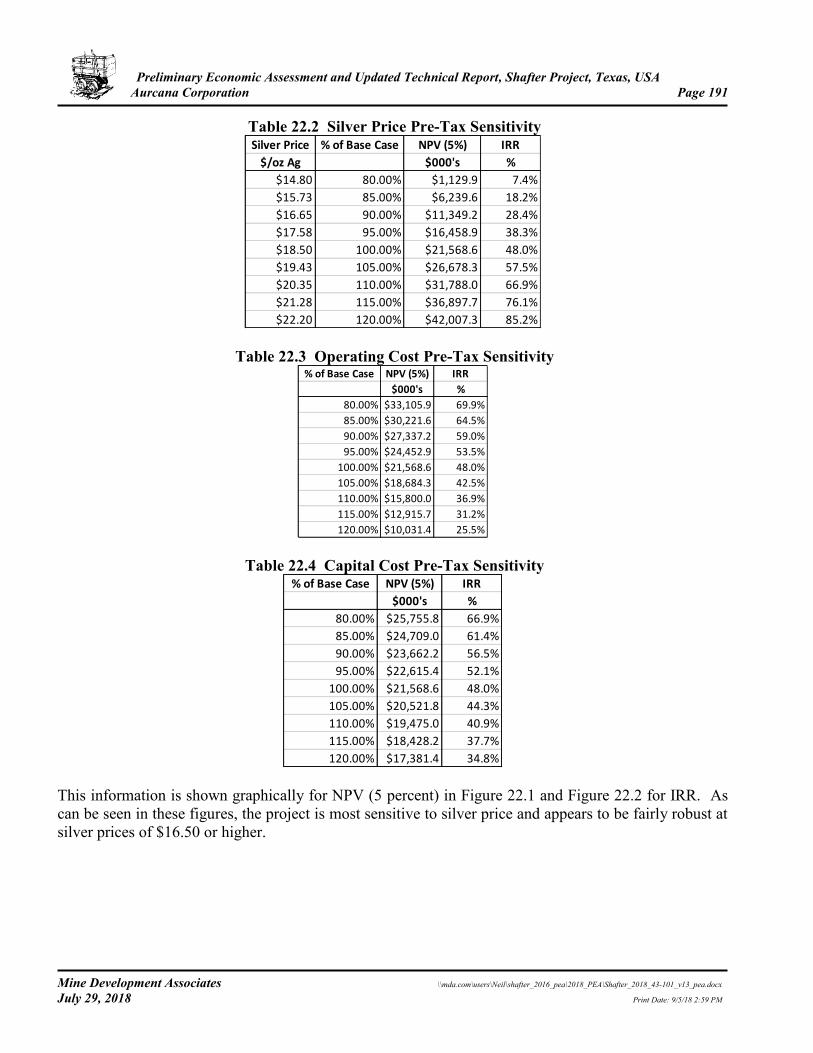
Preliminary Economic Assessment and Updated Technical Report, Shafter Project, Texas, USA Aurcana Corporation Page 191
Mine Development Associates \\mda.com\users\Neil\shafter_2016_pea\2018_PEA\Shafter_2018_43-101_v13_pea.docx July 29, 2018 Print Date: 9/5/18 2:59 PM
Table 22.2 Silver Price Pre-Tax Sensitivity Silver Price % of Base Case NPV (5%) IRR
$/oz Ag $000's %
$14.80 80.00% $1,129.9 7.4%
$15.73 85.00% $6,239.6 18.2%
$16.65 90.00% $11,349.2 28.4%
$17.58 95.00% $16,458.9 38.3%
$18.50 100.00% $21,568.6 48.0%
$19.43 105.00% $26,678.3 57.5%
$20.35 110.00% $31,788.0 66.9%
$21.28 115.00% $36,897.7 76.1%
$22.20 120.00% $42,007.3 85.2%
Table 22.3 Operating Cost Pre-Tax Sensitivity % of Base Case NPV (5%) IRR
$000's %
80.00% $33,105.9 69.9%
85.00% $30,221.6 64.5%
90.00% $27,337.2 59.0%
95.00% $24,452.9 53.5%
100.00% $21,568.6 48.0%
105.00% $18,684.3 42.5%
110.00% $15,800.0 36.9%
115.00% $12,915.7 31.2%
120.00% $10,031.4 25.5%
Table 22.4 Capital Cost Pre-Tax Sensitivity % of Base Case NPV (5%) IRR
$000's %
80.00% $25,755.8 66.9%
85.00% $24,709.0 61.4%
90.00% $23,662.2 56.5%
95.00% $22,615.4 52.1%
100.00% $21,568.6 48.0%
105.00% $20,521.8 44.3%
110.00% $19,475.0 40.9%
115.00% $18,428.2 37.7%
120.00% $17,381.4 34.8% This information is shown graphically for NPV (5 percent) in Figure 22.1 and Figure 22.2 for IRR. As can be seen in these figures, the project is most sensitive to silver price and appears to be fairly robust at silver prices of $16.50 or higher.
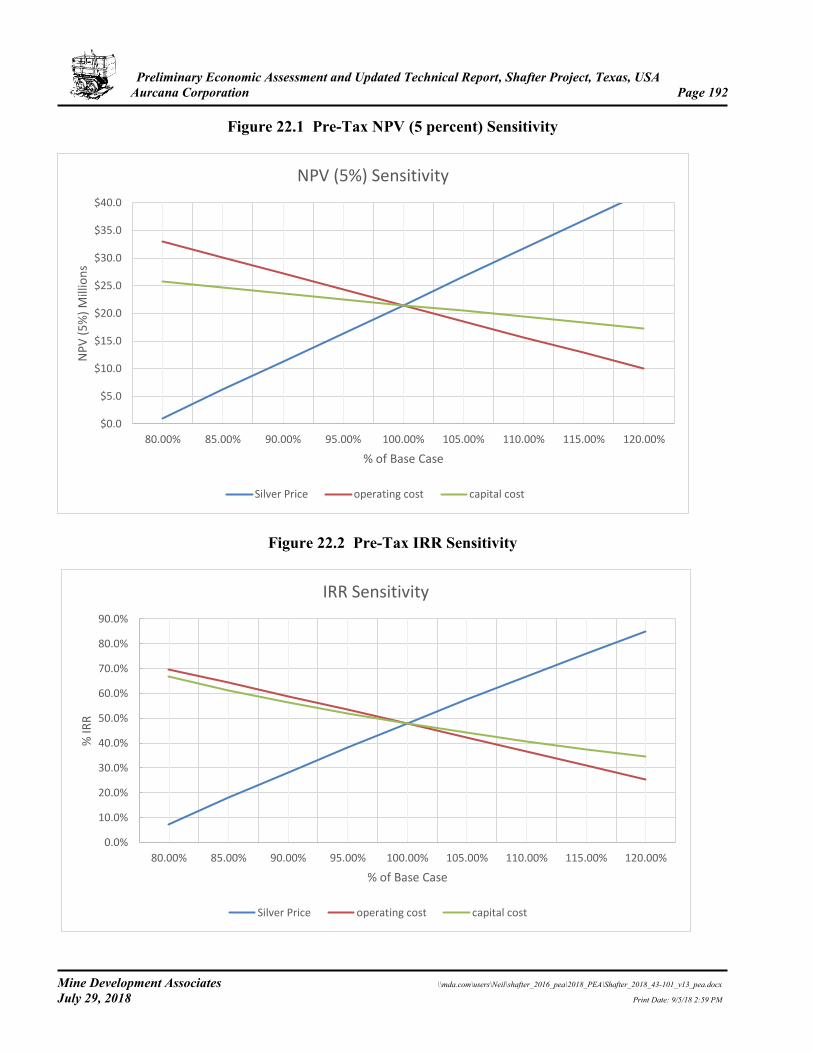
Preliminary Economic Assessment and Updated Technical Report, Shafter Project, Texas, USA Aurcana Corporation Page 192
Mine Development Associates \\mda.com\users\Neil\shafter_2016_pea\2018_PEA\Shafter_2018_43-101_v13_pea.docx July 29, 2018 Print Date: 9/5/18 2:59 PM
Figure 22.1 Pre-Tax NPV (5 percent) Sensitivity
Figure 22.2 Pre-Tax IRR Sensitivity
$0.0
$5.0
$10.0
$15.0
$20.0
$25.0
$30.0
$35.0
$40.0
80.00% 85.00% 90.00% 95.00% 100.00% 105.00% 110.00% 115.00% 120.00%
NP
V (
5%
) M
illio
ns
% of Base Case
NPV (5%) Sensitivity
Silver Price operating cost capital cost
0.0%
10.0%
20.0%
30.0%
40.0%
50.0%
60.0%
70.0%
80.0%
90.0%
80.00% 85.00% 90.00% 95.00% 100.00% 105.00% 110.00% 115.00% 120.00%
% IR
R
% of Base Case
IRR Sensitivity
Silver Price operating cost capital cost
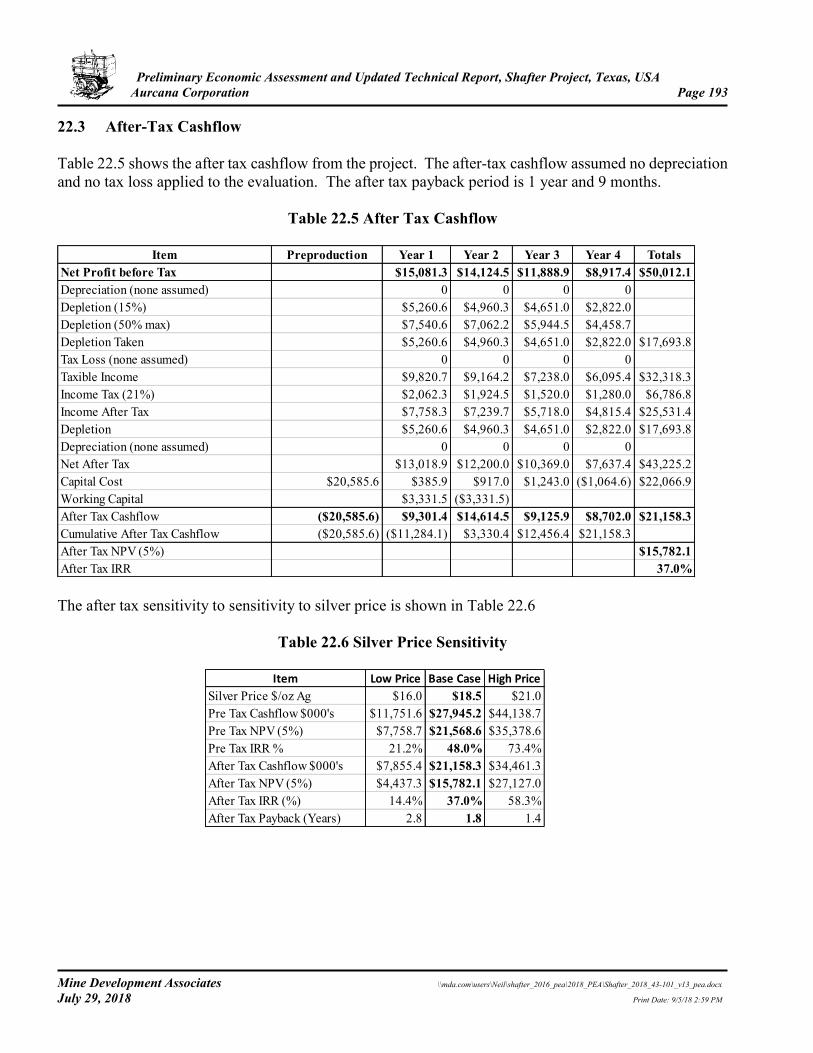
Preliminary Economic Assessment and Updated Technical Report, Shafter Project, Texas, USA Aurcana Corporation Page 193
Mine Development Associates \\mda.com\users\Neil\shafter_2016_pea\2018_PEA\Shafter_2018_43-101_v13_pea.docx July 29, 2018 Print Date: 9/5/18 2:59 PM
22.3 After-Tax Cashflow Table 22.5 shows the after tax cashflow from the project. The after-tax cashflow assumed no depreciation and no tax loss applied to the evaluation. The after tax payback period is 1 year and 9 months.
Table 22.5 After Tax Cashflow
Item Preproduction Year 1 Year 2 Year 3 Year 4 TotalsNet Profit before Tax $15,081.3 $14,124.5 $11,888.9 $8,917.4 $50,012.1Depreciation (none assumed) 0 0 0 0Depletion (15%) $5,260.6 $4,960.3 $4,651.0 $2,822.0Depletion (50% max) $7,540.6 $7,062.2 $5,944.5 $4,458.7Depletion Taken $5,260.6 $4,960.3 $4,651.0 $2,822.0 $17,693.8Tax Loss (none assumed) 0 0 0 0Taxible Income $9,820.7 $9,164.2 $7,238.0 $6,095.4 $32,318.3Income Tax (21%) $2,062.3 $1,924.5 $1,520.0 $1,280.0 $6,786.8Income After Tax $7,758.3 $7,239.7 $5,718.0 $4,815.4 $25,531.4Depletion $5,260.6 $4,960.3 $4,651.0 $2,822.0 $17,693.8Depreciation (none assumed) 0 0 0 0Net After Tax $13,018.9 $12,200.0 $10,369.0 $7,637.4 $43,225.2Capital Cost $20,585.6 $385.9 $917.0 $1,243.0 ($1,064.6) $22,066.9Working Capital $3,331.5 ($3,331.5)After Tax Cashflow ($20,585.6) $9,301.4 $14,614.5 $9,125.9 $8,702.0 $21,158.3Cumulative After Tax Cashflow ($20,585.6) ($11,284.1) $3,330.4 $12,456.4 $21,158.3After Tax NPV (5%) $15,782.1After Tax IRR 37.0% The after tax sensitivity to sensitivity to silver price is shown in Table 22.6
Table 22.6 Silver Price Sensitivity
Item Low Price Base Case High Price
Silver Price $/oz Ag $16.0 $18.5 $21.0Pre Tax Cashflow $000's $11,751.6 $27,945.2 $44,138.7Pre Tax NPV (5%) $7,758.7 $21,568.6 $35,378.6Pre Tax IRR % 21.2% 48.0% 73.4%After Tax Cashflow $000's $7,855.4 $21,158.3 $34,461.3After Tax NPV (5%) $4,437.3 $15,782.1 $27,127.0After Tax IRR (%) 14.4% 37.0% 58.3%After Tax Payback (Years) 2.8 1.8 1.4
Preliminary Economic Assessment and Updated Technical Report, Shafter Project, Texas, USA Aurcana Corporation Page 194
Mine Development Associates \\mda.com\users\Neil\shafter_2016_pea\2018_PEA\Shafter_2018_43-101_v13_pea.docx July 29, 2018 Print Date: 9/5/18 2:59 PM
23.0 ADJACENT PROPERTIES MDA is not aware of any notable nearby properties.
Preliminary Economic Assessment and Updated Technical Report, Shafter Project, Texas, USA Aurcana Corporation Page 195
Mine Development Associates \\mda.com\users\Neil\shafter_2016_pea\2018_PEA\Shafter_2018_43-101_v13_pea.docx July 29, 2018 Print Date: 9/5/18 2:59 PM
24.0 OTHER RELEVANT DATA AND INFORMATION MDA is not aware of other relative data or information on the Shafter Project.
Preliminary Economic Assessment and Updated Technical Report, Shafter Project, Texas, USA Aurcana Corporation Page 196
Mine Development Associates \\mda.com\users\Neil\shafter_2016_pea\2018_PEA\Shafter_2018_43-101_v13_pea.docx July 29, 2018 Print Date: 9/5/18 2:59 PM
25.0 INTERPRETATION AND CONCLUSIONS The PEA summarized in this technical report contains adequate detail and information to support the positive economic outcome for the Shafter project. Using the assumptions contained in this report, the project is shows favorable economics and should proceed to the pre-feasibility stage, but additional work is necessary to improve the classification of Inferred resources and to confirm the PEA results. Mr. Tietz has reviewed the project data and the Shafter drill-hole database and has visited the project site. Mr. Tietz believes that the data provided by Aurcana are generally an accurate and reasonable representation of the Shafter silver deposit. The Shafter deposit has been extensively drilled from both the surface and underground by Amax, Gold Fields, and RGMC (both before and after the company’s acquisition by Aurcana). Since publication of the previous technical reports, about 800 holes have been added to the database, including a considerable number of historic Amax and Gold Fields holes, as well as the new holes drilled by Aurcana since 2011. The database used for the current mineral resource estimate includes 1,694 holes totaling over 466,000ft of drilling. The silver mineralization in the Shafter deposits occurs as a sub-horizontal manto deposit, hosted by variably silicified limestone that lies at, or just below, the Permian/Cretaceous unconformity. Although silver mineralization is generally continuous along the 13,000ft length of the deposit, the resource is fragmentary in the vicinity of the historic Presidio mine due to the removal of mined-out material. The resource is also fragmented west of the historic Presidio mine underground development at the 4oz Ag/ton cutoff. The more fragmented nature of the Presidio mineralization does add more risk than mining in the more continuous Shafter mine area mineralization. Mr. Tietz and Mr. Prenn believes that the most important items that are required for completion of a pre-feasibility or feasibility study are the completion of a cavity survey of the old Presidio workings and to improve the classification of inferred materials to measured or indicated. The old Presidio workings have not been surveyed. To complete the cavity survey some rehabilitation of the old workings may be required. While completing the cavity survey, it is suggested that it be followed by plotting level plans and putting the sample data that is recorded on the walls on maps. This information may be very helpful in finding additional areas and limiting projections of identified mineralization. Additional infill drilling, increased underground mapping and sampling, and more density measurements are necessary to bring greater confidence to the current mineral resource estimate. Both surface and underground drilling are required to improve the classification of inferred materials to indicated or measured classifications. Purchase of an underground core drill should be considered. 25.1 Process The Shafter operations from 2011 to 2013 suffered from poor recovery of metals after extraction in the leach circuit due to solution losses in the tails stream. Flowsheet alterations through the addition of a CCD wash circuit and recycling of silver streams to the leach circuit improves the overall recovery significantly by mitigating loss of silver bearing solution to tails. Liquid solid separation tests performed by Pocock
Preliminary Economic Assessment and Updated Technical Report, Shafter Project, Texas, USA Aurcana Corporation Page 197
Mine Development Associates \\mda.com\users\Neil\shafter_2016_pea\2018_PEA\Shafter_2018_43-101_v13_pea.docx July 29, 2018 Print Date: 9/5/18 2:59 PM
showed good thickening and filtration properties for this shafter mineralized material. Recovery of leached metals efficiency in the CCD circuit combined with filtration wash and recycle streams are anticipated to be above 99%. Overall recovery predictions are based on a combination of the anticipated leach extraction as well as the recovery of silver through CCD thickening and filtration wash of the leach residue which recovers the solubilized (extracted) silver. For the current study with a LOM silver head grade of 10.3 troy ounces per ton, leach extraction is predicted to be 85.7 percent. After extraction, the combined efficiency of the CCD circuit and filters is expected to be 99.6 percent and overall recovery of silver to saleable product is 85.4 percent. 25.2 Risks The main risks to the project are the current definition of the size and shape of the minable areas. In the Presidio mine, the old Presidio workings have not been surveyed or mapped. In the Shafter mine, the drilling has been too widely spaced to adequately define the shape of the potentially minable mineralization. Improve definition of the mineralization will negate this risk. Attracting sufficient skilled workers to the Shafter project for the estimated labor rates is considered to be a risk. Historical operations and testwork show that 1.5 troy ounces per ton silver tails grade are a reliable figure to use for the expected leach extraction recoveries at the recommended and historic leach feed grind size of 80 percent passing 74 micrometers (P80 = 74 µm) due to occluded silver unobtainable above 10 micrometers. However, there are some indications from the recent test data that there may be some slip to higher tails. This appears to be related to the higher head grades in samples that were tested. Additional metallurgical test work is recommended to resolve this risk. A 3000 horsepower mill is at site and is considered for this study to be capable of performing the grinding requirements for this process. This study is at a reduced rate from the original mill design. The current flowsheet requires only about 1000 hp to achieve the grind of P80 = 75 µm. Lower grinding ball loading is planned for reducing the power draw and producing the 75 micrometer product. There is a risk that the larger than required ball mill could over grind the material and cause issues with downstream liquid solid separation processes. This could affect the wash efficiency of the CCD thickeners The costs associated with refurbishing and re-starting a facility that has been sitting idle for several years is very difficult to ascertain, and is something that can be notoriously under-estimated. Issues with the condition of a piece of equipment are often not detectable without detailed mechanical and electrical inspections which sometimes require testing and/or disassembly. Much of the existing tanks and platework were never painted. After several years of sitting empty, the steel plates of tanks have been oxidizing from both sides. An evaluation may need to be done to determine if the tanks are still competent enough to be re-used.
Preliminary Economic Assessment and Updated Technical Report, Shafter Project, Texas, USA Aurcana Corporation Page 198
Mine Development Associates \\mda.com\users\Neil\shafter_2016_pea\2018_PEA\Shafter_2018_43-101_v13_pea.docx July 29, 2018 Print Date: 9/5/18 2:59 PM
The installation of used thickeners that are now 30-years old may be more difficult than anticipated. The ease of assembly will depend heavily upon how and where the equipment has been stored (both at the current storage location as well as at previous locations). 25.3 Opportunities Improving the definition of the mineralization may also lead to improvement in head grade and size of the potentially minable shapes. The short life of the mine may offer opportunities to consider leasing equipment, or purchase of some used equipment for the project. Because the Shafter Project is reusing most of the equipment and reducing the throughput from the 2011 to 2013 operational design, there is an opportunity to use some of that for process advantage. Past metallurgical testing indicates that improved recovery may be seen if the grind product size were brought to 53 or 43 micrometers. Testing might show that since the milling power is available, advantage may be taken of the full milling capacity to improve recovery.
Preliminary Economic Assessment and Updated Technical Report, Shafter Project, Texas, USA Aurcana Corporation Page 199
Mine Development Associates \\mda.com\users\Neil\shafter_2016_pea\2018_PEA\Shafter_2018_43-101_v13_pea.docx July 29, 2018 Print Date: 9/5/18 2:59 PM
26.0 RECOMMENDATIONS A number of activities are proposed to advance the Shafter project prior to developing a new mine plan and converting the estimated mineral resources into mineral reserves. In addition to delineation drilling and sampling to upgrade the classification of inferred materials, work required to support this effort includes rehabilitation and cavity surveying of the old mine workings where required. The estimated total cost of these activities is about $1 million. The proposed activities are:
• Rehabilitate the existing workings and complete a cavity survey of the Presidio Mine workings. This work is believed to be necessary to improve the accuracy of mined material and mineralized material remaining in the mine;
• Consider the purchase an underground core drill;
• Rehabilitate Presidio workings as necessary and complete limited drifting to enable drilling of core holes to improve the classification of Presidio resources;
• Map the Presidio workings and place the assay data that is painted on the ribs of the workings on maps that have been updated with the cavity survey;
• Complete geotechnical investigations to establish design stope dimensions and a ground control management plan;
• Complete hydrogeological investigations to determine expected water inflow by mine area. Dewater the Shafter area and inspect the existing workings;
• Drill 16 holes (pre-drilled by RC or rotary to 700ft, then core) to test the zone east of mine-grid 53750. The primary objective of this in-fill drill program is to obtain geotechnical data, samples for metallurgical testing, and rock density measurements. A secondary objective is to test for continuity and extensions of the high-grade domain (domain code 200) to the southeast;
• Re-examine historical drill-hole data with respect to collar locations, particularly underground;
• Update the database with historical channel-sample information and re-sample some locations to confirm historical results;
• Re-examine and compile historical information from Amax and Gold Fields; o Develop both level plans and sections that map mineral domains and rock types and that
document the continuity of faults and dikes. o Compile results of Gold Fields’ underground core drilling and sludge, panel, and bulk
sampling.
• Develop an accurate survey of the project’s land holdings with respect to proposed development activities. Plot the land holdings on the same grid as the grade model.
• SE recommends that testing be performed on samples representative of the mine plan. Since extensive test-work has been very consistent on comminution studies as well as tailings observations that have established occlude silver in the sub 10 micron solids, SE recommends that
Preliminary Economic Assessment and Updated Technical Report, Shafter Project, Texas, USA Aurcana Corporation Page 200
Mine Development Associates \\mda.com\users\Neil\shafter_2016_pea\2018_PEA\Shafter_2018_43-101_v13_pea.docx July 29, 2018 Print Date: 9/5/18 2:59 PM
a bottle roll leach campaign be performed on these composite samples at the recommended grind size. Bottle roll testing at one grind size (P80=74 µm) on 4 composite samples by year (i.e. year 1 composite, year 2-3 composite, year 4-5 composite, and year 6+ composite). Pricing for three bottle rolls on each of composites (12 bottle rolls) is expected to be in the range of $20,000 to $30,000. SE recommends that the client consider further testing on the same composites to examine the benefits and disadvantages of finer grinding since that option is available with the current mill proposed in this study. Grind size versus recovery bottle roll testing, as well as thickening and pressure filtration testwork should be performed to examine this opportunity. Grind size versus recovery should include a minimum of the achievable grind P80 characteristic distributions of 43 and 53 micrometers. This would require 24 grind and bottle roll test which would cost in the range of $40,000 to $60,000;
• SE recommends that Liquid solid separation testing on the different grind sizes of each of the composites should also be performed. The cost for 8 samples will be about $ 43,200;
• SE recommends that qualified person be consulted to evaluate the thickeners to determine if refurbishment and/or upgrading of key components is necessary to achieve the thickening performance predicted by the Pocock testwork;
The estimated cost of the recommended work is tabulated in Table 26.1
Table 26.1 Estimated Cost of Recommended Work Program
Item Estimated CostPreliminary Mine Rehabilitation & Mapping $100,000Mine and Cavity Survey $100,000Goldfield Shaft Dewatering $50,000Hydrological Studies $50,000Metallurgical Testwork $100,000Geotechnical Studies $50,000Drilling $500,000Surveying and Geological Services $50,000
Totals $1,000,000
At the conclusion of this recommended work program, the project should be re-evaluated. If the project continues to appear positive, a pre-feasibility or feasibility study shoud be completed with an updated resource estimate. MDA believes that the Shafter project is a project of merit and warrants the program proposed by Aurcana and the level of expenditures outlined above.
Preliminary Economic Assessment and Updated Technical Report, Shafter Project, Texas, USA Aurcana Corporation Page 201
Mine Development Associates \\mda.com\users\Neil\shafter_2016_pea\2018_PEA\Shafter_2018_43-101_v13_pea.docx July 29, 2018 Print Date: 9/5/18 2:59 PM
27.0 REFERENCES American Mines Services, 1982 (June), Feasibility Study for Gold Fields Operating Company; Shafter
Silver Mine, Shafter, Texas: volume 1, 136 p.; volume 2: 172 p. Balfour Holdings, Inc., 2000 (May), Shafter manto silver deposit, Red Hills porphyry copper-molybdenum
deposit, Shafter, Texas: Internal company report, 52 p. plus appendices, including portions of a report dated 2000 by Pincock, Allen & Holt.
Bokich, J. C., 2014 (March), Closure and reclamation report and cost estimate for the Shafter silver mine,
Presidio County, Texas, USA: Report prepared for Rio Grande Mining Company by Durán Bokich Enterprises, LLC, 18 p.
Burgess, J., 1998 (September), Shafter-Presidio silver property; underground mine operating concepts &
cost estimates for Blocks I & II detailed by infrastructure updating, shaft & underground rehabilitation, additional mine development, production methods, capital & operating costs: Report prepared for Rio Grande Mining Company.
Burgess, J. W., 2011 (November 2010, amended June 23, 2011), Technical report on Shafter feasibility
study, Presidio County, Texas, USA: Report prepared for Aurcana Corporation, 204 p. plus appendices.
Corbett, R. K., 1979 (October 8), Letter to Gold Fields Mining Corporation from Colorado School of
Mines Research Institute regarding results of mineralogical examination of 12 Shafter samples, 10 p. plus attachments.
Cracraft, B. E., and Williams, W. B., 1982 (July 6), Ore reserve study – Shafter mine – June 1982: Internal
memorandum of Gold Fields Operating Co., Shafter, 8 p. Gault Group, LLC., 2010 (June), Rio Grande Mining Company, Shafter silver mine, Presidio County,
Texas; Solid Waste Registration Number 31623, Customer Reference Number 600495493, Regulated Entity Number 100812502, Industrial Solid Waste Management Notification and Supporting Information Pursuant to: 30 Texas Administrative Code 335.2(d) and 335.6(a): 43 p. plus attachments.
Gilmer, A. K., Kyle, J. R., Connelly, J. N., Mathur, R. D., and Henry, C. D., 2003, Extension of Laramide
magmatism in southwestern North America into Trans-Pecos Texas: Geology, v. 31, no. 5, p. 447-450.
Gold Fields Mining Corporation, 1982 (September), Economic Feasibility Study for the Shafter Silver
Mine, Shafter, Texas: 172 p. Gold Fields Operating Co. – Shafter, undated but thought to be about 1981 or 1982, Shafter mine sampling
system: Internal report of Gold Fields Operating Co., 9 p. plus attachments.
Preliminary Economic Assessment and Updated Technical Report, Shafter Project, Texas, USA Aurcana Corporation Page 202
Mine Development Associates \\mda.com\users\Neil\shafter_2016_pea\2018_PEA\Shafter_2018_43-101_v13_pea.docx July 29, 2018 Print Date: 9/5/18 2:59 PM
Head, J. A., 2002, Stratigraphic and structural controls of Permian carbonate-hosted silver (Pb-Zn) mineralization, Shafter, Presidio County, Texas: M. S. thesis, University of Texas at Austin, 214 p.
Helming, B. H., 1983 (May 4), Hinton project 40-01, 1983 drilling results: Duval Corp. inter-office
memorandum, 13 p. plus attachments. Kappes, Cassiday & Associates, 2004 (July), Shafter silver project scoping study, 324,000 ton per year
CCD mill: Report prepared for Silver Standard Resources Inc. Kastelic, R. L., 1983 (October), Summary report of the Shafter project, Presidio County, Texas: Report
prepared by Gold Fields Mining Corp., 23 p. Knox, W. P., 1983 (April 14), Correspondence from Gold Fields Mining Corporation to Duval
Corporation regarding controlled-source audio magnetotelluric surveying of the Red Hills area, 1 p. plus attachments.
Lambeck, L., 2012, 2012 Aurcana exploration: Internal report prepared for Aurcana Corporation, 38 p. Lambeck, L., Stockhausen, T., and O’Neill, C., 2013 (August 19), Final report of work conducted summer
2013, Rio Grande Mining Company: Internal report prepared for Aurcana Corporation, 5 p. Megaw, P. K. M., Ruiz, J., and Titley, S. R., 1998, High-temperature, carbonate-hosted Ag-Pb- Zn(Cu)
deposits of northern Mexico: Economic Geology, vol. 83, no. 8, p. 1856-1885. Naylor, R. G., 1982 (November 12), Gold Fields/Duval joint venture, Shafter, Presidio County, Texas;
monthly exploration report, October, 1982: Report prepared by Gold Fields Mining Corp. for Duval Corp., 3 p.
Pincock, Allen & Holt, 2000a (February 2), DRAFT of a report on the Shafter project prepared for Rio
Grande Mining Company, 30 p. Pincock, Allen & Holt, 2000b (May 11), DRAFT of a report on the Shafter project prepared for Rio
Grande Mining Company, 30 p. Reyes, A. T., and Rohr, D. M., 2013, Depositional setting of the basal Presidio Formation (Lower
Cretaceous), at the Rio Grande Mining Company Shafter silver mine, west Texas [abs.]: Geological Society of America Abstracts with Programs, v. 45, no. 7, p. 126, and accompanying poster from Poster Session.
Rio Grande Mining Company, 1998a (April), Summaries of RGMC pre-feasibility studies for the
Shafter/Presidio – Red Hills mineral district: Internal Rio Grande Mining Company report, 7 p. Rio Grande Mining Company, 1998b (September), Shafter-Presidio-Red Hills mineral district (Presidio
County, Texas); project descriptions, summaries & economics of current pre-feasibility studies + ongoing studies & permitting activities: Internal Rio Grande Mining Company report.
Preliminary Economic Assessment and Updated Technical Report, Shafter Project, Texas, USA Aurcana Corporation Page 203
Mine Development Associates \\mda.com\users\Neil\shafter_2016_pea\2018_PEA\Shafter_2018_43-101_v13_pea.docx July 29, 2018 Print Date: 9/5/18 2:59 PM
Ross, C. P., 1943, Geology and ore deposits of the Shafter mining district, Presidio County, Texas: U. S. Geological Survey Bulletin 928-B, p 45-125.
Ross, C. P. and Cartwright, W. E., 1935, Preliminary report on the Shafter mining district, Presidio
County, Tex., in The geology of Texas; structural and economic geology: Texas Bureau of Economic Geology, Texas University Bulletin 3401, v. II, p. 573-608.
Rossi, M. E., and Springett, M., 1995 (December), Shafter silver project resource estimation report,
Presidio County, Texas: Report prepared by GeoSystems International and Altamira Mining and Exploration LLC for Rio Grande Mining Co., 28 p.
Rozelle, J. W., 2001 (April 10), Shafter silver project technical report: Report prepared for Silver
Standard Resources Inc. by Pincock, Allen & Holt, 69 p. Rozelle, J. W., and Tschabrun, D. B., 2008 (June 30), Shafter silver project, Presidio County, Texas USA:
Technical Report prepared for Aurcana Corp. by Tetra Tech Inc., 61 p. Shannon, R. W., 2012 (July 30), Analysis of silver mineralogy in two drill cores from the Shafter mine:
Report prepared for Rio Grande Mining Company by Pittsburgh Mineral & Environmental Technology, Inc., 33 p.
Silver, D. B., 1999, Finding the silver lining in Shafter, Texas: Mining Engineering, v. 51, p. 28-32. Smith, J. C., 2011 (January 17; accessed), Shafter mining district: Handbook of Texas Online
((http://www.tshaonline.org/handbook/online/articles/gps02), published by the Texas State Historical Association.
Springett, M. W., 1984, Sampling practices and problems, Chapter 14 in Applied Mining Geology, A. J.
Erickson, editor, Society of Mining Engineers of the AIME, p. 189-195. Tietz, P., and MacFarlane, R., 2016, Technical Report on the Shafter Silver Project, Presidio County,
Texas: Technical Report prepared for Aurcana Corp. by Mine Development Associates, 140p. Tong, F., and Legault, J., 2011 (July), Report on a helicopter-borne Z-axis Tipper electromagnetic
(ZTEM) and aeromagnetic geophysical survey, Shafter project, Shafter, Texas: Report prepared by Geotech Ltd. for Aurcana Corporation.
von Fersen, N., Lambbeck, L., Harris, R., Stockhausen, T., Sonnier, S., and O’Neill, C., 2013 (August
26), 2013 exploration program, Aurcana Corporation, Shafter project: Internal Powerpoint presentation of Aurcana Corporation.
West Texas County Courier, 2012 (June 21), New owner reopens Shafter silver mine, v. 39, no. 25, p. 1-
2.
Preliminary Economic Assessment and Updated Technical Report, Shafter Project, Texas, USA Aurcana Corporation Page 204
Mine Development Associates \\mda.com\users\Neil\shafter_2016_pea\2018_PEA\Shafter_2018_43-101_v13_pea.docx July 29, 2018 Print Date: 9/5/18 2:59 PM
The following additional references were not reviewed by MDA but are cited in the text: Allis-Chalmers, 1982 (April), Test Report No 82-046. Bogle, L. L., 2000, Depositional environments and paleogeography of the Permian of the Shafter, Texas
area: M. S. thesis, Sul Ross State University, 80 p. Hazen Research Incorporated, 1982 (May), Metallurgical Investigation of Shafter Silver Ore. Kappes, Cassiday & Associates, 1998 (July), Shafter-Presidio Silver Project Report of Metallurgical
Testwork. Reyna Mining Engineering, 2009 (January 9), Shafter Project Cyanide Leaching Test Report. Rio Grande Mining Company, 1997 (December), Summaries of Prefeasibility Studies with Estimated
Costs & Cash Generation for the Shafter/Presidio Silver Project and The Red Hills Copper/Moly Project.
Rio Grande Mining Company, 2000 (March), Shafter-Presidio-Red Hills Mineral District, Project
Descriptions, Summaries of Economics for Latest Field and Engineering Studies plus Description of Permitting Activities: 74 p.
Stearns-Roger, 1982 (July), Feasibility Study for Gold Fields Operating Company, Shafter Silver Plant
and Mill, Shafter, Texas; Vol. 1 & Vol. 2.
Preliminary Economic Assessment and Updated Technical Report, Shafter Project, Texas, USA Aurcana Corporation Page 205
Mine Development Associates \\mda.com\users\Neil\shafter_2016_pea\2018_PEA\Shafter_2018_43-101_v13_pea.docx July 29, 2018 Print Date: 9/5/18 2:59 PM
28.0 DATE AND SIGNATURE PAGE Effective Date of report: July 11, 2018 Completion Date of report: July 29, 2018 “Paul Tietz” July 29, 2018 Paul Tietz, C.P.G. Date Signed “Neil Prenn” July 29, 2018 Neil Prenn, P.E., Registered Member MMSA Date Signed “Bill Tilley July 29, 2018 Bill Tilley, P.E. Date Signed “Matt Bender July 29, 2018 Matt Bender, P.E., Registered Member, MMSA Date Signed “Martin J. DeMarse July 29, 2018 Martin J. DeMarse, P.E. Date Signed
Preliminary Economic Assessment and Updated Technical Report, Shafter Project, Texas, USA Aurcana Corporation Page 206
Mine Development Associates \\mda.com\users\Neil\shafter_2016_pea\2018_PEA\Shafter_2018_43-101_v13_pea.docx July 29, 2018 Print Date: 9/5/18 2:59 PM
29.0 CERTIFICATE OF QUALIFIED PERSON Paul Tietz, C.P.G. I, Paul Tietz, C.P.G., do hereby certify that:
1. I am currently employed as Senior Geologist for Mine Development Associates, Inc. located at 210 South Rock Blvd., Reno, Nevada 89502 and
2. I graduated with a Bachelor of Science degree in Biology/Geology from the University of Rochester in 1977, a Master of Science degree in Geology from the University of North Carolina, Chapel Hill in 1981, and a Master of Science degree in Geological Engineering from the University of Nevada, Reno in 2004.
3. I am a Certified Professional Geologist (#11004) with the American Institute of Professional Geologists and have worked as a geologist in the mining industry for more than 35 years. Relevant experience includes exploration and project development of carbonate-hosted precious metal deposits deposit in the western U.S. Also, I have been involved for more than 9 years in resource modeling and estimation for open pit and underground mining projects.
4. I have read the definition of “qualified person” set out in National Instrument 43-101 (“NI 43-101”). I certify that by reason of my education, affiliation with certified professional associations, and past relevant work experience, I fulfill the requirements to be a “qualified person” for the purposes of NI 43-101.
5. I am one of the authors of this technical report titled “Preliminary Economic Assessment and Updated Technical Report on the Shafter Project, Presidio County, Texas” prepared for Aurcana Corp., with and effective date of July 11, 2018. Subject to those issues discussed in Section 3.0, I am responsible for Section 2 through 12, 14, and take co-responsibility for Sections 1 and 25 and 26 of the Technical Report.
6. I have had prior involvement with the Shafter project in the early 1980s while an employee of a previous operator. Pertaining to my role as author and qualified person for this Technical Report, I visited the Shafter project site on January 30 and 31, 2013 and May 21 through May 25, 2013.
7. To the best of my knowledge, information and belief, the technical report contains the necessary scientific and technical information to make the technical report not misleading.
8. I am independent of Aurcana Corp. and related companies applying all of the tests in Section 1.5 of National Instrument 43-101 and in Section 1.5 of the Companion Policy to NI 43-101.
9. I have read National Instrument 43-101 and Form 43-101F1, and the Technical Report has been prepared in accordance with the requirements of that instrument and form.
Dated this 24th day of July 2018 “Paul Tietz” Signature of Qualified Person Paul Tietz Print Name of Qualified Person
Preliminary Economic Assessment and Updated Technical Report, Shafter Project, Texas, USA Aurcana Corporation Page 207
Mine Development Associates \\mda.com\users\Neil\shafter_2016_pea\2018_PEA\Shafter_2018_43-101_v13_pea.docx July 29, 2018 Print Date: 9/5/18 2:59 PM
CERTIFICATE OF QUALIFIED PERSON Neil Prenn I, Neil Prenn, P.E., do hereby certify that:
1. I am currently employed as Principle Engineer for Mine Development Associates, Inc. located at 210 South Rock Blvd., Reno, Nevada 89502 and
2. I graduated with a Engineer of Mines degree from the Colorado School of Mines in 1967. 3. I am a Professional Engineer registered in the state of Nevada (#7844), and a registered
qualified person with MMSA. Relevant experience includes mining exploration, project development, underground construction and mine ventilation. Also, as a mining engineer I have been involved for more than 50 years in mine design, mine planning and project evaluation for open pit and underground mining projects.
4. I have read the definition of “qualified person” set out in National Instrument 43-101 (“NI 43-101”). I certify that by reason of my education, affiliation with certified professional associations, and past relevant work experience, I fulfill the requirements to be a “qualified person” for the purposes of NI 43-101.
5. I am one of the authors of this technical report titled “Preliminary Economic Assessment and Updated Technical Report on the Shafter Project, Presidio County, Texas” prepared for Aurcana Corp., with and effective date of July, 11, 2018. Subject to those issues discussed in Section 3.0, I am responsible for Sections 2-6. 15, 19, and Sections 22 through 24 and take co-responsibility for Sections 1, 21, 25 through 27 of the Technical Report.
6. I have had prior involvement with the property that is the subject of this Technical Report. I visited the Shafter project site on June 10, 2016. I was an author of prior Technical Reports on the property
7. To the best of my knowledge, information and belief, the technical report contains the necessary scientific and technical information to make the technical report not misleading.
8. I am independent of Aurcana Corp. and related companies applying all of the tests in Section 1.5 of National Instrument 43-101 and in Section 1.5 of the Companion Policy to NI 43-101.
9. I have read National Instrument 43-101 and Form 43-101F1, and the Technical Report has been prepared in accordance with the requirements of that instrument and form.
Dated this July 29, 2018 “Neil Prenn” Signature of Qualified Person Neil Prenn P.E. Print Name of Qualified Person
Preliminary Economic Assessment and Updated Technical Report, Shafter Project, Texas, USA Aurcana Corporation Page 208
Mine Development Associates \\mda.com\users\Neil\shafter_2016_pea\2018_PEA\Shafter_2018_43-101_v13_pea.docx July 29, 2018 Print Date: 9/5/18 2:59 PM
CERTIFICATE OF QUALIFIED PERSON Bill Tilley I, William A. Tilley, P.E., do hereby certify that: 1. I am currently employed the Director of Engineering by Cementation USA Inc., 10150 Centennial
Blvd., Sandy UT 84070 and: 2. I graduated with a Bachelor of Science degree in Mining Engineering in 1988 from the Montana
School of Mines, Butte, Montana. I have worked as a mining engineer for 30 years since my graduation. Relevant experience includes mining exploration, mine design, project development, underground construction, and project valuation for underground projects.
3. I am a Professional Engineer (#023216) licensed in the State of Nevada, and I am a Registered Member (#4033387RM) of the Society of Mining, Metallurgy and Exploration.
4. I have read the definition of “qualified person” set out in National Instrument 43-101 (“NI 43-101”) and certify that by reason of my education, affiliation with a professional association and past relevant work experience, I fulfill the requirements to be a “qualified person” for the purposes of NI 43-101.
5. I am independent of Aurcana Corp. and related companies applying all of the tests in Section 1.5 of National Instrument 43-101 and in Section 1.5 of the Companion Policy to NI 43-101.
6. I am one of the authors of this technical report titled “Preliminary Economic Assessment and Updated Technical Report on the Shafter Project, Presidio County, Texas” prepared for Aurcana Corp., with and effective date of July 11, 2018. Subject to those issues discussed in Section 3.0, I am responsible for Section 16, and take co-responsibility for portions of Sections 1, 18,21, and 25 of the Technical Report.
7. I have not had prior involvement with the property that is the subject of this Technical Report. I have not visited the Shafter project.
8. As of the effective date of this Technical Report, to the best of my knowledge, information, and belief, those parts of the Technical Report for which I am responsible contain all scientific and technical information that is required to be disclosed to make the Technical Report not misleading.
9. I have read National Instrument 43-101 and Form 43-101F1, and the Technical Report has been prepared in compliance with that instrument and form.
Dated this July 29, 2018 “Bill Tilley” Bill Tilley, P.E. Signature of Qualified Person
Preliminary Economic Assessment and Updated Technical Report, Shafter Project, Texas, USA Aurcana Corporation Page 209
Mine Development Associates \\mda.com\users\Neil\shafter_2016_pea\2018_PEA\Shafter_2018_43-101_v13_pea.docx July 29, 2018 Print Date: 9/5/18 2:59 PM
CERTIFICATE OF QUALIFIED PERSON Matt Bender. I, Matt Bender, P. E., do hereby certify that:
1. I am currently employed as Director of Metallurgy for Samuel Engineering, Inc. located at 8450 E. Crescent Pkwy 200, Greenwood Village, Colorado 80111.
2. I graduated with a Bachelor of Science degree in Metallurgical Engineering from the Colorado School of Mine in 1987.
3. I am a Professional Engineer (P.E.) registered with the State of Colorado, Registration Number 31471. I am a registered Qualified Professional member of the Mining and Metallurgical Society of America, Member Number 01095QP. I have worked as process metallurgist in the mining industry for the past 31 years, including with respect to the design and operation of precious metals whole-ore leaching and Merrill Crowe recovery facilities.
4. I have read the definition of “qualified person” set out in National Instrument (NI) 43-101, and do certify that, by reason of my education, affiliation with a professional association (as defined by NI 43-101) and past relevant work experience, I fulfill the requirements to be a “qualified person” for the purposes of NI 43-101.
5. I am one of the authors of this technical report titled “Preliminary Economic Assessment and Updated Technical Report on the Shafter Silver Project, Presidio County, Texas” prepared for Aurcana Corp., with and effective date of July 11, 2018. Subject to those issues discussed in Section 3.0, I am responsible for Sections 13, 17, 18, and take co-responsibility for Sections 1 and 21, 25 and 26 of the Technical Report dealing with the process plant.
6. I have not had prior involvement with the property that is the subject of this Technical Report. I have not visited the Shafter project site.
7. To the best of my knowledge, information and belief, the technical report contains the necessary scientific and technical information to make the technical report not misleading.
8. I am independent of Aurcana Corp. and related companies applying all of the tests in Section 1.5 of National Instrument 43-101 and in Section 1.5 of the Companion Policy to NI 43-101.
9. I have read National Instrument 43-101 and Form 43-101F1, and the Technical Report has been prepared in accordance with the requirements of that instrument and form.
Dated this July 29, 2018 “Matt Bender” Signature of Qualified Person Matt Bender Print Name of Qualified Person
Preliminary Economic Assessment and Updated Technical Report, Shafter Project, Texas, USA Aurcana Corporation Page 210
Mine Development Associates \\mda.com\users\Neil\shafter_2016_pea\2018_PEA\Shafter_2018_43-101_v13_pea.docx July 29, 2018 Print Date: 9/5/18 2:59 PM
Martin J. DeMarse I, Martin J. DeMarse, P.E., do hereby certify that: 1. I am a Professional Engineer with the Gault Group, LLC. at a business address of 5213 North 24th
Street, #202, Phoenix Arizona, 85016.
2. I graduated with a Bachelor of Science degree in Civil Engineering from the Arizona State University in 1976.
3. I am a member in good standing of the Association of Professional Engineers and Geoscientists of Arizona (License Nunber 31678).
4. I have pracitced my profession continuously since graduation
5. I am one of the authors of this technical report titled “Preliminary Economic Assessment and Updated Technical Report on the Shafter Silver Project, Presidio County, Texas” prepared for Aurcana Corp., with and effective date of July 11, 2018. Subject to those issues discussed in Section 3.0, I am responsible for Sections 4.4, 4.5 and 20 of the Technical Report.
6. I have not had prior involvement with the property that is the subject of this Technical Report. I have visited the Shafter project site in 2000.
7. To the best of my knowledge, information and belief, the technical report contains the necessary scientific and technical information to make the technical report not misleading.
8. I am independent of Aurcana Corp. and related companies applying all of the tests in Section 1.5 of National Instrument 43-101 and in Section 1.5 of the Companion Policy to NI 43-101.
9. I have read National Instrument 43-101 and Form 43-101F1, and the Technical Report has been prepared in accordance with the requirements of that instrument and form.
“Martin J. DeMarse” Martin J. DeMarse, P.E.