Embed Size (px)
Citation preview

MIMO Measurement Tipswith Agilent P-Series Power Meters and U2000 Series USB Power Sensors
Application Note
Multiple-input,multiple-output (MIMO) is the use of multiple antennas at
both the transmitting and receiving ends simultaneously to improve spectral
efficiency. MIMO technology offers tremendous performance improvement for
wireless local area network (WLAN) or cellular technologies such as worldwide
interoperability for microwave access (WiMAX), or long term evolution (LTE).
With the MIMO technique, users will see immediate range/throughput benefits.
Consequently, MIMO will play a key role in future wireless communication
systems.
This application note explains why the Agilent power measurement solutions
are ideal for enabling accurate and repeatable MIMO measurements. This
application note then shows you how to use these measurement solutions
step by step to perform accurate and repeatable MIMO power measurements.
This note also describes MIMO-related measurements that can be supported
by the power meter and sensor, as well as their key benefits. The procedures
outlined in this application note apply to most measurements of any orthogonal
frequency-division multiplexing (OFDM)-type signals.
Multiple MIMOChannels
Table of Contents1. Introduction .....................................1
2. Overview of MIMO .........................2
2.1 Concept .......................................2
2.2 MIMO Packet Structure ...........3
3. Agilent Power Measurement
Solutions for MIMO
Measurements ...............................4
3.1 P-Series Power Meters and
Sensors .......................................4
3.2 U2000 Series USB Power
Sensors .......................................7
4. Demonstration Guide ...................10
4.1 Demonstration Setup and
Procedures for P-Series .........11
4.2 Demonstration Setup and
Procedures for U2000 Series .16
1. Introduction
2
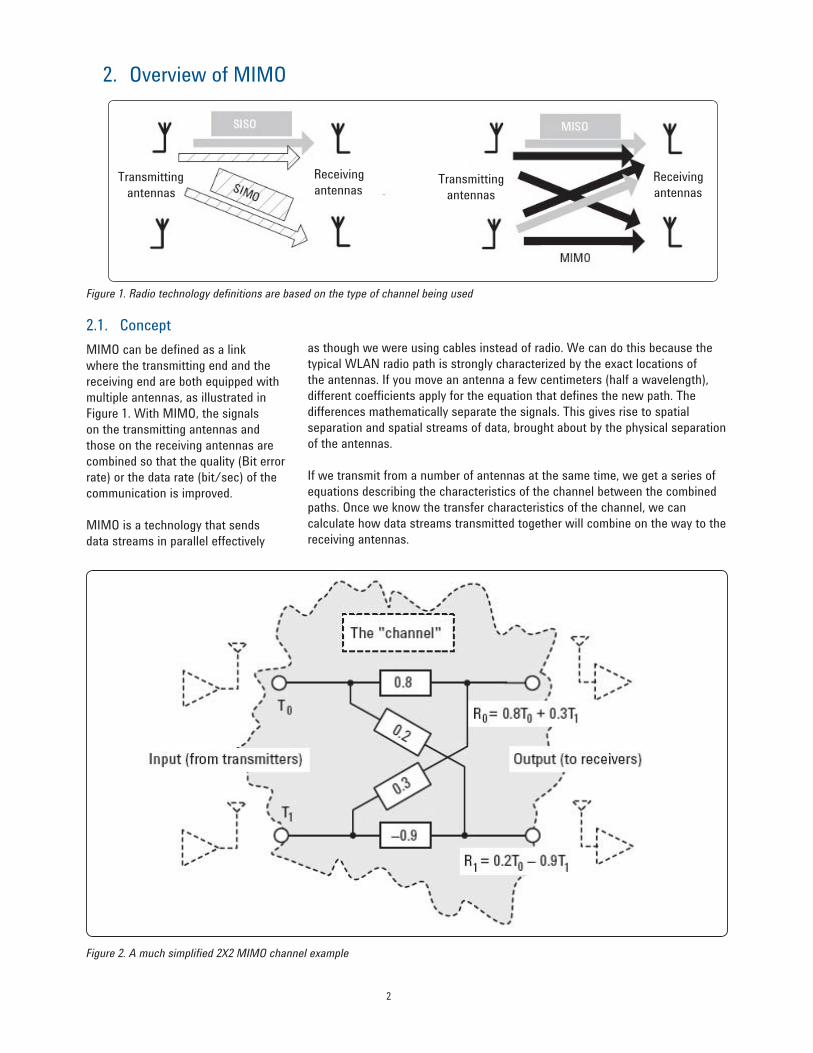
Figure 1. Radio technology defi nitions are based on the type of channel being used
MIMO can be defined as a link
where the transmitting end and the
receiving end are both equipped with
multiple antennas, as illustrated in
Figure 1. With MIMO, the signals
on the transmitting antennas and
those on the receiving antennas are
combined so that the quality (Bit error
rate) or the data rate (bit/sec) of the
communication is improved.
MIMO is a technology that sends
data streams in parallel effectively
2.1. Concept
Figure 2. A much simplifi ed 2X2 MIMO channel example
Receiving
antennasTransmitting
antennas
2. Overview of MIMO
Transmitting
antennas
Receiving
antennas
as though we were using cables instead of radio. We can do this because the
typical WLAN radio path is strongly characterized by the exact locations of
the antennas. If you move an antenna a few centimeters (half a wavelength),
different coefficients apply for the equation that defines the new path. The
differences mathematically separate the signals. This gives rise to spatial
separation and spatial streams of data, brought about by the physical separation
of the antennas.
If we transmit from a number of antennas at the same time, we get a series of
equations describing the characteristics of the channel between the combined
paths. Once we know the transfer characteristics of the channel, we can
calculate how data streams transmitted together will combine on the way to the
receiving antennas.
3
Channel coefficients can be found in
several ways. In Figure 2 on page 2,
a pair of known and different signals
are transmitted at T0 and T1, and
are measured at R0 and R1. Inputs
T0 and T1 represent the signals
transmitted over the radio channel.
The coefficients in the example
represent the frequency-independent
path losses and the cross-coupling on
the way to the receiving antennas at
R0 and R1.
If, during a training period, T0 and
T1 are known and different, the
coefficients in the channel can
be calculated by measuring the
two signals at the receiver inputs.
Solving the resulting simultaneous
equations reveals the channel
coefficients, which can then be used
to reconstruct the original data.
The coefficients do not represent a
realistic channel, but they do show
how we can use the received signals,
R0 and R1, to calculate the channel
coefficients.
Calculate the input from the output
using the following equation:
T0
T1
=1.15
0.26
0.39
–1.03
R0
R1
C = B.log2(1+ρ)
According to Shannon’s theory of channel capacity:
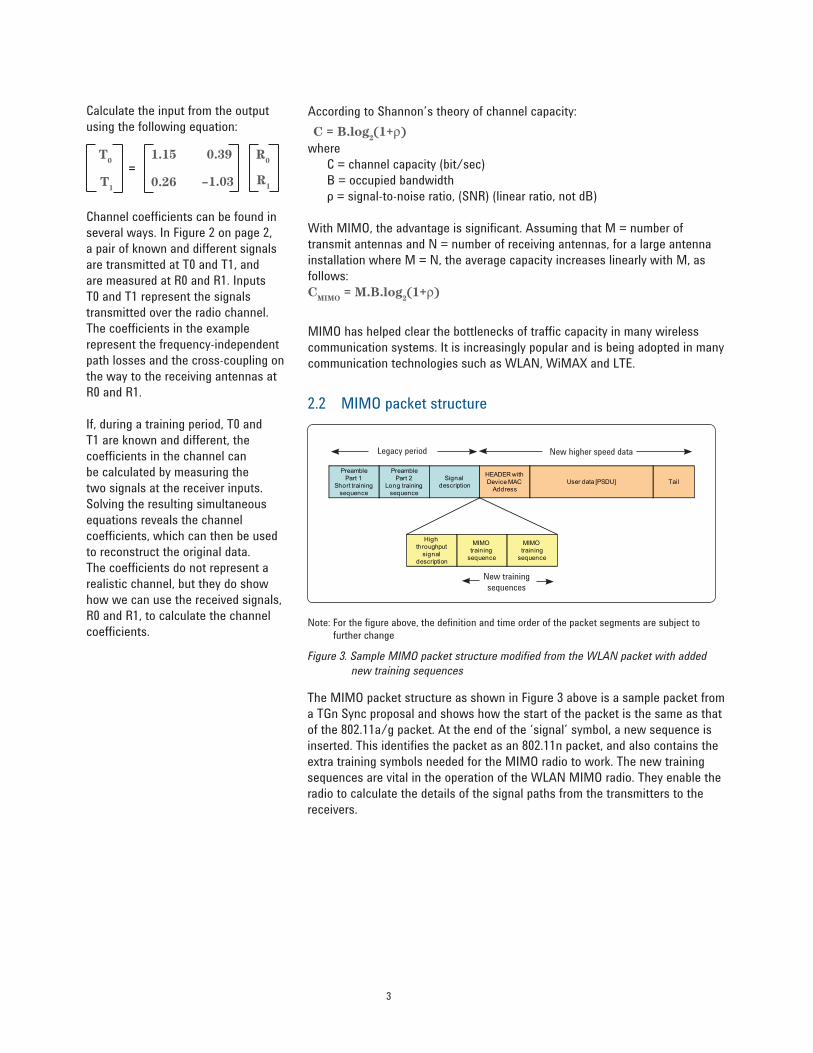
Legacy period New higher speed data
New training
sequences
Note: For the fi gure above, the defi nition and time order of the packet segments are subject tofurther change
2.2 MIMO packet structure
Figure 3. Sample MIMO packet structure modifi ed from the WLAN packet with added
new training sequences
The MIMO packet structure as shown in Figure 3 above is a sample packet from
a TGn Sync proposal and shows how the start of the packet is the same as that
of the 802.11a/g packet. At the end of the ‘signal’ symbol, a new sequence is
inserted. This identifies the packet as an 802.11n packet, and also contains the
extra training symbols needed for the MIMO radio to work. The new training
sequences are vital in the operation of the WLAN MIMO radio. They enable the
radio to calculate the details of the signal paths from the transmitters to the
receivers.
where
C = channel capacity (bit/sec)
B = occupied bandwidth
ρ = signal-to-noise ratio, (SNR) (linear ratio, not dB)
With MIMO, the advantage is significant. Assuming that M = number of
transmit antennas and N = number of receiving antennas, for a large antenna
installation where M = N, the average capacity increases linearly with M, as
follows:
CMIMO = M.B.log2(1+ρ)
MIMO has helped clear the bottlenecks of traffic capacity in many wireless
communication systems. It is increasingly popular and is being adopted in many
communication technologies such as WLAN, WiMAX and LTE.
PreamblePart 1
Short training sequence
PreamblePart 2
Long training sequence
Signal description
HEADER withDevice MAC
AddressUser data [PSDU] Tail
MIMO training
sequence
High throughput
signal description
MIMO training
sequence
4
3. Agilent Power Measurement Solutions for MIMO Measurements
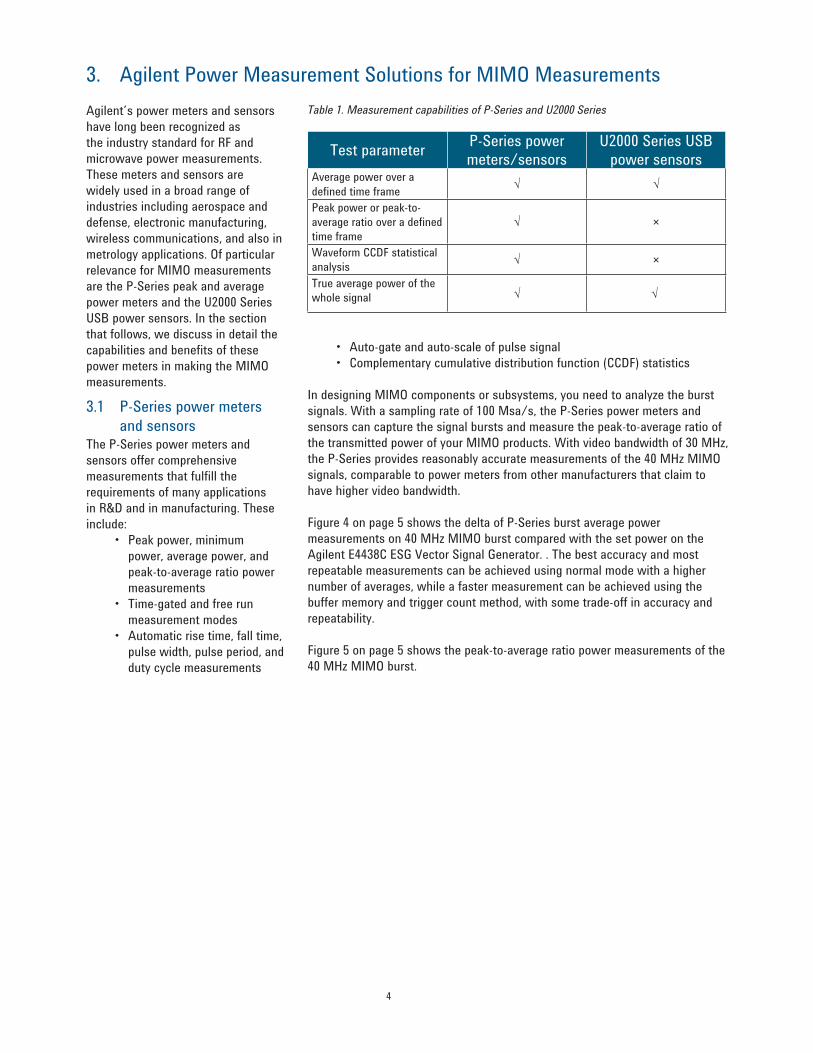
Table 1. Measurement capabilities of P-Series and U2000 Series
Test parameterP-Series power meters/sensors
U2000 Series USB power sensors
Average power over a
defined time frame√ √
Peak power or peak-to-
average ratio over a defined
time frame
√ ×
Waveform CCDF statistical
analysis√ ×
True average power of the
whole signal √ √ √√
Agilent’s power meters and sensors
have long been recognized as
the industry standard for RF and
microwave power measurements.
These meters and sensors are
widely used in a broad range of
industries including aerospace and
defense, electronic manufacturing,
wireless communications, and also in
metrology applications. Of particular
relevance for MIMO measurements
are the P-Series peak and average
power meters and the U2000 Series
USB power sensors. In the section
that follows, we discuss in detail the
capabilities and benefits of these
power meters in making the MIMO
measurements.
3.1 P-Series power meters
and sensorsThe P-Series power meters and
sensors offer comprehensive
measurements that fulfill the
requirements of many applications
in R&D and in manufacturing. These
include:
Peak power, minimum •
power, average power, and
peak-to-average ratio power
measurements
Time-gated and free run •
measurement modes
Automatic rise time, fall time, •
pulse width, pulse period, and
duty cycle measurements
Auto-gate and auto-scale of pulse signal•
Complementary cumulative distribution function (CCDF) statistics•
In designing MIMO components or subsystems, you need to analyze the burst
signals. With a sampling rate of 100 Msa/s, the P-Series power meters and
sensors can capture the signal bursts and measure the peak-to-average ratio of
the transmitted power of your MIMO products. With video bandwidth of 30 MHz,
the P-Series provides reasonably accurate measurements of the 40 MHz MIMO
signals, comparable to power meters from other manufacturers that claim to
have higher video bandwidth.
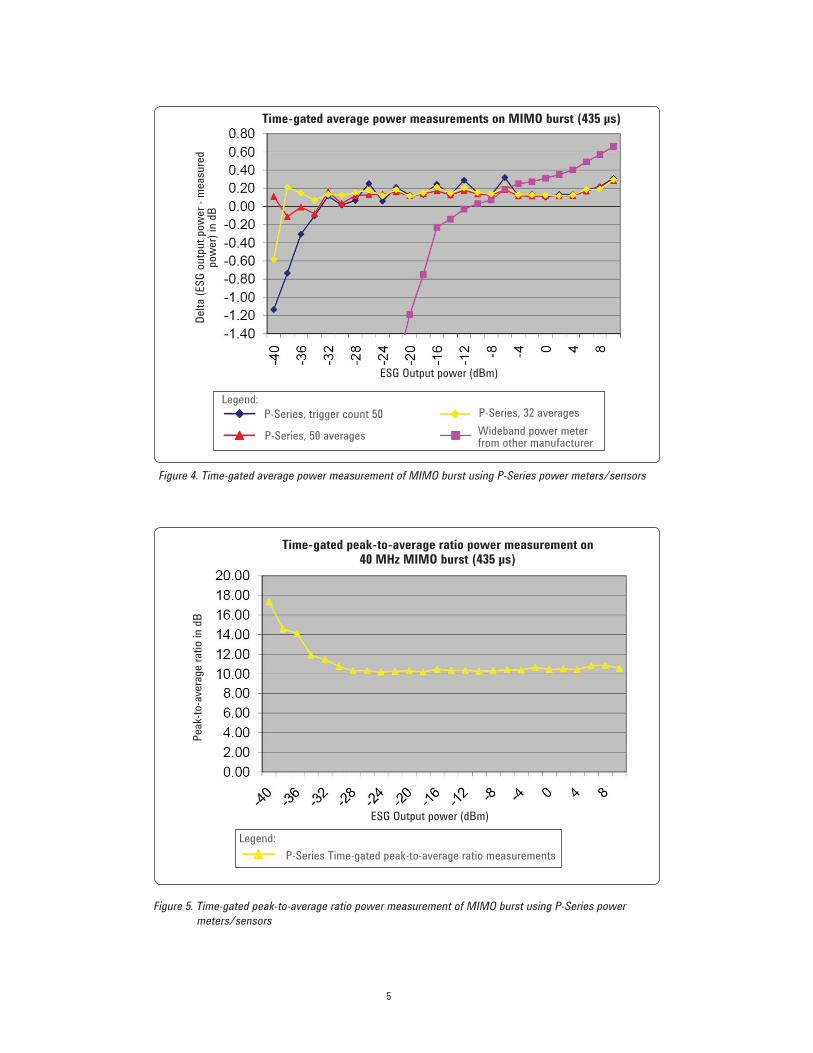
Figure 4 on page 5 shows the delta of P-Series burst average power
measurements on 40 MHz MIMO burst compared with the set power on the
Agilent E4438C ESG Vector Signal Generator. . The best accuracy and most
repeatable measurements can be achieved using normal mode with a higher
number of averages, while a faster measurement can be achieved using the
buffer memory and trigger count method, with some trade-off in accuracy and
repeatability.
Figure 5 on page 5 shows the peak-to-average ratio power measurements of the
40 MHz MIMO burst.
5
Figure 5. Time-gated peak-to-average ratio power measurement of MIMO burst using P-Series power
meters/sensors
Legend:
P-Series, trigger count 50
P-Series, 50 averages
P-Series, 32 averages
Wideband power meter from other manufacturer
P-Series Time-gated peak-to-average ratio measurements
Figure 4. Time-gated average power measurement of MIMO burst using P-Series power meters/sensors
Legend:
Time-gated average power measurements on MIMO burst (435 μs)
Del
ta (
ES
G o
utp
ut
pow
er -
mea
sure
d po
wer
) in
dB
ESG Output power (dBm)
ESG Output power (dBm)
Time-gated peak-to-average ratio power measurement on40 MHz MIMO burst (435 μs)
Pea
k-to
-ave
rage
rat
io in
dB
6
a
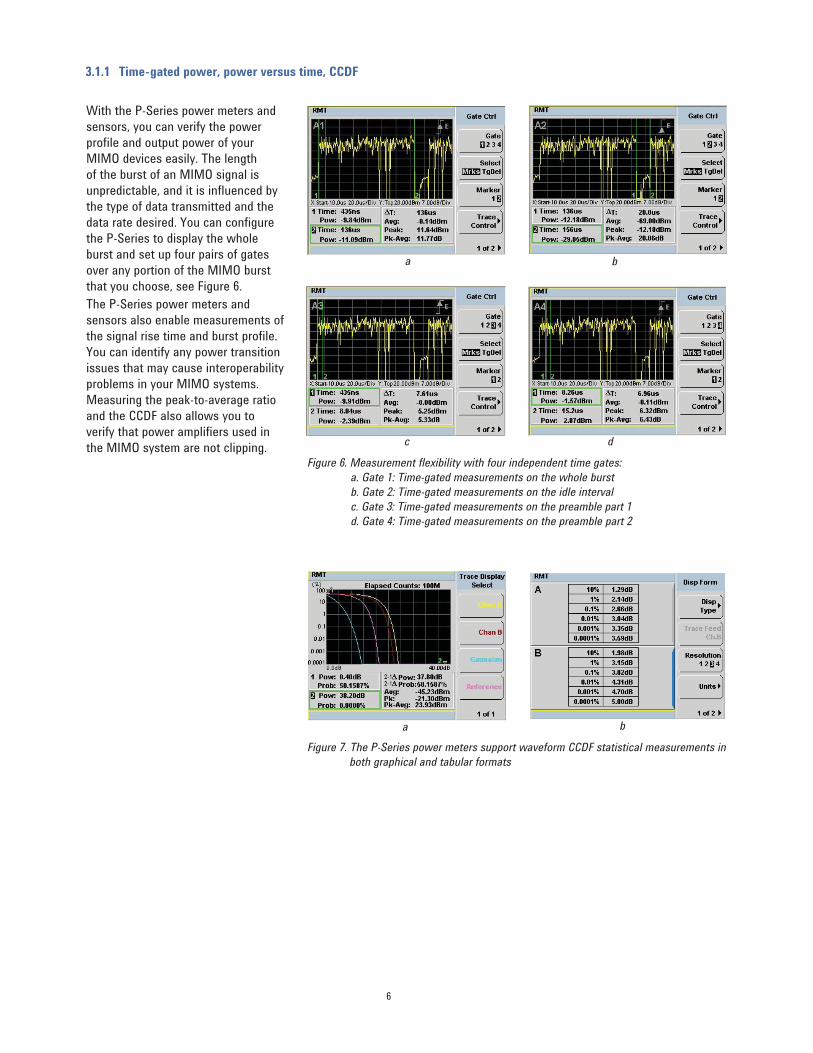
Figure 6. Measurement fl exibility with four independent time gates:
a. Gate 1: Time-gated measurements on the whole burst
b. Gate 2: Time-gated measurements on the idle interval
c. Gate 3: Time-gated measurements on the preamble part 1
d. Gate 4: Time-gated measurements on the preamble part 2
Figure 7. The P-Series power meters support waveform CCDF statistical measurements in
both graphical and tabular formats
ba
b
c d
With the P-Series power meters and
sensors, you can verify the power
profile and output power of your
MIMO devices easily. The length
of the burst of an MIMO signal is
unpredictable, and it is influenced by
the type of data transmitted and the
data rate desired. You can configure
the P-Series to display the whole
burst and set up four pairs of gates
over any portion of the MIMO burst
that you choose, see Figure 6.
The P-Series power meters and
sensors also enable measurements of
the signal rise time and burst profile.
You can identify any power transition
issues that may cause interoperability
problems in your MIMO systems.
Measuring the peak-to-average ratio
and the CCDF also allows you to
verify that power amplifiers used in
the MIMO system are not clipping.
3.1.1 Time-gated power, power versus time, CCDF
7
3.2 U2000 Series USB power sensors
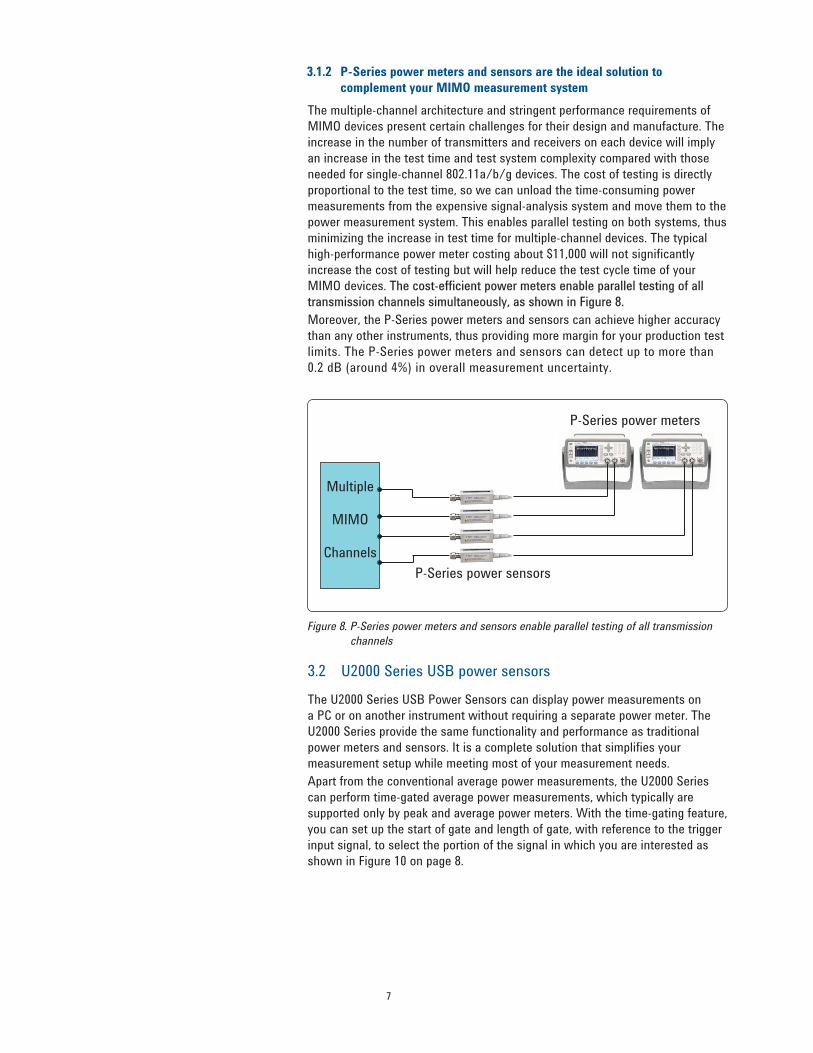
The multiple-channel architecture and stringent performance requirements of
MIMO devices present certain challenges for their design and manufacture. The
increase in the number of transmitters and receivers on each device will imply
an increase in the test time and test system complexity compared with those
needed for single-channel 802.11a/b/g devices. The cost of testing is directly
proportional to the test time, so we can unload the time-consuming power
measurements from the expensive signal-analysis system and move them to the
power measurement system. This enables parallel testing on both systems, thus
minimizing the increase in test time for multiple-channel devices. The typical
high-performance power meter costing about $11,000 will not significantly
increase the cost of testing but will help reduce the test cycle time of your
MIMO devices. The cost-efficient power meters enable parallel testing of all The cost-efficient power meters enable parallel testing of all
transmission channels simultaneously, as shown in Figure 8.transmission channels simultaneously, as shown in Figure 8.
Moreover, the P-Series power meters and sensors can achieve higher accuracy
than any other instruments, thus providing more margin for your production test
limits. The P-Series power meters and sensors can detect up to more than
0.2 dB (around 4%) in overall measurement uncertainty.
The U2000 Series USB Power Sensors can display power measurements on
a PC or on another instrument without requiring a separate power meter. The
U2000 Series provide the same functionality and performance as traditional
power meters and sensors. It is a complete solution that simplifies your
measurement setup while meeting most of your measurement needs.
Apart from the conventional average power measurements, the U2000 Series
can perform time-gated average power measurements, which typically are
supported only by peak and average power meters. With the time-gating feature,
you can set up the start of gate and length of gate, with reference to the trigger
input signal, to select the portion of the signal in which you are interested as
shown in Figure 10 on page 8.
P-Series power meters
P-Series power sensors
Figure 8. P-Series power meters and sensors enable parallel testing of all transmission
channels
3.1.2 P-Series power meters and sensors are the ideal solution to
complement your MIMO measurement system
Multiple
MIMO
Channels
8
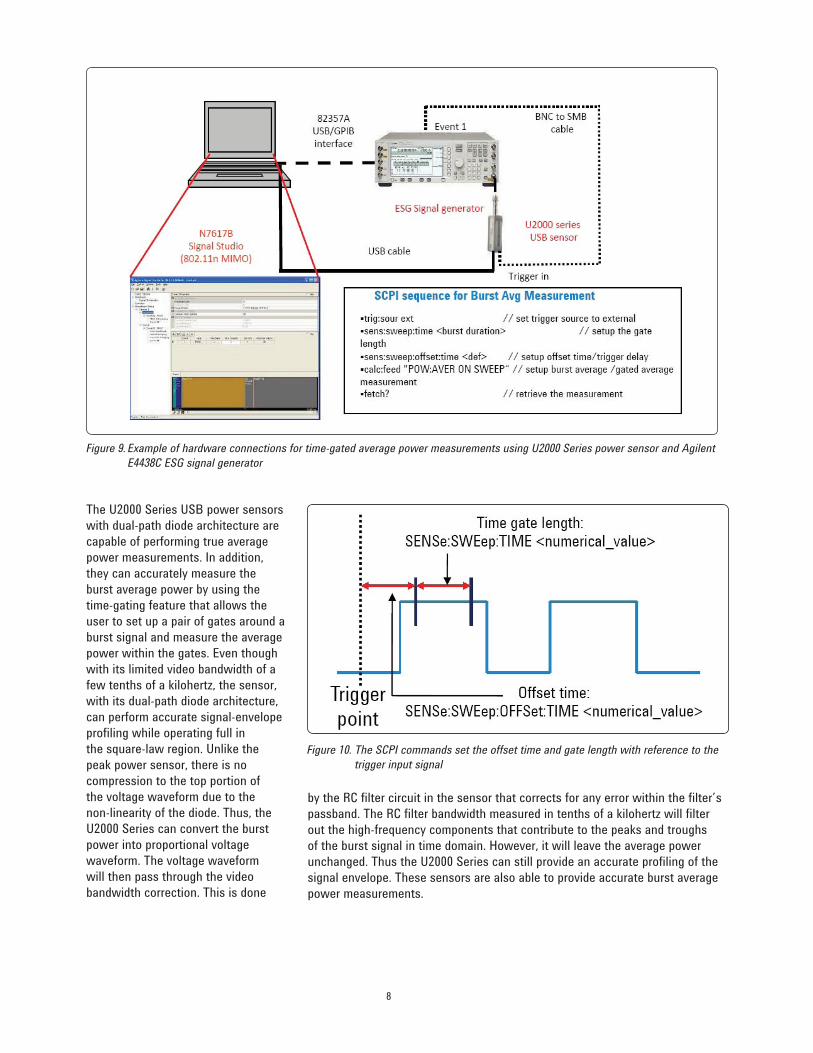
The U2000 Series USB power sensors
with dual-path diode architecture are
capable of performing true average
power measurements. In addition,
they can accurately measure the
burst average power by using the
time-gating feature that allows the
user to set up a pair of gates around a
burst signal and measure the average
power within the gates. Even though
with its limited video bandwidth of a
few tenths of a kilohertz, the sensor,
with its dual-path diode architecture,
can perform accurate signal-envelope
profiling while operating full in
the square-law region. Unlike the
peak power sensor, there is no
compression to the top portion of
the voltage waveform due to the
non-linearity of the diode. Thus, the
U2000 Series can convert the burst
power into proportional voltage
waveform. The voltage waveform
will then pass through the video
bandwidth correction. This is done
Figure 9. Example of hardware connections for time-gated average power measurements using U2000 Series power sensor and Agilent
E4438C ESG signal generator
Figure 10. The SCPI commands set the offset time and gate length with reference to the
trigger input signal
by the RC filter circuit in the sensor that corrects for any error within the filter’s
passband. The RC filter bandwidth measured in tenths of a kilohertz will filter
out the high-frequency components that contribute to the peaks and troughs
of the burst signal in time domain. However, it will leave the average power
unchanged. Thus the U2000 Series can still provide an accurate profiling of the
signal envelope. These sensors are also able to provide accurate burst average
power measurements.
9
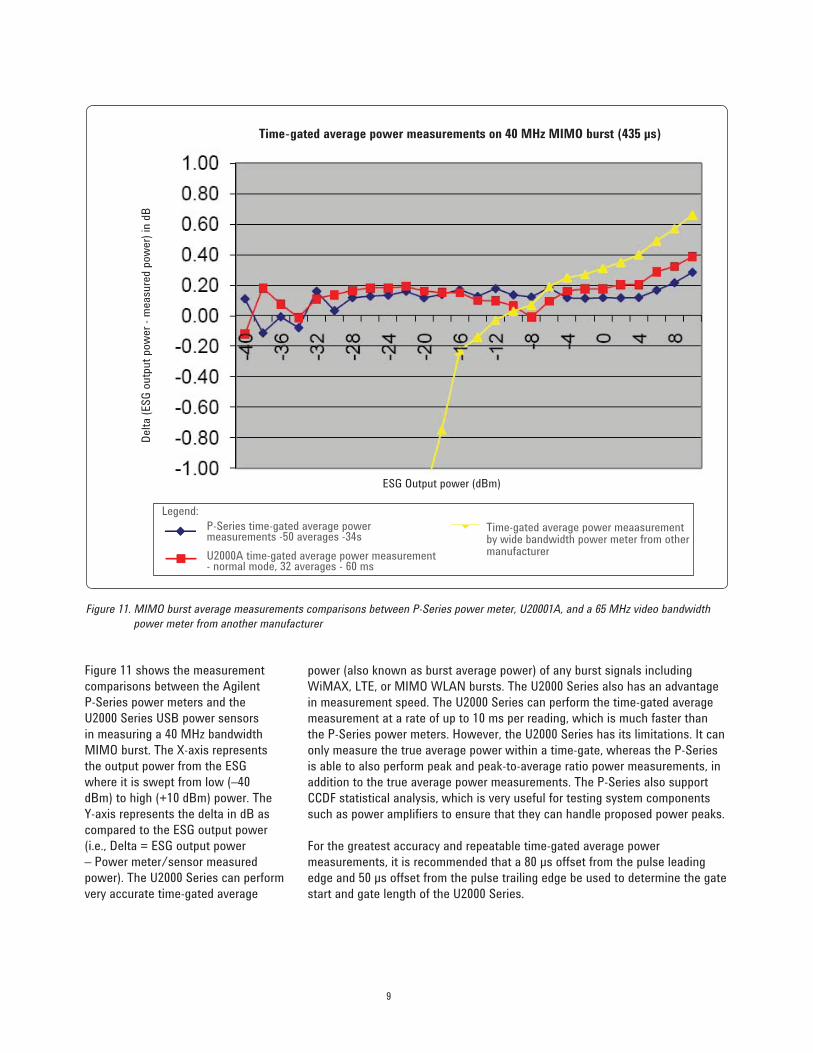
Figure 11 shows the measurement
comparisons between the Agilent
P-Series power meters and the
U2000 Series USB power sensors
in measuring a 40 MHz bandwidth
MIMO burst. The X-axis represents
the output power from the ESG
where it is swept from low (–40
dBm) to high (+10 dBm) power. The
Y-axis represents the delta in dB as
compared to the ESG output power
(i.e., Delta = ESG output power
– Power meter/sensor measured
power). The U2000 Series can perform
very accurate time-gated average
Legend:
P-Series time-gated average power measurements -50 averages -34s
U2000A time-gated average power measurement - normal mode, 32 averages - 60 ms
Time-gated average power meaasurement by wide bandwidth power meter from other manufacturer
power (also known as burst average power) of any burst signals including
WiMAX, LTE, or MIMO WLAN bursts. The U2000 Series also has an advantage
in measurement speed. The U2000 Series can perform the time-gated average
measurement at a rate of up to 10 ms per reading, which is much faster than
the P-Series power meters. However, the U2000 Series has its limitations. It can
only measure the true average power within a time-gate, whereas the P-Series
is able to also perform peak and peak-to-average ratio power measurements, in
addition to the true average power measurements. The P-Series also support
CCDF statistical analysis, which is very useful for testing system components
such as power amplifiers to ensure that they can handle proposed power peaks.
For the greatest accuracy and repeatable time-gated average power
measurements, it is recommended that a 80 μs offset from the pulse leading
edge and 50 μs offset from the pulse trailing edge be used to determine the gate
start and gate length of the U2000 Series.
Figure 11. MIMO burst average measurements comparisons between P-Series power meter, U20001A, and a 65 MHz video bandwidth
power meter from another manufacturer
Time-gated average power measurements on 40 MHz MIMO burst (435 μs)D
elta
(ES
G o
utp
ut
pow
er -
mea
sure
d po
wer
) in
dB
ESG Output power (dBm)
10
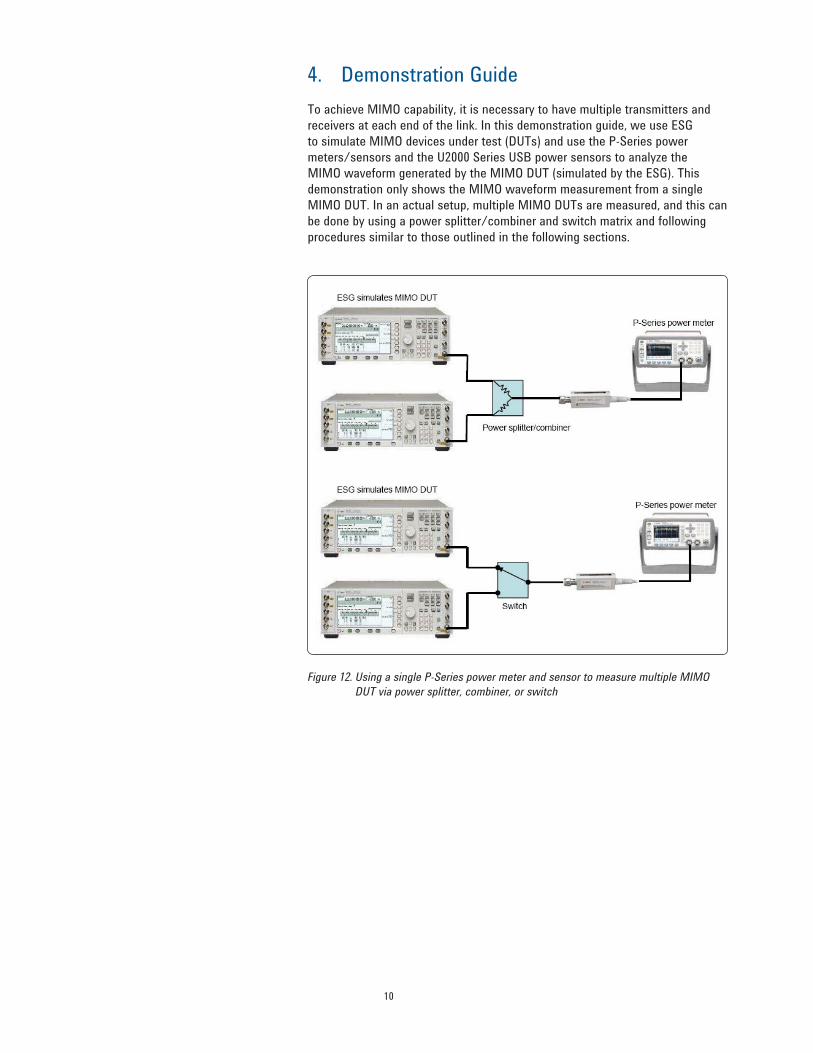
4. Demonstration Guide
To achieve MIMO capability, it is necessary to have multiple transmitters and
receivers at each end of the link. In this demonstration guide, we use ESG
to simulate MIMO devices under test (DUTs) and use the P-Series power
meters/sensors and the U2000 Series USB power sensors to analyze the
MIMO waveform generated by the MIMO DUT (simulated by the ESG). This
demonstration only shows the MIMO waveform measurement from a single
MIMO DUT. In an actual setup, multiple MIMO DUTs are measured, and this can
be done by using a power splitter/combiner and switch matrix and following
procedures similar to those outlined in the following sections.
Figure 12. Using a single P-Series power meter and sensor to measure multiple MIMO
DUT via power splitter, combiner, or switch
11
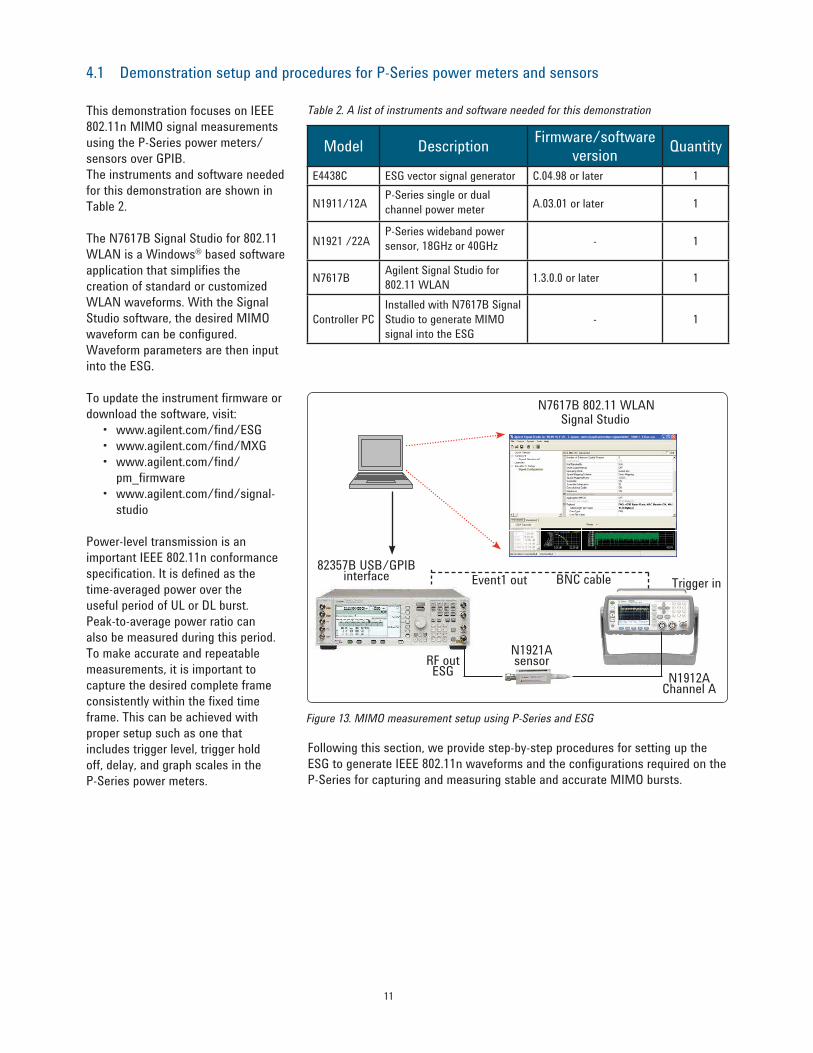
Figure 13. MIMO measurement setup using P-Series and ESG
82357B USB/GPIB interface Event1 out BNC cable Trigger in
N1912A Channel A
N1921A sensorRF out
ESG
This demonstration focuses on IEEE
802.11n MIMO signal measurements
using the P-Series power meters/
sensors over GPIB.
The instruments and software needed
for this demonstration are shown in
Table 2.
The N7617B Signal Studio for 802.11
WLAN is a Windows® based software
application that simplifies the
creation of standard or customized
WLAN waveforms. With the Signal
Studio software, the desired MIMO
waveform can be configured.
Waveform parameters are then input
into the ESG.
To update the instrument firmware or
download the software, visit:
www.agilent.com/find/ESG•
www.agilent.com/find/MXG•
www.agilent.com/find/•
pm_firmware
www.agilent.com/find/signal-•
studio
Power-level transmission is an
important IEEE 802.11n conformance
specification. It is defined as the
time-averaged power over the
useful period of UL or DL burst.
Peak-to-average power ratio can
also be measured during this period.
To make accurate and repeatable
measurements, it is important to
capture the desired complete frame
consistently within the fixed time
frame. This can be achieved with
proper setup such as one that
includes trigger level, trigger hold
off, delay, and graph scales in the
P-Series power meters.
Model DescriptionFirmware/software
versionQuantity
E4438C ESG vector signal generator C.04.98 or later 1
N1911/12AP-Series single or dual
channel power meterA.03.01 or later 1
N1921 /22AP-Series wideband power
sensor, 18GHz or 40GHz - 1
N7617BAgilent Signal Studio for
802.11 WLAN1.3.0.0 or later 1
Controller PC
Installed with N7617B Signal
Studio to generate MIMO
signal into the ESG
- 1
4.1 Demonstration setup and procedures for P-Series power meters and sensors
N7617B 802.11 WLANSignal Studio
Table 2. A list of instruments and software needed for this demonstration
Following this section, we provide step-by-step procedures for setting up the
ESG to generate IEEE 802.11n waveforms and the configurations required on the
P-Series for capturing and measuring stable and accurate MIMO bursts.
12
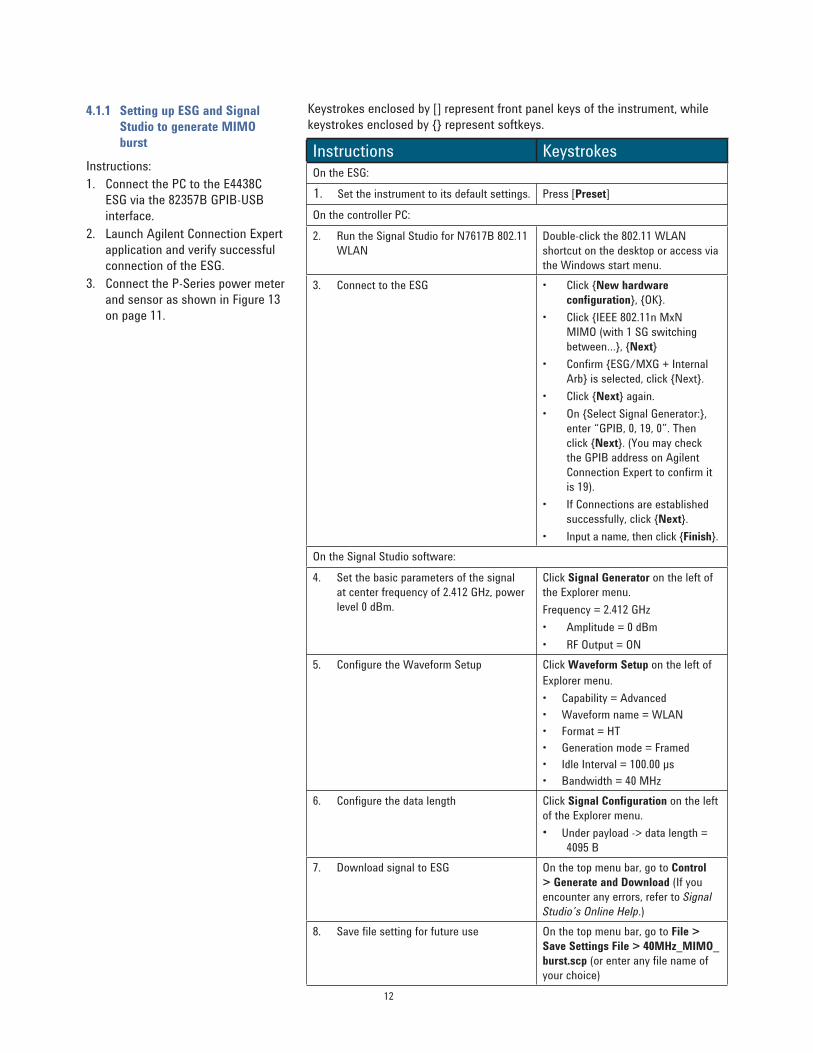
Instructions KeystrokesOn the ESG:
Set the instrument to its default settings.1. Press [Preset]
On the controller PC:
Run the Signal Studio for N7617B 802.11 2.
WLAN
Double-click the 802.11 WLAN
shortcut on the desktop or access via
the Windows start menu.
Connect to the ESG3. Click {• New hardware
confi guration}, {OK}.
Click {IEEE 802.11n MxN •
MIMO (with 1 SG switching
between…}, {Next}
Confi rm {ESG/MXG + Internal •
Arb} is selected, click {Next}.
Click {• Next} again.
On {Select Signal Generator:}, •
enter “GPIB, 0, 19, 0”. Then
click {Next}. (You may check
the GPIB address on Agilent
Connection Expert to confirm it
is 19).
If Connections are established •
successfully, click {Next}.
Input a name, then click {• Finish}.
On the Signal Studio software:
Set the basic parameters of the signal 4.
at center frequency of 2.412 GHz, power
level 0 dBm.
Click Signal Generator on the left of
the Explorer menu.
Frequency = 2.412 GHz
Amplitude = 0 dBm•
RF Output = ON•
Confi gure the Waveform Setup5. Click Waveform Setup on the left of
Explorer menu.
• Capability = Advanced
• Waveform name = WLAN
• Format = HT
• Generation mode = Framed
• Idle Interval = 100.00 μs
• Bandwidth = 40 MHz
Confi gure the data length6. Click Signal Configuration on the left
of the Explorer menu.
Under payload -> data length = • 4095 B
Download signal to ESG7. On the top menu bar, go to Control
> Generate and Download (If you
encounter any errors, refer to Signal
Studio’s Online Help.)
Save fi le setting for future use8. On the top menu bar, go to File >
Save Settings File > 40MHz_MIMO_
burst.scp (or enter any file name of
your choice)
Keystrokes enclosed by [] represent front panel keys of the instrument, while
keystrokes enclosed by {} represent softkeys.4.1.1 Setting up ESG and Signal
Studio to generate MIMO
burst
Instructions:
1. Connect the PC to the E4438C
ESG via the 82357B GPIB-USB
interface.
2. Launch Agilent Connection Expert
application and verify successful
connection of the ESG.
3. Connect the P-Series power meter
and sensor as shown in Figure 13
on page 11.
13
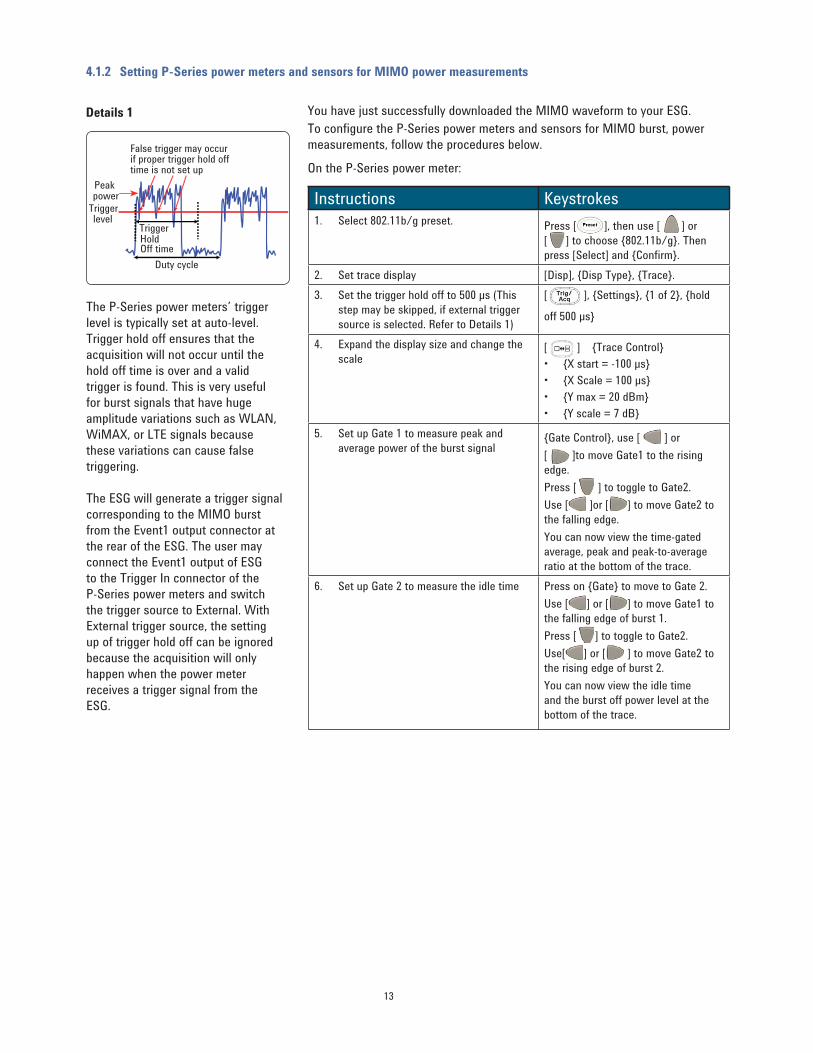
4.1.2 Setting P-Series power meters and sensors for MIMO power measurements
You have just successfully downloaded the MIMO waveform to your ESG.
To configure the P-Series power meters and sensors for MIMO burst, power
measurements, follow the procedures below.
On the P-Series power meter:
Instructions KeystrokesSelect 802.11b/g preset.1. Press [ ], then use [ ] or
[ ] to choose {802.11b/g}. Then
press [Select] and {Confi rm}.
Set trace display2. [Disp], {Disp Type}, {Trace}.
Set the trigger hold off to 500 μs (This 3.
step may be skipped, if external trigger
source is selected. Refer to Details 1)
[ ], {Settings}, {1 of 2}, {hold
off 500 μs}
Expand the display size and change the 4.
scale[ ] {Trace Control}
• {X start = -100 μs}
• {X Scale = 100 μs}
• {Y max = 20 dBm}
• {Y scale = 7 dB}
Set up Gate 1 to measure peak and 5.
average power of the burst signal{Gate Control}, use [ ] or
[ ]to move Gate1 to the rising
edge.
Press [ ] to toggle to Gate2.
Use [ ]or [ ] to move Gate2 to
the falling edge.
You can now view the time-gated
average, peak and peak-to-average
ratio at the bottom of the trace.
Set up Gate 2 to measure the idle time6. Press on {Gate} to move to Gate 2.
Use [ ] or [ ] to move Gate1 to
the falling edge of burst 1.
Press [ ] to toggle to Gate2.
Use[ ] or [ ] to move Gate2 to
the rising edge of burst 2.
You can now view the idle time
and the burst off power level at the
bottom of the trace.
Details 1
False trigger may occur if proper trigger hold off time is not set up
Trigger
Duty cycle
Triggerlevel
Peakpower
The P-Series power meters’ trigger
level is typically set at auto-level.
Trigger hold off ensures that the
acquisition will not occur until the
hold off time is over and a valid
trigger is found. This is very useful
for burst signals that have huge
amplitude variations such as WLAN,
WiMAX, or LTE signals because
these variations can cause false
triggering.
The ESG will generate a trigger signal
corresponding to the MIMO burst
from the Event1 output connector at
the rear of the ESG. The user may
connect the Event1 output of ESG
to the Trigger In connector of the
P-Series power meters and switch
the trigger source to External. With
External trigger source, the setting
up of trigger hold off can be ignored
because the acquisition will only
happen when the power meter
receives a trigger signal from the
ESG.
Off time Hold
14
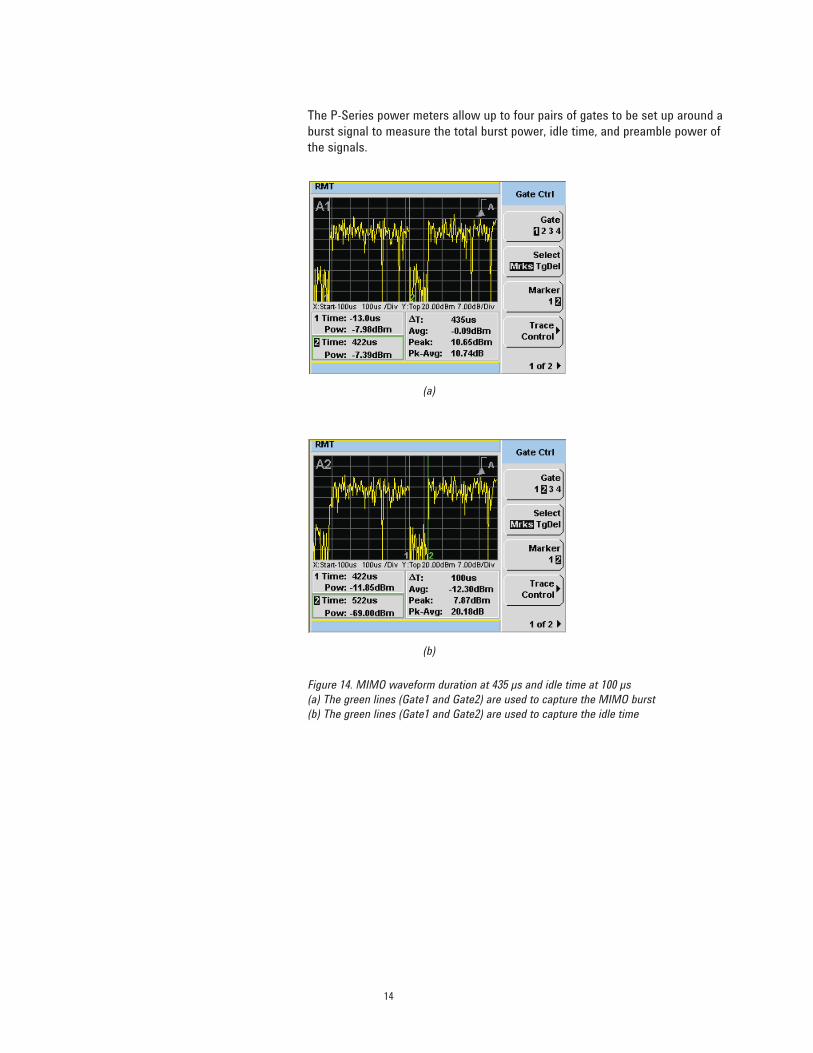
The P-Series power meters allow up to four pairs of gates to be set up around a
burst signal to measure the total burst power, idle time, and preamble power of
the signals.
Figure 14. MIMO waveform duration at 435 μs and idle time at 100 μs
(a) The green lines (Gate1 and Gate2) are used to capture the MIMO burst
(b) The green lines (Gate1 and Gate2) are used to capture the idle time
(a)
(b)
15
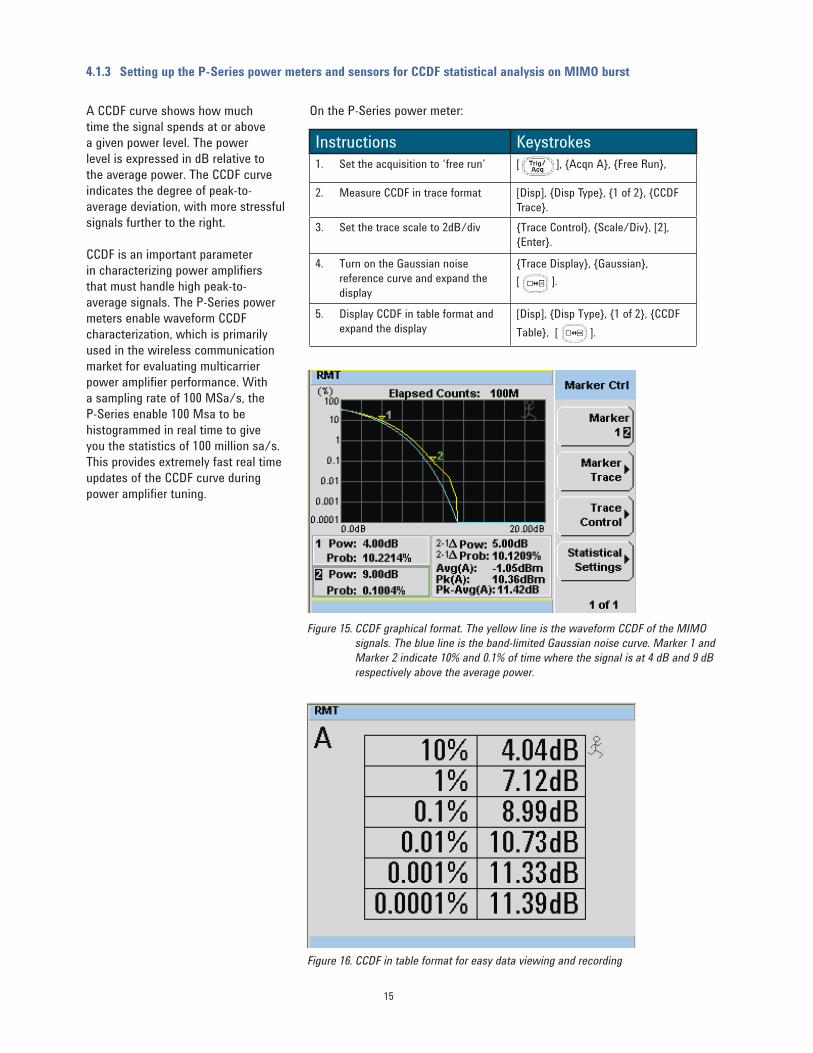
4.1.3 Setting up the P-Series power meters and sensors for CCDF statistical analysis on MIMO burst
A CCDF curve shows how much
time the signal spends at or above
a given power level. The power
level is expressed in dB relative to
the average power. The CCDF curve
indicates the degree of peak-to-
average deviation, with more stressful
signals further to the right.
CCDF is an important parameter
in characterizing power amplifiers
that must handle high peak-to-
average signals. The P-Series power
meters enable waveform CCDF
characterization, which is primarily
used in the wireless communication
market for evaluating multicarrier
power amplifier performance. With
a sampling rate of 100 MSa/s, the
P-Series enable 100 Msa to be
histogrammed in real time to give
you the statistics of 100 million sa/s.
This provides extremely fast real time
updates of the CCDF curve during
power amplifier tuning.
On the P-Series power meter:
Instructions KeystrokesSet the acquisition to ‘free run’1. [ ], {Acqn A}, {Free Run},
Measure CCDF in trace format2. [Disp], {Disp Type}, {1 of 2}, {CCDF
Trace}.
Set the trace scale to 2dB/div3. {Trace Control}, {Scale/Div}, [2],
{Enter}.
Turn on the Gaussian noise 4.
reference curve and expand the
display
{Trace Display}, {Gaussian},
[ ].
Display CCDF in table format and 5.
expand the display
[Disp], {Disp Type}, {1 of 2}, {CCDF
Table}, [ ].
Figure 15. CCDF graphical format. The yellow line is the waveform CCDF of the MIMO
signals. The blue line is the band-limited Gaussian noise curve. Marker 1 and
Marker 2 indicate 10% and 0.1% of time where the signal is at 4 dB and 9 dB
respectively above the average power.
Figure 16. CCDF in table format for easy data viewing and recording
16
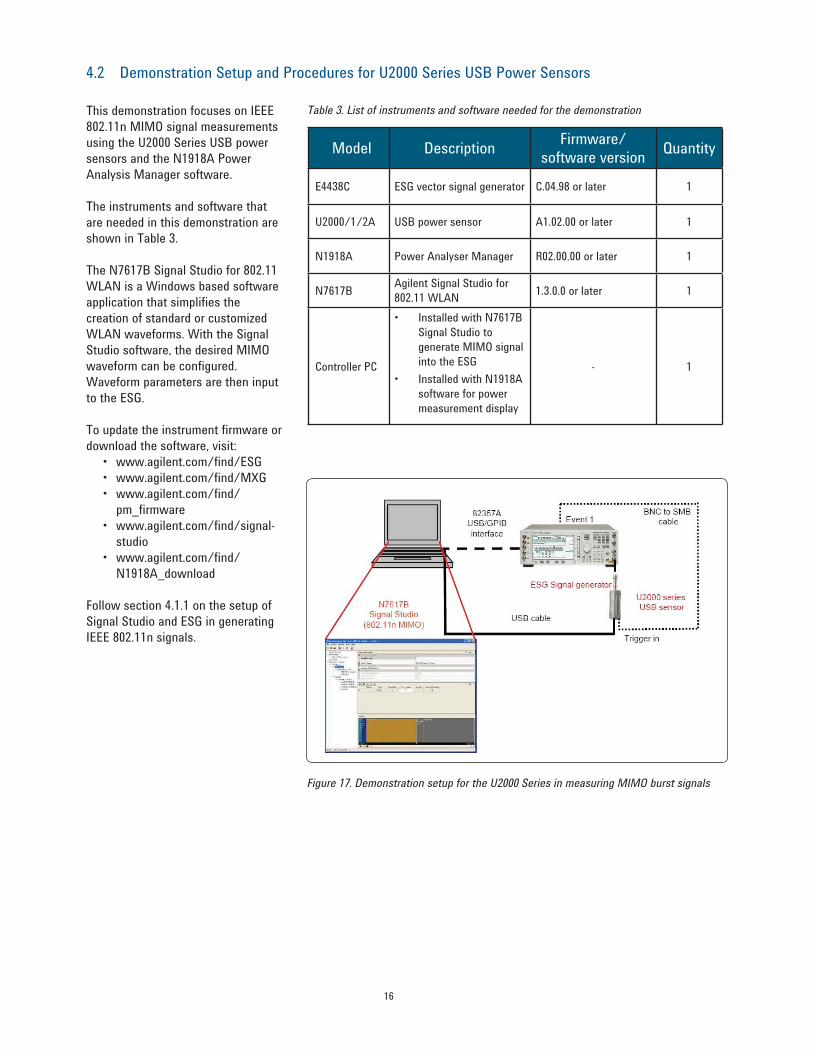
4.2 Demonstration Setup and Procedures for U2000 Series USB Power Sensors
This demonstration focuses on IEEE
802.11n MIMO signal measurements
using the U2000 Series USB power
sensors and the N1918A Power
Analysis Manager software.
The instruments and software that
are needed in this demonstration are
shown in Table 3.
The N7617B Signal Studio for 802.11
WLAN is a Windows based software
application that simplifies the
creation of standard or customized
WLAN waveforms. With the Signal
Studio software, the desired MIMO
waveform can be configured.
Waveform parameters are then input
to the ESG.
To update the instrument firmware or
download the software, visit:
www.agilent.com/find/ESG•
www.agilent.com/find/MXG•
www.agilent.com/find/•
pm_firmware
www.agilent.com/find/signal-•
studio
www.agilent.com/find/•
N1918A_download
Follow section 4.1.1 on the setup of
Signal Studio and ESG in generating
IEEE 802.11n signals.
Model DescriptionFirmware/
software versionQuantity
E4438C ESG vector signal generator C.04.98 or later 1
U2000/1 /2A USB power sensor A1.02.00 or later 1
N1918A Power Analyser Manager R02.00.00 or later 1
N7617BAgilent Signal Studio for
802.11 WLAN1.3.0.0 or later 1
Controller PC
Installed with N7617B •
Signal Studio to
generate MIMO signal
into the ESG
Installed with N1918A •
software for power
measurement display
- 1
Figure 17. Demonstration setup for the U2000 Series in measuring MIMO burst signals
Table 3. List of instruments and software needed for the demonstration
17
Instructions KeystrokesLaunch the 1. N1918A Power Analysis
Manager > Power Panel software,
which is the free soft front panel for
U2000 Series.
Double-click the Power Panel shortcut
on the desktop or access N1918A via
the Windows start menu.
Connect to the USB sensor.2. Select Find USB only on the
Instrument Selector window.
Then click Find.
Check the connected USB sensor and
select Connect.
Perform zeroing.3. Click U2000x – MY47000xxx on the
Instrument Navigator panel on the left.
Select Int or Ext zeroing on the
Instrument Properties pane on the
right. Then click Zero. Wait for about
30 s for the zeroing to complete. (Note:
If Ext zeroing is selected, do not input
any power to the USB sensor)
Set the input frequency to 2.4 GHz.4. On the same Instrument Properties
panel, key in [2.4 G] on the Frequency
(Hz) column.
Set up gated average measurement.5. On the Instrument Navigator panel,
click Gate A.
On the Instrument Properties panel,
check Enable Gate.
Gate 1 Start = 50 μ•
Length = 335 μ•
Set up for external trigger input.6. On the Instrument Navigator panel,
click Trigger.
On the Instrument Properties panel,
check Cont Trig.
The external Trigger Source will be
selected automatically as U2000 can
only support External Trigger Input at
the moment.
Set up Numerical display for power 7.
measurements.
On the middle panel, click the Custom
Views tab.
Click on the top menu.
Right-click the Custom Views window,
Assign Measurement, click the USB
sensor and select Assign.
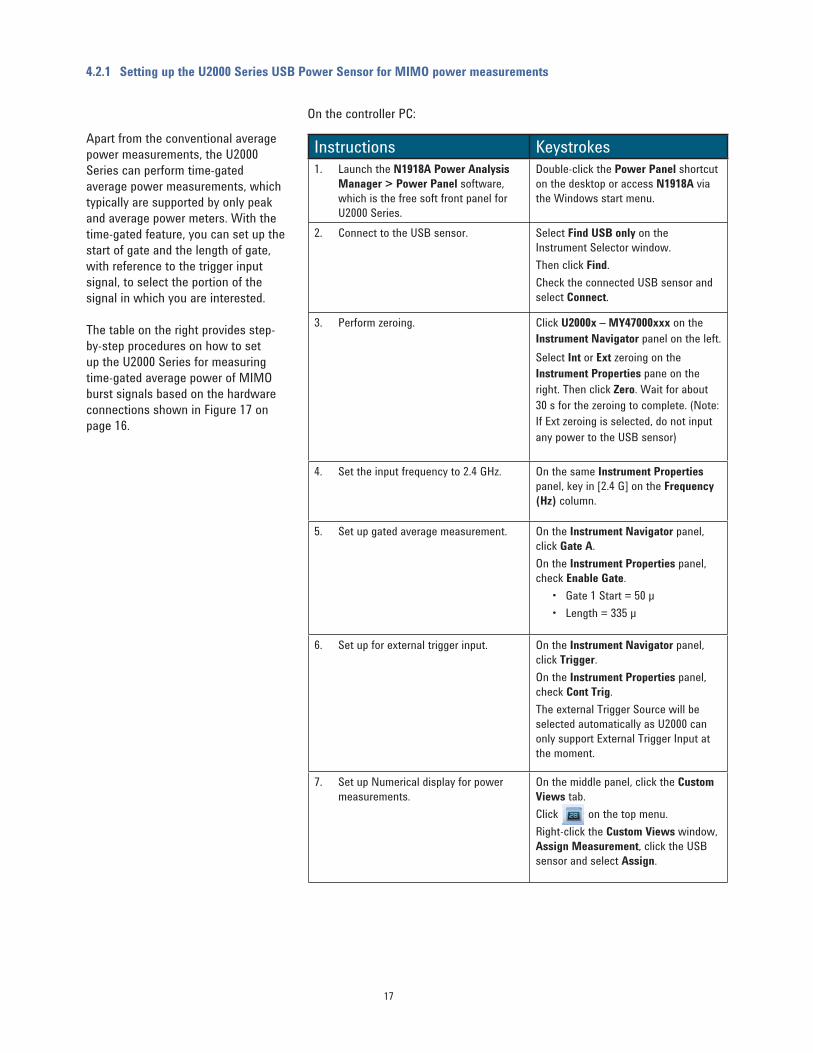
On the controller PC:
4.2.1 Setting up the U2000 Series USB Power Sensor for MIMO power measurements
Apart from the conventional average
power measurements, the U2000
Series can perform time-gated
average power measurements, which
typically are supported by only peak
and average power meters. With the
time-gated feature, you can set up the
start of gate and the length of gate,
with reference to the trigger input
signal, to select the portion of the
signal in which you are interested.
The table on the right provides step-
by-step procedures on how to set
up the U2000 Series for measuring
time-gated average power of MIMO
burst signals based on the hardware
connections shown in Figure 17 on
page 16.
18
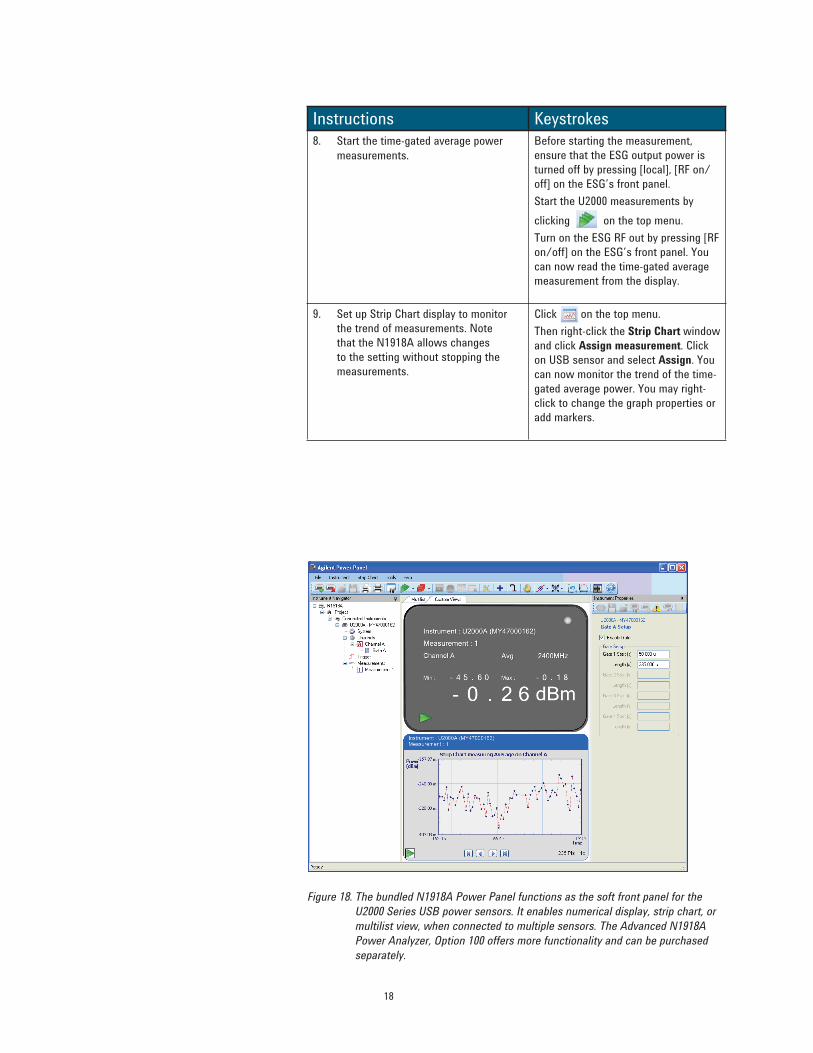
Instructions KeystrokesStart the time-gated average power 8.
measurements.
Before starting the measurement,
ensure that the ESG output power is
turned off by pressing [local], [RF on/
off] on the ESG’s front panel.
Start the U2000 measurements by
clicking on the top menu.
Turn on the ESG RF out by pressing [RF
on/off] on the ESG’s front panel. You
can now read the time-gated average
measurement from the display.
Set up Strip Chart display to monitor 9.
the trend of measurements. Note
that the N1918A allows changes
to the setting without stopping the
measurements.
Click on the top menu.
Then right-click the Strip Chart window
and click Assign measurement. Click
on USB sensor and select Assign. You
can now monitor the trend of the time-
gated average power. You may right-
click to change the graph properties or
add markers.
Figure 18. The bundled N1918A Power Panel functions as the soft front panel for the
U2000 Series USB power sensors. It enables numerical display, strip chart, or
multilist view, when connected to multiple sensors. The Advanced N1918A
Power Analyzer, Option 100 offers more functionality and can be purchased
separately.
19
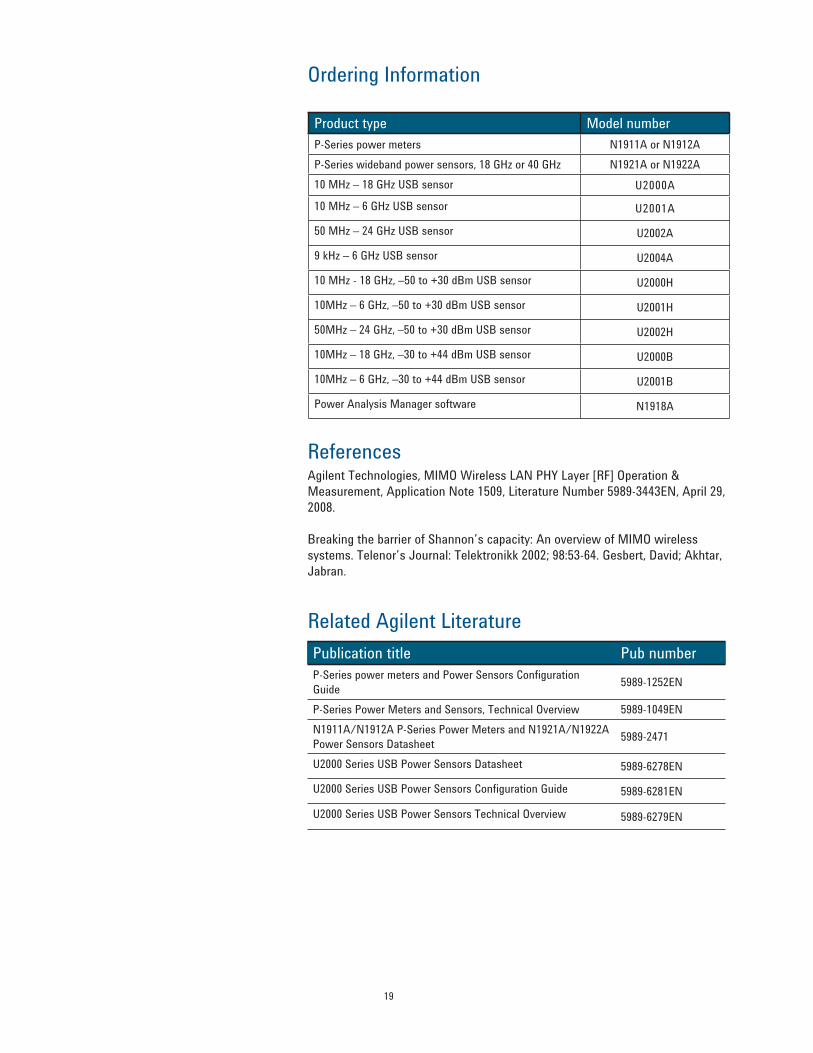
Product type Model number
P-Series power meters N1911A or N1912A
P-Series wideband power sensors, 18 GHz or 40 GHz N1921A or N1922A
10 MHz – 18 GHz USB sensor U2000A
10 MHz – 6 GHz USB sensor U2001A
50 MHz – 24 GHz USB sensor U2002A
9 kHz – 6 GHz USB sensor U2004A
10 MHz - 18 GHz, –50 to +30 dBm USB sensor U2000H
10MHz – 6 GHz, –50 to +30 dBm USB sensor U2001H
50MHz – 24 GHz, –50 to +30 dBm USB sensor U2002H
10MHz – 18 GHz, –30 to +44 dBm USB sensor U2000B
10MHz – 6 GHz, –30 to +44 dBm USB sensor U2001B
Power Analysis Manager software N1918A
ReferencesAgilent Technologies, MIMO Wireless LAN PHY Layer [RF] Operation &
Measurement, Application Note 1509, Literature Number 5989-3443EN, April 29,
2008.
Breaking the barrier of Shannon’s capacity: An overview of MIMO wireless
systems. Telenor’s Journal: Telektronikk 2002; 98:53-64. Gesbert, David; Akhtar,
Jabran.
Ordering Information
Related Agilent Literature
Publication title Pub number
P-Series power meters and Power Sensors Configuration
Guide5989-1252EN
P-Series Power Meters and Sensors, Technical Overview 5989-1049EN
N1911A/N1912A P-Series Power Meters and N1921A/N1922A
Power Sensors Datasheet5989-2471
U2000 Series USB Power Sensors Datasheet 5989-6278EN
U2000 Series USB Power Sensors Configuration Guide 5989-6281EN
U2000 Series USB Power Sensors Technical Overview 5989-6279EN
Remove all doubt
Our repair and calibration services
will get your equipment back to you,
performing like new, when prom-
ised. You will get full value out of
your Agilent equipment through-
out its lifetime. Your equipment
will be serviced by Agilent-trained
technicians using the latest factory
calibration procedures, automated
repair diagnostics and genuine parts.
You will always have the utmost
confi dence in your measurements.
For information regarding self
maintenance of this product, please
contact your Agilent offi ce.
Agilent offers a wide range of ad-
ditional expert test and measure-
ment services for your equipment,
including initial start-up assistance,
onsite education and training, as
well as design, system integration,
and project management.
For more information on repair and
calibration services, go to:
www.agilent.com/fi nd/removealldoubt
Agilent Email Updates
www.agilent.com/fi nd/emailupdates
Get the latest information on the
products and applications you select.
Agilent Direct
www.agilent.com/fi nd/agilentdirect
Quickly choose and use your test
equipment solutions with confi dence.
AgilentOpen
www.agilent.com/fi nd/open
Agilent Open simplifi es the process
of connecting and programming
test systems to help engineers
design, validate and manufacture
electronic products. Agilent offers
open connectivity for a broad range
of system-ready instruments, open
industry software, PC-standard I/O
and global support, which are
combined to more easily integrate
test system development.
For more information on Agilent Technol-ogies’ products, applications or services, please contact your local Agilent offi ce.
The complete list is available at:
www.agilent.com/fi nd/contactus
AmericasCanada (877) 894-4414 Latin America 305 269 7500United States (800) 829-4444
Asia Pacifi cAustralia 1 800 629 485China 800 810 0189Hong Kong 800 938 693India 1 800 112 929Japan 0120 (421) 345Korea 080 769 0800Malaysia 1 800 888 848Singapore 1 800 375 8100Taiwan 0800 047 866Thailand 1 800 226 008
Europe & Middle EastAustria 01 36027 71571Belgium 32 (0) 2 404 93 40 Denmark 45 70 13 15 15Finland 358 (0) 10 855 2100France 0825 010 700* *0.125 €/minute
Germany 07031 464 6333 Ireland 1890 924 204Israel 972-3-9288-504/544Italy 39 02 92 60 8484Netherlands 31 (0) 20 547 2111Spain 34 (91) 631 3300Sweden 0200-88 22 55Switzerland 0800 80 53 53United Kingdom 44 (0) 118 9276201Other European Countries: www.agilent.com/fi nd/contactusRevised: October 6, 2008
© Agilent Technologies, Inc. 2009Printed in USA, January 20, 20095990-3546EN
Microsoft is a U.S. registered trademark of
Microsoft Corporation.
Product specifi cations and descrip-tions in this document are subject to change without notice.
www.agilent.comwww.agilent.com/fi nd/wideband_pow-
ermeters
www.agilent.com/fi nd/usbsensor


![Printed Multi-Band MIMO Antenna Systems and Their ... · the diversity performance of the MIMO antenna system [3]. A ... Multiple-input-multiple-output (MIMO) antenna systems are](https://img.dokumen.tips/doc/110x75/601832972ff2e95336029d17/printed-multi-band-mimo-antenna-systems-and-their-the-diversity-performance.jpg)