Embed Size (px)
Citation preview

Estimation of chemical concentration due to fugitive emissions during chemical process
design
Mimi H. Hassim, DSc. (Tech.)
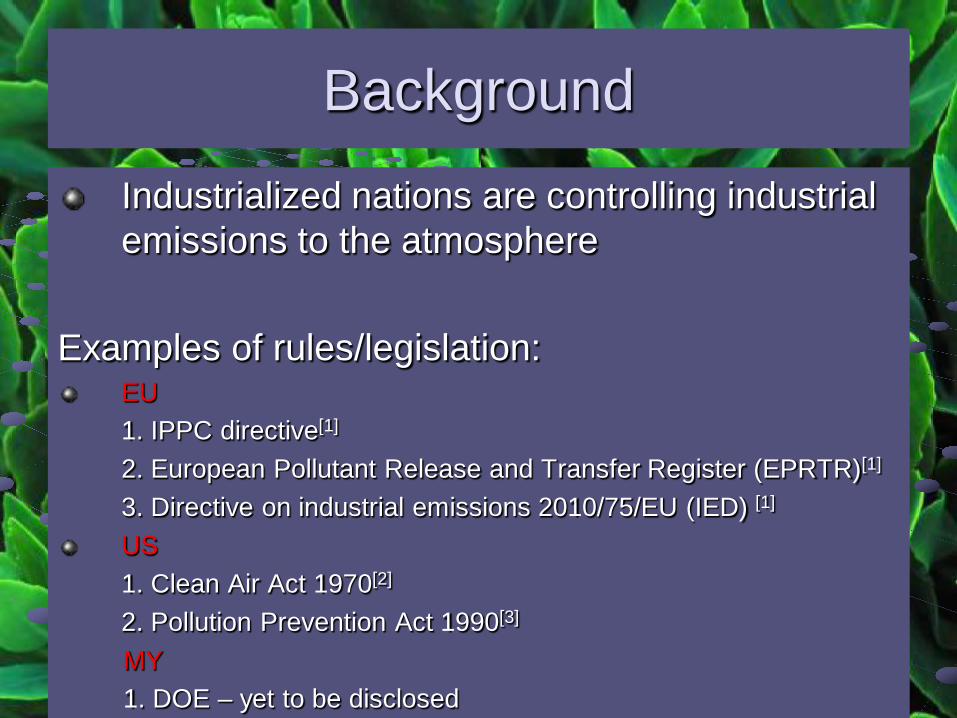
Background
Industrialized nations are controlling industrial emissions to the atmosphere
Examples of rules/legislation:
EU 1. IPPC directive[1] 2. European Pollutant Release and Transfer Register (EPRTR)[1] 3. Directive on industrial emissions 2010/75/EU (IED) [1]
US 1. Clean Air Act 1970[2] 2. Pollution Prevention Act 1990[3] MY 1. DOE – yet to be disclosed

Considerable proportion of emissions are unanticipated – fugitive emission[4]
Chemicals, in any physical forms, represents unanticipated or spurious leak in an industrial site[5]
Leak occurs when there is discontinuties in solid barrier containing the chemicals

In petrochemical industries, fugitive emissions is the most important source of long term exposure which leads to potential hazard[6]
Small amount – exposure is unnoticeable to workers Continuous leak – exposure during plant operation time and thus workers are fully exposed

EXPOSURE ASSESSMENT MODELS
This is the heart of health hazard evaluation and
can be classified in four standard steps namely: hazard identification toxicity assessment exposure assessment risk characterization.
Health exposure can be quantified by direct and indirect methods. Direct method measures the exposure at the point of contact or occurrence.

Example of current models available for exposure assessment
Estimation and Assessment of Substance Exposure (EASE) Predictive Operator Exposure Model (POEM) Qualitative Exposure Assessment (QLEA) Workplace Exposure Assessment (WORKBOOK) ECETOC TRA EMKG
All taken from ref (6)

Disadvantages of the models
Direct contact based method – suitable for indoor or task oriented Require info beyond design phase – suitable for existing plant Not/less consider fugitive emissions

Techniques for estimating fugitive emissions
Direct measurement: applicable to existing process only Mass balance: this requires small amount of material loss and not so accurate. Engineering calculation: this requires complicated techniques and tools. Average emission factor: this is the best because it requires limited process information according to US Environmental Protection Agency (EPA).

Example of available methods for FEs estimation
INSET Toolkit – INSIDE Project EMIS software TANKS software TRIWIN software US EPA
- Average emission factor - Leak/No leak emission factor - Three strata emission factor (stratified) - Leak rate/screening value correlations
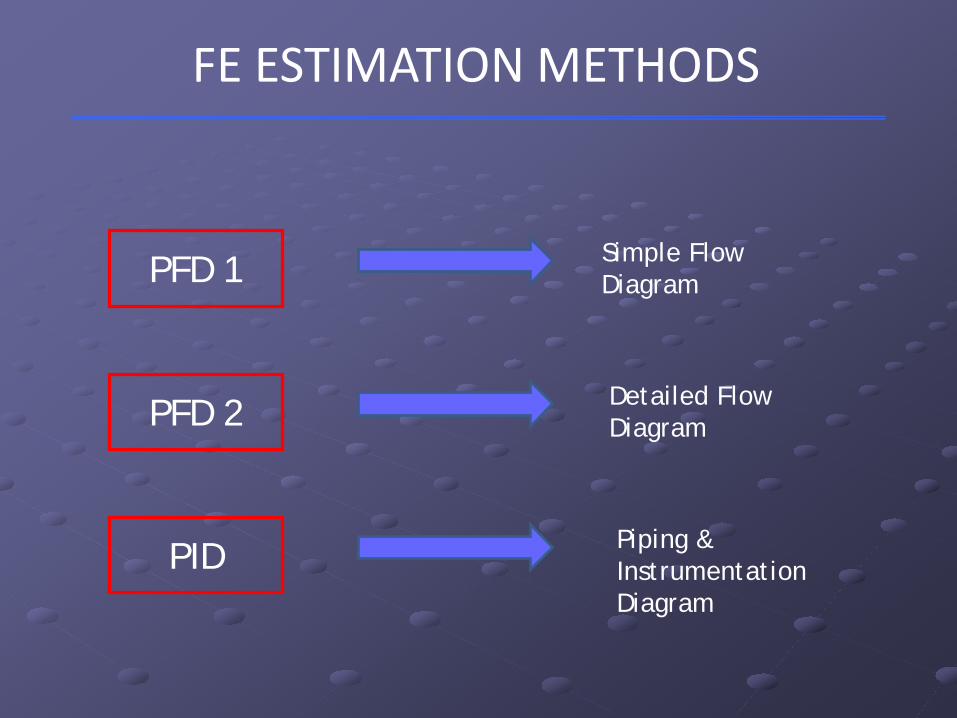
FE ESTIMATION METHODS
Simple Flow Diagram
Detailed Flow Diagram
Piping & Instrumentation Diagram
PFD 1
PFD 2
PID

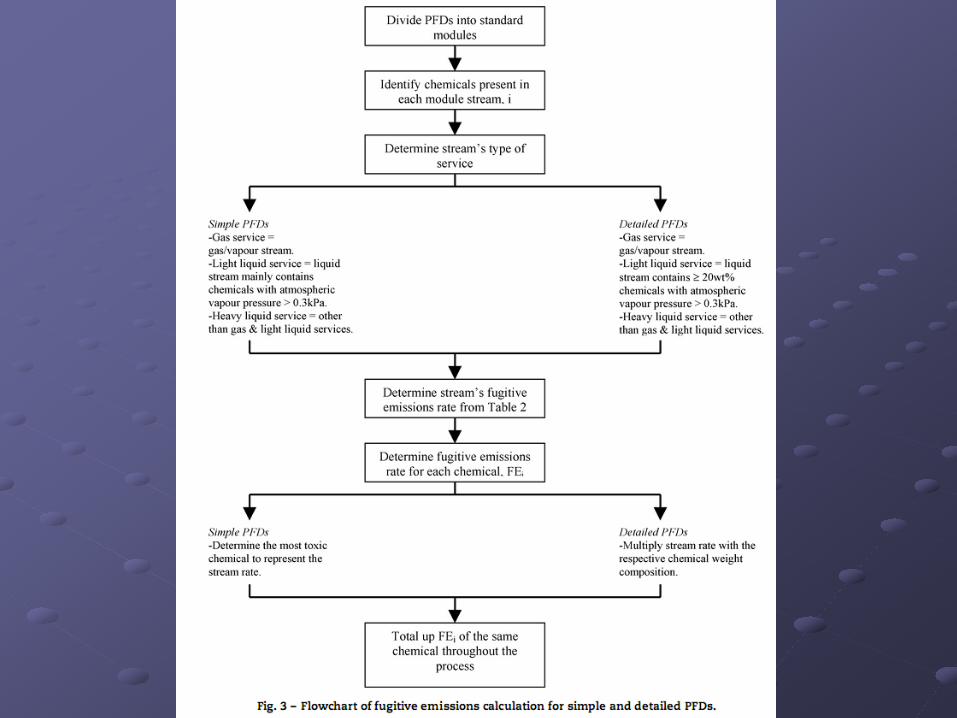
Calculation
Simple PFD Detailed PFD P&ID diagram

PFD 1 (FUGITIVE EMISSION)
Simple PFD: simplified process diagram & descriptions
Based on pre-calculated modules
Provide stream emission estimate for all possible service types

PRE-CALCULATED MODULES Summary of Fugitive Emission Rates in Process Module Stream
1
3
2 3 2
4
1
2
1
a) Stripper/Flash/ Distillation
b) Absorber/Liquid- liquid extractor
c) Ion exchanger
1/2 2/1
2/3
d) CSTR/PFR
Process Equipment Diagram for Stream Number Allocation
Process Module (Fugitive Emission Rate, kg/h) Normal Vacuum Ion Normal Vacuum Total
Stream Service Absorber Stripper Flash LEX Exch CSTR PFR Distillation Comp Feed 1 G/V 0.024 0.117 0 0.057 0.052 0.102 0.059 0.044 0 0.454
LL 0.098 0 0.053 0.048 0.044 0.082 0.127 0.036 0
HL 0.060 0 0.046 0.025 0.029 0.044 0.082 0.021 0
Feed 2 G/V 0.110 0.063 LL 0.113 0.235 0.088 0.052
HL 0.063 0.125 0.046 0.029
Outlet G/V 0.109 0.002 0 0.021 0.123 0.163 0.025 0
2/3 LL 0.464 0.225 0.055 0.100 0.560 0.271 0.405 0.239 HL 0.324 0.127 0.036 0.054 0.378 0.156 0.254 0.137
G&LL mix 0.498
G&HL mix 0.380
Outlet G/V
3/4 LL 0.236 0.159 0 0.301 0.097 0.217 0.139 HL 0.134 0.094 0 0.165 0.059 0.137 0.082

EXAMPLE FOR SIMPLE PFD A distillation unit (ACH based route):
MMA MAA MeOH Water
2 MMA MeOH
3 MAA Water
1
Stream Chemical Service FEi (kg/h) Worst chemical
1 MMA, MAA, MeOH, water Light liquid 0.036 MMA
2 MMA, MeOH Light liquid 0.405 MMA
3 MAA, Water Heavy liquid 0.137 MAA
Total, FEt (kg/h) 0.578
Substance Exposure limit (mg/m3) Methyl methacrylate (MMA) Methacrylic acid (MAA) Methanol (MeOH) Water
42 71
270 Nil

PFD 2 (FUGITIVE EMISSION)
Detailed PFDs: mass and energy balances Similar approach to simple PFD
Differences:
Classification of stream’s service type: based on more specific guidelines (LL: ≥20 wt% chemicals with VP (@20 °C) > 0.3 kPa) Correction of stream emission rate with the respective weight composition

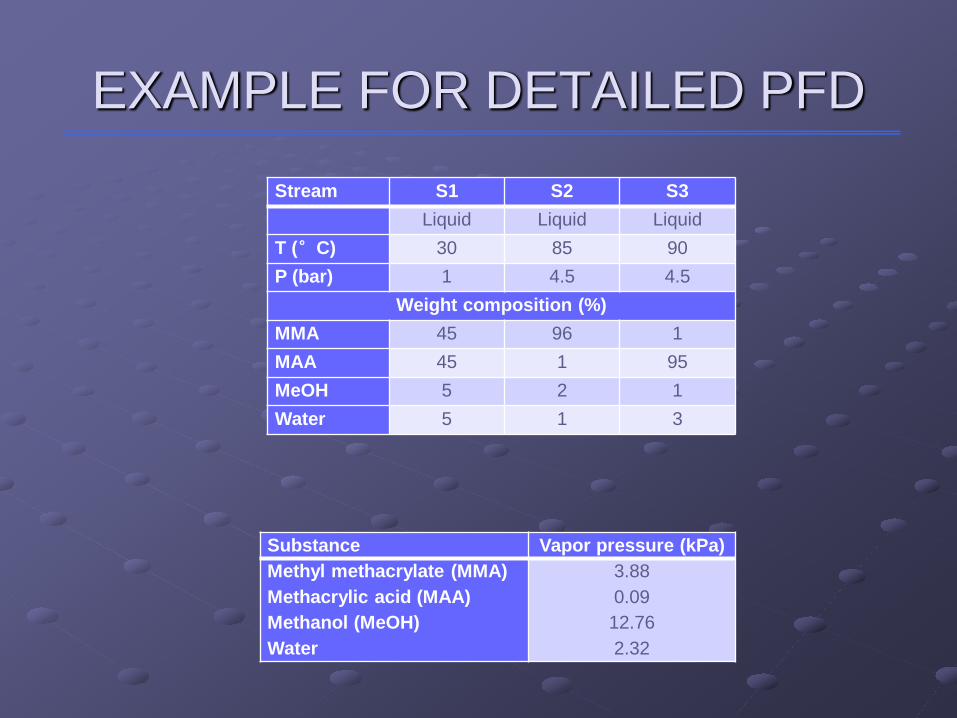
EXAMPLE FOR DETAILED PFD
Stream S1 S2 S3 Liquid Liquid Liquid
T (°C) 30 85 90 P (bar) 1 4.5 4.5
Weight composition (%) MMA 45 96 1 MAA 45 1 95 MeOH 5 2 1 Water 5 1 3
Substance Vapor pressure (kPa) Methyl methacrylate (MMA) Methacrylic acid (MAA) Methanol (MeOH) Water
3.88 0.09 12.76 2.32
PID (FUGITIVE EMISSION)
Based on piping and equipment details
Emission Factors: specific type of piping equipment instead of service type
Correction of stream emission rate with the respective weight fraction
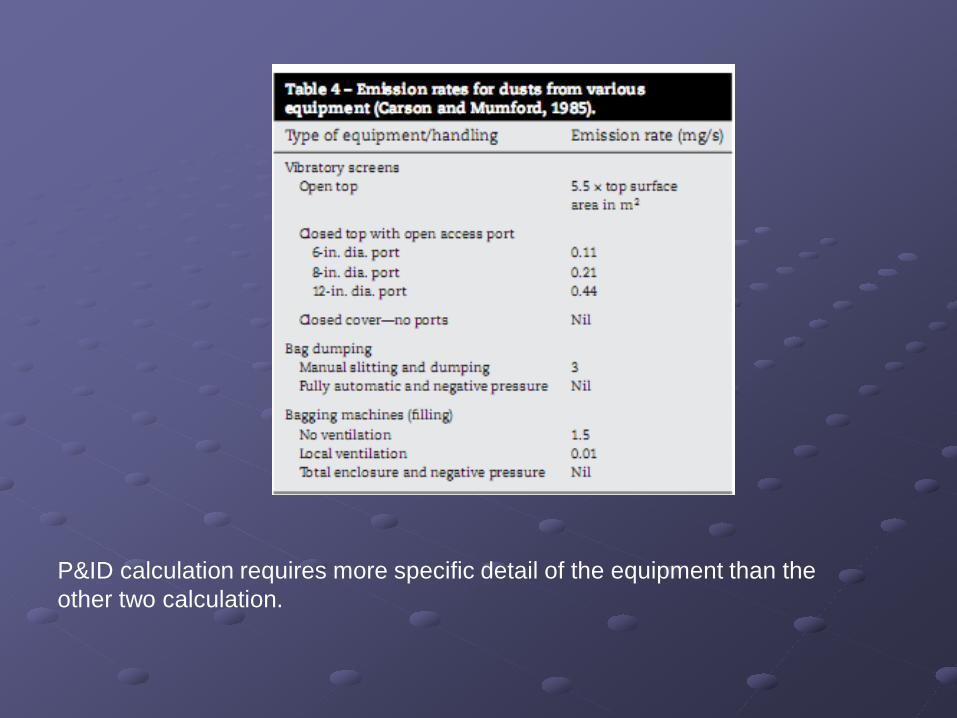
P&ID calculation requires more specific detail of the equipment than the other two calculation.

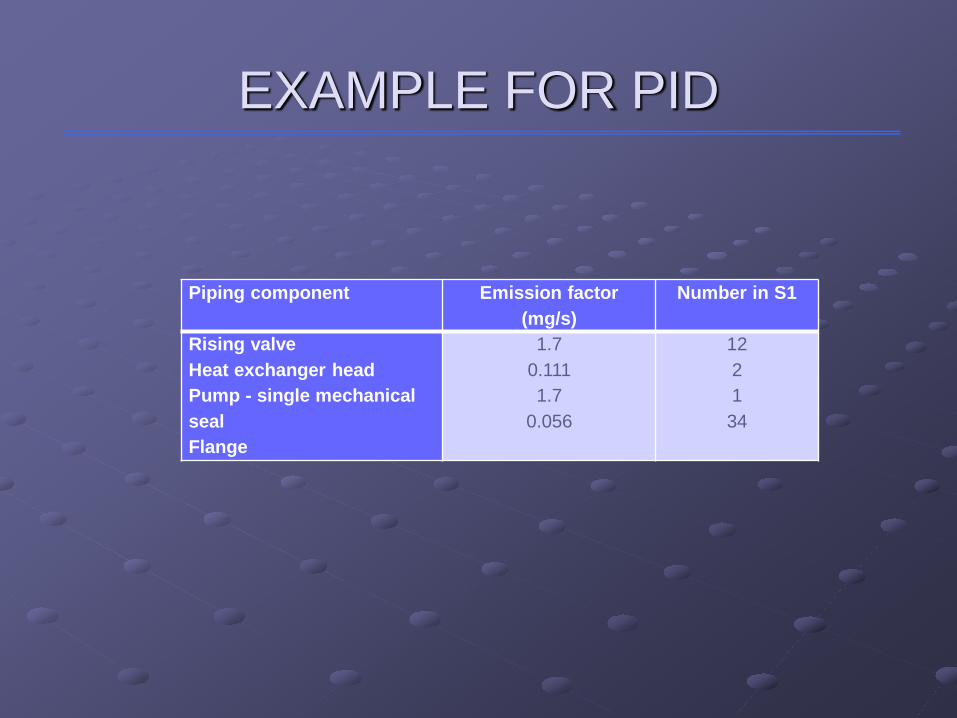
EXAMPLE FOR PID
Piping component Emission factor
(mg/s) Number in S1
Rising valve Heat exchanger head Pump - single mechanical seal Flange
1.7 0.111 1.7
0.056
12 2 1 34

Volumetric Air Calculation
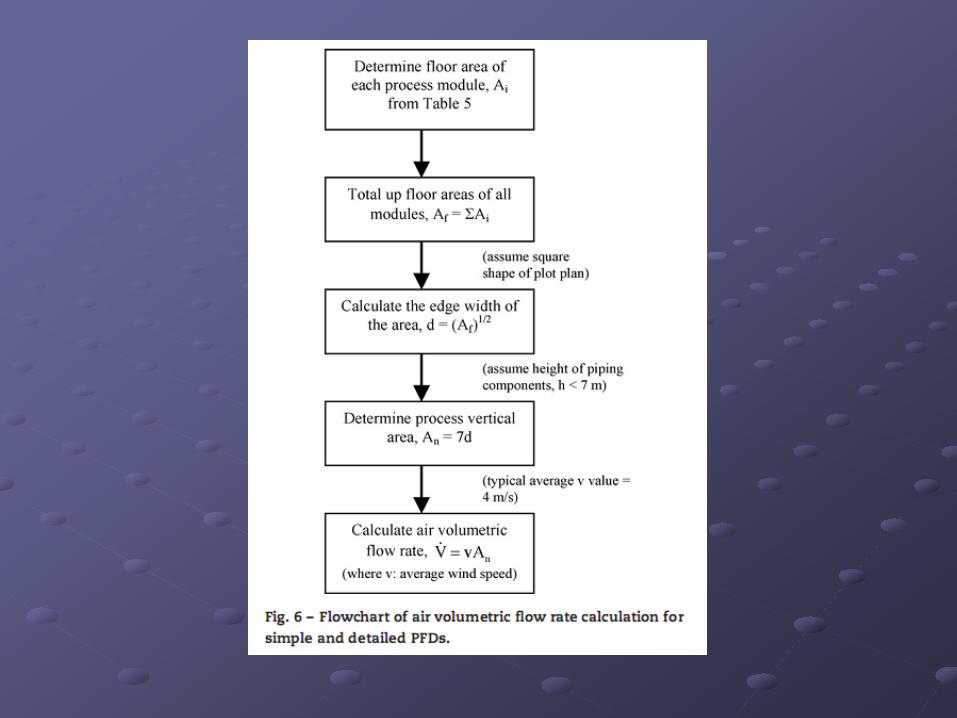

Square plot width dimension = d = (Ar)1/2 = (1103)1/2 = 33.21
33.21

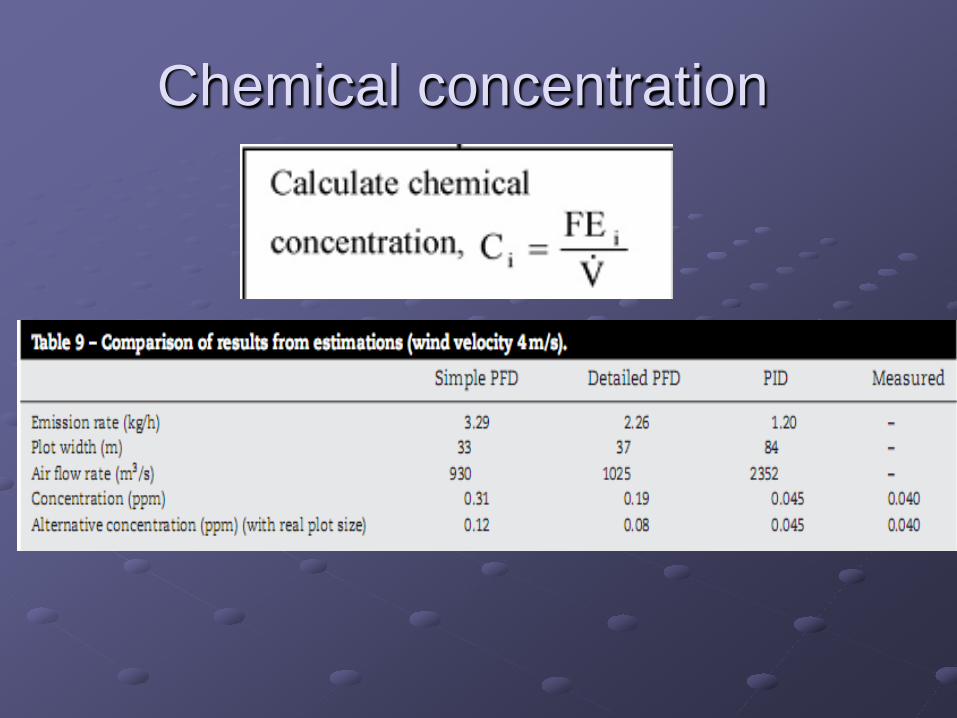
Chemical concentration

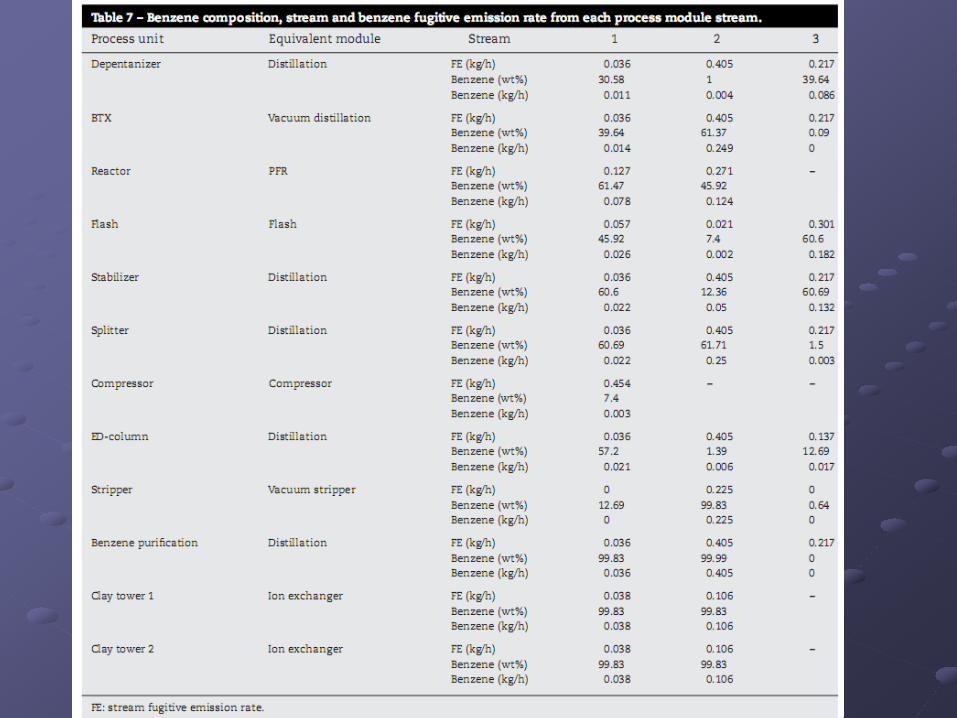
CASE STUDY
Borealis benzene manufacturing plant
Located in Porvoo, Finland
Chemical monitored in the plant: Benzene
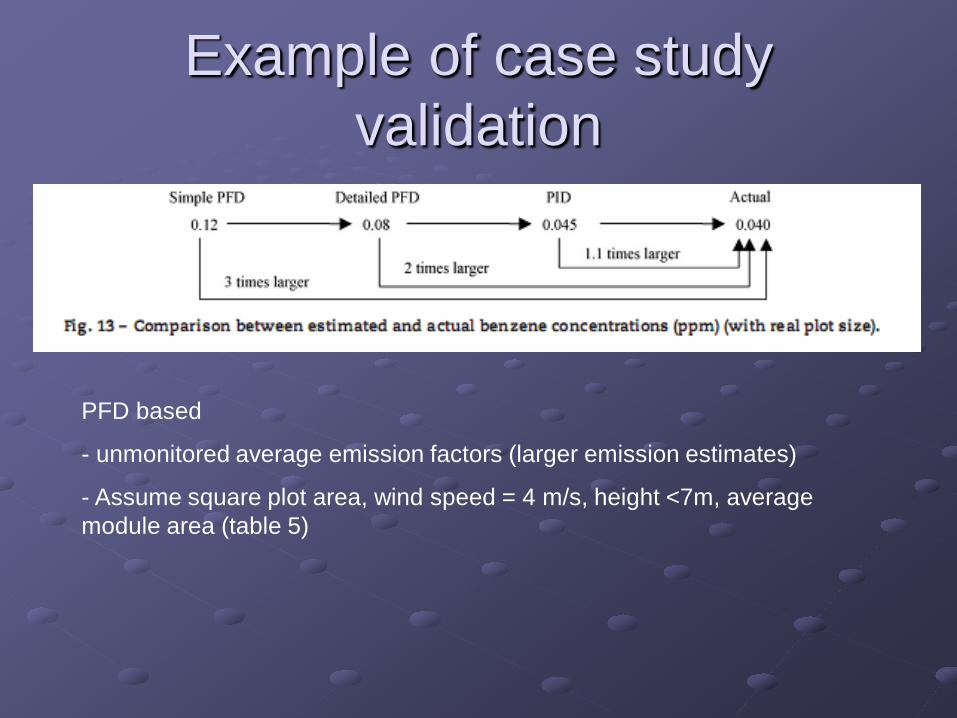
Example of case study validation
PFD based
- unmonitored average emission factors (larger emission estimates)
- Assume square plot area, wind speed = 4 m/s, height <7m, average module area (table 5)

EXPOSURE RISK ESTIMATION Concentration-based health quotient concept Estimate air volumetric flow rate (Q)
ELCC
Noncarcinogen: < 1 Carcinogen: < 0.1
RISK =
QFEC =