Embed Size (px)
Citation preview
Millennial Wine Consumers: Attitudes towards Alternative Wine Packaging
Primary Investigator Nicholas E. Johnston Research Assistant
Texas Wine Marketing Research Institute Texas Tech University
1301 Akron Avenue Lubbock, TX 79409-1240
Tel. 806-834-4215 Email: [email protected]
Project Supervisor Dr. Natalia Velikova
Associate Director / Associate Professor Texas Wine Marketing Research Institute
Texas Tech University 1301 Akron Avenue
Lubbock, TX 79409-1240 Tel. 806-834-3589
Email: [email protected]
Funding Agencies Texas Wine Marketing Research Institute
www.depts.ttu.edu/hs/texaswine
The Wine Market Council www.winemarketcouncil.com

ii
Table of Contents
1. EXECUTIVE SUMMARY .............................................................................................................. 4
2. BACKGROUND AND JUSTIFICATION ..................................................................................... 5
3. METHODOLOGY ........................................................................................................................... 6
3.1 Phase I: Focus Groups (Qualitative) ........................................................................................... 6
3.2 Phase II: Consumer Survey (Quantitative) ............................................................................... 6
4. QUALITATIVE RESULTS ............................................................................................................ 7
4.1. Socio-demographic Profile of Focus Group Participants ................................................... 7
4.2. Consumption Behaviors of Focus Group Participants ........................................................ 7
4.3. Focus Group Results ........................................................................................................................ 8
5. QUANTITATIVE RESULTS ....................................................................................................... 27
5.1. Socio-Demographic Profile of Consumer Panel .................................................................. 27
Geographic representation ............................................................................................................. 27
Gender ..................................................................................................................................................... 27
Age ............................................................................................................................................................ 27
Education ............................................................................................................................................... 28
Income .................................................................................................................................................... 28
Ethnicity ................................................................................................................................................. 28
Marital status ....................................................................................................................................... 29
5.2. Consumption Behavior and Involvement .............................................................................. 29
Beverage preference ......................................................................................................................... 30
Wine knowledge and involvement .............................................................................................. 30
Wine preferences ................................................................................................................................ 32
Consumption frequency ................................................................................................................... 32
Purchasing behaviors ....................................................................................................................... 33
Involvement based on preference ............................................................................................... 35
Preferences and behavior based on age .................................................................................... 35
5.3. Alternative Packaging ................................................................................................................... 36
Alternative wine packaging purchase motivation ................................................................. 36
Survey images ...................................................................................................................................... 38
Alternative packaging: Type 1 ....................................................................................................... 39
Alternative packaging: Type 2 ....................................................................................................... 44
iii
Alternative packaging: Type 3 ....................................................................................................... 49
Alternative packaging: Type 4 ....................................................................................................... 54
Comparison of alternative packaging types ............................................................................. 58
6. MARKETING SUGGESTIONS AND RECOMMENDATIONS .............................................. 60
6.1 Profile of Millennial Wine Consumer ....................................................................................... 60
6.2 Millennials Motivations for Utilizing Alternative Wine Packaging ............................... 61
Price and value .................................................................................................................................... 61
Design attributes ................................................................................................................................ 61
Convenience & functionality .......................................................................................................... 62
Social Perceptions .............................................................................................................................. 63
Situational usage ................................................................................................................................. 63
4 | P a g e
1. EXECUTIVE SUMMARY
The Texas Wine Marketing Research Institute at Texas Tech University conducted a study on Millennials’ perceptions and preferences of alternative wine packaging. The project was co-funded by the Texas Wine Marketing Research Institute and the Wine Market Council. The Millennial generation (ages 21-39) is one of the largest cohorts in U.S. history and they are substantial wine consumers, poised to surpass the baby boomer generation. As wine consumers, Millennials are demanding new, convenient, exciting, and eco-friendly products. In response to this growing demand, many producers are exploring alternative wine packaging. Alternative wine packaging is defined as any type of container that holds wine for retail sale which is not a traditional 750 ml glass bottle. It is important to know consumers’ impressions towards alternative wine packaging because favorable perceptions towards wine packaging results in the selection of wine products and positive evaluations of wine brands. With this understanding in mind, the primary goals of this study were to (1) profile Millennial wine consumers and (2) explore their attitudes and preferences towards alternative wine packaging. Design: The study was implemented through a mixed methods research design. In Phase I, a qualitative approach was taken which included four focus group sessions to gather Millennials’ opinions about alternative wine packaging. A total of 37 individuals participated. Phase II included collecting quantitative data via online survey distributed to Millennials in the U.S. A total of 2,410 responses were utilized. Summary of Results: The findings demonstrate that Millennial wine consumers are knowledgeable and interested in wine but differ in preference based on age and gender. In reference to alternative packaging, these price conscious consumers purchase alternatively packaged products for use in particular situations, such as when gathering with family and friends. Furthermore, they are drawn towards alternative packaging that has modern, natural, and simple design elements as well as packaging that is highly functional and conveys value. Overall, Millennial wine consumers appear to be interested in alternative wine packaging yet are unfamiliar with the various types of alternative packaging available. Benefits to the industry: Wine producers have to ensure that they deliver products that meet or exceed consumers’ expectations. These expectations are largely formed by consumers’ perceptions of the packaging used to deliver the product. This project provides important managerial implications for strategic decisions concerning alternative wine packaging and the Millennial generation. This study is useful in designing and implementing marketing programs for the development and promotion of alternative wine packaging.

5 | P a g e
2. BACKGROUND AND JUSTIFICATION
Wine packaging has a host of interrelated components that convey different types of messages to consumers. The bottle shape and color, closure type, and label presentation are packaging characteristics commonly used to differentiate product types (Barber & Almanza, 2006). Wine producers understand that contemporary consumers shop with their eyes, thus producers are experimenting with alternative packaging as a means of differentiating themselves on the crowded retail shelf.
Challenging the traditional 750 ml glass bottle, some producers have explored packaging alternatives such as, Tetra Pak, wine on tap from steel kegs, oddly sized bottles, bag-in-box, plastic containers (e.g., pouches), and aluminum cans. Research has proven the design of wine packaging - namely the bottle size, shape and color - can directly reflect the quality of the product to the consumer (Jennings & Wood, 1994; Reidick, 2003). For example, consumers have been found to perceive screw-top closures, non-glass containers, larger formed bottles, and boxed wines as a lesser quality wine product (Reidick, 2003). However, research also postulates that some consumers – namely the Millennial generation – are demanding new, exciting, convenient, and eco-friendly wine packaging (Haderspeck, 2014). Producer Eric Steigelman noted in a 2014 interview that “[Millennial] consumers are looking for something different,” he continued by adding, “ functional packaging delights the [Millennial] consumer… this is innovation” (Johnson, 2014).
Amidst a highly competitive and arguably product saturated market, wine marketing experts recommend producers seek new populations, which in turn, will be the future of the U.S. wine market (Thach & Olsen, 2006). Thus, the current project focuses on Millennial wine consumers by investigating their consumption patterns as well as their opinions about alternative wine packaging.

6 | P a g e
3. METHODOLOGY
The population of interest was the U.S. Millennial wine consumer. Although various sources define the age range of Millennials differently, this study adopted the definition utilized by the Wine Market Council, which defines the Millennials currently being between the ages of 21 and 39 (WMC, 2016). Considering the age span of this consumer segment the researchers anticipated there would be differences in opinions between older and younger Millennials. Therefore, data were collected from younger (21-25), middle aged (26-31), and older (32-39) Millennial wine consumers. This project utilized a mixed methodological approach and was conducted in two phases – qualitative and quantitative. Because of the lack of available information pertaining to Millennial wine consumers and alternative wine packaging, focus groups were first conducted (Phase I). The qualitative data were obtained from the focus groups was then utilized to develop and refine the consumer survey (Phase II). The online consumer survey which was hosted by Survey Sampling International (SSI) and distributed to Millennial wine consumers. 3.1 Phase I: Focus Groups (Qualitative)
Focus group data were collected during a three-week period in the Fall of 2015. Participants were recruited via a campus-wide advertisement as well as through social media posts by the researchers. Overall, 37 individuals participated in the focus groups. The researchers divided the participants into three groups based on age (21-24, 25-30, & 31-38). This is procedure is recommended to ensure group harmony and to entice conversation (Berg & Lune, 2012). An additional (fourth) focus group session was added to test for saturation and included participants between the ages of 24 and 29. From a qualitative analysis perspective, data saturation implies that no new information is being offered by the participants, thus the discussion of the topic of interest has been exhausted. Saturation was achieved during the final focus group session. 3.2 Phase II: Consumer Survey (Quantitative)
Online survey data were collected during a one-week period in the Fall of 2015. A consumer panel from Survey Sampling International (SSI) was used to sample U.S. Millennial wine consumers. A total of 2410 usable responses were collected and analyzed, yielding a 96.4% usable response rate. The researchers placed quota limits on key demographic identifiers in order to accurately represent the U.S. wine consumer segment. All survey responses were anonymous and no personal information was asked.

7 | P a g e
4. QUALITATIVE RESULTS
4.1. Socio-demographic Profile of Focus Group Participants
The overall focus group sample was skewed towards more females (30 Females and 7 Males) yet fairly balanced in terms of both genders representation. Since the target population is Millennial wine consumers, it is not surprising that there were more women in the sample than men. Most studies on wine consumption in the U.S. report a similar split of gender representation, as in the US market females generally represent a higher percentage of wine consumers compared to males. The respondents had considerably higher levels of education, with the vast majority having earned either an undergraduate or graduate degree. Given recruitment took place in a town with a major university and the target population were Millennials, it was assumed a majority of participants would be formally educated and/or current students. A total of 15 participants indicated they were students and 26 noted they had completed either their undergraduate and/or graduate degree at the time of the study. In terms of annual household income, the majority (24) reported $60,000 or less. Finally, the number of participants that represented each group included 14 (21-24), 16 (25-30), and 7 (31-38). 4.2. Consumption Behaviors of Focus Group Participants
To better understand wine consumption patterns of the focus group participants, they were asked to fill out a brief survey. Based on the results, the majority of Millennials noted that wine and spirits are their most frequently consumed alcoholic beverages and they expressed a preference for dry red wine. In terms of frequency, more than half of the sample stated they consume wine at least once a week or more and pay $10 - $25 for a bottle to consume at home. Finally, Millennials indicated they make most of their wine purchases at supermarkets/grocery stores. Table 4.1 displays details of the results.

8 | P a g e
Table 4.1. Focus Group Participant Consumption Preferences (N =37) Consumption Preference Number Beverage type Beer 7
Wine 17 Sprits 13 Wine type
Red 24 White 10 Rosé/ Blush wine 1 Champagne/ Sparkling 2 Dry vs. sweet
Dry 18 Sweet 9 Equal preference 10 Consumption frequency
Daily 2 Several times a week 11 Once a week 7 About once in two weeks 13 About once a month 3 Rarely 1 Price paid for a bottle to drink at home
$1 - $9.99 3 $10 - $14.99 17 $15 - $25 17 *Preferred retail outlet
Supermarket/Grocery store 25 Liquor store 9 Warehouses/clubs (SAMs, Costco, etc) 2 Supercenters/Hypermarkets (Walmart, etc.) 6 Convenience stores 0 Drug stores 0 Wineries 3 Note: *Participants could select multiple options
4.3. Focus Group Results
A detailed discussion guide was developed by the researchers and utilized during the focus groups in order to collect information about Millennials attitudes and preferences for wine and alternative wine packaging. Upon completing the analysis, major themes and subthemes were detected. This section presents key findings from the focus group sessions and offers recommendations for the wine industry.
9 | P a g e
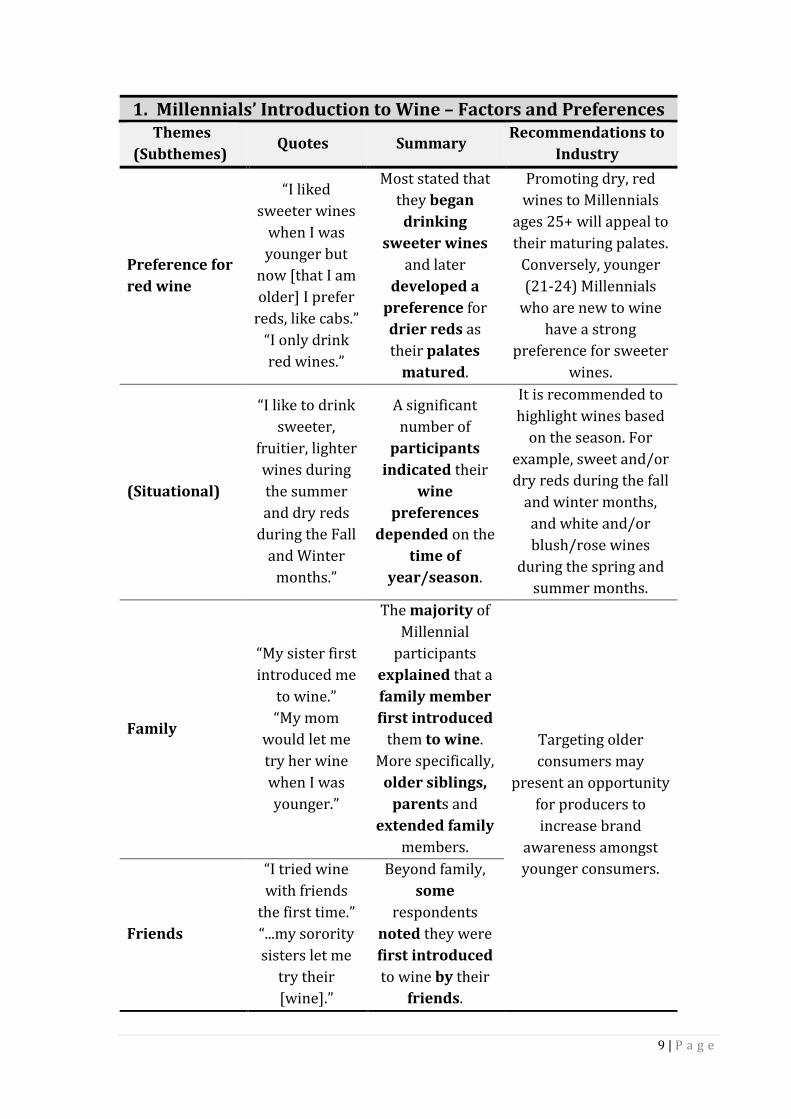
1. Millennials’ Introduction to Wine – Factors and Preferences Themes
(Subthemes) Quotes Summary
Recommendations to Industry
Preference for red wine
“I liked sweeter wines
when I was younger but
now [that I am older] I prefer
reds, like cabs.” “I only drink red wines.”
Most stated that they began drinking
sweeter wines and later
developed a preference for drier reds as their palates
matured.
Promoting dry, red wines to Millennials
ages 25+ will appeal to their maturing palates.
Conversely, younger (21-24) Millennials
who are new to wine have a strong
preference for sweeter wines.
(Situational)
“I like to drink sweeter,
fruitier, lighter wines during the summer and dry reds
during the Fall and Winter
months.”
A significant number of
participants indicated their
wine preferences
depended on the time of
year/season.
It is recommended to highlight wines based
on the season. For example, sweet and/or dry reds during the fall
and winter months, and white and/or blush/rose wines
during the spring and summer months.
Family
“My sister first introduced me
to wine.” “My mom
would let me try her wine when I was younger.”
The majority of Millennial
participants explained that a family member first introduced
them to wine. More specifically,
older siblings, parents and
extended family members.
Targeting older consumers may
present an opportunity for producers to increase brand
awareness amongst younger consumers.
Friends
“I tried wine with friends
the first time.” “...my sorority sisters let me
try their [wine].”
Beyond family, some
respondents noted they were first introduced to wine by their
friends.

10 | P a g e
2. Millennials’ Wine Preferences - Situational Usage
Themes (Subthemes) Quotes Summary Recommendations to
Industry
Social Situations
“I like to have a glass of wine
after work with my friends.”
“My girlfriends
and I drink wine when we get together… for girls night
out or if there’s a [wedding or
baby] shower.”
“I’ll drink wine when I’m at a nice dinner
with friends or coworkers.”
Millennials are social and like to
gather with friends and family. They
prefer wine over other beverages
in particular situations, such
as weddings, baby showers,
and when dining out with friends and coworkers. However, other situations are less desirable
for wine consumption
such as outdoor BBQ’s.
Producers should consider aligning packaging design
based on situations. For example,
packaging should convey fun,
sophistication, functionality, and
value to attract Millennial consumers seeking wine products
for use at weddings and baby showers.
On the other hand, focusing on design
elements that portray relaxation and
functionality would appeal to those
seeking wine for at home use.
At home usage
“My wife and I enjoy relaxing at the end of our week by
treating ourselves to a glass or two of wine. It really helps us relax and puts us in
a better mood.” “I like to cook with wine and maybe have a glass or two.”
Millennial wine consumers view
the consumption of wine as a
means of relaxation. They enjoy a glass or
two when relaxing at
home and/or to unwind after a
long day. Additionally,
many of these consumers noted
they use wine when cooking.
11 | P a g e
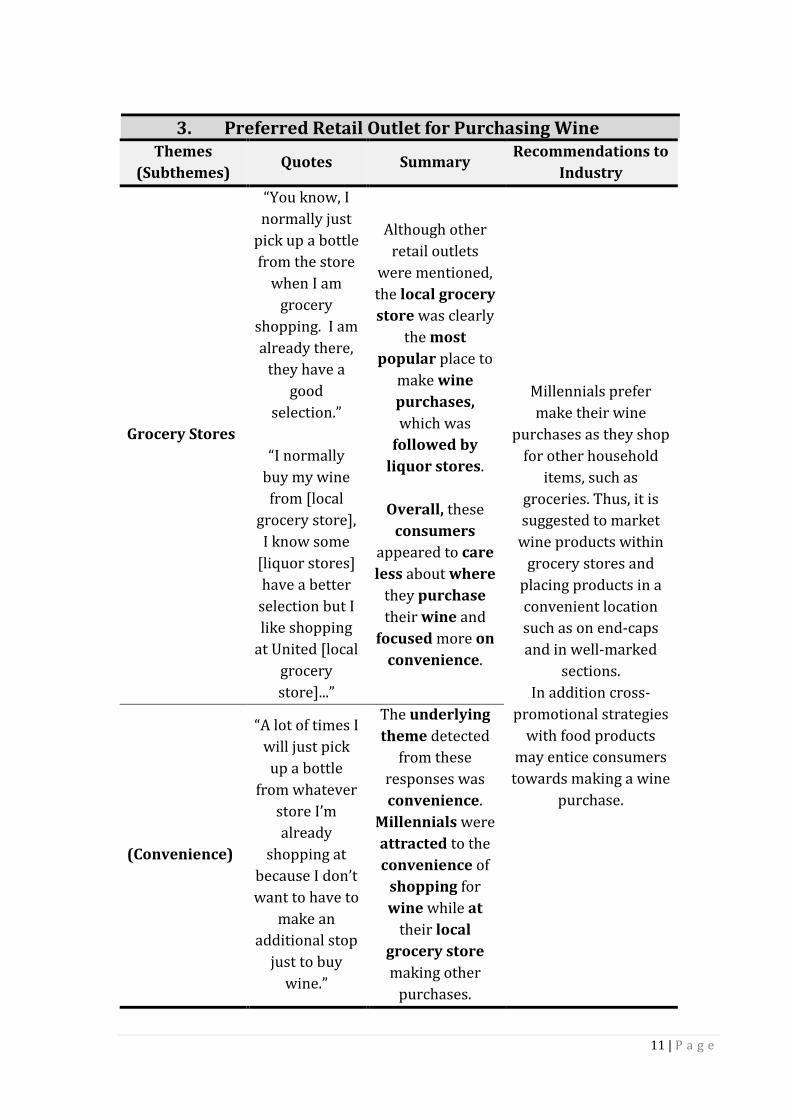
3. Preferred Retail Outlet for Purchasing Wine
Themes (Subthemes)
Quotes Summary Recommendations to
Industry
Grocery Stores
“You know, I normally just
pick up a bottle from the store
when I am grocery
shopping. I am already there,
they have a good
selection.”
“I normally buy my wine from [local
grocery store], I know some
[liquor stores] have a better
selection but I like shopping
at United [local grocery store]...”
Although other retail outlets
were mentioned, the local grocery store was clearly
the most popular place to
make wine purchases, which was
followed by liquor stores.
Overall, these
consumers appeared to care less about where
they purchase their wine and
focused more on convenience.
Millennials prefer make their wine
purchases as they shop for other household
items, such as groceries. Thus, it is suggested to market
wine products within grocery stores and
placing products in a convenient location such as on end-caps and in well-marked
sections. In addition cross-
promotional strategies with food products
may entice consumers towards making a wine
purchase.
(Convenience)
“A lot of times I will just pick up a bottle
from whatever store I’m already
shopping at because I don’t want to have to
make an additional stop
just to buy wine.”
The underlying theme detected
from these responses was convenience.
Millennials were attracted to the convenience of
shopping for wine while at
their local grocery store making other
purchases.

12 | P a g e
4. Millennials Perceptions about Buying Wine Online
Themes (Subthemes)
Quotes Summary Recommendations to
Industry
Lack of Awareness
“I didn't know I could [buy
wine online]. Isn’t it illegal to
have wine shipped in
Texas?” “How does that
work? Is it legal?”
Participants were mostly
unaware they could buy wine
online. In addition, they were unfamiliar with the process of buying wine
online.
If using an online platform for wine sales, producers should focus on
building consumer awareness about the
availability and process for online wine
purchases.
It is also recommended to ease consumer
concerns by building their trust with online wine purchases. This
may be done by offering quality
guarantees for wine products purchased
online. Thus, ensuring the customer that their purchase is protected.
Quality Concerns
“What if the wine is bad or
the bottle breaks.”
“I would have a hard time
trusting [the company and the product] if I bought wine
online.”
Millennials expressed
concern about the quality of the
wine being compromised by
the shipping process from online wine
retailers.
Positive Perceptions
“I have been a member of a
wine club and I really liked it.” “It was fun and
convenient having wine
shipped to me. It was great for
trying new wines I
wouldn't normally buy.”
A few participants
with prior experience
buying wine online enjoyed the hassle-free nature of wine clubs as well as
the ability to explore new
types/brands. Overall, online
wine programs appear favorable
to Millennials.

13 | P a g e
5. Factors Influencing Millennials Wine Purchases Themes
(Subthemes) Quotes Summary Recommendations to Industry
Price
“I have a price range in mind
when I am buying wine
and that determines what I buy.”
“a lot depends
on price...”
Price was a theme that reoccurred
throughout all of the sessions. It plays a major
role in almost all wine purchase decisions made
by Millennial consumers.
It is recommended to position the wine
product based on the price point. If the
product is out of the desired range, these consumers will not
consider making the purchase.
(Situation)
“If I am buying a gift for
someone, like my boss I
might spend more than I
would on myself.”
This finding shows, these
consumers may spend more on a bottle to give as
a gift or for a special occasion.
This may present an opportunity for high-
end labels to build brand
awareness/familiarity with these younger
consumers.
Brand Familiarity
“I like certain brands... so I typically look
for those [brands] when
I buy wine.”
Millennials wine consumers make
assumptions about the quality of the wine based
on their familiarity (or
lack thereof) with the brand.
Millennial wine consumers are
involved and seek familiar labels. Creating and
maintaining a positive brand image amongst millennials is strongly
advised.
Label Design
“...a lot of time I just look for a
neat [interesting/ap
pealing] label...”
Many noted they make wine purchase
decisions based on the design of
the label.
Labels should be utilized as a
differentiation tool designed to grab
Millennials attention.
Variety of Wine
“I only drink dry reds so
that’s all I look for when I buy
wine.”
Some noted the variety of wine influenced their
purchase decisions.
Identifying variety preferences may be useful for targeting
specific groups within the Millennial cohort.

14 | P a g e
6. Past Experiences with Alternatively Packaged Wine
Themes (Subthemes) Quotes Summary Recommendations to
Industry
Box Wine (Bag-in-box)
“Box wine, like we used to
drink in college.”
“I can only
think of wine in a box, like
Franzia.”
“My Aunt always had a box of wine
around. That’s what I think
of.”
Almost all respondents
discussed BIB products. Their opinions about this packaging
type varied but it was clearly the
most recognizable amongst the
Millennial cohort.
The BIB packaging may be useful for
producers that are trying alternative packaging as they appeal to a broad
range of Millennial consumers.
Mini-Bottles
“There are those little bottles, like they sell at games (e.g.,
sporting events).”
“I like to buy
the little bottles, the
small ones to have at home.”
A majority of Millennials
commented on mini-bottles.
They expressed negative
feelings about the quality of the wine but positive
attitudes towards the
functionality of this packaging
type.
Alongside the BIB packaging, producers may consider utilizing
mini-bottles. This packaging type
provides consumers a range of uses, which is desirable to Millennial
consumers.

15 | P a g e
7. Purchasing Experiences for Wine in Alternative Packaging
Themes (Subthemes) Quotes Summary Recommendations to
Industry
Social Gatherings
“We used to buy box wine for
parties [in college].”
“[Box wine] is great for get-
togethers, like baby showers.
We can buy one box and it will last the whole
party.”
These three situational
themes appeared
frequently throughout the
sessions.
Alongside price, Millennials are
situation focused. This
implies that the given situation
is equally important as price when
making purchase decisions for alternatively
packaged wine.
In order to appeal to Millennials, producers are advised to consider the situational usage of
their product(s) and align their efforts to
target those situations.
For example, a blush wine for home use or
gathering with friends would be best in a BIB that fits easily in the
door of a refrigerator.
Conversely, plastic mini-bottles would be desirable for outdoor
use such as camping or beach/lake outings.
Outdoor Activities
“You can’t really carry or at least
it is hard to bring a bottle of wine camping.” “I have bought
those little bottles before when we go to the lake. You
can’t have glass and they fit good
in the cooler.”
Private/At Home Usage
“I do for at home.”
“I’ve bought that to keep in my refrigerator. I like to drink at home but not
always a whole bottle.”

16 | P a g e
8. Millennials’ Preferred Wine Packaging Type Themes
(Subthemes) Quotes Summary Recommendations to Industry
Traditional 750ml Bottle
“It is more traditional, feels like I’m drinking
wine.”
“I like the experience of
opening a bottle [of wine].”
“A bottle is just
better.”
“I would never buy any of these
because the wine that I like to drink could
never be served in something
with so minimal of packaging (referring to
BIB).”
Overall, the Millennial
consumers expressed more
favorable opinions about
traditional wine packaging over
alternative packaging types.
When given a choice most of
these consumers will choose traditional packaging.
Producers may find this information useful
when deciding to utilize alternative wine packaging, especially if the product is directly competing against the
traditional 750ml bottle.

17 | P a g e
Below are examples of some of the alternative wine packages utilized during the focus groups discussions. Packages were placed out for participants to examine and handle. The following tables (9-16) address Millennials attitudes and preferences for alternative packaging.
ALTERNATIVE WINE PACKAGING

18 | P a g e
9. Millennials Impressions towards Alternative Wine Packages
Themes (Subthemes)
Quotes Summary Recommendations to
Industry
Social Perceptions
“…it looks like it's marketed
towards someone that doesn't know
anything about wine.”
“That's the one that you take to
somebody's house that you
really don't want to impress
(referring to a BIB).”
“Like if I was 21, I would probably
pick that one [Sophia cans]...” “That one [Vella BIB] looks like
grandma.”
Many respondents
expressed that alternatively
packaged wine was less socially acceptable than
traditional packaging. The
social perception influence was
strongest amongst younger
Millennials.
Producers should consider the segment of the
Millennial cohort they are trying to target when
launching wine in alternative packaging.
Younger Millennials are more concerned with social
status than their older counterparts.

19 | P a g e
10. Attractive Features of Alternative Wine Packaging
Themes (Subthemes) Quotes Summary Recommendations to
Industry
Functionality
“I think the portion sizes are a lot better. Rather than opening a bottle.” “This one has a straw. That is very useful...” “I think the boxed wine handles are awesome.”
Millennials noted that functionality is very important when considering alternative wine packaging. This theme was raised throughout all of the sessions by all participants.
It is recommended to consider the functionality of the packaging as a fundamental element that entices Millennials towards these packaging types. Therefore, the design of the packaging should convey functionality. This may be done by including handles and pour spouts.
Convenience
“It’s convenient... the portion [size] is right, and I can take that anywhere.” “This one says it's four bottles of wine in one box. That's super convenient.”
Similar to functionality, Millennials are attracted to the convenience of alternatively packaged wine.
Producers should highlight the convenience of utilizing alternatively packaged wine. For instance, high frequency consumers may be attracted to the convenience of one package holding 3 or more liters.
Dislike of Traditional BIB Design
“I would not buy (a BIB similar to Franzia brand) based on the packaging.” “[Vella brand BIB] is not very modern.” “(Vella BIB), it looks exactly like it did when I first saw it when I was 12 years old.”
Of the alternative packaging types discussed, almost all participants expressed strong unfavorable opinions about the “traditional” BIB design used by brands such as Franzia.
To appeal to the Millennial market, producers are advised to incorporate design elements opposite of those utilized by long-standing BIB brands. Millennials are seeking modern packaging designs.

20 | P a g e
11. Graphics/Design Elements Appealing to Millennials’ Themes
(Subthemes) Quotes Summary Recommendations to Industry
Simplicity
“Not the polka dots, it's just too busy.” “Whether it's a box or a bottle, I go for something that's more simplistic.”
Simplistic design elements were far more attractive to Millennials than busy and bold designs.
Design should not focus solely on simplicity but instead balance simplistic design with modern and sophisticated elements to attract Millennials.
Informational
“It’s got the recycling logo on there. That’s cool...” “I like information like where [the wine] is from or how to pair it...”
Millennials enjoyed having information about the wine, producer, and eco-friendly programs displayed on the packaging.
Information should be beneficial to the consumer, such as paring tips tasting tips. Also, including any eco-friendly information pertaining to the product is advised.
Natural/Eco-Design
“When I look at the wine bottle labels, [I] like tree stuff, I like plant things...” “I like the organic look of [Banrock Station].”
Almost all expressed favorable opinions about alternative packaging that incorporated natural and eco-friendly design elements.
Utilizing natural design elements such as images of vineyards and wildlife may attract Millennial consumers.
Sophistication
“I want it [packaging] to look sophisticated even if it was inexpensive.” “I think the flashier the packaging- the more juvenile [the product becomes].”
Millennials felt wine packaging, in general, should be sophisticated and modern. They were not attracted to packaging that appeared young or cheap.
Utilizing reds and backs in the color scheme convey sophistication to these consumers however these should be balanced as to avoid becoming too flashy.

21 | P a g e
12. Messages Alternative Packaging should Communicate
Themes (Subthemes) Quotes Summary Recommendations to
Industry
Eco-Friendly
“...has the recycling logo on it, I think that’s important.” “People in our age group are environmentally conscious... “I like stuff that has nature drawings on it...” “… If part of my purchase is going to go to philanthropy, or to the World Wildlife Fund, that might [persuade] me to [select] that particular bottle.”
Almost all participants expressed favorable opinions about eco-friendly packaging and having eco-friendly messages. Clearly, concern for the environment plays a role in their wine purchasing decision making process.
Millennial wine consumers prefer that alternative packaging be eco-friendly. If this is the case, producers should communicate this message on the packaging and by utilizing specific design elements, such as utilizing natural colors.
Useful Information
“I like that this one talks about like flavor profiles.” “...bits on the back that [provides information about the wine] is helpful.” “…we're at an age where we're learning about wine. It can be like a learning experience.”
In addition to co-friendly messages, Millennials expressed favorable opinions about packages and labels that have relevant information, such as tasting notes and pairing suggestions.
It is recommended to consider the purpose of each piece of information included on the packaging by questioning how it relates to the product. These are involved consumers and they see quality and value in this design element.

22 | P a g e
13. What packaging feature does the most to distinguish one wine from another?
Themes (Subthemes) Quotes Summary Recommendations to
Industry
Modern Design
“…there’s a huge stigma about Franzia, and that’s why I wouldn’t drink boxed wine for the longest time.”
Overall, the results show Millennials prefer design elements that appear less cluttered, different from previous similar products, and have a natural look.
It is recommended to consider balancing a combination of these elements when targeting Millennial wine consumers. For example, the participants noted the Banrock Station 3L BIB (pictured above) had a natural, modern, and simple look.
Natural
“So I like the cardboard, natural looking packaging better for the modern look.”
Simplicity
“…minimalism is kind of the thing now, like, that tells me that this company spends money on this [product]. They probably produce a good product, because they put in the effort to make it look nice, so I think more of their products and the wine.”

23 | P a g e
14. Desirable Packaging Color(s) Schemes Themes
(Subthemes) Quotes Summary Recommendations to Industry
Natural
“I really like the salmon color, because it’s an earthy, natural tone” “I like the Banrock… [I] like [the] earth tones, like [the] nature, classic feeling.” “Not shiny.”
Millennial consumers were mostly attracted to natural color schemes such as browns.
It is recommended to use matted, natural color schemes such as light browns to appeal to this segment.
Modern
“…our generation really likes modern, like sharp edges, kind of simplistic labelling, a minimalist sort of thing.” “It (Black box tetra-pak) just looks a little more modern and grown up than the pink one.” “Red and black, kind of romantic, deep, elegant kind of colors.”
Millennial wine consumers were also attracted to modern design elements.
Utilizing color schemes and design elements that stray away from conventional alternatively packaged wine is appealing to these consumers.

24 | P a g e
15. Millennials’ Tips for Alternative Wine Packaging Design
Themes (Subthemes)
Quotes Summary Recommendations to
Industry
Professional/Age Appropriate
“...Professional.” “Keep it neat.” “Classy.” “…the colorful [design scheme] is more for underage girls, not older wine drinkers.” “…keep it basic. I would say like the [designs] that are most colorful seem like party of young kids...”
Millennial wine consumers, especially younger members of the cohort, frequently associated bold colors and generic packaging as being juvenile and not representative of their generation.
In order to attract Millennials, producers are advised to utilize design schemes that appear to target an older, more mature audience.
Simple/ Modern Design
“Clean,” “minimal” “I feel like if they just keep it straight, simple, to the point, that's how they would get me to buy their [alternatively [packaged wine] product.”
All participants expressed their dislike of bold, colorful, cluttered and traditional design elements.
Design schemes should be plain and not too cluttered because it conveyed simplicity and a modern design to Millennials.

25 | P a g e
16. Millennials’ Tips for Alternative Wine Packaging Design (cont.)
Themes (Subthemes) Quotes Summary Recommendations to
Industry
Useful/ Functional
“… I could throw it in the fridge, in the cooler, and you wouldn't have to worry about it.”
Millennials are motivated to purchases alternatively packaged wine, in part, because if its functionality and usefulness.
It is recommended to highlight the usefulness and functionality of alternative wine packaging, such as by providing tips and suggestions for use on the packaging. In addition, producers should consider where the product is going to be used and incorporate design elements that convey usefulness and functionality to the consumer. For example, a 3L BIB that can fit in the door of a household refrigerator.
Value-Added Social Features
“[I like wine products] that do something else, like if part of my purchase is going to a philanthropy, or a dollar will go to the World Wildlife Fund...” “If I’m making a decision between bottles that [eco-friendly benefits] might push me towards that [particular] bottle.”
Many of the millennial wine consumers interviewed expressed their interest towards products that offer value beyond physical features like handles. They are interested in products that serve multiple purposes. For example, they would be attracted to wine products that also eco-friendly.
Marketers may consider incorporating a philanthropic element such as donating a portion of their proceeds to a charity as a differentiation toll to attract Millennials.

26 | P a g e
17. Millennials’ Tips for Wine Producers Targeting their Cohort Themes
(Subthemes) Quotes Summary
Recommendations to Industry
Respect the Audience
“I feel like they gear a lot of cheaper wines towards [younger Millennials]...” We're not asking for the best wine, we would pay a reasonable price…” “[producers should] Quit trying flashy packaging.”
Millennial wine consumers, especially younger ones, feel misunderstood by marketers. They want to feel accepted and they make purchases that reinforce their desire to appear mature.
In order to appeal to this generation, producers are advised to utilize mature, sophisticated design elements. Millennials were put off by packages that looked generic and flashy.
Value
“Offer more bang for your buck.” “Match the price with the title [label].” “There’s a lot of value with this [BIB] packaging.”
Millennials are motivated by price. They are willing to purchase new or unfamiliar products if there is a perception of value.
It is recommended to convey value though design elements. For example, adding text to the packaging that touts value.
Purposeful Design Elements
“I'd say make it easy ... Like if I look at a box, I want to know what kind of wine it is, or a bottle even, like what kind of wine it is, alcohol percentage, like where it's from.”
Similar to other themes, Millennials are aware of marketing ploys and are less attracted towards products that appear awkward or out of place.
To appeal to Millennials, producers are advised to consider why each element is being added and what level of value it adds to the consumer.

27 | P a g e
5. QUANTITATIVE RESULTS
Based on the results from the focus group sessions, consumer surveys were developed and distributed to Millennials across the U.S. A total of 2418 usable surveys were collected and utilized to profile the Millennial wine consumer (sections 5.1 & 5.2). In addition to profiling, a series of questions explored Millennials attitudes towards alternative wine packaging (see Section 5.3.)
5.1. Socio-Demographic Profile of Consumer Panel
Geographic representation
The sample was purposively segmented to represent different regions of the U.S. The percentages were based on the wine consumption patterns from each state (Beverage Information Group, 2015). For instance, the northeast states of New York, New Jersey, Pennsylvania, and Connecticut collectively account for roughly 17% of the total U.S. wine consumption (Beverage Information Group, 2015). Overall, the sample was deemed representative of the targeted population.
Table 4.2. Geographic Representation of the Sample U.S. Region # of Respondents Percent
Midwest 673 27.9% Northeast 385 16.0% South 509 21.1% West 779 32.3% Pacific 47 2.0%
Total 2393 99.3%
Gender
This study also purposely collected an even amount of responses from males and female Millennials.
Table 4.3. Gender Representation of the Sample Gender # of Respondents Percent Male 1185 49.2%
Female 1212 50.2% Total 2397 99.4%
Age
In addition to gender, the respondents were asked to report their birth year (Table 4.4). The ages of the participants ranged from 21 to 39 and the median were 29 years, which was similar to the mean age of the sample (29.1 years). The researchers later split the sample into three age groups to mirror the profile of the focus group participants.

28 | P a g e
Table 4.4. Age of Participants by Group Age Groups # of Respondents Percent 21-25 695 28.8%
26-31 899 37.3% 32-39 816 33.9% Total 2410 100.0%
Education
Millennials in the sample were well educated; with the majority (53.9%) having earned an undergraduate and/or graduate degree and an additional 15% noted they were attending college at the time of the study.
Table 4.5. The Highest Level of Education Completed Level of Education # of Respondents Percent High school not completed 41 1.7%
High school diploma 491 20.4% Trade/ vocational qualifications 209 8.7% Currently attending college 369 15.3% Undergraduate Degree 741 30.8% Post-graduate degree (e.g., MBA, PhD) 557 23.1% Total 2408 99.6%
Income
Respondents were fairly evenly split in terms of various household income brackets. However, the majority (55.3%) reported an annual income of less than $60,000 and only 12.9% indicated they earned more than $100,001. Overall, the income results were logical considering the average age and current life stage of the cohort.
Table 4.6. Total Annual Household Income Income Level # of Respondents Percent $0 - $20,000 265 11.0%
$20,001 - $40,000 530 21.9% $40,001 - $60,000 541 22.4% $60, 001 - $80,000 446 18.4% $80, 001 - $100,000 310 12.8% $100,001+ 312 12.9% Total 2404 99.4%
Ethnicity
The majority of participants (67.2%) were white/Caucasian of non-Hispanic descent (Table 4.7). Although the results are skewed towards one ethnicity, this finding aligns

29 | P a g e
with existing wine consumer literature, which also found the white/Non-Hispanic segment as the most prevalent wine consumer in the U.S. However, it should be noted that contemporary wine consumer research shows the Hispanic wine consumer segment is rapidly growing (Velikova, Wilkinson, & Harp, 2016).
Table 4.7. Ethnicity of Participants Ethnicity # of Respondents Percent American Indian or Alaska native 33 1.4%
Asian 206 8.5% Black/African American 252 10.5% White/Caucasian – Non-Hispanic 1620 67.2% Hispanic/Latino 256 10.6% Native Hawaiian/Pacific Islander 8 0.3% Other 26 1.1% Total 2410 99.6%
Marital status
In terms of their relationships, the results found marital status was fairly evenly split between single and married. More specifically, roughly 55% of those surveyed were currently married and/or in a domestic partnership and 44.3% of the sample were single, divorced, and/or widowed.
Table 4.8. Marital Status of Participants Marital Status # of Respondents Percent Single 991 41.1%
Married 1116 46.3% Domestic Partnership 202 8.4% Divorced 72 3.0% Widowed 5 0.2% Other 20 0.8% Total 2406 99.8%
5.2. Consumption Behavior and Involvement
In addition to socio-demographic information, a number of questions in the survey asked about the importance of wine in Millennials’ lives as well as their consumption behaviors. Specifically, respondents were asked about their beverage preference, wine consumption frequency, wine preferences, knowledge about wine, and their involvement with wine and the wine industry.

30 | P a g e
Beverage preference
The majority of Millennials prefer wine (60.2%) versus other alcoholic beverages (Table 4.9). However, a requirement to participate in this study was that a person must drink and purchase wine to some degree. Thus, the nature of the research was bias towards wine consumers. On the other hand, a notable amount of Millennials in this study (29.0%) stated they consume beer most often. Table 4.9. Alcoholic Beverage Consumed Most Often Beverage Type # of Respondents Percent Beer 697 28.9%
Spirits 258 10.7% Wine 1454 60.3% Total 2409 99.9%
Additional analysis was conducted to explore group differences based on age and gender. The results show that males are more likely to spread their beverage dollar, particularly on beer products. However, female Millennials are primarily wine drinkers that split their second preference between the two categories. Overall, the findings demonstrate that as Millennials increase in age, so does their preference for wine. Table 4.10. Beverage Preference Segmented by Age and Gender
Beverage Type Males Females
21-25 26-31 32-39 21-25 26-31 32-39 Beer 36.0% 36.4% 33.0% 22.7% 19.6% 18.8% Wine 43.5% 54.4% 57.6% 60.6% 70.2% 71.9% Spirits 10.5% 9.2% 9.4% 16.7% 10.3% 9.3%
N 361 401 427 330 496 388
Wine knowledge and involvement
A set of items were used to measure participants’ level of involvement with wine. The first question asked respondents to report their knowledge about wine. Table 4.10 displays the definitions of each level.
Table 4.10. Self-assessed Wine Knowledge Levels Wine Knowledge Level Definition
Advanced International knowledge of wines; completed wine courses.
Intermediate Know different styles and can identify them.
Basic Know the names of the wines but can’t identify differences between them
No knowledge of wine at all

31 | P a g e
Based on the results, only 2% of the sample noted they did not know much about wine. Conversely, roughly 10% indicated having an advanced knowledge about wine. Overall, the majority (87.9%) of participants considered their wine knowledge as being either at a basic or intermediate level.
Table 4.11. Self-Reported Level of Wine Knowledge Wine Knowledge # of Respondents Percent Advanced 250 10.4%
Intermediate 1136 47.1% Basic 890 36.9% No prior knowledge 70 2.9% Total 2346 97.3%
Next, respondents were asked how much they agreed or disagreed with each of the statements concerning the importance of wine in their lives. The level of agreement with each statement was measured by a 5-point scale, where 1 = ‘strongly disagree’ and 5 = ‘strongly agree.’ According to the results (Table 4.12), Millennial wine consumers have an interest in wine (3.59), find wine to be fascinating (3.71) and purchase it regularly (3.72). Based on the results, Millennials appear to be involved consumers.
Table 4.12. Wine Involvement
Involvement Indicators Average Score
Wine is an important part of my life 3.37 I have a strong interest in wine 3.59 I purchase wine regularly 3.72 I find wine fascinating* 3.71 Notes: N=2418. *Average scores are calculated on a 5-point scale, where 1 = ‘strongly disagree’ and 5 = ‘strongly agree.’
A final involvement question asked whether the respondents were members of a wine club or organization. Only 12.7% of Millennials noted they were involved in a wine club or with a wine organization. Despite this finding, overall, this cohort appears to be knowledgeable and involved wine consumers. Table 4.13. Are you a member of a wine club or organization? Response # of Respondents Percent Yes 302 12.5%
No 2102 87.2% Total 2404 99.8%

32 | P a g e
Wine preferences
After involvement, the respondents were prompted to report the type of wine they prefer (Table 4.14). The majority of Millennials indicated a preference for red wine (55.9%) followed by a preference for whites (33.9%).
Table 4.14. Type of Wine Consumed most often Wine Type # of Respondents Percent Red 1347 55.9%
White 817 33.9% Rosé 206 8.5% Champagne/Sparkling 37 1.5% Total 2407 99.9%
Next, when questioned about their preference for dry or sweet, a majority of the sample noted they prefer sweet wines. The remaining responses were relatively split between dry and an equal preference for both.
Table 4.15. Do you prefer dry or sweet wine? Wine Type # of Respondents Percent Dry 485 20.1%
Sweet 1280 53.1% Equal Preference 640 26.6% Total 2405 99.8%
Wine consumption frequency
Millennials in the sample were involved wine consumers. Over 60% of those sampled noted they drink wine at least once a week or more and roughly one-third indicated consuming wine several times a week. A very small percentage noted drinking wine rarely; and not a single respondent said they never drink wine.
Table 4.16. How often do you consume wine? Frequency of Consumption # of Respondents Percent% Daily 299 12.4%
Several times a week 764 31.7% About once a week 492 20.4% Several times a month 338 14.0% About once a month 242 10.0% Once in a couple of months 136 5.6% A few times a year 88 3.7% Rarely 51 2.1% Total 2410 100.0%

33 | P a g e
When asked about how many glasses of wine they consume at home, over 70% reported less than five glasses a week. On the other hand, roughly a third (28.3%) of the Millennials noted they consume six or more glasses a week. Overall, the sample indicated being fairly frequent consumers of wine when at home.
Table 4.17. How many glasses a week do you consume at home? Frequency of Consumption # of Respondents Percent% 1 - 2 813 33.7%
3 - 5 789 32.7% 6 - 10 476 19.8% 11+ 208 8.6% Total 2386 99.0%
Purchasing behavior
Similar to their consumption frequency, Millennials also purchase wine fairly regularly. Over 55% reported that they make wine purchases several times a month to several times a week. In addition, these results align with the consumption frequency items addressed above.
Table 4.18. How often do you purchase wine? Frequency of Purchases # of Respondents Percent% Daily 103 4.3%
Several times a week 301 12.5% About once a week 551 22.8% Several times a month 525 21.8% About once a month 473 19.6% Once in a couple of months 216 9.0% A few times a year 135 5.6% Rarely 106 4.5% Total 2410 100.0%
Moreover, when asked about where they are purchasing wine for at home consumption, 41.6% stated the grocery store and 38.7% said the liquor store as their preferred retail location (Table 4.19).

34 | P a g e
Table 4.19. Where do you purchase wine most frequently? Retail Location # of Respondents Percent% Grocery stores 971 40.2%
Liquor stores 906 37.5% Warehouse stores 193 8.0% Specialty stores 120 5.0% Convenience stores 51 2.1% Wineries 129 5.3% Online 26 1.1% *Other 6 .2% Total 2402 99.3%
* Three of the “Other” responses indicated pharmacy stores (e.g., CVS and Walgreens). Next, Millennials were questioned about how much they typically pay per bottle for at home consumption. The $10 - $14.99 and $15 - $24.99 price ranges captured 28.3% and 35.9% of the responses, respectively. However, a majority of respondents (75.8%) indicated they typically pay $20 or less for a bottle of wine.
Table 4.20. How much do you typically pay for a bottle to drink at home? Price Range # of Respondents Percent% $0 - $9.99 296 12.2%
$10 - $14.99 684 28.3% $15 - $24.99 869 35.9% $25 - $49.99 363 15.1% $50+ 159 6.6% Total 2372 98.1%
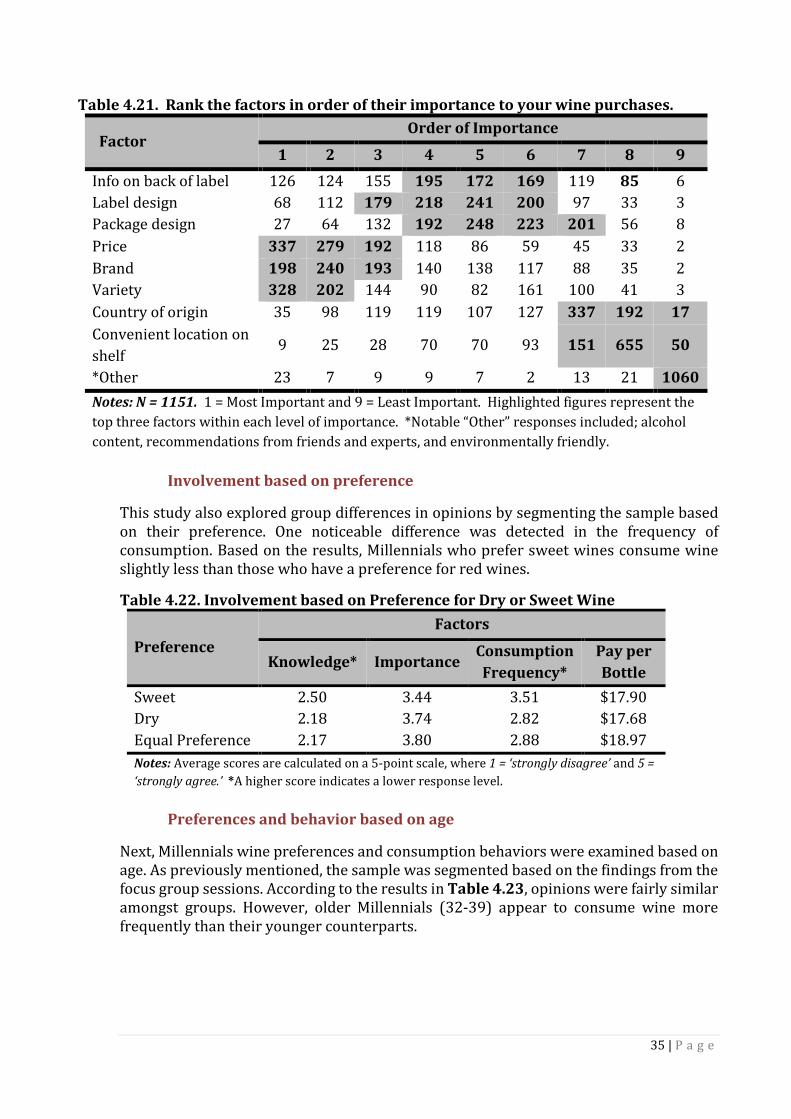
Finally, the participants were asked to rank, in order of importance, the factors that motivate them to select and purchase a bottle of wine at a retail location. As expected, the factors of price, brand, and variety all captured the majority of 1st and 2nd rankings. When making wine purchases, Millennial wine consumers consider these attributes first, which was similar to the relative importance they placed on the same factors during the focus group sessions. Interestingly, the next level of purchase motivation was centered on packaging and label design, which suggests Millennials are at least somewhat motivated to purchase a bottle of wine based on design factors.
35 | P a g e
Table 4.21. Rank the factors in order of their importance to your wine purchases.
Factor Order of Importance
1 2 3 4 5 6 7 8 9 Info on back of label 126 124 155 195 172 169 119 85 6 Label design 68 112 179 218 241 200 97 33 3 Package design 27 64 132 192 248 223 201 56 8 Price 337 279 192 118 86 59 45 33 2 Brand 198 240 193 140 138 117 88 35 2 Variety 328 202 144 90 82 161 100 41 3 Country of origin 35 98 119 119 107 127 337 192 17 Convenient location on shelf
9 25 28 70 70 93 151 655 50
*Other 23 7 9 9 7 2 13 21 1060 Notes: N = 1151. 1 = Most Important and 9 = Least Important. Highlighted figures represent the top three factors within each level of importance. *Notable “Other” responses included; alcohol content, recommendations from friends and experts, and environmentally friendly.
Involvement based on preference
This study also explored group differences in opinions by segmenting the sample based on their preference. One noticeable difference was detected in the frequency of consumption. Based on the results, Millennials who prefer sweet wines consume wine slightly less than those who have a preference for red wines. Table 4.22. Involvement based on Preference for Dry or Sweet Wine
Preference Factors
Knowledge* Importance Consumption Frequency*
Pay per Bottle
Sweet 2.50 3.44 3.51 $17.90 Dry 2.18 3.74 2.82 $17.68 Equal Preference 2.17 3.80 2.88 $18.97 Notes: Average scores are calculated on a 5-point scale, where 1 = ‘strongly disagree’ and 5 = ‘strongly agree.’ *A higher score indicates a lower response level.
Preferences and behavior based on age
Next, Millennials wine preferences and consumption behaviors were examined based on age. As previously mentioned, the sample was segmented based on the findings from the focus group sessions. According to the results in Table 4.23, opinions were fairly similar amongst groups. However, older Millennials (32-39) appear to consume wine more frequently than their younger counterparts.

36 | P a g e
Table 4.23. Consumption Frequency Based on Age
Age Group
Daily/ Several times a week
Once a week/
Several times a month
About once a month/ Every
couple of months
A few times a year/
Rarely 21-25 37.5% 37.2% 18.3% 7.0% 26-31 42.8% 37.1% 14.0% 6.1% 32-39 51.6% 29.1% 14.5% 4.8%
In addition to the frequency of consumption, consumers’ wine preferences were examined by age group. The results in Table 4.24 show little difference in opinion between young and middle aged Millennials. However, older Millennials demonstrated a slightly higher preference for red wine. Table 4.24. Preferred Wine Type based on Age
Age Group Red White Rose/ Blush
Champagne/ Sparkling
21-25 53.9% 34.8% 18.3% 7.0% 26-31 53.6% 35.0% 14.0% 6.1% 32-39 60.3% 29.1% 14.5% 4.8%
Lastly, the preferences for dry and sweet wines are presented in Table 4 25. The findings from this study suggest younger Millennials have a stronger preference for sweeter wines than older consumers. Overall, this study found that as Millennials age increases so does their preference of dry, red wines. Table 4 25. Wine Preference based on Age
Age Group Sweet Dry Equal Preference 21-25 67.1% 16.3% 22.0% 26-31 52.8% 18.8% 28.4% 32-39 46.2% 25.2% 28.6%
5.3. Alternative Packaging
This section provides a detailed discussion about Millennials’ perceptions towards four different alternative wine packages. It should be noted that roughly half of the study sample (N = 1151) participated in the design portion of this research.
Alternative wine packaging purchase motivation
Millennial wine consumers were asked about situations that would prompt them to purchase alternatively packaged wine. A majority of consumers surveyed indicated they are motivated to purchase alternatively packaged wine when gathering with friends (57.2%) and for regular home consumption (55.4%). Roughly 45% of respondents reported they would buy alternatively packaged wine when attending a picnic or a family

37 | P a g e
gathering. Conversely, a relatively small percentage of Millennials noted they would buy alternatively packaged wine to take to a work gathering (20.6%), sporting event (20.7%), and/or for girls/boys night out (27.9%). Overall, the findings in Table 5.1 demonstrate that Millennials most likely utilize alternative packaging at home and/or when gathering with friends and relatives.
Table 5.1. Which situations prompt you to buy wine in alternative packaging? Situation # of Responses Percent% When gathering with friends 1384 57.2% For regular consumption at home 1340 55.4% For outdoor events like concerts 1033 42.7% For a picnic 1065 44.0% For beach or lake outings 980 40.5% Camping 879 36.4% Sporting events 501 20.7% Family gatherings (e.g., Thanksgiving, birthdays, etc.) 1088 45.0% Girls night out / Boys night out 674 27.9% To give as a gift 981 40.6% To take to work-related gatherings (e.g., company party) 498 20.6%
Respondents were prompted to select all responses that apply. Thus, the total does not equal 2410. Further analysis was conducted to explore group differences in opinions based on age. Younger Millennials expressed a slightly stronger preference for utilizing alternative wine packaging to give as a gift and/or when gathering with friends, such as for a girls/boys night out when compared to older respondents. However, the overall difference in opinion between groups was marginal. Therefore, the findings from this analysis demonstrate that Millennials are fairly homogenous in their opinions about situations that prompt the purchase of wine in alternative packaging.
Table 5.2. Situation responses based on age group
Situation Age Groups
21-25 26-31 32-39 When gathering with friends 63.9% 55.4% 53.5% For regular consumption at home 56.8% 54.4% 55.4% For outdoor events like concerts 41.8% 42.1% 44.3% For a picnic 41.9% 43.8% 46.1% For beach or lake outings 39.8% 40.5% 41.2% Camping 35.9% 35.6% 37.5% Sporting events 20.2% 19.8% 22.2% Family gatherings (e.g., Thanksgiving, birthdays, etc.) 49.9% 42.6% 43.4% Girls night out / Boys night out 33.0% 27.2% 24.2% To give as a gift 45.1% 38.7% 38.8% To take to work-related gatherings (e.g., company party) 21.5% 19.6% 20.9%

38 | P a g e
Survey images
Based on the information obtained from the focus groups (section 4), the researchers selected particular types alternative wine packaging to explore further in the consumer survey. Participants were asked to evaluate each of the images in Table 5.3.
Table 5.3. Descriptions and Images of Products Utilized in the Consumer Survey Type Description Image of Packaging
Type 1 Banrock Station
3 Liter Bag-in-Box
Type 2 Beso Del Sol
3 Liter Bag-in-Box
Type 3 Sofia
4-Pack 187ml Aluminum cans
Type 4 Sutter Home
4-Pack 187ml Plastic Bottles

39 | P a g e
Alternative packaging: Type 1
Brand familiarity and willingness to pay
Millennials were first questioned about their familiarity as well as their willingness to pay for the brand presented. About a quarter of the respondents noted they were familiar with the Banrock Station brand. However, the results demonstrate that the participants in this study were mostly unfamiliar with the Banrock Station brand. Moreover, a majority of Millennials noted they would pay between $10 -$20 for this particular product (Table 5.7).
Table 5.4. Are you familiar with this brand? Response # of Respondents Percent Yes 286 24.8
No 865 75.2 Total 1151 100.0
Table 5.5. Have you tried this wine before? Response # of Respondents Percent Yes 205 71.7
No 81 28.3 Total 286 100.0
Table 5.6. If yes, please indicate the quality of the wine? Response # of Respondents Percent Very poor 6 2.9
Poor 3 1.5 Fair 30 14.7 Good 116 56.9 Excellent 49 24.0 Total 204 99.9
Note: N = 205. Mean score = 3.98.

40 | P a g e
Table 5.7. How much would you be willing to pay for this product? Price Range # of Respondents Percent $0 -$10 275 23.9
$11 - $15 303 26.4 $16 - $20 255 22.2 $21 - $30 207 18.0 $31+ 109 9.5 Total 1149 99.8
Design attributes
The next set of questions asked Millennials about their perceptions towards conceptual design features of this alternative packaging type. Based on academic literature concerning packaging design, the following attributes were utilized to measure respondents’ perceptions towards the design of each alternative packaging type. Each attribute was measured on a 5-point scale. For example, for the item “Modern vs Traditional” a score of “1” represents “Very modern” versus a score of “5” which indicates “Very traditional.” The highlighted figures in Table 5.8 indicate the design elements that 45% or more of the respondents selected. Consumers noted that the design of this particular packaging type has both aesthetic (e.g., modern & sophisticated) and functional (e.g., convenient & useful) elements. Based on these results, Millennials appear to have favorable perceptions about the design elements of this BIB alternative packaging.
Table 5.8. Perceptions towards Alternative Packaging Design # 1
Design Perceptions Average Score
Modern vs Traditional* 2.72 Funny vs Serious** 3.57 Cheap vs Sophisticated 3.34 Inconvenient vs Convenient 3.45 Cluttered vs Plain 3.48 Tacky vs Elegant* 3.39 Impractical vs Practical** 3.48 Boring vs Exciting 3.09 Unusual vs Usual* 2.98 Useless vs Useful* 3.31 Dull vs Colorful 3.01

41 | P a g e
Perceived attractiveness and aesthetic quality
Next, consumers were asked how much they agreed or disagreed with each statement regarding the perceived attractiveness of this particular packaging type. As can be seen from the Table 5.9, respondents expressed positive opinions about the attractiveness of this type of alternative packaging. Moreover, respondents displayed slightly favorable opinions towards the quality of the aesthetics for this alternative packaging type, which mirrored the results found in Table 5.8.
Table 5.9. Perceived Attractiveness and Aesthetic Quality of Type # 1
Factors Average Score
Attractiveness Attributes* Unattractive vs Attractive 3.35 Undesirable vs Desirable 3.28 Unlikable vs Likable 3.42 Aesthetic Quality** I like the aesthetics of this packaging 3.43 This design gives me pleasure 3.26 The curves and lines of this packaging makes it appealing to me
3.29
Note: *These items were measured in the same manner as the design elements. ** Average scores are calculated on a 5-point scale, where 1 = ‘strongly disagree’ and 5 = ‘strongly agree.’
Value
Next, statements regarding the perceived value of packaging type #1 were addressed. Table 5.10 displays results from the consumer survey, which demonstrate that this packaging type conveys value to the consumers. Therefore, based on the packaging Millennials consumers feel that this product is economical and has good value.
Table 5.10. Perceived Value of Alternative Packaging Type #1
Value Indicators Average Score
This packaging has good value 3.41 This packaging is economical 3.59 This packaging is cost effective 3.54 Notes: N=1151. Average scores are calculated on a 5-point scale, where 1 = ‘strongly disagree’ and 5 = ‘strongly agree.’
Functionality
In addition to the aforementioned factors, statements regarding the perceived functionality of packaging type #1 were addressed. A majority reported this type of

42 | P a g e
packaging as being functional (58.3%), easy to use (59.2%), and useful (57.3%). Thus, indicating that Millennial wine consumers have relatively strong favorable opinions towards the functionality of this particular type of alternative packaging.
Table 5.11. Perceived Functionality of Alternative Packaging Type #1
Functionality Indicators Average Score
This packaging is functional 3.58
This packaging is easy to use 3.60
This packaging can be useful 3.57
Notes: N=1151. Average scores are calculated on a 5-point scale, where 1 = ‘strongly disagree’ and 5 = ‘strongly agree.’
Social perceptions
Next, respondents’ opinions about utilizing this packaging type around others were assessed. When trying to impress others, Millennials may not serve wine in this particular package (3.32). On the other hand, Millennials appear to agree that wine in this packaging would make a nice gift, be nice to bring to a party, and would be good for any occasion. These findings suggest that Millennial consumers are open to the idea of using this packaging type in most social situations.
Table 5.12. Social Perceptions towards Alternative Packaging Type #1
Social Indicators Average Score*
If I was trying to impress someone I would NOT serve wine in this packaging**
3.32
My peers would be delighted if I brought wine in this packaging to a party
3.26
Wine in this packaging makes a nice gift 3.44 Wine in this packaging is good for any occasion 3.38 Notes: N=1151. *Average scores are calculated on a 5-point scale, where 1 = ‘strongly disagree’ and 5 = ‘strongly agree.’ ** Item is reversed and higher scores indicate a negative response.
Perception of wine quality
Finally, participants were asked to evaluate the quality of the product based on the packaging (Table 5.13). Academic literature established that a positive perception of quality is a direct indicator of intent to purchase. According to the results, respondents noted positive opinions towards the quality of the wine based on the packaging. Overall, this product appears to be of good quality to Millennial consumers, which in turn, should drive them towards purchasing this product type.

43 | P a g e
Table 5.13. Perception of Quality Based on the Packaging
Quality Indicator Average Score
Based solely on the packaging, what do you think the quality of the wine is?
3.45
Note: N= 1151. Mean = 3.45. *Average scores are calculated on a 5-point scale, where 1 = ‘very poor’ and 5 = ‘Excellent.’
Summary
The first packaging type examined was the Banrock Station (3L) bag-in-box. Almost all of the focus group respondents indicated they were unfamiliar with the brand and had not tried the wine before, which was also the case in the consumer survey. However, an overwhelming majority of the focus group participants expressed interest towards this particular package. Motivations for their responses varied but the comments made were all positive in nature. For instance, participants noted they liked the natural and eco-friendly design of this packaging. In addition, they frequently mentioned that the packaging looked modern, simple, and useful. Similarly, the results from the consumer survey confirm that millennial consumers find this packaging type to be aesthetically pleasing. They are attracted to the simple and modern design of this packaging type and they would use this product in most social situations. In summary, the findings suggest that the design presents the BIB product as a modern twist on the classic and/or traditional bag-in-box design. Moreover, the 3L BIB product is functionally appealing to the consumers, which was also found during the focus group sessions. For example, focus group participants noted that the shape of this packaging would allow for it to easily fit on a crowded kitchen counter top. Likewise, others noted the handles and pour spout were convenient features, which improved the perceived functionality of the packaging. Alongside functionality, this product type conveyed good value to Millennials. For instance, during the focus group sessions, participants frequently referred to the value and convenience of purchasing 3L of wine at a time. They associated large volume containers, such as the 3L BIB with value and assumed that buying in bulk equates savings. Therefore, these findings indicate Millennials feel the 3L BIB packaging offers good value and is functional. In summary, the Banrock Station 3L BIB was well received by almost all participants in this study. The consumer survey results further demonstrate that Millennials have positive perceptions about the quality of this product, which in turn, may drive them towards purchasing this product. All in all, Millennials are clearly drawn towards this alternative packaging type.

44 | P a g e
Alternative packaging: Type 2
Brand familiarity and willingness to pay
First, Millennial wine consumers were questioned about their familiarity as well as their willingness to pay for the brand. Less than 16% of the respondents indicated they were familiar with the Beso Del Sol brand (Table 5.14). In addition, those who reported being familiar with the brand also had positive perceptions about the quality of the wine. Overall, a considerable number of participants noted they had no prior experience with this brand. Furthermore, when asked about how much they would pay for this product, over 60% noted they would pay $15 or less (Table 5.17). Table 5.14. Are you familiar with this brand? Response # of Respondents Percent Yes 183 15.9
No 865 84.1 Total 1151 100.0
Table 5.15. Have you tried this wine before? Response # of Respondents Percent Yes 141 77.5
No 41 22.5 Total 182 100.0
Note: N = 183.
Table 5.16. If yes, please indicate the quality of the wine? Response # of Respondents Percent Very poor 1 0.7
Poor 7 5.0 Fair 25 17.9 Good 66 47.1 Excellent 41 29.3 Total 140 99.9
Note: N = 141. Mean score = 3.99.

45 | P a g e
Table 5.17. How much would you be willing to pay for this product? Price Range # of Respondents Percent $0 -$10 428 37.2
$11 - $15 278 24.2 $16 - $20 198 17.2 $21 - $30 164 14.2 $31+ 79 68.6 Total 1151 100.0
Design attributes
After assessing willingness to pay, the participants were asked to share their perceptions towards conceptual design features of alternative packaging Type # 2 (Table 5.18). At first glance, this packaging type appears to be favorable as many noted the design being modern (68.2%), exciting (60.9%), and very colorful (71.5%). However, a majority of the sample also expressed that the design is funny (47.7%), tacky (46.7%), and unusual (48.2%). Moreover, the majority of the sample was mostly undecided about the functionality of this packaging design, which was evident by the neutral responses towards these elements. As a result, Millennials appear to have low opinions about the design of this 3L BIB product.
Table 5.18. Perceptions towards packaging design of Type # 2
Design Perceptions Average Score
Modern vs Traditional 2.18 Funny vs Serious 2.57 Cheap vs Sophisticated 2.80 Inconvenient vs Convenient 3.15 Cluttered vs Plain 2.72 Tacky vs Elegant 2.66 Impractical vs Practical 3.21 Boring vs Exciting 3.70 Unusual vs Usual 2.69 Useless vs Useful 3.15 Dull vs Colorful 4.05
Perceived attractiveness and aesthetic quality
Next, the perceived attractiveness and aesthetic quality of packaging type #2 was assessed (Table 5.19). Consistent with the previous results, Millennials find this packaging type moderately attractive but not necessarily desirable. Similarly, Millennial wine consumers have mostly neutral perceptions about the overall aesthetic quality of this packaging type. In summary, the findings show that Millennials are not necessarily attracted to the aesthetic quality of this bag-in-box product.

46 | P a g e
Table 5.19. Perceived Attractiveness and Aesthetic Quality of Type # 2
Factors Average Score
Attractiveness Attributes* Unattractive vs Attractive 3.25 Undesirable vs Desirable 3.08 Unlikable vs Likable 3.26 Aesthetic Quality** I like the aesthetics of this packaging 3.11 This design gives me pleasure 3.05 The curves and lines of this packaging makes it appealing to me
3.08
Note: *These items were measured in the same manner as the design elements. ** Average scores are calculated on a 5-point scale, where 1 = ‘strongly disagree’ and 5 = ‘strongly agree.’
Value
When Millennials were questioned about their perceptions towards the value of this packaging type, they reported mixed opinions. Roughly 38.5% of respondents agreed that this bag-in-box packaging has good/excellent value. However, less than 10% felt this packaging has absolutely no value, economic viability or cost effectiveness. Thus, the results suggest these consumers feel this packaging type demonstrates good value.
Table 5.20. Perceived value of alternative packaging type #2
Value Indicators Average Score
This packaging has good value 3.20 This packaging is economical 3.34 This packaging is cost effective 3.38 Notes: N=1151. Average scores are calculated on a 5-point scale, where 1 = ‘strongly disagree’ and 5 = ‘strongly agree.’
Functionality
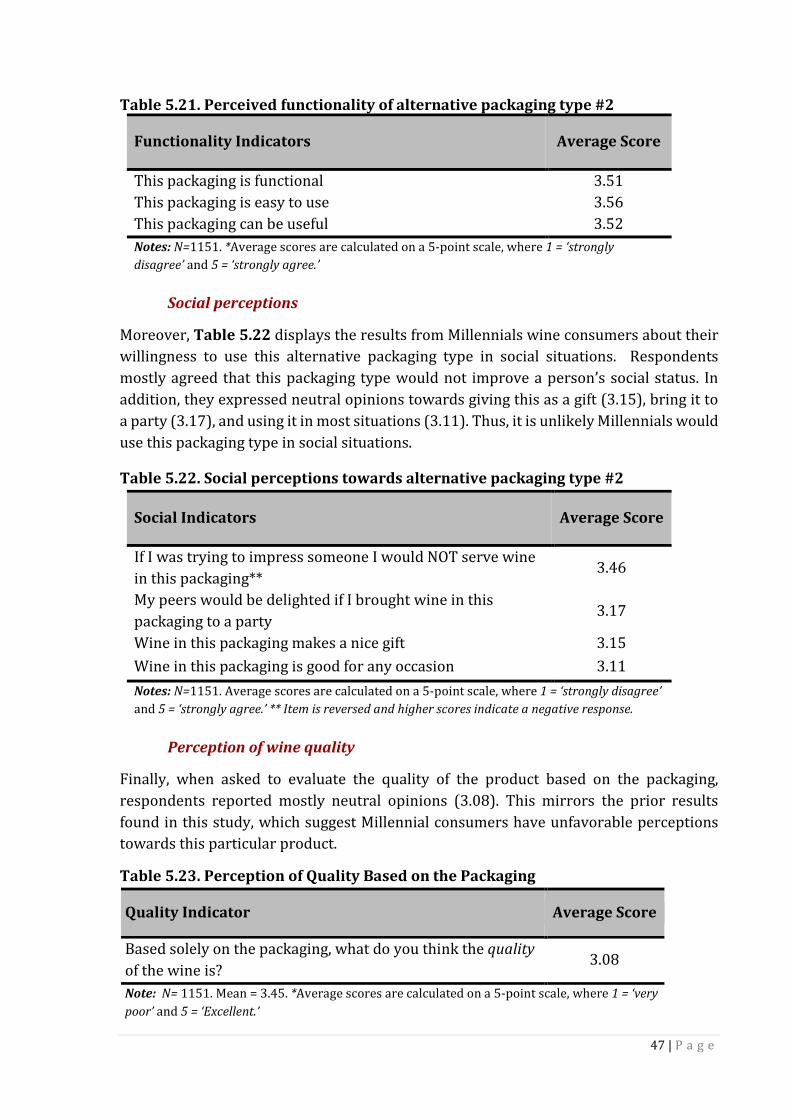
Next, the perceived functionality of packaging type #2 was explored. In contrast to the design attribute findings (Table 5.21), a majority of Millennials reported this bag-in-box packaging type as being functional (56%), easy to use (57.8%) and useful (54.1%). Therefore, these results indicate that, in general, Millennials have positive opinions about the functionality of bag-in-box packaging types.
47 | P a g e
Table 5.21. Perceived functionality of alternative packaging type #2
Functionality Indicators Average Score
This packaging is functional 3.51 This packaging is easy to use 3.56 This packaging can be useful 3.52 Notes: N=1151. *Average scores are calculated on a 5-point scale, where 1 = ‘strongly disagree’ and 5 = ‘strongly agree.’
Social perceptions
Moreover, Table 5.22 displays the results from Millennials wine consumers about their willingness to use this alternative packaging type in social situations. Respondents mostly agreed that this packaging type would not improve a person’s social status. In addition, they expressed neutral opinions towards giving this as a gift (3.15), bring it to a party (3.17), and using it in most situations (3.11). Thus, it is unlikely Millennials would use this packaging type in social situations.
Table 5.22. Social perceptions towards alternative packaging type #2
Social Indicators Average Score
If I was trying to impress someone I would NOT serve wine in this packaging**
3.46
My peers would be delighted if I brought wine in this packaging to a party
3.17
Wine in this packaging makes a nice gift 3.15 Wine in this packaging is good for any occasion 3.11 Notes: N=1151. Average scores are calculated on a 5-point scale, where 1 = ‘strongly disagree’ and 5 = ‘strongly agree.’ ** Item is reversed and higher scores indicate a negative response.
Perception of wine quality
Finally, when asked to evaluate the quality of the product based on the packaging, respondents reported mostly neutral opinions (3.08). This mirrors the prior results found in this study, which suggest Millennial consumers have unfavorable perceptions towards this particular product.
Table 5.23. Perception of Quality Based on the Packaging
Quality Indicator Average Score
Based solely on the packaging, what do you think the quality of the wine is?
3.08
Note: N= 1151. Mean = 3.45. *Average scores are calculated on a 5-point scale, where 1 = ‘very poor’ and 5 = ‘Excellent.’

48 | P a g e
Summary
The second packaging type examined was the Beso Del Sol (3L) bag-in-box. Similar to the focus group results, survey respondents indicated they were mostly unfamiliar with this brand. However, many of the focus group respondents indicated they disliked the overall design and color scheme of this packaging type. Interestingly, during the focus groups, younger Millennials explained that they felt this packaging was juvenile and geared specifically towards novice consumers. The findings from the consumer survey are consistent with the focus group results, which noted the design as being tacky and unusual (Table 5.18).
Moreover, the results from this study demonstrate this packaging type is mostly unattractive and aesthetically unpleasing. For instance, many of the focus group participants commented negatively about the bold colors, polka dots, and glossy finish, which was comparable to the results found in the consumer survey. In general, Millennials were put off by the flashy design of this product.
On the other hand, when examining the perceived functionality of this product, responses were mostly positive. As was the case with Type 1, Millennials find the 3L BIB functional and useful. For example, during the focus group sessions, many participants commented on the usefulness of the handles and size (in relation to volume of wine the product holds) of the BIB packaging. Similarly, Millennials feel the 3L BIB offers good value, which was repeatedly discussed during the focus group sessions. For example, when discussing the BIB products one participant noted “...I don’t know the price but buying that much wine at one time should save money [be of good value]...” Thus, these findings indicate that the 3L BIB packaging, regardless of the aesthetics, conveys usefulness and value to the consumer.
Despite the positive perceptions of functionality and value, this product ranked the lowest in perceptions of the quality of wine based on the packaging. Similarly Therefore, the findings from this study suggest the design of the packaging effects perceptions of quality regardless of the functionality or value.

49 | P a g e
Alternative packaging: Type 3
Brand familiarity and willingness to pay
When Millennials were questioned about their familiarity and willingness to pay for the Sophia brand the results showed that less than 25% were familiar with the product. However, a majority of those who had tried this brand also had positive opinions about the quality of the wine. Moreover, when asked how much they would pay for this product (Table 5.27) responses varied, which may be attributed to the general unfamiliarity they expressed about this product.
Table 5.24. Are you familiar with this brand? Response # of Respondents Percent Yes 275 23.9
No 875 76.1 Total 1150 99.9
Table 5.25. Have you tried this wine before? Response # of Respondents Percent Yes 186 67.7
No 89 32.4 Total 275 100.0
Note: N = 275.
Table 5.26. If yes, please indicate the quality of the wine? Response # of Respondents Percent Very poor 0 0.0
Poor 8 4.3 Fair 26 14.1 Good 94 50.8 Excellent 57 30.8 Total 185 99.9
Note: N = 186. Mean score = 4.08.

50 | P a g e
Table 5.27. How much would you be willing to pay for this product? Price Range # of Respondents Percent $0 -$10 271 23.6
$11 - $15 261 22.7 $16 - $20 222 19.3 $21 - $30 221 19.2 $31+ 220 19.1 Total 1150 99.9
Design attributes
Based on the results reported in Table 5.28, a majority of respondents indicated this packaging design as having both aesthetic (modern, sophisticated, convenient, elegant, exciting, and colorful) and functional (practical & useful) elements. Based on these results, Millennials appear to have favorable opinions about the design of this packaging type.
Table 5.28. Perceptions towards Alternative Packaging Design # 3
Design Perceptions Average Score
Modern vs Traditional 2.59 Funny vs Serious 3.20 Cheap vs Sophisticated 3.50 Inconvenient vs Convenient 3.59 Cluttered vs Plain 3.12 Tacky vs Elegant 3.46 Impractical vs Practical 3.47 Boring vs Exciting 3.67 Unusual vs Usual 2.83 Useless vs Useful 3.52 Dull vs Colorful 3.78
Perceived attractiveness and aesthetic quality
The results in Table 5.29 show that Millennials carry positive opinions about the perceived attractiveness of packaging type #3. Specifically, the mini-can packaging type scored well on attractiveness (3.82), desirability (3.65), and likableness (3.73). Similar to the attractiveness items, Millennials reported favorable opinions about the aesthetic quality of the mini-cans. Based on these findings, Millennial wine consumers are clearly attracted to the design and aesthetic quality of this packaging type.

51 | P a g e
Table 5.29. Perceived Attractiveness and Aesthetic Quality of Type # 3
Factors Average Score
Attractiveness Attributes* Unattractive vs Attractive 3.82 Undesirable vs Desirable 3.65 Unlikable vs Likable 3.73 Aesthetic Quality** I like the aesthetics of this packaging 3.63 This design gives me pleasure 3.54 The curves and lines of this packaging makes it appealing to me
3.65
Note: *These items were measured in the same manner as the design elements. ** Average scores are calculated on a 5-point scale, where 1 = ‘strongly disagree’ and 5 = ‘strongly agree.’
Value
When Millennials were questioned about their perceptions towards the value of this packaging type, they reported slightly favorable opinions (Table 5.30). Over 60% of respondents agreed that the mini-can packaging type has good value. Moreover, less than 5% of the sample felt this packaging has absolutely no value. Table 5.30. Perceived Value of Alternative Packaging Type #3
Value Indicators Average Score
This packaging has good value 3.48 This packaging is economical 3.30 This packaging is cost effective 3.33 Notes: N=1151. Average scores are calculated on a 5-point scale, where 1 = ‘strongly disagree’ and 5 = ‘strongly agree.’
Functionality
Next, the perceived functionality of packaging type #3 was explored (Table 5.31). A majority of Millennials surveyed reported the mini-can packaging type as being functional (57.1%), easy to use (60.4%) and useful (59.4%). Similar to the findings in Table 5.28 , these results indicate that Millennials carry positive opinions about the functionality of this packaging type, which may be attributed to the portability of the cans and/or the additional features (e.g., the attached straw).
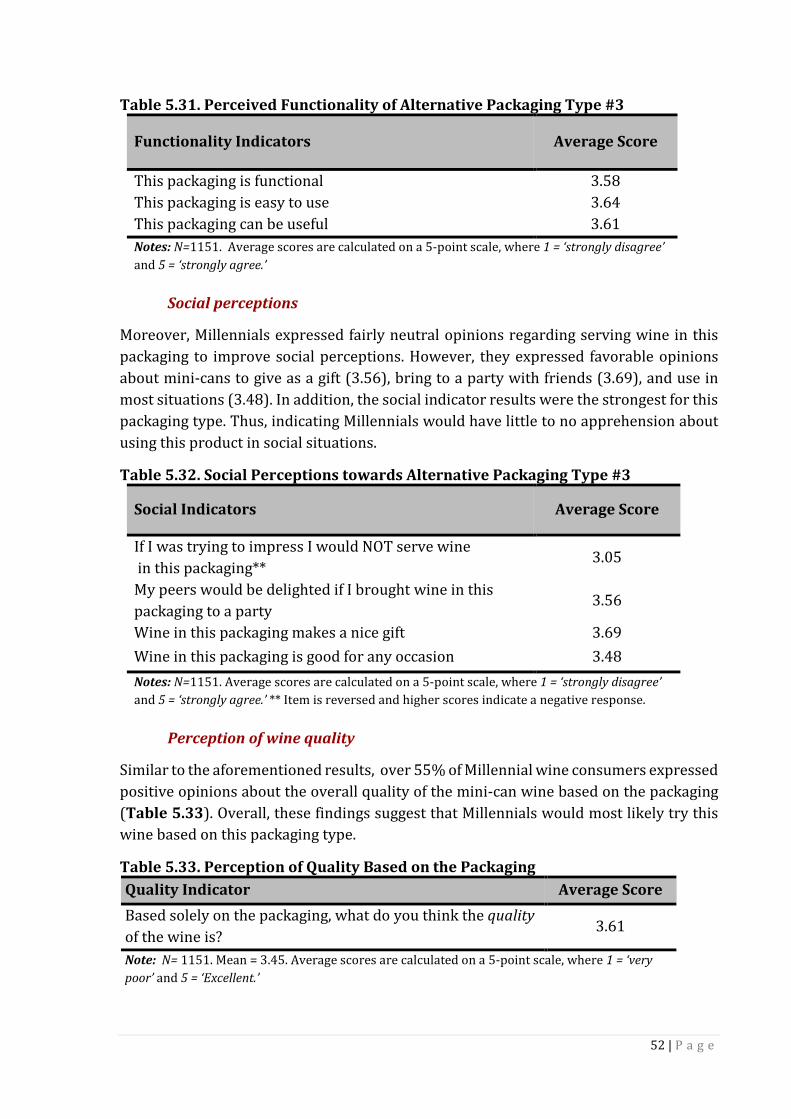
52 | P a g e
Table 5.31. Perceived Functionality of Alternative Packaging Type #3
Functionality Indicators Average Score
This packaging is functional 3.58 This packaging is easy to use 3.64 This packaging can be useful 3.61 Notes: N=1151. Average scores are calculated on a 5-point scale, where 1 = ‘strongly disagree’ and 5 = ‘strongly agree.’
Social perceptions
Moreover, Millennials expressed fairly neutral opinions regarding serving wine in this packaging to improve social perceptions. However, they expressed favorable opinions about mini-cans to give as a gift (3.56), bring to a party with friends (3.69), and use in most situations (3.48). In addition, the social indicator results were the strongest for this packaging type. Thus, indicating Millennials would have little to no apprehension about using this product in social situations.
Table 5.32. Social Perceptions towards Alternative Packaging Type #3
Social Indicators Average Score
If I was trying to impress I would NOT serve wine in this packaging**
3.05
My peers would be delighted if I brought wine in this packaging to a party
3.56
Wine in this packaging makes a nice gift 3.69 Wine in this packaging is good for any occasion 3.48 Notes: N=1151. Average scores are calculated on a 5-point scale, where 1 = ‘strongly disagree’ and 5 = ‘strongly agree.’ ** Item is reversed and higher scores indicate a negative response.
Perception of wine quality
Similar to the aforementioned results, over 55% of Millennial wine consumers expressed positive opinions about the overall quality of the mini-can wine based on the packaging (Table 5.33). Overall, these findings suggest that Millennials would most likely try this wine based on this packaging type.
Table 5.33. Perception of Quality Based on the Packaging Quality Indicator Average Score Based solely on the packaging, what do you think the quality of the wine is?
3.61
Note: N= 1151. Mean = 3.45. Average scores are calculated on a 5-point scale, where 1 = ‘very poor’ and 5 = ‘Excellent.’
53 | P a g e
Summary
The third packaging type examined was the Sofia brand of 4 - 1.87ml cans by Francis Coppola. Almost all focus group participants expressed interest towards this particular package. Motivations for their responses varied, however, most participants seemed to enjoy the overall design (sophisticated, elegant, colorful & exciting) and color scheme of this product. Similarly, the results from the consumer survey show this packaging is attractive and aesthetically pleasing to Millennials. Thus, these consumers consider the Sofia product as having a modern and enticing design. Millennials also felt the design of this product conveyed functionality (convenient, practical, & useful). This was consistent with their responses towards the perceived functionality of the packaging, which were positive. Moreover, most focus group participants expressed interested in the functionality of the packaging, such as the straw that comes with each can as well as the portability of the size. For example, a few participants noted, “this one [mini-cans] has a straw, that is super convenient” and “the size of this [can] I can fit it anywhere.” Based on these results, Millennials appear to be drawn towards the functionality of this packaging type. Finally, the results show that this product has the highest perceived level of quality, especially when compared to the other types. Specifically, the perceptions of the quality based on the packaging were highest for this product. This finding contradicted some of the comments made during the focus group sessions. For example, one person noted “I just can’t take wine in a can seriously.” However, most of the negative responses towards this packaging type were limited to younger Millennials. Overall, the results from this study indicate that Millennials are attracted to this packaging type.

54 | P a g e
Alternative packaging: Type 4
Brand familiarity and willingness to pay
Finally, unlike the other types examined, roughly 80% of the respondents noted that they are familiar with the Sutter Home brand. A majority of those who indicated having prior experience with the brand also reported trying the wine before (82.8%) and have positive perceptions about the quality of the wine (80.9%).
Table 5.34. Are you familiar with this brand? Response # of Respondents Percent Yes 928 80.6
No 223 19.4 Total 1151 100.0
Table 5.35. Have you tried this wine before? Response # of Respondents Percent Yes 768 82.8
No 159 17.2 Total 927 99.9
Note: N = 928.
Table 5.36. If yes, please indicate the quality of the wine? Response # of Respondents Percent Very poor 27 3.5
Poor 57 7.4 Fair 266 34.7 Good 309 40.3 Excellent 108 14.1 Total 767 99.9
Note: N = 768. Mean score = 3.54.

55 | P a g e
Table 5.37. How much would you be willing to pay for this product? Price Range # of Respondents Percent $0 -$10 639 55.6
$11 - $15 257 22.3 $16 - $20 105 9.1 $21 - $30 84 7.3 $31+ 65 5.7 Total 1150 99.9
Design attributes
Upon examining the highlighted results, Millennial wine consumers consider the design of mini-bottle packaging type to be traditional and simple (plain, traditional, elegant, & serious). In addition, these consumers are familiar with this packaging (usual) and also find it very functional (practical, convenient, & useful). Overall, Millennials have positive impressions about the design of this packaging.
Table 5.38. Perceptions towards Alternative Packaging Design # 4
Design Perceptions Average Score
Modern vs Traditional 3.48 Funny vs Serious 3.54 Cheap vs Sophisticated 3.02 Inconvenient vs Convenient 3.89 Cluttered vs Plain 3.63 Tacky vs Elegant 3.29 Impractical vs Practical 3.83 Boring vs Exciting 3.08 Unusual vs Usual 3.62 Useless vs Useful 3.66 Dull vs Colorful 3.11
Perceived attractiveness and aesthetic quality
Based on the results, Millennials have fairly positive attitudes about the attractiveness (3.39), desirability (3.35), and likableness (3.47) of the mini-bottle packaging (Table 5.39). Although the results are agreeable, respondents held mostly neutral opinions about the aesthetic quality of the mini-bottle packaging. Overall, these consumers are attracted to the design of this packaging but do not necessarily find pleasure from the design and/or find the packaging to be desirable.

56 | P a g e
Table 5.39. Perceived Attractiveness and Aesthetic Quality of Type # 4 Factors Average Score Attractiveness Attributes* Unattractive vs Attractive 3.39 Undesirable vs Desirable 3.35 Unlikable vs Likable 3.47 Aesthetic Quality** I like the aesthetics of this packaging 3.31 This design gives me pleasure 3.19 The curves and lines of this packaging makes it appealing to me
3.26
Note: Average scores are calculated on a 5-point scale, where 1 = ‘strongly disagree’ and 5 = ‘strongly agree.’
Value
When Millennials were questioned about their perceptions towards the value of this packaging type, responses were favorable. Over 50% of respondents agreed or strongly agreed that the mini-bottle packaging type offers good value for the consumer, which was also reflected by the relatively low price point they were willing to pay (see Table 5.37).
Table 5.40. Perceived Value of Alternative Packaging Type #4
Value Indicators Average Score
This packaging has good value 3.50 This packaging is economical 3.55 This packaging is cost effective+ 3.53 Notes: N=1151, +N = 1150. Average scores are calculated on a 5-point scale, where 1 = ‘strongly disagree’ and 5 = ‘strongly agree.’
Functionality
Next, the perceived functionality of packaging type #4 was explored and respondents reported favorable results (Table 5.41). Interestingly, this packaging type yielded the highest mean scores for overall functionality. In addition, this finding mirrored the data found during the focus groups, which also expressed this type as being very functional.
Table 5.41. Perceived Functionality of Alternative Packaging Type #4
Functionality Indicators Average Score
This packaging is functional 3.81 This packaging is easy to use 3.92 This packaging can be useful 3.76 Notes: N=1150. Average scores are calculated on a 5-point scale, where 1 = ‘strongly disagree’ and 5 = ‘strongly agree.’

57 | P a g e
Social perceptions
Despite the positive perceptions, the results show this would not be an ideal packaging type to use if trying to improving one’s social status. However, these consumers expressed a willingness to use this product for most occasions. Thus, the findings demonstrate the product is useful to these consumers but not necessarily impressive. Table 5.42. Social Perceptions towards Alternative Packaging Type #4
Social Indicators Average Score
If I was trying to impress someone I would NOT serve wine in this packaging**
3.35
My peers would be delighted if I brought wine in this packaging to a party
3.27
Wine in this packaging makes a nice gift 3.23 Wine in this packaging is good for any occasion 3.42 Notes: N=1151, Average scores are calculated on a 5-point scale, where 1 = ‘strongly disagree’ and 5 = ‘strongly agree.’ ** Item is reversed and higher scores indicate a negative response.
Perception of wine quality
Finally, over 80% of Millennial wine consumers surveyed noted favorable opinions about the quality of the wine based on mini-bottle packaging. This finding is consistent with the results in Table 5.36, which also found perceptions of the quality of this wine to be favorable. Overall, these consumers feel that this product and packaging is of good quality, which in turn, may drive them towards purchasing this product. Table 5.43. Perception of Quality Based on the Packaging
Quality Indicator Average Score
Based solely on the packaging, what do you think the quality of the wine is?
3.38
Note: N= 1151. Mean = 3.45. Average scores are calculated on a 5-point scale, where 1 = ‘very poor’ and 5 = ‘Excellent.’
Summary
The fourth packaging type examined was the 4-pack of 1.87ml mini plastic bottles from Sutter Home. As was the case in the focus groups, most of the survey participants indicated they were familiar with the brand. From a design perspective, Millennials consumers feel this packaging type has a usual design. Similarly, during the focus group sessions, participants noted, “...I know this one [Sutter Home]...” and “I’ve bought these [mini-bottles]...” Based on the results from both phases, this product is well-known, which appeals to Millennial consumers.
58 | P a g e
Moreover, the findings from this study show that this packaging has a classic design scheme that is attractive to Millennial consumers. This was first detected during the focus group sessions when consumers made comment such as “they look like miniature versions of a regular [750ml] bottle” and “I like using these...” In the consumer survey, respondents noted the packaging has a traditional and plain design and also expressed favorable opinions towards the attractiveness and aesthetics of this packaging. Thus, the conventional design of this particular packaging is appealing to Millennial wine consumers. In addition to aesthetics, the results from the consumer survey show that the design of Type 4 has a strong functional appeal. For example, a large majority of survey respondents felt the design of this packaging is convenient, practical, and useful, which was consistent with their positive opinions about the perceived functionality of the packaging. Likewise, this theme was reflected in the focus group sessions as Millennials noted “I could throw these [mini-bottles] in the fridge, in the cooler...” and I like to drink at home but not always a whole bottle.” Therefore, these findings suggest this alternative packaging type has a utilitarian appeal to Millennials consumers. In summary, the mini-plastic bottles were well received by Millennial consumers despite the traditional packaging design. In the focus group sessions, participants frequently expressed their dislike of traditional alternative packaging design elements such as the size and shape of long standing bag-in-box products. However, this particular packaging type yielded positive responses, which may have occurred because of the balance of value and functionality of this packaging. For example, the survey results show that in addition to being highly functional Millennials find this product to be of good value and quality. Thus, the results suggest that in spite of the traditional design, highly functional products that offer good value are attractive to Millennial consumers.
Comparison of alternative packaging types
Finally, a comparison of the alternative wine packaging results is presented in Table 5.44. Based on the results from this study, Type 3 clearly had the highest perceptions of overall attractiveness (3.73) and product quality based on the packaging (3.61). Type 1 and 4 scored lower on attractiveness, but displayed similar scores on value and functionality, which may explain the favorable impressions of overall product quality (3.45 and 3.38, respectively). Thus, it may be assumed that these attributes (attractiveness, value, and functionality) play a fairly equal role in influencing consumers’ perceptions towards the overall quality of the product. Furthermore, academic literature has established that perceived attractiveness, aesthetics, functionality, and value are known predictors of quality perceptions, which in turn, drive purchase behavior. Thus, to increase positive perceptions towards the quality of alternatively packaged wine products, one should first improve perceptions towards these attributes.

59 | P a g e
Table 5.44. Comparison of Alternative Packaging Perceptions
Attributes Packaging Type
Type 1 Type 2 Type 3 Type 4 Attractiveness 3.45 3.20 3.73 3.40 Aesthetics 3.23 3.08 3.61 3.25 Functionality 3.58 3.53 3.61 3.83 Value 3.51 3.31 3.37 3.83 Quality of Product 3.45 3.08 3.61 3.38 Note: The results are presented as mean scores. All items were measured on a 5-point Likert scale, 1= Strongly Disagree & 5=Strongly Agree.

60 | P a g e
6. MARKETING SUGGESTIONS AND RECOMMENDATIONS
6.1 Profile of Millennial Wine Consumer
Based on the results of the current study, the majority of Millennial wine consumers appear to be well educated, with moderate levels of income, and married or in a domestic partnership. These consumers noted they enjoy consuming beer almost as much as wine (Table 4.9). However, the participants in this study expressed an interest and fascination with wine as well as confidence about their basic knowledge of wine. In addition, the findings from this study are consistent with the current trend reports which suggest that Millennials are surpassing Baby boomers in the consumption of wine (WMC, 2016). Overall, these findings demonstrate that Millennials are fairly regular consumers of wine and have a general interest in wine. These consumers enjoy having a glass of wine to relax at home and/or after work with friends. In terms of purchase behaviors, Millennial consumers noted price as the most influential factor driving their wine purchases. Considering the age of this cohort, it is logical to assume many Millennials are in a transition stage of life. They are in and/or have recently completed college and many of them are now starting families and careers, which influence their purchase decision making process. In addition, Millennial wine consumers expressed value as being a determining factor for making wine purchases. Therefore, alternatively packaged wine could be a viable option for producers to offer value to the price sensitive Millennial wine consumer. In addition, Millennials make wine purchases based on the brand. These consumers noted that familiarity with the brand is a strong factor that influences their wine purchases. For example, during the focus group sessions, Millennials mentioned that they seek familiar labels because it gives them confidence in their purchase decision. In addition, these consumers expressed a willingness to use alternatively packaged wine products when gathering with friends and family (Table 5.1, Table 5.2). Thus, producers may consider targeting their loyal customers when launching new alternatively packaged wine products, which in turn, may drive initial sales and awareness about the new packaging. Overall, Millennials appear to be involved wine consumers. However, differences in preferences do exist amongst the cohort. For example, the findings from this study demonstrate that older Millennials enjoy wine over other beverages and have a preference for dry red wines. Conversely, younger Millennials spread out their beverage dollar a little more and enjoy sweeter wines. Based on the findings from this study, it is suggested to segment Millennials and target them by age and preference when developing marketing schemes.
61 | P a g e
6.2 Millennials Motivations for Utilizing Alternative Wine Packaging
Price and value
Price and value are major considerations for the Millennial cohort. Many Millennials are currently at a stage in their lives where they have limited financial resources, which encourage more conservative spending behaviors. Focus group participants expressed their preference for wine products that offer value. During the consumer survey, when asked to rank the most important motivating factor for purchasing wine, price was the most frequent (#1) choice. Thus, alternative wine packaging presents an opportunity for producers to position their products as offering value to the consumer. However, value and price are subjective and influenced by other variables, such as the functionality and design. During the focus group sessions, price and value frequently intertwined with other themes. For example, Millennials noted that the convenience and functionality of the BIB packaging was appealing to them as long as the product was within their price range. In addition, value played a role in the evaluation of alternative packaging types. For example, products that scored well on perceived value also had favorable quality impressions. Thus, to appeal to this cohort, it is advised to consider the role price and value play alongside other attributes of the packaging such as functionality and design.
Design attributes
To better understand Millennials opinions towards alternative wine packaging, this study explored their perceptions towards specific packaging design elements. Adapted from academic literature and measured on a five-point scale, examples of the elements included modern vs. traditional and boring vs. exciting. Furthermore, the design elements explored in this study were based on the comments made during the focus group sessions. According to the results (see Table 5.8, Table 5.18, Table 5.28, Table 5.38), Millennials prefer modern, natural, and simplistic design elements, such as sharp edges with red and black color schemes and/or environmental images with brown (natural) colors. On the other hand, they expressed a strong dislike of bold, funny, tacky, and cluttered design elements, such as polka dots and neon color schemes. Therefore, it is suggested to design packaging that appears modern and simplistic to draw these consumers towards alternative products. Moreover, Millennials were drawn towards designs that conveyed convenience and functionality. These utilitarian elements were frequently discussed in the focus group sessions. For instance, many participants commented on the functional features of alternative packaging such as handles, pour spouts, and straw (see Type #3). In addition, they expressed the usefulness of non-glass containers for outdoor use and the
62 | P a g e
convenience of purchasing large qualities at a time for at home use. Overall, these results were consistent with the findings in the consumer survey, which found a connection between functionality and quality perceptions. For example, packaging Type 4 scored low on aesthetic appeal but very high on functionality, and in turn, respondents had positive perceptions of the quality of the product (Table 5.44). Thus, to attract Millennials to alternative packaging the design of the packaging should appear highly functional and convenient. This research also found group differences in opinions based on age. During the focus groups, younger Millennials noted that packaging with bold, cluttered, and exciting design elements also appeared juvenile. They were turned off by these designs and felt marketers misunderstood their wants and needs. This may be due to their desire to seek social validation through the products they purchase. As a result, to appeal to the younger members of this cohort, it is advised to focus on design elements that portray maturity. On the other hand, older Millennials (30 – 38) were more open to fun and exciting design elements. During the focus groups, these mature wine consumers had a relaxed approach towards alternative wine packaging and appeared to be more willing to try new types of wine products. In particular, they were drawn towards the Sophia brand (Type 3) and found it to be fun, new, exciting, and convenient and functional, which was also found in the consumer survey results (Table 5.28). Therefore, presenting new design elements that are also fun and exciting may appeal to older Millennial wine consumers. Finally, Millennials appear to be attracted to natural and eco-friendly design elements. During the focus groups, participants noted a preference for products that included eco-friendly elements in the design scheme, such as a logo, nature image, and/or a message about sustainable practices. From a design perspective, this was consistent with the survey data, which also found consumers prefer natural looking products, like Type 1 (Table 5.8). Based on the results from this study, Millennials clearly prefer products that boast eco-friendly practices through the design of the packaging.
Convenience & functionality
In addition to design, the results show that convenience and functionality of the packaging are two important factors that push Millennials towards alternative wine packaging. Moreover, these consumers are attracted to alternatively packaged wine because it serves a unique purpose. For instance, comments such as “it is convenient to buy a large amount of wine instead of going to the store every day,” or “[alternative wine packaging] is great when we go to the lake and pack a cooler” were mentioned throughout the focus group sessions. Also, many of the participants noted they enjoy the convenience of alternative packaging features such as the handle, pour spout, and straw.
63 | P a g e
Producers should incorporate features that make alternative packaging convenient for the Millennial consumer to use in different situations. Likewise, the survey results indicated that the functionality of the packaging influences overall quality perceptions. For example, alternative wine packaging types that scored low on attractiveness and high on functionality also recorded a positive overall quality perception (Table 5.44). In addition, consumers note they preferred alternative packaging that can fit easily into a cooler, a refrigerator door, or even small bags (e.g., purses & backpacks). For example, including a handle on bag-in-box or pouch packages is a logical transportation solution that makes it functional for consumers to use the product, which was well received by Millennials. Thus, producers should explore features and design elements that present alternative packaging as easy to use and highly functional to attract Millennial wine consumers.
Social Perceptions
Next, this study explored the social perceptions associated with purchasing alternatively packaged wine. During the focus group sessions, most respondents noted they would not feel comfortable being seen by their peers purchasing or using certain types of alternative wine packaging. Typically associated with work related and/or formal situations, consumers made comments such as “I would not bring this [a traditionally designed bag-in-box] to a work party, it would be embarrassing” This was also the case in the consumer survey, which indicated that most Millennials would not take alternatively packaged wine to work related functions (Table 5.1 & Table 5.2). However, the findings showed that Millennials are comfortable using alternative wine products when gathering with friends and family. Therefore, Millennials are apprehensive about using alternatively packaged wine in work-related and/or formal situations but are willing to try these types of products in casual social settings.
Situational usage
Finally, a reoccurring theme that arose in the focus group sessions and was later explored in the consumer survey was situational usage. Situational usage implies that the situation is the primary motivation or co-motivates purchasing and preference behaviors. For example, in the focus group sessions, participants made comments such as, I like/would buy/use that [alternative wine package] if I was/when I am… “going to the lake,” “going to a party,” “tailgating [at a sporting event],” “drinking at home.” In addition, usage was often intertwined with other factors such as value. For instance, “I would buy this [BIB Type 2] for a [baby/wedding] shower because it holds a lot of wine but I wouldn’t take this [same BIB] to a work party, it look silly.” Moreover, the survey findings demonstrated that Millennials would most likely buy alternatively packaged wine when gathering with friends and family and/or for at home use. Thus, producers are recommended to focus on the situation in which the packaging may be used to better connect with their target market.