Embed Size (px)
Citation preview
NOT MEASUREMENTSENSITIVE
MIL-STD-810F1 January 2000 SUPERSEDINGMIL-STD-810E14 JULY 1989
DEPARTMENT OF DEFENSETEST METHOD STANDARD
FOR
ENVIRONMENTAL ENGINEERING CONSIDERATIONS
AND LABORATORY TESTS
AMSC N/A AREA ENVR
DISTRIBUTION STATEMENT A: Approved for public release; distribution is unlimited.
Downloaded from http://www.everyspec.com on 2012-06-04T5:34:26.
MIL-STD-810F1 January 2000
Part One-ii
FOREWORD
This test method standard is approved for use by all Departments and Agencies of the Department of Defense (DoD).Although prepared specifically for DoD applications, this standard may be tailored for commercial applications aswell. MIL-STD-810F is a significant revision of MIL-STD-810E. Much of the standard is rewritten completely toprovide clearer direction. The primary emphases are still the same -- tailoring a materiel item's environmental designand test limits to the conditions that the specific materiel will experience throughout its service life, and establishinglaboratory test methods that replicate the effects of environments on materiel rather than trying to reproduce theenvironments themselves. However, the "F" revision has been expanded significantly up front to explain how toimplement the environmental tailoring process throughout the materiel acquisition cycle.
This revision recognizes that the environmental design and test tailoring process has expanded to involve a widerange of managerial and technical interests. Accordingly, this revision orients environmental design and testdirection toward three basic types of users who have distinctly different, although closely associated, interests: program managers who, among other responsibilities, ensure proposed concepts and systems are valid and functional inintended operational environments; environmental engineering specialists (EES), who enter the acquisition process earlyto assist combat and materiel developer tailoring efforts by preparing life cycle environmental profiles and draftingtailored design criteria and test programs, and the design, test, and evaluation community, whose analysts, engineers, andfacility operators use tailored designs and tests to meet user needs.
The most visible difference in the "F" revision is that the overall document is in two parts.
Part One describes management, engineering, and technical roles in the environmental design and test tailoringprocess. It focuses on the process of tailoring materiel design and test criteria to the specific environmentalconditions a materiel item is likely to encounter during its service life. New appendices support the succinctlypresented text of Part One. Appendix A contains complete descriptions of environmental engineering tasks. Thesetasks, along with management information in Appendix B and EES guidance in Appendix C, will help to ensure theenvironmental design and test tailoring process is implemented and documented according to the disciplined, butflexible approach to materiel acquisition called for in Department of Defense (DoD) 5000-series documents (DoD5000.1, A.4). Terms used in this standard relating to the materiel acquisition process are limited to terms used in theDoD 5000-series documents; to avoid confusion and promote simplicity, service-specific terms/processes are notused.
Part Two contains environmental laboratory test methods to be applied according to the general and specific testtailoring guidelines described in Part One. It is important to emphasize that these methods are not to be called out inblanket fashion nor applied as unalterable routines, but are to be selected and tailored to generate the most relevanttest data possible.
To support the tailoring process described in Part One, each test method in Part Two contains some environmentaldata and references, and identifies tailoring opportunities for the particular method. Some methods afford a widelatitude for tailoring; some can be tailored up to established limits, and some have relatively few tailoring options. Whenever possible, each method contains background rationale to help determine the appropriate level of tailoring. Each test method supports the test engineer and test facility operator by describing preferred laboratory test facilitiesand methodologies. Any specific tailoring information and values contained in these test methods should besupplanted by more up-to-date or program-specific information when available.
When applied properly, the environmental management and engineering processes described in this standard can beof enormous value in generating confidence in the environmental worthiness and overall durability of materielsystem design. However, it is important to recognize that there are limitations inherent in laboratory testing thatmake it imperative to use proper caution and engineering judgement when extrapolating these laboratory results toresults that may be obtained under actual service conditions. In many cases, real-world environmental stresses(singularly or in combination) cannot be duplicated practically or reliably in test laboratories. Therefore, users
Downloaded from http://www.everyspec.com on 2012-06-04T5:34:26.

MIL-STD-810F1 January 2000
Part One-iii
should not assume that a system or component that passes laboratory tests of this standard also would pass field/fleetverification trials.
The US Department of Defense would like to thank the following individuals for their contributions toward thedevelopment and publication of MIL-STD-810F:
Anderson, Andy – United Defense Merritt, Ron – US Navy, Naval Air Warfare Center
Bair, Jim – US Air Force, Wright-Patterson AFB Moriceau, Jacques – LRBA, France
Bell, Dwayne – US Air Force, Eglin AFB Moss, Ron – Ordnance Board, United Kingdom
Caruso, Hank – G’s and Degrees Sullivan, Jamie – US Army, Redstone Technical Test Center
Connon, Skip – US Army, Aberdeen Test Center Tanner, Steve – US Navy, Naval Air Warfare Center
Egbert, Herb – US Army Developmental Test Command
Walton, Scott – US Army, Aberdeen Test Center
Galloway, Judy – US Army, Aberdeen Test Center Weaver, Earl – US Air Force, Wright-Patterson AFB
Henry, Connie – US Air Force, Wright-PattersonAFB
Williamson, Roger – US Army Test and EvaluationCommand
MacMartin, Dave – National Defence Headquarters,Canada
Also, a special thank you to Herb Egbert, Chairman of the MIL-STD-810 revision committee for his leadership,dedication, and perseverance in revising this document.
This standard is intended to be a "living document" that will be updated as new concepts, technologies, andmethodologies evolve. Address beneficial comments (recommended changes, additions, deletions) along with clear,supporting rationale and any pertinent data that may improve this document to: ASC/ENOI, Bldg. 560, 2530 LoopRoad West, Wright-Patterson AFB OH 45433-7101. Use the Standardization Document Improvement Proposal(DD Form 1426) appearing at the end of this document or send a letter detailing the paragraph/page number,recommended wording, and reason/rationale for the recommendation.
Address technical questions to the following offices:
Aeronautical Systems Center, ATTN: ASC/ENFS, 2530 Loop Road West, Wright-Patterson AFB OH 45433-7101;Commercial Tel: (937) 255-8357/8596; DSN 785-8357/8596; Fax: (937) 476-4546.
Naval Air Warfare Center, Weapons Division, ATTN: Code 476400D, China Lake CA 93555-6100; CommercialTel: (619) 939-4667; DSN 437-4667; Fax: (619) 939-1065.
US Army Developmental Test Command, 314 Longs Corner Road, ATTN: CSTE-DTC-TT-M, Aberdeen ProvingGround MD 21005-5055; Commercial Tel: (410) 278-1476; DSN 298-1476; Fax: (410) 278-4243/1475.
Downloaded from http://www.everyspec.com on 2012-06-04T5:34:26.

MIL-STD-810F1 January 2000
Part One-iv
THIS PAGE INTENTIONALLY BLANK
Downloaded from http://www.everyspec.com on 2012-06-04T5:34:26.
MIL-STD-810F1 January 2000
Part One-v
PART ONE -- ENVIRONMENTAL ENGINEERING PROGRAM GUIDELINES
TABLE OF CONTENTSParagraph Page
1. SCOPE......................................................................................................................................... 1
1.1 Purpose........................................................................................................................................ 11.2 Application.................................................................................................................................... 11.3 Limitations. ................................................................................................................................... 2
2. APPLICABLE DOCUMENTS...................................................................................................... 3
2.1 General. ....................................................................................................................................... 32.2 Government Documents. ............................................................................................................. 32.2.1 Standards..................................................................................................................................... 32.2.2 Other government documents. .................................................................................................... 32.3 Non-government Documents. ...................................................................................................... 32.4 Order of Precedence.................................................................................................................... 4
3. TERMINOLOGY .......................................................................................................................... 4
4. GENERAL PROGRAM GUIDELINES......................................................................................... 7
4.1 Program Managers. ..................................................................................................................... 74.1.1 Roles of the program manager. ................................................................................................... 74.1.2 Guidance for program managers................................................................................................. 74.1.2.1 Mission Need Statement (MNS). ................................................................................................. 84.1.2.2 Operational Requirements Document (ORD). ............................................................................. 84.1.2.3 Systems Engineering Management Plan (SEMP). ...................................................................... 94.1.2.4 Test and Evaluation Master Plan (TEMP).................................................................................... 94.1.2.5 Cost and Operational Effectiveness Analysis (COEA)................................................................. 94.2 Environmental Engineering Specialists (EES). ............................................................................ 94.2.1 Roles of environmental engineering specialists........................................................................... 94.2.2 Environmental engineering tailoring tasks. ................................................................................ 104.2.2.1 General. ..................................................................................................................................... 104.2.2.2 Preparing an Environmental Engineering Management Plan (EEMP), Task 401...................... 104.2.2.3 Developing an Environmental Test and Evaluation Master Plan (ETEMP). .............................. 104.2.2.3.1 Defining a Life Cycle Environmental Profile (LCEP), Task 402. ................................................ 104.2.2.3.2 Developing Operational Environment Documentation (OED), Task 403................................... 104.2.2.3.3 Developing an Environmental Issues/Criteria List (EICL), Task 404. ........................................ 114.2.2.4 Preparing a Detailed Environmental Test Plan (DETP), Task 405. ........................................... 114.2.2.5 Preparing an Environmental Test Report (ETR), Task 406. ...................................................... 114.3 Design and Test Engineers and Facility Operators. .................................................................. 114.3.1 Roles of design engineers. ........................................................................................................ 114.3.2 Roles of test engineers/facility operators. .................................................................................. 114.3.3 Guidance for design and test engineers and test facility operators. .......................................... 124.3.3.1 Natural environment (field/fleet) testing. .................................................................................... 124.3.3.2 Laboratory testing. ..................................................................................................................... 12
5. GENERAL LABORATORY TEST METHOD GUIDELINES. .................................................... 15
5.1 Standard Ambient Test Conditions. ........................................................................................... 155.2 Tolerances for Test Conditions. ................................................................................................. 15
Downloaded from http://www.everyspec.com on 2012-06-04T5:34:26.
MIL-STD-810F1 January 2000
Part One-vi
TABLE OF CONTENTS (CONT’D).Paragraph Page
5.3 Test Instrumentation. ................................................................................................................. 165.3.1 Suitability for environment.......................................................................................................... 165.3.2 Calibration. ................................................................................................................................. 165.4 Stabilizing Test Temperature. .................................................................................................... 165.4.1 Test item operating. ................................................................................................................... 165.4.2 Test item non-operating. ............................................................................................................ 165.5 Test Sequence........................................................................................................................... 165.6 Test Level Derivation. ................................................................................................................ 175.7 Pretest Information for Facility Operators. ................................................................................. 175.8 Test Setup.................................................................................................................................. 175.8.1 Installing the test item in test facility........................................................................................... 175.8.2 Test item operation. ................................................................................................................... 175.9 Pretest Baseline Data. ............................................................................................................... 185.10 Information During Test. ............................................................................................................ 185.11 Interrupted Tests........................................................................................................................ 185.11.1 In-tolerance interruptions. .......................................................................................................... 185.11.2 Out-of-tolerance interruptions for methods 503, 506, 510, 511, 514, 515, 516, 517, 519, 522,
and 523. ..................................................................................................................................... 185.11.3 Out-of-tolerance interruptions for methods 500, 501, 502, 504, 505, 507, 508, 509, 512, 513,
518, 520, and 521. ..................................................................................................................... 195.12 Combined Tests......................................................................................................................... 195.13 Post-test Data. ........................................................................................................................... 195.14 Environmental Effects and Failure Criteria. ............................................................................... 215.15 Environmental Test Reports. ..................................................................................................... 215.16 Water Purity. .............................................................................................................................. 215.17 Analysis of Results..................................................................................................................... 215.18 Monitoring. ................................................................................................................................. 225.18.1 Monitoring test chamber parameters. ........................................................................................ 225.18.2 Monitoring the item under test. .................................................................................................. 22
6. NOTES....................................................................................................................................... 23
6.1 Intended Use.............................................................................................................................. 236.2 Issue of DoDISS. ....................................................................................................................... 236.3 Subject Term (key word) Listing (Also see, Subject Index, page Index –1). ............................. 236.4 International Standardization Agreement................................................................................... 236.5 Changes from Previous Issue.................................................................................................... 24
FIGURES1-1 Environmental engineering program guide ................................................................................ viii1-2 Roles of acquisition personnel in environmental design/test tailoring process ............................ 24-1 Environmental test program tailoring process.............................................................................. 84-2a Generalized life cycle histories for military hardware ................................................................. 134-2b Generalized life cycle histories for military hardware ................................................................. 145-1 Interrupted test cycle logic, Method 503, 506, 510, 511, 514, 516, 517, 519, 522, and 523 ..... 20
Downloaded from http://www.everyspec.com on 2012-06-04T5:34:26.
MIL-STD-810F1 January 2000
Part One-vii
TABLE OF CONTENTS – Continued
APPENDIX PageA Environmental Management and Engineering Tasks ………………………………….. A-1B Detailed Program Management Guidance }}}}}}}}}}}}}}}}…… B-1C Environmental Tailoring Guidelines for Environmental Engineering
Specialists (EES) }}}}}}}}}}}}}}}}}}}}}}}}}}}…..C-1
D Terminology for Dynamic (Mechanical) Test Methods}}}}}}}}}}}}}. D-1
APPENDIX FIGUREC-1 Areas of occurrence of climatic categories ...................................................................... C-5
APPENDIX TABLEC-I Summary of climatic conditions and daily cycles of temperature, solar radiation,
and relative humidity ......................................................................................................... C-6
Subject Index (for Part One) }}}}}}}}}}}}}}}}}}}}}}}}}}}}}… Index -1
PART TWO -- LABORATORY TEST METHODS Part Two-1500.4 Low Pressure (Altitude) }}}}}}}}}}}}}}}}}}}}}.. 500.4-1 - 500.4-8501.4 High Temperature }}}}}}}}}}}}}}}}}}}}}}}} 501.4-1 - 501.4-12502.4 Low Temperature }}}}}}}}}}}}}}}}}}}}}}}} 502.4-1 - 502.4-10503.4 Temperature Shock }}}}}}}}}}}}}}}}}}}}}}}. 503.4-1 - 503.4-10504 Contamination by Fluids }}}}}}}}}}}}}}}}}}}}}. 504-1- 504A-2
505.4 Solar Radiation (Sunshine) }}}}}}}}}}}}}}}}}}}} 505.4-1 - 505.4A-8506.4 Rain }}}}}}}}}}}}}}}}}}}}}}}}}}}}}... 506.4-1 - 506.4-12507.4 Humidity }}}}}}}}}}}}}}}}}}}}}}}}}}}… 507.4-1 - 507.4A-2508.5 Fungus }}}}}}}}}}}}}}}}}}}}}}}}}}}…. 508.5-1 - 508.5-12509.4 Salt Fog }}}}}}}}}}}}}}}}}}}}}}}}}}}… 509.4-1 - 509.4-10510.4 Sand and Dust }}}}}}}}}}}}}}}}}}}}}}}}…. 510.4-1 - 510.4-12511.4 Explosive Atmosphere }}}}}}}}}}}}}}}}}}}}}… 511.4-1 - 511.4-6512.4 Immersion }}}}}}}}}}}}}}}}}}}}}}}}}}…. 512.4-1 - 512.4-8513.5 Acceleration }}}}}}}}}}}}}}}}}}}}}}}}}}. 513.5-1 - 513.5-14514.5 Vibration }}}}}}}}}}}}}}}}}}}}}}}}}}}… 514.5-i - 514.5C-16515.5 Acoustic Noise }}}}}}}}}}}}}}}}}}}}}}}}…. 515.5-i - 515.5B-2516.5 Shock }}}}}}}}}}}}}}}}}}}}}}}}}}}}… 516.5-i - 516.5C-4517 Pyroshock }}}}}}}}}}}}}}}}}}}}}}}}}}}. 517-1 - 517-24518 Acidic Atmosphere }}}}}}}}}}}}}}}}}}}}}}}.. 518-1 - 518-6
519.5 Gunfire Vibration}}}}}}}}}}}}}}}}}}}}}}}}.. 519.5-i - 519.5D-10520.2 Temperature, Humidity, Vibration, and Altitude }}}}}}}}}}}... 520.2-1 - 520.2A-10521.2 Icing/Freezing Rain }}}}}}}}}}}}}}}}}}}}}}}.. 521.2-1 - 521.2-8522 Ballistic Shock }}}}}}}}}}}}}}}}}}}}}}}}}.. 522-1 - 522-14
523.2 Vibro-Acoustic/Temperature }}}}}}}}}}}}}}}}}}}.. 523.2-1 – 523.2A-8
Downloaded from http://www.everyspec.com on 2012-06-04T5:34:26.
MIL-STD-810F1 January 2000
Part One-viii
EEMP LCEP OED EICL DETP ETRtailoringsimulationalternativeslaboratory testingfield/fleet testing
D E V EL O P E N V IR O N M E N TA L E N G IN E ER IN GM A N A G EM EN T PL A N (E EM P).
(TA S K 4 01 , R EF PA R A GR AP H 4 .2 .2.2 )
S C H E D U L E TA S K S 4 02 -4 06 , P L U S TA S K S U P P O R T.C O N S ID E R ALT E R N ATIVE S TO T E ST IN G H A R D W A R E.P R E PA R E C O ST /B E N E F IT /R IS K AN ALYS IS F O RA LT E R N AT IV E(S) TO TE ST IN G H A R D W AR E.
P R E PA R E LIF E C Y C LEE N V IR O N M E N TA L P R O F ILE (L C E P).
(TA S K 4 02 , R EF PA R A GR AP H 4 .2 .2.3 .1)
P R E PA R E EN VIR O N M EN TALISS U E S /C R IT E R IA L IST (E IC L ).
(TA S K 4 04 , R EF PA R A GR AP H 4 .2 .2.3 .3)
B AS E O N R ES U LT S F R O M TAS K S 4 02 & 4 03 .L IS T A LL TA IL O R ED IS S U E S & C R IT E R IA .P R O VID E R AT IO N AL E F O R T H EIRD E R IVAT IO N S .
P R E PA R E D E TAIL ED E N V IR O N M E N TA LT E S T P L AN (D E T P).
(TA S K 4 05 , R EF PA R A GR AP H 4 .2 .2.4 )
L AB O R ATO R Y T E S T PL A N S : U S E M E T H O D S IN T H ISS TAN D A R D , SE L EC T ED & TA IL O R E D TO T H E S PE C IF IC T E S T IT E M .F IE LD /F L E ET T E S T PLA N S : D E V EL O PM E N T /O PE R AT IO N A L T E S T A G E N C IE S U S E T H E IR O W NP LA N R E Q U IR E M E N T S /F O R M AT S. TA IL O R E DT O T H E S PE C IF IC T E S T IT E M .A LT E R N AT IV E(S) : E X PL A IN M E T H O D O LO G Y.
P ER F O R M E N V IR O N M E N TA L T E ST S.
L AB O R ATO R Y T E S T S : U S E M E T H O D S IN T H ISS TAN D A R D S EL E C T E D & TA ILO R E D T O T H ES PE C IF IC T E S T IT E M .F IE LD /F L E ET T E S T S : D E V EL O PM E N T /O PE R AT IO N A L T E S T A G E N C IE S U S E T H E IR O W NM E T H O D S , SE L EC T ED & TA IL O R E D TO T H E S PE C IF IC T E S T IT E M .A LT E R N AT IV E(S) : E X EC U T E M E T H O D O LO G Y.
P R E PA R E EN VIR O N M EN TALT E S T R EP O R T S (E T R ).
(TA S K 4 06 , R EF PA R A GR AP H 4 .2 .2.5 )
L AB O R ATO R Y T E S T R E PO R T S : U S E T H EF O R M AT IN TA SK 40 6.F IE LD /F L E ET T E S T R E PO R T S : D E V EL O PM EN T /O P E R AT IO N AL T ES TA G E N C IE S U S E T H E IR O W N T E S TR E P O R T R E Q U IR E M E N T S /F O R M AT S .A LT E R N AT IV E(S) : A P PR O P R IAT E R EP O R T (S ).
E N V IR O N M E N TA L T E S T & E VA L U AT IO N M A S T E R PL A N (E T E M P )(TA S KS 4 02 , & 40 4 R EF PAR AG R A P H 4.2 .2.3)
N O T E 1:
N O T E 2:
N O T E 3:
C O M P L ET E TA SK D E SC R IPT IO N S A R E INA PP E N D IX A .
IN C L U D E EE M P & E T E M P W IT H O T H E RS YS T E M P LA N S & P R O P O S A LS TO A LL O W R E A LIS T IC C O ST E S T IM AT IN G .
M A K E C O N T R A C T PR OV IS IO N S F O R T H EE Q U IPM EN T S U P P LIE R TO U P D AT E E E M P &E T E M P O N A PE R IO D IC B AS IS A S A D D IT IO N A LIN F O R M AT IO N B EC O M ES AVA ILA BL E .
P R E PA R E O P E R AT IO N AL EN VIR O N M EN TD O C U M E N TAT IO N (O E D ).
(TA S K 4 03 , R EF PA R A GR AP H 4 .2 .2.3 .2)
D O C U M E N T R E AL -W OR LD P L AT F O R MC H A R A C T E R IS T IC S .O BTAIN D ATA F R O M D ATAB A SE S , M O D EL S ,S IM U L AT IO N S .O BTAIN R E M A IN IN G D ATA B Y M EA S U R IN G R E A LIS T IC PL AT F O R M E N V IR O N M E N T S .
T E S TH A R D W A R E/
P R O TO T Y P ES? N O
Y ES
(S E E TA S K 4 01 R E F PA R A G R A PH S 4 .1 .2, 4 .2 .2.1 , & A PP E N D IX B , PA R A . F )
A LT E R N AT IV ES .
S EL E C T ALT E R N AT IV E(e .g., M O D E LIN G &S IM U L AT IO N , C O U P O NS AM PL E S, S IM ILA R IT Y, O T H E R A N ALY SE S .)S C H E D U L E A N D JU STIF YA LT E R N AT IV E(S) INTA SK 40 1 .
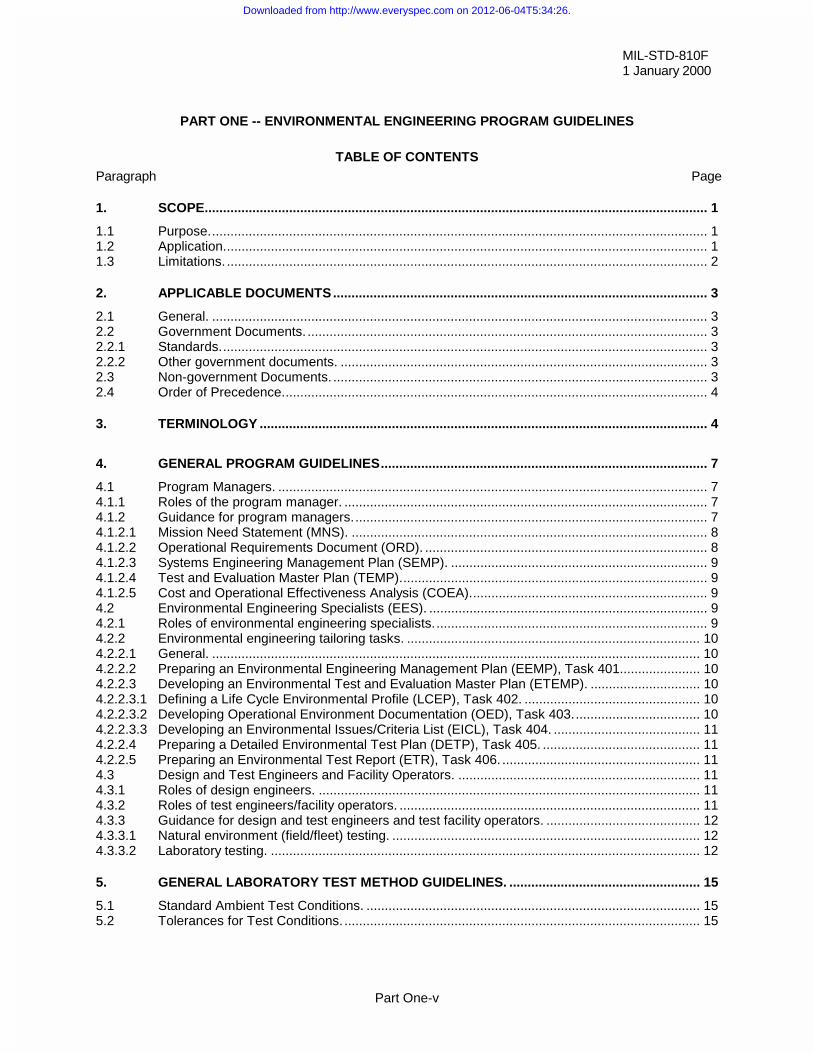
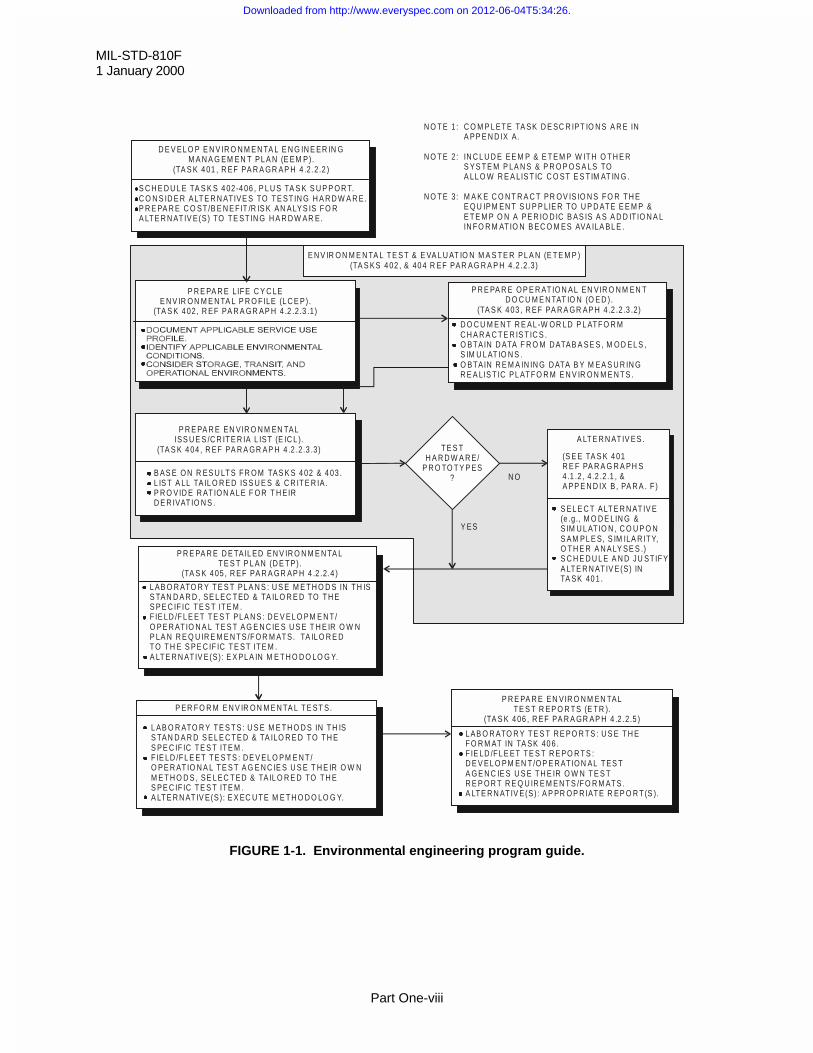
FIGURE 1-1. Environmental engineering program guide.
Downloaded from http://www.everyspec.com on 2012-06-04T5:34:26.
MIL-STD-810F1 January 2000
Part One-1
PART ONE -- ENVIRONMENTAL ENGINEERING PROGRAM GUIDELINES
1. SCOPE.
1.1 Purpose.
a. This standard contains materiel acquisition program planning and engineering direction for consideringthe influences that environmental stresses have on materiel throughout all phases of its service life. It isimportant to note that this document does not impose design or test specifications. Rather, it describesthe environmental tailoring process that results in realistic materiel designs and test methods based onmateriel system performance requirements. Figure 1-1 summarizes this direction.
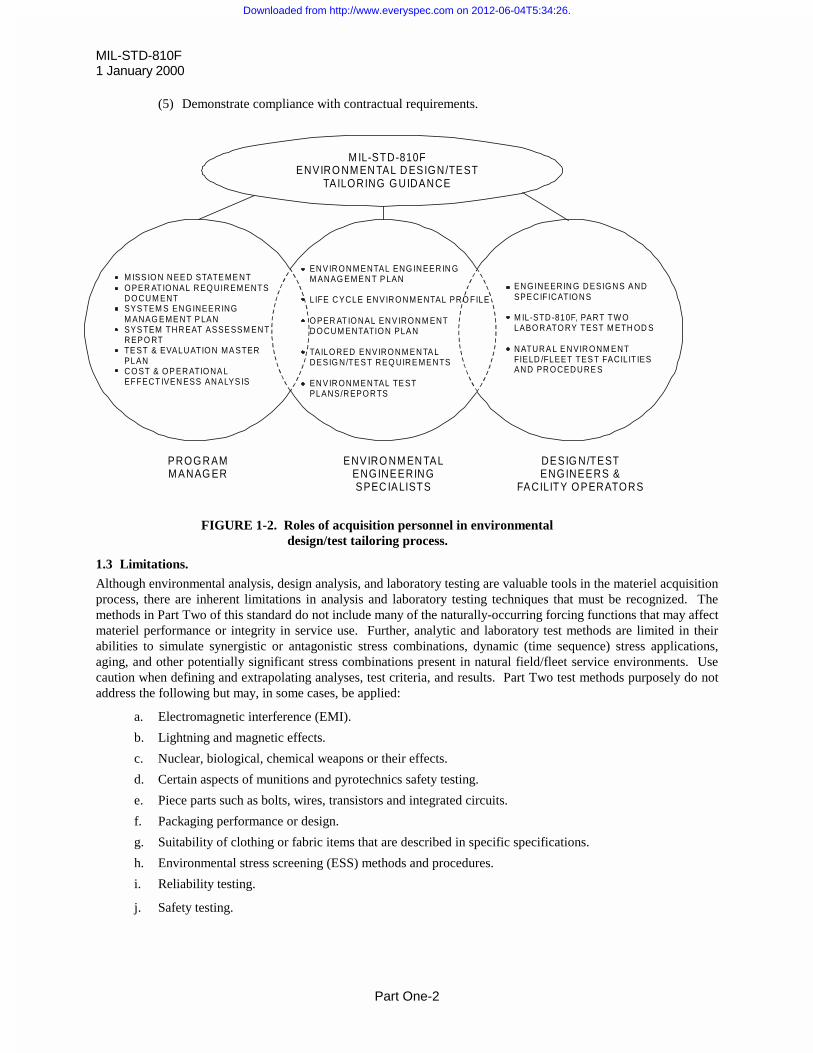
b. This document supports the functions of three different groups of personnel involved in the materielacquisition process. Each of these groups is critical to the goal of successfully incorporatingenvironmental considerations into materiel design, test, and evaluation. Although each group hasdifferent tasks to perform, none of these tasks can be isolated from the others in a successful acquisitionprogram. As shown on figure 1-2, this information is intended for the following:
(1) Materiel acquisition program managers among whose responsibilities is ensuring materiel willfunction as required in intended operational environments. (See paragraph 4.1 below.)
(2) Environmental engineering specialists (EES) who assist combat and materiel developers throughoutthe acquisition process to tailor their materiel designs and test designs to environmentalstresses/constraints expected during the materiel's service life. (See paragraph 4.2 below.)
(3) Design, test, and evaluation community analysts, engineers, and facility operators who meet userneeds by focusing on tailored designs and tests. (See paragraph 4.3 below, and Part Two of thisstandard.)
1.2 Application.
The tailoring process described in this standard (i.e., systematically considering detrimental effects that variousenvironmental factors may have on a specific materiel system throughout its service life) applies throughout themateriel acquisition cycle to all materiel developed for military or commercial applications, including foreign andnondevelopment item (NDI) procurements.
a. Part One lays out a disciplined, tailored approach for acquiring systems that will withstand the stresses ofclimatic, shock and vibration environments that they expect to see in their service lives. The basicprocess for acquiring materiel that satisfies users' needs from this environmental engineering viewpoint isat figure 1-1.
b. Part Two also is an integral part of the environmental tailoring process. It contains tailoring information,environmental stress data, and laboratory test methods. The environmental data contained in the methodsmay help, but should not be used exclusively, to define environmental stresses that materiel willencounter throughout its service life. This will help engineers to tailor analyses and tests to specificmateriel and its defined life cycle. It is not valid to call out all of the methods in this standard in ablanket fashion for a materiel system; nor is it valid, once a method is determined appropriate, to regardthe environmental stress data, test criteria, and procedures in the method as unalterable.
c. Guidance and test methods of this standard are intended to:
(1) Define environmental stress sequences, durations, and levels of materiel life cycles.
(2) Be used to develop analysis and test criteria tailored to the materiel and its environmental life cycle.
(3) Evaluate materiel performance when exposed to a life cycle of environmental stresses.
(4) Identify deficiencies, shortcomings, and defects in materiel design, materials, manufacturingprocesses, packaging techniques, and maintenance methods.
Downloaded from http://www.everyspec.com on 2012-06-04T5:34:26.
MIL-STD-810F 1 January 2000
Part One-2
(5) Demonstrate compliance with contractual requirements.
program managerenvironmental engineering specialistsdesign engineerstest engineersfacility operatorsMNS ORD STAR TEMP COEA EEMP LCEP OED DETP ETRtailoringfield/fleet testinglaboratory testing
FIGURE 1-2. Roles of acquisition personnel in environmentaldesign/test tailoring process.
1.3 Limitations.
Although environmental analysis, design analysis, and laboratory testing are valuable tools in the materiel acquisitionprocess, there are inherent limitations in analysis and laboratory testing techniques that must be recognized. Themethods in Part Two of this standard do not include many of the naturally-occurring forcing functions that may affectmateriel performance or integrity in service use. Further, analytic and laboratory test methods are limited in theirabilities to simulate synergistic or antagonistic stress combinations, dynamic (time sequence) stress applications,aging, and other potentially significant stress combinations present in natural field/fleet service environments. Usecaution when defining and extrapolating analyses, test criteria, and results. Part Two test methods purposely do notaddress the following but may, in some cases, be applied:
a. Electromagnetic interference (EMI).
b. Lightning and magnetic effects.
c. Nuclear, biological, chemical weapons or their effects.
d. Certain aspects of munitions and pyrotechnics safety testing.
e. Piece parts such as bolts, wires, transistors and integrated circuits.
f. Packaging performance or design.
g. Suitability of clothing or fabric items that are described in specific specifications.
h. Environmental stress screening (ESS) methods and procedures.
i. Reliability testing.
j. Safety testing.
M ISS IO N NEE D STATE ME NTO PER AT IO NAL REQ UIREM ENTSDO CUM ENTSYS TEM S ENG INEE RINGM ANAG EME NT P LANSYS TEM THREAT ASSESSM ENTREPO RTTE ST & EVALUATIO N MA STERPLANCO ST & O P ERATIO NA LEFFECT IVEN ESS ANALYS IS
ENVIRO NM ENTAL ENG INEERIN GM ANAG EME NT P LAN
LIFE CYCLE ENVIRONM ENTAL PRO FILE
O PER AT IO NAL ENV IRO NM ENTDO CUM ENTATIO N PLAN
TAILO RED ENVIRO NM ENTA LDESIG N/TEST REQ UIRE MENTS
ENVIRONM ENTAL TE STPLANS/REPO RTS
ENG INEERIN G DESIG NS ANDSPE CIFICATIO NS
M IL-STD-810F, PART TW OLABO RATO RY TEST M ETH OD S
NATURA L ENVIRONM ENTFIELD /FLEET TES T FACIL IT IESAND PRO CEDURE S
M IL-STD-810FENVIRO NM EN TAL D ESIGN/TEST
TAILORING G UIDANCE
ENVIRO NM EN TALENGINEERINGSPEC IALISTS
DESIG N/TESTENGINEERS &
FACILITY O PERATORS
PROG RAMM ANAG ER
Downloaded from http://www.everyspec.com on 2012-06-04T5:34:26.
MIL-STD-810F1 January 2000
Part One-3
2. APPLICABLE DOCUMENTS.
2.1 General.
The documents listed in this paragraph are referenced in Part TWO of this standard. There are other documentscited in Part TWO of this standard that are recommended for additional information or as examples. While everyeffort has been made to ensure the completeness of this list, document users are cautioned that they should considerall specified requirements documents and tasks cited in paragraph 4 of this standard.
2.2 Government Documents.
2.2.1 Standards.
The following standard forms a part of this document to the extent specified herein. When applying a portion of thisstandard that contains one of these references, cite the particular edition of the document that is listed in the currentDepartment of Defense Index of Specifications and Standards (DoDISS), or in the DoDISS that was in effect at thetime of solicitation. Unless otherwise specified, the issues of these documents are those listed in the issue of theDoDISS and supplement thereto, cited in the solicitation (see paragraph 6.2).
STANDARD
MIL-STD-882 System Safety Program Requirements
HANDBOOKS
MIL-HDBK-310 Global Climatic Data for Developing Military Products
(Copies of the above documents are available from the Defense Automated Printing Service, Building 4/Section D,700 Robbins Avenue, Philadelphia PA 19111-5098.)
2.2.2 Other government documents.
The following other Government documents and publications form a part of this document to the extent specifiedherein. Unless otherwise specified, the issues are those cited in the solicitation.
DIRECTIVES, INSTRUCTIONS, AND MANUALS.
DODD 5000.1 Defense Acquisition
DODD 5000.2 Mandatory Procedures for Major Defense Acquisition Programs (MDAP’s) and MajorAutomated Information System (MAIS) Acquisition Programs
DOD 5000.2M Defense Acquisition Management Documentation and Reports
(Copies of the above documents may be downloaded from the Washington HQ Services web site“http://web7.whs.osd.mil/corres.htm”.)
PUBLICATIONS
AR 70-38 Research, Development, Test and Evaluation of Materiel for Extreme ClimaticConditions
(Copies of the above document are available from the U.S. Army Publications Distribution Center, 1655 WoodsonRd., St Louis, MO 65104.)
2.3 Non-government Documents.
The following documents form a part of this document to the extent specified herein. Unless otherwise specified, theissues of the documents that are DoD adopted are those listed in the issue of the DoDISS cited in the solicitation. Unless otherwise specified, the issues of documents not listed in the DoDISS are the issues of the documents cited inthe solicitation (see 6.2).
Downloaded from http://www.everyspec.com on 2012-06-04T5:34:26.
MIL-STD-810F 1 January 2000
Part One-4
STANAG 2895 Extreme Climatic Conditions and Derived Conditions for Use in Defining Design TestCriteria for NATO Forces Materiel
STANAG 4242 Vibration Tests for Munitions Carried in Tracked Vehicles
STANAG 4370 Environmental Testing
QSTAG 360 Climatic Environmental Conditions Affecting the Design of Military Materiel
AECTP 100 Allied Environmental Conditions and Test Publication (AECTP) 100, EnvironmentalGuidelines for Defence Materiel (under STANAG 4370)
AECTP 200 Allied Environmental Conditions and Test Publication (AECTP) 200, EnvironmentalConditions (under STANAG 4370)
AECTP 300 Allied Environmental Conditions and Test Publication (AECTP) 300, ClimaticEnvironmental Tests (under STANAG 4370)
AECTP 400 Allied Environmental Conditions and Test Publication (AECTP) 400, MechanicalEnvironmental Tests (under STANAG 4370)
(Copies of the above documents are available from the Defense Automated Printing Service, Building 4 / Section D,700 Robbins Avenue, Philadelphia PA 19111-5098.)
AMERICAN NATIONAL STANDARDS INSTITUTE (ANSI)
ANSI NCSL Z540-1 General Requirements for Calibration Laboratories and Measuring and Test Equipment
INTERNATIONAL ORGANIZATION FOR STANDARDIZATION (ISO) STANDARDS
ISO 10012-1 Quality Assurance Requirements for Measuring Equipment - Part I: MeteorologicalConfirmation System for Measuring Equipment First Edition
(Copies of the above documents are available from American National Standards Institute (ANSI), 11 West 42nd
Street, New York NY 10036-8002.)
2.4 Order of Precedence.
In the event of a conflict between the text of this document and the references cited herein, the text of this documenttakes precedence. Nothing in this document, however, supersedes applicable laws and regulations unless a specificexemption has been obtained.
3. TERMINOLOGY.
This terminology section is meant to define the general terminology as it is used in this standard. In certain cases theterminology use may be somewhat different from its use in the general engineering community. No attempt has beenmade to be complete, therefore limiting the glossary to such terms as are found in the standard and that are importantto the application of the standard. Terminology unique to a particular method is defined, as appropriate, in thatmethod.
NOTE: A continuation of this terminology section that contains terminology more closely related to the dynamic(mechanical) test methods such as vibration, shock, gunfire vibration, etc., is in Appendix D.
a. Accelerated test. A test designed to shorten the controlled environmental test time with respect to theservice use time by increasing the frequency of occurrence, amplitude, duration, or any combination ofthese of environmental stresses that would be expected to occur during service use.
b. Aggravated test. A test in which one or more conditions are set at a more stressful level than the materielwill encounter during service use.
Downloaded from http://www.everyspec.com on 2012-06-04T5:34:26.

MIL-STD-810F1 January 2000
Part One-5
c. Ambient environment. The conditions, either outdoor or confined (e.g., temperature and humidity), thatcharacterize the air or other medium that surrounds materiel.
d. Climatic categories. Specific types of world climates which materiel is designed to withstand duringoperation, storage, and transit. See Part One, Appendix C, table C-I and figure C-1.
e. Combat developer. Military specialist concerned with training, doctrine, and materiel needsdocumentation.
f. Critical threshold value. The level of an environment forcing function that degrades the capability ofmateriel significantly or requires degradation prevention measures be taken.
g. Cumulative effects. The collective consequences of environmental stresses during the life cycle ofmateriel.
h. Engineering judgement. Expert opinion based on engineering education and experience, especially in thearea in which the judgement is made.
i. Environmental analysis. Technical activity covering an analytical description of the effects that variousenvironments have on materiel, subsystems, and component effectiveness.
j. Environmental conditions. (See Forcing function (environment).)
k. Environmental engineering. The discipline of applying engineering practices to the effects that variousenvironments have on materiel effectiveness.
l. Environmental engineering specialist (EES). A person or group of people skilled in one or moreenvironmental engineering areas. Areas include, but are not necessarily limited to: natural and inducedenvironments and their effects on materiel; expertise in measuring and analyzing in-serviceenvironmental conditions; formulating environmental test criteria; determining when environmentallaboratory tests are appropriate/valid substitutes for natural in-service environmental tests; and evaluatingthe effects of specific environments on materiel. (See paragraph 4.2.)
m. Environmental test. A structured procedure to help determine the effects of natural or inducedenvironments on materiel.
n. Environmental worthiness. The capability of materiel, subsystem, or component to perform its full arrayof intended functions in intended environments.
o. Equipment. For purposes of this standard, equipment includes the instrumentation, facilities, and supportapparatus used to conduct or monitor tests. This does not include the test item itself or the materiel ofwhich the test item is a sample or a part.
p. Forcing function (environment). A natural or induced physical environmental stress condition onmateriel that may affect its ability to function as intended or to withstand transit or storage during itsservice life. (Also referred to as an environmental condition or an environmental stress.)
q. Hermetic seal. A permanent, air-tight seal.
r. Induced environment. An environmental condition that is predominantly man-made or generated by themateriel platform. Also, refers to any condition internal to materiel that results from the combination ofnatural environmental forcing functions and the physical/chemical characteristics of the materiel itself.
s. In-service use. The anticipated use of materiel during its intended service use life.
t. Integrated Product Team (IPT). A group of individuals from different professional disciplines andorganizations (government and industry) who work together on a product from concept throughproduction stages. Individuals who cover a discipline may change from stage to stage, but the disciplineis covered, and the information pertinent to that discipline is passed to the succeeding team member(s) inthat discipline.
u. Life cycle profile. A time history of events and conditions associated with materiel from its release frommanufacturing to its removal from service, including demilitarization. The life cycle should include the
Downloaded from http://www.everyspec.com on 2012-06-04T5:34:26.

MIL-STD-810F 1 January 2000
Part One-6
various phases materiel will encounter in its life, such as: packaging, handling, shipping, and storageprior to use; mission profiles while in use; phases between missions such as stand-by or storage, transferto and from repair sites and alternate locations; and geographical locations of expected deployment.
v. Materiel. A commodity or set of commodities. A generic class of hardware designed to perform aspecific function.
w. Materiel developer. An agency or group of individuals involved in designing, testing, or evaluatingmateriel to meet developer performance requirements.
x. Mission profile. That portion of the life cycle profile associated with a specific operational mission.
y. Operational worthiness. The capability of materiel, a subsystem, or component to perform its full arrayof intended functions.
z. Parameter. Any quantity that represents a descriptive generalization of a certain characteristic physicalproperty of a system that has a certain value at a particular time.
aa. Parameter level. The value of a physical property that documents the degree, extent, or level at which aparameter exists at a given location at a given point in time, or the value to which a variable test controlis set (see test level).
bb. Platform. Any vehicle, surface, or medium that carries the materiel. For example, an aircraft is thecarrying platform for installed avionics items or transported or externally mounted stores. The land is theplatform for a ground radar set, for example, and a person for a man-portable radio.
cc. Platform environment. The environmental conditions materiel experiences as a result of being attachedto or loaded onto a platform. The platform environment is influenced by forcing functions induced ormodified by the platform and any platform environmental control systems.
dd. Program manager. The (Government) official who is in charge of the acquisition process for themateriel.
ee. Service life. Period of time from the release of materiel from the manufacturer through retirement andfinal disposition.
ff. Tailoring. The process of choosing design characteristics/tolerances and test environments, methods,procedures, sequences and conditions, and altering critical design and test values, conditions of failure,etc., to take into account the effects of the particular environmental forcing functions to which materielnormally would be subjected during its life cycle. The tailoring process also includes preparing orreviewing engineering task, planning, test, and evaluation documents to help ensure realistic weather,climate, and other physical environmental conditions are given proper consideration throughout theacquisition cycle.
gg. Test item. Specific materiel, a subsystem, or component being tested, including its container andpackaging materials, that is representative of the materiel being developed. A representative sample ofmateriel that is used for test purposes.
hh. Test level. The value at which a test condition is set or recorded. (Also, see parameter level.)
ii. Test method. The criteria and procedures used to formulate an environmental test. Laboratory testmethods are identified by the environment (or combinations of environments) in Part Two of thisdocument.
jj. Test plan. A document that may include test procedures and test levels, failure criteria, test schedules,and operational and storage requirements.
kk. Test procedure. A sequence of actions that prescribes the exposure of a test item to a particularenvironmental forcing function or combination of environmental forcing functions, as well asinspections, possible operational checks, etc.
Downloaded from http://www.everyspec.com on 2012-06-04T5:34:26.
MIL-STD-810F1 January 2000
Part One-7
ll. Virtual proving ground. Suite of tools, techniques, and procedures by which the tester will verify,validate, test, and evaluate systems, simulators, and models by exposing them to a synthetic rendition ofthe ground truth. “Ground truth data” are data collected from real-world tests or experiences.
4. GENERAL PROGRAM GUIDELINES.
4.1 Program Managers.
4.1.1 Roles of the program manager.
In the context of this standard, the program manager's primary role is to ensure environmental engineeringconsiderations are addressed systematically, thoroughly, and effectively at appropriate times throughout the materielacquisition process. The process for accomplishing this integration is diagrammed on figure 1-1. An associated roleis to ensure environmental effects information is documented, available, and communicated from one program phaseto another.
4.1.2 Guidance for program managers.
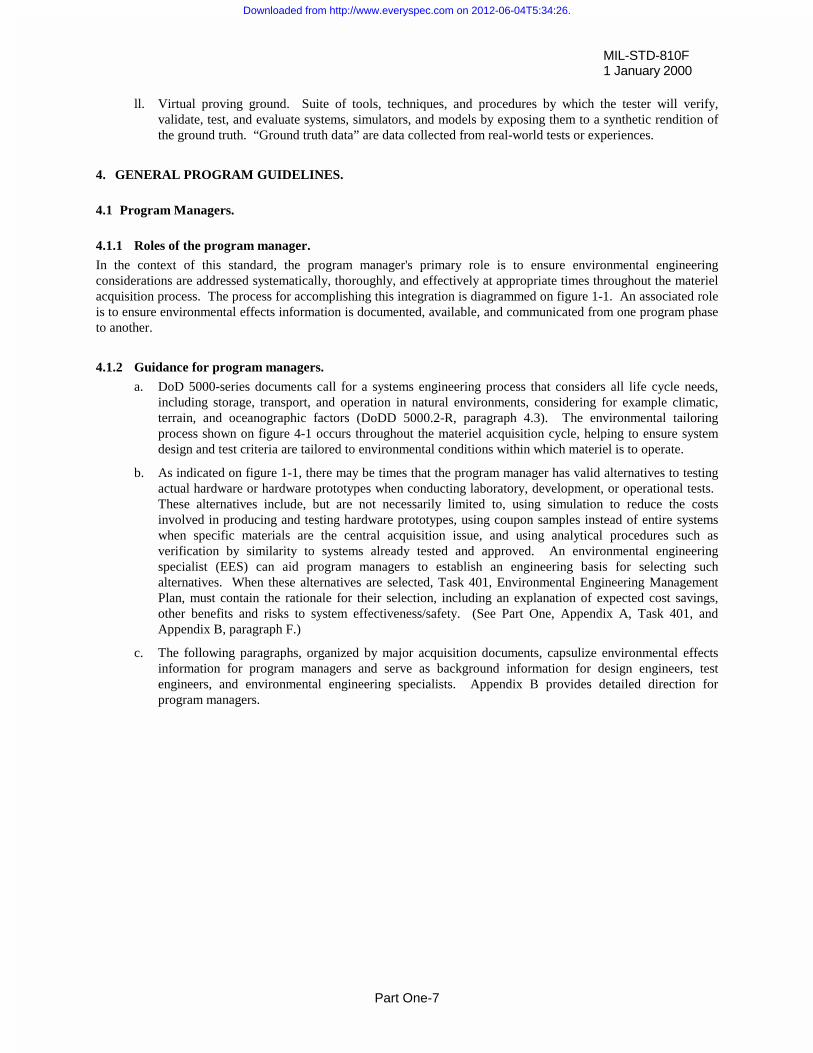
a. DoD 5000-series documents call for a systems engineering process that considers all life cycle needs,including storage, transport, and operation in natural environments, considering for example climatic,terrain, and oceanographic factors (DoDD 5000.2-R, paragraph 4.3). The environmental tailoringprocess shown on figure 4-1 occurs throughout the materiel acquisition cycle, helping to ensure systemdesign and test criteria are tailored to environmental conditions within which materiel is to operate.
b. As indicated on figure 1-1, there may be times that the program manager has valid alternatives to testingactual hardware or hardware prototypes when conducting laboratory, development, or operational tests. These alternatives include, but are not necessarily limited to, using simulation to reduce the costsinvolved in producing and testing hardware prototypes, using coupon samples instead of entire systemswhen specific materials are the central acquisition issue, and using analytical procedures such asverification by similarity to systems already tested and approved. An environmental engineeringspecialist (EES) can aid program managers to establish an engineering basis for selecting suchalternatives. When these alternatives are selected, Task 401, Environmental Engineering ManagementPlan, must contain the rationale for their selection, including an explanation of expected cost savings,other benefits and risks to system effectiveness/safety. (See Part One, Appendix A, Task 401, andAppendix B, paragraph F.)
c. The following paragraphs, organized by major acquisition documents, capsulize environmental effectsinformation for program managers and serve as background information for design engineers, testengineers, and environmental engineering specialists. Appendix B provides detailed direction forprogram managers.
Downloaded from http://www.everyspec.com on 2012-06-04T5:34:26.
MIL-STD-810F 1 January 2000
Part One-8
0
requirements documentstailoringplatform environmentnatural environmentforcing functionsinduced
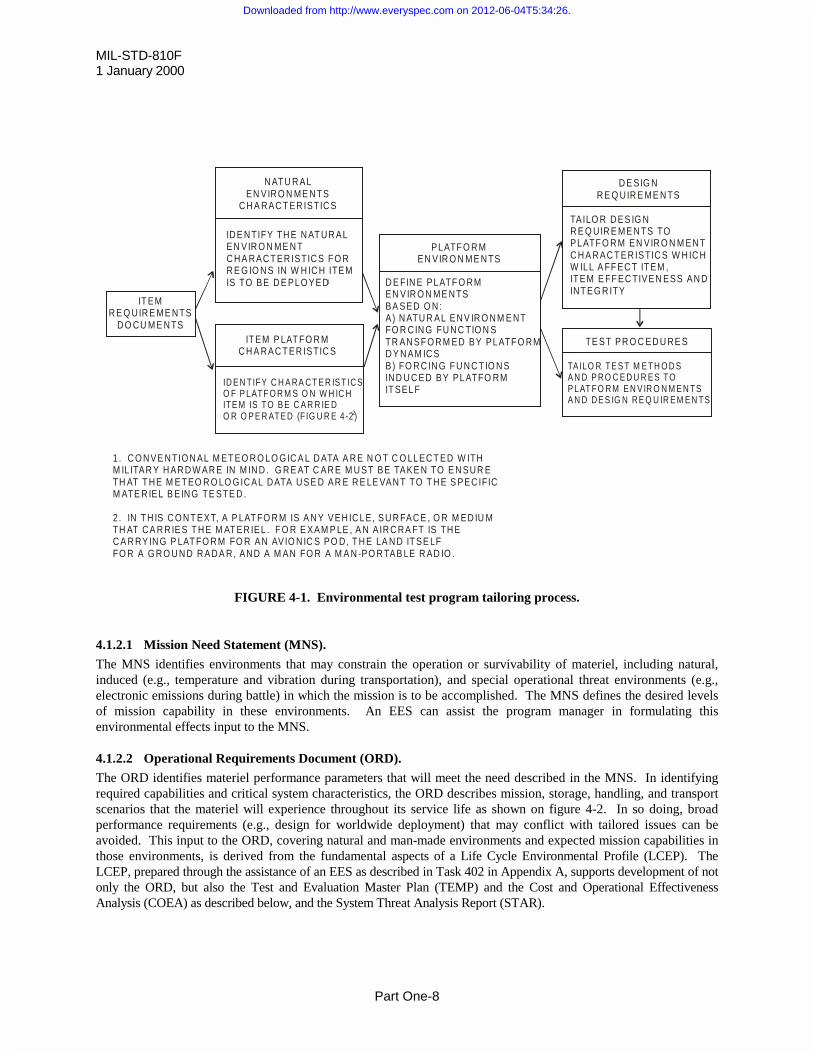
FIGURE 4-1. Environmental test program tailoring process.
4.1.2.1 Mission Need Statement (MNS).
The MNS identifies environments that may constrain the operation or survivability of materiel, including natural,induced (e.g., temperature and vibration during transportation), and special operational threat environments (e.g.,electronic emissions during battle) in which the mission is to be accomplished. The MNS defines the desired levelsof mission capability in these environments. An EES can assist the program manager in formulating thisenvironmental effects input to the MNS.
4.1.2.2 Operational Requirements Document (ORD).
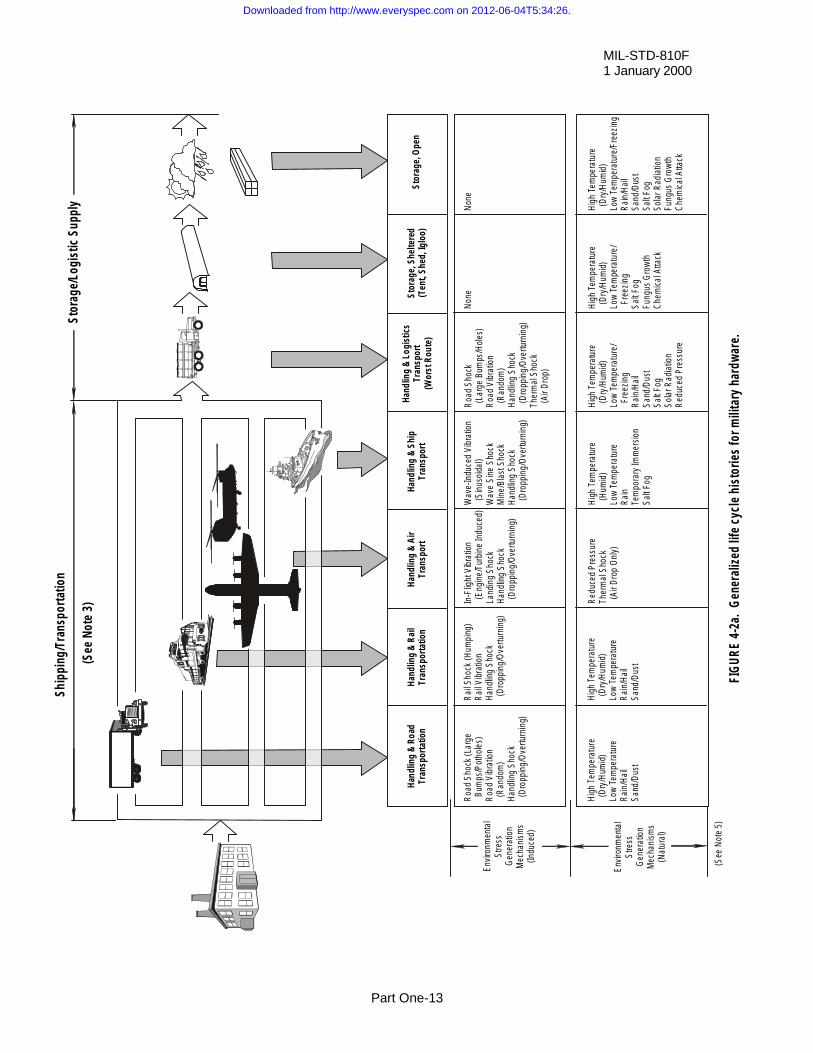
The ORD identifies materiel performance parameters that will meet the need described in the MNS. In identifyingrequired capabilities and critical system characteristics, the ORD describes mission, storage, handling, and transportscenarios that the materiel will experience throughout its service life as shown on figure 4-2. In so doing, broadperformance requirements (e.g., design for worldwide deployment) that may conflict with tailored issues can beavoided. This input to the ORD, covering natural and man-made environments and expected mission capabilities inthose environments, is derived from the fundamental aspects of a Life Cycle Environmental Profile (LCEP). TheLCEP, prepared through the assistance of an EES as described in Task 402 in Appendix A, supports development of notonly the ORD, but also the Test and Evaluation Master Plan (TEMP) and the Cost and Operational EffectivenessAnalysis (COEA) as described below, and the System Threat Analysis Report (STAR).
IT EMR E Q UIR E ME N TS
D O CU M E N TS
N ATU R ALEN VIR O N ME N TS
C H A RAC T ER ISTIC S
IDE N TIFY TH E N AT UR ALEN VIR O N ME N TC H A RAC T ER ISTIC S FO RR E G IO N S IN W H IC H ITEMIS TO BE D E PLO YED
IT EM P LAT FO R MC H A RAC T ER ISTIC S
ID E N TIFY C H A RA CT E R IS T ICSO F P LATF O R M S O N W H IC HITE M IS TO B E C A R R IE DO R O P E R ATE D (F IG U R E 4 -2 )
PLATF O R MEN VIR O N ME N TS
D E FIN E PLATF O RMEN VIR O N ME N TSBA SED O N :A) N ATU R AL EN V IR O N M E NTFO R CIN G FU N C TIO N STR AN SF O R M ED BY PLATF O RMD Y N AM IC SB) FO R C IN G F U N C T IO N SIND U C ED BY PLATFO RMIT SEL F
TE ST PR O C ED U RE S
TA ILO R TE S T M E TH O D SA N D P RO C E D U R E S TOP L AT FO RM E N V IR O N M E N TSA N D DE S IG N RE Q U IR E M E N TS
D E SIG NR E Q UIR E ME N TS
TAILO R D ES IG NR E Q UIR E ME N TS TOPLATF O R M EN VIR O N M EN TC H A RAC T ER ISTIC S W H IC HW ILL A FF EC T IT EM ,IT EM E FF EC TIVEN ESS AN DINT EG R ITY
1 . C O N VE N TIO N AL M ET EO R O LO G IC A L D ATA A R E N O T C O LLEC T ED W ITHM IL ITAR Y H AR D W AR E IN M IN D . G R E AT C AR E M U ST BE TAKE N TO E N SUR ETH AT T HE M E TEO R O LO G IC AL DATA U SE D AR E R E LE VAN T TO T H E S PEC IFIC M ATE R IEL B EIN G TE STE D .
2 . IN T H IS C O N T EXT, A P LAT FO R M IS A N Y VEH IC LE, S U R FAC E , O R M ED IU MTH AT CA R R IE S T H E M AT ER IEL . F O R E XAM P LE , A N A IR C RA FT IS TH EC A R RY IN G P LAT FO R M FO R AN AVIO N IC S PO D , T H E LA N D IT SE LFFO R A G R O U N D R AD A R , AND A M AN FO R A M A N -PO R TAB LE R AD IO .
1
2
Downloaded from http://www.everyspec.com on 2012-06-04T5:34:26.
MIL-STD-810F1 January 2000
Part One-9
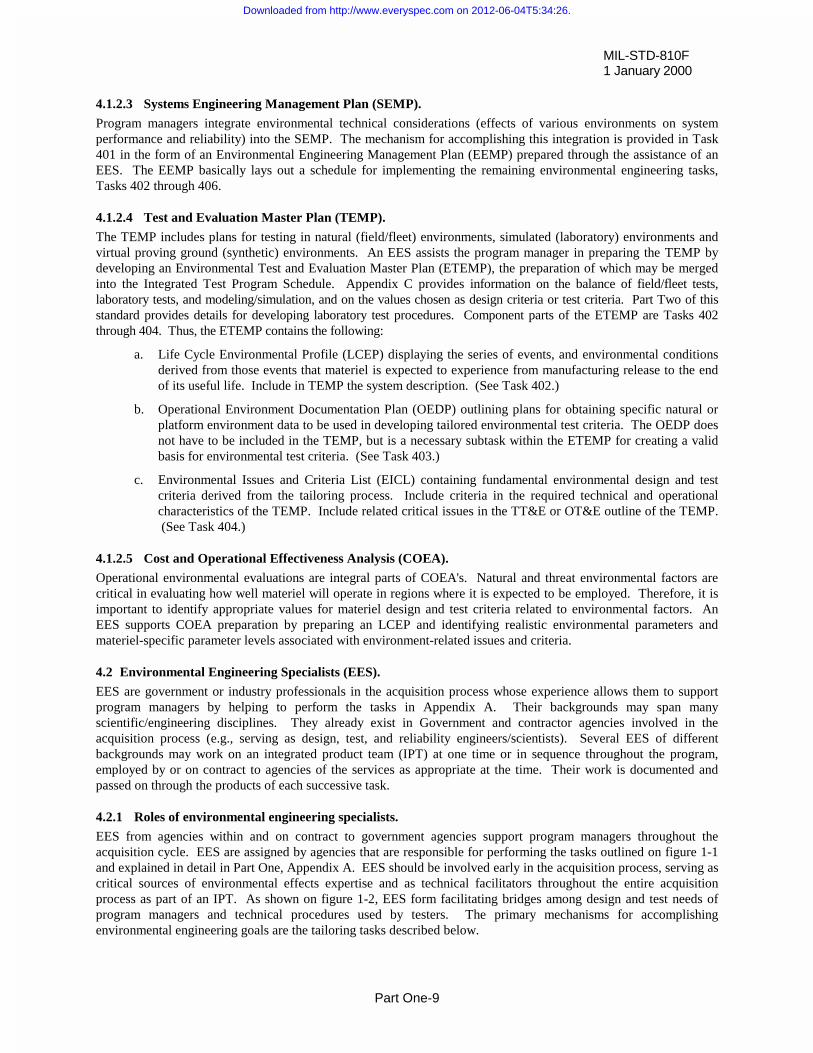
4.1.2.3 Systems Engineering Management Plan (SEMP).
Program managers integrate environmental technical considerations (effects of various environments on systemperformance and reliability) into the SEMP. The mechanism for accomplishing this integration is provided in Task401 in the form of an Environmental Engineering Management Plan (EEMP) prepared through the assistance of anEES. The EEMP basically lays out a schedule for implementing the remaining environmental engineering tasks,Tasks 402 through 406.
4.1.2.4 Test and Evaluation Master Plan (TEMP).
The TEMP includes plans for testing in natural (field/fleet) environments, simulated (laboratory) environments andvirtual proving ground (synthetic) environments. An EES assists the program manager in preparing the TEMP bydeveloping an Environmental Test and Evaluation Master Plan (ETEMP), the preparation of which may be mergedinto the Integrated Test Program Schedule. Appendix C provides information on the balance of field/fleet tests,laboratory tests, and modeling/simulation, and on the values chosen as design criteria or test criteria. Part Two of thisstandard provides details for developing laboratory test procedures. Component parts of the ETEMP are Tasks 402through 404. Thus, the ETEMP contains the following:
a. Life Cycle Environmental Profile (LCEP) displaying the series of events, and environmental conditionsderived from those events that materiel is expected to experience from manufacturing release to the endof its useful life. Include in TEMP the system description. (See Task 402.)
b. Operational Environment Documentation Plan (OEDP) outlining plans for obtaining specific natural orplatform environment data to be used in developing tailored environmental test criteria. The OEDP doesnot have to be included in the TEMP, but is a necessary subtask within the ETEMP for creating a validbasis for environmental test criteria. (See Task 403.)
c. Environmental Issues and Criteria List (EICL) containing fundamental environmental design and testcriteria derived from the tailoring process. Include criteria in the required technical and operationalcharacteristics of the TEMP. Include related critical issues in the TT&E or OT&E outline of the TEMP. (See Task 404.)
4.1.2.5 Cost and Operational Effectiveness Analysis (COEA).
Operational environmental evaluations are integral parts of COEA's. Natural and threat environmental factors arecritical in evaluating how well materiel will operate in regions where it is expected to be employed. Therefore, it isimportant to identify appropriate values for materiel design and test criteria related to environmental factors. AnEES supports COEA preparation by preparing an LCEP and identifying realistic environmental parameters andmateriel-specific parameter levels associated with environment-related issues and criteria.
4.2 Environmental Engineering Specialists (EES).
EES are government or industry professionals in the acquisition process whose experience allows them to supportprogram managers by helping to perform the tasks in Appendix A. Their backgrounds may span manyscientific/engineering disciplines. They already exist in Government and contractor agencies involved in theacquisition process (e.g., serving as design, test, and reliability engineers/scientists). Several EES of differentbackgrounds may work on an integrated product team (IPT) at one time or in sequence throughout the program,employed by or on contract to agencies of the services as appropriate at the time. Their work is documented andpassed on through the products of each successive task.
4.2.1 Roles of environmental engineering specialists.
EES from agencies within and on contract to government agencies support program managers throughout theacquisition cycle. EES are assigned by agencies that are responsible for performing the tasks outlined on figure 1-1and explained in detail in Part One, Appendix A. EES should be involved early in the acquisition process, serving ascritical sources of environmental effects expertise and as technical facilitators throughout the entire acquisitionprocess as part of an IPT. As shown on figure 1-2, EES form facilitating bridges among design and test needs ofprogram managers and technical procedures used by testers. The primary mechanisms for accomplishingenvironmental engineering goals are the tailoring tasks described below.
Downloaded from http://www.everyspec.com on 2012-06-04T5:34:26.
MIL-STD-810F 1 January 2000
Part One-10
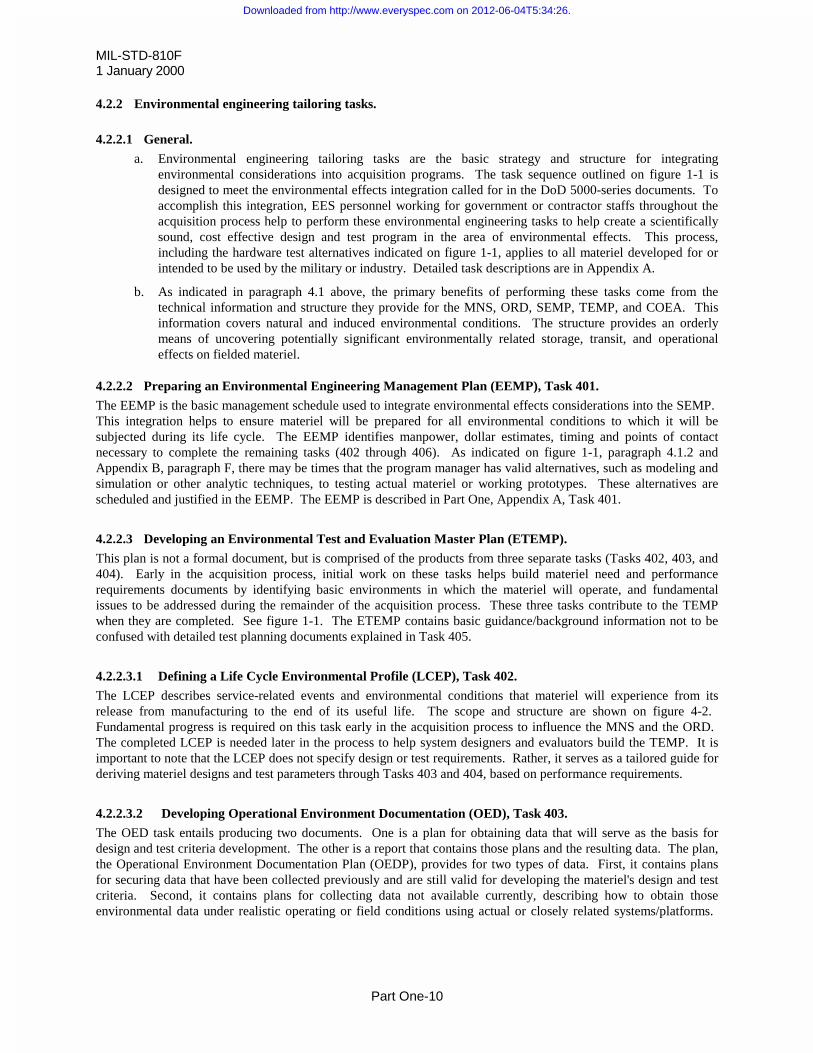
4.2.2 Environmental engineering tailoring tasks.
4.2.2.1 General.
a. Environmental engineering tailoring tasks are the basic strategy and structure for integratingenvironmental considerations into acquisition programs. The task sequence outlined on figure 1-1 isdesigned to meet the environmental effects integration called for in the DoD 5000-series documents. Toaccomplish this integration, EES personnel working for government or contractor staffs throughout theacquisition process help to perform these environmental engineering tasks to help create a scientificallysound, cost effective design and test program in the area of environmental effects. This process,including the hardware test alternatives indicated on figure 1-1, applies to all materiel developed for orintended to be used by the military or industry. Detailed task descriptions are in Appendix A.
b. As indicated in paragraph 4.1 above, the primary benefits of performing these tasks come from thetechnical information and structure they provide for the MNS, ORD, SEMP, TEMP, and COEA. Thisinformation covers natural and induced environmental conditions. The structure provides an orderlymeans of uncovering potentially significant environmentally related storage, transit, and operationaleffects on fielded materiel.
4.2.2.2 Preparing an Environmental Engineering Management Plan (EEMP), Task 401.
The EEMP is the basic management schedule used to integrate environmental effects considerations into the SEMP. This integration helps to ensure materiel will be prepared for all environmental conditions to which it will besubjected during its life cycle. The EEMP identifies manpower, dollar estimates, timing and points of contactnecessary to complete the remaining tasks (402 through 406). As indicated on figure 1-1, paragraph 4.1.2 andAppendix B, paragraph F, there may be times that the program manager has valid alternatives, such as modeling andsimulation or other analytic techniques, to testing actual materiel or working prototypes. These alternatives arescheduled and justified in the EEMP. The EEMP is described in Part One, Appendix A, Task 401.
4.2.2.3 Developing an Environmental Test and Evaluation Master Plan (ETEMP).
This plan is not a formal document, but is comprised of the products from three separate tasks (Tasks 402, 403, and404). Early in the acquisition process, initial work on these tasks helps build materiel need and performancerequirements documents by identifying basic environments in which the materiel will operate, and fundamentalissues to be addressed during the remainder of the acquisition process. These three tasks contribute to the TEMPwhen they are completed. See figure 1-1. The ETEMP contains basic guidance/background information not to beconfused with detailed test planning documents explained in Task 405.
4.2.2.3.1 Defining a Life Cycle Environmental Profile (LCEP), Task 402.
The LCEP describes service-related events and environmental conditions that materiel will experience from itsrelease from manufacturing to the end of its useful life. The scope and structure are shown on figure 4-2. Fundamental progress is required on this task early in the acquisition process to influence the MNS and the ORD. The completed LCEP is needed later in the process to help system designers and evaluators build the TEMP. It isimportant to note that the LCEP does not specify design or test requirements. Rather, it serves as a tailored guide forderiving materiel designs and test parameters through Tasks 403 and 404, based on performance requirements.
4.2.2.3.2 Developing Operational Environment Documentation (OED), Task 403.
The OED task entails producing two documents. One is a plan for obtaining data that will serve as the basis fordesign and test criteria development. The other is a report that contains those plans and the resulting data. The plan,the Operational Environment Documentation Plan (OEDP), provides for two types of data. First, it contains plansfor securing data that have been collected previously and are still valid for developing the materiel's design and testcriteria. Second, it contains plans for collecting data not available currently, describing how to obtain thoseenvironmental data under realistic operating or field conditions using actual or closely related systems/platforms.
Downloaded from http://www.everyspec.com on 2012-06-04T5:34:26.
MIL-STD-810F1 January 2000
Part One-11
The OEDP and the resulting data (existing and new data) form the Operational Environment Documentation Report(OEDR).
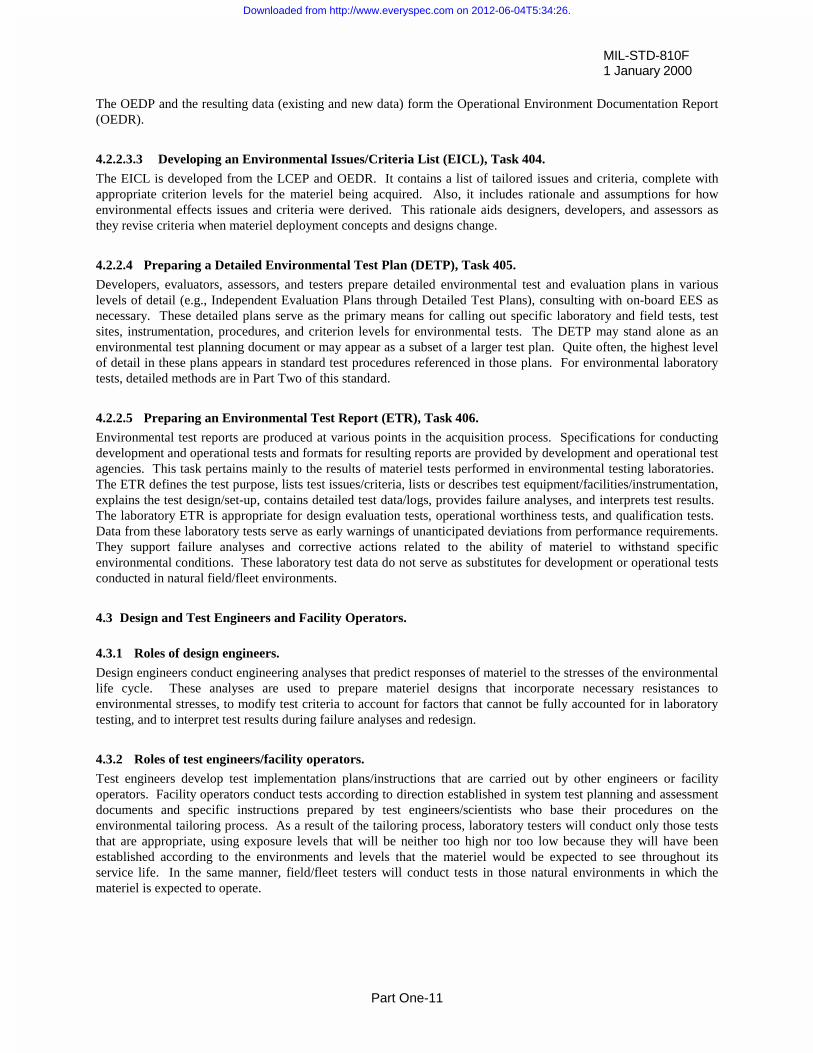
4.2.2.3.3 Developing an Environmental Issues/Criteria List (EICL), Task 404.
The EICL is developed from the LCEP and OEDR. It contains a list of tailored issues and criteria, complete withappropriate criterion levels for the materiel being acquired. Also, it includes rationale and assumptions for howenvironmental effects issues and criteria were derived. This rationale aids designers, developers, and assessors asthey revise criteria when materiel deployment concepts and designs change.
4.2.2.4 Preparing a Detailed Environmental Test Plan (DETP), Task 405.
Developers, evaluators, assessors, and testers prepare detailed environmental test and evaluation plans in variouslevels of detail (e.g., Independent Evaluation Plans through Detailed Test Plans), consulting with on-board EES asnecessary. These detailed plans serve as the primary means for calling out specific laboratory and field tests, testsites, instrumentation, procedures, and criterion levels for environmental tests. The DETP may stand alone as anenvironmental test planning document or may appear as a subset of a larger test plan. Quite often, the highest levelof detail in these plans appears in standard test procedures referenced in those plans. For environmental laboratorytests, detailed methods are in Part Two of this standard.
4.2.2.5 Preparing an Environmental Test Report (ETR), Task 406.
Environmental test reports are produced at various points in the acquisition process. Specifications for conductingdevelopment and operational tests and formats for resulting reports are provided by development and operational testagencies. This task pertains mainly to the results of materiel tests performed in environmental testing laboratories. The ETR defines the test purpose, lists test issues/criteria, lists or describes test equipment/facilities/instrumentation,explains the test design/set-up, contains detailed test data/logs, provides failure analyses, and interprets test results. The laboratory ETR is appropriate for design evaluation tests, operational worthiness tests, and qualification tests. Data from these laboratory tests serve as early warnings of unanticipated deviations from performance requirements.They support failure analyses and corrective actions related to the ability of materiel to withstand specificenvironmental conditions. These laboratory test data do not serve as substitutes for development or operational testsconducted in natural field/fleet environments.
4.3 Design and Test Engineers and Facility Operators.
4.3.1 Roles of design engineers.
Design engineers conduct engineering analyses that predict responses of materiel to the stresses of the environmentallife cycle. These analyses are used to prepare materiel designs that incorporate necessary resistances toenvironmental stresses, to modify test criteria to account for factors that cannot be fully accounted for in laboratorytesting, and to interpret test results during failure analyses and redesign.
4.3.2 Roles of test engineers/facility operators.
Test engineers develop test implementation plans/instructions that are carried out by other engineers or facilityoperators. Facility operators conduct tests according to direction established in system test planning and assessmentdocuments and specific instructions prepared by test engineers/scientists who base their procedures on theenvironmental tailoring process. As a result of the tailoring process, laboratory testers will conduct only those teststhat are appropriate, using exposure levels that will be neither too high nor too low because they will have beenestablished according to the environments and levels that the materiel would be expected to see throughout itsservice life. In the same manner, field/fleet testers will conduct tests in those natural environments in which themateriel is expected to operate.
Downloaded from http://www.everyspec.com on 2012-06-04T5:34:26.

MIL-STD-810F 1 January 2000
Part One-12
4.3.3 Guidance for design and test engineers and test facility operators.
4.3.3.1 Natural environment (field/fleet) testing.
Plan for and conduct natural environmental field/fleet tests, incorporating the principles of environmental tailoringinformation into established field/fleet procedures and facilities.
4.3.3.2 Laboratory testing.
Plan for and conduct laboratory tests according to the tailoring information above and specific guidelines below inPart One, plus specific guidelines in each method of Part Two of this standard.
Downloaded from http://www.everyspec.com on 2012-06-04T5:34:26.
MIL-STD-810F1 January 2000
Part One-13
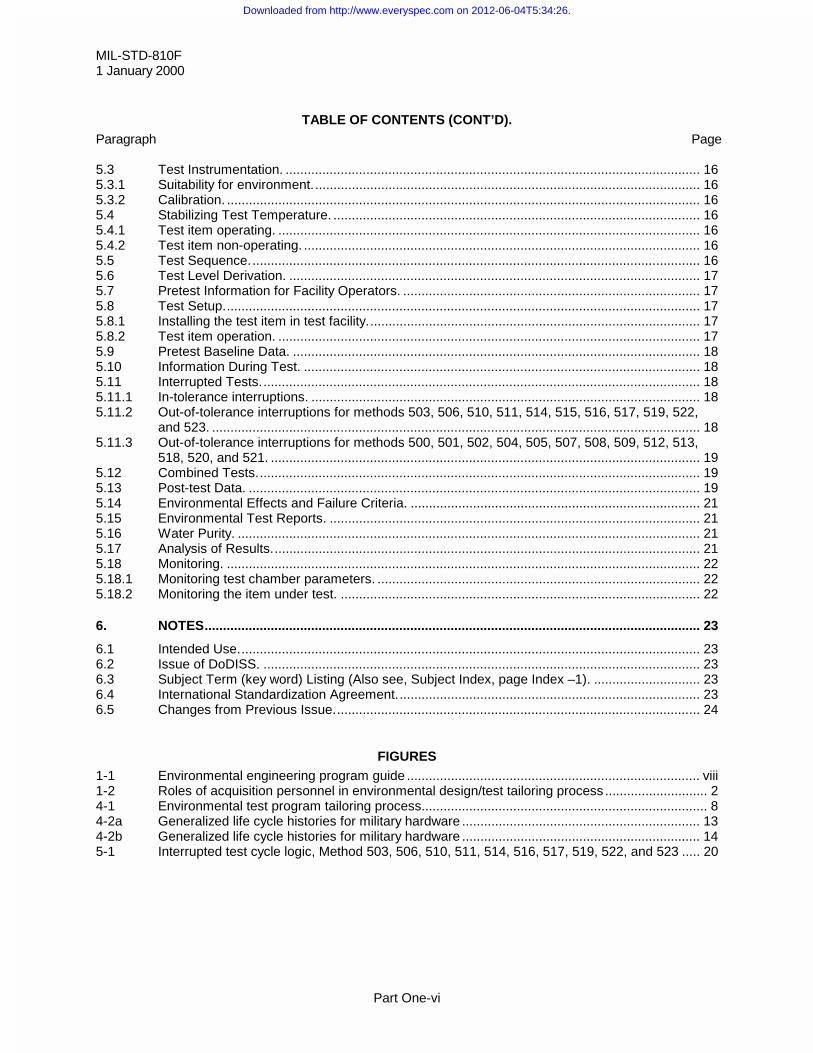
transportshippingstoragesheltered materielenvironmental stressLCEPmission profileshipsaircraftlogistic supplyinducednatural environmentforcing functions
FIG
UR
E 4-
2a.
Gen
eral
ized
life
cyc
le h
isto
ries
for m
ilita
ry h
ardw
are.
Stor
age/
Logi
stic
Sup
ply
Ship
ping
/Tra
nspo
rtatio
n
(See
Not
e 3)
Han
dlin
g &
Roa
dTr
ansp
orta
tion
Han
dlin
g &
Rai
lTr
ansp
orta
tion
Roa
d Sh
ock
(Lar
ge
Bum
ps/P
otho
les)
Roa
d Vi
brat
ion
(R
ando
m)
Han
dlin
g Sh
ock
(D
ropp
ing/
Ove
rturn
ing)
Hig
h Te
mpe
ratu
re (
Dry
/Hum
id)
Low
Tem
pera
ture
Rai
n/H
ail
Sand
/Dus
t
Envi
ronm
enta
lSt
ress
Gen
erat
ion
Mec
hani
sms
(Indu
ced)
Envi
ronm
enta
lSt
ress
Gen
erat
ion
Mec
hani
sms
(Nat
ural
)
(See
Not
e 5)
Rai
l Sho
ck (H
umpi
ng)
Rai
l Vib
ratio
nH
andl
ing
Shoc
k (
Dro
ppin
g/O
vertu
rnin
g)
Hig
h Te
mpe
ratu
re (
Dry
/Hum
id)
Low
Tem
pera
ture
Rai
n/H
ail
Sand
/Dus
t
Han
dlin
g &
Air
Tran
spor
t
In-F
light
Vib
ratio
n (
Engi
ne/T
urbi
ne In
duce
d)La
ndin
g Sh
ock
Han
dlin
g Sh
ock
(D
ropp
ing/
Ove
rturn
ing)
Red
uced
Pre
ssur
eTh
erm
al S
hock
(Ai
r Dro
p O
nly)
Hand
ling
& Sh
ipTr
ansp
ort
Wav
e-In
duce
d Vi
brat
ion
(Si
nuso
idal
)W
ave
Sine
Sho
ckM
ine/
Blas
t Sho
ckH
andl
ing
Shoc
k (
Dro
ppin
g/O
vertu
rnin
g)
Hig
h Te
mpe
ratu
re (
Hum
id)
Low
Tem
pera
ture
Rai
nTe
mpo
rary
Imm
ersio
nSa
lt Fo
g
Hand
ling
& Lo
gist
ics
Tran
spor
t(W
orst
Rou
te)
Roa
d Sh
ock
(La
rge
Bum
ps/H
oles
)R
oad
Vibr
atio
n (
Ran
dom
)H
andl
ing
Shoc
k (
Dro
ppin
g/O
vertu
rnin
g)Th
erm
al S
hock
(Ai
r Dro
p)
Hig
h Te
mpe
ratu
re (
Dry
/Hum
id)
Low
Tem
pera
ture
/ F
reez
ing
Rai
n/H
ail
Sand
/Dus
tSa
lt Fo
gSo
lar R
adia
tion
Red
uced
Pre
ssur
e
Stor
age,
She
ltere
d(T
ent,
Shed
, Igl
oo)
Non
e
Hig
h Te
mpe
ratu
re (
Dry
/Hum
id)
Low
Tem
pera
ture
/ F
reez
ing
Salt
Fog
Fung
us G
row
thC
hem
ical
Atta
ck
Stor
age,
Ope
n
Non
e
Hig
h Te
mpe
ratu
re (
Dry
/Hum
id)
Low
Tem
pera
ture
/Fre
ezin
gR
ain/
Hai
lSa
nd/D
ust
Salt
Fog
Sola
r Rad
iatio
nFu
ngus
Gro
wth
Che
mic
al A
ttack
Downloaded from http://www.everyspec.com on 2012-06-04T5:34:26.
MIL-STD-810F 1 January 2000
Part One-14
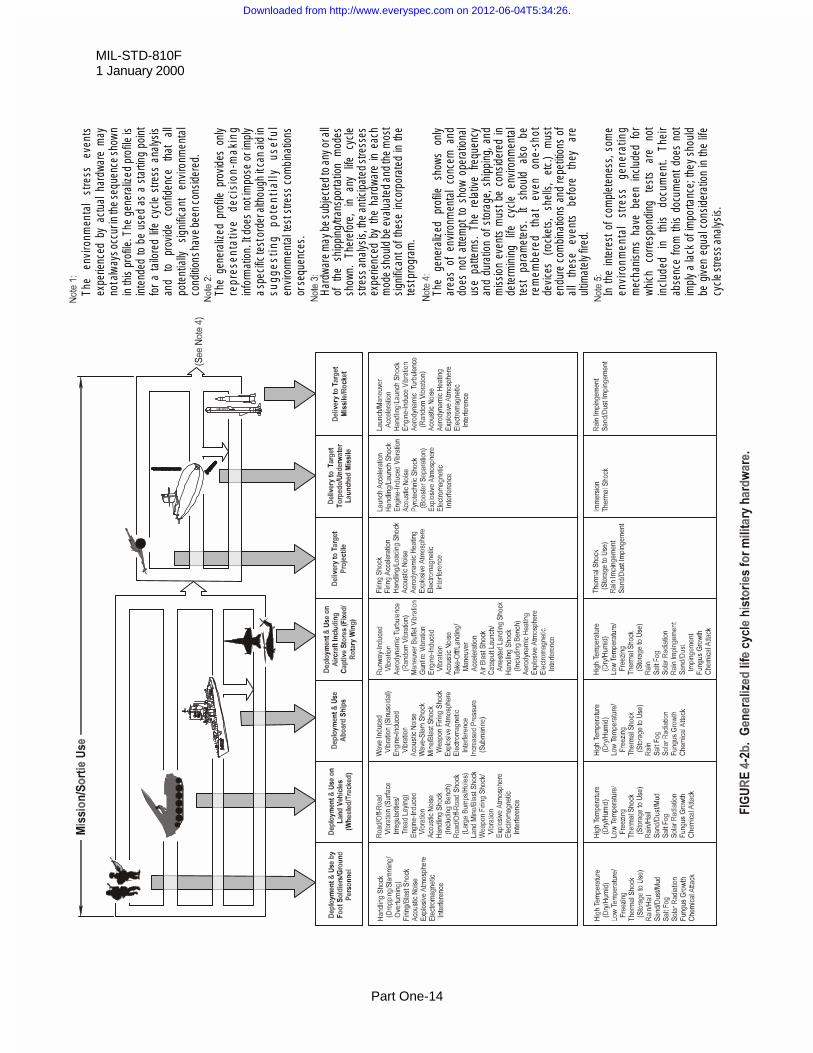
sortieusedeliverydeploymentLCEPstoresforcing functions
The
envi
ronm
enta
l st
ress
ev
ents
ex
perie
nced
by
actu
al h
ardw
are
may
no
t alw
ays o
ccur
in th
e se
quen
ce sh
own
in th
is p
rofile
. The
gen
eral
ized
prof
ile is
in
tend
ed to
be
used
as
a st
artin
g po
int
for
a ta
ilore
d lif
e cy
cle
stre
ss a
nalys
is
and
to
prov
ide
conf
iden
ce
that
al
l po
tent
ially
si
gnifi
cant
en
viro
nmen
tal
cond
ition
s hav
e be
en co
nsid
ered
.
The
gene
raliz
ed p
rofil
e pr
ovid
es o
nly
repr
esen
tativ
e de
cisi
on-m
akin
g in
form
atio
n. It
doe
s no
t im
pose
or i
mpl
y a
spec
ific te
st or
der a
lthou
gh it
can
aid
in
sugg
esti
ng
pote
ntia
lly
usef
ul
envir
onm
enta
l tes
t stre
ss c
ombi
natio
ns
or se
quen
ces.
Har
dwar
e m
ay b
e su
bjec
ted
to a
ny o
r all
of t
he s
hipp
ing/
trans
porta
tion
mod
es
show
n.
Ther
efor
e, i
n an
y lif
e cy
cle
stre
ss a
naly
sis,
the
antic
ipat
ed st
ress
es
expe
rienc
ed b
y th
e ha
rdwa
re in
eac
h m
ode
shou
ld b
e ev
alua
ted
and
the
mos
t si
gnifi
cant
of t
hese
inco
rpor
ated
in th
e te
st pr
ogra
m.
The
gene
raliz
ed
prof
ile
show
s on
ly
area
s of
env
ironm
enta
l co
ncer
n an
d do
es n
ot a
ttem
pt t
o sh
ow o
pera
tiona
l us
e pa
ttern
s. T
he r
elat
ive f
requ
ency
an
d du
ratio
n of
sto
rage
, shi
ppin
g, a
nd
mis
sion
even
ts m
ust b
e co
nsid
ered
in
dete
rmin
ing
life
cycl
e en
viro
nmen
tal
test
pa
ram
eter
s.
It sh
ould
al
so
be
rem
embe
red
that
ev
en
one-
shot
de
vices
(ro
cket
s,
shel
ls,
etc.
) m
ust
endu
re c
ombi
natio
ns a
nd re
petit
ions
of
all
thes
e ev
ents
be
fore
th
ey
are
ultim
atel
y fire
d.
In t
he in
tere
st o
f com
plet
enes
s, s
ome
envi
ronm
enta
l st
ress
ge
nera
ting
mec
hani
sms
have
bee
n in
clud
ed f
or
whi
ch
corre
spon
ding
te
sts
are
not
incl
uded
in
th
is
docu
men
t. Th
eir
abse
nce
from
this
doc
umen
t doe
s no
t im
ply
a la
ck o
f im
porta
nce;
they
sho
uld
be g
iven
equ
al c
onsid
erat
ion
in th
e lif
e cy
cle
stre
ss a
nalys
is.
Downloaded from http://www.everyspec.com on 2012-06-04T5:34:26.
MIL-STD-810F1 January 2000
Part One-15
5. GENERAL LABORATORY TEST METHOD GUIDELINES.
NOTE: Safety is an inherent concern in all test programs. Specific concerns are addressed in appropriate testmethods. Guidelines for establishing a materiel safety program are in MIL-STD-882.
5.1 Standard Ambient Test Conditions.
When the term "standard ambient" is specified in the methods of this standard, use the values shown below. If theterm is not used and no specific values are called for in the test method or the materiel specification, conduct itemtests (e.g., pre-, during, and post-test) at standard ambient conditions.
Temperature: 25°C r 10°C (77°F r 18°F)
Relative humidity: 20 to 80%
Atmospheric pressure: Site pressure
NOTE: Every effort has been made to use metric units throughout this document. The initial figures are followed byU.S. units in parentheses, but these conversions are not usually repeated throughout this document.
5.2 Tolerances for Test Conditions.
Unless otherwise specified, adhere to the test condition tolerances shown below for the following parameters. Anytolerance shown as rX following a specified value is intended to mean the specified value is what is intended but,because of instrumentation or measurement inaccuracies, a slight deviation is acceptable but not outside of thetolerance.
a. Test section air temperature. Surround the test item totally by an envelope of air (except at necessarysupport points), considering boundary effects. Keep the air temperature uniform in the immediatevicinity of the item. To ensure that the test item is bathed in the required air temperature, placeverification sensors at representative points around the entire item and as close to the test item as possiblebut not so the airstream temperature is affected by the test item temperature. Keep these temperatureswithin r 2qC (3.6qF) of the required test temperature. Ensure the air temperature gradient across the itemdoes not exceed 1°C (2°F) per meter or a maximum of 2.2qC (4qF) total (test item nonoperating). Widertemperature tolerances are acceptable in situations such as:
(1) For large items with a volume greater than 5 m3, the temperature tolerance can be r 3qC. Justify anylarger tolerance and obtain approval for its use from the procuring activity.
(6) For required temperatures greater than 100qC, the temperature tolerance can be r 5qC. Specify theactual tolerance achieved.
b. Pressure. r5 percent of the value or r200 Pa, whichever is greater.
c. Humidity. Keep relative humidity at the chamber control sensor to r5 percent RH of the specified value.
d. Vibration amplitude.
Sinusoidal r10 percent
Random See method 514.5
e. Vibration frequency. Measure vibration frequency of 25 Hz and above to an accuracy of r2 percent. Below 25 Hz, use r½ Hz.
f. Acceleration. Measure acceleration (g's) within 10 percent of the specified value.
g. Time. Control time (e.g., test durations and data gathering intervals) within 5 minutes for total testdurations greater than 8 hours, and within 1 percent of the specified value for durations or intervals of 8hours or less, unless the nature of the test requires greater accuracy.
Downloaded from http://www.everyspec.com on 2012-06-04T5:34:26.
MIL-STD-810F 1 January 2000
Part One-16
h. Air velocity. Maintain within 10 percent of specified value.
i. Water purity. See paragraph 5.16.
5.3 Test Instrumentation.
5.3.1 Suitability for environment.
Ensure the sensors and instrumentation to be used for recording environmental conditions and responses are suitablefor the intended environments. (For example, accelerometers used in a combined high temperature/vibration testcould give erroneous readings if not designed for high temperature use.)
5.3.2 Calibration.
Prior to and following each test, verify the accuracy of instruments and test equipment used to control or monitor thetest parameters. Calibration intervals must meet the guidelines of ANSI NCSL Z540-1 or ISO 10012-1 to thesatisfaction of the procuring activity. All instruments and test equipment used in conducting the tests in thisdocument should:
a. Be calibrated to laboratory standards, traceable to the National Standards via primary standards.
b. Have an accuracy at least equal to 1/3 the tolerance of the variable to be measured. In the event ofconflict between this accuracy and guidelines for accuracy in any one of the test methods of this standard,the latter governs.
5.4 Stabilizing Test Temperature.
Temperature stabilization is generally important to ensure reproducible test conditions. Stabilizing test itemelements critical for operational requirement (i.e., components, subassemblies, etc.) normally is more important thanstabilizing temperatures of structural members. The following information is based on this intent.
5.4.1 Test item operating.
Unless otherwise specified, operating temperature stabilization is attained when the temperature of the functioningpart(s) of the test item considered to have the longest thermal lag is changing at a rate of no more than 2.0qC (3.6qF)per hour.
5.4.2 Test item non-operating.
Unless otherwise specified, non-operating temperature stabilization is attained when the temperature of thefunctional part(s) of the test item considered to have the longest thermal lag reaches a temperature that is within thetemperature tolerance of the air surrounding the test item. Structural or passive members are not normallyconsidered for stabilization purposes. When adjusting temperatures, the temperature of the chamber air may beadjusted beyond the test condition limits to reduce stabilization time, provided the extended temperature does notinduce a response temperature beyond the test item's temperature limits.
5.5 Test Sequence.
Base the specific sequence on the item, its intended situation-dependent use, available program assets, andanticipated synergetic effects of the individual test environments. In defining a life cycle sequence of exposures,consider recurring exposure(s) that might reasonably occur during service use. In most cases there is no singledefined sequence. See Appendix C of Part One for additional information.
a. Use the anticipated life cycle sequence of events as a general sequence guide. However, experience hasshown definite advantages to performing certain tests immediately before, in combination with, orimmediately following other tests. Where these advantages have been identified in the information in thetest methods, follow the test sequence. Use other sequences and combinations consistent with good
Downloaded from http://www.everyspec.com on 2012-06-04T5:34:26.
MIL-STD-810F1 January 2000
Part One-17
tailoring practices with the permission of the acquisition agency. With the exception of informationprovided in the individual methods, do not alter test sequences to ease the effects of the tests.
b. Relate cumulative effects on performance and durability of a materiel item to a test sequence that stressesmateriel in the proper order according to its mission profile (see Part One, figure 4-2 as an example). Developing such a test sequence requires communication among the test sponsor, the tester, theevaluator, and the end user early and often to ensure a trackable, reliable, and realistic test effort.
5.6 Test Level Derivation.
Derive specific test levels, ranges, rates, and durations from data that occur on identical or appropriately similarmateriel that is situated on platforms under similar natural environmental conditions (see Appendix A, Task 403,paragraph 403.2.1). When data from actual situations are not available or cannot be obtained nor estimated easily,tailor the test characteristics using the information found in specific methods.
5.7 Pretest Information for Facility Operators.
Provide the following (in addition to any information required in the individual test methods):
a. Test facilities and instrumentation.
b. Required test procedure(s).
c. Critical components, if applicable.
d. Test duration.
e. Test item configuration.
f. Test level, duration, and method of stress application.
g. Location of instrumentation/sensors, e.g., thermocouples, transducers.
h. Test item installation details (including mounting provisions, orientation, interconnections, etc.).
i. Cooling provisions, if appropriate.
5.8 Test Setup.
5.8.1 Installing the test item in test facility.
Unless otherwise specified, install the test item in the test facility in a manner that will simulate service use to themaximum extent practical, with test connections made and instrumentation attached as necessary.
a. To test the effectiveness of protective devices, ensure plugs, covers, and inspection plates used inservicing are in whatever position is appropriate for the test and in their normal (protected orunprotected) mode during operation.
b. Make electrical and mechanical connections normally used in service, but not required for the test beingperformed (e.g., tests of items not running) with dummy connectors installed (connected and protected asin field/fleet use) so that all portions of the test item will receive a realistic test.
c. If the item to be tested consists of several separate units, these units may be tested separately, providedthe functional aspects are maintained as defined in the requirement’s document. If units are being testedtogether and the mechanical, electrical, and RF interfaces permit, position units at least 15 cm (6 inches)from each other or from the test chamber surfaces to allow for realistic air circulation.
d. Protect test items from unrelated environmental contaminants.
5.8.2 Test item operation.
Operate the test item in the most representative operating modes (from performance and thermal standpoints) usingduty cycles and durations that represent service use.
Downloaded from http://www.everyspec.com on 2012-06-04T5:34:26.
MIL-STD-810F 1 January 2000
Part One-18
5.9 Pretest Baseline Data.
Before environmental exposure, operate the test item under standard ambient conditions (see paragraph 5.1) toensure the test item is operating properly and to obtain baseline performance data. Include the following informationin the pretest documentation:
a. Background data of each item:
(1) Item nomenclature, model, serial number, manufacturer, etc.
(2) General appearance/condition.
(3) Specific physical anomalies.
(4) Environmental test history of the specific item.
b. Collect pretest data on the functional parameters that will be monitored during and after eachenvironmental test. Use functional parameters and operational limits specified in the materielspecification or requirements document. If such specifications are not provided, establish and applyappropriate parameters/limits for the pretest, the main test, and the post test.
5.10 Information During Test.
a. Performance check. When there is a reason to operate the test item during the exposure, perform suitabletests/analyses to determine if the test exposure produces changes in performance when compared withpretest data.
b. Test facility. Maintain a record of environmental conditions applied to the test item.
c. Test item response. Maintain a record of test item response to applied environmental forcing functions.
5.11 Interrupted Tests.
For the purpose of standardization and valid testing, and unless otherwise specified in the individual methods, applythe following procedures when a test is interrupted. Explain test interruptions in the test report, and any deviationfrom the following information.
5.11.1 In-tolerance interruptions.
Interruption periods during which the prescribed test conditions remain in tolerance (e.g., power interruptions that donot affect chamber temperature) do not constitute a test interruption. Therefore, do not modify the test duration ifexposure to proper test levels was maintained during the ancillary interruption.
5.11.2 Out-of-tolerance interruptions for methods 503, 506, 510, 511, 514, 515, 516, 517, 519, 522, and 523.
A logic diagram for these methods is on figure 5-1.
a. Undertest. If test condition tolerances fall below the minimum tolerance value (i.e., environmental stressless severe than specified) resulting in an undertest condition, the test may be resumed (afterreestablishing prescribed conditions, except as noted in the individual methods) from the point at whichthe test condition fell below the lower tolerance level. Extend the test to achieve the prescribed test cycleduration.
b. Overtest. If an overtest condition occurs, the preferable course of action is to stop the test and start overwith a new test item. But, as shown on figure 5-1, if there is no damage to the test item, continue the test,realizing that if the item fails the test from this point on or fails subsequent tests, you have a "NO TEST"unless it can be shown that the overtest condition had no effect on the test item. Overtest conditions candamage the test item and cause subsequent failures that may not have occurred otherwise, thus failing atest item because of an invalid test. However, if damage resulting directly from an overtest occurs to atest item component that has absolutely no impact on the data being collected, and it is known that suchdamage is the only damage caused by the overtest (e.g., rubber feet on bottom of a test item melted byhigh temperature where those feet have no impact on the performance of the test item), the test item can
Downloaded from http://www.everyspec.com on 2012-06-04T5:34:26.
MIL-STD-810F1 January 2000
Part One-19
be repaired and the test resumed and extended as in the undertest condition. Coordinate with thecustomer before repairing and continuing to test an item after it has been overtested. This coordination isaimed at preventing customer objections if the test item fails during the remainder of the test program(claims that the test was invalid past the point of the overtest because the overtest caused undiscovereddamage to a critical component).
5.11.3 Out-of-tolerance interruptions for methods 500, 501, 502, 504, 505, 507, 508, 509, 512, 513, 518, 520,and 521.
Each of these methods contains information for handling out-of-tolerance test of interruptions. Analyze any suchinterruption carefully. If the decision is made to continue testing from the point of interruption, to restart the lastsuccessfully completed test cycle, or to restart the entire test with the same test item, and a failure occurs, it isessential to determine the effects of having interrupted or extended the test.
5.12 Combined Tests.
Combinations of tests may represent the effects of the environment more realistically than a series of single tests. Combined environment testing is encouraged when these conditions may be expected in operational environments.
5.13 Post-test Data.
After completing each environmental test, examine the test item in accordance with the materiel specifications. Operate the test item when appropriate for obtaining post-test data. Compare the results with the pretest dataobtained in accordance with paragraphs 5.8 and 5.10. Include the following information in the post test record:
a. Test item identification (manufacturer, model/serial number, etc.).
b. Test equipment identification, including accessories.
c. The actual test sequence (program) used.
d. Deviation from the planned test program (including explanation).
e. Performance data collected on the same parameters at the same operational levels as those of the pretest(including visual examination results and photographs, if applicable).
f. Test item identification (manufacturer, model/serial number, etc.).
g. Room ambient test conditions recorded periodically during test period.
h. Other data specified in individual methods or requirements document(s).
i. Initial failure analyses, if applicable.
j. A signature and date block for the test engineer/technician to certify the test data.
Downloaded from http://www.everyspec.com on 2012-06-04T5:34:26.
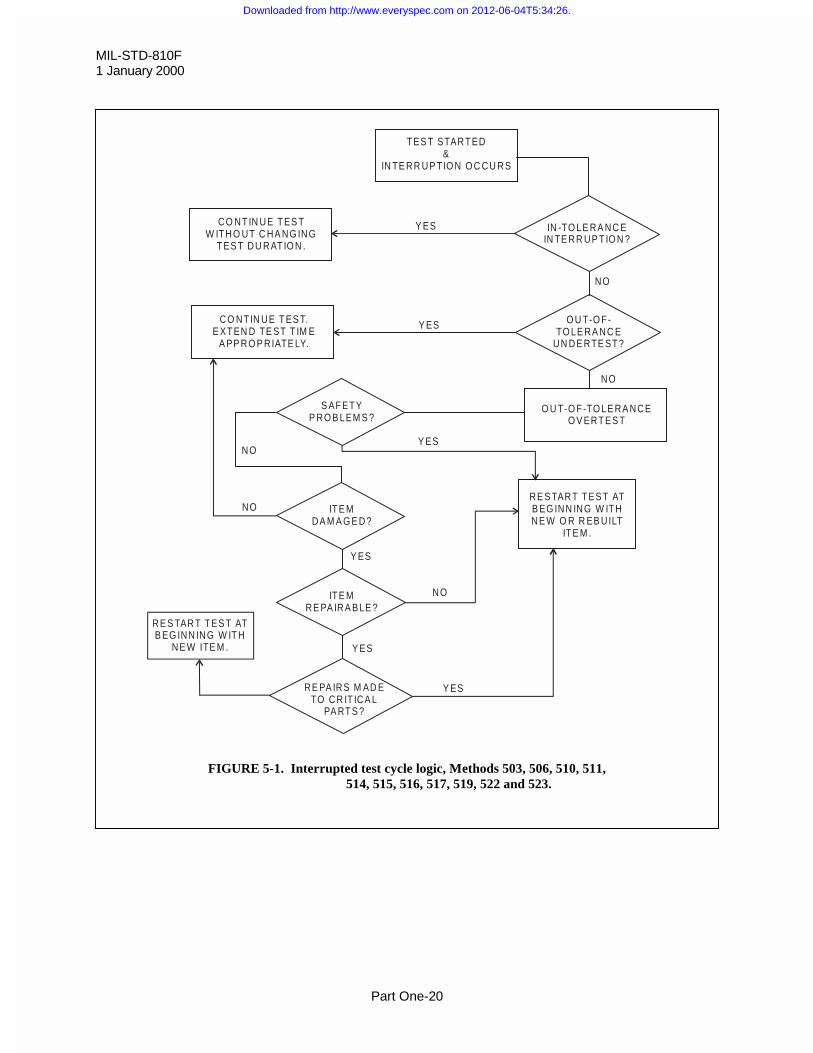
MIL-STD-810F 1 January 2000
Part One-20
interrupted testsdamagesafetyovertestundertest
TES T STARTED&
IN TE RR UP TIO N O C CU RS
Y ES IN -TO LE RA NC EIN TE RR UP TIO N ?
NO
O U T-O F-TO LE RA NC E
UN DE RTE ST?
NO
O U T-O F-TO LE RA NCEO V ERTES T
RE S TART TES T ATB EG INN ING W ITHNE W O R R EB UILT
ITE M .
Y ES
Y ES
Y ES
NO
RE PA IRS M AD ETO CR IT ICA L
PA RTS ?
ITE MRE PA IRA B LE ?
ITE MDA M A G E D?
S AFETYP RO B LEM S ?
NO
NO
Y ES
Y ESCO NTIN UE TES T.E XTEN D TE ST T IM E
A PP RO P RIATE LY.
CO NTIN UE TES TW ITHO UT C HA NG ING
TES T DU RATIO N .
RE S TART TES T ATB EG INN ING W ITH
NE W ITE M .
FIGURE 5-1. Interrupted test cycle logic, Methods 503, 506, 510, 511,514, 515, 516, 517, 519, 522 and 523.
Downloaded from http://www.everyspec.com on 2012-06-04T5:34:26.
MIL-STD-810F1 January 2000
Part One-21
5.14 Environmental Effects and Failure Criteria.
Interpretation of the effects of an environmental test depends on the purpose of the test in the context of a specificacquisition program. Structural degradation and performance anomalies may be considered as useful informationduring engineering development tests, but as failures during formal tests for contractual compliance. The followingare some of the most common conditions that could constitute a materiel failure, depending on specific contractrequirements.
a. Deviation of monitored functional parameter levels beyond acceptable limits established in the pretestperformance record and specified in the requirements document. NOTE: Certain types of materiel (e.g.,propellants and electrically driven devices) often are expected to demonstrate decreased performance atan environmental extreme, particularly low temperature. A failure would occur only if degradation ismore than permissible, or remains degraded after removal of the environmental stress.
b. Not fulfilling safety requirements or developing safety hazards.
c. Not fulfilling specific materiel requirements.
d. Test item changes that could prevent the materiel from meeting its intended service life or maintenancerequirements. (For example: Corroded oil drain plug cannot be removed with specified tools.)
e. Deviation from established environmental impact requirements. (For example: Exhaust emission levelsbeyond established limits or seal failures that allow oil spills.)
f. Additional failure criteria as specified in the materiel specification.
5.15 Environmental Test Reports.
Complete environmental test reports according to Part One, Appendix A, Task 406.
5.16 Water Purity.
It is essential that water used for humidity (water vapor and wet bulb socks), salt fog and fungus growth (all aspects)tests not unfairly impose contaminants or unintended products on test items, or affect fungus germination. Chemicalscommonly found in commercial water supplies such as chlorine can cause unintended corrosive effects. Solublessuch as calcium carbonate (lime) or insolubles can cause nozzles to clog or leave deposits. Water with a non-neutralpH could cause unintended effects on materiel. Accordingly, rather than impose unrealistic water purityrequirements on test establishments, recommend water used for these tests be relatively clean of impurities andchemicals, and have a pH in the range of 6.5 to 7.2 at 25qC at the time of the test. NOTE: A water resistivity in therange of 150,000 ohm cm (open tank humidity generators that act as additional distillers, greatly increasing the purityof the water actually arriving at the test item), to 250,000 ohm cm is recommended. This can be produced usingdistillation, demineralization, reverse osmosis, or deionization.
5.17 Analysis of Results.
a. The analysis of test results is to be consistent with the guidance provided is paragraph 5.14 above, as wellas Part One, Appendix A, Tasks 405 and 406. Additionally, the analysis of results will, in general,consist of presentation in some appropriate format as called out by the DETP, the (1) measured inputenvironment to the test item; (2) the measured response environment of the test item, and (3) thefunctional or operational performance of the test item under the environmental stress. With regard to (1)and (2), these may include temperature, humidity, pressure, acoustic, acceleration, velocity,displacement, vibration or shock. With regard to (3), this may include the mechanical, electrical, overallfunctional or safety performance while under environmental stress.
b. The goal of the “analysis of results” paragraph in each test method is an attempt to correlate themeasured response environments and the functional or operational performance of the test item with themeasured input environment considering any synergistic effects. Performance of this correlation may
Downloaded from http://www.everyspec.com on 2012-06-04T5:34:26.
MIL-STD-810F 1 January 2000
Part One-22
require an understanding of an idealized model of the test item, a careful study of the physics of failure,and some rudimentary understanding of the synergistic effects of combined environments. In extendedduration environmental tests, an understanding of the general “fatigue” stress receptivity of the test itemis required. Underlying all of this is the purpose of the test and the relationship of the test to the goals ofthe test, i.e., environmental qualification, test-analyze-and-fix, developmental testing, etc. In some casesthe test will be designed to simulate the in-service environment. In other cases it will be designed toenvelope the environment in hope of providing a conservative margin to a design and, in other cases, thetest may be exploratory in nature to examine the “fragility” of the test materiel.
5.18 Monitoring.
5.18.1 Monitoring test chamber parameters.
It is good scientific and engineering practice to monitor chamber conditions to ensure that the chamber settings arecorrect and that the desired environmental conditions within the chamber are being maintained within specifiedtolerances throughout the duration of the test. An environmental engineering specialist should work with thecustomer to tailor monitoring requirements to the customer's needs. Considerations include:
a. The frequency of monitoring may vary depending on the data requirements and how the data are to beused. Monitor test parameter levels throughout the test at intervals that are meaningful for the item undertest such that a failure to maintain prescribed parameter levels may be corrected without jeopardizing thevalidity of the test.
b. Establish an alarm system to be triggered by parameter levels that stray out of tolerance beyondacceptable limits.
c. To provide proof of parameter level maintenance, keep a manually- or electronically-produced log ofparameter levels. Exact parameter monitoring intervals and exact methods of recording parameter levelsmay vary for different methods and for different items being tested using a specific method. In someinstances, monitoring chamber parameters may be required only at long intervals (15-minutes or evenseveral hours). In others, continual, non-stop recording may be necessary.
d. The technology involved in recording parameter levels may involve visual checks at prescribed intervals,real time continuous recording such as a circular chart, periodic recording on a device such as a datalogger, or other techniques established in a contract or agreed upon by the tester and the customer.
e. From a quality assurance standpoint, the intervals at which monitoring should occur depend on howmeaningful the interval length is to the customer, who should be provided with monitoring records thatare no longer nor shorter in interval than the customer needs.
5.18.2 Monitoring the item under test.
It is equally important to monitor the test item itself to record the effects of the chamber environment on the physicalcondition or performance of the item under test. The reason for such monitoring is to ensure that pertinent changesin the condition of the item under test are captured at relevant intervals throughout the duration of the test so thatmeaningful test item failure analyses may be performed. Consider the following:
a. The tester must meet contractual or other monitoring requirements established by the customer to fulfilltest data needs.
b. The frequency of monitoring will vary depending on the data requirements and how the data are to beused. For example, during conditioning, it may desirable to monitor the condition of the test iteminfrequently because the information gathered during this period of testing, though important, may not behighly critical. However, during cycled static testing or system performance testing, the frequency ofmonitoring the test item may be higher at the beginning of a test to capture initial, fast-occurring
Downloaded from http://www.everyspec.com on 2012-06-04T5:34:26.

MIL-STD-810F1 January 2000
Part One-23
degradation. Other minimum intervals may be set to capture transient events that may occur at any timeduring the test.
6. NOTES
(This paragraph contains information of a general or explanatory nature that may be helpful.)
6.1 Intended Use.
This standard is intended to organize and standardize the approach within the materiel acquisition process forconsidering how environmental stresses affect materiel design, test, and evaluation. It emphasizes tailoring materielto withstand the stresses it is intended to see during its life cycle, and testing such materiel accordingly. Theintended result is to eliminate over- and under-designed/tested materiel with respect to environmental stresses; toensure environmental considerations are addressed systematically; to ensure test plans are tailored realistically aswell as thoroughly; to ensure test execution adheres to tailored test plans, and to ensure test reports are complete andmeaningful.
6.2 Issue of DoDISS.
When this standard is used in acquisition, the applicable issue of the DoDISS must be cited in the solicitation (seeparagraphs 2.2.1 and 2.3).
6.3 Subject Term (key word) Listing. (Also see Subject Index, page 63.)
AccelerationAcoustic NoiseClimatic EnvironmentDustEnvironmental EngineeringEnvironmental Life CycleEnvironmental Test ProceduresEnvironmental Test ReportExplosive AtmosphereFungusGunfire VibrationHumidityInduced EnvironmentLow Pressure (Altitude)Natural EnvironmentRainSalt FogSandShock, MechanicalSolar RadiationTemperatureTemperature ShockVibration
6.4 International Standardization Agreement.
Certain provisions of this standard are the subject of international standardization agreements STANAG’s 2895 and4370. When proposed amendments, revisions, or cancellation of this standard will modify the internationalagreement concerned, the preparing activity will take appropriate action through international standardizationchannels, including departmental standardization offices, to change the agreement or make other appropriateaccommodations.
Downloaded from http://www.everyspec.com on 2012-06-04T5:34:26.

MIL-STD-810F 1 January 2000
Part One-24
6.5 Changes from Previous Issue.
This document is a complete rewrite of MIL-STD-810E. Due to the extensive modifications, asterisks or verticallines are not used to identify changes from the previous issue. Changes to MIL-STD-810F will be published inChange Notices.
Custodians: Preparing activity Army - TE Air Force - 11 Navy - AS Air Force - 11 Project No.
ENVR-0045Review activities: Army - AR, AT, AV, CE, CR, GL, HD, MT, SM Navy - CH, EC, MC, OS, SH, YD Air Force - 10, 13, 19, 69
International interest (see paragraph 6.4)
Downloaded from http://www.everyspec.com on 2012-06-04T5:34:26.
MIL-STD-810F1 January 2000APPENDIX A
1Part One A-
APPENDIX A
ENVIRONMENTAL MANAGEMENT AND ENGINEERING TASKSTask Page
Task 401 - Environmental Engineering Management Plan (EEMP) ..........................................................................A-3
Task 402 - Life Cycle Environmental Profile (LCEP) ................................................................................................A-5
Task 403 - Operational Environment Documentation (OED).....................................................................................A-7
Task 404 - Environmental Issues/Criteria List (EICL)................................................................................................A-9
Task 405 - Detailed Environmental Test Plans (DETP) ...........................................................................................A-11
Task 406 - Environmental Test Reports (ETR).........................................................................................................A-15
Downloaded from http://www.everyspec.com on 2012-06-04T5:34:26.

MIL-STD-810F 1 January 2000APPENDIX A
Part One A-2
THIS PAGE INTENTIONALLY BLANK
Downloaded from http://www.everyspec.com on 2012-06-04T5:34:26.
MIL-STD-810F1 January 2000APPENDIX A
Part One A-3
TASK 401
ENVIRONMENTAL ENGINEERING MANAGEMENT PLAN (EEMP)
401.1 Purpose. The EEMP is basically an administrative document prepared by the program manager's staff orcontract personnel responsible to the program manager. It provides a schedule for integrating Tasks 402 through406 into the Systems Engineering Management Plan (SEMP). By so doing, the EEMP lays out a viable and costeffective environmental effects program to help ensure that materiel will be designed and tested for all pertinentenvironmental conditions to which it will be subjected during its life cycle. The EEMP also outlines criticalenvironmental engineering technical and communications interfaces between the materiel developer and theprocuring agency.
401.2 Task description. As a minimum, perform the following subtasks and include subtask products in the EEMP:
a. Identify Government agencies and contracts that will include EES personnel to assist in organizing andexecuting environmental engineering tasks. Include list in EEMP.
b. Include in the EEMP the environmental engineering tasks listed below. Note that Tasks 402, 403, and404 comprise the Environmental Test and Evaluation Master Plan (ETEMP) which provides fundamentalinput to the MNS and ORD and detailed input to the TEMP (see Part One, figure 1-1 and paragraph4.1.2.4).
(1) Task 402 - Life Cycle Environmental Profile (LCEP)
(2) Task 403 - Operational Environment Documentation (OED)
(3) Task 404 - Environmental Issues/Criteria List (EICL)
(4) Task 405 - Detailed Environmental Test Plans (DETP)
(5) Task 406 - Environmental Test Report (ETR)
(6) Other program-specific tasks as appropriate
c. Provide risk assessments for any tasks that are eliminated or curtailed, and for alternatives to testingactual hardware or prototypes. For example, if an analytical procedure, acceptance by similarity toanother system, coupon samples, or simulations are used in lieu of testing actual systems or prototypes,explain the cost savings, other benefits, and risks to system effectiveness/safety. Because the EEMP is aliving document, it may be changed at any time to accommodate such alternatives.
d. Develop schedules, milestones, and personnel requirements needed to accomplish these tasks.
e. Identify lines of communication among the specific developer and acquisition agency organizationalelements responsible for environmental engineering.
f. Develop methods/schedules for monitoring, assessing, reporting government and contractor progress ontasks; updating task products (e.g., profiles and plans), and for implementing corrective actions forproblems in developing and executing the EEMP, and include them in EEMP.
401.3 Details to be provided by the acquisition agency.
a. Complete description of the materiel to be developed and the scenarios associated with its intendedservice application(s).
b. Schedule and procedures for EEMP submittal.
c. Identification as a contract task or submittal.
d. Special conditions or restrictions.
Downloaded from http://www.everyspec.com on 2012-06-04T5:34:26.

MIL-STD-810F 1 January 2000APPENDIX A
Part One A-4
THIS PAGE INTENTIONALLY BLANK
Downloaded from http://www.everyspec.com on 2012-06-04T5:34:26.
MIL-STD-810F1 January 2000APPENDIX A
Part One A-5
TASK 402
LIFE CYCLE ENVIRONMENTAL PROFILE (LCEP)
402.1 Purpose. The LCEP, prepared by an environmental engineering specialist (combat/materiel developer staff orcontractor), identifies and characterizes environments or combinations of environments to which the materiel couldbe exposed throughout its service life. Use the LCEP as the baseline document to support design and test activitiesthroughout the materiel development process.
402.2 Task description. This is one of three tasks (Task 402, 403, and 404) that make up the Environmental Testand Evaluation Master Plan (ETEMP). The LCEP accurately describes real-world environmental conditions that arerelevant to the materiel being developed. It provides a consistent baseline for design and test decisions regardingmateriel performance and survival under realistically outlined operational environmental conditions. As such, itshould not contain conservatism factors, parameter exaggeration, or test procedures that will be covered by othertasks. The LCEP is a living document that should be reviewed and updated periodically as new informationregarding operational environmental conditions becomes available.
402.2.1 Contents of LCEP. As a minimum, perform the following subtasks and include subtask products in theLCEP:
a. Describe the anticipated logistical and operational events associated with the materiel from the time offinal factory acceptance until the end of its useful life. Include description in the LCEP.
b. Develop a list of significant natural and induced environments or combinations of environmentsassociated with each of the events described in "a" above, and include the list in the LCEP.
c. Prepare narrative, tabular, graphic, and statistical characterizations, to the extent practical, of theenvironmental stress conditions identified in "b" above. These characterizations may be a combinationof analytical calculations, test results, and measurements on materiel systems in service. Includecharacterizations in LCEP.
402.2.2 Special considerations. When appropriate in developing the LCEP, describe the following specialconsiderations along with any others that may apply, and include the descriptions in the LCEP:
a. Anticipated materiel configuration(s) during manufacturing, handling, repair/rework, environmentalstress screening (ESS), and transport.
b. Environments to be encountered and their associated geographical and physical locations.
c. Packaging/container designs/configurations.
d. Platform on which the materiel is mounted, stored, or transported.
e. Structural, operating, and other interfaces with adjacent materiel.
f. Absolute and relative durations of exposure to environmental conditions in each life cycle phase, as wellas any other circumstances of occurrence.
g. Number of times each life cycle phase is expected to occur and its frequency or likelihood of occurrence.
h. Anticipated limitations and critical values that the environment may have on the materiel because ofmateriel design or natural laws (e.g., fog or other precipitation may inhibit the effectiveness of infraredsensors).
Downloaded from http://www.everyspec.com on 2012-06-04T5:34:26.

MIL-STD-810F 1 January 2000APPENDIX A
Part One A-6
402.3 Details to be provided by the acquisition agency. The LCEP must be the product of the shared knowledge ofboth the materiel supplier and the acquisition agency. The acquisition agency must provide, as a minimum:
a. A thorough description of all anticipated logistical and operational events associated with the materielfrom the time of final factory acceptance until its terminal expenditure, removal from the inventory, anddemilitarization. Include:
(1) Geographical areas of service or deployment.
(2) Platforms on which the materiel will be mounted, stored, or transported.
(3) Actual measurements of environmental conditions related to the same or similar materiel andplatforms.
b. Schedule and procedures for LCEP submittal.
c. Identification as a contract task or submittal.
d. Special conditions or restrictions.
Downloaded from http://www.everyspec.com on 2012-06-04T5:34:26.
MIL-STD-810F1 January 2000APPENDIX A
Part One A-7
TASK 403
OPERATIONAL ENVIRONMENT DOCUMENTATION (OED)
403.1 Purpose. This is one of three tasks (Task 402, 403, and 404) completed by one or more environmentalengineering specialists (combat/materiel developer staff or contractor) whose products comprise the EnvironmentalTest and Evaluation Master Plan (ETEMP). To develop the Environmental Issues/Criteria List called for in Task404, it may be necessary to obtain specific data that describe the environmental conditions laid out in the Life CycleEnvironmental Profile established through Task 402. These data, the OED, are produced by preparing a plan and areport: the Operational Environment Documentation Plan (OEDP), to obtain data that will serve as the basis fordesign and test criteria development; and the Operational Environment Documentation Report (OEDR), that containsthe OEDP and the data called for in that plan.
403.2 OEDP subtask description. The Operational Environment Documentation Plan (OEDP) provides for twotypes of data. First, it contains plans for obtaining data that already exist and are valid for developing the materieldesign and test criteria. Second, it contains plans for collecting data not available currently, describing how to obtainthose environmental data under realistic operating or field conditions using actual or closely relatedsystems/platforms. As a minimum, perform the following subtasks and include subtask products in the OEDP:
403.2.1 Obtain available field/fleet data. Prepare a list of field/fleet data descriptions of materiel or platformenvironment conditions that can be used to develop environmental issues and criteria. Include the list in the OEDP. Adhere to all of the following guidelines:
a. Materiel similarity. Whenever practical, obtain data on the same type of materiel on the same platformtype that will carry the materiel to be tested. This ideal situation is often unattainable early in thedevelopment of new materiel. Therefore, it is sometimes necessary to derive data from appropriatelysimilar materiel or carrying platforms. Under such circumstances, exact equivalence would not beexpected nor required. It is important to note that materiel may be functionally dissimilar but still beconsidered comparable for documenting environmental stress conditions.
b. Data quality. Satisfy the following minimum standards before considering field data suitable for use ascriterion values in laboratory test procedures. Obtain, analyze, and format field data to be compatiblewith the specific test procedure for which those data are being considered as criteria. Include thefollowing supporting information:
(1) A description of the materiel or the carrying platform.
(2) The location on the materiel or carrying platform at which the measurements were made.
(3) The ambient environmental and operating conditions under which the measurements were made.
(4) The type and calibration status of data recording and analysis equipment and instrumentation.
c. Data quantity. Sufficient data are needed to adequately describe the conditions being evaluated, but thedefinition of sufficiency will vary with the environmental conditions, physical and performancecharacteristics of the hardware type, and program needs. Some engineering judgment may be required toassess the applicability of data when constraints limit the number and location of measurement points. As a minimum, consider:
(1) The number and nature of data points.
(2) The number and scope of test trials.
Downloaded from http://www.everyspec.com on 2012-06-04T5:34:26.

MIL-STD-810F 1 January 2000APPENDIX A
Part One A-8
403.2.2 Develop plans for new data. When field/fleet data are not available (in data bases or other data sources) todescribe specific environmental conditions, develop plans to acquire these needed data under actual serviceconditions. Prepare a list of new data requirements that can be used to develop environmental issues and criteria. Prepare plans for obtaining these new data. Include the list and the plans in the OEDP. In addition to following theguidelines and providing the information required in paragraph 403.2.1 above for available data, include thefollowing in the OEDP:
a. A description of precisely what data are to be collected and to what degrees of accuracy.
b. A description of the materiel locations at which measurements are to be made.
c. Identify the instrumentation to be used to make these measurements.
d. Provide mission profile time histories, durations, and the number of tests for which environmentalmeasurements are to be made.
e. Describe the assets and personnel to be provided by the procuring activity to obtain the required data,including vehicles, facilities, and information collection and processing equipment.
f. Provide schedules for acquiring data.
g. Identify the geographic locations at which measurements are to be made.
h. Identify points of contact and lines of communication between the procuring activity and the contractorenvironmental engineering organizations.
403.2.3 Details to be provided by the acquisition agency.
a. Platforms and personnel availability for acquiring data.
b. Geographic locations available for data acquisition.
c. Data acquisition instrumentation and analysis equipment available at test sites.
403.3 Operational Environment Documentation Report. The OEDP, along with the data resulting from itsimplementation, form the Operational Environment Documentation Report (OEDR).
Downloaded from http://www.everyspec.com on 2012-06-04T5:34:26.
MIL-STD-810F1 January 2000APPENDIX A
Part One A-9
TASK 404
ENVIRONMENTAL ISSUES/CRITERIA LIST (EICL)
404.1 Purpose. This task, completed by one or more environmental engineering specialists (combat/materieldeveloper staff or contractor), provides a list of issues and criteria that cover the effects that various environmentshave on materiel performance and reliability. It includes design and test criteria and issues, and their supportingrationale and assumptions. This is one of three tasks (Task 402, 403, and 404) that make up the Environmental Testand Evaluation Master Plan (ETEMP). Critical issues and basic criteria may appear in the MNS, ORD, and TEMP. Environmental design and test issues/criteria are derived from the LCEP and OED data.
404.2 Task description. For each environmental stress type or combination of stress types to be considered inmateriel design/testing, include the following information, as a minimum, in the EICL. Note that design and testcriteria may not be the same in all cases because some form of time compression, stress exaggeration, or othersimplifying assumptions may be needed to perform tests, particularly laboratory tests, in a practical schedule withavailable facilities. However, test criteria must always be tailored realistically.
a. Develop specific design and test criteria (including specific criterion values) and their associated criticalissues. Include these issues and criteria in the EICL.
b. Develop rationale and assumptions used to select the specific criteria, including the significance of thecriteria with respect to materiel performance and durability, and including factors of conservatism. Include these in the EICL.
c. Explain differences between design and test criteria, including test compression algorithms, fatigueacceleration models, and test facility limitations.
d. Estimate expected degree of correlation between laboratory test results and anticipated serviceexperiences.
404.3 Details. Details to be provided by the acquisition agency.
a. Service scenarios of greatest concern for performance and durability.
b. Data analysis methodologies (optional).
c. Test time compression algorithms or stress models (optional).
Downloaded from http://www.everyspec.com on 2012-06-04T5:34:26.

MIL-STD-810F 1 January 2000APPENDIX A
Part One A-10
THIS PAGE INTENTIONALLY BLANK
Downloaded from http://www.everyspec.com on 2012-06-04T5:34:26.
MIL-STD-810F1 January 2000APPENDIX A
Part One A-11
TASK 405
DETAILED ENVIRONMENTAL TEST PLANS (DETP)
405.1 Purpose. This task calls for detailed plans for conducting environmental tests required to determine if theenvironmental criteria developed in Task 404 are met and their associated critical issues are satisfied, and to identifycritical environmental threshold values for system effectiveness that may be evident during testing. Environmentaltest plans are prepared by materiel developers, evaluators, assessors, and testers in various levels of detail during theacquisition cycle. Development and operational testers prepare plans for testing in laboratory and natural field/fleetenvironments.
a. Laboratory test plans. This task pertains mainly to plans for materiel tests performed in environmentallaboratories. The laboratory DETP provides the acquisition activity with plans for environmentallaboratory tests early in the development cycle.
b. Natural environment field/fleet tests. The information in paragraph 405.2 and following may be used asexamples of some of the types of environmental testing procedures that are useful guidelines for somedevelopment and operational test plans. These plans are influenced automatically by previousenvironmental engineering tasks. Agency EES normally assist in preparing these plans.
405.2 Approach. Use decisions and data obtained through the tailoring process to determine the need for laboratorytests, specific criterion values (settings) for the individual environmental test methods in Part Two of this document,and the types and timing of development or operational tests in natural environments. Early coordination with thedevelopment and operational test community is essential to facilitate preparation of DETP's and to avoid costlyomissions or duplications in environmental test planning. Consider the following:
a. Probability of occurrence of specific environmental forcing functions, alone or in combination.
b. Occurrence of similar environmental stresses in more than one life profile phase.
c. Experience from other materiel similarly deployed/tested.
d. Expected environmental effects and materiel failure modes.
e. Expected effects on hardware performance and mission success.
f. Likelihood of problem disclosure by a specific laboratory test method using a specific chamber testsequence/setting or natural environment test location/method.
405.3 Contents. Include the following in DETP's:
405.3.1 Pretest information. Include the following in the test plan as information that is required prior to conductingan environmental test.
a. Background data of each item:
(1) Item nomenclature, model, serial number, manufacturer, etc.
(2) General appearance/condition.
(3) Specific physical anomalies.
(4) Environmental test history of the specific test item.
b. Pretest data on the functional parameters that will be monitored during and after the main test. Usefunctional parameters and operational limits specified in the materiel specification or requirementsdocument. If such specifications are not provided, establish and apply appropriate parameters/limits forthe pretest, during the test, and the post test.
c. Pretest information for facility operators. (Additional information may be required in specific methods inPart Two of MIL-STD-810F.)
Downloaded from http://www.everyspec.com on 2012-06-04T5:34:26.
MIL-STD-810F 1 January 2000APPENDIX A
Part One A-12
(1) Test facilities (if applicable) including instrumentation.
(a) apparatus(b) fixture(s)(c) heating or cooling provisions(d) requirements for combined environment
(2) Test item installation details.
(a) procedures for installation including test item configuration relative to ant fixture(b) orientation(c) interconnections
(3) Test instrumentation, monitoring, and recording.
(a) schedule(b) individual test duration of exposure(c) axes of orientation(d) level criteria and tolerances(e) method of test stress application(f) shutdown procedures(g) completion criteria(h) test item functional and operational requirements for pretest, during test, and post test
(4) Test procedure:
(a) schedule(b) individual test duration of exposure(c) axes of orientation(d) level criteria and tolerances(e) method of test stress application(f) shutdown procedures(g) completion criteria(h) test item functional and operational requirements for pretest, during test, and post test
405.3.2 During test information. Include the following in the test plan as data to be collected during the test.
a. Environmental design parameters and test criteria.
b. Test configuration and quantity of items to be tested.
c. Description of the testing to be performed, including specific climatic categories in which tests areconducted, subtests (e.g., initial examination (including packaging adequacy), pretest data (see paragraph405.3.1, above), storage, performance, operational modes, human factors, safety, etc.), and failurecriteria.
d. Test procedure criteria, limits and tolerances.
e. Test sequence and schedule.
f. Test instrumentation, including, but not necessarily limited to:
(1) Specific instrumentation, calibration criteria, and procedures.
(2) Data to be collected and accuracies to be achieved.
(3) Description of all filtering performed on data.
g. Descriptions of test installations, facilities, and equipment currently available to the contractor oravailable for procurement for the specific test program.
h. Facilities/equipment required from the Government and dates required.
Downloaded from http://www.everyspec.com on 2012-06-04T5:34:26.

MIL-STD-810F1 January 2000APPENDIX A
Part One A-13
i. Data reduction/analysis techniques and statistical criteria.
405.3.3 Post test information. Include the following in the test plan as information that is required after conductingthe main test.
a. Test item identification (manufacturer, model/serial number, etc.).
b. Test equipment identification, including accessories.
c. The actual test sequence (program) used or procedural anomalies.
d. Deviation from the planned test program (including explanation).
e. Performance data collected on the same parameters at the same operational levels as those of the pretest(including visual examination results and photographs, if applicable).
f. If not tested in a chamber (e.g., vibration test), room ambient test conditions recorded periodically duringtest period.
g. Other data as specified in the individual methods or materiel requirements document(s).
h. Initial failure analyses.
i. A signature and date block for the test engineer/technician to certify the test data.
j. Photographic record of the test item, test fixture, and test apparatus, as appropriate.
Downloaded from http://www.everyspec.com on 2012-06-04T5:34:26.

MIL-STD-810F 1 January 2000APPENDIX A
Part One A-14
THIS PAGE INTENTIONALLY BLANK
Downloaded from http://www.everyspec.com on 2012-06-04T5:34:26.
MIL-STD-810F1 January 2000APPENDIX A
Part One A-15
TASK 406
ENVIRONMENTAL TEST REPORT (ETR)
406.1 Purposes.
a. Environmental test reports are produced at various points in the acquisition process by development andoperational testers. Specifications for reports of development and operational tests in specificenvironments are provided by development and operational test agencies, and therefore do not appearhere. However, the information in paragraph 406.2 may be used as examples of some of the types ofinformation that could appear in development and operational test reports.
b. This task pertains mainly to the results of materiel tests performed in environmental laboratories. TheETR provides the acquisition activity with environmental laboratory test data early in the developmentcycle. The laboratory ETR is appropriate for design evaluation tests, operational worthiness tests, andqualification tests. Data from these laboratory tests serve as early warnings of unanticipated deviationsfrom performance requirements. They support failure analyses and corrective actions related to theability of materiel items to survive specific environmental conditions. These laboratory test reports(neither singularly nor in aggregate) are not substitutes for reports of development or operational testsconducted in natural field/fleet environments.
406.2 Task description. For each laboratory test conducted, provide the following:
406.2.1 General information.
406.2.1.1 Main body. Include the following in the main body of the report:
a. Test item identification.
b. Functional description of the failed or affected parts of the materiel.
c. Causes of failures, if known.
d. Proposed corrective actions if determinable.
e. Test conditions (quantitative and qualitative data on environmental parameters of test).
406.2.1.2 Attachments. Include the following as attachments:
a. Incremental test log (including time and events between failures).
b. Laboratory failure analysis reports (which identify the physics-of-failure to the extent possible).
c. A list of all other development and production activities where the same part failed, for example:
(1) Environmental tests
(2) Reliability tests
(3) Screening tests
(4) Bench checks
(5) Acceptance test procedures
406.2.2 Content requirements.
406.2.2.1 Interim test reporting. Unless otherwise specified, accomplish this reporting by letter.
a. Quick look. Report accomplishment of an environmental test by way of a quick look letter. Identify thespecific test accomplished, salient test parameters and conditions, important test results, failures thatoccurred, and proposed corrective actions.
Downloaded from http://www.everyspec.com on 2012-06-04T5:34:26.

MIL-STD-810F 1 January 2000APPENDIX A
Part One A-16
b. Test anomaly notification. When a test anomaly occurs, prepare a test anomaly letter to the procuringactivity. Briefly summarize the test anomaly and include the following information:
(1) Materiel serial numbers.
(2) Description of the anomaly (test interruption caused by test facility or test equipment failure, ormateriel item failure).
(3) Environmental conditions surrounding the anomaly.
(4) Materiel failed part identification, if known at the time the anomaly letter is written.
(5) Test anomaly analysis and corrective action. Include an analysis of the causes of a test anomaly andthe corrective action taken to prevent its recurrence. Prepare a short letter for one or more testanomalies that are simple in nature and have simple correction actions. For a materiel failure,prepare a more detailed notification letter.
406.2.2.2 Final test report. Document engineering development or qualification testing for each test (singleenvironment or combined environmental test) for which testing was accomplished. Include in the final report foreach test:
a. The purpose of the test (i.e., engineering development, qualification, environmental worthiness, etc.).
b. A list of criteria and issues pertaining to the test.
c. Description of test item, including configuration identification of test hardware and photographs asappropriate.
d. Description of test parameter, test duration, and any special conditions involved in the test.
e. Description of test method, facility, and test procedure. Include a detailed description of how the testitem was operated during each test and any controlled conditions.
f. Test set-up diagram/photos. Show arrangements of test item relative to test equipment used.
g. A list of all test equipment used in the test. Identify manufacturer, model, calibration status, and serialnumber for each item of test equipment listed.
h. Location of environmental sensors such as accelerometers, microphones, thermocouples, etc., relative totest item. Use diagrams and photographs as appropriate.
i. Description of test instrumentation system with particular emphasis given to any sensor averaging.
j. Test results. Insert conversion tables (metric).
k. Analysis of results relating data to criteria, including data reduction techniques and procedures showinghow the data were related to the criteria, and a met/not met statement for each criterion.
l. Record of critical values. In situations when environmental conditions limit or significantly degradesystem performance (e.g., fog limiting infrared sensor system effectiveness, etc.), describe the limitationand designate it in the final test report as a critical threshold value.
Downloaded from http://www.everyspec.com on 2012-06-04T5:34:26.
MIL-STD-810F1 January 2000APPENDIX B
Part One B-1
APPENDIX B
DETAILED PROGRAM MANAGEMENT GUIDANCE
A. General. Materiel must perform adequately under all environmental conditions associated with its service life;withstand those conditions in transit and storage, and maintain the desired level of reliability after environmentallyharsh operation, storage, and transit. In order for this to happen, the effects that environmental conditions have onmateriel effectiveness and safety must be determined, considered, analyzed, and integrated into all aspects of theacquisition process as indicated in Part One, figures 4-1 and 4-2. The guidance provided here and throughout thisentire standard applies to the effects of environments on systems rather than the effects of systems on environmentalquality. Therefore, the thrust of this standard should not be confused with Environmental Impact programs thatfocus on how to preserve and protect flora and fauna from service personnel, their materiel, and their activities. Conversely, this standard pertains to the effects that environments have on materiel system effectiveness.
B. Environments of intended use.
1. Several sections of the DoD 5000-series on Defense Acquisition address environmental considerations,stressing that systems must perform well in all environments of intended use (DoDD 5000.2-R, AppendixIII, Parts III and IV. Unlike other technical areas (e.g., Reliability, Electromagnetic Environmental Effects,Human Factors, and environmental quality), no single section of that series is devoted to addressing naturalor induced environmental factors. Therefore, this Part One of MIL-STD-810F provides basic programprocedures for integrating environmental factors into the materiel acquisition process. This integration isaccomplished through input to acquisition planning documents from the Mission Need Statement throughthe Test and Evaluation Master Plan to detailed test and evaluation plans and reports.
2. Environmental factors, working separately and in various combinations, are known to affect operation,transit, and storage of materiel. The DoD 5000-series documents point out that these factors includeclimate (temperature, humidity, solar radiation, rain, snow, icing phenomena, wind, blowing sand, dust andsnow, ozone, freeze-thaw occurrences, fog, cloud ceiling height, and visibility); weather-relatedatmospheric obscurants (rain, snow, fog, cloud cover); terrain elements (slope, soil, and vegetation);induced elements (shock and vibration); and field/fleet conditions (obscurants, debris, emissions). Environmental Engineering Specialists (EES) are trained to assist acquisition personnel throughout theacquisition cycle to integrate these environmental concerns into requirements, design, test and evaluationdocuments, and procedures. See Appendix A of this document.
C. Balancing cost, schedule, and performance considerations. One of the basic policies governing defenseacquisition covers the need to translate operational needs into stable, affordable programs. The key to this is using aconcurrent systems engineering approach to help ensure reliable performance in all operational environments, whenrequired. This entails designing a product to perform its assigned mission over time in intended operationalenvironments and, at the same time, designing the system to survive non-operational environments (e.g., storage).
D. Trade-off considerations. Evaluate the need to operate in extreme environments against other factors such ascost, technical feasibility, tactics, doctrine, and materiel platforms. Higher costs, logistical problems, andoperational difficulties associated with these environmentally rigorous areas could lead to selecting one of thefollowing:
1. Special materiel capable of operation in extreme environmental areas.
2. Special materiel solely for extreme environments.
3. Modification kits that adapt new standard materiel or previously type-classified materiel to such use.
4. Special design values that are more extreme than normal tailoring would suggest for materiel whose failureto operate would be life-threatening.
5. Special design for materiel that would be useless or dangerous after one-time exposure.
E. Testing materiel for environmental effects. Developmental and evaluation plans must consider environmentaleffects outlined in the life cycle environmental profile. Both chamber tests and field/fleet tests serve useful purposes.
Downloaded from http://www.everyspec.com on 2012-06-04T5:34:26.
MIL-STD-810F 1 January 2000APPENDIX B
Part One B-2
Apply them at appropriate times during the acquisition cycle. Except for reasons of safety, chamber tests cannot besubstituted for field/fleet development tests because unknown synergistic/antagonistic effects fromcombined/induced environments cannot be built into chamber/laboratory test methods. An example where chambertesting may be substituted for field/fleet testing is ammunition conditioning prior to test firing. Following are someguidelines for laboratory testing, natural field/fleet development testing and operational testing.
1. Laboratory testing. Conduct laboratory tests early in the development stage to screen materiel forenvironmentally caused problems that may degrade materials, performance, or reliability. Conductlaboratory tests according to the general tailoring guidance in Part One and the specific testing guidelines inPart Two of this standard.
2. Natural field/fleet development testing. Conduct natural environmental field/fleet development tests todetermine the true effects of the real environment. This will allow system assessment ofsynergistic/antagonistic effects of natural environmental factors combined with human factors and inducedfactors such as shock/vibration, smoke/obscurants and electromagnetic interference. Use establishednatural climatic test centers and standard test procedures to obtain data that may be compared toprevious/following test data and to develop data bases that may be used for simulations.
3. Operational testing. Conduct operational testing in natural environments that are as realistic as possible. When operational testing cannot subject materiel to the desired ranges of environmental stresses anddeterioration that may be encountered during actual operation, storage, and transit, development testenvironmental effects data may be substituted for operational test environmental effects data.
F. Analytic alternatives to testing actual hardware. In some instances, there may be analytic alternatives to testingactual systems or hardware prototypes in laboratories or in field/fleet environments. An EES can help to establish anengineering basis for selecting and implementing such alternatives. When alternatives to testing actual hardware orprototypes are chosen, Task 401, Environmental Engineering Master Plan, must contain the rationale for theirselection including an explanation of the cost savings, other benefits and risks to system effectiveness/safety. (SeePart One, paragraph 4.1.2.b; Appendix A, Task 401; and Appendix B, paragraph F.) Analytic alternatives include,but are not necessarily limited to the following.
1. Modeling and simulation. To the extent that data bases are available and the predictive validity ofsimulation techniques has been verified, use environmental effects data/knowledge bases, warfightersimulation techniques, and virtual proving grounds, rather than hardware test techniques, to predictperformance and reliability characteristics of competing concepts and designs. Simulation can reduce highcosts involved in producing and testing hardware prototypes. Although artificial intelligence and softwaresimulations may be integral parts of models, neither these types of data nor data from chamber tests shouldbe used to validate models. The most sound criteria for developing and validating models and simulationscome from real world, field/fleet data or knowledge bases. To that end, all fields of science and engineeringcan help to save costs through simulation by developing or contributing to data bases or knowledge basesthat cover the entire domain of environmental effects. (See Appendix C, paragraph B.)
2. Testing coupon samples. In some instances, particularly in laboratory tests and natural field/fleetexposure/surveillance tests, there may be significant savings by using coupon samples instead of entiresystems when specific materials are the central acquisition issue.
3. Acceptance by similarity. In cases where materiel considered for testing is nearly identical to materielalready tested, and there is no reason to believe that the differences between them would pose anenvironmentally induced problem, the program manager may consider accepting the materiel by virtue of itssimilarity to the similar materiel already accepted.
G. Type classification process. Environmental considerations influence the type classification process. Formateriel that is designated by the combat developer to be critical to combat success, type classification or fieldingmay be barred if environmental testing reveals that environmental effects were not considered adequately andincorporated in the design of the system. Additionally, successful system performance and reliability in naturalenvironments are listed as critical issues in Milestone III (production) decisions.
Downloaded from http://www.everyspec.com on 2012-06-04T5:34:26.
MIL-STD-810F1 January 2000APPENDIX C
Part One C-1
APPENDIX C
ENVIRONMENTAL TAILORING GUIDELINES FOR ENVIRONMENTALENGINEERING SPECIALISTS (EES)
A. General. Environmental tailoring is the process of choosing or altering materiel designs and tests so that a givenmateriel will be manufactured and tested to operate reliably when influenced by the various environmental factorsand levels it is expected to experience throughout its service life. The tailoring process, broadly speaking, alsoincludes preparing or reviewing engineering task and planning documents to help ensure realistic environments aregiven proper consideration throughout the acquisition cycle.
1. Objective of tailoring. Tailoring helps to ensure that materiel will be neither under- nor over-designed, nor under- nor over-tested with respect to specific environments it is expected to see duringits service life. The tailoring process outlined in Part One, figure 4-1 shows that it is important not totake design and test criteria directly from natural environment data (descriptions of naturalenvironmental factors or forcing functions found in STANAG 2895, MIL-HDBK-310 AND AR 70-38 or elsewhere), but rather from the transformations that such forcing functions create as theyinteract with a platform environment (static or dynamic materiel platforms, including inducedenvironmental changes that result from operating the materiel itself).
2. Tailoring process. Fundamental to the tailoring process is the ability to apply commonscientific/engineering sense to environmental life cycle "homework," focusing on realistic materieldesign and test criteria. To execute a quality tailoring process, it is necessary to give properconsideration to environments that occur throughout the materiel's life cycle. Completing Tasks 401through 406 in Appendix A will help program managers and environmental engineering specialists toapply proper environmental considerations throughout the materiel acquisition cycle. Part One, figure1-1 explains the tailoring process in terms of the environmental engineering tasks (Appendix A)required by this standard, thereby serving as a guide for program managers, design engineers,environmental engineering specialists, test engineers, and facility operators. Use Task 401,Environmental Engineering Management Plan (EEMP), and Task 402, Life Cycle EnvironmentalProfile (LCEP) as the main guides for tailoring. Careful completion of each of these tasks will helpensure correct environments are identified for tests, that engineering development as well asqualification tests are phased properly into the materiel's acquisition program, and that environmentaltest conditions are appropriate and traceable to realistically encountered life cycle conditions.
B. Environmental testing domain.
1. Acquisition personnel. Acquisition personnel, with the assistance of an EES, should deriveenvironmental development and operational test plans according to the environmental tailoring processshown in Part One, figures 1-1 and 4-1. All types of environments need to be addressed. In the broadersense, environmental considerations go beyond basic climatic factors (such as temperature and humidity)to complex combinations and sequences of factors (such as rapid heating and cooling in high humidity,intermittent rainfall, high microbial activity, and vibration conditions) that can combine synergistically orantagonistically to influence materiel effectiveness. Therefore, the domain of environmental testing goesbeyond the laboratory test methods appearing in Part Two of this standard. The broader objective ofenvironmental effects tailoring is to determine optimum design and test specifications for the expectedenvironmental classes such as:
a. Natural
Climate
Terrain
b. Induced
Downloaded from http://www.everyspec.com on 2012-06-04T5:34:26.
MIL-STD-810F 1 January 2000APPENDIX C
Part One C-2
Shock/vibration
Noise
Light
Electromagnetic radiation
c. Constructed
Built up areas
Transportation facilities
Communication facilities
Energy sources
d. Conflict
Permanent fortifications
Persistent debris/emissions
Transitory obscurants/emissions
2. Performance of laboratory tests. Conduct the laboratory tests in Part Two early in the acquisition cycle tothe extent that they can reveal environmentally caused materiel problems early in the acquisition processbefore the problems become costly to solve. It is important to note that these laboratory test methodscannot be used as substitutes for field/fleet test methods that measure materiel performance, reliability,safety, and other important aspects of materiel evaluation in natural field/fleet environments. The reason isinherent in the many combined effects that can occur in nature and on materiel platforms in field/fleetoperations. By performing the tasks in Appendix A, EES from government and industry can assist combatdevelopers, materiel developers, program managers, etc., to select factors within each of the environmentalclasses, tailoring them to the specific materiel application. Different EES may be used in different phases ofthe acquisition cycle (e.g., system design and system assessment) to maintain independence of thosefunctions.
C. Climatic categories. One of the vital challenges of the tailoring process is to design materiel to operate inclimates of the world in which the materiel is expected to be deployed. Five Climatic Categories may be called outin mission need, materiel requirement, design, and test documents for tailoring purposes: Basic, Hot, Cold, SevereCold, and Coastal/Ocean. The Basic Climatic Category covers a broad range of climatic conditions in which mostmateriel should operate and survive storage and transportation. Coastal/Ocean is a relatively new category that maynot appear in other documents that describe climates. All categories are described below. Within each categorythere are one or more "daily cycles" primarily based on variations in temperature and relative humidity levels. AllClimatic Categories, except for Coastal/Ocean, are defined in table C-I and mapped on figure C-1. For furtherdetails on the Coastal/Ocean Climatic Category and other outdoor ambient worldwide and regional climates, seeSTANAG 2895, MIL-HDBK-310, and AR 70-38.
1. Hot Climatic Category. This Climatic Category includes most of the hot-dry low-latitude deserts of theworld. During summer in these areas, outdoor ambient air temperatures above 43°C (110°F) occurfrequently. However, except for a few specific places, outdoor ambient air temperatures will seldom beabove 49°C (120°F). These approximate temperatures of the free air in the shade approximately 1.5 to 2meters (about 5 or 6 feet) above the ground (in an instrument shelter). The thermal effects of solar loadingcan be significant for materiel exposed to direct sunlight, but will vary significantly with the exposuresituation. The ground surface can attain temperatures of 17 to 33°C (30 to 60°F) higher than that of the freeair, depending on the type/color of the ground surface, radiation, conduction, wind, and turbulence. Airlayers very close to the surface will be only slightly cooler than the ground, but the decrease in temperaturewith height above the surface is exponential. Temperatures at approximately 0.5 to 1 meter (about 2 to 3
Downloaded from http://www.everyspec.com on 2012-06-04T5:34:26.
MIL-STD-810F1 January 2000APPENDIX C
Part One C-3
feet) will be only slightly warmer than that observed in an instrument shelter at about twice that height.1 Inwinter, such temperatures are likely to be in the same range as for the Basic Climatic Category. If materielis designed only for the hot climate, seek a specially tailored low outdoor ambient air temperature designvalue. Small portions of this area are sometimes subject to very high absolute humidity. However, in thesehot-wet areas, the highest outdoor ambient air temperatures and highest dew points do not occur at the sametime.
2. Basic Climatic Category. This includes the most densely populated and heavily industrialized parts of theworld as well as the humid tropics. The entire range of basic design conditions does not necessarily occurin any one place. Each single condition (high temperature, low temperature, high humidity) occurs in awide area. When taken together, the design values should be valid for materiel used throughout the area.
a. Humid tropic zone. Humid tropic areas are included in the Basic Climatic Category rather than beingconsidered an extreme category because humid tropic temperatures are moderate and their humiditylevels are equaled at times in some of the other mid-latitude areas. The feature of the humid tropicsmost important for materiel system design is the persistence of high humidity coupled with moderatelyhigh temperatures throughout the year. This combined environmental condition not only promotescorrosion, but also greatly increases insect and microbiological damage.
b. Intermediate zone. These are mid-latitude areas that do not combine higher temperatures with higherhumidities throughout the year, and at the same time are not climatically extreme enough to meet theconditions for Hot nor Cold Climatic Categories. This zone includes the daily cycles shown in table C-I, plus a condition known as "cold-wet" which can occur within the mild cold daily cycle at or near thefreezing point (2 to -4°C (35 to 25°F)) with relative humidity tending toward saturation (100 to 95%RH) and negligible solar radiation.
3. Cold and Severe Cold Climatic Categories. These areas include northern North America, Greenland,northern Asia, and Tibet. In the Cold Climatic Category, the temperature during the coldest month in anormal year may be colder than the Basic Climatic Category cold extreme of -32°C (-25°F). In the SevereCold areas, the temperature during the coldest month in a normal year may be colder than the Cold ClimaticCategory extreme of -46°C (-50°F). Temperatures colder than -51°C (-60°F) occur no more than 20percent of the hours in the coldest month of the coldest part of the area (northern Siberia) wheretemperatures as low as -68°C (-90°F) have been recorded. Because extremely low temperatures are notcontrolled by a daily solar cycle, they persist for a long enough period of time to cause materiel to reachequilibrium at extremely low temperatures.
4. Coastal/Ocean Climatic Category. These areas include open seas and coastal ports north of 60°S. The areasouth of 60°S, the Antarctic Circle area, is excluded because of extremely harsh conditions that would callfor special, case-by-case designs outside of the scope of the conditions/procedures covered in this standard,and because military conflicts are highly unlikely in this international area. In general, materiel should bedesigned to operate in the Coastal/Ocean Climatic Category during all but a small percentage of the timewhen routes may be closed to navigation because of sea ice. See STANAG 2895, MIL-HDBK-310, andAR 70-38 for details.
D. Considerations for determining climatic categories for materiel systems.
1. Normal environment considerations. All combat and combat support systems should be designed for atleast the Basic Climatic Category, meaning that design temperatures will include the outdoor ambient airtemperatures range of -32°C through +43°C. See figure C-1 and table C-I.
2. Extreme environment considerations. Materiel intended to be deployed or used in extreme climates (hot,cold, and severe cold), in areas with extreme non-thermal weather conditions (such as blowing sand anddust), or in areas with mobility-restricting terrain conditions (such as tundra soil and heavily forested areas)
1 Synopsis of Background Material for MIL-STD-210B, Climatic Extremes for Military Equipment,Norman Sissenwine & Rene' V. Cormier, 24 January 1974.
Downloaded from http://www.everyspec.com on 2012-06-04T5:34:26.
MIL-STD-810F 1 January 2000APPENDIX C
Part One C-4
will require additional planning, design, and testing considerations. In addition to being prepared for theBasic Climatic Category, most materiel will need to be designed, developed, tested, and evaluated foroperation, storage, and transit conditions in areas of the world that experience extreme temperatures. According to STANAG 2895, MIL-HDBK-310, and AR 70-38, to qualify as an area of extremetemperature, the area must meet one of the following two conditions: (1) have one percent or more of thehours in the hottest month equal to or exceeding 43qC; (2) have one percent or more of the hours in itscoldest month equal to or lower than -32°C. The areas that have more extreme temperatures than these arethe Hot, Cold, and Severe Cold Climatic Categories shown on figure C-1 and table C-I.
3. Special considerations for materiel categories/modes.
a. Storage and transit. When preparing a materiel's mission profile, life cycle environmental profile, or anORD, identify storage and transport environments and environmental limits that the materiel is requiredor desired to withstand (e.g., temperature, humidity, vibration levels, etc.). For severe storage/transportconditions that would generate high materiel costs to withstand, consider modifyingstorage/transit/platform conditions/designs as tradeoffs to materiel design requirements. Environmentalconditions for storage and transit modes may be more severe than those of operational modes becauseof the possibility of induced/combined environments (e.g., heat, humidity, shock, vibration, etc.),higher levels of some factors (e.g., high temperature in temporary open storage or during delaysbetween transit modes), or greater materiel exposure times.
b. Design of sheltered materiel. This paragraph pertains to materiel that is intended to bedeployed/operated within shelters. In this case, the shelter becomes the materiel platform, and theenvironmental characteristics that the sheltered materiel will see depend upon the location and designof the shelter. Not only design sheltered materiel to be transported (as part of a shelter assembly) to itsuse location, but also design it to be used under the conditions that exist within the shelter when theshelter is operated in the areas stipulated in its requirements documents. This includes storageconditions within shelters that are not controlled environmentally as well as operational conditionswhere environments are controlled. Also, design sheltered materiel to withstand environmental effectsthat occur during materiel relocation when the shelter is not available. The materiel developer should:
(1) Develop or supply protective devices or modification kits, if required, that will permit shipment,storage, and operational use of such materiel in the environmental conditions for which it isintended.
(2) Indicate by distinct marking at appropriate places on the materiel (where size makes this feasible),and by warning statements in technical manuals, the actual climatic stress limits that should not beexceeded in operational and non-operational modes.
c. Effects of environments on soldier/system interfaces. As part of each materiel analysis conductedduring the materiel acquisition cycle, the developmental and operational evaluators must considerenvironmental effects on the soldier/system interface. These considerations are also applicable tonondevelopmental items (NDI) and to foreign materiel acquired for military use.
d. Environmental considerations for potentially dangerous materiel. Design potentially dangerousmateriel (e.g., ammunition and explosive materials/materiel, etc.) to include safety requirements basedon the long-term, worldwide temperature extremes detailed in STANAG 2895, MIL-HDBK-310, andAR 70-38, even though the materiel may not be intended for operational use at these extremes. Thiswill prevent situations where explosive or other dangerous materiel that is developed for less thanworldwide deployments is transported, stored, or used inadvertently in areas of unexpected extremeconditions, thus possibly resulting in critical or catastrophic failure.
Downloaded from http://www.everyspec.com on 2012-06-04T5:34:26.
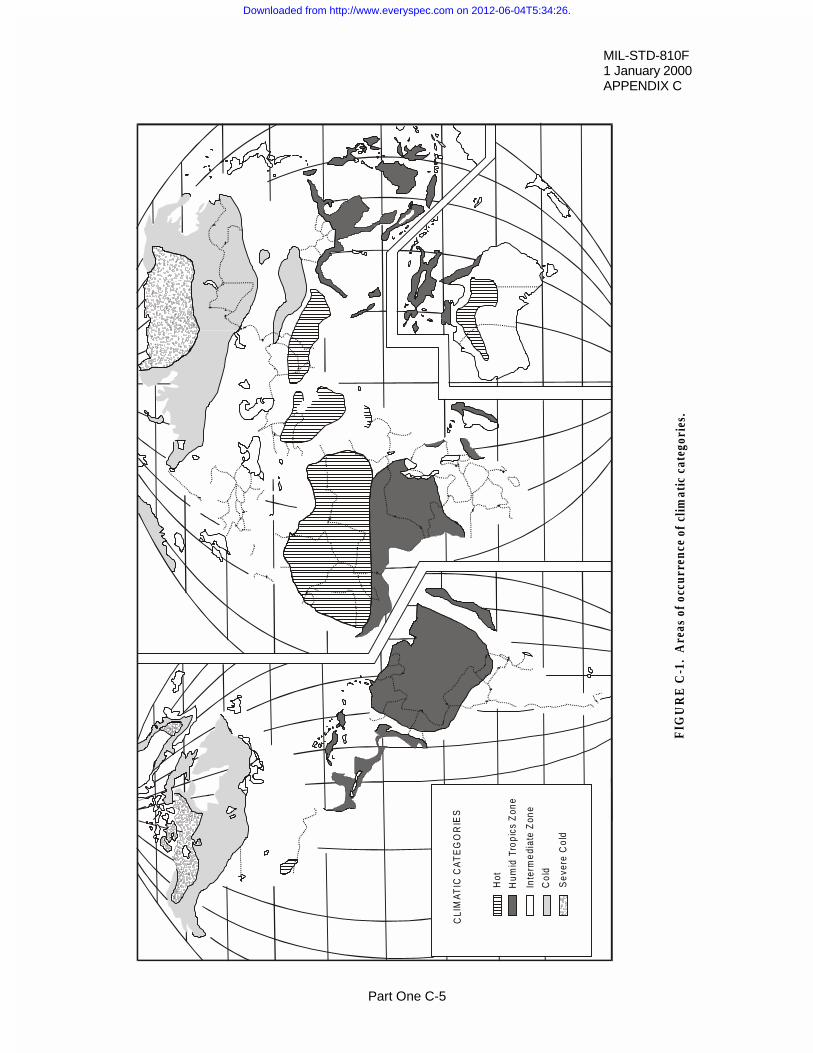
MIL-STD-810F1 January 2000APPENDIX C
Part One C-5
climatic categoriestropiccoldsevere cold
FIG
UR
E C
-1.
Are
a s o
f occ
urre
nce
of c
limat
ic c
ateg
orie
s.
Hot
Hum
id T
ropi
cs Z
one
Inte
rmed
iate
Zon
e
Col
d
Sev
ere
Col
d
CLI
MAT
IC C
AT
EG
OR
IES
Downloaded from http://www.everyspec.com on 2012-06-04T5:34:26.
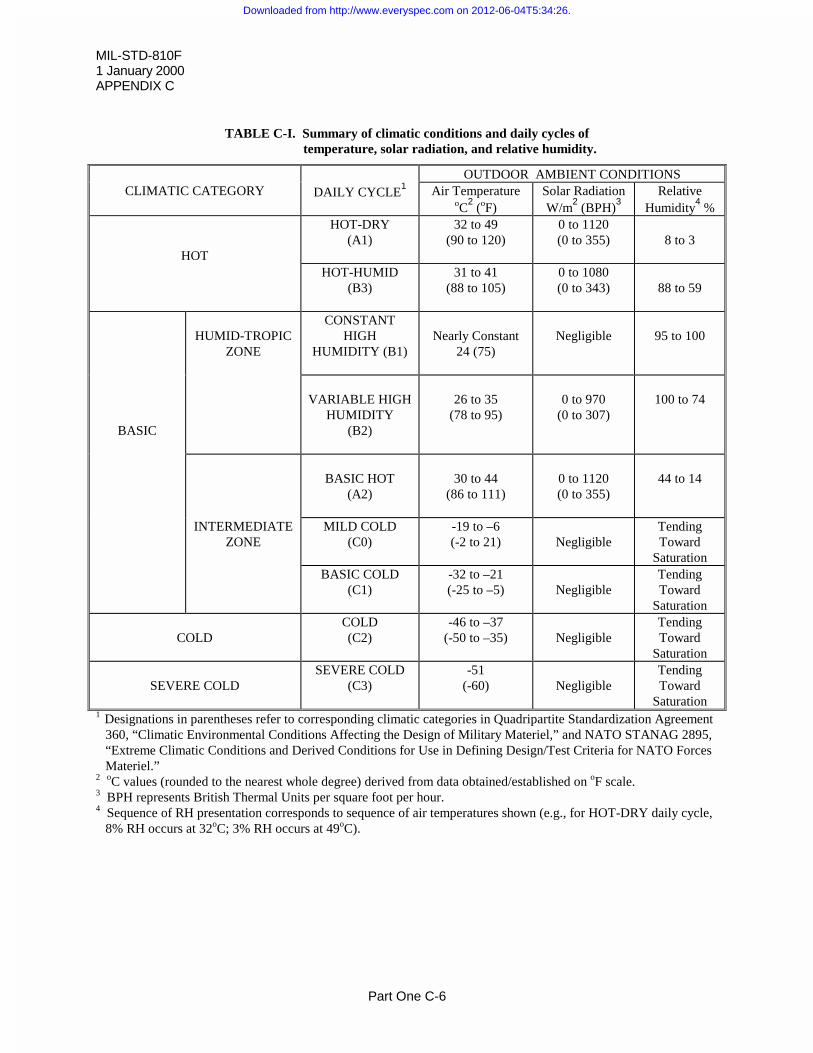
MIL-STD-810F 1 January 2000APPENDIX C
Part One C-6
TABLE C-I. Summary of climatic conditions and daily cycles oftemperature, solar radiation, and relative humidity.
OUTDOOR AMBIENT CONDITIONSCLIMATIC CATEGORY DAILY CYCLE
1 Air TemperatureoC
2 (oF)
Solar RadiationW/m
2 (BPH)
3Relative
Humidity4 %
HOT
HOT-DRY(A1)
32 to 49(90 to 120)
0 to 1120(0 to 355) 8 to 3
HOT-HUMID(B3)
31 to 41(88 to 105)
0 to 1080(0 to 343) 88 to 59
HUMID-TROPICZONE
CONSTANTHIGH
HUMIDITY (B1)Nearly Constant
24 (75)Negligible 95 to 100
BASIC
VARIABLE HIGHHUMIDITY
(B2)
26 to 35(78 to 95)
0 to 970(0 to 307)
100 to 74
BASIC HOT(A2)
30 to 44(86 to 111)
0 to 1120(0 to 355)
44 to 14
INTERMEDIATEZONE
MILD COLD(C0)
-19 to –6(-2 to 21) Negligible
TendingToward
SaturationBASIC COLD
(C1)-32 to –21(-25 to –5) Negligible
TendingToward
Saturation
COLDCOLD(C2)
-46 to –37(-50 to –35) Negligible
TendingToward
Saturation
SEVERE COLDSEVERE COLD
(C3)-51
(-60) NegligibleTendingToward
Saturation1 Designations in parentheses refer to corresponding climatic categories in Quadripartite Standardization Agreement
360, “Climatic Environmental Conditions Affecting the Design of Military Materiel,” and NATO STANAG 2895,“Extreme Climatic Conditions and Derived Conditions for Use in Defining Design/Test Criteria for NATO ForcesMateriel.”
2 oC values (rounded to the nearest whole degree) derived from data obtained/established on oF scale.3 BPH represents British Thermal Units per square foot per hour.4 Sequence of RH presentation corresponds to sequence of air temperatures shown (e.g., for HOT-DRY daily cycle,
8% RH occurs at 32oC; 3% RH occurs at 49oC).
Downloaded from http://www.everyspec.com on 2012-06-04T5:34:26.
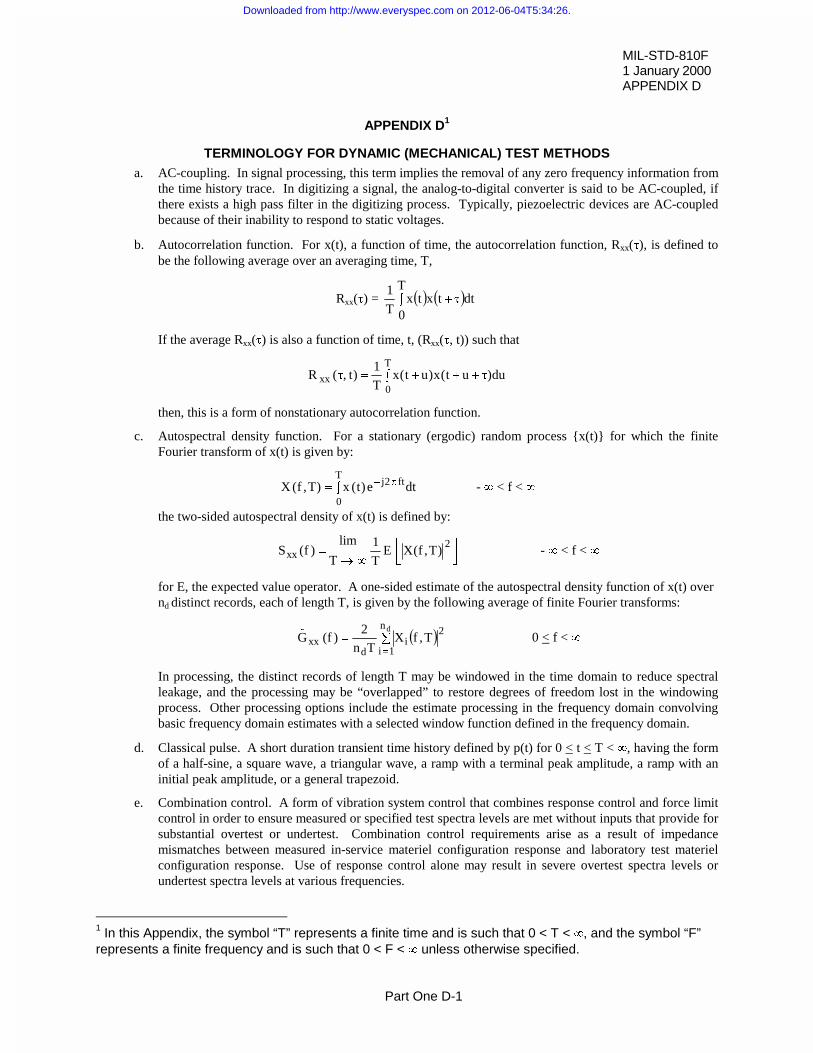
MIL-STD-810F1 January 2000APPENDIX D
Part One D-1
APPENDIX D1
TERMINOLOGY FOR DYNAMIC (MECHANICAL) TEST METHODSa. AC-coupling. In signal processing, this term implies the removal of any zero frequency information from
the time history trace. In digitizing a signal, the analog-to-digital converter is said to be AC-coupled, ifthere exists a high pass filter in the digitizing process. Typically, piezoelectric devices are AC-coupledbecause of their inability to respond to static voltages.
b. Autocorrelation function. For x(t), a function of time, the autocorrelation function, Rxx(W), is defined tobe the following average over an averaging time, T,
Rxx(W) = � � � �³ W�
T
0dttxtx
T
1
If the average Rxx(W) is also a function of time, t, (Rxx(W, t)) such that
³ W��� W
T
0xx du)ut(x)ut(x
T
1)t,(R
then, this is a form of nonstationary autocorrelation function.
c. Autospectral density function. For a stationary (ergodic) random process {x(t)} for which the finiteFourier transform of x(t) is given by:
³ S�
T
0
ft2j dte)t(x)T,f(X - f < f < f
the two-sided autospectral density of x(t) is defined by:
»¼
º
«¬
ª
fo
2
xx )T,f(XET
1
T
lim)f(S - f < f < f
for E, the expected value operator. A one-sided estimate of the autospectral density function of x(t) overnd distinct records, each of length T, is given by the following average of finite Fourier transforms:
� �¦
dn
1i
2i
dxx T,fX
Tn
2)f(G
�
0 < f < f
In processing, the distinct records of length T may be windowed in the time domain to reduce spectralleakage, and the processing may be “overlapped” to restore degrees of freedom lost in the windowingprocess. Other processing options include the estimate processing in the frequency domain convolvingbasic frequency domain estimates with a selected window function defined in the frequency domain.
d. Classical pulse. A short duration transient time history defined by p(t) for 0 < t < T < f, having the formof a half-sine, a square wave, a triangular wave, a ramp with a terminal peak amplitude, a ramp with aninitial peak amplitude, or a general trapezoid.
e. Combination control. A form of vibration system control that combines response control and force limitcontrol in order to ensure measured or specified test spectra levels are met without inputs that provide forsubstantial overtest or undertest. Combination control requirements arise as a result of impedancemismatches between measured in-service materiel configuration response and laboratory test materielconfiguration response. Use of response control alone may result in severe overtest spectra levels orundertest spectra levels at various frequencies.
1 In this Appendix, the symbol “T” represents a finite time and is such that 0 < T < f, and the symbol “F”represents a finite frequency and is such that 0 < F < f unless otherwise specified.
Downloaded from http://www.everyspec.com on 2012-06-04T5:34:26.

MIL-STD-810F 1 January 2000APPENDIX D
Part One D-2
f. Cross-correlation function. For x(t) and y(t) functions of time, the cross correlation function, Rxy(W), isdefined to be the following average over an averaging time, T:
Rxy(W) = ³ W�
T
0dt)t(y)t(x
T
1
If the average Rxy(W) is also a function of time, t, (Rxy(W, t)) such that
³ W��� W
T
0xy du)ut(y)ut(x
T
1)t,(R
then, this is a form of nonstationary cross correlation function.
g. Cross-spectral density function. For stationary (ergodic) random processes {x(t)} and {y(t)} for whichfinite Fourier transforms of x(t) and y(t) are respectively,
³ S�
T
0
ft2j dte)t(x)T,f(X - f < f < f
³ S�
T
0
ft2j dte)t(y)T,f(Y - f < f < f
the two-sided cross-spectral density function of x(t) and y(t) is defined by:
� � � �¿¾½
¯®
fo T,fYT,fXE
T
1
T
lim)f(S *
xy - f < f < f
An estimate of the one-sided cross-spectral density function of x(t) and y(t) over nd distinct records, eachof length T, is given by the following average of finite Fourier transforms:
� �¦
dn
1ii
*i
dxy )T,f(YT,fX
Tn
2)f(G
�
0 < f < f
In processing, the distinct records of length T may be windowed in the time domain to reduce spectralleakage, and the processing may be “overlapped” to restore degrees of freedom lost in the windowingprocess. Other processing options include the estimate processing in the frequency domain convolvingbasic frequency domain estimates with a selected window function defined in the frequency domain.
h. DC-coupling. In signal processing, this term implies the retention of all zero frequency information in atime history trace. In digitizing a signal, the analog-to-digital converter is said to be DC-coupled if thereis no high pass filter in the digitizing process. Typically, piezoresistive devices are DC-coupled becauseof their ability to retain the magnitude of static voltages.
i. Energy autospectral density function. For a time limited history x(t) defined for 0 d t d T < f with finiteFourier transform
³ S�
T
0
ft2j dte)t(x)T,f(X - f < f < f
the two-sided energy autospectral density function of x(t) is given by:
»¼
º
«¬
ª
2xx )T,f(XE)T,f(L - f < f < f
for E, an ensemble average over nd available single records. A one-sided estimate of this function isgiven by:
2xx )T,f(X2)T,f(L
�
0 < f < f
Downloaded from http://www.everyspec.com on 2012-06-04T5:34:26.
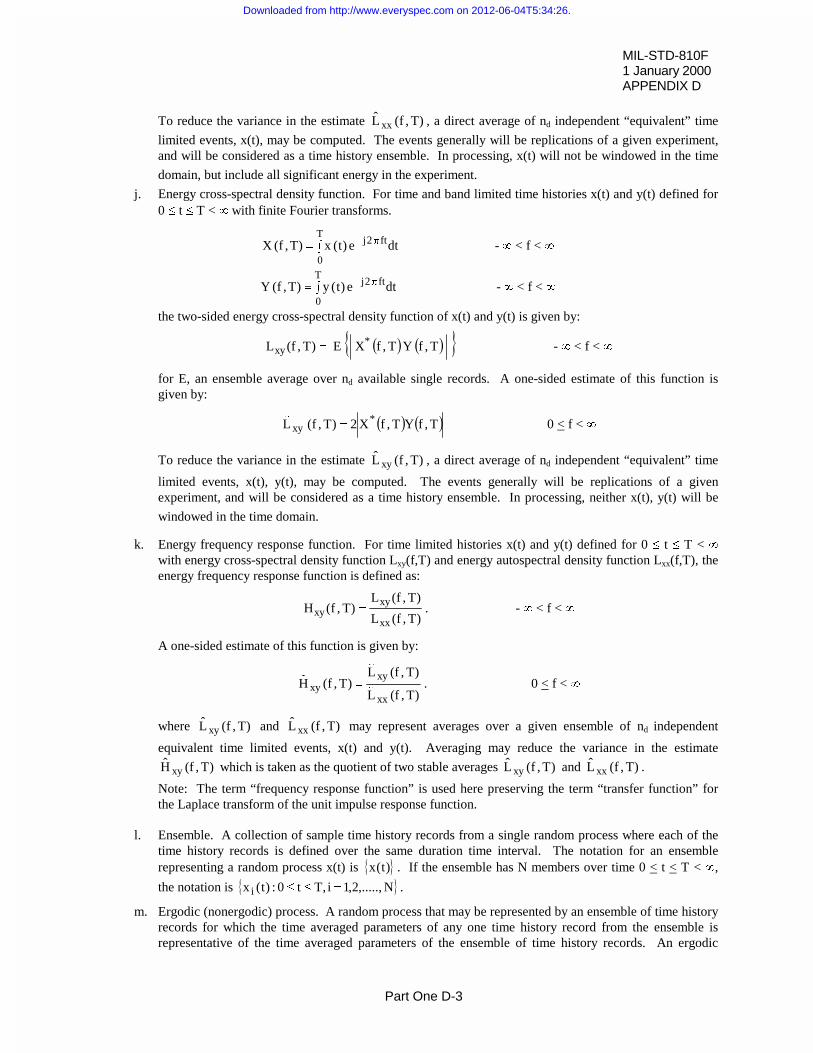
MIL-STD-810F1 January 2000APPENDIX D
Part One D-3
To reduce the variance in the estimate )T,f(L xx , a direct average of nd independent “equivalent” time
limited events, x(t), may be computed. The events generally will be replications of a given experiment,and will be considered as a time history ensemble. In processing, x(t) will not be windowed in the time
domain, but include all significant energy in the experiment.
j. Energy cross-spectral density function. For time and band limited time histories x(t) and y(t) defined for0 d t d T < f with finite Fourier transforms.
³ S�
T
0
ft2j dte)t(x)T,f(X - f < f < f
³ S�
T
0
ft2j dte)t(y)T,f(Y - f < f < f
the two-sided energy cross-spectral density function of x(t) and y(t) is given by:
� � � �� �T,fYT,fXE)T,f(L *xy - f < f < f
for E, an ensemble average over nd available single records. A one-sided estimate of this function isgiven by:
� � � �T,fYT,fX2)T,f(L *xy
�
0 < f < f
To reduce the variance in the estimate )T,f(L xy , a direct average of nd independent “equivalent” time
limited events, x(t), y(t), may be computed. The events generally will be replications of a givenexperiment, and will be considered as a time history ensemble. In processing, neither x(t), y(t) will be
windowed in the time domain.
k. Energy frequency response function. For time limited histories x(t) and y(t) defined for 0 d t d T < fwith energy cross-spectral density function Lxy(f,T) and energy autospectral density function Lxx(f,T), theenergy frequency response function is defined as:
)T,f(L
)T,f(L)T,f(H
xx
xyxy . - f < f < f
A one-sided estimate of this function is given by:
)T,f(L
)T,f(L)T,f(H
xx
xyxy �
�
�
. 0 < f < f
where )T,f(L xy and )T,f(L xx may represent averages over a given ensemble of nd independent
equivalent time limited events, x(t) and y(t). Averaging may reduce the variance in the estimate
)T,f(H xy which is taken as the quotient of two stable averages )T,f(L xy and )T,f(L xx .
Note: The term “frequency response function” is used here preserving the term “transfer function” forthe Laplace transform of the unit impulse response function.
l. Ensemble. A collection of sample time history records from a single random process where each of thetime history records is defined over the same duration time interval. The notation for an ensemblerepresenting a random process x(t) is � �)t(x . If the ensemble has N members over time 0 < t < T < f,
the notation is � �N,.....,2,1i,Tt0:)t(x i dd .
m. Ergodic (nonergodic) process. A random process that may be represented by an ensemble of time historyrecords for which the time averaged parameters of any one time history record from the ensemble isrepresentative of the time averaged parameters of the ensemble of time history records. An ergodic
Downloaded from http://www.everyspec.com on 2012-06-04T5:34:26.
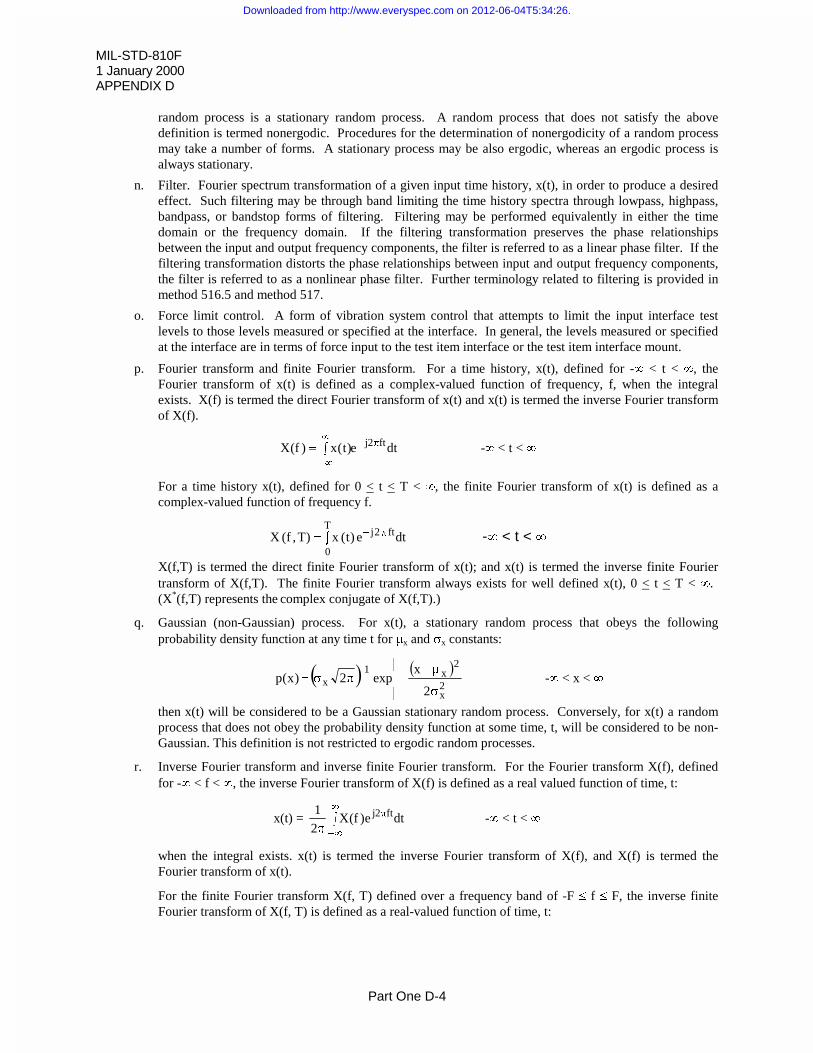
MIL-STD-810F 1 January 2000APPENDIX D
Part One D-4
random process is a stationary random process. A random process that does not satisfy the abovedefinition is termed nonergodic. Procedures for the determination of nonergodicity of a random processmay take a number of forms. A stationary process may be also ergodic, whereas an ergodic process isalways stationary.
n. Filter. Fourier spectrum transformation of a given input time history, x(t), in order to produce a desiredeffect. Such filtering may be through band limiting the time history spectra through lowpass, highpass,bandpass, or bandstop forms of filtering. Filtering may be performed equivalently in either the timedomain or the frequency domain. If the filtering transformation preserves the phase relationshipsbetween the input and output frequency components, the filter is referred to as a linear phase filter. If thefiltering transformation distorts the phase relationships between input and output frequency components,the filter is referred to as a nonlinear phase filter. Further terminology related to filtering is provided inmethod 516.5 and method 517.
o. Force limit control. A form of vibration system control that attempts to limit the input interface testlevels to those levels measured or specified at the interface. In general, the levels measured or specifiedat the interface are in terms of force input to the test item interface or the test item interface mount.
p. Fourier transform and finite Fourier transform. For a time history, x(t), defined for -f < t < f, theFourier transform of x(t) is defined as a complex-valued function of frequency, f, when the integralexists. X(f) is termed the direct Fourier transform of x(t) and x(t) is termed the inverse Fourier transformof X(f).
dte)t(x)f(X ft2j S�
f
f�
³ -f < t < f
For a time history x(t), defined for 0 < t < T < f, the finite Fourier transform of x(t) is defined as acomplex-valued function of frequency f.
³ S�
T
0
ft2j dte)t(x)T,f(X -f < t < f
X(f,T) is termed the direct finite Fourier transform of x(t); and x(t) is termed the inverse finite Fouriertransform of X(f,T). The finite Fourier transform always exists for well defined x(t), 0 < t < T < f. (X*(f,T) represents the complex conjugate of X(f,T).)
q. Gaussian (non-Gaussian) process. For x(t), a stationary random process that obeys the followingprobability density function at any time t for Px and Vx constants:
� � � �
»
»
¼
º
«
«
¬
ª
V
P��SV
�
2x
2x1
x2
xexp2)x(p -f < x < f
then x(t) will be considered to be a Gaussian stationary random process. Conversely, for x(t) a randomprocess that does not obey the probability density function at some time, t, will be considered to be non-Gaussian. This definition is not restricted to ergodic random processes.
r. Inverse Fourier transform and inverse finite Fourier transform. For the Fourier transform X(f), definedfor -f < f < f, the inverse Fourier transform of X(f) is defined as a real valued function of time, t:
x(t) = ³S
f
f�
S dte)f(X2
1 ft2j -f < t < f
when the integral exists. x(t) is termed the inverse Fourier transform of X(f), and X(f) is termed theFourier transform of x(t).
For the finite Fourier transform X(f, T) defined over a frequency band of -F d f d F, the inverse finiteFourier transform of X(f, T) is defined as a real-valued function of time, t:
Downloaded from http://www.everyspec.com on 2012-06-04T5:34:26.
MIL-STD-810F1 January 2000APPENDIX D
Part One D-5
³S
�
SFF
ft2j dfe)T,f(X2
1)t(x -f < t < f
x(t) is termed the inverse finite Fourier transform of X(f,T) and X(f,T) is termed the finite Fouriertransform of x(t), 0 < t < T < f. The inverse finite Fourier transform always exists for well definedX(f,T), -F < f < F and is periodic in t.
s. Linear system. A system in which scaled and additive inputs result in scaled and additive outputs. Thatis, for y = h(x) representation of a linear system, h, then for c, a constant, and x, x1, x2 inputs thefollowing input/output relationships are defined:
System homogeneity: cy = ch(x) = h(cx)
System superposition: y1 + y2 = h(x1) + h(x2) = h(x1 + x2)
t. Mean (ensemble). For an ensemble {xi(t): 0 < t < T < f, i = 1,2,…..N} of N time history records, xi(t),with a mean P(t), 0 d t d T, an unbiased estimate of the mean of the ensemble at time t is given by:
Tt0)t(xN
1)t(m
N
1ii dd¦
�
P(t) is the first moment of the random process � �)t(x .
u. Mean-square (ensemble). For an ensemble {xi(t): 0 < t < T < f, i = 1,2,…..N} of N time history recordswith a mean square p(t), 0 d t d T, an unbiased estimate of the mean-square for the ensemble at time t isgiven by:
¦
N
1i
2i )t(x
N
1)t(p
�
p(t) is the second moment of the random process � �)t(x .
v. Nonlinear system. A system that is not linear in that either the system homogeneity requirement or thesystem superposition requirement or both are violated. For y = h(x) representation of system h, then forc, a constant, and x1, x2 inputs, either
cy = ch(x) z h(cx)
or y1 + y2 = h(x1) + h(x2) z h(x1 + x2)
or both.
w. Nonstationary process. A nonstationary random process is an ensemble of time history records thatcannot be defined to be stationary. In general, the statistical properties of a nonstationary process are afunction of time and not invariant with respect to time translations. In this standard, if either the mean(first moment) estimate or mean-square (second moment) estimate, or both from a random processensemble vary with time over the ensemble, the random process is considered nonstationary. If theensemble has a deterministic component that varies in time, the ensemble may or may not be considerednonstationary depending on whether the random part of the ensemble is nonstationary or stationary.
x. Pulse. For purpose of this standard, a pulse is a finite duration deterministic or random time history. Incases in which the pulse is related to the response in testing of materiel, the duration is generally nolonger than five times the period of the lowest natural frequency of the materiel under consideration, andmay be substantially shorter.
y. Random process. A random process is represented by an ensemble of time history records that haveproperties described in terms of parameters estimated from statistical computations at selected times. Inthis standard it will be assumed that one or more sample records from the random process are related to arepeatable experiment that completely describes the phenomenon under consideration.
z. Response control. A form of vibration system control that attempts to match the response of materiel atone or more points with measured or specified vibration data at one or more points on the materiel.
Downloaded from http://www.everyspec.com on 2012-06-04T5:34:26.
MIL-STD-810F 1 January 2000APPENDIX D
Part One D-6
Vibration control system operational procedures provide for a variety of response matching options, e.g.,single point control, multipoint control, average control, extreme control, etc.
aa. Root-mean-square (ensemble). For an ensemble {xi(t): 0 < t < T < f, i = 1,2,…..N} of N time historyrecords with a mean square p(t), 0 d t d T, (estimated by p
�
(t)), an estimate of the root-mean-square for
the ensemble at time t is given by:
¦
N
1i
2i )t(x
N
1)t(p)t(r
��
bb. Sample function. One particular realization of a random process that may be used to form an ensemblerepresentation for the random process.
cc. Spectrum. The representation of a time history in terms of a function of frequency. The representation,in general, will occur as a result of analyzing the time history with the Fourier transform and may be realor complex. (In the case of time history data analyzed by way of the shock response spectrumengineering tool, the representation is in terms of real amplitude and the natural frequency of a singledegree of freedom system.)
dd. Standard deviation (ensemble). For an ensemble {xi(t): 0 < t < T < f, i = 1,2,…..N} of N time historyrecords with a mean, P(t), and a standard deviation, V(t), 0 d t d T, where the mean P(t) is estimated bym (t), an unbiased estimate of the standard deviation of the ensemble at time t is given by:
¦ ��
N
1i
2i ))t(m)t(x(
1N
1)t(s
��
0 < t < T
ee. Stationary process. A stationary random process is an ensemble of time history records that hasstatistical properties that are not a function of time and, hence, are invariant with respect to timetranslations. The stationary random process may be ergodic or nonergodic.
ff. Transient vibration. A form of nonstationary random vibration time history that has a positive time-varying envelope that begins at zero and ends at zero over a certain period of time, T < f. In general, fora(t), 0 < t <T, the time-varying deterministic envelope function with frequency content below significantfrequency content in the stationary random vibration time history, x(t), the transient vibration may bemodeled in terms of the product model
y(t) = a(t)x(t) 0 < t < T
A condition for application of this model to random data is
)T,f(X)T,f(A �� f0 < f
for some f0 and f0 < f where f0 T
1| . This condition helps ensure a(t) does not significantly modulate
x(t).
gg. Variance (ensemble). For an ensemble {xi(t): 0 < t < T < f, i = 1,2,…..N} of N time history records witha mean P(t) and a variance V2(t), 0 d t d T, where P(t) is estimated by � �tm , an unbiased estimate of the
variance of the ensemble at time t is given by:
� �¦ dd��
N
1i
2i Tt0)t(m)t(x
1N
1)t(v
��
hh. Waveform control. A form of vibration system control in which the system replicates a properlycompensated time history, x(t), in an open loop (no feedback) mode of control. In this standard,waveform control will refer to the replication of measured materiel response in laboratory testing basedupon determining the input voltage time history to the vibration control system that will nearly exactlyreproduce the measured materiel response when applied to the vibration system.
Downloaded from http://www.everyspec.com on 2012-06-04T5:34:26.
MIL-STD-810F1 January 2000INDEX
Index-1
Subject Index (for Part One)
A
Absolute humidity......................................................................................................................................................C-3Accelerated test............................................................................................................................................................. 4Acceleration ...................................................................................................................................... vii, 15, 21, 23, A-9Aggravated test ............................................................................................................................................................. 5Air circulation............................................................................................................................................................. 17Aircraft.................................................................................................................................................................... 6, 13Alternatives...................................................................................................................................... viii, 7, 10, A-3, B-2Ambient .............................................................................................................5, 15, 18, 19, A-7, A-13, C-2, C-3, C-6Atmospheric pressure.................................................................................................................................................. 15
B
Baseline performance.................................................................................................................................................. 18
C
Calibration .................................................................................................................................. 4, 16, A-7, A-12, A-16Catastrophic failure....................................................................................................................................................C-4Climate.......................................................................................................................................5, 6, B-1, C-1, C-2, C-3Climatic categories.......................................................................................................5, A-12, C-2, C-3, C-4, C-5, C-6Coastal ...............................................................................................................................................................C-2, C-3COEA ............................................................................................................................................................. 2, 8, 9, 10Cold-wet ....................................................................................................................................................................C-3Combat developer ..........................................................................................................................................5, B-2, C-2Combined.....................................................................................................16, 19, 22, A-12, A-16, B-2, C-2, C-3, C-4Conditioning ........................................................................................................................................................22, B-2Conduction.................................................................................................................................................................C-2Configuration .................................................................................................................................. 17, A-5, A-12, A-16Contract requirements................................................................................................................................................. 21Contractor .............................................................................................................9, 10, A-3, A-5, A-7, A-8, A-9, A-12Corrosion ...................................................................................................................................................................C-3Critical threshold value ....................................................................................................................................... 5, A-16Cumulative effects .................................................................................................................................................. 5, 17
D
Daily cycles........................................................................................................................................................C-3, C-6Damage ........................................................................................................................................................... 18, 19, 20Dangerous materiel ....................................................................................................................................................C-4Data base........................................................................................................................................................... A-8, B-2Data requirements ............................................................................................................................................... 22, A-8Delivery....................................................................................................................................................................... 14
Downloaded from http://www.everyspec.com on 2012-06-04T5:34:26.
MIL-STD-810F 1 January 2000INDEX
Index-2
Deployment................................................................................................................................... 6, 8, 11, 14, A-6, C-4Design criteria ........................................................................................................................................................... ii, 9Design engineers..........................................................................................................................................2, 7, 11, C-1Detailed Environmental Test Plan .................................................................................................... 11, A-1, A-3, A-11DETP ................................................................................................................................. iii, 2, 11, 21, A-1, A-3, A-11Development testing ..................................................................................................................................................B-2Deviation................................................................................................................. 11, 15, 18, 19, 21, A-13, A-15, D-6DoD 5000-series ......................................................................................................................................... ii, 7, 10, B-1Dummy connectors ..................................................................................................................................................... 17Durations..................................................................................................................................... 1, 15, 17, 18, A-5, A-8
E
EEMP .................................................................................................................................. viii, 2, 9, 10, A-1, A-3, C-1EICL ........................................................................................................................................viii, 9, 11, A-1, A-3, A-9Engineering judgement ............................................................................................................................................. ii, 5Environmental analysis ............................................................................................................................................. 2, 5Environmental class ...........................................................................................................................................C-1, C-2Environmental consideration .............................................................................................1, 10, 23, B-1, B-2, C-1, C-4Environmental Engineering Management Plan........................................................................... 7, 9, 10, A-1, A-3, C-1Environmental engineering specialists............................................................................................ ii, 1, 2, 7, 9, B-1, C-1Environmental engineering tasks ................................................................................................................ ii, 9, 10, A-3Environmental Issues/Criteria List.............................................................................................. 11, A-1, A-3, A-7, A-9Environmental stress ...................................................................... ii, 1, 2, 4, 5, 11,13, 18, 21, 23, A-5, A-7, A-11, B-2Environmental Test and Evaluation Master Plan .................................................................... 9, 10, A-3, A-5, A-7, A-9Environmental Test Report ................................................................................................... 11, 21, 23, A-1, A-3, A-15Environmental worthiness............................................................................................................................... ii, 5, A-16Established limits .................................................................................................................................................... ii, 21ETEMP ................................................................................................................................... 9, 10, A-3, A-5, A-7, A-9ETR........................................................................................................................................viii, 2, 11, A-1, A-3, A-15Extreme conditions ....................................................................................................................................................C-4Extreme environment.........................................................................................................................................B-1, C-3
F
Facility operators ............................................................................................................... ii, 1, 2, 11, 12, 17, A-11, C-1Failure analyses........................................................................................................................... 11, 19, 22, A-13, A-15Failure criteria............................................................................................................................................... 6, 21, A-12Failure modes.......................................................................................................................................................... A-11Field/fleet verification trials......................................................................................................................................... iiiForcing functions ...................................................................................................... 2, 5, 6, 7, 8, 13, 14, 18, A-11, C-1Foreign.......................................................................................................................................................................... 1Forested .....................................................................................................................................................................C-3Freezing point ............................................................................................................................................................C-3
H
Hot-dry...............................................................................................................................................................C-2, C-6Hot-wet ......................................................................................................................................................................C-3
Downloaded from http://www.everyspec.com on 2012-06-04T5:34:26.
MIL-STD-810F1 January 2000INDEX
Index-3
I
Induced ........................................................................................................5, 6, 8, 10, 13, 23, A-5, B-1, B-2, C-1, C-4Instrumentation ................................................................................................. 5, 11, 15, 16, 17, A-7, A-8, A-12, A-16Integrated Product Team........................................................................................................................................... 5, 9International ...............................................................................................................................................4, 23, 24, C-3Interrupted tests .................................................................................................................................................... 18, 20Invalid test .................................................................................................................................................................. 19
K
Knowledge base.........................................................................................................................................................C-2
L
Laboratory standards................................................................................................................................................... 16Laboratory testing .................................................................................................................. ii, viii, 2, 11, 12, B-2, D-6LCEP .....................................................................................viii, 2, 8, 9, 10, 11, 13, 14, A-1, A-3, A-5, A-6, A-9, C-1Levels........................................................ 1, 6, 8, 9, 11, 17, 18, 19, 21, 22, A-11, A-13, C-1, C-2, C-3, C-4, D-1, D-4Life Cycle Environmental Profile ........................................................... ii, 8, 9, 10, A-1, A-3, A-5, A-7, B-2, C-1, C-4Life cycle sequence..................................................................................................................................................... 16Limitations ................................................................................................................................................ ii, 2, A-5, A-9Living document .......................................................................................................................................... iii, A-3, A-5Logistic supply ............................................................................................................................................................ 13
M
Materiel developer....................................................................................... ii, 1, 6, A-3, A-5, A-7, A-9, A-11, C-2, C-4Microbiological..........................................................................................................................................................C-3Military ................................................................................................................................1, 3, 4, 5, 10, C-3, C-4, C-6Mission profile.................................................................................................................................. 6, 13, 17, A-8, C-4MNS.................................................................................................................................................... 2, 8, 10, A-3, A-9Modification kits................................................................................................................................................B-1, C-4
N
Natural (field/fleet) ....................................................................................................................................................... 9Natural environment ......................................................................................5, 7, 8, 11, 12, 13, 17, 23, A-11, B-2, C-1Normal environment ..................................................................................................................................................C-3
O
Objections................................................................................................................................................................... 19Obscurants .........................................................................................................................................................B-1, B-2OED.................................................................................................................iii, 2, 9, 10, 11, A-1, A-3, A-7, A-8, A-9OEDP................................................................................................................................................ 9, 10, 11, A-7, A-8OEDR ......................................................................................................................................................... 11, A-7, A-8Operation ...............................................................................................................................5, 6, 7, 8, 17, 18, B-1, C-4Operational Environment Documentation Plan............................................................................................... 9, 10, A-7
Downloaded from http://www.everyspec.com on 2012-06-04T5:34:26.
MIL-STD-810F 1 January 2000INDEX
Index-4
Operational Environment Documentation Report....................................................................................... 11, A-7, A-8Operational testing.....................................................................................................................................................B-2Operational worthiness ................................................................................................................................. 6, 11, A-15ORD............................................................................................................................................ 2, 8, 10, A-3, A-9, C-4Outdoor ambient ................................................................................................................................................C-2, C-3Overtest................................................................................................................................................... 18, 19, 20, D-1
P
Performance data ........................................................................................................................................ 18, 19, A-13Platform environment ........................................................................................................................... 6, 8, 9, A-7, C-1Post test................................................................................................................................... 18, 19, A-11, A-12, A-13Pretest ......................................................................................................................... 17, 18, 19, 21, A-11, A-12, A-13Primary ............................................................................................................................................... ii, 7, 9, 10, 11, 16Program Management Guidance .................................................................................................................................B-1Program manager ............................................................................................. ii, 1, 2, 6, 7, 8, 9,10, A-3, B-2, C-1, C-2
R
Radiation....................................................................................................................................................................C-2Rationale ........................................................................................................................................ ii, iii, 7, 11, A-9, B-2Realistic test................................................................................................................................................................ 17Real-world ........................................................................................................................................................ ii, 7, A-5Relative humidity.................................................................................................................................15, C-2, C-3, C-6Requirements documents .............................................................................................................................3, 8, 10, C-4RF interfaces ............................................................................................................................................................... 17
S
Safety .................................................................................................2, 3, 7, 15, 20, 21, A-3, A-12, B-1, B-2, C-2, C-4Saturation...........................................................................................................................................................C-3, C-6SEMP.............................................................................................................................................................. 9, 10, A-3Service conditions................................................................................................................................................. ii, A-8Service life ................................................................................................................ ii, 1, 5, 6, 8, 11, 21, A-5, B-1, C-1Service-specific............................................................................................................................................................. iiSevere cold ................................................................................................................................C-2, C-3, C-4, C-5, C-6Sheltered materiel .................................................................................................................................................13, C-4Shipping.................................................................................................................................................................. 6, 13Ships............................................................................................................................................................................ 13Shock .....................................................................................................................1, 4, 21, 23, B-1, B-2, C-2, C-4, D-6Shock/vibration..................................................................................................................................................B-2, C-2Simulation .................................................................................................................................... viii, 7, 9, 10, A-3, B-2Smoke/obscurants ......................................................................................................................................................B-2Solar radiation......................................................................................................................................23, B-1, C-3, C-6Soldier/system interface.............................................................................................................................................C-4Specifications and Standards ........................................................................................................................................ 3Specified value...................................................................................................................................................... 15, 16Standardization .................................................................................................................................... iii, 4, 18, 23, C-6STAR ........................................................................................................................................................................ 2, 8Storage .........................................................................................................5, 6, 7, 8, 10, 13, A-12, B-1, B-2, C-2, C-4Stores ...................................................................................................................................................................... 6, 14
Downloaded from http://www.everyspec.com on 2012-06-04T5:34:26.
MIL-STD-810F1 January 2000INDEX
Index-5
Synergetic ................................................................................................................................................................... 16Synergistic .................................................................................................................................................2, 21, 22, B-2System assessment .............................................................................................................................................B-2, C-2System effectiveness ......................................................................................................... 7, A-3, A-11, A-16, B-1, B-2
T
Tailoring ................................................................ ii, viii, 1, 2, 6, 7, 8, 9, 10, 11, 12, 17, 23, A-11, B-1, B-2, C-1, C-2Technical manuals .....................................................................................................................................................C-4TEMP ............................................................................................................................................. 2, 8, 9, 10, A-3, A-9Temperature gradient .................................................................................................................................................. 15Temperature limits ...................................................................................................................................................... 16Terrain ...................................................................................................................................................7, B-1, C-1, C-3Test chamber......................................................................................................................................................... 17, 22Test criteria ................................................................................................. 4, 5, 7, 9, 10, 11, A-7, A-9, A-12, C-1, C-6Test duration ............................................................................................................................... 15, 17, 18, A-12, A-16Test engineer..................................................................................................................... ii, 2, 7, 11, 12, 19, A-13, C-1Test Engineer and Facility Operators.......................................................................................................................... 11Test facilities................................................................................................................................................. ii, 17, A-12Test level................................................................................................................................................... 6, 17, 18, D-4Thermal effects ..........................................................................................................................................................C-2Threat environmental factors ........................................................................................................................................ 9Tolerances......................................................................................................................................... 6, 15, 18, 22, A-12Transit......................................................................................................................................5, 10, B-1, B-2, C-2, C-4Transport............................................................................................................................................. 7, 8, 13, A-5, C-4Tundra........................................................................................................................................................................C-3Turbulence .................................................................................................................................................................C-2
U
Undertest................................................................................................................................................. 18, 19, 20, D-1User needs ................................................................................................................................................................. ii, 1
V
Verification sensors .................................................................................................................................................... 15Vibration..................................................... 1, 4, 8, 15, 16, 21, 23, A-13, B-1, B-2, C-1, C-2, C-4, D-1, D-4, D-5, D-6Virtual proving ground ......................................................................................................................................7, 9, C-2
W
Wind ..................................................................................................................................................................B-1, C-2
Downloaded from http://www.everyspec.com on 2012-06-04T5:34:26.
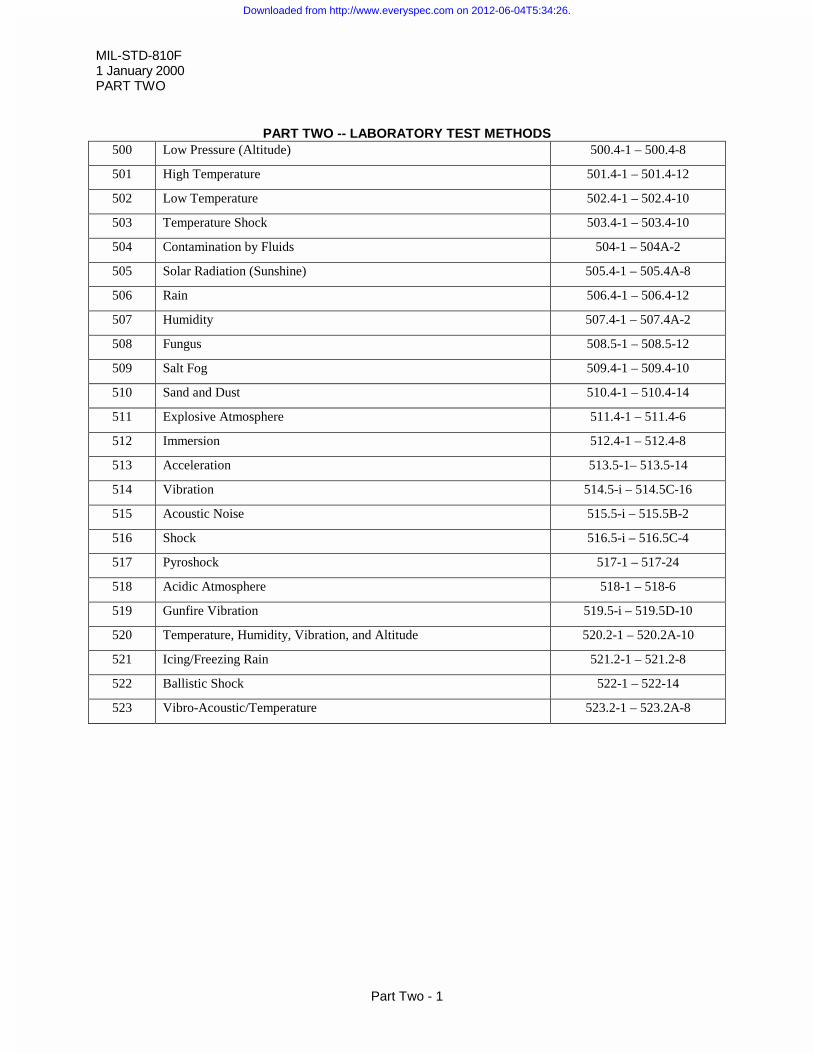
MIL-STD-810F1 January 2000PART TWO
Part Two - 1
PART TWO -- LABORATORY TEST METHODS500 Low Pressure (Altitude) 500.4-1 – 500.4-8
501 High Temperature 501.4-1 – 501.4-12
502 Low Temperature 502.4-1 – 502.4-10
503 Temperature Shock 503.4-1 – 503.4-10
504 Contamination by Fluids 504-1 – 504A-2
505 Solar Radiation (Sunshine) 505.4-1 – 505.4A-8
506 Rain 506.4-1 – 506.4-12
507 Humidity 507.4-1 – 507.4A-2
508 Fungus 508.5-1 – 508.5-12
509 Salt Fog 509.4-1 – 509.4-10
510 Sand and Dust 510.4-1 – 510.4-14
511 Explosive Atmosphere 511.4-1 – 511.4-6
512 Immersion 512.4-1 – 512.4-8
513 Acceleration 513.5-1– 513.5-14
514 Vibration 514.5-i – 514.5C-16
515 Acoustic Noise 515.5-i – 515.5B-2
516 Shock 516.5-i – 516.5C-4
517 Pyroshock 517-1 – 517-24
518 Acidic Atmosphere 518-1 – 518-6
519 Gunfire Vibration 519.5-i – 519.5D-10
520 Temperature, Humidity, Vibration, and Altitude 520.2-1 – 520.2A-10
521 Icing/Freezing Rain 521.2-1 – 521.2-8
522 Ballistic Shock 522-1 – 522-14
523 Vibro-Acoustic/Temperature 523.2-1 – 523.2A-8
Downloaded from http://www.everyspec.com on 2012-06-04T5:34:26.
MIL-STD-810F1 January 2000
METHOD 500.4500.4-1
METHOD 500.4
LOW PRESSURE (ALTITUDE)
NOTE: Tailoring is essential. Select methods, procedures and parameter levels based on the tailoring processdescribed in Part One, paragraph 4.2.2, and Appendix C. Apply the general guidelines for laboratory test methodsdescribed in Part One, paragraph 5 of this standard.
1. SCOPE.
1.1 Purpose.
Use low pressure (altitude) tests to determine if materiel can withstand and/or operate in a low pressure environmentand/or withstand rapid pressure changes.
1.2 Application.
Use this method to evaluate materiel likely to be:
a. stored and/or operated at high ground elevation sites.
b. transported or operated in pressurized or unpressurized areas of aircraft (consider also method 520.2).
c. exposed to a rapid or explosive decompression and, if so, to determine if its failure will damage the aircraftor present a hazard to personnel.
d. carried externally on aircraft.
1.3 Limitations.
This method is not intended to be used to test materiel to be installed or operated in space vehicles, aircraft or missilesthat fly at altitudes above 30,000m.
2. TAILORING GUIDANCE.
2.1 Selecting the Low Pressure (Altitude) Method.
After examining the requirements documents and applying the tailoring process in Part One of this standard todetermine where low pressure is foreseen in the life cycle of the materiel, use the following to aid in selecting thismethod and placing it in sequence with other methods.
2.1.1 Effects of low pressure environments.
In addition to thermal effects (see method 501.4), consider the following typical problems to help determine if thismethod is appropriate for the materiel being tested. This list is not intended to be all-inclusive and some of theexamples may overlap the categories.
2.1.1.1 Physical/chemical.
a. Leakage of gases or fluids from gasket-sealed enclosures.
b. Deformation, rupture or explosion of sealed containers.
c. Change in physical and chemical properties of low-density materials.
d. Overheating of materiel due to reduced heat transfer.
Downloaded from http://www.everyspec.com on 2012-06-04T5:34:26.
MIL-STD-810F1 January 2000
METHOD 500.4500.4-2
e. Evaporation of lubricants.
f. Erratic starting and operation of engines.
g. Failure of hermetic seals.
2.1.1.2 Electrical.
Erratic operation or malfunction of materiel resulting from arcing or corona.
2.1.2 Sequence among other methods.
a. General. See Part One, paragraph 5.5.
b. Unique to this method. Normally this method is performed early in a test sequence because of both itslimited damage potential and its generally early occurrence in the life cycle. However, other testing maycontribute significantly to the effects of low pressure on the test item (see paragraph 2.1.1), and may haveto be conducted before this method. For example:
c. Low-temperature and high-temperature testing may affect seals.
d. Dynamic tests may affect the structural integrity of the test item.
e. Aging of non-metallic components may reduce their strength.
2.2 Selecting Procedures.
This method includes four low pressure tests: Procedure I (Storage); Procedure II (Operation); Procedure III (RapidDecompression), and Procedure IV (Explosive Decompression). Based on the test data requirements, determinewhich of the test procedures or combination of procedures is applicable.
2.2.1 Procedure selection considerations.
Differences among the low pressure test procedures are explained below. Select the procedure that represents themost severe exposure anticipated. When selecting a procedure, consider:
a. The materiel configuration.
b. The logistical and operational requirements (purpose) of the materiel.
c. The operational purpose of the materiel.
d. The test data required to determine if the operational purpose of the materiel has been met.
e. Procedure sequence.
2.2.2 Difference among procedures.
a. Procedure I - Storage/Air Transport. Procedure I is appropriate if the materiel is to be transported or storedat high ground elevations or transported by air in its shipping/storage configuration. Evaluate the materielwith respect to known effects of low pressure (paragraph 2.1.1) and the LCEP (Part One, paragraph4.2.2.3.1) to determine if this procedure is appropriate.
b. Procedure II - Operation/Air Carriage. Use Procedure II to determine the performance of the materiel underlow pressure conditions. It may be preceded by Procedure I. If there are no low pressure storage, rapid orexplosive decompression requirements, this procedure can stand alone.
c. Procedure III - Rapid Decompression. Use Procedure III to determine if a rapid decrease in pressure of thesurrounding environment will cause a materiel reaction that would endanger nearby personnel or theplatform (ground vehicle or aircraft) in which it is being transported. This procedure may be preceded byeither the storage or the operational test.
Downloaded from http://www.everyspec.com on 2012-06-04T5:34:26.
MIL-STD-810F1 January 2000
METHOD 500.4500.4-3
d. Procedure IV - Explosive Decompression. Procedure IV is similar to Procedure III except that it involvesan "instantaneous" decrease in the pressure of the surrounding environment.
NOTE: After either decompression test a potential safety problem could exist that is not obvious. Exercise cautionduring the post-test operational check.
2.3 Determine Test Levels and Conditions.
Having selected this method and relevant procedures (based on the materiel's requirements documents and thetailoring process), it is necessary to complete the tailoring process by selecting specific parameter levels and specialtest conditions/techniques for these procedures based on requirements documents, Life Cycle Environmental Profile,Operational Environment Documentation (see Part One, figure 1-1), and information provided with this procedure. From these sources of information, determine the functions to be performed by the materiel in low pressureenvironments or following storage in low pressure environments. Determine the test parameters such as test pressureand temperature, rate of change of pressure (and temperature if appropriate), duration of exposure, and test itemconfiguration.
2.3.1 Test pressure and temperature.
Base determination of the specific test pressures and temperatures on the anticipated deployment or flight profile ofthe test item.
a. Ground areas. If measured data are not available, temperatures may be obtained for appropriate groundelevations and geographical locations from STANAG 2895. The highest elevation currently contemplatedfor NATO ground military operations (materiel operating and nonoperating) is 4,570m with an equivalentair pressure of 57 kPa.
b. Transport aircraft cargo compartment pressure conditions. The test pressure used for each of the fourprocedures in this method will vary greatly for each test item. There are many different types of cargotransport aircraft on which materiel could be transported and many different types of pressurization systems.Aircraft have different service ceilings (“normal” altitude for cruise) and the normal service ceiling may notbe achievable for very heavy equipment. Most pressurization systems provide outside atmospheric pressurein the cargo compartment (no pressure differential between the inside and outside of the aircraft) up to aparticular altitude, and then maintain a specific pressure above that altitude. The pressure inside the cargodepartment is known as “cabin altitude.” Subject the test item to the most likely anticipated conditions. Unless the materiel has been designed for transport on a particular aircraft with unique cabin altituderequirements, use the following guidance:
(1) For Procedures I and II, use 4,572m (15,000 ft) for the cabin altitude (corresponding pressure in astandard atmosphere: 57.2kPa or 8.3 psia).
(2) For Procedures III and IV, use 2,438m (8,000 ft) for the initial cabin altitude (75.2kPa or 10.9 psia),and 12,192m (40,000 ft) for the final cabin altitude after decompression (18.8kPa or 2.73 psia).
c. Transport aircraft cargo compartment temperature conditions. The range of temperatures associated withthe various low pressure situations varies widely, primarily depending on the capabilities of theenvironmental control system within the cargo compartment of the various aircraft. Obtain the testtemperatures from measured data or from appropriate national sources.
2.3.2 Altitude change rate.
If a specific rate of altitude change (climb/descent rate) is not known or specified in the requirements document, thefollowing guidance is offered: In general, and with the exception of the explosive decompression test, do not use arate of altitude change that exceeds 10 m/s unless justified by the anticipated deployment platform. In a full militarypower takeoff, military transport aircraft normally have an average altitude change rate of 7.6 m/s. Use the value of10 m/s for ground deployment tests (for standardization purposes) unless otherwise specified.
Downloaded from http://www.everyspec.com on 2012-06-04T5:34:26.
MIL-STD-810F1 January 2000
METHOD 500.4500.4-4
2.3.3 Decompression rate.
There are several conditions for which the rapid rate of decompression may vary. These include:
a. massive damage to the aircraft, but the aircraft survives and decompression is virtually instantaneous(explosive decompression -- to be accomplished in 0.1 second or less).
b. relatively minor damage caused by foreign objects through which decompression could occur at a slowerrate than above (rapid decompression -- not more than 15 seconds).
2.3.4 Test duration.
For Procedure I, use a test duration representative of the anticipated service environment but, if this is extensive, usea test duration of at least one hour which is considered adequate for most materiel. Once the test pressure has beenreached and any required functions performed, Procedures II, III, and IV do not require extended periods at the testpressure.
2.3.5 Test item configuration.
Determine the test item configuration based on the realistic configuration(s) of the materiel as anticipated fortransportation, storage, or operation. As a minimum, consider the following configurations:
a. In a shipping/storage container or transit case.
b. In its normal operating configuration (realistic or with restraints, such as with openings that are normallycovered).
2.3.6 Humidity.
Although various levels of humidity commonly exist in the natural environment, there is no requirement to include itin this method because of the complexities involved in controlling combinations of temperature, air pressure, andrelative humidity. method 520.2 does include this combination, and MIL-HDBK-310 includes data on humidity ataltitude.
3. INFORMATION REQUIRED.
3.1 Pretest.
a. General. Information listed in Part One, paragraphs 5.7 and 5.9, and Appendix A, Task 405 of this standard.
b. Specific to this method.
(1) Test altitude and corresponding pressure.
(2) Altitude change rates (or pressurization schedule if a particular aircraft and flight environment areknown).
(3) Test temperature (if other than standard ambient).
(4) Test item configuration.
(5) Test duration.
3.2 During test.
See Part One, paragraph 5.10, and Appendix A, Task 406 of this standard.
3.3 Post-test.
a. General. Information listed in Part One, paragraph 5.13, and in Appendix A, Task 406 of this standard.
b. Specific to this method.
(1) Previous test methods to which the specific test item has been subjected.
Downloaded from http://www.everyspec.com on 2012-06-04T5:34:26.
MIL-STD-810F1 January 2000
METHOD 500.4500.4-5
(2) Time-versus pressure data.
4. TEST PROCESS.
4.1 Test Facility.
a. The required apparatus consists of a chamber or cabinet together with auxiliary instrumentation capable ofmaintaining and monitoring (see Part One, paragraph 5.18) the required conditions of low pressure andtemperature.
b. Make continuous recordings of chamber pressure and, if required, temperature.
4.2 Controls.
a. Altitude change rate. For standardization purposes, and unless otherwise specified, do not use an altitudechange rate in excess of 10 m/s. (See paragraph 2.3.2.)
b. Charts. For standardization purposes, use readout charts that can be read with a resolution within twopercent of full scale.
4.3 Test Interruption.
a. General. See Part One, paragraph 5.11, of this standard.
b. Specific to this method. To achieve the desired effects, subject the test item to the full duration of the lowpressure test without interruption.
4.4 Test Setup.
See Part One, paragraph 5.8.
4.5 Test Execution.
The following steps, alone or in combination, provide the basis for collecting necessary information concerning themateriel in a low pressure environment. Unless otherwise specified, maintain the chamber temperature at standardambient.
4.5.1 Preparation for test.
4.5.1.1 Preliminary steps.
Before starting the test, review pretest information in the test plan to determine test details (e.g., procedures, test itemconfiguration, test altitude, altitude change rate, duration, parameter levels for storage/operation, etc.).
4.5.1.2 Pretest standard ambient checkout.
All test items require a pretest standard ambient checkout to provide baseline data. Conduct the checkout as follows:
Step 1. If required, install temperature sensors in or on the test item as described in the test plan.
Step 2. Install the test item in the chamber (Part One, paragraph 5.8.1) at standard ambient conditions(Part One, paragraph 5.1).
Step 3. Conduct a visual examination of the test item with special attention to stress areas, such as cornersof molded cases, and document the results.
Step 4. Conduct an operational checkout (Part One, paragraph 5.8.2) as described in the plan and recordthe results.
Step 5. If the test item operates satisfactorily, proceed to the appropriate test procedure. If not, resolve theproblems and repeat Step 4 above.
4.5.2 Procedure I - Storage/Air Transport.
Step 1. Place the test item in its storage or transport configuration and install it in the test chamber.
Downloaded from http://www.everyspec.com on 2012-06-04T5:34:26.
MIL-STD-810F1 January 2000
METHOD 500.4500.4-6
Step 2. If appropriate, stabilize the test item to the required temperature.Step 3. Adjust the chamber air pressure to that which corresponds to the required test altitude, at an
altitude change rate as specified in the test plan.Step 4. Maintain the conditions for a minimum of one hour unless otherwise specified in the test plan.Step 5. Adjust the chamber air to standard ambient conditions at the rate specified in the test plan.Step 6. Visually examine the test item to the extent possible and conduct an operational check. Document
the results.
4.5.3 Procedure II - Operation/Air Carriage.
Step 1. With the test item in its operational configuration, adjust the chamber air pressure (andtemperature, if appropriate) to that which corresponds to the required operational altitude at a ratenot to exceed that specified in the test plan.
Step2. Conduct an operational check of the test item in accordance with the requirements documents, anddocument the results.
Step 3. Adjust the chamber air to standard ambient conditions at the rate specified in the test plan.Step 4. Visually examine the test item to the extent possible and conduct an operational check. Document
the results.
4.5.4 Procedure III - Rapid Decompression.
Step 1. With the test item in the storage or transit configuration, adjust the chamber air pressure (andtemperature if appropriate) at the rate specified in the test plan to the cabin altitude (2,438m) (seeparagraph 2.3.1b).
Step 2. Reduce the chamber air pressure to that which corresponds to the required test altitude of 12,192m(18.8 kPa), or as otherwise specified in the test plan for the maximum flight altitude, in not morethan 15 seconds. Maintain this stabilized reduced pressure for at least 10 minutes.
Step 3. Adjust the chamber air to standard ambient conditions at the rate specified in the test plan.Step 4. Visually examine the test item to the extent possible. Document the results. Note: Be alert for
potential safety problems.
4.5.5 Procedure IV - Explosive Decompression.
Step 1. With the test item in the storage or transit configuration, adjust the chamber air pressure (andtemperature if appropriate) at the rate specified in the test plan to the cabin altitude (2,438m) (seeparagraph 2.3.1b).
Step 2. Reduce the chamber air pressure to that which corresponds to the required test altitude of 12,192mor as otherwise specified in the test program, in not more than 0.1 seconds. Maintain thisstabilized reduced pressure for at least 10 minutes.
Step 3. Adjust the chamber air to standard ambient conditions at the rate specified in the test plan.Step 4. Visually examine the test item to the extent possible. Document the results. Note: Be alert for
potential safety problems.
5. ANALYSIS OF RESULTS.
In addition to the guidance provided in Part One, paragraph 5.14, the following information may assist in theevaluation of the test results. Apply any data relative to failure of a test item to meet the requirements of the materielspecifications to the test analysis. For Procedures III and IV, the test item fails only if rapid or explosivedecompression causes a hazard to the aircraft or to personnel; the test item need not show satisfactory post-testperformance unless otherwise specified.
6. REFERENCE/RELATED DOCUMENTS.
a. STANAG 4044, Adoption of a Standard Atmosphere, 10 April 1969, (ICAO Standard Atmosphere).
b. STANAG 4370, Environmental Testing.
c. Allied Environmental Conditions and Test Publication 300, Climatic Environmental Testing (Edition 2)(under STANAG 4370).
Downloaded from http://www.everyspec.com on 2012-06-04T5:34:26.

MIL-STD-810F1 January 2000
METHOD 500.4500.4-7
d. MIL-HDBK-310, Global Climatic Data for Developing Military Products.
e. Synopsis of Background Material for MIL-STD-210B, Climatic Extremes for Military Equipment. Bedford, MA. U.S. Air Force Cambridge Research Laboratories, 1974. DTIC number AD-780-508.
f. Handbook of Geophysics and Space Environments. Bedford, MA. U.S. Air Force Cambridge ResearchLaboratories, Office of Aerospace Research, 1965.
g. U.S. Standard Atmosphere, 1976. NOAA/NASA/USAF, 1976.
Downloaded from http://www.everyspec.com on 2012-06-04T5:34:26.

MIL-STD-810F1 January 2000
METHOD 500.4500.4-8
THIS PAGE INTENTIONALLY BLANK
Downloaded from http://www.everyspec.com on 2012-06-04T5:34:26.
MIL-STD-810F1 January 2000
METHOD 501.4501.4-1
METHOD 501.4
HIGH TEMPERATURE
NOTE: Tailoring is essential. Select methods, procedures, and parameter levels based on the tailoring processdescribed in Part One, paragraph 4.2.2, and Appendix C. Apply the general guidelines for laboratory test methodsdescribed in Part One, paragraph 5 of this standard.
1. SCOPE.
1.1 Purpose.
Use high temperature tests to obtain data to help evaluate effects of high temperature conditions on materiel safety,integrity, and performance.
1.2 Application.
Use this method to evaluate materiel likely to be deployed in areas where temperatures are higher than standardambient.
1.3 Limitations.
Limit use of this method to evaluating the effects of relatively short-term (months, as opposed to years), evendistributions of heat throughout the test item. This method is not generally practical for:
a. Evaluating time-dependent performance degradation (aging) effects that occur during constant long-termexposure to high temperatures (under storage or operational modes) where synergetic effects may beinvolved. For such high temperature aging effects, test in the natural environment.
b. Evaluating materiel in a high temperature environment where solar radiation produces significant thermalgradients in the materiel. For simulating direct solar impingement, use method 505.4, Procedure I.
c. Evaluating actinic (photochemical) effects (for the last part use method 505.4, Procedure II).
d. Evaluating the effects of aerodynamic heating.
2. TAILORING GUIDANCE.
2.1 Selecting this Method.
After examining requirements documents and applying the tailoring process in Part One of this standard to determinewhere high temperatures are foreseen in the life cycle of the test item, use the following to confirm the need for thismethod and to place it in sequence with other methods.
2.1.1 Effects of high temperature environments.
High temperatures may temporarily or permanently impair performance of materiel by changing physical propertiesor dimensions of the material(s) of which it is composed. The following are examples of problems that could resultfrom high temperature exposure that may relate to the materiel being tested. Consider the following typical problemsto help determine if this method is appropriate for the materiel being tested. This list is not intended to be all-inclusive.
a. Parts bind from differential expansion of dissimilar materials.
b. Lubricants become less viscous; joints lose lubrication by outward flow of lubricants.
c. Materials change in dimension, either totally or selectively.
Downloaded from http://www.everyspec.com on 2012-06-04T5:34:26.
MIL-STD-810F1 January 2000
METHOD 501.4501.4-2
d. Packing, gaskets, seals, bearings and shafts become distorted, bind, and fail causing mechanical orintegrity failures.
e. Gaskets display permanent set.
f. Closure and sealing strips deteriorate.
g. Fixed-resistance resistors change in values.
h. Electronic circuit stability varies with differences in temperature gradients and differential expansion ofdissimilar materials.
i. Transformers and electromechanical components overheat.
j. Operating/release margins of relays and magnetic or thermally activated devices alter.
k. Shortened operating lifetime.
l. Solid pellets or grains separate.
m. High pressures created within sealed cases (projectiles, bombs, etc.).
n. Accelerated burning of explosives or propellants.
o. Expansion of cast explosives within their cases.
p. Explosives melt and exude.
q. Discoloration, cracking or crazing of organic materials.
r. Outgassing of composite materials.
2.1.2 Sequence among other methods.
a. General. See Part One, paragraph 5.5.
b. Unique to this method. There are at least two philosophies related to test sequence. One approach is toconserve test item life by applying what are perceived to be the least damaging environments first. Forthis approach, generally apply the high temperature test early in the test sequence. Another approach isto apply environments to maximize the likelihood of disclosing synergetic effects. For this approach,consider high temperature testing following dynamic tests, such as vibration and shock. Although notwritten for such, this test may be used in conjunction with shock and vibration tests to evaluate the effectof dynamic events (i.e., shipping, handling, and shock) on hot materials. Also, this test may contributesignificantly to the results of low pressure testing of seals, e.g., see paragraph 2.1.1d, e and f.
2.2 Selecting Procedures.
This method includes two test procedures, Procedure I (Storage) and Procedure II (Operation). Determine theprocedure(s) to be used.
2.2.1 Procedure selection considerations.
When selecting procedures, consider:
a. The operational purpose of the materiel.
b. The natural exposure circumstances.
c. The test data required to determine whether the operational purpose of the materiel has been met.
d. Procedure sequence. If both the storage and operation procedures are to be applied, perform Procedure Ibefore Procedure II.
Downloaded from http://www.everyspec.com on 2012-06-04T5:34:26.
MIL-STD-810F1 January 2000
METHOD 501.4501.4-3
e. Other significant heat sources that could affect the materiel such as motors, engines, power supplies, orexhaust air.
2.2.2 Difference between procedures.
While both procedures involve temperature conditioning and performance testing, they differ on the basis of thetemperature load prior to and during performance tests. The storage procedure assesses the effects of hightemperature storage on subsequent materiel performance. The operation procedure assesses the effects of hightemperatures during performance.
a. Procedure I - Storage. Use Procedure I to investigate how high temperatures during storage affect themateriel (integrity of materials, and safety/performance of the materiel). This test procedure includesexposing the test item to high temperatures (and low humidity where applicable) that may be encounteredin the materiel's storage situation, followed by a performance test at standard or high temperature ambientconditions.
b. Procedure II - Operation. Use Procedure II to investigate how high ambient temperatures may affectmateriel performance while it is operating. There are two ways to perform Procedure II:
(1) Expose the test item to cyclic chamber conditions with the test item operating either continuously orduring the period of maximum response (highest item temperature).
(2) Expose the test item to a constant temperature and operate the test item when its temperaturestabilizes.
2.3 Determine Test Levels and Conditions.
Having selected this method and relevant procedures (based on the test item's requirements documents and thetailoring process), complete the tailoring process by identifying appropriate parameter levels and applicable testconditions and techniques for these procedures. Base these selections on the requirements documents, the Life CycleEnvironmental Profile, Operational Environment Documentation (see Part One, figure 1-1), and informationprovided with this procedure. Consider the following when selecting test levels.
2.3.1 Climatic conditions.
Identify the appropriate climatic conditions for the geographic areas in which the materiel will be operated andstored. There are two climatic categories where high temperatures are typically encountered: Hot Dry and BasicHot (Part One, Appendix C, figure C-1). Data for these areas are shown in tables 501.4-I, -II, and -III. Determinehigh temperature levels with respect to:
a. Climatic area of concern.
b. Exposure to solar radiation: Is this exposure directly on the materiel, shipping container, protectivepackage shelter, etc.?
c. Analysis of the path of heat transfer from the ambient air and solar radiation to the materiel.
2.3.2 Exposure conditions.
Before determining the levels at which to set test temperatures, determine the way in which the materiel is exposed toheat in normal storage and operational circumstances. Review the LCEP to help make this determination. Considerat least the following exposure conditions:
a. Deployment configuration.
(1) Exposed. Of interest are the most severe conditions that materiel would experience when deployedin any climatic area of the world without the benefit of a protective cover or sheltering enclosure.
(2) Sheltered. Of interest are the most severe conditions that materiel would experience when deployedin any climatic area of the world when under cover or inside a sheltering enclosure. The amount ofventilation available and the presence of adjacent shade can significantly affect the temperature ofthe air surrounding sheltered materiel. Examples of these situations are provided below. (Note: If
Downloaded from http://www.everyspec.com on 2012-06-04T5:34:26.
MIL-STD-810F1 January 2000
METHOD 501.4501.4-4
field data are not available, the conditions for this exposure may be approximated using MIL-HDBK-310 or NATO STANAG 2895. The outdoor ambient air temperature and humidityconditions described in this reference are those measured in standard meteorological shelters at aheight of 1.2 to 1.8 m (4 to 6 ft) above the ground.)
(a) Inside unventilated enclosures.(b) Within enclosed vehicle bodies.(c) Within aircraft sections having surfaces exposed to solar heating.(d) Inside of tents.(e) Under closed tarpaulins.(f) Located above, on, or below the surface of the Earth.
b. Exposure duration. Determine the duration of exposure that the materiel will experience for each of theexposure conditions identified. Exposure may be constant or cyclic, in which case, also identify thenumber of times that the exposure occurs.
c. Special conditions. Although high temperature testing is generally based on the average temperature ofthe air envelope surrounding the materiel, significant localized heating can occur because of specialheating conditions. This localized heating can be well above the average surrounding air and thereforecan significantly affect the evaluation of the materiel's thermal behavior and performance. When theseconditions exist (as described below), include or simulate them in the high temperature test setup to theextent practical.
(1) Aggravated solar. When materiel is located behind glazed or transparent panels or within confined,unventilated compartments behind thin metallic skins, direct solar impingement may temporarilyraise local air temperatures in excess of those shown in tables 505.4-I and -II. Use caution whenapplying extreme temperatures because of increased damage potential. In these circumstances basetesting on actual field measurements. (Applicable conditions for such testing may indicate usingmethod 505.4 separately or in conjunction with this method.)
(2) Man-made sources. Man-made heat-producing devices (motors, engines, power supplies, high-density electronic packages, etc.) may significantly raise the local air temperature near the materiel,either by radiation, convection, or impingement of exhaust air.
2.3.3 Test duration.
For constant temperature exposure, soak the test item until its temperature has stabilized and maintain the testtemperature at least two hours following stabilization. For cyclic exposure, determine the test duration based on anestimate of the number of cycles required to satisfy the design requirements and the guidance below. The duration ofhigh temperature exposure may be as significant as the temperature itself. Because Procedures I and II could exposethe test items to cyclic temperatures, the number of cycles is critical. (Cycles are 24-hour periods unless otherwisespecified.)
a. Procedure I - Storage. The number of cycles for the storage test is set at a minimum of seven to coincidewith the one percent frequency of occurrence of the hours of extreme temperatures during the mostsevere month in an average year at the most severe location. (The maximum temperature occurs forapproximately one hour in each cycle.) When considering extended storage, critical materials, ormaterials determined to be very sensitive to high temperature, increase the number of cycles to assure thedesign requirements are met.
b. Procedure II - Operation. The minimum number of cycles for the operational exposure test is three. Thisnumber is normally sufficient for the test item to reach its maximum response temperature. A maximumof seven cycles is suggested when repeated temperature response is difficult to obtain.
NOTE: This maximum response temperature is referenced in several other methods of this standard such as method503.4.
Downloaded from http://www.everyspec.com on 2012-06-04T5:34:26.
MIL-STD-810F1 January 2000
METHOD 501.4501.4-5
2.3.4 Test item configuration.
Determine the test item configuration based on realistic configuration(s) of the materiel anticipated for storage andoperation. As a minimum, consider the following configurations:
a. In a shipping/storage container or transit case.
b. Protected or unprotected (under canopy, enclosed, etc.).
c. In its normal operating configuration (realistic or with restraints, such as with openings that are normallycovered).
d. Modified with kits for special applications.
e. Stacked or palletized configurations.
2.3.5 Humidity.
Generally, relative humidity (RH) control during high temperature tests is not necessary. In special cases, extremelylow RH may have a significant effect on some materiel during high temperature testing. If the materiel has specialcharacteristics that could be affected by extremely low RH, use the values for RH shown in tables 501.4-I and -II.
2.4 Test Item Operation.
When it is necessary to operate the test item, use the following guidelines for establishing test operating procedures.
a. General. See Part One, paragraph 5.8.2.
b. Unique to this method.
(1) Include operating modes that consume the most power (generate the most heat).
(2) Include the required range of input voltage conditions if changes in voltage could affect the test itemthermal dissipation or response (e.g., power generation or fan speed).
(3) Introduce the cooling media that normally would be applied during service use (e.g., forced air orliquid coolant). Consider using cooling medium inlet temperatures and flow rates that represent bothtypical and worst-case degraded temperature and flow conditions.
(4) For steady-state temperature testing, consider thermal stabilization to be achieved when thetemperatures of critical internal operating components are relatively constant. (Because of test itemduty cycling or the operating characteristics, a constant operating temperature may never beachieved.)
(5) For cyclic temperature testing and depending on the cycle and test item characteristics, there may beno thermal stabilization. In this case, the thermal responses of the test item will also be cyclic, i.e.,the peak response temperature is within 2qC of that of the previous cycle.
3. INFORMATION REQUIRED.
3.1 Pretest.
The following information is required to conduct high temperature tests adequately.
a. General. Information listed in Part One, paragraphs 5.7 and 5.9, and Appendix A, Task 405 of thisstandard.
b. Specific to this method. Relative humidity control requirements (if necessary). (See paragraph 2.3.5 ofthis method.)
c. Thermocouple locations. The component/assembly/structure to be used for thermal response andtemperature stabilization purposes. (See Part One, paragraph 5.4.)
Downloaded from http://www.everyspec.com on 2012-06-04T5:34:26.
MIL-STD-810F1 January 2000
METHOD 501.4501.4-6
3.2 During Test.
Collect the following information during conduct of the test:
a. General. Information listed in Part One, paragraph 5.10, and in Appendix A, Task 406 of this standard.
b. Specific to this method.
(1) Record of chamber temperatures (and humidity, if applicable) versus time conditions.
(2) Record of the test item temperature-versus-time data for the duration of the test.
3.3 Post-test.
See Part One, paragraph 5.13.
4. TEST PROCESS.
4.1 Test Facility.
a. The required apparatus consists of a chamber or cabinet together with auxiliary instrumentation capableof maintaining and monitoring (see Part One, paragraph 5.18) the required conditions of hightemperature (and humidity, where required) throughout an envelope of air surrounding the test item(s).
b. Unless justified by the materiel platform environment and to prevent unrealistic heat transfer in themateriel, maintain the air velocity in the vicinity of the test item so as to not exceed 1.7 m/s (335 ft/min).
c. Make continuous recordings of chamber temperature measurements and, if required, test itemtemperatures.
4.2 Controls.
a. Temperature. Unless otherwise specified in the test plan, if any action other than test item operation(such as opening the chamber door) results in a significant change of the test item temperature (more than2qC (3.6qF)) or chamber air temperature, re-stabilize the test item at the required temperature beforecontinuing the test. If the operational check is not completed within 15 minutes, reestablish test itemtemperature/RH conditions before continuing.
b. Rate of temperature change. Unless otherwise specified, use a rate of temperature change not exceeding3qC (6qF) per minute to prevent thermal shock.
Downloaded from http://www.everyspec.com on 2012-06-04T5:34:26.
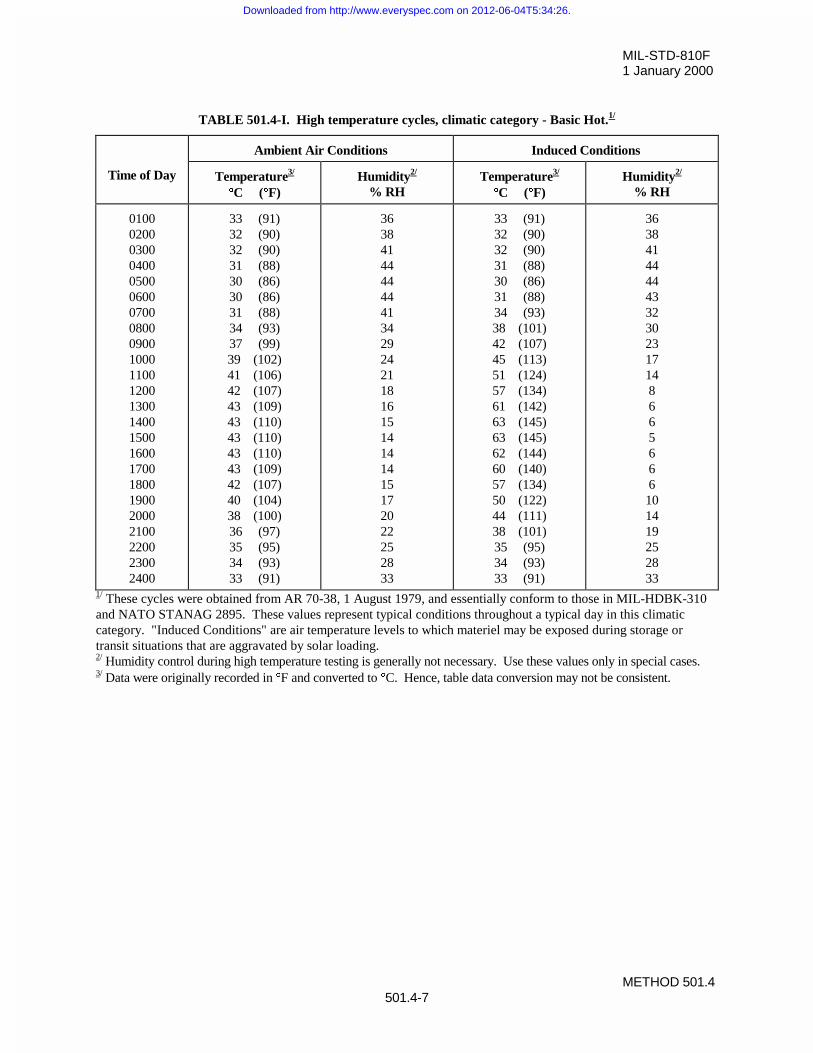
MIL-STD-810F1 January 2000
METHOD 501.4501.4-7
TABLE 501.4-I. High temperature cycles, climatic category - Basic Hot.1/
Ambient Air Conditions Induced Conditions
Time of Day Temperature3/
qqC (qqF)Humidity2/
% RHTemperature3/
qqC (qqF)Humidity2/
% RH
010002000300040005000600070008000900100011001200130014001500160017001800190020002100220023002400
33 (91)32 (90)32 (90)31 (88)30 (86)30 (86)31 (88)34 (93)37 (99)39 (102)41 (106)42 (107)43 (109)43 (110)43 (110)43 (110)43 (109)42 (107)40 (104)38 (100)36 (97)35 (95)34 (93)33 (91)
363841444444413429242118161514141415172022252833
33 (91)32 (90)32 (90)31 (88)30 (86)31 (88)34 (93)38 (101)42 (107)45 (113)51 (124)57 (134)61 (142)63 (145)63 (145)62 (144)60 (140)57 (134)50 (122)44 (111)38 (101)35 (95)34 (93)33 (91)
36384144444332302317148665666101419252833
1/ These cycles were obtained from AR 70-38, 1 August 1979, and essentially conform to those in MIL-HDBK-310and NATO STANAG 2895. These values represent typical conditions throughout a typical day in this climaticcategory. "Induced Conditions" are air temperature levels to which materiel may be exposed during storage ortransit situations that are aggravated by solar loading.2/ Humidity control during high temperature testing is generally not necessary. Use these values only in special cases.3/ Data were originally recorded in qF and converted to qC. Hence, table data conversion may not be consistent.
Downloaded from http://www.everyspec.com on 2012-06-04T5:34:26.
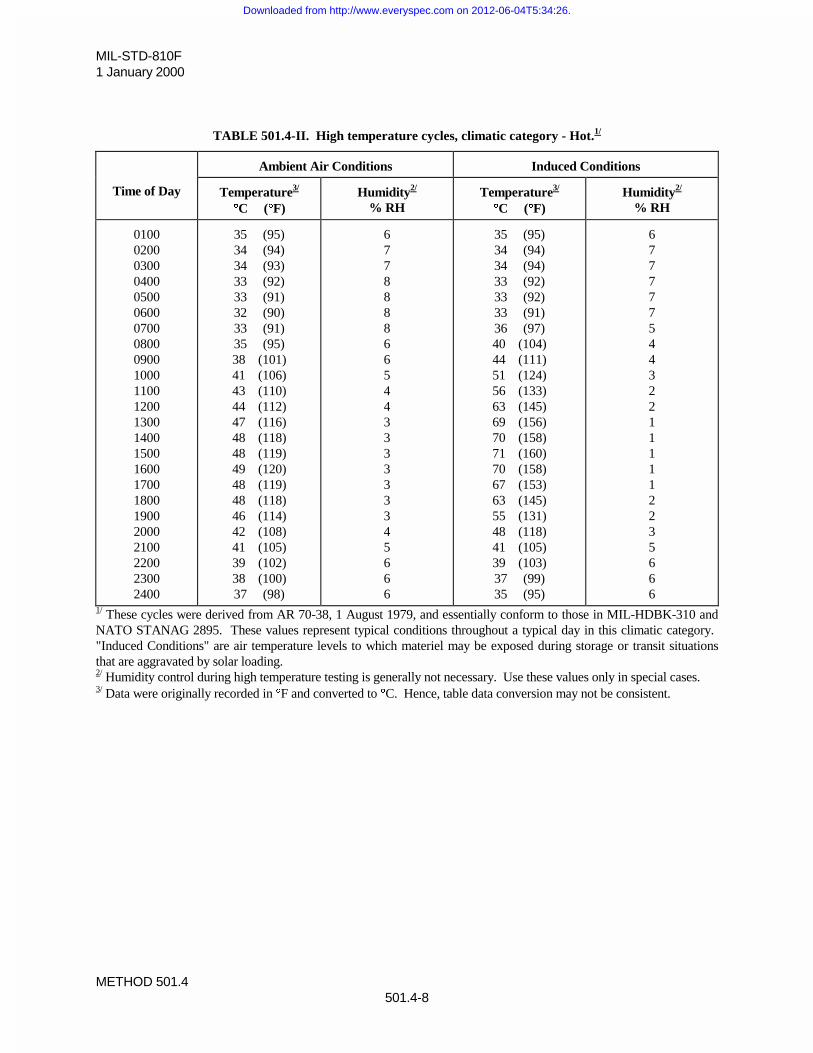
MIL-STD-810F1 January 2000
METHOD 501.4501.4-8
TABLE 501.4-II. High temperature cycles, climatic category - Hot.1/
Ambient Air Conditions Induced Conditions
Time of Day Temperature3/
qqC (qqF)Humidity2/
% RHTemperature3/
qqC (qqF)Humidity2/
% RH
010002000300040005000600070008000900100011001200130014001500160017001800190020002100220023002400
35 (95)34 (94)34 (93)33 (92)33 (91)32 (90)33 (91)35 (95)38 (101)41 (106)43 (110)44 (112)47 (116)48 (118)48 (119)49 (120)48 (119)48 (118)46 (114)42 (108)41 (105)39 (102)38 (100)37 (98)
677888866544333333345666
35 (95)34 (94)34 (94)33 (92)33 (92)33 (91)36 (97)40 (104)44 (111)51 (124)56 (133)63 (145)69 (156)70 (158)71 (160)70 (158)67 (153)63 (145)55 (131)48 (118)41 (105)39 (103)37 (99)35 (95)
677777544322111112235666
1/ These cycles were derived from AR 70-38, 1 August 1979, and essentially conform to those in MIL-HDBK-310 andNATO STANAG 2895. These values represent typical conditions throughout a typical day in this climatic category. "Induced Conditions" are air temperature levels to which materiel may be exposed during storage or transit situationsthat are aggravated by solar loading.2/ Humidity control during high temperature testing is generally not necessary. Use these values only in special cases.3/ Data were originally recorded in qF and converted to qC. Hence, table data conversion may not be consistent.
Downloaded from http://www.everyspec.com on 2012-06-04T5:34:26.
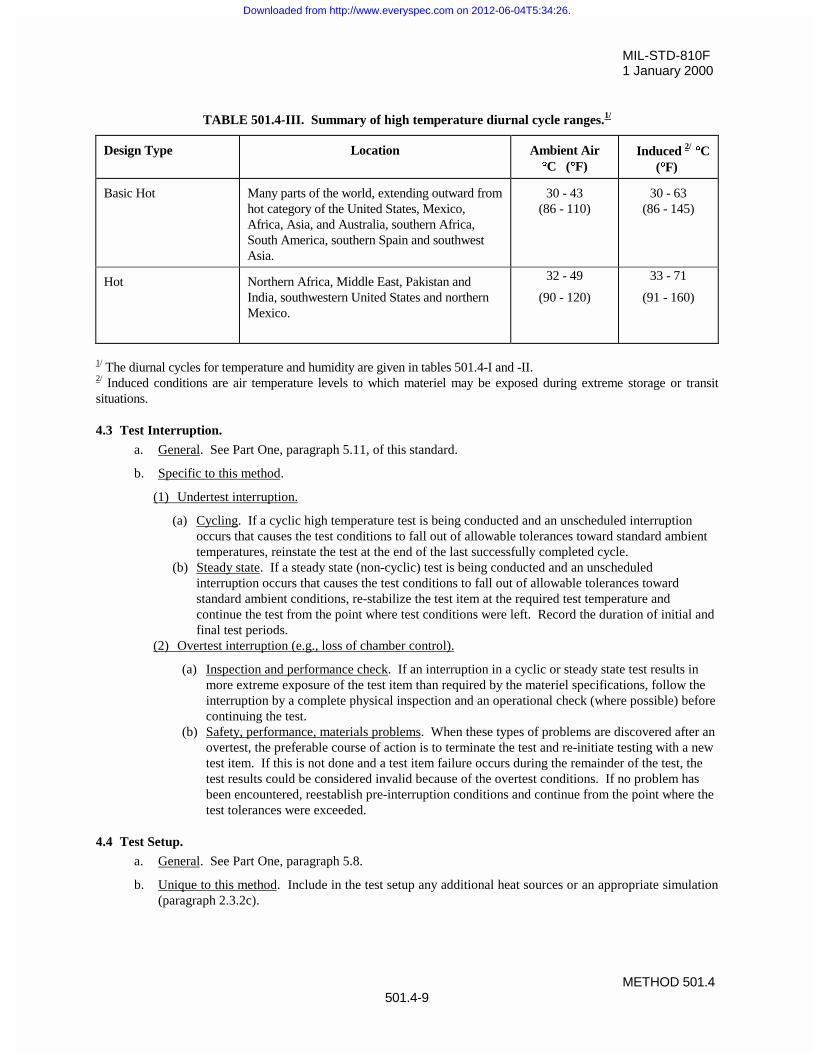
MIL-STD-810F1 January 2000
METHOD 501.4501.4-9
TABLE 501.4-III. Summary of high temperature diurnal cycle ranges.1/
Design Type Location Ambient AirqqC (qqF)
Induced 2/ qqC
(qqF)
Basic Hot Many parts of the world, extending outward fromhot category of the United States, Mexico,Africa, Asia, and Australia, southern Africa,South America, southern Spain and southwestAsia.
30 - 43(86 - 110)
30 - 63(86 - 145)
Hot Northern Africa, Middle East, Pakistan andIndia, southwestern United States and northernMexico.
32 - 49
(90 - 120)
33 - 71
(91 - 160)
1/ The diurnal cycles for temperature and humidity are given in tables 501.4-I and -II.2/ Induced conditions are air temperature levels to which materiel may be exposed during extreme storage or transitsituations.
4.3 Test Interruption.
a. General. See Part One, paragraph 5.11, of this standard.
b. Specific to this method.
(1) Undertest interruption.
(a) Cycling. If a cyclic high temperature test is being conducted and an unscheduled interruptionoccurs that causes the test conditions to fall out of allowable tolerances toward standard ambienttemperatures, reinstate the test at the end of the last successfully completed cycle.
(b) Steady state. If a steady state (non-cyclic) test is being conducted and an unscheduledinterruption occurs that causes the test conditions to fall out of allowable tolerances towardstandard ambient conditions, re-stabilize the test item at the required test temperature andcontinue the test from the point where test conditions were left. Record the duration of initial andfinal test periods.
(2) Overtest interruption (e.g., loss of chamber control).
(a) Inspection and performance check. If an interruption in a cyclic or steady state test results inmore extreme exposure of the test item than required by the materiel specifications, follow theinterruption by a complete physical inspection and an operational check (where possible) beforecontinuing the test.
(b) Safety, performance, materials problems. When these types of problems are discovered after anovertest, the preferable course of action is to terminate the test and re-initiate testing with a newtest item. If this is not done and a test item failure occurs during the remainder of the test, thetest results could be considered invalid because of the overtest conditions. If no problem hasbeen encountered, reestablish pre-interruption conditions and continue from the point where thetest tolerances were exceeded.
4.4 Test Setup.
a. General. See Part One, paragraph 5.8.
b. Unique to this method. Include in the test setup any additional heat sources or an appropriate simulation(paragraph 2.3.2c).
Downloaded from http://www.everyspec.com on 2012-06-04T5:34:26.
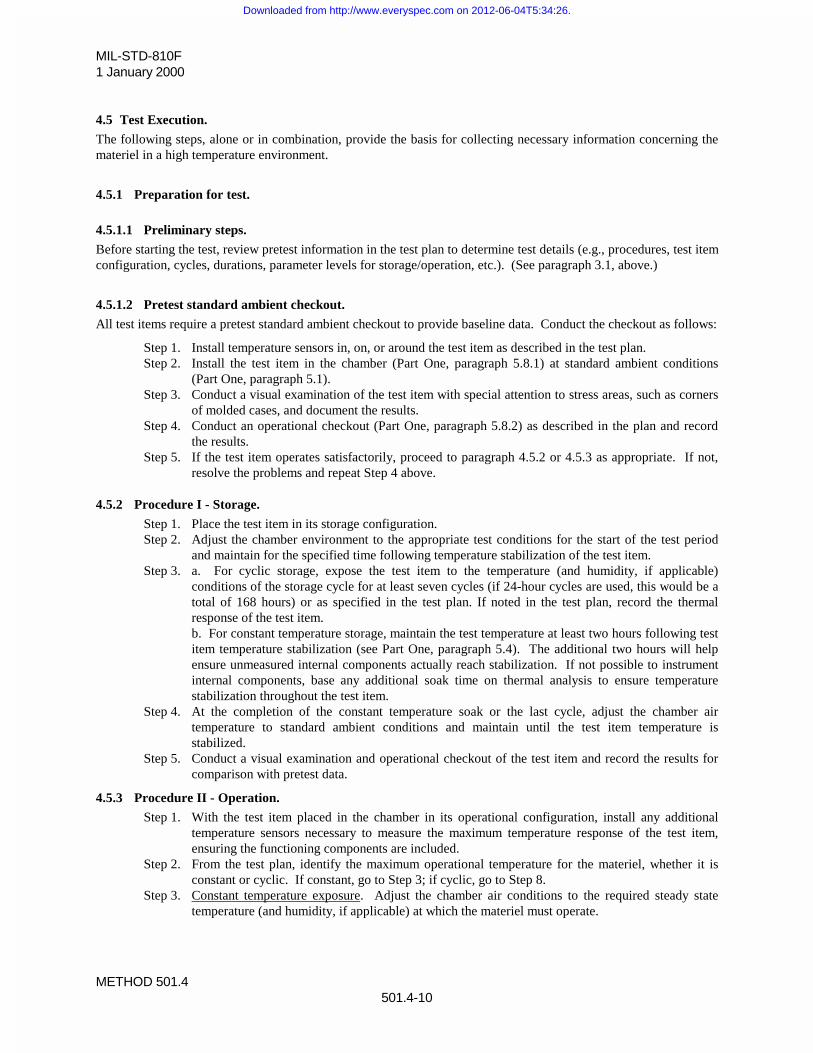
MIL-STD-810F1 January 2000
METHOD 501.4501.4-10
4.5 Test Execution.
The following steps, alone or in combination, provide the basis for collecting necessary information concerning themateriel in a high temperature environment.
4.5.1 Preparation for test.
4.5.1.1 Preliminary steps.
Before starting the test, review pretest information in the test plan to determine test details (e.g., procedures, test itemconfiguration, cycles, durations, parameter levels for storage/operation, etc.). (See paragraph 3.1, above.)
4.5.1.2 Pretest standard ambient checkout.
All test items require a pretest standard ambient checkout to provide baseline data. Conduct the checkout as follows:
Step 1. Install temperature sensors in, on, or around the test item as described in the test plan.Step 2. Install the test item in the chamber (Part One, paragraph 5.8.1) at standard ambient conditions
(Part One, paragraph 5.1).Step 3. Conduct a visual examination of the test item with special attention to stress areas, such as corners
of molded cases, and document the results.Step 4. Conduct an operational checkout (Part One, paragraph 5.8.2) as described in the plan and record
the results.Step 5. If the test item operates satisfactorily, proceed to paragraph 4.5.2 or 4.5.3 as appropriate. If not,
resolve the problems and repeat Step 4 above.
4.5.2 Procedure I - Storage.
Step 1. Place the test item in its storage configuration.Step 2. Adjust the chamber environment to the appropriate test conditions for the start of the test period
and maintain for the specified time following temperature stabilization of the test item.Step 3. a. For cyclic storage, expose the test item to the temperature (and humidity, if applicable)
conditions of the storage cycle for at least seven cycles (if 24-hour cycles are used, this would be atotal of 168 hours) or as specified in the test plan. If noted in the test plan, record the thermalresponse of the test item.b. For constant temperature storage, maintain the test temperature at least two hours following testitem temperature stabilization (see Part One, paragraph 5.4). The additional two hours will helpensure unmeasured internal components actually reach stabilization. If not possible to instrumentinternal components, base any additional soak time on thermal analysis to ensure temperaturestabilization throughout the test item.
Step 4. At the completion of the constant temperature soak or the last cycle, adjust the chamber airtemperature to standard ambient conditions and maintain until the test item temperature isstabilized.
Step 5. Conduct a visual examination and operational checkout of the test item and record the results forcomparison with pretest data.
4.5.3 Procedure II - Operation.
Step 1. With the test item placed in the chamber in its operational configuration, install any additionaltemperature sensors necessary to measure the maximum temperature response of the test item,ensuring the functioning components are included.
Step 2. From the test plan, identify the maximum operational temperature for the materiel, whether it isconstant or cyclic. If constant, go to Step 3; if cyclic, go to Step 8.
Step 3. Constant temperature exposure. Adjust the chamber air conditions to the required steady statetemperature (and humidity, if applicable) at which the materiel must operate.
Downloaded from http://www.everyspec.com on 2012-06-04T5:34:26.
MIL-STD-810F1 January 2000
METHOD 501.4501.4-11
Step 4. Maintain the chamber conditions at least two hours following test item temperature stabilization(see Part One, paragraph 5.4). If not possible to instrument internal components, base theadditional soak time on thermal analysis to ensure temperature stabilization throughout the testitem.
Step 5. Conduct as thorough a visual examination of the test item as possible considering chamber accesslimitations, and document the results for comparison with pretest data.
Step 6. Operate the test item and allow its temperature to re-stabilize. Conduct an operational checkout ofthe test item in accordance with the test plan and document the results for comparison with pretestdata.
Step 7. Proceed to Step 10.Step 8. Cycling temperature exposure. Adjust the chamber air temperature (and humidity, if applicable) to
the initial conditions of the operational cycle appropriate for materiel deployment and maintainuntil the test item’s temperature has stabilized.
Step 9. Expose the test item to at least three cycles or the number of cycles necessary to assure repeatedtest item response. Conduct as complete a visual examination of the test item as possibleconsidering chamber access limitations. Document the results.
Step 10. Operate the test item during the maximum response period of the exposure cycle. Note that themaximum response period may not coincide with the maximum temperature cycle conditionsbecause of the thermal lag of the test item. Repeat until a complete operational checkout of the testitem has been accomplished in accordance with the approved test plan and the results have beendocumented.
Step 11. With the test item not operating, adjust the chamber air temperature to standard ambient conditionsand maintain until the test item temperature has stabilized.
Step 12. Conduct a complete visual examination and operational checkout in accordance with the approvedtest plan and document the results for comparison with pretest data.
5. ANALYSIS OF RESULTS.
In addition to the guidance provided in Part One, paragraph 5.14, the following information is provided to assist inthe evaluation of the test results. Apply any data relative to failure of a test item to meet the requirements of themateriel specifications to the test analysis, and consider related information such as:
a. Results of nondestructive examinations (if any) of materiel following the storage test may be conductedat the extreme temperatures.
b. Degradation or changes in operating characteristics allowed at the high extreme temperatures.
c. Necessity for special kits or special operating procedures for high temperature exposure.
d. Evidence of improper lubrication and assurance that the lubricants specified for the environmentalcondition were used.
6. REFERENCE/RELATED DOCUMENTS.
a. AR 70-38, Research, Development, Test and Evaluation of Materiel for Extreme Climatic Conditions.
b. MIL-HDBK-310, Global Climatic Data for Developing Military Products.
c. Synopsis of Background Material for MIL-STD-210B, Climatic Extremes for Military Equipment. Bedford, MA: Air Force Cambridge Research Laboratories, 24 January 1974. DTIC numberAD-780-508.
d. NATO STANAG 2895, Extreme Climatic Conditions and Derived Conditions for Use in DefiningDesign/Test Criteria for NATO Forces Materiel.
e. NATO STANAG 4370, Environmental Testing.
f. Allied Environmental Conditions and Test Procedure (AECTP) 300, Climatic Environmental Tests(under STANAG 4370).
Downloaded from http://www.everyspec.com on 2012-06-04T5:34:26.

MIL-STD-810F1 January 2000
METHOD 501.4501.4-12
THIS PAGE INTENTIONALLY BLANK
Downloaded from http://www.everyspec.com on 2012-06-04T5:34:26.
MIL-STD-810F1 January 2000
METHOD 502.4502.4-1
METHOD 502.4
LOW TEMPERATURE
NOTE: Tailoring is essential. Select methods, procedures, and parameter levels based on the tailoring processdescribed in Part One, paragraph 4.2.2, and Appendix C. Apply the general guidelines for laboratory test methodsdescribed in Part One, paragraph 5 of this standard.
1. SCOPE.
1.1 Purpose.Use low temperature testing to measure how low temperature conditions during storage, operation, and manipulationaffect materiel safety, integrity, and performance.
1.2 Application.Use this method when the materiel is likely to be deployed in a low temperature environment during its life cycleand the effects of low temperature have not been assessed during other tests (e.g., a temperature-altitude test).
1.3 Limitations.This method is not intended for testing materiel to be installed in and operated in unpressurized aircraft, since suchmateriel would usually be tested according to method 520.2.
2. TAILORING GUIDANCE.
2.1 Selecting the Low Temperature Method.After examining requirements documents and applying the tailoring process in Part One of this standard todetermine where low temperatures are foreseen in the life cycle of the test item, use the following to confirm theneed for this method and to place it in sequence with other methods.
2.1.1 Effects of low temperature environments.Low temperatures have adverse effects on almost all basic material. As a result, exposure of materiel to lowtemperatures may either temporarily or permanently impair the operation of the materiel by changing the physicalproperties of the material(s) of which it is composed. Consider low temperature tests whenever the materiel will beexposed to temperatures below standard ambient, and consider the following typical problems to help determine ifthis method is appropriate for the materiel being tested. This list is not intended to be all-inclusive.
a. Hardening and embrittlement of materials.
b. Binding of parts from differential contraction of dissimilar materials and the different rates of expansionof different parts in response to temperature transients.
c. Loss of lubrication and lubricant flow due to increased viscosity.
d. Changes in electronic components (resistors, capacitors, etc.).
e. Changes in performance of transformers and electromechanical components.
f. Stiffening of shock mounts.
g. Cracking of explosive solid pellets or grains, such as ammonium nitrate.
h. Cracking and crazing, embrittlement, change in impact strength, and reduced strength.
i. Static fatigue of restrained glass.
j. Condensation and freezing of water.
Downloaded from http://www.everyspec.com on 2012-06-04T5:34:26.
MIL-STD-810F1 January 2000
METHOD 502.4502.4-2
k. Decrease in dexterity, hearing, and vision of personnel wearing protective clothing.
l. Change of burning rates.
2.1.2 Sequence among other methods.a. General. See Part One, paragraph 5.5.
b. Unique to this method. There are at least two philosophies related to test sequence. One approach is toconserve test item life by applying what are perceived to be the least damaging environments first. Forthis approach, generally apply the low temperature test early in the test sequence. Another approach isto apply environments to maximize the likelihood of disclosing synergetic effects. For this approach,consider low temperature testing following dynamic tests, such as vibration and shock. Although notwritten for such, this test may be used in conjunction with shock and vibration tests to evaluate the effectof dynamic events (i.e., shipping, handling, and shock) on cold materials. Also, this test maysignificantly alter the performance of seals during the low pressure testing of method 500.4.
2.2 Selecting Procedures.This method includes three test procedures, Procedure I (Storage), Procedure II (Operation), and Procedure III(Manipulation). Based on the test data requirements, determine which test procedure, combination, or sequence ofprocedures is applicable. In most cases, all three procedures will apply.
2.2.1 Procedure selection considerations.When selecting procedures, consider:
a. The operational purpose of the materiel. From the requirements documents, determine the functions tobe performed by the materiel in a low temperature environment and any limiting conditions, such asstorage.
b. The natural exposure circumstances.
c. The test data required to determine whether the operational purpose of the materiel has been met.
(1) The expected temperature at the deployment location.
(2) The expected duration at the deployment location.
(3) The test item configuration.
d. Procedure sequence.
(1) Procedure II can be preceded by Procedure I, Procedure III, or both. If the materiel is to be stored atlow temperatures before use, Procedure I is conducted before Procedure II. If a manipulation test isrequired, Procedure III can precede the operational test. If the materiel is not intended to be storedat low temperature or manipulated before use, Procedure II is conducted directly.
(2) Storage testing, operational testing, or both can precede the manipulation test if required.
2.2.2 Difference among procedures.While all procedures involve low temperatures, they differ on the basis of the timing and nature of performancetests.
a. Procedure I - Storage. Use Procedure I to investigate how low temperatures during storage affectmateriel safety during and after storage, and performance after storage.
b. Procedure II - Operation. Use Procedure II to investigate how well the materiel operates in lowtemperature environments. For the purpose of this document, operation is defined as excitation of themateriel with a minimum of contact by personnel. It does not exclude handling (manipulation).
Downloaded from http://www.everyspec.com on 2012-06-04T5:34:26.
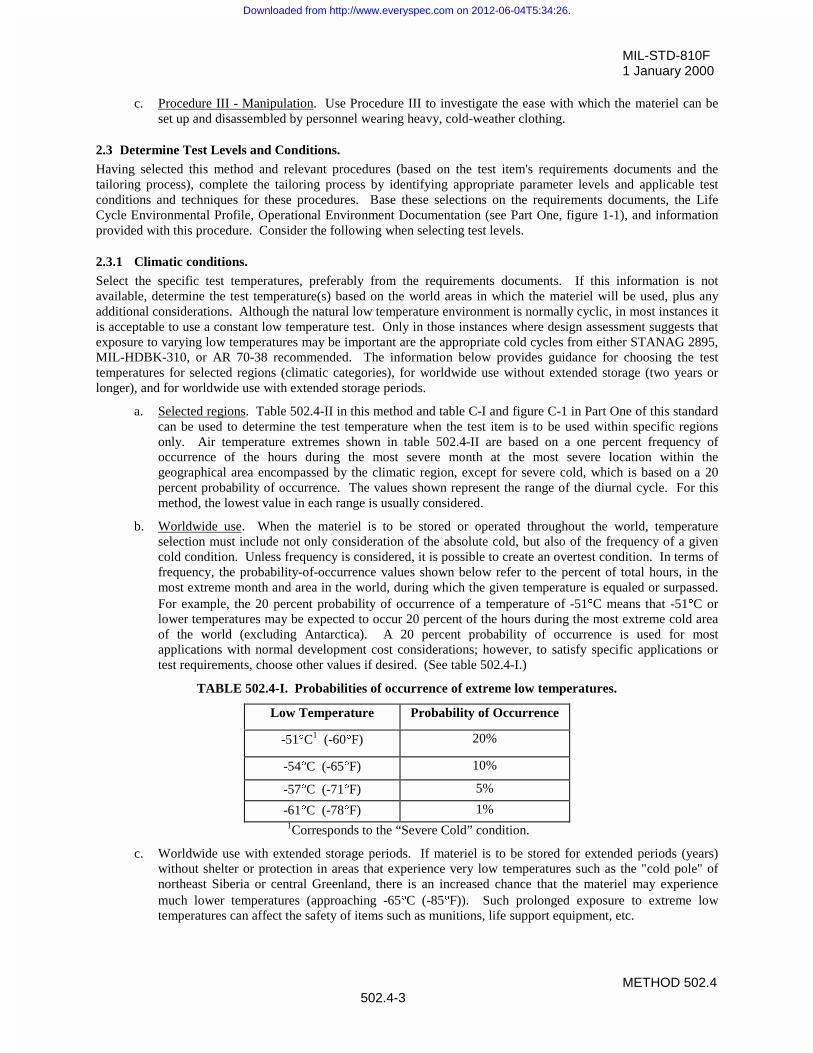
MIL-STD-810F1 January 2000
METHOD 502.4502.4-3
c. Procedure III - Manipulation. Use Procedure III to investigate the ease with which the materiel can beset up and disassembled by personnel wearing heavy, cold-weather clothing.
2.3 Determine Test Levels and Conditions.Having selected this method and relevant procedures (based on the test item's requirements documents and thetailoring process), complete the tailoring process by identifying appropriate parameter levels and applicable testconditions and techniques for these procedures. Base these selections on the requirements documents, the LifeCycle Environmental Profile, Operational Environment Documentation (see Part One, figure 1-1), and informationprovided with this procedure. Consider the following when selecting test levels.
2.3.1 Climatic conditions.Select the specific test temperatures, preferably from the requirements documents. If this information is notavailable, determine the test temperature(s) based on the world areas in which the materiel will be used, plus anyadditional considerations. Although the natural low temperature environment is normally cyclic, in most instances itis acceptable to use a constant low temperature test. Only in those instances where design assessment suggests thatexposure to varying low temperatures may be important are the appropriate cold cycles from either STANAG 2895,MIL-HDBK-310, or AR 70-38 recommended. The information below provides guidance for choosing the testtemperatures for selected regions (climatic categories), for worldwide use without extended storage (two years orlonger), and for worldwide use with extended storage periods.
a. Selected regions. Table 502.4-II in this method and table C-I and figure C-1 in Part One of this standardcan be used to determine the test temperature when the test item is to be used within specific regionsonly. Air temperature extremes shown in table 502.4-II are based on a one percent frequency ofoccurrence of the hours during the most severe month at the most severe location within thegeographical area encompassed by the climatic region, except for severe cold, which is based on a 20percent probability of occurrence. The values shown represent the range of the diurnal cycle. For thismethod, the lowest value in each range is usually considered.
b. Worldwide use. When the materiel is to be stored or operated throughout the world, temperatureselection must include not only consideration of the absolute cold, but also of the frequency of a givencold condition. Unless frequency is considered, it is possible to create an overtest condition. In terms offrequency, the probability-of-occurrence values shown below refer to the percent of total hours, in themost extreme month and area in the world, during which the given temperature is equaled or surpassed.For example, the 20 percent probability of occurrence of a temperature of -51qC means that -51qC orlower temperatures may be expected to occur 20 percent of the hours during the most extreme cold areaof the world (excluding Antarctica). A 20 percent probability of occurrence is used for mostapplications with normal development cost considerations; however, to satisfy specific applications ortest requirements, choose other values if desired. (See table 502.4-I.)
TABLE 502.4-I. Probabilities of occurrence of extreme low temperatures.
Low Temperature Probability of Occurrence
-51qC1 (-60qF) 20%
-54qC (-65qF) 10%
-57qC (-71qF) 5%
-61qC (-78qF) 1%1Corresponds to the “Severe Cold” condition.
c. Worldwide use with extended storage periods. If materiel is to be stored for extended periods (years)without shelter or protection in areas that experience very low temperatures such as the "cold pole" ofnortheast Siberia or central Greenland, there is an increased chance that the materiel may experiencemuch lower temperatures (approaching -65qC (-85qF)). Such prolonged exposure to extreme lowtemperatures can affect the safety of items such as munitions, life support equipment, etc.
Downloaded from http://www.everyspec.com on 2012-06-04T5:34:26.
MIL-STD-810F1 January 2000
METHOD 502.4502.4-4
2.3.2 Duration of exposure to low temperatures.The duration of exposure to low temperature may be a factor in materiel safety, integrity and performance.
a. Nonhazardous or non-safety-related (non-life-support type) materiel. Most materiel in this category (in anonoperating mode), with the possible exception of organic plastics, will not experience deteriorationfollowing temperature stabilization of the materiel at low temperatures. Following temperaturestabilization of the test item, use a storage period of four hours for this materiel if no other value isavailable.
b. Explosives, munitions, organic plastics, etc. These items may continue to deteriorate followingtemperature stabilization; consequently, it is necessary to test them at low temperatures for long periodsof time. Use a minimum storage period of 72 hours following temperature stabilization of the test item,since durations of exposure of this period of time are typical for these types of items.
c. Restrained glass. Glass, ceramics, and glass-type products (such as those used in optical systems, lasersystems, and electronic systems) that require mounting or restraining in specific positions mayexperience static fatigue. A more extended period of low temperature may be required to induce thisphenomenon. Although we do not have a specific reference, it has been reported that a 24-hourexposure usually gives an 87 percent probability of uncovering this type of design defect.
2.3.3 Test item configuration.The configuration of the materiel is an important factor in how it may be affected by temperature. Therefore, usethe anticipated configuration of the materiel during storage or use during the test. As a minimum, consider thefollowing configurations:
a. In a shipping/storage container or transit case.
b. Protected or unprotected.
c. Deployed (realistically or with restraints, such as with openings that are normally covered).
d. Modified with kits for special applications.
2.3.4 Additional guidelines.Review the materiel specifications and requirements documents. Apply any additional guidelines necessary.
3. INFORMATION REQUIRED.
3.1 Pretest.The following information is required to conduct low temperature tests adequately.
a. General. Information listed in Part One, paragraphs 5.7 and 5.9, and Part One, Appendix A, Task 405 ofthis standard.
b. Specific to this method. Test temperatures, type of protective clothing required, and any additionalguidelines.
c. Temperature sensor locations. The component/assembly/structure to be used for thermal response andtemperature stabilization purposes. (See Part One, paragraph 5.4.)
3.2 During Test.Collect the following information during conduct of the test:
a. General. Information listed in Part One, paragraph 5.10, and in Appendix A, Task 406 of this standard.
b. Specific to this method.
(1) Record of chamber temperature versus time conditions.
Downloaded from http://www.everyspec.com on 2012-06-04T5:34:26.
MIL-STD-810F1 January 2000
METHOD 502.4502.4-5
(2) Protective clothing used during manipulation tests.
3.3 Post Test.The following post test information is required.
a. General. Information listed in Part One, paragraph 5.13, and in Appendix A, Task 406 of this standard.
b. Specific to this method.(1) Length of time required for each performance check.
(2) Temperature-time versus data (test item and chamber).
(3) Clothing and special equipment used to set up or disassemble the test item.
(4) Appropriate anthropometric measurements of personnel performing manipulation tests.
4. TEST PROCESS.
4.1 Test Facility.a. The required apparatus consists of a chamber or cabinet and auxiliary instrumentation capable of
maintaining and monitoring (see Part One, paragraph 5.18) the required conditions of low temperaturethroughout an envelope of air surrounding the test item.
b. Unless otherwise justified by the materiel platform environment and to prevent unrealistic heat transferin the materiel, maintain the air velocity in the vicinity of the test item so as to not exceed 1.7 m/s (335ft/min).
4.2 Controls.a. Temperature. Unless otherwise specified in the test plan, if any action other than test item operation
(such as opening the chamber door) results in a significant change of the test item temperature (morethan 2qC (3.6qF)), restabilize the test item at the required temperature before continuing. If theoperational check is not completed within 15 minutes, reestablish the test item temperature conditionsbefore continuing.
b. Rate of temperature change. Unless otherwise specified, control the rate of temperature change to notexceed 3qC (6qF) per minute to prevent thermal shock.
c. Temperature measurement. Install temperature sensor instrumentation on or in the test item to measuretemperature stabilization data (see Part One, paragraph 5.4).
d. Temperature recording. Continuously record the chamber and test item temperature, if required.
4.3 Test Interruption.a. General. See Part One, paragraph 5.11 of this standard.
b. Specific to this method.
(1) Undertest interruption. Follow an interruption that allows test temperatures to fluctuate outsideallowable tolerances toward ambient conditions by a complete physical inspection and operationalcheck (where possible). If no problems are encountered, restabilize the test item at the testtemperature and continue from the point of the interruption. Since no extreme conditions wereencountered, consider any problems as a test item failure.
(2) Overtest interruption. Follow any interruption that results in more extreme exposure of the test itemthan required by the materiel specification by a complete physical examination and operationalcheck (where possible) before any continuation of testing. This is especially true where a safetyproblem could exist, such as with munitions. If a problem is discovered, the preferable course ofaction is to terminate the test and reinitiate testing with a new test item. If this is not done and testitem failure occurs during the remainder of the test, the test results could be considered invalid
Downloaded from http://www.everyspec.com on 2012-06-04T5:34:26.
MIL-STD-810F1 January 2000
METHOD 502.4502.4-6
because of the overtest condition. If no problem has been encountered, reestablish pre-interruptionconditions and continue from the point where the test tolerances were exceeded.
4.4 Test Setup.See Part One, paragraph 5.8.
4.5 Test Execution.The following steps, alone or in combination, provide the basis for collecting necessary information concerning thetest item in a low temperature environment. Conduct operational checkouts after storage and after manipulation toverify successful completion of both procedures.
4.5.1 Preparation for test.
4.5.1.1 Preliminary steps.Before starting the test, review pretest information in the test plan to determine test details (e.g., procedures, testitem configuration, cycles, durations, parameter levels for storage/operation, etc.).
4.5.1.2 Pretest standard ambient checkout.All test items require a pretest standard checkout at standard ambient conditions to provide baseline data. Conductthe checkout as follows (change of step sequence may be required for large test items):
Step 1. Install temperature sensors in or on the test item as required to determine the test itemtemperature(s).
Step 2. Insert the test item into the chamber and stabilize it at standard ambient conditions (See Part One,paragraph 5.1).
Step 3. Conduct a complete visual examination of the test item, with special attention to stress areas suchas corners of molded cases.
Step 4. Document the results.Step 5. Prepare the test item in its required configuration in accordance with Part One, paragraph 5.8.1,
and configure the test item as required.Step 6. Conduct an operational checkout in accordance with the approved test plan and record the results.Step 7. If the test item operates satisfactorily, proceed to the first test procedure as determined from the
test plan. If not, resolve the problems and repeat Step 6 above.
4.5.2 Procedure I - Storage.Step1. Adjust the test item to its storage configuration and install it in the test chamber.Step 2. Adjust the chamber air temperature to that specified in the test plan for storage.Step 3. Following temperature stabilization of the test item (Part One, paragraph 5.4), maintain the storage
temperature for a period as specified in the test plan.Step 4. Conduct a visual examination of the test item and compare the results with the pretest data.
Record any pertinent physical changes or the fact that there were no obvious changes.Step 5. If low temperature operation is required, proceed to paragraph 4.5.3, Step 4, otherwise, proceed to
Step 6 below.Step 6. Adjust the chamber air temperature to standard ambient and maintain until the test item has
achieved temperature stabilization.Step 7. Conduct a complete visual examination of the test item and document the results.Step 8. If appropriate, conduct an operational checkout of the test item and document the results.Step 9. Compare these data with the pretest data.
4.5.3 Procedure II - Operation.Step 1. With the test item in the test chamber, adjust the chamber air temperature to the low operating
temperature of the test item as specified in the test plan. Maintain at least two hours followingtemperature stabilization of the test item.
Downloaded from http://www.everyspec.com on 2012-06-04T5:34:26.
MIL-STD-810F1 January 2000
METHOD 502.4502.4-7
Step 2. Conduct as complete a visual examination of the test item as chamber access limitations willallow.
Step 3. Document the results.Step 4. Conduct an operational checkout of the test item as in paragraph 4.5.1.2, Step 6.Step 5. Document the results.Step 6. If manipulation of the test item is required at low temperature, proceed to Step 4 of paragraph
4.4.4. If not, proceed to step 7 of this procedure.Step 7. Adjust the chamber air temperature to standard ambient and maintain until temperature
stabilization of the test item has been achieved.Step 8. Conduct a complete visual examination of the test item.Step 9. Document the results.Step 10. If appropriate, conduct an operational checkout and record results for comparison with data
obtained in paragraph 4.5.1.2, Step 6.
4.5.4 Procedure III - Manipulation.Step 1. With the test item in the test chamber, adjust the chamber air temperature to the low operating
temperature of the test item as determined from the test plan. Maintain for two hours followingtemperature stabilization of the test item.
Step 2. While maintaining the low operating temperature, place the test item in its normal operatingconfiguration by using the options of Step 4.
Step 3. Reestablish the temperature to that used in Step 1, above.Step 4. Based on the type of test chamber available, select one of the two following options:
Option 1 - To be used when a "walk-in" type chamber is available: With personnel clothed andequipped as they would be in a low temperature tactical situation, disassemble the testitem as would be done in the field, and repack it in its normal shipping/storagecontainer(s), transit case, or other mode and configuration.
Option 2 - To be used when small chambers (non-walk-in) are used: Perform the option 1procedure, except the disassembly and packing will be performed by personnelreaching through chamber access holes or the open door while they are wearing heavygloves such as would be required in the natural environment. NOTE - Opening of thechamber door may cause frost to form on the test item in addition to a gradual warmingof the test item. Limit manipulation necessary to perform the required setup orteardown to 15-minute intervals, between which reestablish the temperature of step 1above.
Step 5. If operation of the test item is required at low temperatures, repeat step 2, above, and then proceedto Step 1 of paragraph 4.5.3. If not, proceed to step 6 of this procedure.
Step 6. Conduct a complete visual examination of the test item.Step 7. Document the results for comparison with the pretest data.Step 8. Adjust the chamber air temperature to standard ambient and maintain until the test item has
reached temperature stabilization.Step 9. Conduct a complete visual examination of the test item.Step 10. Document the results.Step 11. If appropriate, conduct an operational checkout of the test item and record results for comparison
with data obtained in paragraph 4.5.1.2, Step 6.
5. ANALYSIS OF RESULTS.In addition to the guidance provided in Part One, paragraph 5.14, the following information is provided to assist inthe evaluation of the test results. Apply any data relative to failure of a test item to meet the requirements of themateriel specifications to the test analysis, and consider related information such as:
a. Nondestructive test/examination following exposure to low temperature may be conducted at the lowtest temperature.
b. Degradation allowed in operating characteristics when at low temperatures.
c. Necessity for special kits or special cold weather procedures.
Downloaded from http://www.everyspec.com on 2012-06-04T5:34:26.
MIL-STD-810F1 January 2000
METHOD 502.4502.4-8
d. Evidence of improper lubrication and assurance that lubricants specified for the environmental conditionwere used.
e. For starting failure on internal combustion engines, assurance of the presence of proper fuels anddeicers, if appropriate.
f. Condition and adequacy of the power source.
6. REFERENCE/RELATED DOCUMENTS.a. AR 70-38, Research, Development, Test and Evaluation of Materiel for Extreme Climatic Conditions.
b. MIL-HDBK-310, Global Climatic Data for Developing Military Products.
c. Synopses of Background Material for MIL-STD-210B, Climatic Extreme for Military Equipment.Bedford, MA: Air Force Cambridge Research Laboratories, January 1974. DTIC number AD-780-508.
d. NATO STANAG 2895, Extreme Climatic-Conditions and Derived Conditions for Use in DefiningDesign/Test Criteria for NATO-Forces Materiel.
e. STANAG 4370, Environmental Testing.
f. Allied Environmental Conditions and Test Publication 300, Climatic Environmental Tests (underSTANAG 4370).
Downloaded from http://www.everyspec.com on 2012-06-04T5:34:26.
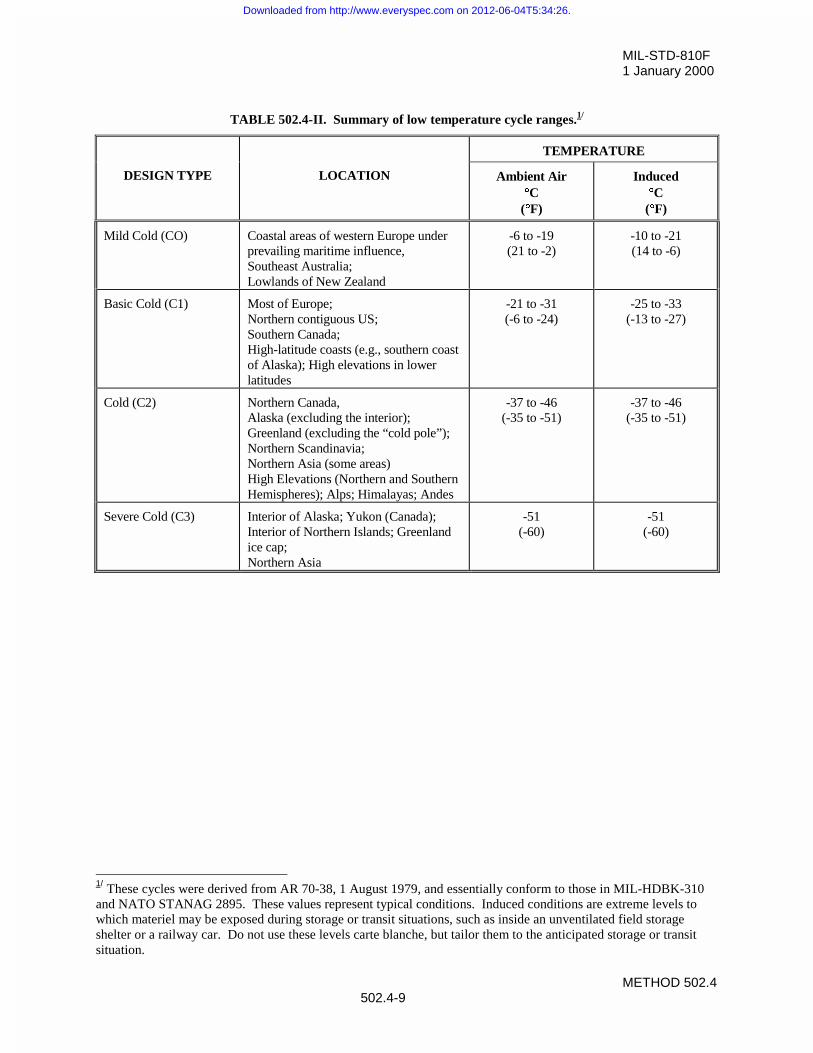
MIL-STD-810F1 January 2000
METHOD 502.4502.4-9
TABLE 502.4-II. Summary of low temperature cycle ranges.1/
TEMPERATURE
DESIGN TYPE LOCATION Ambient AirqqC
(qqF)
InducedqqC
(qqF)
Mild Cold (CO) Coastal areas of western Europe underprevailing maritime influence,Southeast Australia;Lowlands of New Zealand
-6 to -19(21 to -2)
-10 to -21(14 to -6)
Basic Cold (C1) Most of Europe;Northern contiguous US;Southern Canada;High-latitude coasts (e.g., southern coastof Alaska); High elevations in lowerlatitudes
-21 to -31(-6 to -24)
-25 to -33(-13 to -27)
Cold (C2) Northern Canada,Alaska (excluding the interior);Greenland (excluding the “cold pole”);Northern Scandinavia;Northern Asia (some areas)High Elevations (Northern and SouthernHemispheres); Alps; Himalayas; Andes
-37 to -46(-35 to -51)
-37 to -46(-35 to -51)
Severe Cold (C3) Interior of Alaska; Yukon (Canada);Interior of Northern Islands; Greenlandice cap;Northern Asia
-51(-60)
-51(-60)
1/ These cycles were derived from AR 70-38, 1 August 1979, and essentially conform to those in MIL-HDBK-310and NATO STANAG 2895. These values represent typical conditions. Induced conditions are extreme levels towhich materiel may be exposed during storage or transit situations, such as inside an unventilated field storageshelter or a railway car. Do not use these levels carte blanche, but tailor them to the anticipated storage or transitsituation.
Downloaded from http://www.everyspec.com on 2012-06-04T5:34:26.

MIL-STD-810F1 January 2000
METHOD 502.4502.4-10
THIS PAGE INTENTIONALLY BLANK
Downloaded from http://www.everyspec.com on 2012-06-04T5:34:26.
MIL-STD-810F1 January 2000
METHOD 503.4503.4-1
METHOD 503.4
TEMPERATURE SHOCK
NOTE: Tailoring is essential. Select methods, procedures, and parameter levels based on the tailoring processdescribed in Part One, paragraph 4.2.2, and Appendix C. Apply the general guidelines for laboratory test methodsdescribed in Part One, paragraph 5 of this standard.
1. SCOPE.
1.1 Purpose.
Use temperature shock tests to determine if materiel can withstand sudden changes in the temperature of thesurrounding atmosphere without experiencing physical damage or deterioration in performance. For the purpose ofthis document, "sudden changes" is defined as "greater than 10qC per minute."
1.2 Application.
1.2.1 Normal environment.
Use this method when the requirements documents specify the materiel is likely to be deployed where suddensignificant changes of air temperature may be experienced. This method is intended to only evaluate the effects ofsudden temperature changes of the outer surfaces of materiel, items mounted on the outer surfaces, or internal itemssituated near the external surfaces. Typically, this addresses:
a. The transfer of materiel between heated areas and low temperature environments.
b. Ascent from a high temperature ground environment to high altitude via a high performance vehicle (hotto cold only).
c. Air drop at high altitude/low temperature from heated aircraft enclosures when only the external material(packaging or materiel surface) is to be tested.
1.2.2 Safety and screening.
Except as noted in paragraph 1.3, use this method to reveal safety problems and potential flaws in materiel normallyexposed to less extreme rates of temperature change (as long as the test conditions do not exceed the designlimitations of the materiel). Although not intended to be used for environmental stress screening (ESS), with properengineering this method can also be used as a screening test (using more extreme temperature shocks) to revealpotential flaws in materiel exposed to less extreme temperature change conditions.
1.3 Limitations.
This method is not intended for materiel that will not experience sudden extreme temperature changes because of itspackaging, installed location, etc. This method does not replace the assessment of performance characteristics afterlengthy exposure to extreme temperatures, such as with methods 501.4 and 502.4. Additionally, this method doesnot address the temperature shock experienced by materiel transferred between air and liquid or two liquids, thethermal shock caused by rapid transient warmup by engine compressor bleed air, or aerodynamic loading. Exceptfor ESS, this method is inappropriate if the actual transfer time in a service environment will not produce asignificant thermal shock. Additionally, this method does not address materiel that has been exposed to heat from afire and subsequently cooled with water.
Downloaded from http://www.everyspec.com on 2012-06-04T5:34:26.
MIL-STD-810F1 January 2000
METHOD 503.4503.4-2
2. TAILORING GUIDANCE.
2.1 Selecting this Method.
After examining requirements documents and applying the tailoring process in Part One of this standard to determinewhere thermal shocks are foreseen in the life cycle of the materiel, use the following to confirm the need for thismethod and to place it in sequence with other methods.
2.1.1 Effects of thermal shock environments.
Effects of thermal shocks are usually more severe near the outer portions of materiel. The further from the surface(depending, of course, on the properties of the material involved), the slower and less significant the thermalchanges. Transit cases, packaging, etc. will lessen the effects of thermal shock on the enclosed materiel even more. Sudden temperature changes may either temporarily or permanently affect operation of materiel. The following areexamples of problems that could result from thermal shock exposure that may relate to the materiel being tested. Consider the following typical problems to help determine if this method is appropriate for the materiel being tested. This list is not intended to be all-inclusive.
a. Physical.
(1) Shattering of glass vials and optical materiel.
(2) Binding or slackening of moving parts.
(3) Cracking of solid pellets or grains in explosives.
(4) Differential contraction or expansion rates or induced strain rates of dissimilar materials.
(5) Deformation or fracture of components.
(6) Cracking of surface coatings.
(7) Leaking of sealed compartments.
(8) Failure of insulation protection.
b. Chemical.
(1) Separation of constituents.
(2) Failure of chemical agent protection.
c. Electrical.
(1) Changes in electrical and electronic components.
(2) Electronic or mechanical failures due to rapid water or frost formation.
(3) Excessive static electricity.
2.1.2 Sequence among other methods.
a. General. See Part One, paragraph 5.5.
b. Unique to this method. Use test item response characteristics and performance determinationinformation obtained from the high and low temperature tests to better define the test conditions to beused for this procedure.
2.2 Selecting Procedures.
This method includes two test procedures, Procedure I (Steady State) and Procedure II (Cyclic). Determine theprocedure(s) to be used.
Downloaded from http://www.everyspec.com on 2012-06-04T5:34:26.
MIL-STD-810F1 January 2000
METHOD 503.4503.4-3
2.2.1 Procedure selection considerations.
When selecting procedures, consider:
a. The expected exposure temperatures in service.
b. The materiel's logistic or deployment configuration.
c. Environmental stress screening (ESS) requirements.
2.2.2 Difference between procedures.
While both procedures involve temperature conditioning and performance testing, they differ on the basis oftemperature stabilization prior to shocks.
a. Procedure I - Steady State. Procedure I employs constant temperature at each of the extreme shockconditions because, in many instances, the thermal shock itself so outweighs the other thermal effects thatthe test may be performed using two constant temperatures. This is particularly the case when moresevere shocks are desired, such as for evaluation of safety or initial design, and when extreme values willbe used.
b. Procedure II - Cyclic. When a careful simulation of a real environment is required, use Procedure IIbecause the upper temperature follows part of an appropriate diurnal cycle. From the requirementsdocuments determine the function (operational requirement) to be achieved by the materiel and adefinition of the circumstances responsible for the thermal shock.
2.3 Determine Test Levels and Conditions.
Having selected this method and relevant procedures (based on the test item's requirements documents and thetailoring process), complete the tailoring process by identifying appropriate parameter levels and applicable testconditions and techniques for these procedures. Base these selections on the requirements documents, the Life CycleEnvironmental Profile, Operational Environment Documentation (see Part One, figure 1-1), stress screeningrequirements and information provided with this procedure. Consider tailoring known service extreme temperaturesif the intent of the test is to reproduce induced strain rates found in service. Use values other than those suggested ifrealistic. Consider the following when selecting test levels. This method addresses several exposure situations: aircraft flight exposure, air delivery - desert, and ground transfer or air delivery - arctic. Based on the anticipateddeployment, determine which test variation is applicable. The extreme exposure range should determine the testconditions, but extend the test levels as necessary to detect design flaws.
a. Aircraft flight exposure. This is appropriate if the materiel is to be exposed to desert or tropical groundheat and possible direct solar heating and, a few minutes later, exposed to the extreme low temperaturesassociated with high altitude.
b. Air delivery - desert. This is appropriate for materiel which is delivered over desert terrain fromunheated, high-altitude aircraft, but use the ambient air temperature (no solar loading).
c. Ground transfer or air delivery - arctic. This is intended to test materiel for the effects of movement toand from heated storage, maintenance, or other enclosures or a heated cargo compartment in coldregions.
d. Engineering design. This is used to detect marginal design issues.e. ESS. ESS is used for evaluating workmanship practices.
2.3.1 Climatic conditions.
Identify the appropriate climatic conditions for the geographic areas in which the materiel will be operated andstored. Actual response temperatures achieved when materiel is exposed to the climatic conditions of the variousground climatic categories could be obtained from the test results of high and low temperature exposure (methods501.4, 502.4, and 505.4) for either the operational or storage configuration. The latter assumption must take intoaccount the induced effects of solar radiation during storage and transit in various climates.
Downloaded from http://www.everyspec.com on 2012-06-04T5:34:26.
MIL-STD-810F1 January 2000
METHOD 503.4503.4-4
2.3.2 Exposure conditions.
Select the test temperatures from field data or from the requirements documents, if available. If not available,determine the test temperatures from the anticipated deployment application or world areas in which the materiel willbe deployed, or from the most extreme nonoperating temperature requirements. Except for stress screeningpurposes, recommend using a range of temperatures that reflects that anticipated in service rather than some arbitraryextreme range.
a. Deployment application (aircraft flight exposure). The thermal stresses and rates that materiel willexperience during exposure to the air flight operational environment are dependent upon the ambientconditions, flight conditions, and performance of the onboard environmental control systems. Thetemperature and humidity at various altitudes can be found in MIL-HDBK-310.
b. Air delivery/airdrop. The test conditions for this exposure are based upon the probable conditions in thecargo compartment of the aircraft (or other transport location) and on the ground at the point of impact. Use a lower temperature extreme that assumes an unheated, unpressurized aircraft cargo compartmentwith the aircraft at an altitude of 8 kilometers (26,200 ft). This is the limiting altitude for cargo aircraftbecause of oxygen-pressure requirements when the aircraft cargo compartment is unpressurizedimmediately before airdrop operations. The temperature at this altitude can be found in MIL-HDBK-310. Determine the high temperature surface extremes from the appropriate tables in method 501.4. NOTE: Materiel packaging will normally mitigate thermal shocks. The air delivery/airdrop scenariomay not involve significant thermal shock to the materiel itself.
c. Ground transfer/air delivery - arctic. The conditions developed for heated enclosures located in coldregions are 21qC (70qF) and 25 percent relative humidity. These conditions roughly correspond tonormal heating practices in the Arctic and on aircraft. Base selection of the outside ambient conditionsupon the climatic categories or areas listed in the appropriate table in method 502.4.
d. Engineering design. Use test conditions that reflect the extreme anticipated storage conditions.
2.3.3 Test duration (number of shocks).
For materiel that is likely to be exposed only rarely to thermal shock, perform one shock for each appropriatecondition. There is little available data to substantiate a specific number of shocks when more frequent exposure isexpected. In lieu of better information, apply three shocks or more at each condition, the number dependingprimarily on the anticipated service events. The objective of this test is to determine the effect of rapid temperaturechanges on the materiel. Therefore, expose the test item to the temperature extremes for a duration equal to eitherthe actual operation (i.e., actual flight time) or to that required to achieve temperature stabilization.
2.3.4 Extreme high temperature exposure.
Materiel is likely to experience the highest heating during storage in the sun in the Hot Dry and Basic Hot climaticregions. Therefore, conduct transitions from hot to cold with the test item stabilized at its high storage temperature. Conduct transitions from cold to hot with the high temperature facility’s air temperature at the maximum storagetemperature of the appropriate cycle. Immediately following the cold-to-hot transfer, cycle the high temperaturefacility through the appropriate diurnal cycle (method 501.4) from the beginning of the hour at which the maximumair temperature is experienced until the test item maximum operational response temperature is reached (see method501.4, paragraph 2.3.3b). Other tests, such as stress screening, may require even more extreme temperatures.
2.3.5 Test item configuration.
The configuration of the test item strongly affects test results. Therefore, use the anticipated configuration of theitem during storage, shipment, or use. As a minimum, consider the following configurations:
a. In a shipping/storage container or transit case, and installation of a thermally conditioned item into acontainer conditioned at another temperature.
b. Protected or unprotected.
c. Deployed (realistically or with restraints).
Downloaded from http://www.everyspec.com on 2012-06-04T5:34:26.
MIL-STD-810F1 January 2000
METHOD 503.4503.4-5
d. Modified with kits for special applications.
e. Packaged for airdrop.
2.3.6 Temperature stabilization.
Stabilize the test item temperature (prior to transfer) for as long as necessary to ensure a uniform temperaturethroughout at least the outer portions of the test item.
2.3.7 Relative humidity.
For most test programs, the relative humidity (RH) is not controlled. During the thermal shock test it may, however,have a significant effect on some materiel, e.g., cellulosic materials which are typically porous, into which moisturecan migrate and then expand upon freezing. Do not attempt to control relative humidity unless specifically required.
2.3.8 Transfer time.
Ensure the transfer time reflects the time associated with the actual thermal shock in the life cycle profile. It shouldbe as rapid as possible, but if the transfer takes more than one minute, justify the extra time.
2.4 Special Considerations.
The test conditions as presented in this procedure are intended to be in general agreement with other extremesdescribed in this document. The primary purpose in establishing these levels is to provide realistic conditions for thetraverse between the two temperature extremes. Therefore, before transfer, stabilize the test item at the most realistictemperature that would be encountered during the specific operation, or possibly the most extreme test itemstabilization temperature, if appropriate. Consider tailoring known service extreme temperatures, if the intent of thetest is to reproduce induced strain rates found in service.
3. INFORMATION REQUIRED.
3.1 Pretest.
The following information is required to conduct temperature shock tests adequately.
a. General. Information listed in Part One, paragraphs 5.7 and 5.9, and Appendix A, Task 405 of thisstandard.
b. Specific to this method.
(1) Test item configuration.
(2) Test temperature extremes or test item thermal rates of change.
(3) Duration of exposure at each temperature.
(4) Test item response temperature (from method 501.4).
(5) For Procedure II, the high temperature cycle, and the initial temperature for the temperature cycling.
(6) The component/assembly/structure to be used for thermal response and temperature stabilizationpurposes (if required). (See Part One, paragraph 5.4.)
3.2 During Test.
For test validation purposes, record deviations from planned or pre-test procedures or parameter levels, includingany procedural anomalies that may occur.
3.3 Post-test.
Record the following post-test information.
a. General. Information listed in Part One, paragraph 5.13, and in Appendix A, Task 406 of this standard.
Downloaded from http://www.everyspec.com on 2012-06-04T5:34:26.
MIL-STD-810F1 January 2000
METHOD 503.4503.4-6
b. Specific to this method.
(1) Previous test methods to which the specific test item has been exposed.
(2) Duration of each exposure.
(3) Status of the test item for each visual examination.
(4) Test temperatures.
(5) Results of operational checks.
(6) Transfer times (e.g., "door open" to "door closed").
4. TEST PROCESS.
4.1 Test Facility.
4.1.1 Apparatus.
The required apparatus consists of two chambers or cabinets, or a two-celled chamber in which the test conditionscan be established and maintained. Unless otherwise specified, use chambers equipped so that, after transfer of thetest item, the test conditions within the chamber can be stabilized within five minutes. Use materiel handlingequipment, if necessary, for transfer of the test item between chambers.
4.1.2 Instrumentation.
Use chambers equipped with auxiliary instrumentation capable of monitoring (see Part One, paragraph 5.18) the testconditions throughout an envelope of air surrounding the test item(s). (See Part One, paragraph 5.3.) Quick-disconnect thermocouples may be necessary for monitoring test item conditions following changes.
4.2 Controls.
4.2.1 Temperature.
Unless otherwise specified in the test plan, if any action other than test item operation (such as opening of thechamber door, except at transfer time) results in a significant change (more than 2qC (3.6qF)) of the test itemtemperature or chamber air temperature, stabilize the test item at the required temperature before continuation.
4.2.2 Air velocity.
Unless justified by the materiel's platform environment, and to provide standard testing conditions, use an airvelocity that does not exceed 1.7 m/s (335 ft/min) in the vicinity of the test item.
4.2.3 Transfer time.
Transfer the test item between the two environments (high and low temperatures) as rapidly as possible but in nomore than five minutes (unless the test item is large and requires handling equipment). If the transfer requires morethan five minutes, re-assess the need for a thermal shock test.
4.3 Test Interruption.
a. General. See Part One, paragraph 5.11 of this standard.
b. Specific to this method.
(1) Undertest interruption. If, before the temperature change, an unscheduled test interruption occursthat causes the test conditions to exceed allowable tolerances toward standard ambient temperatures,reinitiate the test at the point of interruption and reestablish the test item at the test condition. If the
Downloaded from http://www.everyspec.com on 2012-06-04T5:34:26.
MIL-STD-810F1 January 2000
METHOD 503.4503.4-7
interruption occurs during the transfer, reestablish the test item at the previous temperature and thentransfer.
(2) Overtest interruption. Follow any interruption that results in more extreme exposure of the test itemthan required by the materiel specification by a complete physical examination and operationalcheck of the test item (where possible) before any continuation of testing. This is especially truewhere a safety problem could exist, such as with munitions. If a problem is discovered, thepreferable course of action is to stop the test and start over with a new test item. If this is not doneand test item failure occurs during the remainder of the test, the test results could be invalid due tothe overtest condition. If no problem is discovered, reestablish pre-interruption conditions andcontinue from the point where the test tolerances were exceeded.
4.4 Test Execution.
The following steps, alone or in combination, provide the basis for collecting necessary information concerning themateriel's susceptibility to temperature shock.
4.4.1 Preparation for test.
4.4.1.1 Preliminary steps.
Before starting the test, review pretest information in the test plan to determine test details (e.g., procedures, test itemconfiguration, temperature levels, cycles, temperature stabilization determination, durations, etc.). (See paragraph3.1 above.)
4.4.1.2 Pretest standard ambient checkout.
All test items require a pretest standard ambient checkout to provide baseline data. Examine munitions and otherappropriate materiel by nondestructive examination methods. Conduct the checkout as follows:
Step 1. Stabilize the test item at standard ambient conditions (Part One, paragraph 5.1).
Step 2. Conduct a complete visual examination of the test item (evaluate against paragraph 2.1.1) withspecial attention to stress areas such as corners of molded areas and interfaces between differentmaterials (e.g., component lead/ceramic interfaces of visible electronic parts), and document theresults for comparison with post test data.
Step 3. Conduct an operational checkout in accordance with the approved test plan and record the results.
Step 4. If the test item operates satisfactorily, proceed to the next Step. If not, resolve the problems andrestart at Step 1, above.
Step 5. Prepare the test item in accordance with Part One, paragraph 5.8 and in the required test itemconfiguration.
4.4.2 Procedures.
The following procedures provide the basis for collecting the necessary information concerning the materiel in asevere temperature shock environment. The procedures depicted on figures 1 and 2 arbitrarily begin with the lowertemperature, but could be reversed to begin with the higher temperature if it is more realistic. Specific points onfigures 1 and 2 (in parentheses) are referenced in the following text.
Downloaded from http://www.everyspec.com on 2012-06-04T5:34:26.
MIL-STD-810F1 January 2000
METHOD 503.4503.4-8
4.4.2.1 Procedure I - Shock from constant extreme temperatures. (Figure 503.4-1.)
Step 1. With the test item in the chamber, adjust the chamber air temperature to the low temperatureextreme specified in the test plan (a). Maintain this temperature for a period as determined in thetest plan (a-b).
Step 2. Transfer the test item in no more than one minute (b-c) to an atmosphere at temperature T2 thatwill produce the thermal shock specified in the test plan, and maintain this temperature as specifiedin the test plan (c-e).
Step 3. If required in the test plan, evaluate the effects of the thermal shock on the test item to the extentpracticable.
Step 4. If other cycles in reversed directions are required, transfer the test item to the T1 environment inless than one minute (e-f) and stabilize as required in the test plan (f-b), evaluate the thermal shockeffects (if required), and continue as in steps 2 and 3 above. If other one way shocks are required,return the test item to the T1 environment at a rate of not more than 3qC/minute and repeat Steps 1-3. If no other shocks are required, go to Step 5.
Step 5. Return the test item to standard ambient conditions. Step 6. Examine the test item and, if appropriate, operate. Record the results for comparison with pretest
data.
4.4.2.2 Procedure II - Shock to/from cyclic high temperatures. (Figure 503.4-2.)
Step 1. With the test item in the chamber, adjust the chamber air temperature to the low temperatureextreme specified in the test plan (a) at a rate not to exceed 3qC/min. Maintain this temperature fora period as determined in the test plan (a-b).
Step 2. Transfer the test item to the maximum air temperature of the high temperature cycle (c) (asspecified in the test plan) in no more than one minute. As soon as the chamber door is closed andthe chamber recovers to the peak temperature, cycle the chamber through part of the appropriatediurnal cycle until the chamber air temperature reaches the test item response temperature (d)(obtained from method 501.4, paragraph 2.3.3b). Maintain this temperature as specified in the testplan (d-e).
Step 3. If no other cycles are required, return the test item to standard ambient conditions and proceed toStep 7.
Step 4. Transfer the test item to the lower temperature environment (f) in no more than one minute andstabilize as required in the test plan (f-h). If other cycles are required, proceed to Step 6.
Step 5. If no other cycles are required, return the test item to standard ambient conditions, and proceed toStep 7.NOTE: Unless the requirements documents indicate otherwise, if the test procedure is interruptedbecause of work schedules, etc., maintaining the test item at the test temperature for the timerequired will facilitate completion of the test when resumed. If the temperature is changed, beforecontinuing the test, restabilize the test item at the temperature of the last successfully completedperiod before the interruption.
Step 6. Repeat steps 2, 3, and 4 as specified in the test plan. Step 7. Examine the test item and, if appropriate, operate. Record the results for comparison with pretest
data.
5. ANALYSIS OF RESULTS.
Follow the guidance provided in Part One, paragraph 5.14, to assist in the evaluation of the test results. Analyze anyfailure of a test item to meet the requirements of the materiel specifications.
Downloaded from http://www.everyspec.com on 2012-06-04T5:34:26.

MIL-STD-810F1 January 2000
METHOD 503.4503.4-9
6. REFERENCE/RELATED DOCUMENTS.
a. MIL-HDBK-310, Global Climatic Data for Developing Military Products.
b. NATO STANAG 2895, Extreme Climatic-Conditions and Derived Conditions for Use in DefiningDesign/Test Criteria for NATO-Forces Materiel.
c. STANAG 4370, Environmental Testing.
d. Allied Environmental Conditions and Test Publication 300, Climatic Environmental Testing (underSTANAG 4370).
Downloaded from http://www.everyspec.com on 2012-06-04T5:34:26.

MIL-STD-810F1 January 2000
METHOD 503.4503.4-10
FIGURE 503.4-1. Shocks from constant extreme temperature.
FIGURE 503.4-2. Shocks from cyclic high temperature.
Downloaded from http://www.everyspec.com on 2012-06-04T5:34:26.
MIL-STD-810F1 January 2000
METHOD 504504-1
METHOD 504
CONTAMINATION BY FLUIDSNOTE: Tailoring is essential. Select methods, procedures, and parameter levels based on the tailoring processdescribed in Part One, Paragraph 4.2.2, and Appendix C. Apply the general guidelines for laboratory test methodsdescribed in Part One, paragraph 5 of this standard.
1. SCOPE.
1.1 Purpose.Use contamination by fluids tests to determine if materiel is unacceptably affected by temporary exposure tocontaminating fluids (liquids) such as may be encountered during its life cycle, either occasionally1/, intermittently2/,or over extended periods3/.
1.2 Application.Select the tests described in this method when there is a high probability of fluid contamination during the life cycleof the materiel. Contamination may arise from exposure to fuels, hydraulic fluids, lubricating oils, solvents, andcleaning fluids, de-icing and anti-freeze fluids, runway de-icers, insecticides, disinfectants, coolant dielectric fluid,and fire extinguishants.
WARNING: THIS METHOD REQUIRES THE USE OF SUBSTANCES AND/OR TEST PROCEDURES THATMAY HAVE AN ENVIRONMENTAL IMPACT OR BE INJURIOUS TO HEALTH, IF ADEQUATEPRECAUTIONS ARE NOT TAKEN. ADDITIONAL INFORMATION IS PROVIDED IN ANNEX A. REFERTO THE SUPPLIER'S MATERIAL SAFETY DATA SHEET (MSDS) OR EQUIVALENT FOR CHEMICALCOMPATABILITY AND HEALTH HAZARD DATA ON THE VARIOUS CHEMICALS USED, ANDCOORDINATE WITH LOCAL ENVIRONMENTAL AUTHORITIES. ENSURE ALL POST-TEST MATERIALSARE DISPOSED OF IN ACCORDANCE WITH LOCAL, STATE AND FEDERAL REGULATIONS.
1.3 Limitations.This test is not intended to demonstrate the suitability of materiel to perform during continuous contact with a fluid,e.g., an immersed fuel pump, nor should it be used to demonstrate resistance to electrolytic corrosion.
2. TAILORING GUIDANCE.
2.1 Selecting the Contamination by Fluids Method.After examining requirements documents and applying the tailoring process in Part One of this standard todetermine where exposure to contaminating fluids is foreseen in the life cycle of the test item, use the following toconfirm the need for this method and to place it in sequence with other methods. For specifically testing small armssystems, consider using Test Operations Procedure (TOP) 3-2-609.
2.1.1 Effects of the contaminating fluids environment.During its life cycle, materiel may be accidentally or intentionally exposed to one or more fluids that could have anadverse effect on the materiel. As a result, exposure of materiel to contaminating fluids may either temporarily orpermanently impair the operation of the materiel by changing the physical properties of the material(s) composing it.Consider the following typical examples of problems to help determine if this method is appropriate for the materielbeing tested. The list is not intended to be all-inclusive and some of the examples may overlap.
a. Packaging failure.
b. Crazing or swelling of plastics and rubbers.
1/ Extraordinary/unusual circumstances occurring once or twice a year.2/ Regular basis under normal operation; possibly seasonally over the life of the materiel.3/ Long periods such that materiel is thoroughly exposed.
Downloaded from http://www.everyspec.com on 2012-06-04T5:34:26.
MIL-STD-810F1 January 2000
METHOD 504504-2
c. Leeching of antioxidants and other soluble materials.
d. Seal or gasket failures.
e. Adhesion failures.
f. Paint/legend removal.
g. Corrosion.
h. Melting or decomposition.
2.1.2 Sequence among other methods.
a. General. See Part One, paragraph 5.5.
b. Unique to this method. Do not perform these tests prior to other climatic environmental tests because ofpotential effect of the contaminants or their removal by decontaminants.
2.2 Selecting Procedure Variations.This method has one procedure. Possible variations are described below. The most significant parameters used inthis test method are the fluid to be used, the temperature, and duration of exposure. It is also important in this testprocedure to specify the operational configuration of the test item, as well as whether or not the test item is heatdissipating during operation.
2.2.1 Length of exposure.There are three options provided in the test procedure: occasional contamination, intermittent contamination, andextended contamination (paragraph 1.1). From the requirements document, determine the option to be used basedon the anticipated life cycle scenario, along with the order of application of the test fluids if more than one isrequired.
2.2.2 Contaminant fluid groups. (See paragraph 2.2.3 below.)
The following groups of fluids are listed in table 504-I.
2.2.2.1 Fuels.Fuels will, for the most part, be of the gasoline or kerosene type, and whereas the former may be expected toevaporate rapidly - possibly with few permanently harmful effects, the latter - being more persistent - can bedamaging to many elastomers, particularly at elevated temperatures. Paints and most plastics are normally notaffected by fuels, but silicone resin bonded boards may tend to de-laminate after prolonged exposure. Some fuelsmay have additives to inhibit icing or to dissipate static charges. Where there is reason to believe that theseadditives may increase the severity of the test, include them in the test fluids.
2.2.2.2 Hydraulic fluids.Commonly used hydraulic fluids may be of the mineral oil or ester-based synthetic type. The latter are damaging tomost elastomers and to plastics; phosphate esters are especially damaging to these materials and to paint finishes.
2.2.2.3 Lubricating oils.Mineral or synthetic-based lubricating oils may be at elevated temperatures in their working states. Mineral oil isdamaging to natural rubber but less so to synthetics such as polychloroprene, chloro-sulphonated polyethylene, andsilicone rubber. Synthetic lubricants are extremely damaging to plastics such as PVC as well as to many elastomers.
2.2.2.4 Solvents and cleaning fluids.Many areas of aircraft or vehicles may require dirt or grease removal before servicing can begin. The fluids given intable I are representative of those presently in use.
Downloaded from http://www.everyspec.com on 2012-06-04T5:34:26.
MIL-STD-810F1 January 2000
METHOD 504504-3
2.2.2.5 De-icing and anti-freeze fluids.These fluids may be applied, often at elevated temperatures, to the leading edges, intakes, etc., of aircraft and maypenetrate areas where they can contaminate components and materiel. These fluids are based, typically, on inhibitedethylene glycols.
2.2.2.6 Runway de-icers.These fluids are used on runways and other areas to lower the freezing point of water. They may penetrate theundercarriage and equipment bays of aircraft as a fine mist.
2.2.2.7 Insecticides.Aircraft flying in and through the tropics may be treated with insecticide sprays as a routine precaution. While it isunlikely that these will have a directly adverse effect on materiel, it may be necessary to make exploratory testsusing a proprietary insecticide.
2.2.2.8 Disinfectants.The primary contaminating agent is likely to be the disinfectant used, which will be a formaldehyde/phenolpreparation, and its use on waste liquid in/from galleys and toilet compartments, where a leak may permitcontamination of materiel below the leak.
2.2.2.9 Coolant dielectric fluids.These are used as thermal transfer liquids to assist cooling of certain equipment. They are usually based on silicateester materials, and their effects on materials may be considered to be similar to the phosphate ester hydraulic fluids,although not quite as severe.
2.2.2.10 Fire extinguishants.Halon (chloro bromo fluoro hydrocarbon) or similar compounds are likely to be used on aircraft, and will berelatively short-lived. Ground-based extinguishants are aqueous foams derived from fluoro chemicals orfluoroproteins. Their effects will be mainly due to water or buildup of trapped residues. The necessity for testingwith these products is based on the need to maintain equipment functioning after release of the extinguishant.
2.2.3 Test fluid(s).Select the test fluid(s) from those listed in table 504-I which are representative of those commonly encounteredduring the life cycle. Each specified test fluid is the worst case representative of a group of fluids and is the mostlikely to affect the performance of the materiel. In the requirements document, list other fluids identified during thetailoring process as possible contaminants. Service grades of fluids may be changed or modified with developmentformulations and equipment demands. Some may subsequently be found undesirable because of environmental orhealth and safety problems. Table 504-I may be updated as necessary in the future.
2.2.4 Combination of test fluids4/.
When more than one test fluid is to be applied, consider the following:
a. the need to assess the effect of the fluids individually, combined, or in succession.
b. if the order of exposure to fluids in service is known, or if the order of exposure to fluids recognized ashaving synergistic effects is known and is realistic in service, specify this order.
c. if the test item should be cleaned between or after tests, or if a new test item should be used for each testfluid. Choice of cleaning fluid should not result in further contamination. Some of the specified test fluidsmay be used as cleaning fluids (e.g., aviation fuel, solvents, or cleaning fluids), otherwise use a fluid knownto be used in normal cleaning procedures.
4/ When mixing two or more fluids, ensure they are compatible and will not produce hazardous reactions.
Downloaded from http://www.everyspec.com on 2012-06-04T5:34:26.
MIL-STD-810F1 January 2000
METHOD 504504-4
2.2.5 Test temperature.Use temperatures representative of the actual conditions under which fluid contamination can occur eitherintentionally or accidentally. The application of contaminating fluids could result in thermal shock as well ascontamination effects.
2.2.5.1 Test item temperature.Use a test item temperature representative of the materiel temperature when exposed to the contaminating fluid. Forexample, materiel to be de-iced will most likely be at or below freezing; materiel exposed to hydraulic leaks whileon the tarmac may have surface temperatures above 50qC.
2.2.5.2 Test fluid temperature.In most cases, use the temperature of the test fluid equal to its temperature during its most extreme operatingcondition. Design assessment may prove that other temperatures provide a more severe environment, e.g., longerexposure at lower temperatures because of slower evaporation. Table I includes worst-case test fluid temperatures.
2.2.5.3 Soak temperature.In order for contamination effects to mature, a soak of the test item following contamination is necessary. Thetemperature of both the contaminating fluid and the materiel will, most likely, change during actual contaminationsituations. The post-contamination soak will not necessarily reflect the exposure scenario, but rather the worst-caseeffect(s) on the materiel. Accordingly, for the soak temperature, use the materiel's maximum life cycle temperaturefor the anticipated exposure situation.
2.2.6 Soak duration.Unless otherwise justified, expose the contaminated test item to the required soak temperature (paragraph 2.2.5.3)for a minimum of 8 hours.
3. INFORMATION REQUIRED.
3.1 Pretest.The following information is required to conduct contamination by fluid tests adequately.
a. General. Information listed in Part One, paragraphs 5.7 and 5.9, and Appendix A, Task 405 of thisstandard.
b. Specific to this method.
(1) The test fluid(s) to be used and its temperature.
(2) The method of test fluid application.
(3) The soak (post-wetting) temperature and duration.
(4) The cleaning/decontaminating fluids.
(5) The sequence of test fluid applications and post-test cleaning instructions.
(6) The type of exposure, i.e., occasional, intermittent, or extended.
(7) Any requirement for long term surveillance and inspections.
(8) Material properties, e.g., tensile strength, hardness, weight, dimensions, etc., of the material likely tobe affected by the contaminating fluids.
3.2 During Test.Collect the following information during conduct of the test:
a. General. Information listed in Part One, paragraph 5.10, and in Appendix A, Task 406 of this standard.
b. Specific to this method.
Downloaded from http://www.everyspec.com on 2012-06-04T5:34:26.
MIL-STD-810F1 January 2000
METHOD 504504-5
(1) Record of chamber temperature versus time conditions.
(2) Test fluid(s) and the corresponding temperature.
(3) Any deterioration noted during visual checks.
3.3 Post Test.The following post test information is required.
a. General. Information listed in Part One, paragraph 5.13, and in Appendix A, Task 406 of this standard.
b. Specific to this method.
(1) Results of each functional check after each exposure to each of the specified fluids.
(2) Any degradation of materials, protective finishes, etc. (see paragraph 3.1b(8)).
(3) Immersion times and exposure type.
4. TEST PROCESS.
4.1 Test Facility.Use a test facility that includes an enclosure and a temperature control mechanism designed to maintain the test itemat a specified temperature, as well as a means of monitoring the prescribed conditions (see Part One, paragraph5.18). The contamination facility is a tank within the test enclosure (non-reactive with the contaminant) in whichthe test item is exposed to the selected contaminant by immersion, spraying, splashing, or brushing. Design thetemperature control mechanism to maintain the test item at the specified temperature. When the flash point of thetest fluid is lower than the test temperature, design the test facility in accordance with fire and explosion standards.
4.2 Controls.Ensure the test and cleaning (decontaminating) fluids are handled and disposed of as required by localenvironmental and safety requirements. Some test fluid specifications are referenced in table 504-I.
4.3 Test Interruption.
a. General. See Part One, paragraph 5.11, of this standard.
b. Specific to this method.
(1) Undertest interruption. If an unscheduled test interruption occurs that causes the test conditions toexceed allowable tolerances toward standard ambient conditions, give the test item a completevisual examination and develop a technical evaluation of the impact of the interruption on the testresults. Restart the test at the point of interruption and restabilize the test item at the test conditions.
(2) Overtest interruption. If an unscheduled test interruption occurs that causes the test conditions toexceed allowable tolerances away from standard ambient conditions, stabilize the test conditions towithin tolerances and hold them at that level until a complete visual examination and technicalevaluation can be made to determine the impact of the interruption on test results. If the visualexamination or technical evaluation results in a conclusion that the test interruption did notadversely affect the final test results, or if the effects of the interruption can be nullified withconfidence, restabilize the pre-interruption conditions and continue the test from the point where thetest tolerances were exceeded. Otherwise, restart the test with a new test item.
4.4 Test Setup.
a. General. See Part One, paragraph 5.8.
b. Unique to this method. Ensure collection containers are available for each test fluid and waste fluids.
Downloaded from http://www.everyspec.com on 2012-06-04T5:34:26.
MIL-STD-810F1 January 2000
METHOD 504504-6
4.5 Test Execution.The following test procedure may be used to determine the resistance of the materiel to contaminating fluids.Conduct the functional checks after each exposure to each of the specified fluids.
4.5.1 Preparation for test.
4.5.1.1 Preliminary steps.Before starting the test procedure, determine the test details (e.g., procedure variations, test item configuration,contaminating fluids, durations, parameter levels, etc.) from the test plan. (See paragraph 3.1 above.)
4.5.1.2 Pretest standard ambient checkout.All test items require a pretest standard ambient checkout to provide baseline data. Examine munitions and otherappropriate materiel by nondestructive examination methods. Conduct the checkout as follows:
Step 1. Stabilize the test item at standard ambient conditions (Part One, paragraph 5.1).Step 2. Conduct a complete visual examination of the test item (evaluate against paragraph 2.1.1) with
special attention to stress areas such as corners of molded areas and interfaces between differentmaterials (e.g., component lead/ceramic interfaces of visible electronic parts), and document theresults for comparison with post test data.
Step 3. Conduct an operational checkout in accordance with the approved test plan and record the results.Step 4. If the test item operates satisfactorily, proceed to the next Step. If not, resolve the problems and
restart at Step 1, above.Step 5. Prepare the test item in accordance with Part One, paragraph 5.8 and in the required test item
configuration.
4.5.1.3 Cleaning.If necessary and, unless otherwise specified, clean the test item to remove unrepresentative coatings or deposits ofgrease.
4.5.1.4 Multiple fluids.If more than one contaminating fluid has been identified, determine if each is to be evaluated simultaneously orsequentially. If sequential testing is required, specify in the requirements document any necessary cleaning methodbetween tests for different contaminants. Check the supplier’s material safety data sheet for chemical compatibility.
4.5.2 Procedure.Step 1. With the test item in its required configuration (operational, storage, etc.), install it in the test
facility. If appropriate, the configuration may include appropriate electrical or mechanicalconnections.
Step 2. If appropriate, perform an operational check and record data for comparison with post test data.Step 3. Stabilize the test item at the appropriate temperature for the identified contamination scenario (see
paragraph 2.2.5).Step 4. Stabilize the temperature of the specified fluid(s) to that determined from paragraph 2.2.5.2. If
simultaneous application of more than one fluid is required, apply the fluid with the highestapplication temperature first, then the next highest, and so on until all required fluids have beenapplied5/. If sequential, complete steps 4-9 for the first fluid. Apply the second fluid and repeat,etc.a. For occasional contamination, apply the specified fluid(s) (e.g., dip, spray, etc.) to the entire
surface of the test item that is likely to be exposed.
b. For intermittent contamination, apply the specified fluid(s) (e.g., dip, spray, etc.) to the entiresurface of the test item that is likely to be exposed. Repeat this procedure one or more timesas necessary to maintain all the test item surfaces in a wetted condition for the periodspecified in the requirements document. If not specified, subject the test item to three 24-hour
5/Before mixing two or more fluids, ensure they are compatible and will not produce a hazardous reaction.
Downloaded from http://www.everyspec.com on 2012-06-04T5:34:26.
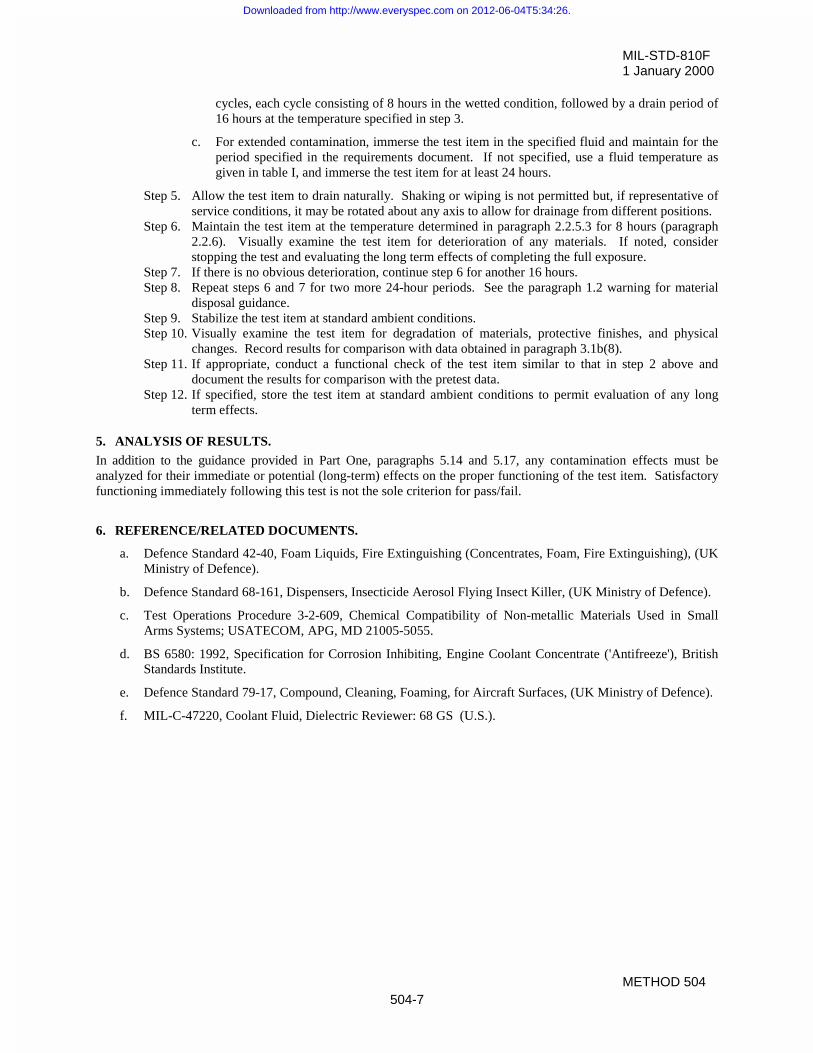
MIL-STD-810F1 January 2000
METHOD 504504-7
cycles, each cycle consisting of 8 hours in the wetted condition, followed by a drain period of16 hours at the temperature specified in step 3.
c. For extended contamination, immerse the test item in the specified fluid and maintain for theperiod specified in the requirements document. If not specified, use a fluid temperature asgiven in table I, and immerse the test item for at least 24 hours.
Step 5. Allow the test item to drain naturally. Shaking or wiping is not permitted but, if representative ofservice conditions, it may be rotated about any axis to allow for drainage from different positions.
Step 6. Maintain the test item at the temperature determined in paragraph 2.2.5.3 for 8 hours (paragraph2.2.6). Visually examine the test item for deterioration of any materials. If noted, considerstopping the test and evaluating the long term effects of completing the full exposure.
Step 7. If there is no obvious deterioration, continue step 6 for another 16 hours.Step 8. Repeat steps 6 and 7 for two more 24-hour periods. See the paragraph 1.2 warning for material
disposal guidance.Step 9. Stabilize the test item at standard ambient conditions.Step 10. Visually examine the test item for degradation of materials, protective finishes, and physical
changes. Record results for comparison with data obtained in paragraph 3.1b(8).Step 11. If appropriate, conduct a functional check of the test item similar to that in step 2 above and
document the results for comparison with the pretest data.Step 12. If specified, store the test item at standard ambient conditions to permit evaluation of any long
term effects.
5. ANALYSIS OF RESULTS.In addition to the guidance provided in Part One, paragraphs 5.14 and 5.17, any contamination effects must beanalyzed for their immediate or potential (long-term) effects on the proper functioning of the test item. Satisfactoryfunctioning immediately following this test is not the sole criterion for pass/fail.
6. REFERENCE/RELATED DOCUMENTS.
a. Defence Standard 42-40, Foam Liquids, Fire Extinguishing (Concentrates, Foam, Fire Extinguishing), (UKMinistry of Defence).
b. Defence Standard 68-161, Dispensers, Insecticide Aerosol Flying Insect Killer, (UK Ministry of Defence).
c. Test Operations Procedure 3-2-609, Chemical Compatibility of Non-metallic Materials Used in SmallArms Systems; USATECOM, APG, MD 21005-5055.
d. BS 6580: 1992, Specification for Corrosion Inhibiting, Engine Coolant Concentrate ('Antifreeze'), BritishStandards Institute.
e. Defence Standard 79-17, Compound, Cleaning, Foaming, for Aircraft Surfaces, (UK Ministry of Defence).
f. MIL-C-47220, Coolant Fluid, Dielectric Reviewer: 68 GS (U.S.).
Downloaded from http://www.everyspec.com on 2012-06-04T5:34:26.
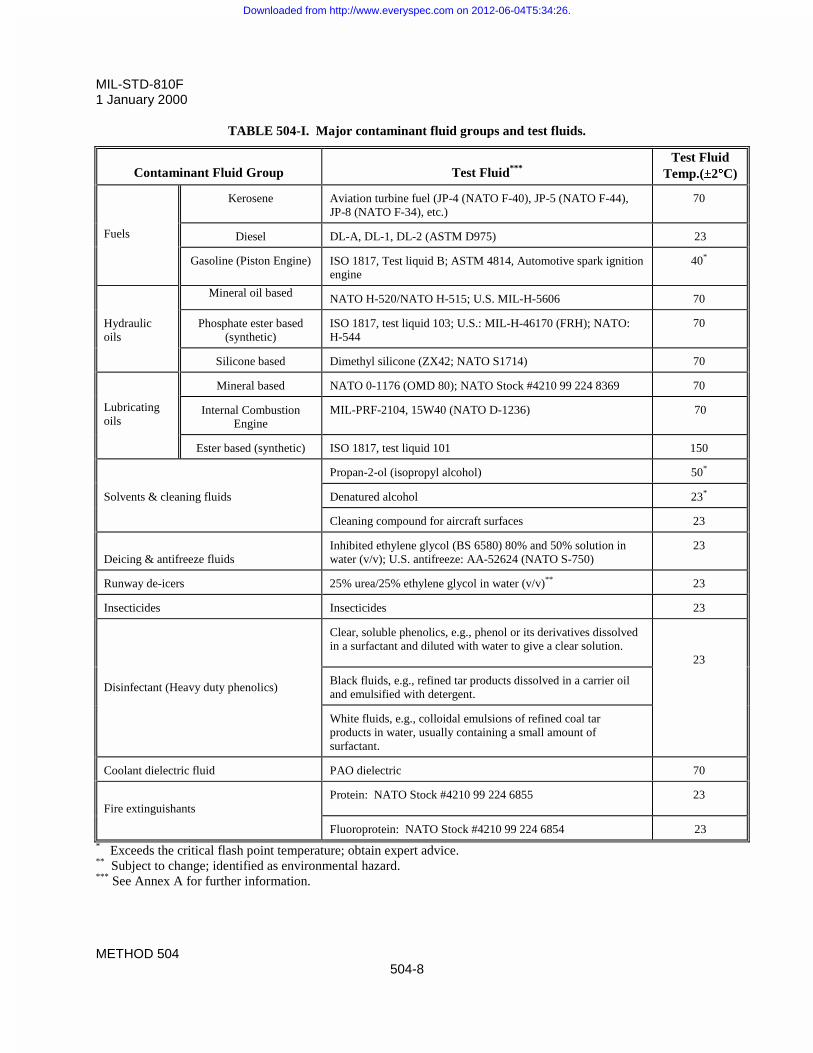
MIL-STD-810F1 January 2000
METHOD 504504-8
TABLE 504-I. Major contaminant fluid groups and test fluids.
Contaminant Fluid Group Test Fluid***Test Fluid
Temp.(rr2qqC)
Kerosene Aviation turbine fuel (JP-4 (NATO F-40), JP-5 (NATO F-44),JP-8 (NATO F-34), etc.)
70
Diesel DL-A, DL-1, DL-2 (ASTM D975) 23Fuels
Gasoline (Piston Engine) ISO 1817, Test liquid B; ASTM 4814, Automotive spark ignitionengine
40*
Mineral oil based NATO H-520/NATO H-515; U.S. MIL-H-5606 70
Hydraulicoils
Phosphate ester based(synthetic)
ISO 1817, test liquid 103; U.S.: MIL-H-46170 (FRH); NATO:H-544
70
Silicone based Dimethyl silicone (ZX42; NATO S1714) 70
Mineral based NATO 0-1176 (OMD 80); NATO Stock #4210 99 224 8369 70
Internal CombustionEngine
MIL-PRF-2104, 15W40 (NATO D-1236) 70Lubricatingoils
Ester based (synthetic) ISO 1817, test liquid 101 150
Propan-2-ol (isopropyl alcohol) 50*
Solvents & cleaning fluids Denatured alcohol 23*
Cleaning compound for aircraft surfaces 23
Deicing & antifreeze fluidsInhibited ethylene glycol (BS 6580) 80% and 50% solution inwater (v/v); U.S. antifreeze: AA-52624 (NATO S-750)
23
Runway de-icers 25% urea/25% ethylene glycol in water (v/v)** 23
Insecticides Insecticides 23
Clear, soluble phenolics, e.g., phenol or its derivatives dissolvedin a surfactant and diluted with water to give a clear solution.
23
Black fluids, e.g., refined tar products dissolved in a carrier oiland emulsified with detergent.
Disinfectant (Heavy duty phenolics)
White fluids, e.g., colloidal emulsions of refined coal tarproducts in water, usually containing a small amount ofsurfactant.
Coolant dielectric fluid PAO dielectric 70
Fire extinguishantsProtein: NATO Stock #4210 99 224 6855 23
Fluoroprotein: NATO Stock #4210 99 224 6854 23* Exceeds the critical flash point temperature; obtain expert advice.** Subject to change; identified as environmental hazard.*** See Annex A for further information.
Downloaded from http://www.everyspec.com on 2012-06-04T5:34:26.
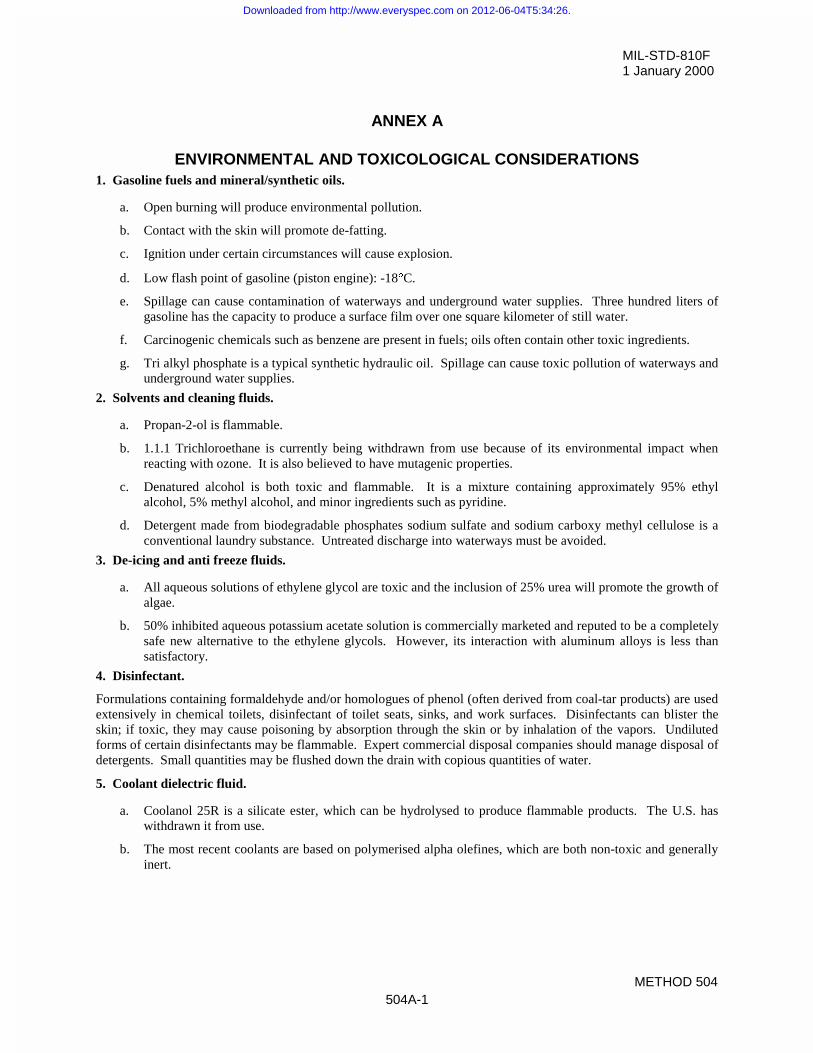
MIL-STD-810F1 January 2000
METHOD 504504A-1
ANNEX A
ENVIRONMENTAL AND TOXICOLOGICAL CONSIDERATIONS1. Gasoline fuels and mineral/synthetic oils.
a. Open burning will produce environmental pollution.
b. Contact with the skin will promote de-fatting.
c. Ignition under certain circumstances will cause explosion.
d. Low flash point of gasoline (piston engine): -18qC.
e. Spillage can cause contamination of waterways and underground water supplies. Three hundred liters ofgasoline has the capacity to produce a surface film over one square kilometer of still water.
f. Carcinogenic chemicals such as benzene are present in fuels; oils often contain other toxic ingredients.
g. Tri alkyl phosphate is a typical synthetic hydraulic oil. Spillage can cause toxic pollution of waterways andunderground water supplies.
2. Solvents and cleaning fluids.
a. Propan-2-ol is flammable.
b. 1.1.1 Trichloroethane is currently being withdrawn from use because of its environmental impact whenreacting with ozone. It is also believed to have mutagenic properties.
c. Denatured alcohol is both toxic and flammable. It is a mixture containing approximately 95% ethylalcohol, 5% methyl alcohol, and minor ingredients such as pyridine.
d. Detergent made from biodegradable phosphates sodium sulfate and sodium carboxy methyl cellulose is aconventional laundry substance. Untreated discharge into waterways must be avoided.
3. De-icing and anti freeze fluids.
a. All aqueous solutions of ethylene glycol are toxic and the inclusion of 25% urea will promote the growth ofalgae.
b. 50% inhibited aqueous potassium acetate solution is commercially marketed and reputed to be a completelysafe new alternative to the ethylene glycols. However, its interaction with aluminum alloys is less thansatisfactory.
4. Disinfectant.
Formulations containing formaldehyde and/or homologues of phenol (often derived from coal-tar products) are usedextensively in chemical toilets, disinfectant of toilet seats, sinks, and work surfaces. Disinfectants can blister theskin; if toxic, they may cause poisoning by absorption through the skin or by inhalation of the vapors. Undilutedforms of certain disinfectants may be flammable. Expert commercial disposal companies should manage disposal ofdetergents. Small quantities may be flushed down the drain with copious quantities of water.
5. Coolant dielectric fluid.
a. Coolanol 25R is a silicate ester, which can be hydrolysed to produce flammable products. The U.S. haswithdrawn it from use.
b. The most recent coolants are based on polymerised alpha olefines, which are both non-toxic and generallyinert.
Downloaded from http://www.everyspec.com on 2012-06-04T5:34:26.

MIL-STD-810F1 January 2000
METHOD 504504A-2
6. Fire extinguishants.
The propellant gases currently used to produce foaming are chloro fluoro hydrocarbons (CFC's). These react withozone and are therefore environmentally destructive.
7. Insecticides.
Most insecticides may be regarded as toxic to man. If the delivery vehicle for the insecticide is a kerosene-type(fuel/oil) spray or mist, many of the features identified under paragraph 1 above will also apply.
Downloaded from http://www.everyspec.com on 2012-06-04T5:34:26.
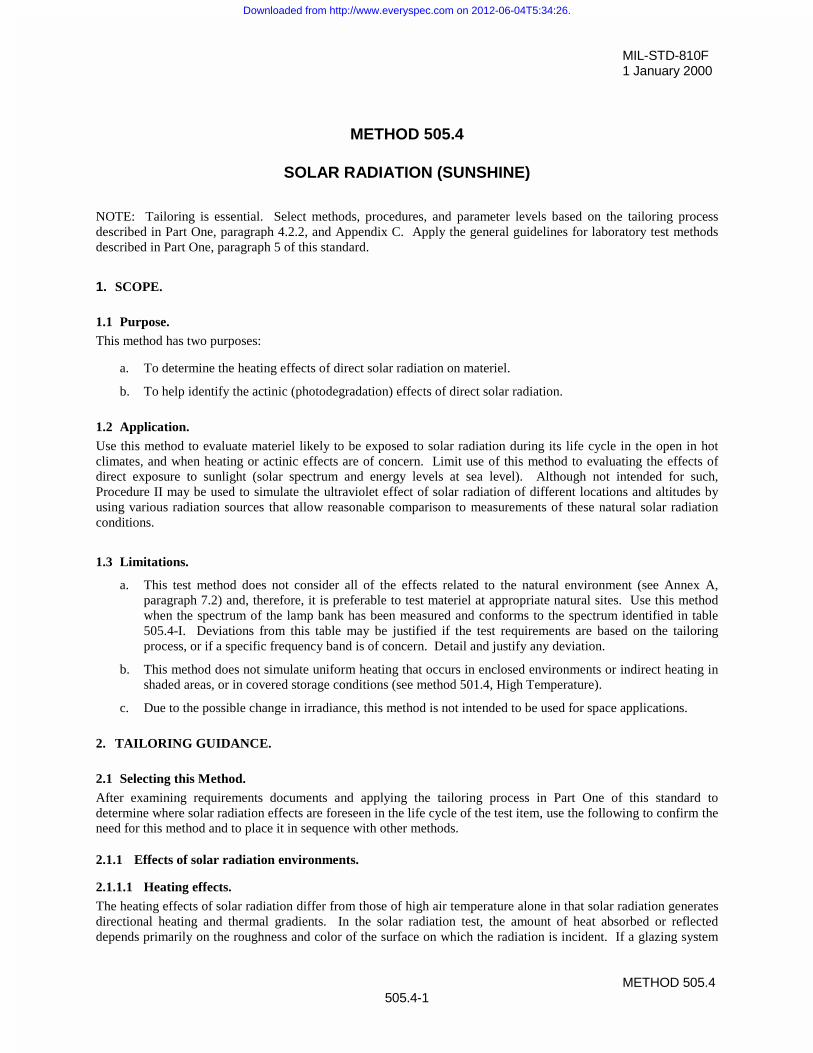
MIL-STD-810F1 January 2000
METHOD 505.4505.4-1
METHOD 505.4
SOLAR RADIATION (SUNSHINE)
NOTE: Tailoring is essential. Select methods, procedures, and parameter levels based on the tailoring processdescribed in Part One, paragraph 4.2.2, and Appendix C. Apply the general guidelines for laboratory test methodsdescribed in Part One, paragraph 5 of this standard.
1. SCOPE.
1.1 Purpose.This method has two purposes:
a. To determine the heating effects of direct solar radiation on materiel.
b. To help identify the actinic (photodegradation) effects of direct solar radiation.
1.2 Application.Use this method to evaluate materiel likely to be exposed to solar radiation during its life cycle in the open in hotclimates, and when heating or actinic effects are of concern. Limit use of this method to evaluating the effects ofdirect exposure to sunlight (solar spectrum and energy levels at sea level). Although not intended for such,Procedure II may be used to simulate the ultraviolet effect of solar radiation of different locations and altitudes byusing various radiation sources that allow reasonable comparison to measurements of these natural solar radiationconditions.
1.3 Limitations.
a. This test method does not consider all of the effects related to the natural environment (see Annex A,paragraph 7.2) and, therefore, it is preferable to test materiel at appropriate natural sites. Use this methodwhen the spectrum of the lamp bank has been measured and conforms to the spectrum identified in table505.4-I. Deviations from this table may be justified if the test requirements are based on the tailoringprocess, or if a specific frequency band is of concern. Detail and justify any deviation.
b. This method does not simulate uniform heating that occurs in enclosed environments or indirect heating inshaded areas, or in covered storage conditions (see method 501.4, High Temperature).
c. Due to the possible change in irradiance, this method is not intended to be used for space applications.
2. TAILORING GUIDANCE.
2.1 Selecting this Method.After examining requirements documents and applying the tailoring process in Part One of this standard todetermine where solar radiation effects are foreseen in the life cycle of the test item, use the following to confirm theneed for this method and to place it in sequence with other methods.
2.1.1 Effects of solar radiation environments.
2.1.1.1 Heating effects.The heating effects of solar radiation differ from those of high air temperature alone in that solar radiation generatesdirectional heating and thermal gradients. In the solar radiation test, the amount of heat absorbed or reflecteddepends primarily on the roughness and color of the surface on which the radiation is incident. If a glazing system
Downloaded from http://www.everyspec.com on 2012-06-04T5:34:26.
MIL-STD-810F1 January 2000
METHOD 505.4505.4-2
is part of the test item configuration, and the component of concern is exposed to solar energy that has passedthrough the glazing system, use a full spectrum source if the glazing system is attenuating the infrared portion of thespectrum. In addition to the differential expansion between dissimilar materials, changes in the intensity of solarradiation may cause components to expand or contract at different rates, which can lead to severe stresses and lossof structural integrity. In addition to those identified in method 501.4, consider the following typical problems tohelp determine if this method is appropriate for the materiel being tested. This list is not intended to be all-inclusive.
a. Jamming or loosening of moving parts.
b. Weakening of solder joints and glued parts.
c. Changes in strength and elasticity.
d. Loss of calibration or malfunction of linkage devices.
e. Loss of seal integrity.
f. Changes in electrical or electronic components.
g. Premature actuation of electrical contacts.
h. Changes in characteristics of elastomers and polymers.
i. Blistering, peeling, and delamination of paints, composites, and surface laminates applied with adhesivessuch as radar absorbent material (RAM).
j. Softening of potting compounds.
k. Pressure variations.
l. Sweating of composite materials and explosives.
m. Difficulty in handling.
2.1.1.2 Actinic effects.In addition to the heating effects of paragraph 2.1.1.1, certain degradation from solar energy may be attributable toother portions of the spectrum, particularly the ultraviolet. Since the rate at which these reactions will occurgenerally increases as the temperature rises, use the full spectrum to adequately simulate the actinic effects of solarradiation. The following are examples of deterioration caused by actinic effects. The list is not intended to becomprehensive.
a. Fading of fabric and plastic color.
b. Checking, chalking, and fading of paints.
c. Deterioration of natural and synthetic elastomers and polymers through photochemical reactions initiatedby shorter wavelength radiation. (High strength polymers such as Kevlar are noticeably affected by thevisible spectrum. Deterioration can be driven by breakage of high-order bonds (such as pi and sigma bondsexisting in carbon chain polymers) by radiation exposure.)
2.1.2 Sequence among other methods.
a. General. See Part One, paragraph 5.5.
b. Unique to this method. Generally, consider applying the solar radiation test at any stage in the testprogram. However, high temperatures or actinic effects could affect material's strength or dimensions thatcould affect the results of subsequent tests such as vibration.
Downloaded from http://www.everyspec.com on 2012-06-04T5:34:26.
MIL-STD-810F1 January 2000
METHOD 505.4505.4-3
2.2 Selecting Procedures.This method includes two test procedures, Procedure I (Cycling (thermal effects)) and Procedure II (Steady State(actinic effects)). Determine the procedure(s) to be used. Either procedure may be used to determine actinic effects,but procedure II reduces the test duration.
2.2.1 Procedure selection considerations.When selecting procedures, consider:
a. The operational purpose of the test item. Physical degradation that occurs during exposure may produceadverse effects on materiel performance or reliability. Based on the purpose of the materiel, determinefunctional modes and test data needed to evaluate the performance of the test item during and afterexposure to solar radiation.
b. The anticipated areas of deployment.
c. The test item configuration.
d. The anticipated exposure circumstances (use, transportation, storage, etc.).
e. The expected duration of exposure to solar radiation.
f. The expected problem areas within the test item.
2.2.2 Difference between procedures.While both procedures involve exposing test items to simulated solar radiation, they differ on the basis of timing andlevel of solar loads, and the focus of the procedure (analyzing heat versus actinic effects). Procedure I (Cycling(thermal effects)) focuses on the effects of heat produced by solar radiation, exposing materiel to continuous 24-hourcycles of simulated solar radiation (or thermal loading) at realistic maximum levels typical throughout the world.Procedure II (Steady State (actinic effects)) is designed to accelerate photo degradation effects produced by solarradiation. This procedure exposes materiel to cycles of intensified solar loads (approximately 2.5 times normallevels) interspersed with dark periods to accelerate actinic effects that would be accumulated over a longer period oftime under normal solar loads. Actual acceleration ratios are material dependent, and 2.5 times the natural solarexposure may not provide equal acceleration. This could, however, provide a more rapid test provided the failuremechanisms follow the path expected in the real environment.
a. Procedure I – Cycling (heating effects). Use Procedure I to investigate response temperatures whenmateriel is exposed in the open in realistically hot climates and is expected to perform without degradationduring and after exposure. Although Procedure I can be performed using simple heat-generating lamps,limited evaluation of actinic effects is possible if Procedure II lamps are used instead. It is preferable to usethe solar radiation test (as opposed to the High Temperature test, method 501.4) when the materiel could beaffected by differential heating (see paragraph 2.1.1.1) or when the levels or mechanisms of heating causedby solar radiation are unknown (this encompasses almost all materiel). Only materials that are of the sameor like color and structure should be analyzed using an infrared source. If a glazing system is incorporatedin the materiel, verify that the infrared transmission is not affected when using an infrared source.Otherwise, use a full spectrum source. It is critical to maintain the minimum airflow necessary to controlthe required air temperature at the test item.
b. Procedure II – Steady State (actinic effects). Use Procedure II to investigate the effects on materiel of longperiods of exposure to sunshine. Actinic effects usually do not occur until materiel surfaces receive largeamounts of sunlight (as well as heat and moisture). Therefore, it is inefficient to use the repeated, longcycles of normal levels of solar radiation (as in Procedure I) to generate actinic effects. Using Procedure Ifor this purpose could take months. The approach, therefore, is to use an accelerated test that is designed toreduce the time to reproduce cumulative effects of long periods of exposure.
(1) The key to using Procedure II successfully is maintaining enough cooling air to prevent the test itemfrom exceeding temperatures that would be attained under natural conditions. However, do not use
Downloaded from http://www.everyspec.com on 2012-06-04T5:34:26.
MIL-STD-810F1 January 2000
METHOD 505.4505.4-4
so much cooling air that it produces unrealistic cooling. This implies that before this test can beperformed, the maximum temperature response the materiel would experience under naturalconditions (by using field/fleet data or as determined by running Procedure I) must be known. IfProcedure I has not been performed previously and no field/fleet data are available, recommend apreliminary test be carried out in accordance with Procedure I (absolute minimum of one completecycle) to determine the approximate maximum response temperature of the test item. If it ispractical, conduct this preliminary test on the entire test item; if not, use a coupon which isrepresentative of the test item's actual color, surface roughness, degree of insulation (any internalheating will need to be simulated), etc. Use this preliminary coupon test to determine only theapproximate maximum temperature response of the test item, not to replace either Procedure I orProcedure II. Similarly, if multiple and identical test items are to be tested, use one or more of theitems for the preliminary test to determine the maximum temperature response. Since actinic effectsare highly dependent upon the solar radiation spectrum (as well as intensity and duration), thespectrum must be as close as possible to that of natural sunlight. Temperature measurementtechniques must be agreed by the parties involved.
(2) The 4-hour "lights-off" period of each 24-hour cycle allows for test item conditions (physical andchemical) to return toward "normal" and provide some degree of thermal stress exercising.
2.3 Determine Test Levels and Conditions.Having selected this method and relevant procedures (based on the materiel's requirements documents and thetailoring process), complete the tailoring process by identifying appropriate parameter levels, special test conditionsand techniques for these procedures such as the diurnal cycle, test duration, test item configuration, relativehumidity, and any additional appropriate conditions. Base these test parameter levels on the requirementsdocuments, Life Cycle Environmental Profile, Operational Environment Documentation (see Part One, figure 1-1),and information provided with this method. Consider the following in light of the operational purpose and life cycleof the materiel.
2.3.1 Diurnal cycle.For Procedure I, there are three high temperature diurnal cycles included that correspond to the maximummeteorological conditions in the three climatic categories, A1, A2, and A3 of MIL-HDBK-310. Although usuallynot as significant, in addition to these climatic categories, consider marine environments (M1and M2 in STANAG2895) as appropriate in the life cycle profile. Figure 505.4-1 shows the daily cycles of temperature and solarradiation corresponding to categories A1-A3 for Procedure I. Choose the conditions for the test according to theplanned climatic categories for use of the materiel:
a. Worldwide deployment. Cycle A1 has peak conditions of 1120 W/m2 (355 BTU/ft2/hr) and 49qC (120qF),and represents the hottest conditions exceeded not more than one percent of the hours in the most extrememonth at the most severe locations that experience very high temperatures accompanied by high levels ofsolar radiation, namely, hot, dry deserts of north Africa, parts of the Middle East, northern India, and theSouthwestern USA.
b. Cycle A2 has peak conditions of 1120 W/m2 and 44qC (111qF) and represents less severe conditions atlocations that experience high temperatures accompanied by high levels of solar radiation and moderatelylow humidity, namely, the most southerly parts of Europe, most of the Australian continent, south centralAsia, northern and eastern Africa, coastal regions of north Africa, southern parts of the USA, and most ofMexico. Use this cycle when the materiel is to be used only in geographical locations described incategories A2 or A3, but not in category A1.
c. Cycle A3 has peak conditions of 1120 W/m2 and 39qC (102qF) and represents only those locations whichexperience moderately high temperatures and moderately low humidity for at least part of the year. It isparticularly representative of conditions in Europe except the most southern parts, Canada, the northernUSA, and the southern part of the Australian continent. However, for the purposes of this document,category A3 is considered to apply to all land masses except those designated as category A1 or A2. Usethis cycle when the materiel is to be used only in the geographical locations described in category A3 but
Downloaded from http://www.everyspec.com on 2012-06-04T5:34:26.
MIL-STD-810F1 January 2000
METHOD 505.4505.4-5
not category A1 or A2. Figure 505.4-2 shows the corresponding temperature and solar radiation levels forProcedure II.
2.3.2 Test duration.
a. Procedure I. Expose the test item to continuous 24-hour cycles of controlled simulated solar radiation anddry bulb temperature as indicated on figure 505.4-1 or as identified in the requirements documents. A goalof this test is to establish the highest temperature that the test item will reach during repeated cycles. Inmany cases three cycles are adequate to establish this maximum temperature. Perform at least threecontinuous cycles. The variation in solar energy may be applied continuously or incrementally, with aminimum of four levels (preferably eight levels) for each side of the cycle, provided that the total energy ofthe cycle is maintained. If the maximum temperature is not reached (within 2qC (3.6qF) of the peakresponse temperature achieved during the previous 24-hour cycle) during the three cycles, perform four toseven cycles. Stop the test when the maximum test item temperature is established or at the end of theseventh cycle. In the absence of other guidance, recommend the maximum test duration of seven cyclesbecause the peak high temperature for the selected climatic region occurs approximately seven hours in themost extreme month. If more exact simulation is required, meteorological data for the particular areas underconsideration should be consulted. This may include adjustment of solar energy, if appropriate, to account forlatitude, altitude, month of anticipated exposure, or other factors (for example, a product exclusively used innorthern areas, or exclusively used in winter months). Any deviation from the standard conditions must bedetailed and justified.
b. Procedure II. Procedure II produces an acceleration factor of approximately 2.5 as far as the total energyreceived by the test item is concerned, i.e., one 24-hour cycle as shown on figure 505.4-2 providesapproximately 2.5 times the solar energy experienced in one 24-hour (natural) diurnal cycle plus a 4-hourlights-off period to allow for alternating thermal stressing and for the so-called "dark" processes to occur.To simulate 10 days of natural exposure, for instance, perform four 24-hour cycles as shown on figure505.4-2. Recommend a duration of ten 24-hour cycles (as on figure 505.4-2) for materiel which isoccasionally used outdoors, such as portable test items, etc. For materiel continuously exposed to outdoorconditions, recommend a test duration of 56 24-hour cycles or longer. Do not increase the irradiance abovethe identified level because of the danger of overheating; there is presently no indication that attempting toaccelerate the test in this way gives results that correlate with materiel response under natural solarradiation conditions.
2.3.3 Humidity.While various levels of relative humidity occur naturally, and humidity combined with temperature and solarradiation can, in many cases, have deleterious effects on materiel. If the materiel is known or suspected to besensitive to RH, include it in the Procedure I test requirements. STANAG 2895 and MIL-HDBK-310 havetemperature-humidity data for various regions of the Earth.
2.3.4 Configuration.Use the same test item configuration as during exposure to natural solar radiation. The orientation of the test itemrelative to the direction of radiation will have a significant impact on the heating effects. In cases where several testitem components are already known to be sensitive to solar effects, adjust the relative test item/solar radiation sourceorientation to simulate a natural diurnal cycle. Whenever possible, mount the test item so that its configuration isrepresentative of actual deployment, as provided in the requirements document. This mounting may includesupports or a substrate of specified properties (e.g., a layer of concrete of specified thickness or a sand bed of certainreflectivity).
2.3.5 Spectral distribution - Sea level versus high ground elevations.At high ground elevations solar radiation contains a greater proportion of damaging UV radiation than at sea level.Although the internationally agreed spectrum shown in table 505.4-I is recommended for general testing, it is acloser representation of the real environment at 4-5 km above sea level. This standard spectrum may be used (unlessother data are available) for both sea level and high ground elevation. If testing for sea level conditions using the
Downloaded from http://www.everyspec.com on 2012-06-04T5:34:26.
MIL-STD-810F1 January 2000
METHOD 505.4505.4-6
data in table 505.4-I, degradation during the test may be expected to proceed at a faster rate than if using theappropriate spectrum for sea level, and laboratory test exposure periods should be modified accordingly.
2.3.6 Temperature.
In addition to the temperature guidance given elsewhere in this method, it is essential to maintain the air temperature inthe vicinity of the test item to that temperature specified as the test area ambient air temperature. To do so requiresnecessary airflow and air temperature measurement (sensors shielded from radiation) in the immediate vicinity of thetest item.
2.4 Test Item Operation.When it is necessary to operate the test item, use the following guidelines for establishing test operating procedures.
a. General. See Part One, paragraph 5.8.2.
b. Unique to this method.
(1) Include operating modes that consume the most power (generate the most heat).
(2) Include the required range of input voltage conditions, if changes in voltage could affect the testitem thermal dissipation or response (e.g., power generation or fan speed).
(3) Introduce any cooling media that normally would be applied during service use (e.g., forced air orliquid coolant). Consider using cooling medium inlet temperatures and flow rates that representboth typical and worst-case degraded temperature and flow conditions.
3. INFORMATION REQUIRED.
3.1 Pretest.The following information is required to conduct solar radiation tests adequately.
c. General. Information listed in Part One, paragraphs. 5.7 and 5.9, and Appendix A, Task 405 of thisstandard.
d. Specific to this method.
(1) Appropriate diurnal cycle (for Procedure I) to include humidity if appropriate.
(2) Test item operational requirements.
(3) Spectral radiation of the source lighting (e.g., to reproduce conditions of a previous test).
(4) Any additional guidelines.
(5) Temperature measurement techniques.
3.2 During Test.Collect the following information during conduct of the test:
a. General. Information listed in Part One, paragraph 5.10, and in Appendix A, Task 406 of this standard.
b. Specific to this method.
(1) Record of chamber temperatures and light intensity versus time conditions.
(2) Record of the test item temperature-versus-time data for the duration of the test.
Downloaded from http://www.everyspec.com on 2012-06-04T5:34:26.
MIL-STD-810F1 January 2000
METHOD 505.4505.4-7
3.3 Post-test.The following post-test information is required.
a. General. Information listed in Part One, paragraph 5.13, and in Appendix A, Task 406 of this standard.
b. Specific to this method.
(1) Location of temperature sensors on the test item.
(2) Test item temperatures and exposure periods.
(3) Solar lamp bank identification.
(4) Any additional data required.
4. TEST PROCESS.
4.1 Test Facility.
a. The required facility consists of a chamber or cabinet, auxiliary instrumentation, and a solar lamp bank.This apparatus must be capable of maintaining and monitoring (see Part One, paragraph 5.18) the requiredconditions of temperature, airflow, and irradiation.
b. For both procedures consider the possible cooling effects of airflow over the test specimens. An airflow ofas little as 1 m/s can cause a reduction in temperature rise of over 20 percent. Unless otherwise justified,control and measure the rate of airflow in the vicinity of the test item such that it is as low as possibleconsistent with achieving satisfactory control of the ambient air temperature at the test item, i.e., usuallybetween 0.25 and 1.5 m/s (50 to 300 ft/min).
c. To minimize or eliminate re-radiation from chamber surfaces, experience has shown that the best method iswhen the volume of the test chamber is a minimum of 10 times that of the envelope volume of the test item.(Consider the beam angles of the light source hitting the walls of the test chamber.)
4.1.1 Substrate.The test item should be mounted either on raised supports or on a substrate of specified properties, e.g., a layer ofconcrete of specified thickness or a sand bed of a conductivity and reflectivity representative of actual deployment,as provided in the requirements documents.
4.1.2 Solar radiation source.
a. Compose the solar radiation source of either radiant heat-producing lamps (for Procedure I) or lamps thatsimulate the solar spectrum (for Procedure II or both I and II). The radiation intensity of the light sourcearray must not vary by more than 10% from the desired value as measured on the upper surface of the testitem.
b. Use a maximum irradiance intensity of 1120 W/m2 (r47W/m2) and ensure the radiation on the test item isuniform to within 10% of the desired value. Where actinic effects are to be assessed, ensure the spectraldistribution of the light source adheres to the distribution given in table 505.4-I (within the giventolerances). Where only thermal effects are being assessed, it is desirable to maintain at least the visibleand infrared portions of the spectrum as in table 505.4–I. However, if not feasible, deviate from thespectral distribution (table 505.4-I) as necessary, but adjust the irradiance to give an equivalent heatingeffect. In order to determine the amount of adjustment necessary, employ either of two methods:
(1) Mathematically calculate the adjustment using the following information:
(a) The spectral reflectance or transmittance of the irradiated surfaces, and
(b) The spectral energy distribution of the particular lamps being used (and also the effect of anyassociated reflectors or glasses).
Downloaded from http://www.everyspec.com on 2012-06-04T5:34:26.
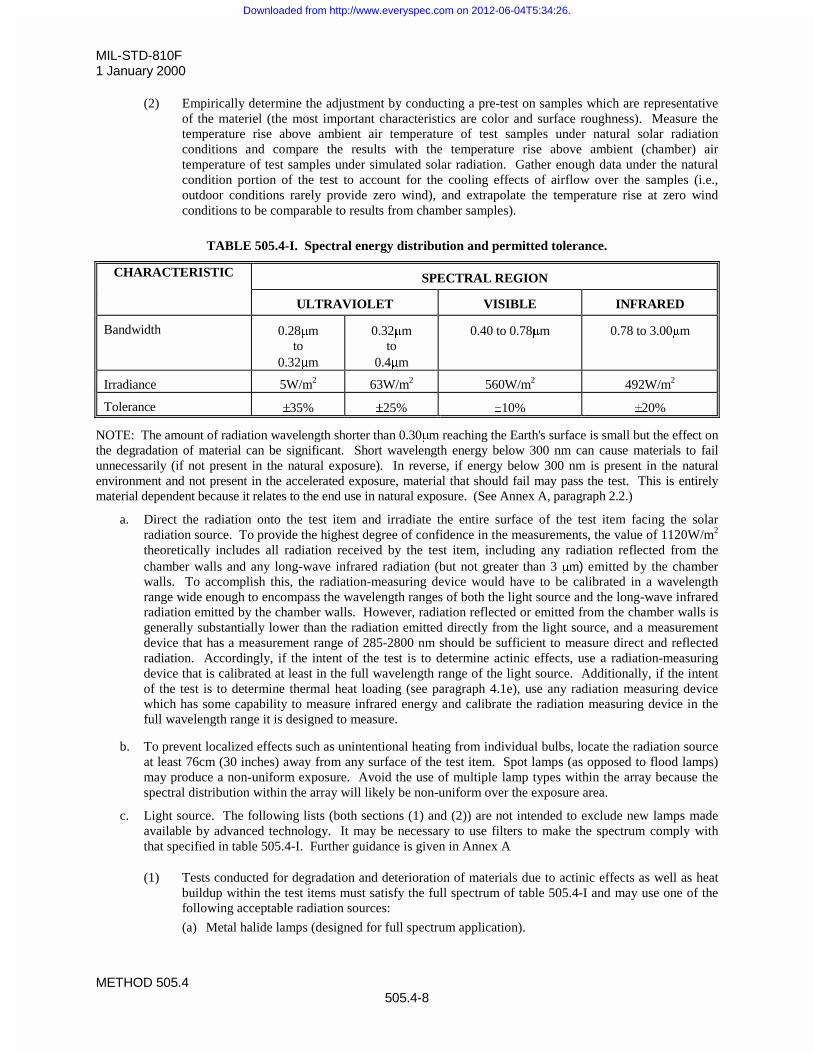
MIL-STD-810F1 January 2000
METHOD 505.4505.4-8
(2) Empirically determine the adjustment by conducting a pre-test on samples which are representativeof the materiel (the most important characteristics are color and surface roughness). Measure thetemperature rise above ambient air temperature of test samples under natural solar radiationconditions and compare the results with the temperature rise above ambient (chamber) airtemperature of test samples under simulated solar radiation. Gather enough data under the naturalcondition portion of the test to account for the cooling effects of airflow over the samples (i.e.,outdoor conditions rarely provide zero wind), and extrapolate the temperature rise at zero windconditions to be comparable to results from chamber samples).
TABLE 505.4-I. Spectral energy distribution and permitted tolerance.
CHARACTERISTIC SPECTRAL REGION
ULTRAVIOLET VISIBLE INFRARED
Bandwidth 0.28Pmto
0.32Pm
0.32Pmto
0.4Pm
0.40 to 0.78Pm 0.78 to 3.00Pm
Irradiance 5W/m2 63W/m2 560W/m2 492W/m2
Tolerance r35% r25% r10% r20%
NOTE: The amount of radiation wavelength shorter than 0.30Pm reaching the Earth's surface is small but the effect onthe degradation of material can be significant. Short wavelength energy below 300 nm can cause materials to failunnecessarily (if not present in the natural exposure). In reverse, if energy below 300 nm is present in the naturalenvironment and not present in the accelerated exposure, material that should fail may pass the test. This is entirelymaterial dependent because it relates to the end use in natural exposure. (See Annex A, paragraph 2.2.)
a. Direct the radiation onto the test item and irradiate the entire surface of the test item facing the solarradiation source. To provide the highest degree of confidence in the measurements, the value of 1120W/m2
theoretically includes all radiation received by the test item, including any radiation reflected from thechamber walls and any long-wave infrared radiation (but not greater than 3 Pm) emitted by the chamberwalls. To accomplish this, the radiation-measuring device would have to be calibrated in a wavelengthrange wide enough to encompass the wavelength ranges of both the light source and the long-wave infraredradiation emitted by the chamber walls. However, radiation reflected or emitted from the chamber walls isgenerally substantially lower than the radiation emitted directly from the light source, and a measurementdevice that has a measurement range of 285-2800 nm should be sufficient to measure direct and reflectedradiation. Accordingly, if the intent of the test is to determine actinic effects, use a radiation-measuringdevice that is calibrated at least in the full wavelength range of the light source. Additionally, if the intentof the test is to determine thermal heat loading (see paragraph 4.1e), use any radiation measuring devicewhich has some capability to measure infrared energy and calibrate the radiation measuring device in thefull wavelength range it is designed to measure.
b. To prevent localized effects such as unintentional heating from individual bulbs, locate the radiation sourceat least 76cm (30 inches) away from any surface of the test item. Spot lamps (as opposed to flood lamps)may produce a non-uniform exposure. Avoid the use of multiple lamp types within the array because thespectral distribution within the array will likely be non-uniform over the exposure area.
c. Light source. The following lists (both sections (1) and (2)) are not intended to exclude new lamps madeavailable by advanced technology. It may be necessary to use filters to make the spectrum comply withthat specified in table 505.4-I. Further guidance is given in Annex A
(1) Tests conducted for degradation and deterioration of materials due to actinic effects as well as heatbuildup within the test items must satisfy the full spectrum of table 505.4-I and may use one of thefollowing acceptable radiation sources:
(a) Metal halide lamps (designed for full spectrum application).
Downloaded from http://www.everyspec.com on 2012-06-04T5:34:26.
MIL-STD-810F1 January 2000
METHOD 505.4505.4-9
(b) Xenon arc or mercury xenon arc (used singularly) with suitable reflector.
(c) Combination of high pressure sodium vapor and improved mercury vapor with suitablereflectors.
(d) High-intensity multi-vapor, mercury vapor (with suitable reflectors), and incandescent spotlamps.
(e) Carbon arc (with suitable filters).
NOTE: Use other combinations of the lamps listed above and in paragraph 4.1h (2) below if it is proven that thecombination produces the spectrum of table 505.4-I.
(2) Use the appropriate lamps from the following list for tests conducted to assess heating effects alone(and not actinic effects).
(a) Mercury vapor lamps (internal reflector type only).(b) Combination of incandescent spot and tubular-type mercury vapor lamps w/ external reflectors.(c) Combination of incandescent spot lamps and mercury vapor lamps with internal reflectors.(d) Metal halide.(e) Xenon arc or mercury xenon arc lamps with suitable reflectors.(f) Multi-vapor (clear or coated bulb) with suitable reflectors.(g) Tungsten filament lamps.(h) Any other heat producing lamp (see paragraph 4.1e)
4.2 Controls.
a. Temperature. Maintain the chamber air temperature (as specified in the test plan) in accordance with PartOne, paragraph 5.2a. In order to adequately measure the temperature of the air surrounding the test item,measure it (with adequate shielding from radiated heat) at a point or points in a horizontal reference planeat the approximate elevation of the upper surface of the test item, and as close as possible to the test item,making adequate provision for shielding from the effects of radiant heat from the test item. This is one wayto ensure reasonable control of the envelope of air surrounding the test item. The temperature sensors usedto measure the thermal response of the test item will also be affected by direct radiation of the light source.When practical, mount these sensors to the inside surface of the external case (upper surface) of the testitem.
b. Surface contamination. Dust and other surface contamination may significantly change the absorptioncharacteristics of irradiated surfaces. Unless otherwise required, ensure the test items are clean when theyare tested. However, if the effects of surface contamination are to be assessed, include in the relevantrequirements document the necessary information on preparation of surfaces.
c. Instrumentation. Use a pyranometer, pyrheliometer or other suitable device to measure the total radiatedenergy imposed on the test item. Use a pyranometer with suitable filters or a spectroradiometer to measurethe spectral distribution of the radiation imposed on the test item. A filtered pyranometer can only providean approximate measurement of the spectral distribution. However, a spectroradiometer, although moredelicate to employ, can provide a precise measurement of the spectral distribution. Use other measuringinstruments only if they can satisfy the required specifications. Refer to the table below for the requiredmeasurement accuracy of these commonly used instruments. For a pyranometer, the following applies1:
Spectral Range: 280 – 2,500 (better 3,000) nmDirectional Error (cosine error): < +/-1%Non Linearity: <1.5%Tilt Effect (use at tilted surfaces): <1.5%Operating temperature: -40C to +80CTemperature dependence of sensitivity: +/-2% (-10C to +40C)
1 These requirements correspond to a ISO 9060 secondary standard instrument as manufactured by several well-known manufacturers.
Downloaded from http://www.everyspec.com on 2012-06-04T5:34:26.
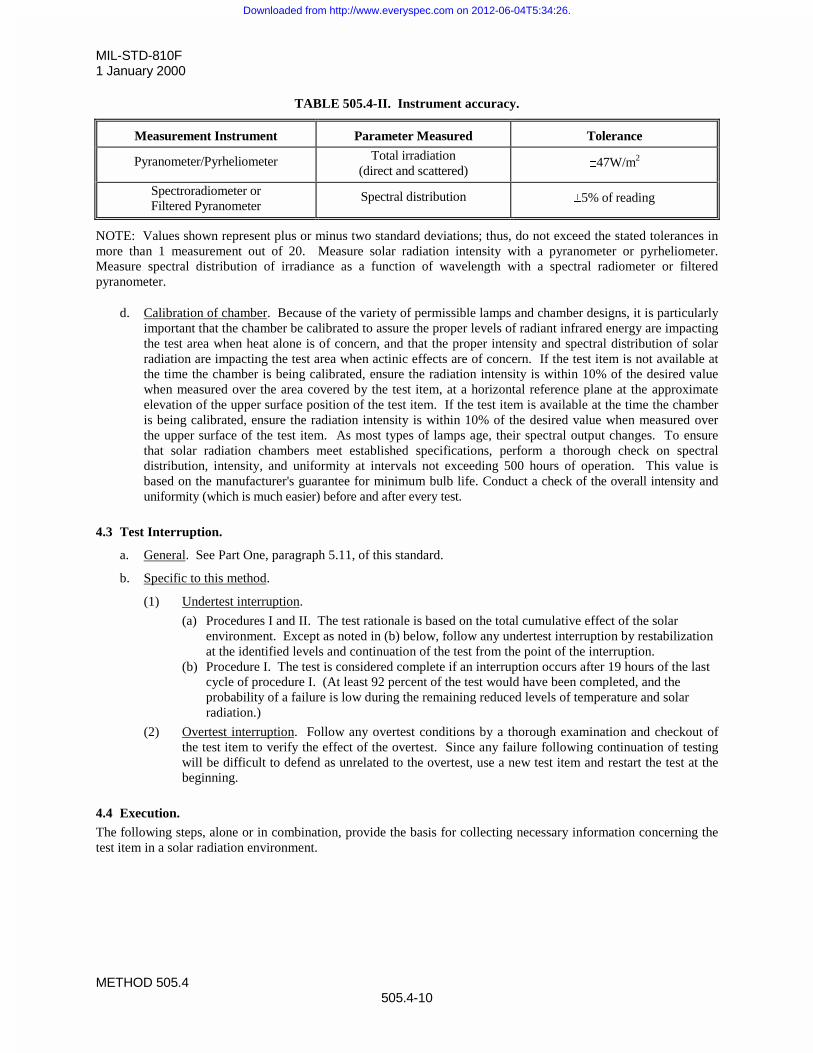
MIL-STD-810F1 January 2000
METHOD 505.4505.4-10
TABLE 505.4-II. Instrument accuracy.
Measurement Instrument Parameter Measured Tolerance
Pyranometer/Pyrheliometer Total irradiation(direct and scattered)
r47W/m2
Spectroradiometer orFiltered Pyranometer
Spectral distribution r5% of reading
NOTE: Values shown represent plus or minus two standard deviations; thus, do not exceed the stated tolerances inmore than 1 measurement out of 20. Measure solar radiation intensity with a pyranometer or pyrheliometer.Measure spectral distribution of irradiance as a function of wavelength with a spectral radiometer or filteredpyranometer.
d. Calibration of chamber. Because of the variety of permissible lamps and chamber designs, it is particularlyimportant that the chamber be calibrated to assure the proper levels of radiant infrared energy are impactingthe test area when heat alone is of concern, and that the proper intensity and spectral distribution of solarradiation are impacting the test area when actinic effects are of concern. If the test item is not available atthe time the chamber is being calibrated, ensure the radiation intensity is within 10% of the desired valuewhen measured over the area covered by the test item, at a horizontal reference plane at the approximateelevation of the upper surface position of the test item. If the test item is available at the time the chamberis being calibrated, ensure the radiation intensity is within 10% of the desired value when measured overthe upper surface of the test item. As most types of lamps age, their spectral output changes. To ensurethat solar radiation chambers meet established specifications, perform a thorough check on spectraldistribution, intensity, and uniformity at intervals not exceeding 500 hours of operation. This value isbased on the manufacturer's guarantee for minimum bulb life. Conduct a check of the overall intensity anduniformity (which is much easier) before and after every test.
4.3 Test Interruption.
a. General. See Part One, paragraph 5.11, of this standard.
b. Specific to this method.
(1) Undertest interruption.
(a) Procedures I and II. The test rationale is based on the total cumulative effect of the solarenvironment. Except as noted in (b) below, follow any undertest interruption by restabilizationat the identified levels and continuation of the test from the point of the interruption.
(b) Procedure I. The test is considered complete if an interruption occurs after 19 hours of the lastcycle of procedure I. (At least 92 percent of the test would have been completed, and theprobability of a failure is low during the remaining reduced levels of temperature and solarradiation.)
(2) Overtest interruption. Follow any overtest conditions by a thorough examination and checkout ofthe test item to verify the effect of the overtest. Since any failure following continuation of testingwill be difficult to defend as unrelated to the overtest, use a new test item and restart the test at thebeginning.
4.4 Execution.The following steps, alone or in combination, provide the basis for collecting necessary information concerning thetest item in a solar radiation environment.
Downloaded from http://www.everyspec.com on 2012-06-04T5:34:26.
MIL-STD-810F1 January 2000
METHOD 505.4505.4-11
4.4.1 Preparation for test.
4.4.1.1 Preliminary steps.Before starting the test, review pretest information in the test plan to determine test details (e.g., procedures, itemconfiguration, cycles, durations, parameter levels for storage/operation, etc.). (See paragraph 3.1, above.)
a. Which test procedures are required.
b. The diurnal cycle to be used.
c. Other variables, such as number of cycles, etc.
d. Degree of removal of surface contamination necessary (see paragraph 4.2b).
e. Comparative information. For eventual comparison between pre- and post-test items, photograph the testitem and take material samples (if required).
4.4.1.2 Pretest standard ambient checkout.All items require a pretest standard ambient checkout to provide baseline data. Conduct the checkout as follows:
Step 1. Install the test item in the chamber and stabilize it at standard ambient conditions (Part One,paragraph 5.1a) and in a manner that will simulate service use, unless the storage configuration isspecified. Position the test item in accordance with the following:
a. As near the center of the test chamber as practical and so that the surface of the item is notcloser than 0.3m (1 ft) to any wall or 0.76m (30 in.) to the radiation source when the source isadjusted to the closest position it will assume during the test
b. Oriented, within realistic limits, to expose its most vulnerable parts to the solar radiation,unless a prescribed orientation sequence is to be followed.
c. Separated from other items that are being tested simultaneously, to ensure that there is nomutual shading or blocking of airflow unless this, also, is representative of the test item's fielduse.
Step 2. Conduct a visual examination of the test item with special attention to stress areas, such as cornersof molded cases, and document the results.
Step 3. Prepare the test item in accordance with Part One, paragraph 5.8, and in the identified test itemconfiguration (see paragraph 2.3.3), with any temperature sensors necessary to determine test itemresponse.
Step 4. Conduct an operational checkout in accordance with the test plan and record the results.Step 5. If the test item operates satisfactorily, place it in its test configuration (if other than operational). If
not, resolve the problem and restart at Step 1. Return the test item to the position identified in Step1 and proceed to the first test as identified in the test plan.
4.4.2 Procedure I.Step 1. Adjust the chamber air temperature to the minimum value of the temperature cycle at which
radiation is nonexistent.Step 2. Expose the test item to continuous 24-hour cycles of controlled simulated solar radiation and dry-
bulb temperature as indicated on figure 505.4-1 or as identified in the requirements document,measuring and recording test item temperatures throughout the exposure period. For convenienceand if the test facility is unable to perform the continuous curve of figure 505.4-1, to approximatethe curve increase and decrease the solar radiation intensity in a minimum of four levels (preferablyeight levels) for each side of the cycle, provided that the total energy of the cycle as well as thespectral power distribution (table 505.4-I) is maintained. Perform the longer of the followingnumber of cycles:
Downloaded from http://www.everyspec.com on 2012-06-04T5:34:26.
MIL-STD-810F1 January 2000
METHOD 505.4505.4-12
a. The minimum necessary to ensure the peak response temperature of the most critical area ofthe test item achieved during a cycle is within 2qC of the peak response temperature achievedduring the previous 24-hour cycle, or
b. Three continuous cycles, or
c. The number of cycles as identified by the requirements document (not to exceed 7 cycles).
Step 3. The test item may or may not be operated throughout the test, at the option of the requirementsdocument. If operation is required, operate the test item when the peak cycle temperature occurs.For some single-use items (e.g., rockets), use thermocouples affixed to critical portions of the testitem to determine the time and value of peak temperature. Operate the test item at the peak cycletemperature. Conduct the operational checkout of the test item as in paragraph 4.4.1.2, Step 4.Document the results.
Step 4. Adjust the chamber air temperature to standard ambient conditions and maintain until temperaturestabilization of the test item has been achieved.
Step 5. Conduct a complete visual examination of the test item and document the results. For comparisonbetween pre- and post-test items, photograph the test item and take material samples (if required).
Step 6. Conduct an operational checkout of the test item as in paragraph 4.4.1.2, Step 4.Step 7. Compare these data with the pretest data.
4.4.3 Procedure II.
Step 1. Adjust the chamber air temperature to 49qC or the temperature identified in the test plan.Step 2. Adjust the solar radiation source to a radiant energy rate of 1120 r47 W/m2 or as identified in the
materiel specification.Step 3. Maintain these conditions for 20 hours, measuring and recording the test item temperatures. If
required, conduct operational checks during the last four hours of each 20-hour exposure when testtemperatures are maximized.
Step 4. Turn off the solar radiation source for four hours.Step 5. Repeat Steps 1 through 4 for the number of cycles identified in the test plan.Step 6. At the end of the last radiation cycle, allow the test item to return to standard ambient conditions.Step 7. Conduct a visual examination and an operational check as in paragraph 4.4.1.2, Steps 2 and 4, and
document the results. Take photographs of the test item and material samples (if required) forcomparison between pre- and post-test items.
5. ANALYSIS OF RESULTS.In addition to the guidance provided in Part One, paragraphs 5.14 and 5.17, the following information is provided toassist in the evaluation of the test results. Analyze any failure of a test item to meet the requirements of the materielspecifications.
a. Procedure I. Do not alter the performance characteristics either at the peak temperature or after return tostandard ambient conditions to the extent that the test item does not meet its requirements. Record asobservations only those actinic effects that do not affect performance, durability, or required characteristics.
b. Procedure II. Do not alter the performance and characteristics (such as color or other surface conditions) ofthe test item to the extent that the test item does not meet requirements. Record actinic effects that do notaffect performance, durability, or required characteristics as observations only. The fading of colors couldresult in higher heating levels within the test item.
6. REFERENCE/RELATED DOCUMENTS.
a. AR 70-38, Research, Development, Test and Evaluation of Materiel for Extreme Climatic Conditions.
b. MIL-HDBK-310, Global Climatic Data for Developing Military Products.
c. Synopsis of Background Material for MIL-STD-210B, Climatic Extremes for Military Equipment.Bedford, MA: AF Cambridge Research Laboratories, January 1974. DTIC number AD-780-508.
Downloaded from http://www.everyspec.com on 2012-06-04T5:34:26.

MIL-STD-810F1 January 2000
METHOD 505.4505.4-13
d. NATO STANAG 2895, Extreme Climatic Conditions and Derived Conditions for Use in DefiningDesign/Test Criteria for NATO Forces Materiel.
e. NATO STANAG 4370, AECTP 300, Climatic Test Methods, Method 305, Solar Radiation.
f. “Ultraviolet Spectral Energy Distribution of Natural Sunlight and Accelerated Test Light Sources”; R.C.Hirt, R.G. Schmitt, N.D. Searle and A.P. Sullivan; Journal of the Optical Society of America, July 1960,vol. 50, p. 706.
g. “Studies of Spectral Energy Distribution of Different Light Sources in Connection with Solar Simulation”;D.W. Gibson and J. Weinard; Institute of Environmental Sciences 1962 Proceedings, p. 453.
h. “Ultraviolet Radiation”; L.R. Koller; Wiley, 2nd Edition, 1965.
i. “An Artificial Sunshine Solarium”; G.F. Prideaux, Illuminating Engineering, 1946, Vol. 12, p.762.
j. “'Project Assess - a Report of a Long Term Solar Simulation Test”; R. Kruger, Institute of EnvironmentalSciences 1966 Proceedings, p. 271.
k. “Spectral Distribution of Typical Daylight as a Function of Correlated Color Temperature”; D.B. Judd, D.L.MacAdam and G. Wyszecki; Journal of the Optical Society of America, August 1964, vol. 54, p. 1031.
l. “Simulating the Solar Spectrum with a Filtered High-pressure Xenon Lamp”; E.A. Boettner and L.J.Miedler, Applied Optics, 1963, vol. 2, p. 105.
m. “Modular Xenon Solar Simulation of Large Area Application”; J.A. Castle, Institute of EnvironmentalSciences, 1967 Proceedings, p. 687.
n. “Four-foot Solar Simulation System”; R.N. Harmon, Institute of Environmental Sciences 1966 Proceedingsp. 531.
o. “Radiation Instruments and Measurements”; International Geophysical Year Manual, Part VI, 1958,Pergamon Press.
p. “Deterioration of Materials”; G.A. Greathouse and C.J. Wassel, Reinhold, New York, 1954.
q. “The Simulation of Solar Radiant Energy”; P.W. Baker, Environmental Engineering Quarterly June 1963,p. 17-19 and Sept 1963, p. 14-17.
r. “Measurement of Spectral Irradiance”; .J Arveson, Handbook of Solar Simulation for Thermal VacuumTesting, Section 9B Institute of Environmental Sciences, 1968.
s. “The Solar Constant and the Solar Spectrum Measured from a Research Aircraft”; M.P. Thekaekara,NASA TR R-351, Washington, DC, Oct 1970.
Downloaded from http://www.everyspec.com on 2012-06-04T5:34:26.
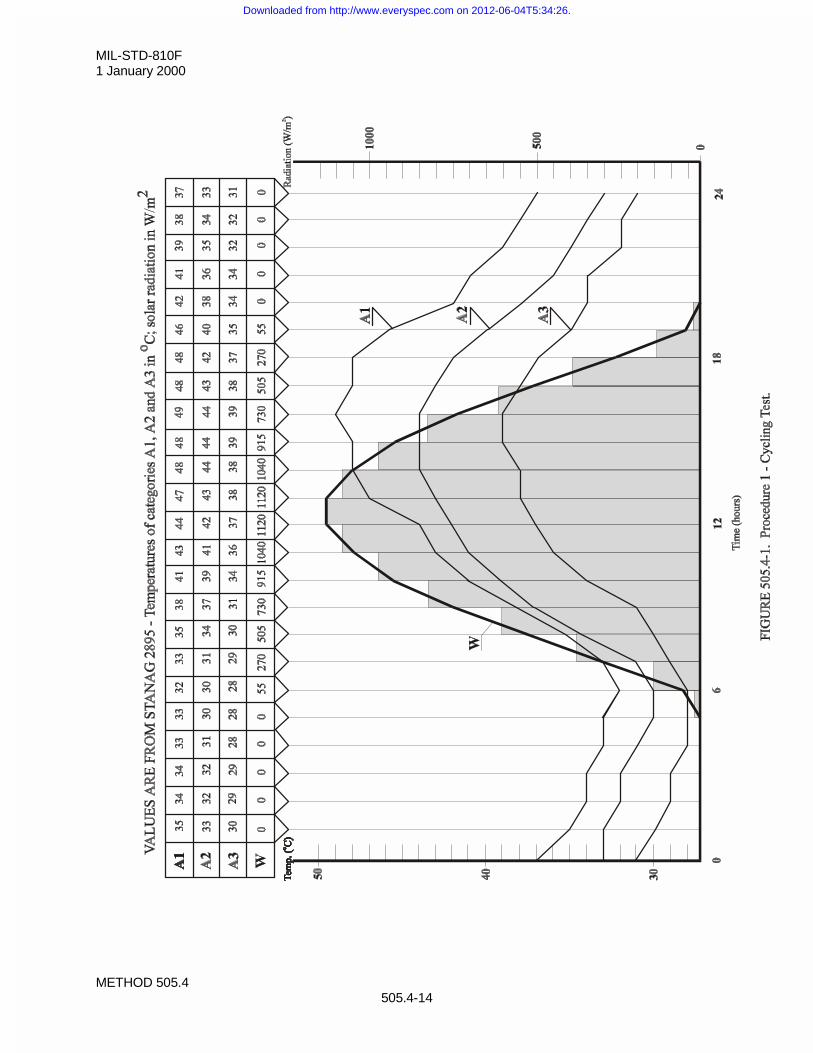
MIL-STD-810F1 January 2000
METHOD 505.4505.4-14
Downloaded from http://www.everyspec.com on 2012-06-04T5:34:26.
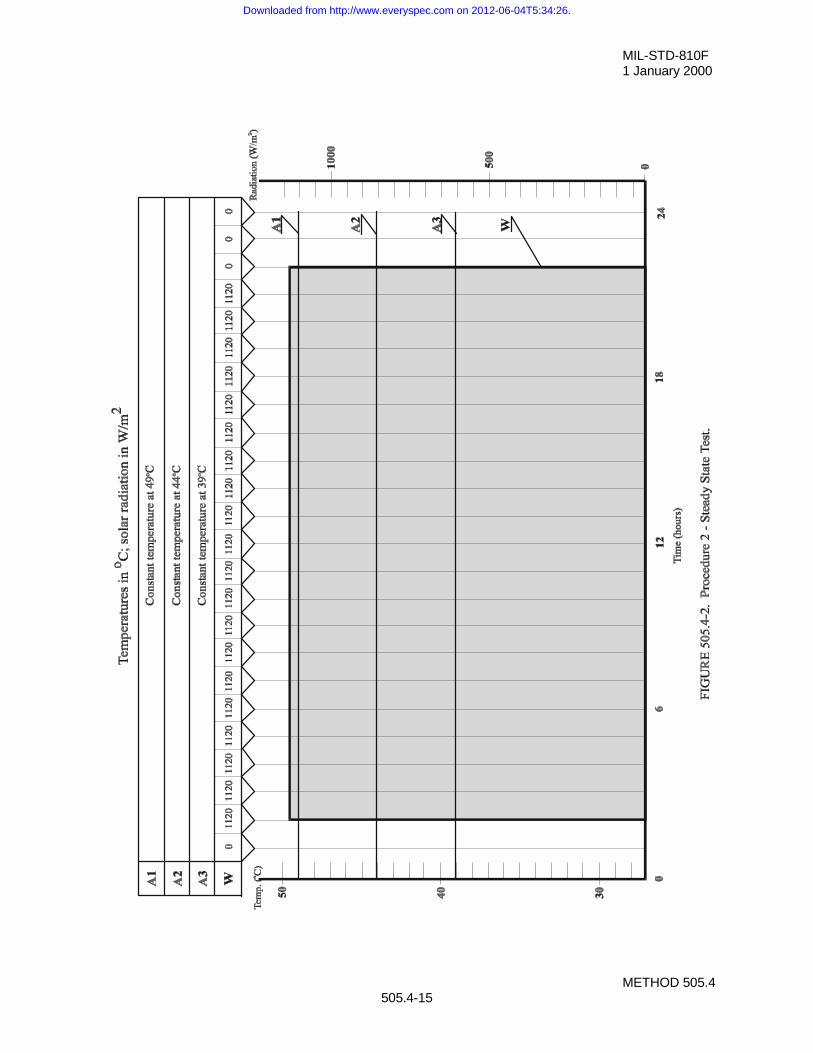
MIL-STD-810F1 January 2000
METHOD 505.4505.4-15
Downloaded from http://www.everyspec.com on 2012-06-04T5:34:26.

MIL-STD-810F1 January 2000
METHOD 505.4505.4-16
THIS PAGE INTENTIONALLY BLANK
Downloaded from http://www.everyspec.com on 2012-06-04T5:34:26.
MIL-STD-810F1 January 2000
METHOD 505.4505.4A-1
ANNEX A
DETAILED GUIDANCE ON SOLAR RADIATION TESTING
1. INTRODUCTION.This Annex describes methods of simulation designed to examine the effects of solar radiation on materiel. Themain quantities to be simulated are the spectral energy distribution of the sun as observed at the Earth's surface andthe intensity of received energy, in combination with controlled temperature conditions. However, it may benecessary to consider a combination of solar radiation - including sky radiation - with other environments, e.g.,humidity, air velocity, etc.
2. IRRADIANCE AND SPECTRAL DISTRIBUTION.The effect of radiation on the materiel will depend mainly on the level of irradiance and its spectral distribution.
2.1 Irradiance.The irradiance by the sun on a plane perpendicular to the incident radiation outside the Earth's atmosphere at themean Earth-sun distance is known as the solar constant “I0.” The irradiance at the surface of the Earth is influencedby the solar constant and the attenuation and scattering of radiation in the atmosphere. For test purposes, amaximum intensity of 1120 W/m2 is specified to simulate the global (total) radiation at the surface of the Earth fromthe sun and the sky with the sun at zenith, based on a solar constant I0 = 1350 W/m2. The true solar constant isthought to be about 1365-1370 W/m2.
2.2 Spectral Distribution - Sea Level Versus High Altitude.At high altitude, solar radiation contains a greater proportion of damaging UV radiation than at sea level. Theinternationally-agreed spectrum (see table 505.4A-I) recommended for general testing is a representation of the realenvironment at 4-5 km. This spectrum is recommended for use at both sea level and at high altitude.
3. OTHER ENVIRONMENTAL FACTORS TO BE CONSIDERED.Attention is drawn to the possible cooling effects of air flow over materiel. This can also result in misleading errorsin open-type thermopiles used to monitor radiation intensity; ventilation of pyranometers may be necessary to keepthe glass dome cool. An air flow of as little as one meter per second can effect a reduction in temperature rise ofover 20%. In practice, high solar radiation conditions are rarely accompanied by complete absence of wind. It maybe necessary, therefore, to assess the effect of different air velocities over materiel under test. The materielspecification should state any special requirements in this respect. It is essential, therefore, to measure and controlthe rate of air flow in order to maintain the required air temperature at the test item.
4. RADIATION SOURCES.
4.1 General.The radiation source may comprise one or more lamps and their associated optical components, e.g., reflectors,filters, etc., to provide the required spectral distribution and irradiance. The high pressure xenon arc lamp withfilters can provide the best spectral match. Mercury vapor and xenon-mercury lamps have considerable deficienciesin matching which would lead to error. The carbon arc, with specially-doped electrodes, has been widely used butpresents difficulties as regards stability and maintenance, and is therefore not generally favored. If not alreadycovered in test method characteristics of these sources, features of filters, optical arrangements, etc., are covered inthe following paragraphs. The following general information about several light sources may be helpful.
Downloaded from http://www.everyspec.com on 2012-06-04T5:34:26.
MIL-STD-810F1 January 2000
METHOD 505.4505.4A-2
a. Xenon lamps. The configuration and size of the lamp(s) used will depend on the test required. The relativespectral distribution of the xenon arc radiation has been found to be substantially independent of lamppower. However, variation of lamp power will change the temperature of the electrodes and hence thespectral distribution of their radiation. With long arc lamps, it is relatively simple to mask off the electroderadiation. The form of construction of the short arc lamp leads to considerably wider manufacturingvariation compared with the long arc, a point particularly important when replacement becomes necessary.Routine replacement of either type of lamp will be needed, since the emission will change continuouslywith life, and there may be wide variations of the life characteristic from lamp to lamp.
b. Carbon arc. Under certain conditions, the carbon arc can be made to provide radiation of a spectraldistribution somewhat similar to that of the sun as observed at ground level, but correcting filters areneeded, especially in the ultraviolet region. The combustible nature of the source has the disadvantages oflack of precise location and of impermanence. Perhaps the greatest disadvantage of the carbon arc is itsburning away. Even with a carefully arranged feed mechanism, the continuous burning time is unlikely toexceed 13 hours.
c. Metal Halide (HMI). Although this lamp imparts more energy in the ultraviolet range and low visiblerange than specified in table 505.4-I, it provides a good source for tests requiring attention to thermaleffects, since the additional UV energy represents less than one per cent of the total energy, and tests forheating effects are generally sufficiently short in duration that actinic degradation will not be a concern. Fortesting actinic effects, the energy level in the heating range will be lower than specified as the UV levelswill be adjusted to table 505.4A-I levels. Since the energy level between 0.32 and 0.40Pm increases sharplyas the lamp power level is reduced, power cannot be used to adjust overall energy levels once the desireddistribution has been obtained.
4.2 Filters.
Liquid filters have certain disadvantages such as the possibility of boiling, the temperature coefficient of spectraltransmission, and long term drift in spectral character. The present preference is for glass filters to be used, althoughthe characteristics of glass filters are not as accurately reproduced as those of a chemical solution filter. Some trialand error may be necessary to compensate for different optical densities by using different plate thicknesses. Glassfilters are proprietary articles and manufacturers should be consulted concerning the choice of filters suitable forparticular purposes. The choice will depend on the source and its methods of use. For example, a xenon source maybe test-compensated by a combination of infrared and ultraviolet absorbing filters. Some glass infrared filters maybe prone to rapid changes in spectral characteristics when exposed to excessive ultraviolet radiation. Thisdeterioration may be largely prevented by interposing the ultraviolet filter between the source and the infrared filter.Interference type filters, which function by reflecting instead of absorbing the unwanted radiation, (thus resulting inreduced heating of the glass), are generally more stable than absorption filters.
4.3 Uniformity of Irradiance.
Owing to the distance of the sun from the Earth, solar radiation appears at the Earth's surface as an essentiallyparallel beam. Artificial sources are relatively close to the working surface and means of directing and focusing thebeam must be provided with the aim of achieving a uniform irradiance at the measurement plane withinspecification limits (i.e., 1120 W/m2 (+10, -0 W/m²)). This is difficult to achieve with a short-arc xenon lamp with aparabolic reflector because of shadows from the lamp electrodes and supports. Also, the incandescence of the anodecan produce considerable radiation at a much lower color temperature, slightly displaced from the main beam, ifonly the arc itself is at the focus of the reflector. Uniform irradiation is more readily achieved with a long arc lampmounted in a parabolic 'trough' type reflector. However, by employing very elaborate mounting techniques, it ispossible to irradiate, with some degree of uniformity, a large surface by a number of short arc xenon lamps. It isgenerally advisable to locate radiation source(s) outside the test enclosure or chamber. This avoids possibledegradation of the optical components, e.g., by high humidity conditions, and contamination of test items by ozonethat has been generated by xenon and other types of arc lamps. Precise collimation of the radiation beam is notnormally required except for testing special materiel such as solar cells, solar tracking devices, etc. However, some
Downloaded from http://www.everyspec.com on 2012-06-04T5:34:26.
MIL-STD-810F1 January 2000
METHOD 505.4505.4A-3
of the simulation techniques developed for space research purposes could be adapted for Earth-surface solarradiation studies.
5. INSTRUMENTATION.
5.1 Measurement of Irradiance.
The type of instrument considered most suitable for monitoring the irradiance is a pyranometer as used formeasuring global (combined solar and sky) radiation on a horizontal plane. Two types are suitable for measuringradiation from a simulated solar source. Each depends for its operation on thermojunctions.
5.1.1 Moll-Gorczinski pyranometer.
The Moll-Gorczinski pyranometer consists of 14 constantan-manganin strips (10 x 1 x 0.005 mm) arranged so thattheir 'hot' junctions lie on a plane and are formed into a horizontal surface by means of a black varnish of lowthermal conductivity. The “cold” junction ends are bent down to make good thermal connections with a copperplate of large thermal capacity. The sensitive area is surmounted by two concentric glass hemispheres.
5.l.2 Eppley precision spectral pyranometer.
The sensor is a circular 50-junction wire wound plated (copper-constantan) thermopile, enclosed in concentric,clear-glass hemispheres, 30 mm and 50 mm diameter. The outer hemisphere is interchangeable with another, eitherof glass absorbing in particular wavelength bands, or with a deposited interference type filter, allowing theseparation of radiation into well-defined wavelength intervals. Neither of these instruments is significantly affectedby long-wave IR radiation emitted by the specimen or the test enclosure. A modification of the Moll-Gorczinskipyranometer, commonly known as the Kipp solarimeter, is the instrument used by meteorological services in manycountries. The Eppley pyranometer is the one most widely used in the United States. The glass covers used in boththese instruments will cut off radiation at wavelengths greater than about 3 mm; this is only significant whenunfiltered tungsten lamps are used and a correction factor would then be necessary.
5.2 Measurement of Spectral Distribution.Total intensity checks are readily made, but detailed checks on spectral characteristics are more difficult. Majorspectral changes can be checked by inexpensive routine measurements, using a pyranometer in conjunction withselective filters. For checking the detail spectral distribution characteristics of the facility, it would be necessary toemploy sophisticated spectroradiometric instrumentation. However, there seems to be no practical instrumentationobstacle to prevent this calibration being done either as a service by the facility manufacturer or by a visit from anational calibration center. Correlation should be achieved between the filter/pyranometer and spectroradiometricmethods at regular intervals. Changes in the spectral characteristics of lamps, reflectors and filters may occur over aperiod of time which could result in the spectral distribution being seriously outside the permitted tolerances.Manufacturing tolerances may mean that lamp replacement could result in unacceptable changes in both the level ofirradiation and spectral distribution compared with that initially set up. Regular monitoring is therefore essential,but monitoring of the detailed spectral distribution within the test facility may not be possible while an item isundergoing test. A method of measuring the intensity of radiation below 320 nm based on the exposure ofpolysulphone film and which would permit the monitoring of this wavelength range within the test facility is nowestablished. (The technique is currently being considered as an ISO test method.)
5.3 Measurement of Temperature.Because of the high level of radiation, it is essential that temperature sensors are adequately shielded from radiantheating effects. This applies both to measuring air temperatures within the test enclosure and also to monitoring testitem temperatures. For air temperature measurements, it is obviously impractical to use the standard 'Stevenson'screen used for meteorological measurements of “shade temperatures” since this is too cumbersome. A suitablealternative is a thermocouple freely mounted in a radiation shield comprising a vertical cupro-nickel tube(approximately 1.5 cm diameter by 7 cm long), surmounted by a spaced metal hood, polished on the inside surface
Downloaded from http://www.everyspec.com on 2012-06-04T5:34:26.
MIL-STD-810F1 January 2000
METHOD 505.4505.4A-4
and painted white on the outside. When monitoring test item temperatures, sensors, e.g., thermocouples, should belocated on the inside surfaces of the external case and should not be attached to the outside surfaces.Temperature-indicating paints and waxes are unsuitable for monitoring the temperature of irradiated surfaces, sincetheir absorption characteristics will not be the same.
6. PREPARATION OF TEST FACILITY AND MATERIEL UNDER TEST.
6.1 Test Facility.Ensure that the optical parts of the facility, lamps, reflectors, and filters, etc., are clean. The level of irradiation overthe specified measurement plane must be measured immediately prior to each test. Throughout the test continuallymonitor any ancillary environmental conditions, e.g., ambient temperature, as well as air velocity and otherparameters if specified.
6.2 Materiel under Test.The method of mounting and the orientation of the test item relative to the direction of radiation will have markedinfluences on the heating effects. The test item will probably be required to be mounted either on raised supports or ona substrate of specified properties, e.g., a layer of concrete of specified thickness or a sand-bed of certain conductivity.All this and the attitude of the test item should be included in the relevant specification. Special attention must be paidto the surface conditions of the test item to see that its finish is clean or in accordance with the relevant requirements.The heating effect on the test item will be largely affected by the condition of its external surfaces. Care must thereforebe exercised in handling the test item, especially in avoiding oil films and in ensuring that the surface finish and itsunderlay are fully representative of production standards. Temperature sensors should be attached to the test item asrequired (but see also paragraph 5.3 of this Annex).
7. INTERPRETATION OF RESULTS.The materiel specification should indicate the permitted changes in the external conditions and/or performance of thetest item after exposure to the required level of irradiation for certain durations. In addition, the following aspects ofinterpretation may be considered:
7.1 Comparison with Field Experience.The effects of exposing material to solar radiation are well documented (see also paragraphs 7.2 and 7.3 below). Anymarked differences between the expected effects and the behavior under test conditions should be investigated and thebasic cause established, i.e., whether caused by the test equipment or procedure, or by some peculiarity in the test item.
7.2 Thermal Effects.
a. The maximum surface and internal temperatures attained by materiel will depend on:
(1) the temperature of the ambient air.
(2) the intensity of radiation.
(3) the air velocity.
(4) the duration of exposure.
(5) the thermal properties of the materiel itself, e.g., surface reflectance, size and shape, thermalconductance, and specific heat.
b. Materiel can attain temperatures in excess of 60oC if fully exposed to solar radiation in an ambienttemperature as low as 35 to 40oC. The surface reflectance of an object affects its temperature rise fromsolar heating to a major extent; changing the finish from a dark color, for example, to a gloss white willeffect a considerable reduction in temperature. Conversely, a pristine finish designed to reduce temperaturecan be expected to deteriorate in time resulting in an increase in temperature. Most materials are selectivereflectors, i.e., their spectral reflectance changes with wavelength. For instance, paints, in general, are poor
Downloaded from http://www.everyspec.com on 2012-06-04T5:34:26.
MIL-STD-810F1 January 2000
METHOD 505.4505.4A-5
infrared reflectors although they may be very efficient in the visible region. Furthermore, the spectralreflectance of many materials changes sharply in the visible (producing a color sensation to the human eye)and in the near infrared. It is important, therefore, that the spectral energy distribution of the radiationsource(s) used in any simulated test should closely duplicate that of natural radiation.
7.3 Degradation of Materials.
The combined effects of solar radiation, atmospheric gases, temperature, humidity changes, etc., are oftencollectively termed “weathering,” and result in the “ageing” and ultimate destruction of most organic materials (e.g.,plastics, rubbers, paints, timber, etc.). Many materials that give satisfactory service in temperate regions have beenfound to be completely unsuitable for use under the more adverse conditions of the tropics. Typical effects are therapid deterioration and breakdown of paints, the cracking and disintegration of cable sheathing, and the fading ofpigments. The breakdown of a material under weathering usually results not from a single reaction, but from severalindividual reactions of different types occurring simultaneously, often with interacting effects. Although solarradiation, principally the ultraviolet portion, resulting in photodegradation is often the major factor, its effects canseldom be separated, in practice, from those of other weathering factors. An example is the effect of ultravioletradiation on polyvinyl chloride, where the apparent effects of ultraviolet radiation alone are small, but itssusceptibility to thermal breakdown, in which oxygen probably plays a major role, is markedly increased.Unfortunately, artificial tests occasionally produce abnormal defects that do not occur under weathering. This canbe often attributed to one or more of the following causes:
a. Many laboratory sources of ultraviolet radiation differ considerably from natural solar radiation in spectralenergy distribution.
b. When the intensity of ultraviolet, temperature, humidity, etc. are increased to obtain accelerated effects, therate of the individual reactions (which occur under normal exposure conditions), are not necessarilyincreased to the same extent. In some cases, e.g., fluorescent lamps, the infrared energy of the source issignificantly less than that of true solar loading, resulting in a surface test temperature that is lower thanwould be experienced out-of-doors.
c. The artificial tests, in general, do not simulate all the natural weathering factors.
8. HAZARDS AND PERSONNEL SAFETY.
8.1 General.The complex equipment employed for solar radiation testing purposes will necessarily call for operation andmaintenance by a skilled test staff, not only to ensure the prescribed performance of the test, but also because of thevarious health and safety hazards that have to be considered.
8.2 Ultraviolet Radiation.The most obvious dangers that have to be guarded against are those associated with the harmful effects of highintensity radiation in the near ultraviolet region. In natural sunlight, the eyes are protected in two ways: thebrightness of the sun makes it almost impossible to look directly at it and the ultraviolet radiation is considerablyattenuated by the atmosphere. These protections may not apply to artificial sources. The eyes must be protected byfiltered goggles or viewing apertures, particularly when setting up the equipment. Due to the point sources and highUV component of these sources, sunglasses may increase the danger. All testing personnel should be warned thatsevere eye damage can result from only short exposure to unfiltered radiation from arc-type lamps. Seriouserythema (sunburn) of exposed skin will also occur. Koller (see references) states the ultraviolet radiation ofsunlight is a major causal factor in cancer of the skin in the white population of the USA. The use of suitableprotective clothing including protection of the head and hands is highly recommended, even when working in testenclosures irradiated by filtered sources.
Downloaded from http://www.everyspec.com on 2012-06-04T5:34:26.
MIL-STD-810F1 January 2000
METHOD 505.4505.4A-6
8.3 Ozone and Harmful Fumes.Another serious health hazard arising from the use of xenon and other arc lamps is the possible buildup of localtoxic concentrations of ozone during the testing period. However, the maximum production of ozone occurs at theinitial switching on of the lamp, and thereafter the hot envelope of the lamp tends to degrade the ozone back tooxygen. Where forced-air cooling is employed, this cooling air should be sucked out and removed from the buildingand not blown into the lamp housing. In this way, the ozone hazard can be largely eliminated. Suitable detectingand measuring equipment is commercially available. The combined effects of heat and ultraviolet radiation oncertain plastics (e.g., melamine laminates) may also produce toxic fumes. Particular care should therefore be takenin the choice of materials used in the construction of a test facility.
8.4 Risk of Lamp Explosions.The use of high pressure xenon discharge lamps as the primary radiation source can also result in serious accidentsunless a well planned code of practice for the handling of these arc discharge tubes has been specified and is adheredto. All such lamps (whether hot or cold, used or new) have a liability to explode violently by reason of theconsiderable internal pressure (two to three atmospheres when cold, but up to twenty atmospheres when hot). Thereshould be no visible dirt or oil on the envelope, so regular cleaning with detergent and alcohol is necessary usingcotton gloves and face protection during such cleaning. When cold lamps are to be stored, the effects of explosionmay be limited by two layers of 0.25 mm thick polycarbonate sheet. Particular care must be taken to limit thespread of chain reaction breakdowns in multi-lamp equipment. It is possible to use armor plate glass for the dualpurpose of protection against lamp explosions and as a corrective filter. Individual lamp records should be kept as amatter of routine so as to be able to detect abnormal voltage/current behavior.
8.5 Electric Shock.Normal electric shock preventive measures must, of course, be adopted, particularly in the case of the high voltageigniter systems used with arc lamps. In some xenon lamps, the arc ignition pulse exceeds 60 kV, and an interlocksystem is therefore essential.
Downloaded from http://www.everyspec.com on 2012-06-04T5:34:26.
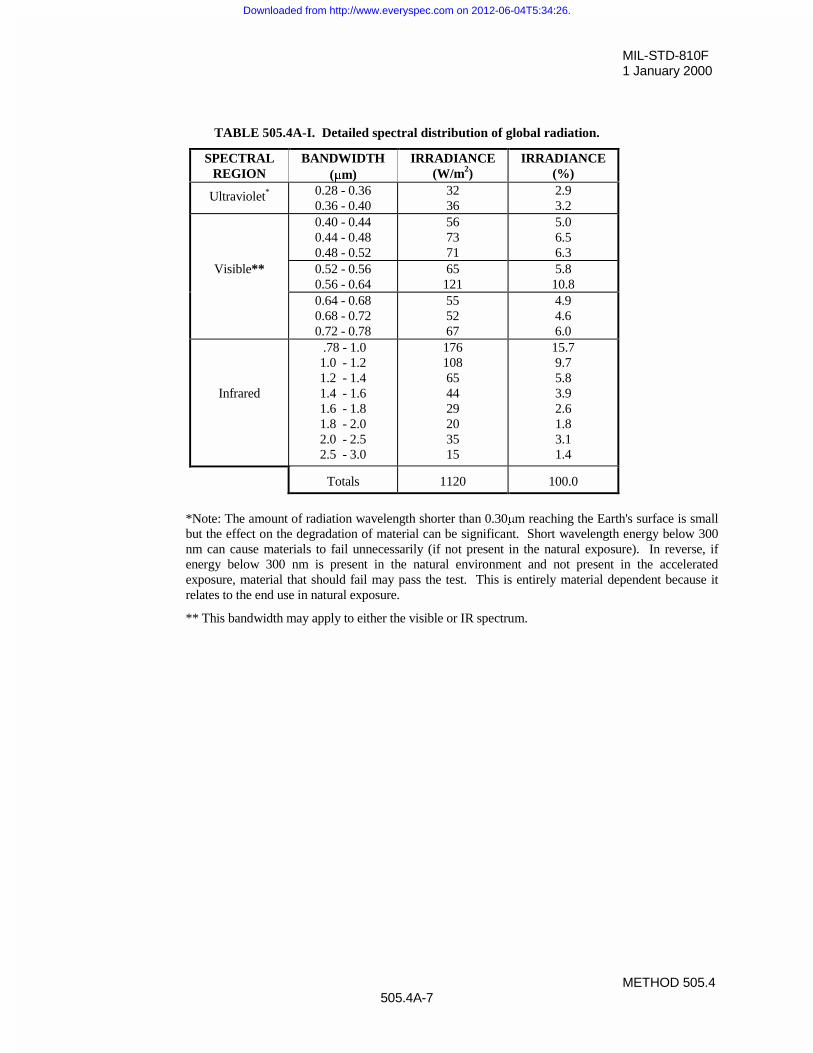
MIL-STD-810F1 January 2000
METHOD 505.4505.4A-7
TABLE 505.4A-I. Detailed spectral distribution of global radiation.
SPECTRALREGION
BANDWIDTH(PPm)
IRRADIANCE(W/m2)
IRRADIANCE(%)
Ultraviolet* 0.28 - 0.360.36 - 0.40
3236
2.93.2
0.40 - 0.440.44 - 0.480.48 - 0.52
567371
5.06.56.3
Visible** 0.52 - 0.560.56 - 0.64
65121
5.810.8
0.64 - 0.680.68 - 0.720.72 - 0.78
555267
4.94.66.0
Infrared
.78 - 1.01.0 - 1.21.2 - 1.41.4 - 1.61.6 - 1.81.8 - 2.02.0 - 2.52.5 - 3.0
176108654429203515
15.79.75.83.92.61.83.11.4
Totals 1120 100.0
*Note: The amount of radiation wavelength shorter than 0.30Pm reaching the Earth's surface is smallbut the effect on the degradation of material can be significant. Short wavelength energy below 300nm can cause materials to fail unnecessarily (if not present in the natural exposure). In reverse, ifenergy below 300 nm is present in the natural environment and not present in the acceleratedexposure, material that should fail may pass the test. This is entirely material dependent because itrelates to the end use in natural exposure.
** This bandwidth may apply to either the visible or IR spectrum.
Downloaded from http://www.everyspec.com on 2012-06-04T5:34:26.

MIL-STD-810F1 January 2000
METHOD 505.4505.4A-8
THIS PAGE INTENTIONALLY BLANK
Downloaded from http://www.everyspec.com on 2012-06-04T5:34:26.
MIL-STD-810F1 January 2000
METHOD 506.4506.4-1
METHOD 506.4
RAIN
NOTE: Tailoring is essential. Select methods, procedures and parameter levels based on the tailoring processdescribed in Part One, paragraph 4.2.2, and Appendix C. Apply the general guidelines for laboratory test methodsdescribed in Part One, paragraph 5 of this standard.
1. SCOPE.
1.1 Purpose.
The purpose of this method is to help determine the following with respect to rain, water spray, or dripping water:
a. The effectiveness of protective covers, cases, and seals in preventing the penetration of water into themateriel.
b. The capability of the materiel to satisfy its performance requirements during and after exposure to water.
c. Any physical deterioration of the materiel caused by the rain.
d. The effectiveness of any water removal system.
e. The effectiveness of protection offered to a packaged materiel.
1.2 Application.
Use this method to evaluate materiel likely to be exposed to rain, water spray, or dripping water during storage,transit, or operation. If the materiel configuration is the same, the immersion (leakage) test (method 512.4) isnormally considered to be a more severe test for determining if water will penetrate materiel. There is generally noneed to subject materiel to a rain test if it has previously passed the immersion test and the configuration does notchange. However, there are documented situations in which rain tests revealed problems not observed duringimmersion tests due to differential pressure. Additionally, the immersion test may be more appropriate if themateriel is likely to be placed on surfaces with significant amounts of standing water. In most cases, both testsshould be performed if appropriately identified in the life cycle profile.
1.3 Limitations.
Where a requirement exists for determining the effects of rain erosion on radomes, nose cones, fuzes, etc., considerusing a rocket sled test facility or other such facility. Since any test procedure involved would be contingent onrequirements peculiar to the materiel and the facility employed, a standardized test procedure for rain erosion is notincluded in this method. Because of the finite size of the test facilities, it may be difficult to determine atmosphericrain effects such as on electromagnetic radiation and propagation. This method is not intended for use in evaluatingthe adequacy of aircraft windshield rain removal provisions, nor does it address pressure washers or decontaminationdevices. Additionally, this method may not be adequate for determining the effects of extended periods of exposureto rain.
2. TAILORING GUIDANCE.
2.1 Selecting the Rain Method.
After examining the requirements documents and applying the tailoring process in Part One of this standard todetermine where rain is foreseen in the life cycle of the materiel, use the following to aid in selecting this method andplacing it in sequence with other methods. The term "rain" encompasses the full range of "free water" (blowing,steady state, drip) tests included in this method.
Downloaded from http://www.everyspec.com on 2012-06-04T5:34:26.
MIL-STD-810F1 January 2000
METHOD 506.4506.4-2
2.1.1 Effects of rain environments.
Rain (when falling, upon impact, and as deposited as pooled water) has a variety of effects on materiel. Consider thefollowing typical problems to help determine if this method is appropriate for the materiel being tested. This list is notintended to be all-inclusive and some of the examples may overlap the categories.
2.1.1.1 In the atmosphere.
In the atmosphere the effects resulting from exposure to these environments include:
a. Interference with or degradation of radio communication.
b. Limited radar effectiveness.
c. Limited aircraft operations due to restricted visibility and decreased lift from wing surfaces (excessiverain rates only).
d. Damage to aircraft in flight.
e. Affect on artillery and missile launching.
f. Degradation or negation of optical surveillance.
g. Decreased effectiveness of personnel in exposed activities.
h. Premature functioning of some fuses.
i. Inhibited visibility through optical devices.
2.1.1.2 On impact.
On impact it erodes surfaces.
2.1.1.3 After deposition and/or penetration.
After deposition and/or penetration, the effects resulting from exposure to these environments include:
a. Degraded strength/swelling of some materials.
b. Increased corrosion potential, erosion, or even fungal growth.
c. Increased weight.
d. Electrical or electronic apparatus become inoperative or unsafe.
e. Malfunction of electrical materiel.
f. Freezing inside materiel that may cause delayed deterioration and malfunction by swelling or cracking ofparts.
g. Modified thermal exchange.
h. Slower burning of propellants.
2.1.2 Sequence among other methods.
a. General. See Part One, paragraph 5.5.
b. Unique to this method. This method is applicable at any stage in the test program, but its effectiveness indetermining the integrity of an enclosure is maximized if it is performed after the dynamic tests.
2.2 Selecting Procedures.
This method includes three rain-related test procedures: Procedure I (Rain and Blowing Rain), Procedure II(Watertightness), and Procedure III (Drip). Before conducting the test, determine which test procedure(s) and testconditions are appropriate.
Downloaded from http://www.everyspec.com on 2012-06-04T5:34:26.
MIL-STD-810F1 January 2000
METHOD 506.4506.4-3
2.2.1 Procedure selection considerations.
Differences among rain test procedures are explained below. Select the procedure that represents the most severeexposure anticipated for the materiel commensurate with materiel size. When selecting a procedure, consider:
a. The materiel configuration.
b. The logistical and operational requirements (purpose) of the materiel.
c. The operational purpose of the materiel and data to verify it has been met.
d. The natural exposure circumstances.
e. Procedure sequence.
2.2.2 Difference among procedures.
a. Procedure I - Rain and Blowing Rain. Procedure I is applicable for materiel which will be deployed out-of-doors and which will be unprotected from rain or blowing rain. The accompanying wind velocity canvary from almost calm to extremely high. Consider using either Procedure II or Procedure III formateriel that cannot be adequately tested with this procedure because of its (large) size.
b. Procedure II - Watertightness. Consider Procedure II when large (shelter-size) materiel is to be testedand a blowing-rain facility is not available or practical. This procedure is not intended to simulatenatural rainfall but will provide a high degree of confidence in the watertightness of materiel.
c. Procedure III - Drip. Procedure III is appropriate when materiel is normally protected from rain but maybe exposed to falling water from condensation or leakage from upper surfaces.
2.3 Determine Test Levels and Conditions.
Having selected this method and relevant procedures (based on the materiel's requirements documents and thetailoring process), it is necessary to complete the tailoring process by selecting specific parameter levels and specialtest conditions/techniques for these procedures based on requirements documents, Life Cycle Environmental Profile,Operational Environment Documentation (see Part One, Figure 1-1), and information provided with this procedure. From these sources of information, determine the functions to be performed by the materiel in rain environments orfollowing storage in rain environments. Then determine the rainfall levels of the geographical areas and micro-environments in which the materiel is designed to be employed. Variables under each test procedure include the testitem configuration, rainfall rate, wind velocity, test item exposure surfaces, water pressure, and any additionalappropriate guidelines in accordance with the requirements document.
2.3.1 Test item configuration.
Perform the test using all the configurations in which the materiel may be placed during its life cycle. As aminimum, consider the following configurations:
a. In a shipping/storage container or transit case.
b. Protected or not protected.
c. In its operational configuration.
d. Modified with kits for special applications.
NOTE: Do not use any sealing, taping, caulking, etc., except as required by the design specification for the materiel.Unless otherwise specified, do not use test items that have surface contamination such as oil, grease, or dirt, whichcould prevent wetting.
2.3.2 Rainfall rate.
The rainfall rate used in Procedure I may be tailored to the anticipated deployment locale and duration. Althoughvarious rainfall intensities have been measured in areas of heavy rainfall, recommend a minimum rate of 1.7 mm/min(4 in/hr) since it is not an uncommon occurrence and would provide a reasonable degree of confidence in themateriel. MIL-HDBK-310 contains further information.
Downloaded from http://www.everyspec.com on 2012-06-04T5:34:26.
MIL-STD-810F1 January 2000
METHOD 506.4506.4-4
2.3.3 Droplet size.
Nominal drop-size spectra exist for instantaneous rainfall rates but for the long-term rainfall rates they aremeaningless since rates are made up of many different instantaneous rates possessing different spectra (reference b). For Procedures I and II, use droplet sizes predominantly in the range of approximately 0.5 mm in diameter1/ (whichis considered to be mist or drizzle rather than rain (reference e), to 4.5 mm in diameter (reference i). For drip testsusing dispensing tubes (figure 506.4-1), polyethylene tubing sleeves added to the dispensing tubes will increase thedroplet size to its maximum.
NOTE: Observations have shown that water droplets introduced into a high velocity air stream tend to break up overdistance (references j and k). Accordingly, recommend introducing the droplets as close as possible to the test itemwhile assuring the droplets achieve the required velocity prior to impact with the test item.
2.3.4 Wind velocity.
High rainfall intensities accompanied by winds of 18 m/s (40 mph) are not uncommon during storms. Unlessotherwise specified or when steady state conditions are specified, recommend this velocity. Where facilitylimitations preclude the use of wind, use Procedure II or III.
2.3.5 Test item exposure surface (orientation).
Wind-blown rain will usually have more of an effect on vertical surfaces than on horizontal surfaces, and vice versafor vertical or near-vertical rain. Expose all surfaces onto which the rain could fall or be driven to the testconditions. Rotate the item as required to expose all vulnerable surfaces.
2.3.6 Water pressure.
Procedure II relies on pressurized water. Vary the pressure as necessary to comply with the requirement’sdocuments, but a minimum value of 276 kPa (40 psig) nozzle pressure is given as a guideline based on pastexperience. This value will produce water droplets traveling at approximately 64 km/h (40 mph) when a nozzle asspecified in paragraph 4.1.2 is used.
2.3.7 Preheat temperature.
Experience has shown that a temperature differential between the test item and the rainwater can affect the results ofa rain test. When specified for nominally sealed items, increasing the test item temperature to about 10°C higherthan the rain temperature at the beginning of each exposure period to subsequently produce a negative pressureinside the test item will provide a more reliable verification of its watertightness. Ensure the heating time is theminimum required to stabilize the test item temperature, and not sufficient to dry the test item when not openedbetween exposures.
2.3.8 Exposure duration.
Determine the exposure duration from the life cycle profile, but do not use a duration less than that specified in theindividual procedures. For items made of material that may absorb moisture, the duration may have to besignificantly extended to reflect real life cycle circumstances and, for drip tests, the drip rate appropriately reduced.
3. INFORMATION REQUIRED.
3.1 Pretest.
The following information is required to conduct rain tests adequately.
a. General. Information listed in Part One, paragraphs 5.7 and 5.9, and Appendix A, Task 405 of thisstandard.
1/Observations show there are no drops of less than roughly 0.5 mm diameter during intense rains (reference c).
Downloaded from http://www.everyspec.com on 2012-06-04T5:34:26.
MIL-STD-810F1 January 2000
METHOD 506.4506.4-5
b. Specific to this method.
(1) Rainfall rate.
(2) Exposure surfaces/duration.
(3) Test item preheat temperature.
(4) Initial water temperature.
(5) Wind velocity.
(6) Water pressure (if appropriate).
3.2 During Test.
For test validation purposes, record deviations from planned or pre-test procedures or parameter levels, includingany procedural anomalies that may occur.
3.3 Post-test.
Record the following post-test information.
a. General. Information listed in Part One, paragraph. 5.13, and in Appendix A, Task 406 of this standard.
b. Specific to this method.
(1) Surfaces of the test item subjected to rainfall.
(2) Duration of exposure per face.
(3) Results of inspection for water penetration (amount and probable point of entry).
(4) Results of operational checks.
(5) Length of time for each performance check.
4. TEST PROCESS.
4.1 Test Facility.
4.1.1 Procedure I.
a. Use a rain facility capable of producing falling rain at the rate specified herein. To produce the rain, usea water distribution device that produces droplets having a diameter range predominantly between 0.5mm and 4.5 mm. Ensure the rain is dispersed completely over the test item when accompanied by theprescribed wind. A water-soluble dye such as fluorescein may be added to the rainwater to aid inlocating and analyzing water leaks. For steady state rain, use either spray nozzles or the apparatus shownon figure 506.4-1, and position the dispenser at a height sufficient to ensure the drops approach terminalvelocity. It is not necessary to use de-ionized or distilled water for this test.
b. Position the wind source with respect to the test item so that it will cause the rain to beat directly, withvariations up to 45° from the horizontal, and uniformly against one side of the test item. Use a windsource that can produce horizontal wind velocities equal to and exceeding 18 m/s. Measure the windvelocity at the position of the test item before placement of the test item in the facility. Do not allow rustor corrosive contaminants on the test item.
4.1.2 Procedure II.
Use nozzles that produce a square spray pattern or other overlapping pattern (for maximum surface coverage) andwith a droplet size predominantly in the 0.5 to 4.5 mm range at approximately 276 kPa. Use at least one nozzle foreach 0.56m2 (6 ft2) of surface area and position each about 48 cm from the test surface. Adjust this distance asnecessary to achieve overlap of the spray patterns. A water-soluble dye such as fluorescein added to the rainwatermay aid in locating and analyzing any water leaks. For Procedure II, position the nozzles as required by the test planor as depicted on figure 506.4-2.
Downloaded from http://www.everyspec.com on 2012-06-04T5:34:26.
MIL-STD-810F1 January 2000
METHOD 506.4506.4-6
4.1.3 Procedure III.
Use a test setup that provides a volume of water greater than 280 l/m2/hr (7 gal/ft2/hr) dripping from a dispenser withdrip holes on a 20 to 25.4 mm pattern (depending on which dispenser is used) but without coalescence of the dripsinto a stream. Figures 506.4-1 and 506.4-3 provide possible dispenser designs. Either arrangement shown on figure506.4-1 is recommended over that of figure 506.4-3 due to its simplicity of construction, maintenance, cost, andreproducibility of tests. The polyethylene tubing is optional, but it ensures maximum droplet size. Use a drip heightthat ensures terminal velocity of the droplets (~9 m/s). Use a dispenser with a drip area large enough to cover theentire top surface of the test item. A water-soluble dye such as fluorescein added to the rainwater may aid in locatingand analyzing water leaks.
4.2 Controls.
a. For Procedures I and II, verify the rainfall rate immediately before each test.
b. For Procedure I, verify the wind velocity immediately before each test.
c. For Procedures I and II, verify the nozzle spray pattern and pressure before each test.
d. For Procedure III, verify the flow rate immediately before the test and ensure that only separate (ordiscrete) drops are issuing from the dispenser.
e. Unless otherwise specified, water used for rain tests can be from local water supply sources.
4.3 Test Interruption.
a. General. See Part One, paragraph 5.11 of this standard.
b. Specific to this method. Interruption of a rain test is unlikely to generate any adverse effects. Normally,continue the test from the point of interruption.
4.4 Execution.
The following steps, alone or in combination, provide the basis for collecting necessary information concerning themateriel's watertightness.
4.4.1 Preparation for test.
4.4.1.1 Preliminary steps.
Before starting the test, review pretest information in the test plan to determine test details (e.g., procedures, test itemconfiguration/orientation, cycles, durations, parameter levels for storage/operation, rainfall rates and wind velocities(for Procedures I), etc.). (See paragraph 3.1, above.)
4.4.1.2 Pretest standard ambient checkout.
All test items require a pretest standard ambient checkout to provide baseline data. Conduct the checkout as follows:
Step 1. Stabilize the test item at standard ambient conditions (Part One, paragraph 5.1), in the testchamber, whenever possible.
Step 2. Conduct a complete pretest examination and document the results.
Step 3. Prepare the test item in accordance with Part One, paragraph 5.8 and in the required test itemconfiguration.
Step 4. To establish baseline data, conduct an operational checkout in accordance with the test plan, andrecord the results.
4.4.2 Procedure I - Rain and blowing rain.
Step 1. With the test item in the facility and in its normal operating position, adjust the rainfall rate asspecified in the test plan. If the temperature differential between the water and the test item is lessthan 10qC, either heat the test item to a higher temperature than the rain water (see paragraph
Downloaded from http://www.everyspec.com on 2012-06-04T5:34:26.
MIL-STD-810F1 January 2000
METHOD 506.4506.4-7
2.3.7) such that the test item temperature has been stabilized at 10 +2qC above the rain watertemperature at the start of each exposure period (see paragraph 2.3.7), or cool the water. Restorethe test item to its normal operating configuration immediately before testing.
Step 2. Initiate the wind at the velocity specified in the test plan and maintain it for at least 30 minutes.Step 3. If required, operate the test for the last 10 minutes of the 30-minute rain.Step 4. Rotate the test item to expose it to the rain and blowing wind source to any other side of the test
item that could be exposed to blowing rain in its deployment cycle.Step 5. Repeat Steps 1 through 4 until all surfaces have been tested.Step 6. Examine the test item in the test chamber (if possible), otherwise, remove the test item from the
test facility and conduct a visual inspection. If water has penetrated the test item, judgment mustbe used before operation of the test item. It may be necessary to empty water from the test item(and measure the quantity) to prevent a safety hazard.
Step 7. Measure and document any free water found inside the protected areas of the test item.Step 8. If required, operate the test item for compliance with the requirements document, and document
the results.
4.4.3 Procedure II - Watertightness.
Step 1. Install the test item in the test facility with all doors, louvers, etc., closed.Step 2. Position the nozzles as required by the test plan or as indicated on figure 506.4-2.Step 3. Spray all exposed surfaces of the test item with water for not less than 40 minutes per face.Step 4. After each 40-minute spray period, inspect the interior of the test item for evidence of free water.
Estimate its volume and the probable point of entry and document.Step 5. Conduct an operational check of the test item as specified in the test plan, and document the
results.
4.4.4 Procedure III - Drip.
Step 1. Install the test item in the facility in accordance with Part One, paragraph 5.8 and in its operationalconfiguration with all connectors and fittings engaged. Ensure the temperature differentialbetween the test item and the water is 10qC or greater. If necessary, either raise the test itemtemperature or lower the water temperature to achieve the differential in paragraph 2.3.7, andrestore the test item to its normal operating configuration immediately before testing.
Step 2. With the test item operating, subject it to water falling from a specified height (no less than 1 meter(3 feet)) as measured from the upper main surface of the test item at a uniform rate for 15 minutesor as otherwise specified (see figure 506.4-1 or figure 506.4-3). Use a test setup that ensures thatall of the upper surfaces get droplets on them at some time during the test. For test items withglass-covered instruments, tilt them at a 45q angle, dial up.
Step 3. At the conclusion of the 15-minute exposure, remove the test item from the test facility and removesufficient panels or covers to allow the interior to be seen.
Step 4. Visually inspect the test item for evidence of water penetration.Step 5. Measure and document any free water inside the test item.Step 6. Conduct an operational check of the test item as specified in the test plan, and document the
results.
5. ANALYSIS OF RESULTS.
In addition to the guidance provided in Part One, paragraphs 5.14 and 5.17, the following information is provided toassist in the evaluation of the test results. Analyze any failure of a test item to meet the requirements of the materielspecifications and consider related information such as follows.
5.1 Operational Failures.
a. Degradation allowed in the performance characteristics because of rainfall exposure.
b. Necessity for special kits for special operating procedures.
c. Safety of operation.
Downloaded from http://www.everyspec.com on 2012-06-04T5:34:26.

MIL-STD-810F1 January 2000
METHOD 506.4506.4-8
5.2 Water Penetration.
Based on the individual materiel and the requirements for its non-exposure to water, determine if one of thefollowing is applicable:
a. Unconditional failure. Any evidence of water penetration into the test item enclosure following the raintest.
b. Acceptable water penetration. Water penetration of not more than 4 cm3 per 28,000 cm3 (1 ft3) of testitem enclosure provided the following conditions are met:
(1) There is no immediate effect of the water on the operation of the materiel.
(2) The test item in its operational configuration (transit/storage case open or removed) can successfullycomplete the aggravated temperature/humidity procedure of method 507.4.
6. REFERENCE/RELATED DOCUMENTS.
a. AR 70-38, Research, Development, Test and Evaluation of Materiel for Extreme Climatic Conditions.
b. MIL-HDBK-310, Global Climatic Data for Developing Military Products.
c. Synopsis of Background Material for MIL-STD-210B, Climatic Extremes for Military Equipment.Bedford, MA: Air Force Cambridge Research Laboratories, 1974, DTIC number AD-780-508.
d. Army Materiel Command Pamphlet AMCP-706-116, Engineering Design Handbook, EnvironmentalFactors.
e. Huschke, R. E. (ed.), Glossary of Meteorology. Boston: American Meteorological Society, 1970.
f. RTCA/DO-160D, Environmental Conditions and Test Procedures for Airborne Equipment.
g. Tattelman, P.I., and Sissenwine, N., Extremes of Hydrometers at Altitude for MIL-STD-210B:Supplement Drop Size Distributions (1973), AFCRL-TR-73-0008, AFSG 253.
h. R.M. Clayton et al, Rain Simulation for High-Intensity Acoustic Noise Cavities. Jet PropulsionLaboratory, California Institute of Technology, Pasadena, CA, Report NPO-17237/6745.
i. Rogers, R.R., Short Course in Cloud Physics, Pergamon Press, Oxford; 1979.
j. STANAG 4370, Environmental Testing.
k. Allied Environmental Conditions and Test Publication 300, Climatic Environmental Testing (underSTANAG 4370).
Downloaded from http://www.everyspec.com on 2012-06-04T5:34:26.
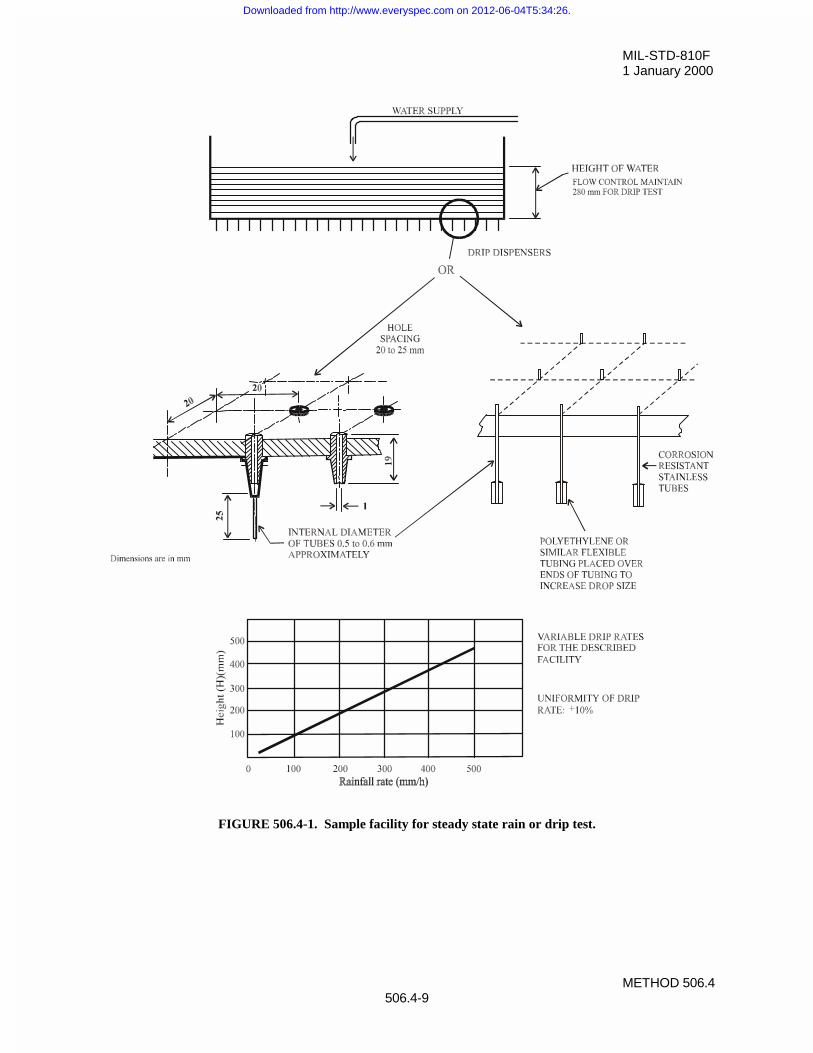
MIL-STD-810F1 January 2000
METHOD 506.4506.4-9
FIGURE 506.4-1. Sample facility for steady state rain or drip test.
Downloaded from http://www.everyspec.com on 2012-06-04T5:34:26.
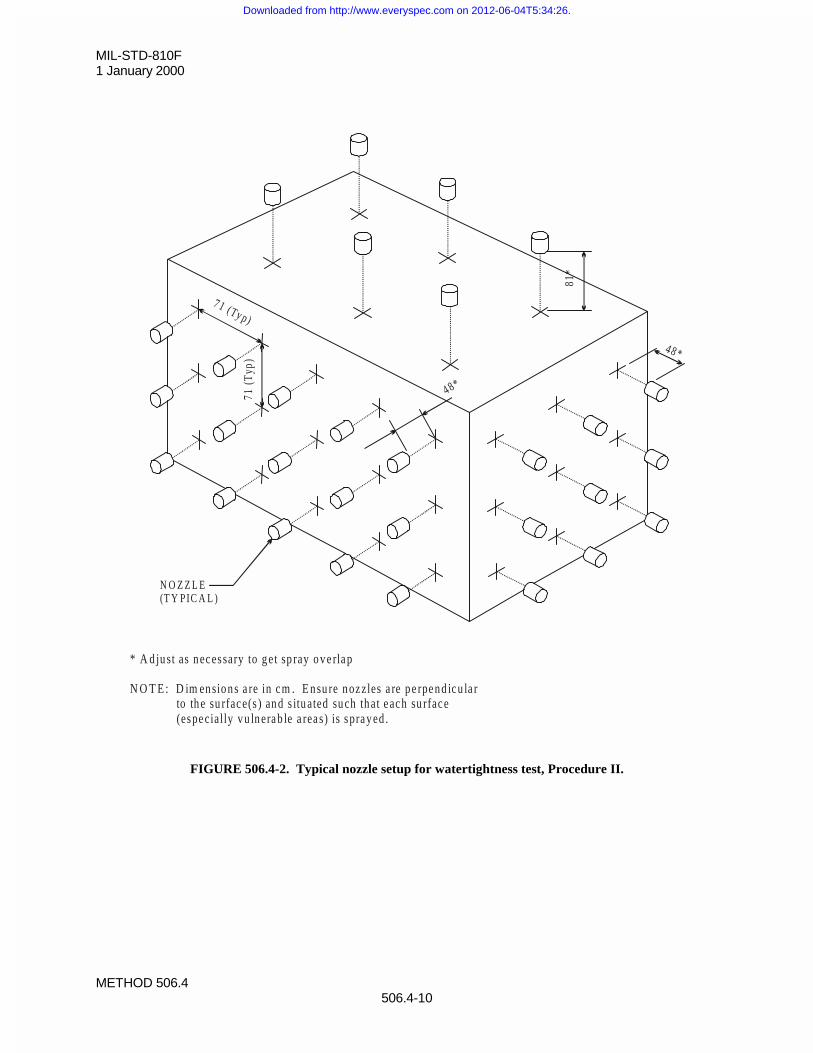
MIL-STD-810F1 January 2000
METHOD 506.4506.4-10
FIGURE 506.4-2. Typical nozzle setup for watertightness test, Procedure II.
81*
7 1 (Ty p)
71 (T
yp)
4 8 *
48*
N O Z Z L E(T Y PIC A L )
* A d ju st as n ec essary to g e t sp ray o v e rla p
N O T E : D im ensions a re in cm . E n su re nozzles a re pe rpend icu la r to th e su rface(s ) an d s itu ated su ch th at e ach su rface (espe cially v u ln erab le a rea s) is spray ed .
Downloaded from http://www.everyspec.com on 2012-06-04T5:34:26.
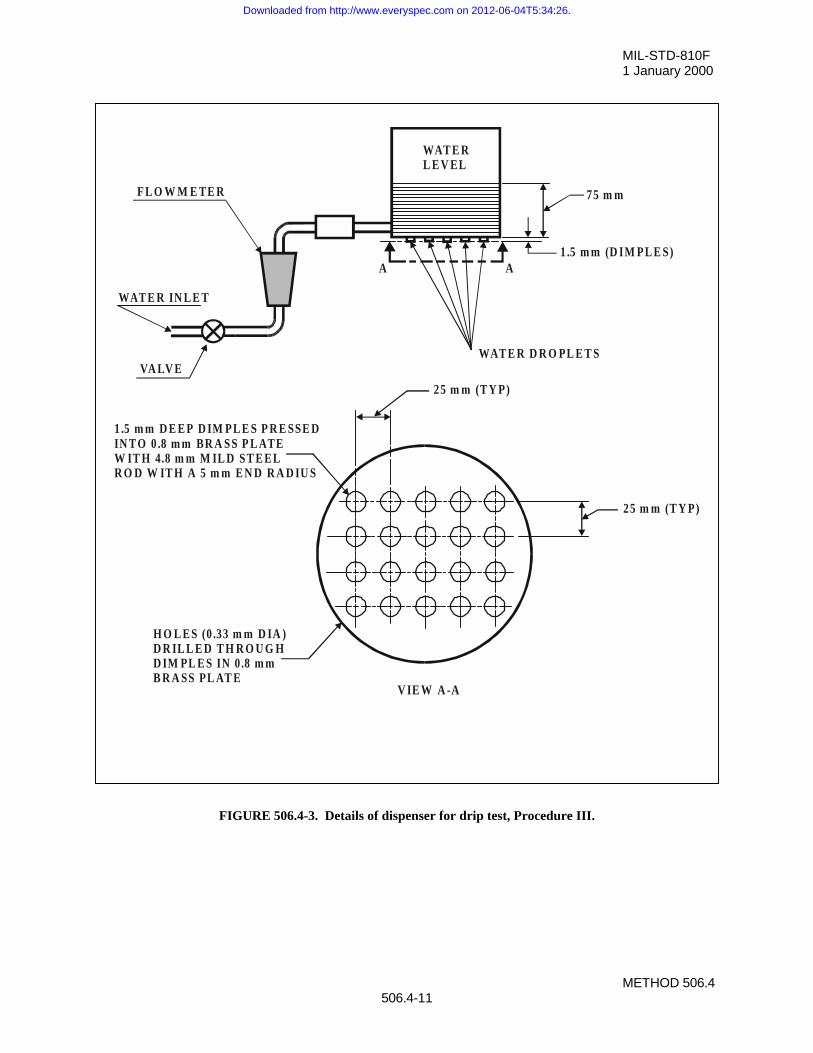
MIL-STD-810F1 January 2000
METHOD 506.4506.4-11
FIGURE 506.4-3. Details of dispenser for drip test, Procedure III.
25 m m (T Y P)
25 m m (T Y P)
V IE W A -A
1.5 m m D E E P D IM PL E S P R E SSE DIN T O 0 .8 m m BR A SS P L ATEW IT H 4.8 m m M IL D ST E E LR O D W IT H A 5 m m E N D R A D IU S
H O L E S (0 .33 m m D IA )D R IL L E D T H R O U G HD IM PL E S IN 0.8 m mB R A SS PL AT E
WAT E RL E V EL
WAT E R IN L E T
VA LV E
FL O W M E TE R
A A
75 m m
1.5 m m (D IM PL E S)
WAT E R D R O PL E T S
Downloaded from http://www.everyspec.com on 2012-06-04T5:34:26.

MIL-STD-810F1 January 2000
METHOD 506.4506.4-12
THIS PAGE INTENTIONALLY BLANK
Downloaded from http://www.everyspec.com on 2012-06-04T5:34:26.
MIL-STD-810F1 January 2000
METHOD 507.4507.4-1
METHOD 507.4
HUMIDITY
NOTE: Tailoring is essential. Select methods, procedures, and parameter levels based on the tailoring processdescribed in Part One, paragraph 4.2.2, and Appendix C. Apply the general guidelines for laboratory test methodsdescribed in Part One, paragraph 5 of this standard.
1. SCOPE.
1.1 Purpose.
The purpose of this method is to determine the resistance of materiel to the effects of a warm, humid atmosphere.
1.2 Application.
This method applies to materiel that is likely to be stored or deployed in a warm, humid environment or anenvironment in which high levels of humidity occur. Although it is preferable to test materiel at appropriate naturalenvironment sites, it is not always practical because of logistical, cost, or schedule considerations. Warm, humidconditions can occur year-round in tropical areas, seasonally in mid-latitude areas, and in materiel subjected tocombinations of changes in pressure, temperature, and relative humidity. Other high levels of humidity can existworldwide.
1.3 Limitations.
This method may not reproduce all of the humidity effects associated with the natural environment such as long-termeffects, nor with low humidity situations. This method does not attempt to duplicate the complextemperature/humidity environment but, rather, it provides a generally stressful situation that is intended to revealpotential problem areas in the materiel. Therefore, this method does not contain natural or inducedtemperature/humidity cycles as in previous editions. Specifically, this method does not address:
a. Condensation resulting from changes of pressure and temperature for airborne or ground materiel.
b. Condensation resulting from black-body radiation (e.g., night sky effects).
c. Synergistic effects of humidity or condensation combined with biological and chemicalcontaminants.
d. Liquid water trapped within materiel or packages and retained for significant periods.
e. This method is not intended for evaluating the internal elements of a hermetically sealed assemblysince such materiel is air-tight.
2. TAILORING GUIDANCE.
2.1 Selecting the Humidity Method.
After examining requirements documents and applying the tailoring process in Part One of this standard to determineif warm temperature/humidity conditions are anticipated in the life cycle of materiel, use the following to confirm theneed for this method and to place it in sequence with other methods.
2.1.1 Effects of warm, humid environments.
Humidity has physical and chemical effects on materiel; the temperature and humidity variations can also triggercondensation inside materiel. Consider the following typical problems to help determine if this method isappropriate for the materiel being tested. This list is not intended to be all-inclusive.
a. Surface effects, such as:
Downloaded from http://www.everyspec.com on 2012-06-04T5:34:26.
MIL-STD-810F1 January 2000
METHOD 507.4507.4-2
(1) Oxidation and/or galvanic corrosion of metals.
(2) Increased chemical reactions.
(3) Chemical or electrochemical breakdown of organic and inorganic surface coatings.
(4) Interaction of surface moisture with deposits from external sources to produce a corrosive film.
(5) Changes in friction coefficients, resulting in binding or sticking.
b. Changes in material properties, such as:
(1) Swelling of materials due to sorption effects.
(2) Other changes in properties.
(a) Loss of physical strength.
(b) Electrical and thermal insulating characteristics.
(c) Delamination of composite materials.
(d) Change in elasticity or plasticity.
(e) Degradation of hygroscopic materials.
(f) Degradation of explosives and propellants by absorption.
(g) Degradation of optical element image transmission quality.
(h) Degradation of lubricants.
c. Condensation and free water, such as:
(1) Electrical short circuits.
(2) Fogging of optical surfaces.
(3) Changes in thermal transfer characteristics.
2.1.2 Sequence among other methods.
a. General. See Part One, paragraph 5.5.
b. Unique to this method. Humidity testing may produce irreversible effects. If these effects couldunrealistically influence the results of subsequent tests on the same item(s), perform humidity testingfollowing those tests. Also, because of the potentially unrepresentative combination of environmentaleffects, it is generally inappropriate to conduct this test on the same test sample that has previously beensubjected to salt fog, sand and dust, or fungus tests.
2.2 Selecting Procedure Variations.
This method has one procedure. Possible variations are described below.
2.2.1 Test duration.
The minimum number of 48-hour cycles for this test is five. This has historically proven adequate to reveal potentialeffects in most materiel. Extend the test as specified in the test plan to provide a higher degree of confidence in themateriel to withstand warm, humid conditions.
2.2.2 Temperature/humidity levels.
Although the combined 60qC and 95% RH does not occur in nature, these levels of temperature and relativehumidity have historically provided an indication of potential problem areas in materiel.
Downloaded from http://www.everyspec.com on 2012-06-04T5:34:26.
MIL-STD-810F1 January 2000
METHOD 507.4507.4-3
2.3 Test Variations.
The most important ways the test can vary are in the number of temperature-humidity cycles, relative humidity, andtemperature levels and durations, test item operation and performance monitoring, and test item ventilation.
2.4 Philosophy of Testing.
The purpose of the test procedure described in this method is to produce representative effects that typically occurwhen materiel is exposed to elevated temperature-humidity conditions in actual service. (See paragraph 2.1.1,above, for categories and examples of these effects.) Accordingly, this procedure does not reproduce naturallyoccurring or service-induced temperature-humidity time histories, nor is it intended to produce humidity effects thathave been preceded by solar effects. It may induce problems that are indicative of long-term effects. Test itemfailures do not necessarily indicate failures in the real environment.
2.5 Alternative Tests.
If materiel specification documents suggest the use of natural or induced cycles as in AR 70-38 or NATO STANAG2895 during laboratory tests, exercise caution in applying such cycles and in interpreting test results. The complextemperature/humidity environment with its associated antagonistic elements such as microbial growth, acidicatmosphere, and other biological elements produce synergistic effects that cannot be practically duplicated in thelaboratory. Coupled with these test data interpretation problems are the extensive durations of real-worldenvironments that, in most cases, are too lengthy to realistically apply in the laboratory.
3. INFORMATION REQUIRED.
3.1 Pretest.
The following information is required to conduct humidity tests adequately.
a. General. Information listed in Part One, paragraphs 5.7 and 5.9, and Appendix A, Task 405 of thisstandard.
b. Specific to this method.
(1) Any sealed areas of the test item to be opened during testing or vice versa.
(2) Periods of materiel operation or designated times for visual examinations.
(3) Operating test procedures, if appropriate.
3.2 During Test.
Collect the following information during conduct of the test:
a. General. Information listed in Part One, paragraph 5.10, and in Appendix A, Task 406 of this standard.
b. Specific to this method.
(1) Record of chamber temperature and humidity versus time conditions.
(2) Test item performance data and time/duration of checks.
3.3 Post Test.
The following post test information is required.
a. General. Information listed in Part One, paragraph 5.13, and in Appendix A, Task 406 of this standard.
b. Specific to this method.
(1) Previous test methods to which the test item has been subjected.
(2) Results of each performance check (before, during, and after test) and visual examination (andphotographs, if applicable).
Downloaded from http://www.everyspec.com on 2012-06-04T5:34:26.
MIL-STD-810F1 January 2000
METHOD 507.4507.4-4
(3) Length of time required for each performance check.
(4) Exposure durations and/or number of test cycles.
(5) Test item configuration and special test setup provisions.
4. TEST PROCESS.
4.1 Test Facility.
Ensure the apparatus used in performing the humidity test includes the following:
4.1.1 General description.
The required apparatus consists of a chamber or cabinet, and auxiliary instrumentation capable of maintaining andmonitoring (see Part One, paragraph 5.18) the required conditions of temperature and relative humidity throughoutan envelope of air surrounding the test item. (See Part One, paragraph 5.)
4.1.2 Facility design.
Unless otherwise specified, use a test chamber or cabinet with a test volume and the accessories contained thereinconstructed and arranged in such a manner as to prevent condensate from dripping on the test item. Vent the testvolume to the atmosphere to prevent the buildup of total pressure and prevent contamination from entering.
4.1.3 Test sensors and measurements.
Determine the relative humidity by employing either solid-state sensors whose calibration is not affected by watercondensation, or by an equivalent method such as fast-reacting wet-bulb/dry-bulb sensors or dew point indicators. Sensors that are sensitive to condensation, such as the lithium chloride type, are not recommended for tests with highrelative humidity levels. A data collection system, including an appropriate recording device(s), separate from thechamber controllers is necessary to measure test volume conditions. If charts are used, use charts readable to within±0.6qC. If the wet-wick control method is approved for use, clean the wet bulb and tank and install a new wickbefore each test and at least every 30 days. Ensure the wick is as thin as realistically possible to facilitateevaporation (approximately 1/16” thick) consistent with maintaining a wet surface around the sensor. Use water inwet-wick systems which is of the same quality as that used to produce the humidity. When physically possible,visually examine the water bottle, wick, sensor, and other components making up relative humidity measuringsystems at least once every 24 hours during the test to ensure they are functioning as desired.
4.1.4 Air velocity.
Use an air velocity flowing across the wet-bulb sensor of not less than 4.6 meters/second (900 feet/minute), andensure the wet wick is on the suction side of the fan to eliminate the effect of fan heat. Maintain the flow of airanywhere within the envelope of air surrounding the test item between 0.5 and 1.7 meters/second (98 to 335feet/minute).
4.1.5 Humidity generation.
Use steam or water injection to create the relative humidity within the envelope of air surrounding the test item. Usewater as described in Part One, paragraph 5.16. Verify its quality at periodic intervals (not to exceed 15 days) toensure its acceptability. If water injection is used to humidify the envelope of air, temperature-condition it before itsinjection to prevent upset of the test conditions, and do not inject it directly into the test section. From the testvolume drain and discard any condensate developed within the chamber during the test.
4.1.6 Contamination prevention.
Do not bring any material other than water into physical contact with the test item(s) that could cause the test item(s)to deteriorate or otherwise affect the test results. Do not introduce any rust or corrosive contaminants or any materialother than water into the chamber test volume. Achieve dehumidification, humidification, heating and cooling of the
Downloaded from http://www.everyspec.com on 2012-06-04T5:34:26.
MIL-STD-810F1 January 2000
METHOD 507.4507.4-5
air envelope surrounding the test item by methods that do not change the chemical composition of the air, water, orwater vapor within that volume of air.
4.2 Controls.
a. Ensure the test chamber includes an appropriate measurement and recording device(s), separate from thechamber controllers.
b. Test parameters. Unless otherwise specified, make continuous analog temperature and relative humiditymeasurements during the test. Conduct digital measurements at intervals of 15 minutes or less.
c. Capabilities. Use only instrumentation with the selected test chamber that meets the accuracies,tolerances, etc., of Part One, paragraph 5.3.
4.3 Test Interruption.
a. General. See Part One, paragraph 5.11, of this standard.
b. Specific to this method.
(1) Undertest interruption. If an unscheduled interruption occurs that causes the test conditions to fallbelow allowable limits, the test must be reinitiated at the end of the last successfully completedcycle.
(2) Overtest interruptions. If the test item(s) is exposed to test conditions that exceed allowable limits,conduct an appropriate physical examination of the test item and perform an operational check(when practical) before testing is resumed. This is especially true where a safety condition couldexist, such as with munitions. If a safety condition is discovered, the preferable course of action is toterminate the test and reinitiate testing with a new test item. If this is not done and test item failureoccurs during the remainder of the test, the test results may be considered invalid. If no problem hasbeen encountered, reestablish pre-interruption conditions and continue from the point where the testtolerances were exceeded.
4.4 Test Setup.
a. General. See Part One, paragraph 5.8.
b. Unique to this method. Verify that environmental monitoring and measurement sensors are of anappropriate type and properly located to obtain the required test data.
4.5 Test Execution.
The following steps, alone or in combination, provide the basis for collecting necessary information concerning thetest item in a warm, humid environment.
4.5.1 Preparation for test.
4.5.1.1 Preliminary steps.
Before starting the test, determine the test details (e.g., procedure variations, test item configuration, cycles,durations, parameter levels for storage/operation, etc.) from the test plan.
4.5.1.2 Pretest standard ambient checkout.
All items require a pretest checkout at room ambient conditions to provide baseline data. Conduct the checkout asfollows:
Step 1. Install the test item into the test chamber and conduct an operational checkout (if appropriate) inaccordance with the test plan.
Downloaded from http://www.everyspec.com on 2012-06-04T5:34:26.
MIL-STD-810F1 January 2000
METHOD 507.4507.4-6
Step 2. Prepare the test item in its required configuration in accordance with Part One, paragraph 5.8.1.Step 3. Conduct a thorough visual examination of the test item to look for conditions that could
compromise subsequent test results.Step 4. Document any significant results.Step 5. Conduct an operational checkout (if appropriate) in accordance with the test plan, and record
results.
4.5.2 Procedure.
This test consists of a 24-hour conditioning period (to ensure all items at any intended climatic test location will startwith the same conditions), followed by a repeating 48-hour temperature and humidity cycle for the number of cyclesspecified in the test plan.
Step 1. With the test item installed in the test chamber in its required configuration, adjust the temperatureto 23 r2qC and 50 r5% RH, and maintain for 24 hours.
Step 2. Adjust the chamber temperature to 30qC and the RH to 95%.Step 3. Expose the test item(s) to the appropriate number of test cycles (figure 507.4-1) as determined in
paragraph 2.2.1. Conduct test item performance checks during the periods shown and documentthe results.
Step 4. At the end of the required number of cycles, adjust the temperature and humidity conditions tostandard ambient conditions.
Step 5. In order to prevent unrealistic drying, within 15 minutes after Step 3 is completed, conduct anoperational performance check, if applicable, and document the results. If the check cannot becompleted within 30 minutes, recondition the test item at 30qC and 95% RH for one hour, and thencontinue the checkout.
Step 6. Perform a thorough visual examination of the test item and document any conditions resulting fromhumidity exposure.
5. ANALYSIS OF RESULTS. In addition to the guidance provided in Part One, paragraphs 5.14 and 5.17, the following information is provided toassist in the evaluation of the test results.
a. Allowable or acceptable degradation in operating characteristics.
b. Possible contributions from special operating procedures or special test provisions needed to performtesting.
c. Whether it is appropriate to separate temperature effects from humidity effects.
6. REFERENCE/RELATED DOCUMENTS.
a. AR 70-38, Research, Development, Test and Evaluation of Materiel for Extreme Climatic Conditions.
b. MIL-HDBK-310, Global Climatic Data for Developing Military Products.
c. Synopsis of Background Material for MIL-STD-210B, Climatic Extremes for Military Equipment,Bedford, MA: Air Force Cambridge Research Laboratories, 24 January 1974. DTIC numberAD-780-508.
d. STANAG 2895, Climatic Environmental Conditions Affecting the Design of Materiel for Use of NATOForces.
Downloaded from http://www.everyspec.com on 2012-06-04T5:34:26.
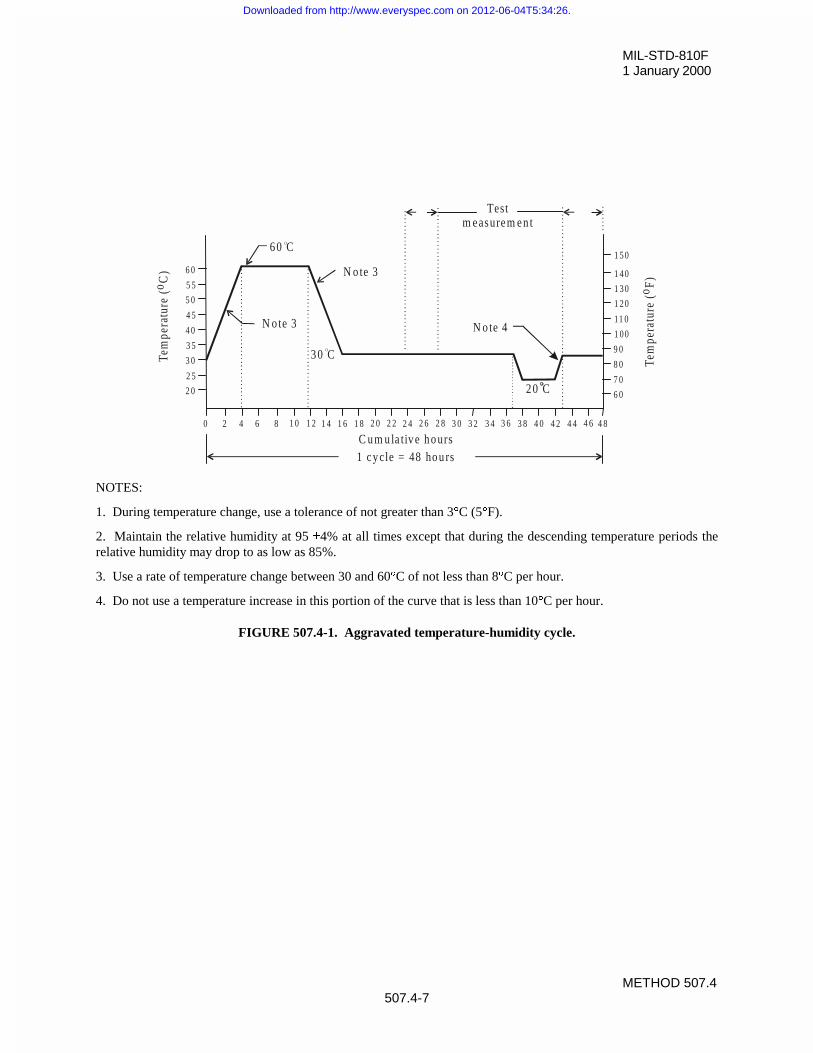
MIL-STD-810F1 January 2000
METHOD 507.4507.4-7
NOTES:
1. During temperature change, use a tolerance of not greater than 3qC (5qF).
2. Maintain the relative humidity at 95 r4% at all times except that during the descending temperature periods therelative humidity may drop to as low as 85%.
3. Use a rate of temperature change between 30 and 60qC of not less than 8qC per hour.
4. Do not use a temperature increase in this portion of the curve that is less than 10qC per hour.
FIGURE 507.4-1. Aggravated temperature-humidity cycle.
2 0
3 0
3 5
4 0
2 5
4 5
5 0
5 5
6 0
6 0
8 0
9 0
1 0 0
7 0
11 0
1 2 0
1 3 0
1 4 0
1 5 0
0 1 0 1 2 1 4 1 6 2 01 8 2 2 2 4 2 6 2 8 3 0 3 2 3 4 3 6 3 8 4 0 4 2 4 4 4 6 4 8
1 c y cle = 48 ho u rsC u m u la tiv e h o urs
N o te 3
3 0 CO
N o te 3
6 0 CO
N o te 4
2 0 C
Testm easurem en t
Tem
pera
ture
(o C
)
Tem
pera
ture
(o F)
2 4 6 8
Downloaded from http://www.everyspec.com on 2012-06-04T5:34:26.

MIL-STD-810F1 January 2000
METHOD 507.4507.4-8
THIS PAGE INTENTIONALLY BLANK
Downloaded from http://www.everyspec.com on 2012-06-04T5:34:26.
MIL-STD-810F1 January 2000ANNEX A
METHOD 507.4507.4A-1
ANNEX A
Physical Phenomena Associated with Humidity1. CONDENSATION.
Precipitation of water vapor on a surface whose temperature is lower than the dew point of the ambient air. As aconsequence, the water is transformed from the vapor state to the liquid state.
The dew point depends on the quantity of water vapor in the air. The dew point, the absolute humidity and the vaporpressure are directly interdependent. Condensation occurs on a test item when the temperature at the surface of theitem placed in the test chamber is lower than the dew point of the air in the chamber. As a result, the item may needto be preheated to prevent condensation.
Generally speaking, condensation can only be detected with certainty by visual inspection. This, however, is notalways possible, particularly with small objects having a rough surface. If the test item has a low thermal constant,condensation can only occur if the air temperature increases abruptly, or if the relative humidity is close to 100%. Slight condensation may be observed on the inside surface of box structures resulting from a decrease in the ambienttemperature.
2. ADSORPTION.
Adherence of water vapor molecules to a surface whose temperature is higher than the dew point. The quantity ofmoisture that can adhere to the surface depends on the type of material, its surface condition, and the vapor pressure. An estimation of the effects due solely to adsorption is not an easy matter because the effects of absorption, whichoccurs at the same time, are generally more pronounced.
3. ABSORPTION.
The accumulation of water molecules within material. The quantity of water absorbed depends, in part, on the watercontent of the ambient air. The process of absorption occurs continuously until equilibrium is reached. Thepenetration speed of the molecules in the water increases with temperature.
4. DIFFUSION.
Movement of water molecules through material caused by a difference in partial pressures. An example of diffusionoften encountered in electronics is the penetration of water vapor through organic coatings such as those oncapacitors or semiconductors, or through the sealing compound in the box.
5. BREATHING.
Air exchange between a hollow space and its surroundings caused by temperature variations. This commonlyinduces condensation inside the hollow space.
Downloaded from http://www.everyspec.com on 2012-06-04T5:34:26.

MIL-STD-810F1 january 2000ANNEX A
METHOD 507.4507.4A-2
THIS PAGE INTENTIONALLY BLANK
Downloaded from http://www.everyspec.com on 2012-06-04T5:34:26.
MIL-STD-810F1 January 2000
METHOD 508.5508.5-1
METHOD 508.5
FUNGUS
NOTE: Tailoring is essential. Select methods, procedures and parameter levels based on the tailoring processdescribed in Part One, paragraph 4, and Appendix C. Apply the general guidelines for laboratory test methodsdescribed in Part One, paragraph 5 of this standard.
1. SCOPE.
1.1 Purpose.The purpose of this fungus test is to assess the extent to which materiel will support fungal growth and how anyfungal growth may affect performance or use of the materiel. The primary objectives of the fungus test are todetermine:
a. if the materials comprising the materiel, or the assembled combination of same, will support fungal growth,and if so, of what species.
b. how rapidly fungus will grow on the materiel.
c. how fungus affects the materiel, its mission, and its safety for use following the growth of fungus on themateriel.
d. if the materiel can be stored effectively in a field environment.
e. if there are simple reversal processes, e.g., wiping off fungal growth.
1.2 Application.Since microbial deterioration is a function of temperature and humidity and is an inseparable condition of hot,humid tropics and the midlatitudes, consider it in the design of all standard, general-purpose materiel. This methodis used to determine if fungal growth will occur and, if so, how it may degrade/impact the use of the materiel.
NOTE: This test procedure and the accompanying preparation and post test analysis involve highly specializedtechniques and potentially hazardous organisms. Use only technically qualified personnel (e.g., microbiologists) toperform the test.
1.3 Limitations.This test is designed to obtain data on the susceptibility of materiel. Do not use it for testing of basic materials sincevarious other test procedures, including soil burial, pure culture, mixed culture, and plate testing are available.
NOTE: Although the basic (documented) resistance of materials to fungal growth is helpful in the design of newmateriel, the combination of materials, the physical structure of combined materials, and the possible contaminationof resistant materials during manufacture necessitate laboratory or natural environment tests to verify the resistanceof the assembled materiel to fungal growth.
2. TAILORING GUIDANCE.
2.1 Selecting the Fungus Method.After examining requirements documents and applying the tailoring process in Part One of this standard todetermine where fungal growth is anticipated in the life cycle of materiel, use the following to confirm the need forthis method and to place it in sequence with other methods.
2.1.1 Effects of fungus growth.Fungal growth impairs the functioning or use of materiel by changing its physical properties.
Downloaded from http://www.everyspec.com on 2012-06-04T5:34:26.
MIL-STD-810F1 January 2000
METHOD 508.5508.5-2
2.1.1.1 Detrimental effects.The detrimental effects of fungal growth are summarized as follows:
a. Direct attack on materials. Nonresistant materials are susceptible to direct attack as the fungus breaks thematerials down and uses them as nutrients. This results in deterioration affecting the physical properties ofthe material. Examples of nonresistant materials are:
(1) Natural material. Products of natural origin are most susceptible to this attack.
(a) Cellulosic materials (e.g., wood, paper, natural fiber textiles, and cordage).
(b) Animal- and vegetable-based adhesives.
(c) Grease, oils, and many hydrocarbons.
(d) Leather.
(2) Synthetic materials.
(a) PVC formulations (e.g., those plasticized with fatty acid esters).
(b) Certain polyurethanes (e.g., polyesters and some polyethers).
(c) Plastics that contain organic fillers of laminating materials.
(d) Paints and varnishes that contain susceptible constituents.
b. Indirect attack on materials. Damage to fungus-resistant materials results from indirect attack when:
(1) Fungal growth on surface deposits of dust, grease, perspiration, and other contaminants (that findtheir way onto materiel during manufacture or accumulate during service) causes damage to theunderlying material, even though that material may be resistant to direct attack.
(2) Metabolic waste products (i.e., organic acids) excreted by fungus cause corrosion of metals, etchingof glass, or staining or degrading of plastics and other materials.
(3) The products of fungus on adjacent materials that are susceptible to direct attack come in contactwith the resistant materials.
2.1.1.2 Physical interference.Physical interference can occur as follows:
a. Electrical or electronic systems. Damage to electrical or electronic systems may result from either direct orindirect attack. Fungi can form undesirable electrical conducting paths across insulating materials, forexample, or may adversely affect the electrical characteristics of critically adjusted electronic circuits.
b. Optical systems. Damage to optical systems results primarily from indirect attack. The fungus canadversely affect light transmission through the optical system, block delicate moving parts, and changenonwetting surfaces to wetting surfaces with resulting loss in performance.
2.1.1.3 Health and aesthetic factors.Fungus on materiel can cause physiological problems (e.g., allergies) or be so aesthetically unpleasant that the userswill be reluctant to use the materiel.
2.1.2 Sequence among other methods.
a. General. See Part One, paragraph 5.5.
b. Unique to this method. Because of the potentially unrepresentative combination of environmental effects,it is generally inappropriate to conduct this test on the same test sample previously subjected to salt fog,sand and dust, or humidity tests. However, if it is necessary, perform the fungus test before the salt fog orsand and dust tests. A heavy concentration of salt may affect the germinating fungus growth, and sand anddust can provide nutrients, thus leading to a false indication of the biosusceptibility of the test item.
Downloaded from http://www.everyspec.com on 2012-06-04T5:34:26.
MIL-STD-810F1 January 2000
METHOD 508.5508.5-3
2.2 Selecting Procedure Variations.This method has one procedure. Since the combination of temperature and humidity is critical to microbial growth,it is essential that these be maintained as specified in the procedure. However, other possible variations aredescribed below.
2.2.1 Test duration.Twenty-eight days is the minimum test period to allow for fungus germination, breakdown of carbon-containingmolecules, and degradation of material. Since indirect effects and physical interference are not likely to occur in therelatively short time frame of the fungus test, consider extension of the exposure period to 84 days if a greaterdegree of certainty (less risk) is required in determining the existence or effect of fungus growth.
2.2.2 Choice of fungus.Two groups of fungus (U.S. and European) are commonly used and are listed in table 508.5-I. Use one group or theother and, if necessary, adjust it as in paragraph 2.2.2b. These organisms were selected because of their ability todegrade materials, their worldwide distribution and their stability. To aid in selection of a species to supplement theselected group, the organisms have, where possible, been identified with respect to the materials to which they areknown to attack, and should be selected accordingly.
a. Because the test item is not sterile before testing, other microorganisms will be present on the surfaces.When the test item is inoculated with the selected group of fungi, both these and the other organisms willcompete for available nutrients. It is not surprising to see organisms other than the test fungi growing onthe test item at the end of the test.
b. Add additional species of fungus to those required in this test method. However, if additional fungi areused, base their selection on prior knowledge of specific material deterioration. For example,Aureobasidium pullulans was once employed because of its known specificity for degrading paints. (It hassince been deleted from the suggested European species because of mutations to the strain.)
3. INFORMATION REQUIRED.
3.1 Pretest.The following information is required to conduct fungus tests adequately.
a. General. Information listed in Part One, paragraphs 5.7 and 5.9, and Appendix A, Task 405 of thisstandard.
b. Specific to this method.
(1) Which set of fungi to be used (U.S. or European).
(2) Additional species to be added.
3.2 During Test.Collect the following information during conduct of the test:
a. General. Information listed in Part One, paragraph 5.10, and in Appendix A, Task 406 of this standard.
b. Specific to this method.
(1) Record of chamber temperature and RH versus time conditions.
(2) Evidence of fungus growth on the cotton control strips at the 7-day check.
(3) Location of any fungal growth.
3.3 Post Test.The following post test information is required.
Downloaded from http://www.everyspec.com on 2012-06-04T5:34:26.
MIL-STD-810F1 January 2000
METHOD 508.5508.5-4
a. General. Information listed in Part One, paragraph 5.13, and in Appendix A, Task 406 of this standard.
b. Specific to this method.
(1) Evidence of fungus growth at the end of the test. If growth is found, identify the species.
(2) Narrative description of growth, including colors, areas covered, growth patterns, and density ofgrowth (and photographs, if possible). (See table 508.5-II.)
(3) Effect of fungus on performance or use:
(a) As received from the chamber.
(b) After removal of fungus, if appropriate.
(c) Physiological or aesthetic considerations.
(4) Observations to aid in failure analysis.
4. TEST PROCESS.
4.1 Test Facility.In addition to the standard requirements for test chambers, the following apply to chambers to be used for fungustests.
4.1.1 Test chamber.Construct the chamber and accessories in such a manner as to prevent condensation from dripping on the test item.Filter-vent the chamber to the atmosphere to prevent the buildup of pressure and release of spores into theatmosphere.
4.1.2 Sensors.Monitor and control the humidity inside the test enclosure using psychrometric systems or with sensors that are notaffected by condensation (see Part One, paragraph 5.18). Record the humidity and temperature using sensorsseparate from those used to control the chamber environment.
4.1.3 Air velocity.Ensure the speed of the air across the psychrometric sensors is at least 4.5 m/s in order to achieve the requiredevaporation and sensor response. (If necessary to obtain this speed in the vicinity of the probe, use diffusers ifdesired.) However, control the air velocity in the vicinity of the test item and controls to between 0.5 and 1.7 m/sec(98 to 335 ft/min). Install deflectors or screens around the test item if necessary. In order to prevent heating of thepsychrometer sensors, install the sensors either upstream of any fan used to create the air velocity, or far enoughdownstream not to be affected by fan motor heat.
4.2 Controls.In addition to the information provided in Part One, paragraph 5, the following controls apply to this test.
4.2.1 Relative humidity.In addition to the requirements appropriate for method 507.4, Humidity, and water purity as described in Part One,paragraph 5.16, determine the relative humidity by employing either solid state sensors whose calibration is notaffected by water condensation, or by an approved equivalent method such as fast-reacting wet bulb/dry bulbsensors. Do not use lithium chloride sensors because of their sensitivity to condensation.
a. When the wet bulb control method is used, clean the wet bulb assembly and install a new wick for eachtest.
Downloaded from http://www.everyspec.com on 2012-06-04T5:34:26.
MIL-STD-810F1 January 2000
METHOD 508.5508.5-5
b. In order to produce the evaporation necessary for sensor measurement of wet bulb temperature, ensure theair velocity across the wet bulb is not less than 4.5 meters per second.
c. Because heat from fan motors may affect temperature readings, do not install wet and dry bulb sensorsclose to the discharge side of any local fan or blower used to create the requirement of paragraph 4.2.1b.
4.2.2 Circulation.Maintain free circulation of air around the test item and keep the contact area of fixtures supporting the test item to aminimum.
4.2.3 Steam.Do not inject steam directly into the test chamber working space where it may have an adverse effect on the test itemand microbial activity.
4.2.4 Unless otherwise specified:a. Use only reagents that conform to the specifications of the Committee on Analytical Reagents of the
American Chemical Society, where such specifications are available.
b. References to water means distilled water or water of equal purity. (See Part One, paragraph 5.16.)
4.3 Test Interruption.
a. General. See Part One, paragraph 5.11, of this standard.
b. Specific to this method. The fungus test, unlike other environmental tests, involves living organisms. Ifthe test is interrupted, the fact that live organisms are involved must be considered.
(1) If the interruption occurs during the first ten days of the test, restart the test from the beginning witheither a new or cleaned test item.
(2) If the interruption occurs late in the test cycle, examine the test item for evidence of fungus growth.If the test item is bio-susceptible, there is no need for a retest. If the controls exhibit viable growthbut there is no evidence of fungus growth on the test item, follow the guidance given below.
(a) Lowered temperature. A lowering of the test chamber temperature generally will retard fungusgrowth. If the relative humidity has been maintained, reestablish the test conditions and continuethe test from the point where the temperature fell below the prescribed tolerances. If not, seeparagraph 4.3(c) below.
(b) Elevated temperature. Elevated temperatures may have a drastic effect on fungus growth. Acomplete re-initiation of the test is required if one of the following exists. Otherwise, reestablishtest conditions and continue the test from the point of interruption.
- the temperature exceeds 40qC, or- the temperature exceeds 31qC for 4 hours or more, or- there is evidence of deterioration of the fungus growth on the control strips.
(c) Lowered humidity. A complete retest is required if one of the following exists. Otherwise,reestablish test conditions and continue the test from the point of interruption.
- the relative humidity drops below 50%, or- the relative humidity drops below 70% for 4 hours or more, or- there is evidence of deterioration of the fungal colonies on the control strips.
Downloaded from http://www.everyspec.com on 2012-06-04T5:34:26.
MIL-STD-810F1 January 2000
METHOD 508.5508.5-6
4.4 Execution.
4.4.1 Cleaning.Although it is preferable to use a new test item, the same test item as used in other tests may be used. If cleaning isrequired, conduct the cleaning at least 72 hours before test initiation in order to allow evaporation of any volatilematerials. Clean using typical production cleaning methods. Prepare the test item in accordance with paragraph4.5.1. Place new cotton control strips in the test chamber and inoculate both the test item and the controls with thetest fungi.
4.4.2 Miscellaneous.
a. This method is designed to provide optimal climatic conditions and all of the basic inorganic mineralsneeded for growth of the fungal species used in the test. The group of fungal species was chosen for itsability to attack a wide variety of materials commonly used in the construction of military materiel.Optional species may be added to the inoculum, if required (see paragraph 2.2.2).
b. This test must be performed by trained personnel at laboratories specially equipped for microbiologicalwork.
c. The presence of moisture is essential for spore germination and growth. Generally, germination andgrowth will start when the relative humidity of the ambient air exceeds 70%. Development will becomeprogressively more rapid as the humidity rises above this value, reaching a maximum in the 90 to 100%relative humidity range.
d. The specified temperature of 30 + 1°C (86 + 2°F) is most conducive to the growth of the test fungi.
e. Control items specified in paragraph 4.4.3.3 are designed to:
(1) verify the viability of the fungus spores used in the inoculum.
(2) establish the suitability of the chamber environment to support fungus growth.
f. Although this procedure can provide information on the susceptibility of materials to fungus growth, thetesting of materials and piece parts will not reveal potential fungus growth situations in materiel. These canresult due to the complexities involved in assemblages. Examples are induced conditions created bycoatings and protective wrappings, deterioration of protective coatings due to bi-metallic reactions, andother situations that would not be encountered with the testing of components.
Downloaded from http://www.everyspec.com on 2012-06-04T5:34:26.
MIL-STD-810F1 January 2000
METHOD 508.5508.5-7
4.4.3 Preparation for test.
4.4.3.1 Preparation of mineral salts solution.
a. Using clean apparatus, prepare the mineral salts solution to contain the following:
Potassium dihydrogen orthophosphate (KH2PO4) 0.7g
Potassium monohydrogen orthophosphate (K2HPO4). 0.7g
Magnesium sulfate heptahydrate (MgSO4.7H2O) 0.7g
Ammonium nitrate (NH4N03) 1.0g
Sodium chloride (NaCl) 0.005g
Ferrous sulfate heptahydrate (FeSO4.7H2O) 0.002g
Zinc sulfate heptahydrate (ZnSO4.7H2O) 0.002g
Manganous sulfate monohydrate (MnSO4.H2O) 0.001g
Distilled water 1000ml
b. The pH of the mineral salts solution must be between 6.0 and 6.5.
4.4.3.2 Preparation of mixed spore suspension.NOTE - PRECAUTIONS: Although the exact strains of fungus specified for this test are not normally considered topresent a serious hazard to humans, certain people may develop allergies or other reactions. Therefore, use standingoperating procedures for safety. Also, use only personnel trained in microbiological techniques to conduct the tests.
a. Use aseptic techniques to prepare the spore suspension containing at least the test fungi determined fromparagraph 2.2.2.
b. Maintain pure cultures of these fungi separately on an appropriate medium such as potato dextrose agar, butculture Chaetomium globosum on strips of filter paper overlaid on the surface of mineral salts agar.Prepare the mineral salts agar by dissolving 15.0g of agar in a liter of the mineral salts solution described inparagraph 4.4.3.1.
NOTE: Do not keep the stock cultures for more than 4 months at 6 +4°C; after that time, prepare subcultures anduse them for the new stocks.
c. Verify the purity of fungus cultures before the test.
d. Make subcultures from the pure stock cultures and incubate them at 30 +1°C for 10 to 211 days.
e. Prepare a spore suspension of each of the required test fungus by pouring into one subculture of eachfungus 10 ml of an aqueous solution containing 0.05g per liter of a nontoxic wetting agent such as sodiumdioctyl sulfosuccinate or sodium lauryl sulfate.
f. Use a rounded glass rod or a sterilized platinum or nickel chrome wire to gently scrape the surface growthfrom the culture of the test organisms.
g. Pour the spore charge into a 125 ml capped Erlenmeyer flask containing 45 ml of water and 50 to 75 solidglass beads, 5mm in diameter.
h. Shake the flask vigorously to liberate the spores from the fruiting bodies and to break the spore clumps.
i. Filter the dispersed fungal spore suspension into a flask through a 6 mm layer of glass wool contained in aglass funnel.
NOTE: This process should remove large mycelial fragments and clumps of agar.
1 Most fungi will develop within 10 to 14 days and may show signs of deterioration after longer incubation. Somefungi such as Chaetomium globosum require 21 days or longer to develop.
Downloaded from http://www.everyspec.com on 2012-06-04T5:34:26.
MIL-STD-810F1 January 2000
METHOD 508.5508.5-8
j. Centrifuge the filtered spore suspension and discard the supernatant liquid.
k. Re-suspend the residue in 50 ml of water and centrifuge. Wash the spores obtained from each of the fungiin this manner at least three times (until the supernatant is clear).
l. Dilute the final washed residue with mineral-salts solution in such a manner that the resultant sporesuspension contains 1,000,000 r20% spores per milliliter as determined with a counting chamber.
m. Repeat this operation for each organism used in the test.
n. Perform a viability check for each organism in accordance with paragraph 4.4.3.3.
o. Blend equal volumes of the resultant spore suspension to obtain the final mixed spore suspension.
NOTE: Use a freshly prepared spore suspension. If not freshly prepared, it must be held at 6 r4°C for not morethan 14 days.
4.4.3.3 Control items.Two types of control tests are required. Using the following procedures, verify the viability of the spore suspensionand its preparation, as well as the suitability of the chamber environment.
a. Viability of spore suspension
(1) Before preparing the composite spore suspension, inoculate sterile potato dextrose or anothernutrient agar plates with 0.2 to 0.3 ml of the spore suspension of each of the individual fungusspecies. Use separate agar plates for each species.
(2) Distribute the inoculum over the entire surface of the plate.
(3) Incubate the inoculated potato dextrose agar plate at 30 r1°C for 7 to 10 days.
(4) After the incubation period, check the fungus growth.
NOTE: The absence of copious growth of any of the test organisms over the entire surface in each container willinvalidate the results of any tests using these spores.
b. Test chamber environment
(1) Prepare the following solution:
10.0g glycerol
0.1g potassium dihydrogen orthophosphate (KH2PO4).
0.1g ammonium nitrate (NH4NO3).
0.025g magnesium sulfate heptahydrate (MgSO4.7H2O).
0.05g yeast extract.
Distilled water to a total volume of 100 ml.
0.005g of a nontoxic wetting agent such as sodium dioctyl sulfosuccinate
or sodium lauryl sulfate.
HCl and NaOH to adjust the final solution pH to 5.3.
(2) Prepare control strips from unbleached, plain weave, 100% cotton cloth that has been cut or torninto strips about 3 cm wide. Use only strips devoid of fungicides, water repellents and sizingadditives. To aid in removing any possible treatment materials, recommend boiling in distilledwater. Dip the strips into the above solution. After dipping, remove the excess liquid from thestrips and hang them to dry before placing them in the chamber and inoculating. Ensure the stripshave been thoroughly wetted.
(3) Within the chamber, place the strips vertically close to and bracketing the test items to ensure thetest strips and test items experience the same test environment. Use strips at least as long as the testitem is high.
Downloaded from http://www.everyspec.com on 2012-06-04T5:34:26.
MIL-STD-810F1 January 2000
METHOD 508.5508.5-9
(4) To ensure proper conditions are present in the incubation chamber to promote fungus growth, installthese strips and inoculate them along with the test item.
4.5 Test Procedure.
4.5.1 Preparation for incubation.Step 1. Assure the condition of the items subjected to testing is similar to their condition as delivered by
the manufacturer or customer for use, or as otherwise specified. Accomplish any cleaning of thetest item at least 72 hours before the beginning of the fungus test to allow for evaporation ofvolatile materials.
Step 2. Install the test item in the chamber or cabinet on suitable fixtures, or suspend them from hangers.Step 3. Hold the test item in the operating chamber (at 30 r1°C and a RH of greater than 90% but less than
100%) for at least four hours immediately before inoculation.Step 4. Inoculate the test item and the cotton fabric chamber control items with the mixed fungus spore
suspension by spraying the suspension on the control items, and on and into the test item(s) (if notpermanently or hermetically sealed) in the form of a fine mist from an atomizer or nebulizer.Ensure personnel with appropriate knowledge of the test item are available to aid in exposing itsinterior surfaces for inoculation.
NOTE: In spraying the test and control items with composite spore suspension, cover all external and internalsurfaces that are exposed during use or maintenance. If the surfaces are non-wetting, spray until drops begin to formon them.
Step 5. In order for air to penetrate, replace the covers of the test items without tightening the fasteners.Step 6. Start incubation immediately following the inoculation.
4.5.2 Incubation of the test item.Step 7. Except as noted in Step 2 below, incubate the test items at constant temperature and humidity
conditions of 30 r1°C and a relative humidity above 90% but below 100% for the test duration (28days, minimum).
Step 8. After 7 days, inspect the growth on the control cotton strips to verify the environmental conditionsin the chamber are suitable for growth. At this time at least 90 percent of the part of the surfacearea of each test strip located at the level of the test item should be covered by fungus. If it is not,repeat the entire test with the adjustments of the chamber required to produce conditions suitablefor growth. Leave the control strips in the chamber for the duration of the test.
Step 9. If the cotton strips show satisfactory fungus growth after 7 days, continue the test for the requiredperiod from the time of inoculation as specified in the test plan. If there is no increase in fungusgrowth on the cotton strips at the end of the test as compared to the 7-day results, the test is invalid.
4.5.3 Inspection.At the end of the incubation period, inspect the test item immediately. If possible, inspect the item within thechamber. If the inspection is conducted outside of the chamber and is not completed in 8 hours, return the test itemto the test chamber or to a similar humid environment for a minimum of 12 hours. Except for hermetically sealedmateriel, open the test item enclosure and examine both the interior and exterior of the test item. Record the resultsof the inspection.
4.5.4 Operation/use.(To be conducted only if required.) If operation of the test item is required (e.g., electrical materiel), conduct theoperation in the period as specified in paragraph 4.5.3. Ensure personnel with appropriate knowledge of the testitem are available to aid in exposing its interior surfaces for inspection and in making operation and use decisions.Disturbance of any fungus growth must be kept to a minimum during the operational checkout.
Downloaded from http://www.everyspec.com on 2012-06-04T5:34:26.
MIL-STD-810F1 January 2000
METHOD 508.5508.5-10
5. ANALYSIS OF RESULTS.In addition to the guidance provided in Part One, paragraphs 5.14 and 5.17, the following information is provided toassist in the evaluation of the test results.
a. Any fungal growth on the test item must be analyzed to determine the species, and if the growth is on thetest item material(s) or on contaminants.
b. Any fungal growth on the test item material(s), whether from the inoculum or other sources, must beevaluated by qualified personnel for:
(1) The extent of growth on susceptible components or materials. Use table 508.5-II as a guide for thisevaluation, but any growth must be completely described.
(2) The immediate effect that the growth has on the physical characteristics of the materiel.
(3) The long-range effect that the growth could have on the materiel.
(4) The specific material (nutrient(s)) supporting the growth.
c. Evaluate human factors effects (including health risks).
6. REFERENCE/RELATED DOCUMENTS.None.
Downloaded from http://www.everyspec.com on 2012-06-04T5:34:26.
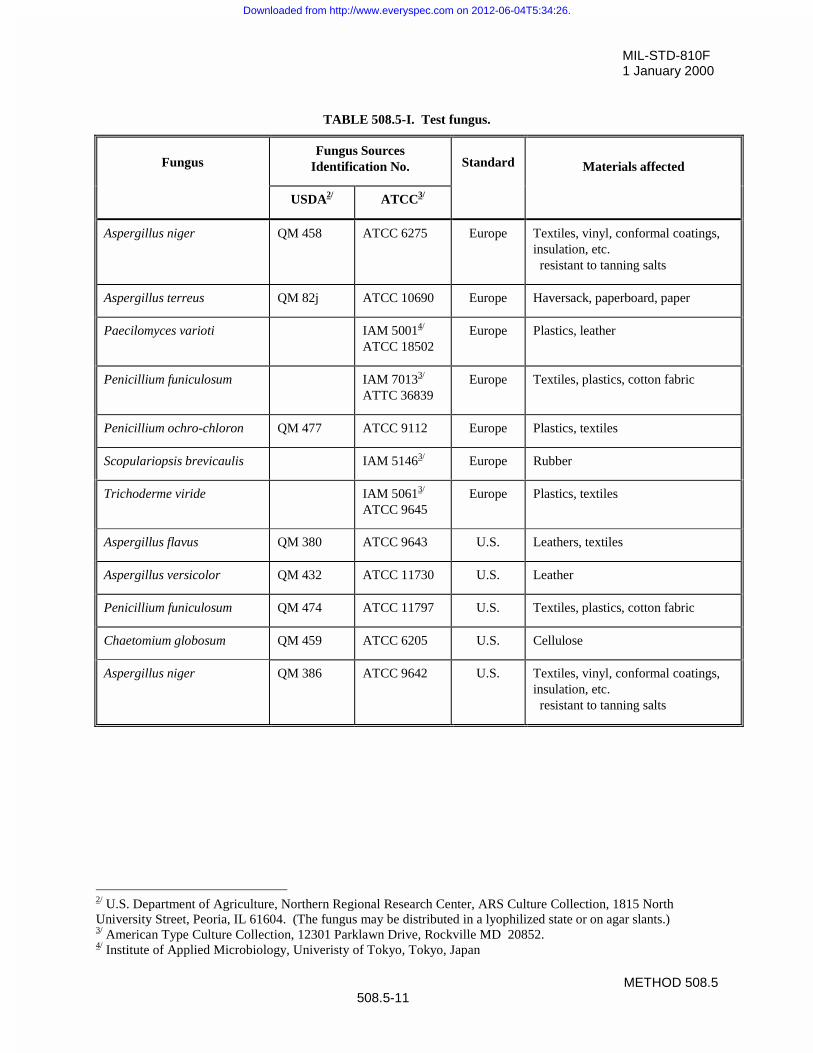
MIL-STD-810F1 January 2000
METHOD 508.5508.5-11
TABLE 508.5-I. Test fungus.
FungusFungus Sources
Identification No. Standard Materials affected
USDA2/ ATCC3/
Aspergillus niger QM 458 ATCC 6275 Europe Textiles, vinyl, conformal coatings,insulation, etc. resistant to tanning salts
Aspergillus terreus QM 82j ATCC 10690 Europe Haversack, paperboard, paper
Paecilomyces varioti IAM 50014/
ATCC 18502Europe Plastics, leather
Penicillium funiculosum IAM 70133/
ATTC 36839Europe Textiles, plastics, cotton fabric
Penicillium ochro-chloron QM 477 ATCC 9112 Europe Plastics, textiles
Scopulariopsis brevicaulis IAM 51463/ Europe Rubber
Trichoderme viride IAM 50613/
ATCC 9645Europe Plastics, textiles
Aspergillus flavus QM 380 ATCC 9643 U.S. Leathers, textiles
Aspergillus versicolor QM 432 ATCC 11730 U.S. Leather
Penicillium funiculosum QM 474 ATCC 11797 U.S. Textiles, plastics, cotton fabric
Chaetomium globosum QM 459 ATCC 6205 U.S. Cellulose
Aspergillus niger QM 386 ATCC 9642 U.S. Textiles, vinyl, conformal coatings,insulation, etc. resistant to tanning salts
2/ U.S. Department of Agriculture, Northern Regional Research Center, ARS Culture Collection, 1815 NorthUniversity Street, Peoria, IL 61604. (The fungus may be distributed in a lyophilized state or on agar slants.)3/ American Type Culture Collection, 12301 Parklawn Drive, Rockville MD 20852.4/ Institute of Applied Microbiology, Univeristy of Tokyo, Tokyo, Japan
Downloaded from http://www.everyspec.com on 2012-06-04T5:34:26.
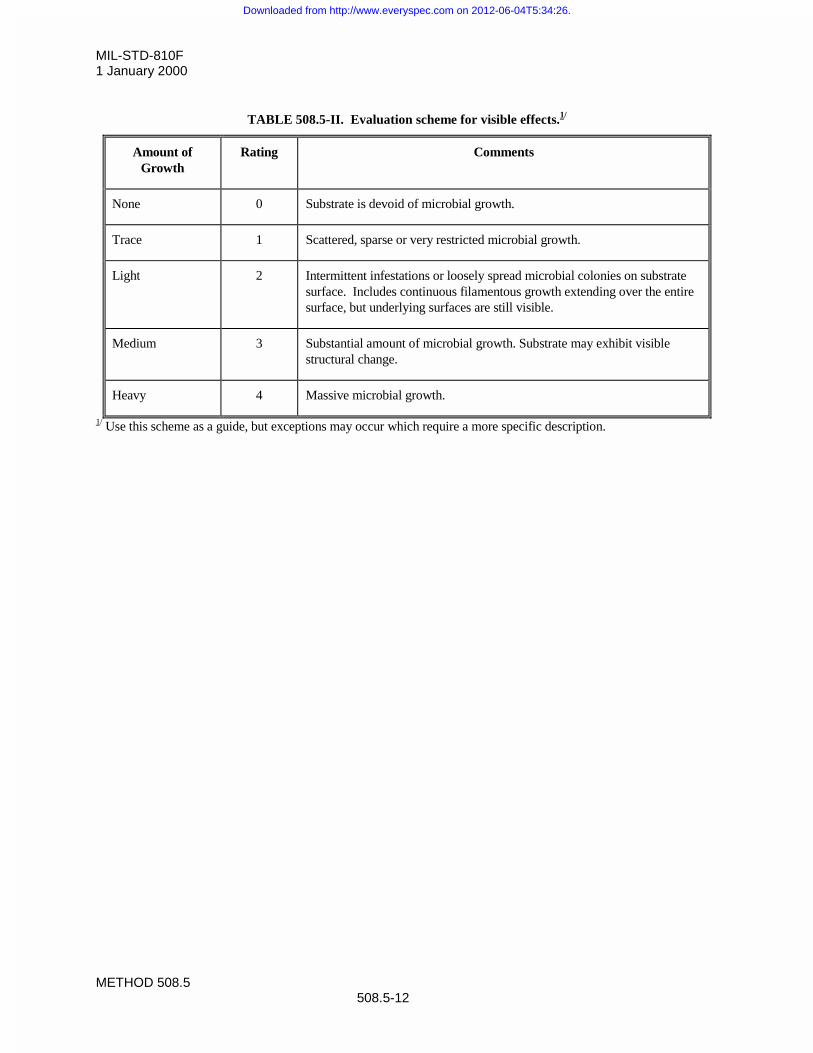
MIL-STD-810F1 January 2000
METHOD 508.5508.5-12
TABLE 508.5-II. Evaluation scheme for visible effects.1/
Amount ofGrowth
Rating Comments
None 0 Substrate is devoid of microbial growth.
Trace 1 Scattered, sparse or very restricted microbial growth.
Light 2 Intermittent infestations or loosely spread microbial colonies on substratesurface. Includes continuous filamentous growth extending over the entiresurface, but underlying surfaces are still visible.
Medium 3 Substantial amount of microbial growth. Substrate may exhibit visiblestructural change.
Heavy 4 Massive microbial growth.
1/ Use this scheme as a guide, but exceptions may occur which require a more specific description.
Downloaded from http://www.everyspec.com on 2012-06-04T5:34:26.
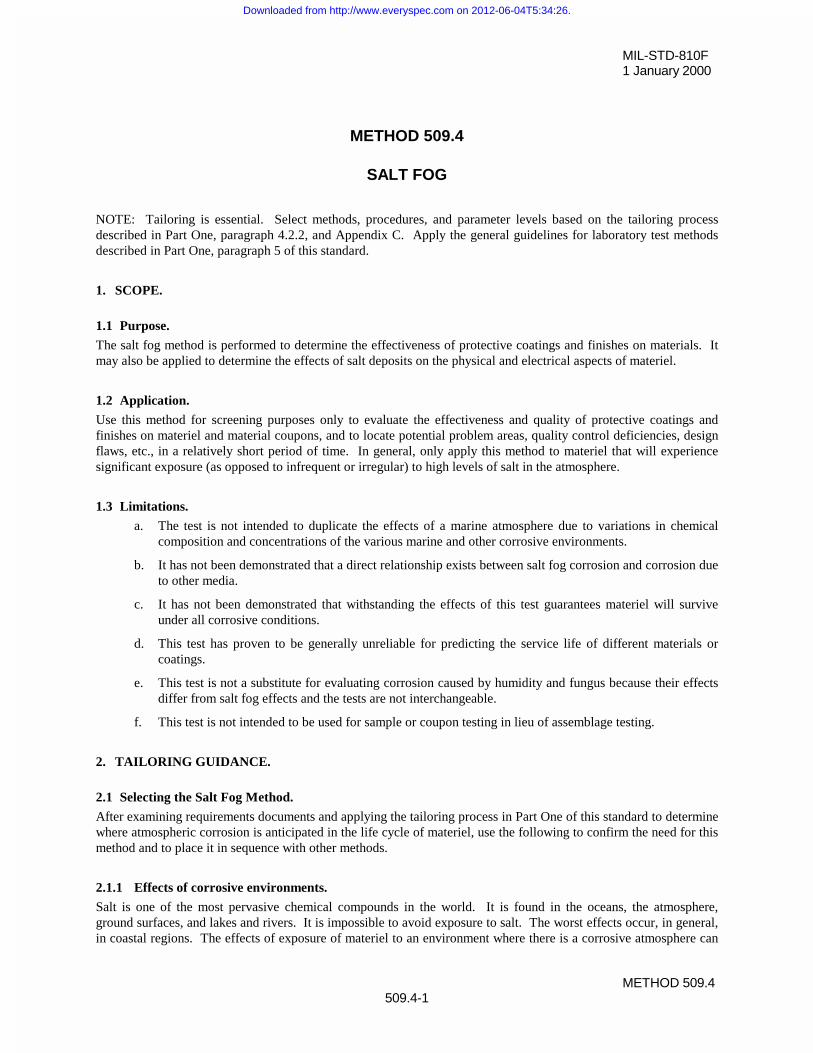
MIL-STD-810F1 January 2000
METHOD 509.4509.4-1
METHOD 509.4
SALT FOG
NOTE: Tailoring is essential. Select methods, procedures, and parameter levels based on the tailoring processdescribed in Part One, paragraph 4.2.2, and Appendix C. Apply the general guidelines for laboratory test methodsdescribed in Part One, paragraph 5 of this standard.
1. SCOPE.
1.1 Purpose.
The salt fog method is performed to determine the effectiveness of protective coatings and finishes on materials. Itmay also be applied to determine the effects of salt deposits on the physical and electrical aspects of materiel.
1.2 Application.
Use this method for screening purposes only to evaluate the effectiveness and quality of protective coatings andfinishes on materiel and material coupons, and to locate potential problem areas, quality control deficiencies, designflaws, etc., in a relatively short period of time. In general, only apply this method to materiel that will experiencesignificant exposure (as opposed to infrequent or irregular) to high levels of salt in the atmosphere.
1.3 Limitations.
a. The test is not intended to duplicate the effects of a marine atmosphere due to variations in chemicalcomposition and concentrations of the various marine and other corrosive environments.
b. It has not been demonstrated that a direct relationship exists between salt fog corrosion and corrosion dueto other media.
c. It has not been demonstrated that withstanding the effects of this test guarantees materiel will surviveunder all corrosive conditions.
d. This test has proven to be generally unreliable for predicting the service life of different materials orcoatings.
e. This test is not a substitute for evaluating corrosion caused by humidity and fungus because their effectsdiffer from salt fog effects and the tests are not interchangeable.
f. This test is not intended to be used for sample or coupon testing in lieu of assemblage testing.
2. TAILORING GUIDANCE.
2.1 Selecting the Salt Fog Method.
After examining requirements documents and applying the tailoring process in Part One of this standard to determinewhere atmospheric corrosion is anticipated in the life cycle of materiel, use the following to confirm the need for thismethod and to place it in sequence with other methods.
2.1.1 Effects of corrosive environments.
Salt is one of the most pervasive chemical compounds in the world. It is found in the oceans, the atmosphere,ground surfaces, and lakes and rivers. It is impossible to avoid exposure to salt. The worst effects occur, in general,in coastal regions. The effects of exposure of materiel to an environment where there is a corrosive atmosphere can
Downloaded from http://www.everyspec.com on 2012-06-04T5:34:26.
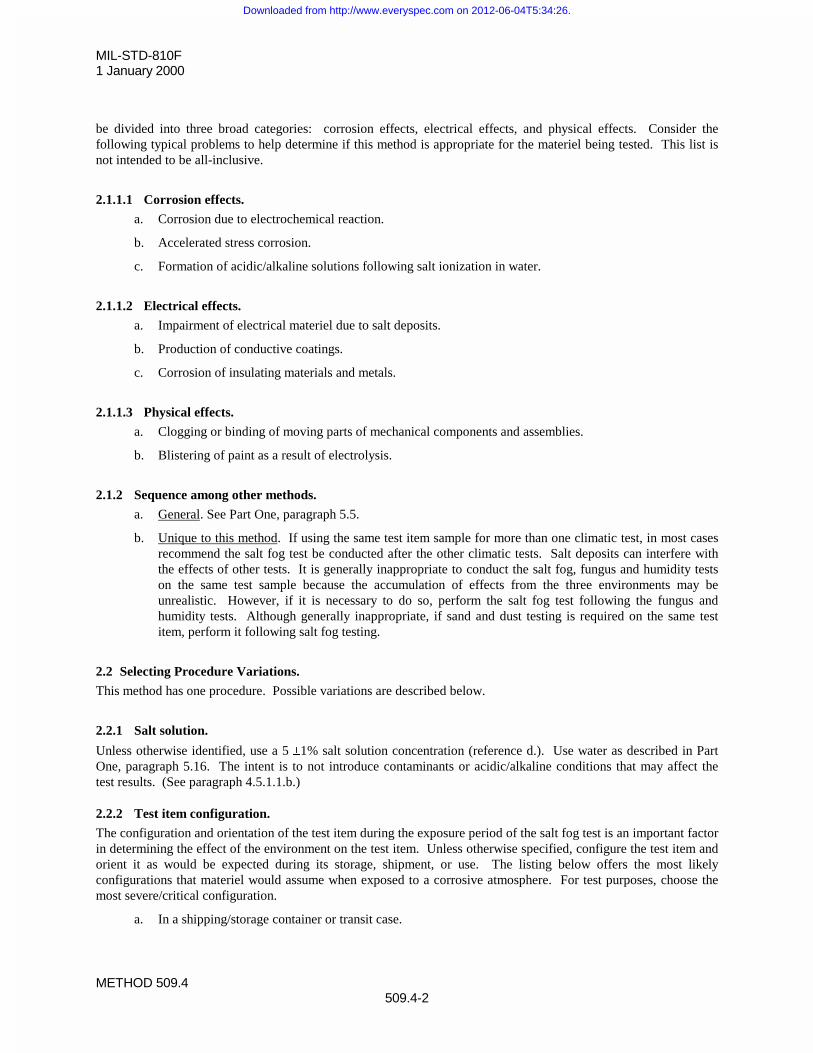
MIL-STD-810F1 January 2000
METHOD 509.4509.4-2
be divided into three broad categories: corrosion effects, electrical effects, and physical effects. Consider thefollowing typical problems to help determine if this method is appropriate for the materiel being tested. This list isnot intended to be all-inclusive.
2.1.1.1 Corrosion effects.
a. Corrosion due to electrochemical reaction.
b. Accelerated stress corrosion.
c. Formation of acidic/alkaline solutions following salt ionization in water.
2.1.1.2 Electrical effects.
a. Impairment of electrical materiel due to salt deposits.
b. Production of conductive coatings.
c. Corrosion of insulating materials and metals.
2.1.1.3 Physical effects.
a. Clogging or binding of moving parts of mechanical components and assemblies.
b. Blistering of paint as a result of electrolysis.
2.1.2 Sequence among other methods.
a. General. See Part One, paragraph 5.5.
b. Unique to this method. If using the same test item sample for more than one climatic test, in most casesrecommend the salt fog test be conducted after the other climatic tests. Salt deposits can interfere withthe effects of other tests. It is generally inappropriate to conduct the salt fog, fungus and humidity testson the same test sample because the accumulation of effects from the three environments may beunrealistic. However, if it is necessary to do so, perform the salt fog test following the fungus andhumidity tests. Although generally inappropriate, if sand and dust testing is required on the same testitem, perform it following salt fog testing.
2.2 Selecting Procedure Variations.
This method has one procedure. Possible variations are described below.
2.2.1 Salt solution.
Unless otherwise identified, use a 5 r1% salt solution concentration (reference d.). Use water as described in PartOne, paragraph 5.16. The intent is to not introduce contaminants or acidic/alkaline conditions that may affect thetest results. (See paragraph 4.5.1.1.b.)
2.2.2 Test item configuration.
The configuration and orientation of the test item during the exposure period of the salt fog test is an important factorin determining the effect of the environment on the test item. Unless otherwise specified, configure the test item andorient it as would be expected during its storage, shipment, or use. The listing below offers the most likelyconfigurations that materiel would assume when exposed to a corrosive atmosphere. For test purposes, choose themost severe/critical configuration.
a. In a shipping/storage container or transit case.
Downloaded from http://www.everyspec.com on 2012-06-04T5:34:26.
MIL-STD-810F1 January 2000
METHOD 509.4509.4-3
b. Outside of its shipping/storage container but provided with an effective environmental control systemthat partly excludes the salt fog environment.
c. Outside of its shipping/storage container and set up in its normal operating mode.
d. Modified with kits for special applications or to compensate for mating components that are normallypresent, but are not used for this specific test.
2.2.3 Duration.
The standard exposure of 48 hours of exposure and 48 hours of drying time has not changed. However, experiencehas shown that alternating 24-hour periods of salt fog exposure and drying conditions for a minimum of four 24-hourperiods (two wet and two dry), provides more realistic exposure and a higher damage potential than does continuousexposure to a salt atmosphere (reference d.). Because the rate of corrosion is much higher during the transition fromwet to dry, it is critical to closely control the rate of drying if corrosion levels from test to test are to be compared. The number of cycles may be increased, if appropriate.
2.2.4 Temperature.
Maintain the temperature in the exposure zone at 35 r2°C (95 r4°F). This temperature has been historicallyaccepted and is not intended to simulate actual exposure situations. Other temperatures may be used if appropriate.
2.2.5 Air circulation.
Ensure the air velocity in test chambers is minimal (essentially zero).
2.2.6 Fallout rate.
Adjust the salt fog fallout such that each receptacle collects from 1 to 3 ml of solution per hour for each 80 cm2 ofhorizontal collecting area (10 cm diameter).
3. INFORMATION REQUIRED.
3.1 Pretest.
The following information is required to conduct salt fog tests adequately.
a. General. Information listed in Part One, paragraphs 5.7 and 5.9, and Appendix A, Task 405 of thisstandard.
b. Specific to this method.
(1) Areas of the test item visually and functionally examined and an explanation of their inclusion orexclusion.
(2) Salt concentration if other than 5%.
(3) Resistivity of initial water and type of water.
3.2 During Test.
Collect the following information during conduct of the test:
a. General. Information listed in Part One, paragraph 5.10, and in Appendix A, Task 406 of this standard.
b. Specific to this method.
(1) Record of chamber temperature versus time conditions.
(2) Salt fog fallout quantities per unit of time (paragraph 4.1.4).
(3) Salt fog pH (paragraph 4.5.1.1b).
Downloaded from http://www.everyspec.com on 2012-06-04T5:34:26.
MIL-STD-810F1 January 2000
METHOD 509.4509.4-4
3.3 Post Test.
The following post test information is required.
a. General. Information listed in Part One, paragraph 5.13, and in Appendix A, Task 406 of this standard.
b. Specific to this method.
(1) Areas of the test item visually and functionally examined and an explanation of their inclusion orexclusion.
(2) Test variables:
(a) Salt solution pH.(b) Salt solution fallout rate (ml/cm2/hr).
(3) Results of examination for corrosion, electrical, and physical effects.
(4) Observations to aid in failure analysis.
4. TEST PROCESS.
4.1 Test Facility.
Ensure the apparatus used in performing the salt fog test includes the following.
4.1.1 Test chamber.
Use supporting racks that do not affect the characteristics of the salt fog mist. All parts of the test setup that contactthe test item must not cause electrolytic corrosion. Do not allow condensation to drip on the test item. Do not returnto the salt solution reservoir any liquid that comes in contact with either the chamber or the test item. Vent theexposure area to prevent pressure buildup. Ensure the test chamber has a waste collection system so that all wastematerial can be tested prior to disposal. Dispose of any material determined to be hazardous waste in accordancewith local, state and federal regulations.
4.1.2 Salt solution reservoir.
Ensure the salt solution reservoir is made of material that is non-reactive with the salt solution, e.g., glass, hardrubber, or plastic.
4.1.3 Salt solution injection system.
Filter the salt solution (figures 509.4-2 and -3) and inject it into the test chamber with atomizers that produce a finelydivided, wet, dense fog. Use atomizing nozzles and a piping system made of material that is non-reactive to the saltsolution. Do not let salt buildup clog the nozzles.
NOTE: Suitable atomization has been obtained in chambers having a volume of less than .34m3 (12 ft3) under thefollowing conditions:
a. Nozzle pressure as low as practical to produce fog at the required rate.
b. Orifices between 0.5 and 0.76 mm (0.02 and 0.03 in) in diameter.
c. Atomization of approximately 2.8 liters of salt solution per 0.28m3 (10 ft3) of chamber volume per 24hours.
When chambers with a volume considerably in excess of 0.34m3 (12 ft3) are used, the conditions specified may requiremodification.
4.1.4 Salt fog collection receptacles.
Use a minimum of 2 salt fog collection receptacles to collect water solution samples. Locate one at the perimeter ofthe test item nearest to the nozzle, and the other also at the perimeter of the test item but at the farthest point from the
Downloaded from http://www.everyspec.com on 2012-06-04T5:34:26.
MIL-STD-810F1 January 2000
METHOD 509.4509.4-5
nozzle. If using multiple nozzles, the same principles apply. Position the receptacles such that they are not shieldedby the test item and will not collect drops of solution from the test item or other sources.
4.2 Controls.
Preheat the oil-free and dirt-free compressed air used to produce the atomized solution (to offset the cooling effectsof expansion to atmospheric pressure) and pre-humidify it such that the temperature is 35 r2°C and the relativehumidity is in excess of 85% at the nozzle (see table 509.4-I).
TABLE 509.4-I. Air pressure and preheat temperature requirements for operation at 35°C.
Air Pressure (kPa) 83 96 110 124
Preheat temperature (°C) (before atomizing)
46 47 48 49
4.3 Test Interruption.
a. General. See Part One, paragraph 5.11, of this standard.
b. Specific to this method.
(1) Undertest interruption. If an unscheduled test interruption occurs that causes the test conditions toexceed allowable tolerances toward standard ambient conditions, give the test item a complete visualexamination and develop a technical evaluation of the impact of the interruption on the test results. Restart the test at the point of interruption and restabilize the test item at the test conditions.
(2) Overtest interruption. If an unscheduled test interruption occurs that causes the test conditions toexceed allowable tolerances away from standard ambient conditions, stabilize the test conditions towithin tolerances and hold them at that level until a complete visual examination and technicalevaluation can be made to determine the impact of the interruption on test results. If the visualexamination or technical evaluation results in a conclusion that the test interruption did not adverselyaffect the final test results, or if the effects of the interruption can be nullified with confidence,restabilize the pre-interruption conditions and continue the test from the point where the testtolerances were exceeded.
4.4 Test Setup.
a. General. See Part One, paragraph 5.8.
b. Unique to this method. Ensure the fallout collection containers are situated in the chamber such that theywill not collect fluids dripping from the test item.
4.5 Test Execution.
The following steps, alone or in combination, provide the basis for collecting necessary information concerning thetest item in a salt fog environment.
4.5.1 Preparation for test.
4.5.1.1 Preliminary steps.
Before starting the test, determine the test details (e.g., procedure variations, test item configuration, cycles,durations, parameter levels for storage/operation, etc.) from the test plan. (See paragraph 3.1 above.)
a. Handling and configuration.
(1) Handle the test item as little as possible. Prepare the test item for testing immediately beforeexposure. Unless otherwise specified, ensure the test item surfaces are free of surface contaminationsuch as oil, grease, or dirt that could cause a water break. Do not use corrosive solvents, solvents
Downloaded from http://www.everyspec.com on 2012-06-04T5:34:26.
MIL-STD-810F1 January 2000
METHOD 509.4509.4-6
which deposit either corrosive or protective films, or abrasives other than a paste of pure magnesiumoxide in any cleaning methods.
(2) Configure the test item as specified in the test plan and insert it into the test chamber.
b. Preparation of salt solution. For this test, use sodium chloride containing (on a dry basis) not more than0.1% sodium iodide and not more than 0.5% total impurities. Do not use sodium chloride containinganti-caking agents because such agents may act as corrosion inhibitors. Unless otherwise specified,prepare a 5 r1% solution by dissolving 5 parts by weight of salt in 95 parts by weight of water. Adjust toand maintain the solution at a specific gravity (figure 509.4-1) by using the measured temperature anddensity of the salt solution. If necessary, add sodium tetraborate (borax) to the salt solution as a pHstabilization agent in a ratio not to exceed 0.7g sodium tetraborate to 75 liters of salt solution. Maintainthe pH of the salt solution, as collected as fallout in the exposure chamber, between 6.5 and 7.2 with thesolution temperature at +35 r2°C. To adjust the pH, use only diluted chemically pure hydrochloric acidor chemically pure sodium hydroxide. Make the pH measurement either electrometrically orcalorimetrically.
c. Chamber operation verification. Unless the chamber has been used within five days or the nozzlebecomes clogged, immediately before the test and with the exposure chamber empty, adjust all testparameters to those required for the test. Maintain these conditions for at least one 24-hour period oruntil proper operation and salt fog collection can be verified. Continuously monitor all test parameters toverify the test chamber is operating properly.
4.5.1.2 Pretest standard ambient checkout.
All items require a pretest checkout at room ambient conditions to provide baseline data. Conduct the checkout asfollows:
Step 1. Prepare the test item in its required configuration in accordance with Part One, paragraph 5.8.1.Step 2. Record the room ambient conditions.Step 3. Conduct a complete visual examination of the test item with attention to:
(1) High-stress areas.
(2) Areas where dissimilar metals are in contact.
(3) Electrical and electronic components - especially those having closely spaced, unpainted orexposed circuitry.
(4) Metallic surfaces.
(5) Enclosed volumes where condensation has occurred or may occur.
(6) Components or surfaces provided with coatings or surface treatments for corrosion protection.
(7) Cathodic protection systems; mechanical systems subject to malfunction if clogged or coatedwith salt deposits.
(8) Electrical and thermal insulators.
NOTE: Consider partial or complete disassembly of the test item if a complete visual examination is required. Becareful not to damage any protective coatings, etc.
Step 4. Document the results. (Use photographs, if necessary.)Step 5. Conduct an operational checkout in accordance with the test plan and record the results for
compliance with Part One, paragraph 5.9.Step 6. If the test item meets the requirements of the test plan or other applicable documents, proceed to
Step 1 of the test procedure below. If not, resolve any problems and restart the pretest standardambient checkout at the most reasonable step above.
4.5.2 Procedure.
Step 1. Adjust the test chamber temperature to 35°C and condition the test item for at least two hoursbefore introducing the salt fog.
Downloaded from http://www.everyspec.com on 2012-06-04T5:34:26.
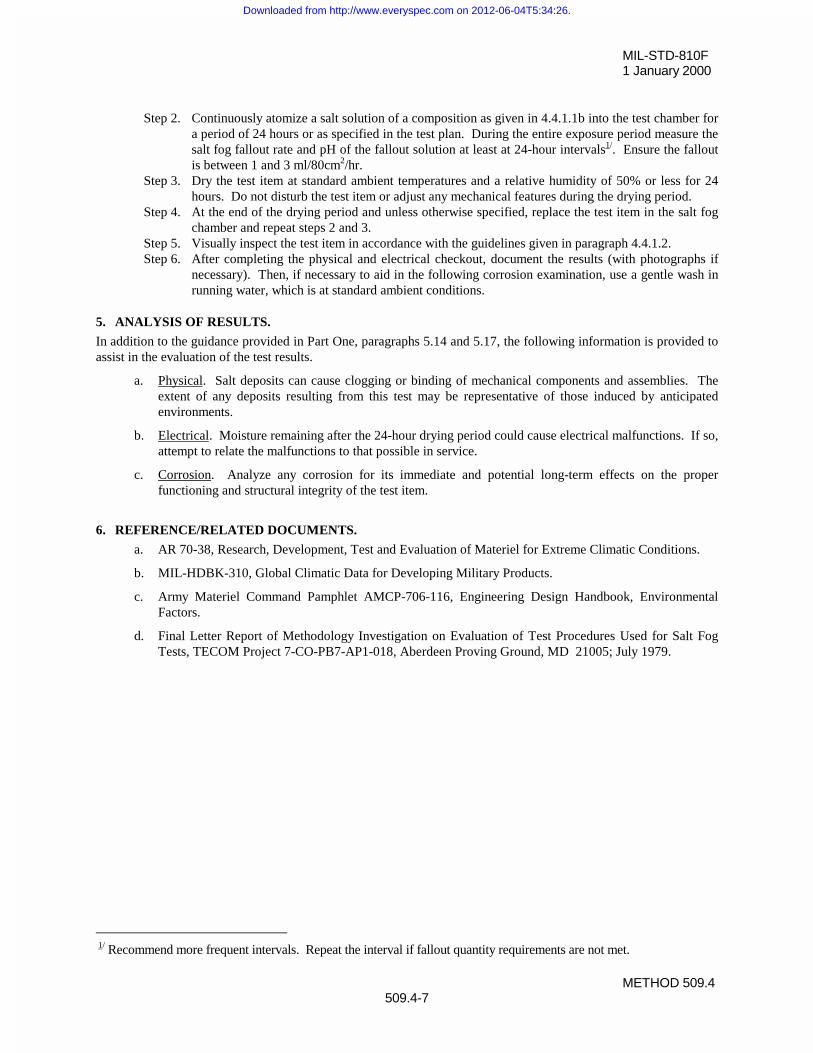
MIL-STD-810F1 January 2000
METHOD 509.4509.4-7
Step 2. Continuously atomize a salt solution of a composition as given in 4.4.1.1b into the test chamber fora period of 24 hours or as specified in the test plan. During the entire exposure period measure thesalt fog fallout rate and pH of the fallout solution at least at 24-hour intervals1/. Ensure the falloutis between 1 and 3 ml/80cm2/hr.
Step 3. Dry the test item at standard ambient temperatures and a relative humidity of 50% or less for 24hours. Do not disturb the test item or adjust any mechanical features during the drying period.
Step 4. At the end of the drying period and unless otherwise specified, replace the test item in the salt fogchamber and repeat steps 2 and 3.
Step 5. Visually inspect the test item in accordance with the guidelines given in paragraph 4.4.1.2. Step 6. After completing the physical and electrical checkout, document the results (with photographs if
necessary). Then, if necessary to aid in the following corrosion examination, use a gentle wash inrunning water, which is at standard ambient conditions.
5. ANALYSIS OF RESULTS.
In addition to the guidance provided in Part One, paragraphs 5.14 and 5.17, the following information is provided toassist in the evaluation of the test results.
a. Physical. Salt deposits can cause clogging or binding of mechanical components and assemblies. Theextent of any deposits resulting from this test may be representative of those induced by anticipatedenvironments.
b. Electrical. Moisture remaining after the 24-hour drying period could cause electrical malfunctions. If so,attempt to relate the malfunctions to that possible in service.
c. Corrosion. Analyze any corrosion for its immediate and potential long-term effects on the properfunctioning and structural integrity of the test item.
6. REFERENCE/RELATED DOCUMENTS.
a. AR 70-38, Research, Development, Test and Evaluation of Materiel for Extreme Climatic Conditions.
b. MIL-HDBK-310, Global Climatic Data for Developing Military Products.
c. Army Materiel Command Pamphlet AMCP-706-116, Engineering Design Handbook, EnvironmentalFactors.
d. Final Letter Report of Methodology Investigation on Evaluation of Test Procedures Used for Salt FogTests, TECOM Project 7-CO-PB7-AP1-018, Aberdeen Proving Ground, MD 21005; July 1979.
1/ Recommend more frequent intervals. Repeat the interval if fallout quantity requirements are not met.
Downloaded from http://www.everyspec.com on 2012-06-04T5:34:26.
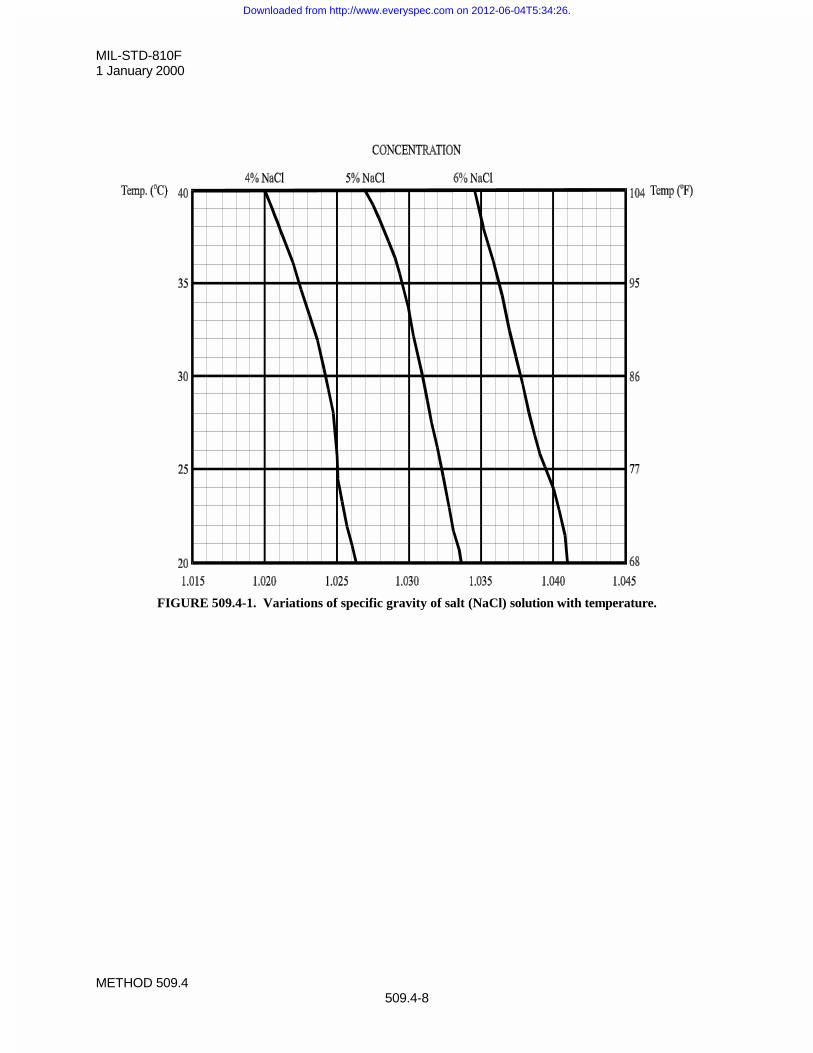
MIL-STD-810F1 January 2000
METHOD 509.4509.4-8
FIGURE 509.4-1. Variations of specific gravity of salt (NaCl) solution with temperature.
Downloaded from http://www.everyspec.com on 2012-06-04T5:34:26.
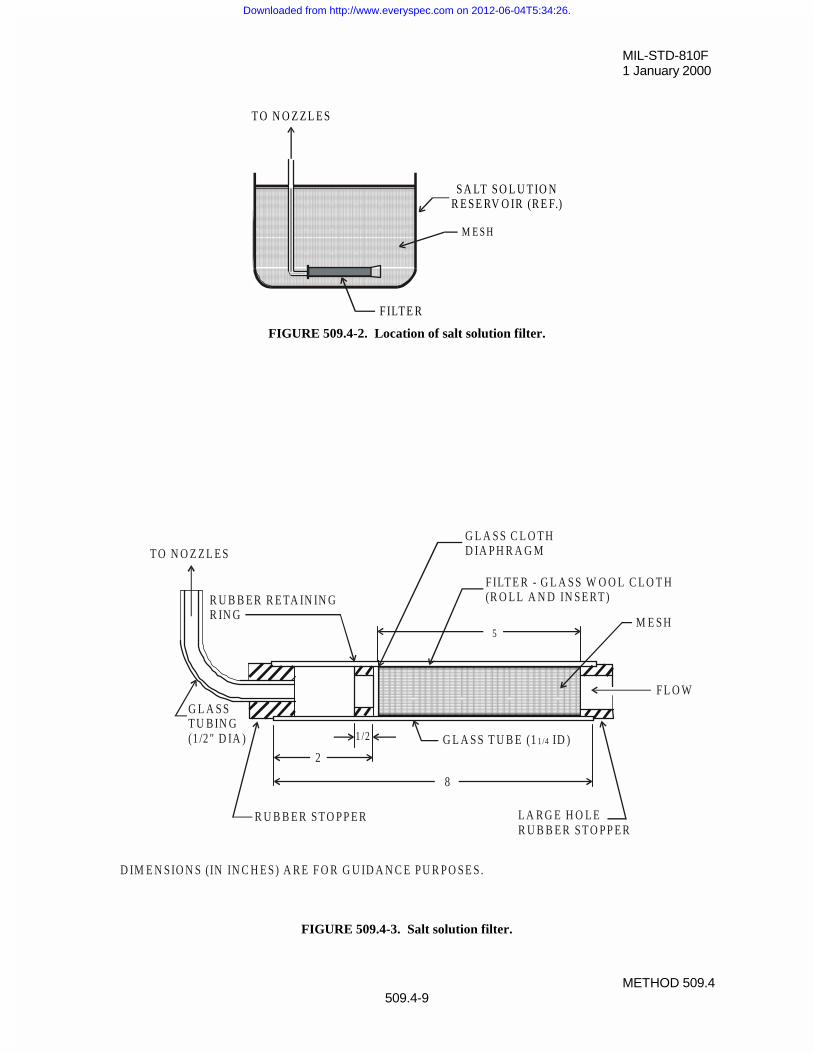
MIL-STD-810F1 January 2000
METHOD 509.4509.4-9
T O N O Z Z L E S
S A LT S O L U T IO NR E S E RV O IR (R E F.)
F ILT E R
M E S H
FIGURE 509.4-2. Location of salt solution filter.
FIGURE 509.4-3. Salt solution filter.
D IM E N S IO N S (IN IN C H E S ) A R E F O R G U ID A N C E P U R P O S E S .
5
T O N O Z Z L E S
R U B B E R R E TA IN IN GR IN G
G L A S S C L O T HD IA P H R A G M
F ILT E R - G L A S S W O O L C L O T H(R O L L A N D IN S E RT )
M E S H
F L O W
G L A S S T U B E (1 ID )1 /4
G L A S ST U B IN G(1 /2 " D IA )
R U B B E R S T O P P E R
8
2
1 /2
L A R G E H O L ER U B B E R S T O P P E R
Downloaded from http://www.everyspec.com on 2012-06-04T5:34:26.

MIL-STD-810F1 January 2000
METHOD 509.4509.4-10
THIS PAGE INTENTIONALLY BLANK
Downloaded from http://www.everyspec.com on 2012-06-04T5:34:26.
MIL-STD-810F1 January 2000
METHOD 510.4510.4-1
METHOD 510.4
SAND AND DUST
NOTE: Tailoring is essential. Select methods, procedures, and parameter levels based on the tailoring processdescribed in Part One, paragraph 4.2.2, and Appendix C. Apply the general guidelines for laboratory test methodsdescribed in Part One, paragraph 5 of this standard.
1. SCOPE.
1.1 Purpose.
a. Small-particle dust (d 149 µm) procedures. These tests are performed to help evaluate the ability ofmateriel to resist the effects of dust that may obstruct openings, penetrate into cracks, crevices, bearings,and joints and to evaluate the effectiveness of filters.
b. Blowing sand (150 to 850 µm particle size) procedures. These tests are performed to help evaluate ifmateriel can be stored and operated under blowing sand conditions without degrading performance,effectiveness, reliability, and maintainability due to abrasion (erosion) or clogging effects of large, sharp-edged particles.
1.2 Application.
Use this method to evaluate all mechanical, optical, electrical, electronic, electrochemical, and electromechanicaldevices likely to be exposed to dry, blowing sand, blowing dust-laden atmosphere, or settling dust.
1.3 Limitations.
This method is not suitable for determining erosion of airborne (in flight) materiel because of the particle impactvelocities involved, or for determining the effects of a buildup of electrostatic charge. Additionally, because ofcontrol problems, this method does not address sand or dust testing out-of-doors.
2. TAILORING GUIDANCE.
2.1 Selecting the Sand and Dust Method.
After examining requirements documents and applying the tailoring process in Part One of this standard to determinewhere sand and dust environments are foreseen in the life cycle of the materiel, use the following to confirm the needfor this method and to place it in sequence with other methods.
2.1.1 Effects of sand and dust environments.
Although the blowing sand and dust environment is usually associated with hot-dry regions, it exists seasonally inmost other regions. Naturally-occurring sand and dust storms are an important factor in the deployment of materiel,but with the increased mechanization of military operations, they cause less of a problem than does sand and dustassociated with man's activities. Consider the following typical problems to help determine if this method isappropriate for the materiel being tested. This list is not intended to be all-inclusive.
a. Abrasion and erosion of surfaces.
b. Penetration of seals.
c. Degradation of electrical circuits.
d. Obstruction/clogging of openings and filters.
Downloaded from http://www.everyspec.com on 2012-06-04T5:34:26.
MIL-STD-810F1 January 2000
METHOD 510.4510.4-2
e. Physical interference with mating parts.
f. Fouling/interference of moving parts.
g. Reduction of thermal conductivity.
h. Interference with optical characteristics.
i. Overheating and fire hazard due to restricted ventilation or cooling.
2.1.2 Sequence among other methods.
a. General. See Part One, paragraph 5.5.
b. Unique to this method. This method will produce a dust coating on, or severe abrasion of a test item, whichcould influence the results of other MIL-STD-810 methods such as Humidity (method 507.4), Fungus(method 508.5), and Salt Fog (method 509.4). Therefore, use judgment in determining where in thesequence of tests to apply this method. Additionally, results obtained from the High Temperature testmethod (501.4) may be required to define temperature parameters used in this method. On the other hand,the presence of dust in combination with other environmental parameters can induce corrosion or moldgrowth. A warm humid environment can cause corrosion in the presence of chemically aggressive dust.
2.2 Selecting Procedures.
This method includes three test procedures, Procedure I (Blowing Dust), Procedure II (Blowing Sand), andProcedure III (Settling Dust). Determine the procedure(s) to be used.
2.2.1 Procedure selection considerations.
When selecting procedures, consider:
a. The operational purpose of the materiel. From the requirements documents, determine the functions to beperformed by the materiel in a sand or dust environment and any limiting conditions such as storage.
b. The natural exposure circumstances.
c. The test data required to determine if the operational purpose of the materiel has been met.
d. Procedure sequence. If both sand and dust procedures are to be applied to the same test item, it is generallymore appropriate to conduct the less damaging first, i.e., settling dust, blowing dust, and then blowing sand.
2.2.2 Difference among procedures.
While all procedures involve sand and dust, they differ on the basis of particle size and type of movement. These testprocedures are tailorable to the extent that the user must specify the test temperature, dust composition, test duration,and air velocity.
a. Procedure I - Blowing Dust. Use Procedure I to investigate how susceptible materiel is to concentrations ofblowing dust (< 149 Pm).
b. Procedure II - Blowing Sand. Use Procedure II to investigate how susceptible materiel is to the effects ofblowing, large particle sand (150 Pm to 850 Pm).
c. Procedure III - Settling Dust. Use Procedure III to investigate the effects of settling dust (d 105 Pm) onmateriel (usually electrical) in sheltered or enclosed areas with negligible airflow (e.g., offices, laboratories,store rooms, tents) where dust may accumulate over long periods. Settling dust can also affect the heatdissipation of materiel with accumulated dust on the top surface. Also, use the settling dust test to verify thequality of air filters used in the inlet of air pollution samplers for outdoor use.
Downloaded from http://www.everyspec.com on 2012-06-04T5:34:26.
MIL-STD-810F1 January 2000
METHOD 510.4510.4-3
2.3 Determine Test Levels and Conditions.
Having selected this method and relevant procedures (based on the materiel's requirements documents and thetailoring process), it is necessary to complete the tailoring process by selecting specific parameter levels and specialtest conditions/techniques for these procedures based on requirements documents, Life Cycle Environmental Profile,Operational Environment Documentation (see Part One, figure 1-1), and information provided with this procedure.From these sources of information, determine the functions to be performed by the materiel in sand and dustenvironments or following storage in such environments. Then determine the sand and dust levels of thegeographical areas and micro-environments in which the materiel is designed to be employed. To do this, considerthe following in light of the operational purpose and life cycle of the materiel.
2.3.1 Identify climatic conditions.
Identify the appropriate climatic conditions for the geographic areas in which the materiel will be operated andstored, and whether or not test item needs to be operated during the test.
2.3.2 Determine exposure conditions.
Base the specific test conditions on field data if available. In the absence of field data, determine the test conditionsfrom the applicable requirements documents. If this information is not available, use the following guidance:
2.3.2.1 Test item configuration.
Use a test item configuration that reproduces, as close as possible, the anticipated materiel configuration duringstorage or use, such as:
a. Enclosed in a shipping/storage container or transit case.
b. Protected or unprotected.
c. Deployed realistically or with restraints, such as with openings that are normally covered.
2.3.2.2 Temperature.
Unless otherwise specified, conduct the blowing sand and blowing dust tests with the test item at the high operatingor storage temperature obtained from the temperature response of the test item in the high temperature test (method501.4). Unless otherwise specified, perform the settling dust test at 23 r2°C which is in the standard ambient range.
2.3.2.3 Relative humidity.
High levels of relative humidity (RH) may cause caking of dust particles. Consequently, control the test chamberRH to not exceed 30% for both blowing and settling tests.
2.3.2.4 Air velocity.
a. Blowing dust. The air velocities used in the blowing dust (small particle) test procedure include a minimumair velocity of 1.5 m/s (300 ft/min) to maintain test conditions, and a higher air velocity of 8.9 m/s (1750ft/min) typical of desert winds, to be used in the absence of specified values. Use other air velocities ifrepresentative of natural conditions and if the capabilities of the test chamber allow.
b. Blowing sand. Winds of 18 m/s (3540 ft/min) capable of blowing the large particle sand are common,while gusts up to 29 m/s (5700 ft/min) are not unusual. If the induced flow velocity around the materiel inits field application is known to be outside of this range, use the known velocity. Otherwise use an airvelocity in the range of 18-29 m/s to maintain the blowing sand particles.
NOTE: Ensure the sand particles impact the test item at velocities ranging from 18-29 m/s. In order for the particlesto attain these velocities, maintain an approximate distance of 3-m (10 ft) from the sand injection point to the testitem. Use shorter distances if it can be proven the particles achieve the necessary velocity at impact.
Downloaded from http://www.everyspec.com on 2012-06-04T5:34:26.
MIL-STD-810F1 January 2000
METHOD 510.4510.4-4
c. Settling dust. Use only sufficient air velocity to disperse the dust in the air above the test item, and ensure itdoes not produce an air velocity at the test item of more than 0.2 m/s.
2.3.2.5 Sand and dust composition.
a. Blowing dust. Conduct the small-particle (blowing dust) procedure with any of the following dustcompositions, by weight.
(1) Red china clay is common worldwide and contains:
CaCO3, MgCO3, MgO, TiO2, etc. 5%
Ferric oxide (Fe2O3) 10 r5%
Aluminum oxide (Al2O3) 20 r10%
Silicon dioxide (SiO2) remaining percentage
(2) Silica flour has been widely used in dust testing and contains 97 to 99 percent (by weight) silicondioxide.
(3) Other materials may be used for dust testing, but their particle size distribution may fall below that in2.3.2.5a(4), below. Ensure material to be used is appropriate for the intended purpose and regions ofthe world being simulated; e.g., for dust penetration, ensure the particle sizes are no larger than thoseidentified for the region. These materials for dust testing include talc (talcum powder) (hydratedmagnesium silicate), F.E. (fire extinguisher powder composed mainly of sodium or potassiumhydrogen carbonate with a small amount of magnesium stearate bonded to the surface of theparticles in order to assist free-running and prevent clogging - must be used in dry conditions toprevent corrosive reaction and formation of new chemicals (reference c.)), quartz (the mainconstituent of many dusts occurring in nature), and undecomposed feldspar and olivine (which havesimilar properties to quartz).
**WARNING**: Refer to the supplier's Material Safety Data Sheet (MSDS) or equivalent for health hazard data.Exposure to silica flour can cause silicosis; other material may cause adverse health effects.
(4) Unless otherwise specified, use a particle size distribution of 100% by weight less than 150 Pm, witha median diameter (50% by weight) of 20 ±5 Pm. This dust is readily available as a 140 mesh SilicaFlour (about 2% retained on a 140 mesh (108 microns) sieve) and should provide comparable resultsto prior test requirements. National documentation may contain other more specific distributions.
b. Blowing sand. Unless otherwise specified, for the large particle sand test use silica sand (at least 95% byweight SiO2). Use sand of sub-angular structure, a mean Krumbein number range of 0.5 to 0.7 for bothroundness and sphericity and a hardness factor of 7 mhos. Due to the loss of subangular structure andcontamination, re-use of test sand is normally not possible. If possible, determine the particle sizedistribution from the geographical region in which the materiel will be deployed. There are 90 deserts inthe world, each with different particle size distributions. Therefore, it is impossible to specify a particle sizedistribution that encompasses all areas. The recommended particle size distribution for the large particlesand test is from 150Pm to 850 Pm, with a mean of 90 r5% by weight smaller than 600 Pm and larger than149 Pm, and at least 5% by weight 600 Pm and larger. When materiel is designed for use in a region whichis known to have an unusual or special sand requirement, analyze a sample of such sand to determine thedistribution of the material used in the test. Specify the details of its composition in the requirementsdocuments.
**WARNING**: The same health hazard considerations as noted for the dust apply. Refer to the supplier'sMaterial Safety Data Sheet (MSDS) or equivalent for health hazard data; exposure can cause silicosis.
c. Settling dust. Although settling dust can be of numerous compositions to include quartz, silica, salts,fertilizers, organic fibers, etc., use the small particle dusts described above to evaluate the potential effectsof most settling dust. Do not use dust with particles larger than 105 Pm.
Downloaded from http://www.everyspec.com on 2012-06-04T5:34:26.
MIL-STD-810F1 January 2000
METHOD 510.4510.4-5
2.3.2.6 Sand and dust concentrations.
a. Blowing dust. Unless otherwise specified, maintain the dust concentration for the blowing dust test at 10 r7g/m3 (0.3 r0.2 g/ft3) unless otherwise specified. This figure is not unrealistic and is used because of thelimitations of most chambers.
b. Blowing sand. Unless otherwise specified, maintain the sand concentrations as follows (reference a):
(1) For materiel likely to be used close to helicopters operating over unpaved surfaces:2.2 r 0.5 g/m3 (0.06 r0.015 g/ft3).
(2) For material never used or exposed in the vicinity of operating aircraft, but which may be used orstored unprotected near operating surface vehicles: 1.1 r0.3 g/m3 (0.033 r0.0075 g/ft3).
(3) For material that will be subjected only to natural conditions: 0.18 g/m3, -0.0/+0.2 g/m3 (0.005g/ft3). (This large tolerance is due to the difficulties of measuring concentrations at low levels.)
c. Settling dust. For the settling dust test, the relationship between severity (duration and concentration) isdifficult to determine. Real conditions vary considerably, and this test is intended to standardize a means todemonstrate survival of the materiel, and not necessarily duplicate conditions. Consequently, onlyguidelines are given in order to provide guidance on the relationship between the severity levels of the testand some values from real conditions. Unless otherwise specified, use a dust settlement rate of 6 g/m2/day.Table 510.4-I provides average dust deposits for various areas along with a rough guide to accelerationfactors for the specified rates (reference d). For example, a 3-day test equates to between 51 days and 1800days (5 years) for rural and suburban environments, and between 9 days and 18 days for an industrialenvironment.
TABLE 510.4-I. Settling dust quantities and acceleration factors.
AREA DUST SETTLEMENTPER DAY (g/m2)
ACCELERATION FACTOR
(with 6 g/m2/day)
Rural and suburban 0.01 - 0.36 600 - 17
Urban 0.36 - 1.00 17 - 6Industrial 1.00 - 2.00 6 - 3
2.3.2.7 Orientation.
a. Blowing dust tests. Unless otherwise specified, orient the test item such that the most vulnerable surfacesface the blowing dust. Using the specified test duration, rotate the test item (if required) at equal intervalsto expose all vulnerable surfaces.
b. Blowing sand tests. Orient the test item with respect to the direction of the blowing sand such that the testitem will experience maximum erosion effects. The test item may be re-oriented at 90-minute intervals.
c. Settling dust tests. Install the test item in the test chamber in a manner representative of its anticipateddeployment in service.
2.3.2.8 Duration.
a. Blowing dust. Unless otherwise specified, conduct blowing dust tests for 6 hours at 23°C and an additional6 hours at the high storage or operating temperature. If necessary, stop the test after the first 6-hour periodprovided that prior to starting the second 6-hour period the chamber conditions are restabilized.
b. Blowing sand. Perform blowing sand tests for a minimum of 90 minutes per each vulnerable face.
Downloaded from http://www.everyspec.com on 2012-06-04T5:34:26.
MIL-STD-810F1 January 2000
METHOD 510.4510.4-6
c. Settling dust. Use a basic deposition rate of 6 g/m2/day. This, combined with the values shown in table510.4-I provides a rough guide to acceleration factors for the areas shown. If no specific region isidentified, use a test duration of three days (for standardization purposes) to provide a reasonable severity.
2.3.2.9 Operation during test.
a. Determine the need to operate the test item during exposure to sand or dust from the anticipated in-serviceoperational requirements. For example, operate heating/cooling test items while exposed to extremeambient environments, but operate certain materiel, although exposed to severe environments, in anenvironmentally controlled shelter. If the test item must be operated during the test, specify the time andperiods of operation in the test plan. Include at least one 10-minute period of continuous operation of thetest item during the last hour of the test, with the test item's most vulnerable surface facing the blowing sandor dust.
b. For the settling dust test, condition the test item which employs forced air cooling with the air coolingsystem operating to determine the effect of dust trapped in filters; operate heat-generating materiel withventilation openings for convection cooling during the test; operate heat-generating materiel of closedconstruction intermittently in order to produce a breathing effect by thermal cycling, or to determinethermal increase due to insulative effects of accumulated dust.
3. INFORMATION REQUIRED.
3.1 Pretest.
The following information is required to conduct sand and dust tests adequately.
a. General. Information listed in Part One, paragraphs 5.7 and 5.9, and Appendix A, Task 405 of thisstandard.
b. Specific to this method.
(1) Test temperature
(2) Relative humidity
(3) Air velocity
(4) Sand or dust composition
(5) Sand or dust concentration
(6) Operating requirements
(7) Test item orientation and exposure time per orientation
(8) Methods of sand and dust removal as used in service
3.2 During Test.
Collect the following information during conduct of the test:
a. General. Information listed in Part One, paragraph 5.10, and in Appendix A, Task 406 of this standard.
b. Specific to this method.
(1) Periodic dust concentrations.
(2) Periodic relative humidity levels.
Downloaded from http://www.everyspec.com on 2012-06-04T5:34:26.
MIL-STD-810F1 January 2000
METHOD 510.4510.4-7
3.3 Post Test.
The following post test information is required.
a. General. Information listed in Part One, paragraph 5.13, and in Appendix A, Task 406 of this standard.
b. Specific to this method.
(1) Initial test item orientation and any orientation change during test.
(2) Values of the test variables for each section of the test (temperature, relative humidity, air velocity,sand/dust concentration and duration).
(3) Results of each visual inspection.
4. TEST PROCESS.
4.1 Test Facility.
Ground the test item and facility to avoid buildup of an electrostatic charge. Verify resistance/continuity inaccordance with applicable safety requirements for the materiel. Employ a data collection system separate from thechamber controllers to measure the test volume conditions (see Part One, paragraph 5.18). Use charts that arereadable to within 0.6°C (1°F) to record temperature. Except for gaseous nitrogen (GN2), achieve dehumidification,heating and cooling of the air envelope surrounding the test item by methods that do not change the chemicalcomposition of the air, dust, sand and water vapor within the chamber test volume air. The following information isalso appropriate.
a. Blowing dust.
(1) Use a test facility that consists of a chamber and accessories to control dust concentration, velocity,temperature, and humidity of dust-laden air. In order to provide adequate circulation of the dust-laden air, use a test chamber of sufficient size that no more than 50 percent of the test chamber'scross-sectional area (normal to airflow) and 30 percent of the volume of the test chamber is beoccupied by the test item(s). Maintain and verify the concentration of dust in circulation within thechamber with suitable instrumentation such as a calibrated smoke meter and standard light source.Introduce the dust-laden air into the test space in such a manner as to allow the air to become asclose to laminar as possible, but at least in a manner that prevents excessive turbulence as the flow ofdust-laden air strikes the test item.
(2) Use dust in this test as outlined in paragraphs 2.3.2.4 and 2.3.2.5, above.
b. Blowing sand. Test facility design considerations.
(1) In order to provide adequate circulation of the sand-laden air, use a test chamber of sufficient sizethat no more than 50 percent of the test chamber's cross-sectional area (normal to airflow) and 30percent of the volume of the test chamber is occupied by the test item(s).
(2) Control the sand feeder to emit the sand at the specified concentrations. To simulate the effectsproduced in the field, locate the feeder to ensure the sand is approximately uniformly suspended inthe air stream when it strikes the test item.
NOTE: Uniform sand distribution is usually easier to obtain when the sand-air mixture is directed downward.
(3) Because of the extremely abrasive characteristics of blowing sand, do not re-circulate the sandthrough the fan or air conditioning equipment.
c. Settling dust.
(1) Experience has shown that it is best to use a test section with a horizontal area at least twice the areaof the test item (see figure 510.4-1) which is large enough to maintain the uniformity of the dust
Downloaded from http://www.everyspec.com on 2012-06-04T5:34:26.
MIL-STD-810F1 January 2000
METHOD 510.4510.4-8
coating on the test item. Dust uniformity is difficult to achieve with the dust injection system. Use atest section high enough to ensure that during conditioning the air velocity around the test item isnear zero (i.e., less than 0.2 m/s). In order to accomplish this, experience shows that a test sectionheight of 4-5 times the longest horizontal test item dimension is necessary.
(2) Inject the dust (constant or hourly) into the test section above the test item (not directly into the testitem) using a minimum air flow sufficient to diffuse the dust and produce a uniform dust deposit onthe test item at a rate of 0.25 g/m2 each hour (6 r 1g/m2/day), but ensure it does not exceed 0.2 m/sat the test item. Place collection receptacles in the vicinity of the test item for dust densityverification (not near fan intakes). Do not disturb the settled dust during injection. Ensure the testitem is centrally located on a horizontal plane, at least 150 mm from any wall or other test item(unless more is required for test item intake fans).
(3) Because of difficulties associated with dust quantities, the following system has worked well:
NOTE: Contain the dust in a glass cylinder with a lid that has a manifold with fine holes through which thecompressed air is blown. The air stream stirs the dust and the dust is guided through a tube to the dust injectionsystem. The volume of compressed air per unit of time, the distance between the inlet holes and the top of the dust,and the time control of compressed air determine the amount of dust being injected. Roughly check the amount ofdust injected into the chamber by the weight loss of the container.
4.2 Controls.
a. For dust testing, maintain the test chamber relative humidity (RH) at 30% or less to prevent caking of dustparticles. Measure the humidity and dust concentration at least once an hour to ensure conditions are withinthe desired range.
b. For the blowing sand and dust tests, continuously measure the temperature during the test. Measure thehumidity at least once an hour to ensure conditions are within the desired range.
c. Verify chamber air velocity and sand concentration prior to test. Calculate the sand feed rate and verify itby measuring the sand quantity delivered over unit time using the following formula:
Rate = (Concentration)(Area)(Velocity)
where:
Rate = mass of sand introduced into the test chamber per set time interval
Concentration = sand concentration required by the test plan
Area = cross-sectional area of the wind stream at the test item location.
Velocity = average velocity of air at the test item location
d. For the settling dust test, maintain the air velocity in the vicinity of the test item less than 0.2 m/s to allowsettling of the finer dust particles. Use collection plates in the vicinity of the test item to verify the quantityof deposited dust.
4.3 Test Interruption.
a. General. See Part One, paragraph 5.11 of this standard.
b. Specific to this method.
(1) Undertest interruption. Follow any undertest interruption by reestablishing the prescribed testconditions and continue from the point of interruption.
(2) Overtest interruption. Following exposure to excessive sand or dust concentrations, remove as muchof the accumulation as possible (as would be done in service) and continue from the point ofinterruption. If abrasion is of concern, either restart the test with a new test item or reduce theexposure period by using the concentration-time equivalency (assuming the overtest concentrationrate is known).
Downloaded from http://www.everyspec.com on 2012-06-04T5:34:26.
MIL-STD-810F1 January 2000
METHOD 510.4510.4-9
4.4 Execution.
The following steps, alone or in combination, provide the basis for collecting necessary information concerning thetest item in sand and dust environments.
4.4.1 Preparation for test.
**WARNING** The relatively dry test environment combined with the moving air, organic dust, and sand particlesmay cause a buildup of electrostatic energy that could affect operation of the test item. Use caution when makingcontact with the test item during or following testing if organic dust is used, and be aware of potential anomaliescaused by electrostatic discharge during test item checkout.
4.4.1.1 Preliminary steps.
Before starting the test, review pretest information in the currently approved test plan to determine test details (e.g.,procedures, item configuration, cycles, durations, parameter levels for storage/operation, etc.). (See paragraph 3.1,above.)
a. Determine from the test plan which test procedure is required.
b. Determine from the test plan specific test variables to be used.
c. Operate the test chamber without the test item to confirm proper operation.
(1) Calibrate the sand dispensing system for the sand concentration specified in the test plan.
(2) Adjust the air system or test item position to obtain the specified air velocity for the test item. Seeparagraph 4.1c(2), above.
(3) For the settling dust test, verify the fallout rate over a two-hour period using a one-minute injectionperiod each hour, followed by a 59-minute settling period.
4.4.1.2 Pretest standard ambient checkout.
All items require a pretest standard ambient checkout to provide baseline data. Conduct the pretest checkout asfollows:
Step 1. Position the test item as near the center of the test chamber as possible and from any other test item(if more than one item is being tested). For the blowing sand or dust procedures, orient the test itemto expose the most critical or vulnerable parts to the sand or dust stream. For the settling dust test,position the test to represent its normal orientation during operation or storage.
NOTE: If required by the test plan, change the orientation of the test item as specified during the test.
Step 2. Prepare the test item in its operating configuration or as specified in the test plan.Step 3. Ensure the test item is grounded (either through direct contact with the test chamber or with a
grounding strap).Step 4. Stabilize the test item temperature to standard ambient conditions.Step 5. Conduct a complete visual examination of the test item with special attention to sealed areas and
small/minute openings.Step 6. Document the results.Step 7. Conduct an operational checkout in accordance with the test plan and record results.Step 8. If the test item operates satisfactorily, proceed to step 1 of the test procedure. If not, resolve the
problem and restart at Step 1 of pretest checkout.
4.4.2 Procedure I - Blowing dust.
**WARNING** Silica flour (or other dusts of similar particle size) may present a health hazard. When using silicaflour, ensure the chamber is functioning properly and not leaking; if a failure of containment is noted and personnelmight have been exposed, obtain air samples and compare them to the current threshold limit values of the nationalsafety and health regulations. Make chamber repairs and/or take other appropriate action before continuing use of
Downloaded from http://www.everyspec.com on 2012-06-04T5:34:26.
MIL-STD-810F1 January 2000
METHOD 510.4510.4-10
the chamber. Be extremely careful during all steps where exposure of personnel to the silica dust is possible.Additionally, fine dust becomes potentially explosive when its concentration in air exceeds 20 g/m3.
Step 1. With the test item in the chamber, adjust the test section temperature to standard ambient conditionsand the air velocity to the required value, determined from the test plan. Adjust the test sectionrelative humidity to less than 30% and maintain it throughout the test.
Step 2. Adjust the dust feed control for a dust concentration of 10 r 7 g/m3.Step 3. Unless otherwise specified, maintain the conditions of Steps 1 and 2 for at least 6 hours. If
required, periodically reorient the test item to expose other vulnerable faces to the dust stream.SEE ABOVE WARNING NOTES in paragraphs 5.4 and 5.4.2.
Step 4. Stop the dust feed. Reduce the test section air velocity to approximately 1.5 m/s and adjust thetemperature to standard ambient conditions or as otherwise determined from the test plan.
Step 5. Maintain the step 4 conditions for 1 hour following test temperature stabilization.Step 6. Adjust the air velocity to that used in Step 1 and restart the dust feed to maintain the dust
concentration as in Step 2.Step 7. Continue the exposure for at least 6 hours or as otherwise specified. If required, operate the test
item in accordance with the test plan.Step 8. Allow the test item to return to standard ambient conditions, and the dust to settle. SEE THE
WARNING AT THE BEGINNING OF THIS PROCEDURE AND IN PARAGRAPH 4.4.1,ABOVE.
Step 9. Remove accumulated dust from the test item by brushing, wiping or shaking, taking care to avoidintroduction of additional dust or disturbing any which may have already entered the test item. Donot remove dust by either air blast or vacuum cleaning unless these methods are likely to be used inservice.
Step 10. Perform an operational check in accordance with the approved test plan, and document the resultsfor comparison with pretest data.
Step 11. Inspect the test item for dust penetration, giving special attention to bearings, grease seals,lubricants, filters, ventilation points, etc. Document the results.
4.4.3 Procedure II - Blowing sand.
Step 1. Position the test item at the required distance from the sand injection point and adjust air velocityaccording to test plan.
Step 2. Stabilize the test item at its high operating temperature.Step 3. Adjust the sand feeder to obtain the sand mass flow rate determined from the pretest calibration.Step 4. Maintain the conditions of Steps 1 through 3 for the duration specified in the test plan. If required,
re-orient the test item at 90-minute intervals to expose all vulnerable faces to the blowing sand andrepeat Steps 1-3.
Step 5. If operation of the test item during the test is required, perform an operational test of the itemduring the last hour of the test and document the results. If not, proceed to Step 6.**SEE THE WARNING IN PARAGRAPH 4.4.2, ABOVE.**
Step 6. Allow the test item to return to standard ambient conditions. Remove accumulated sand from thetest item by using the methods anticipated to be used in service such as brushing, wiping, shaking,etc., taking care to avoid introduction of additional sand into the test item.
Step 7. Conduct an operational check of the test item in accordance with the approved test plan and recordresults for comparison with pretest data.
Step 8. Visually inspect the test item looking for abrasion and clogging effects, and any evidence of sandpenetration. Document the results.
4.4.4 Procedure III - Settling dust.
**SEE THE WARNING NOTE IN PARAGRAPH 4.4.2, ABOVE.**
Step 1. With the test item and collection plates in the test chamber, adjust the test section temperature to23°C or as otherwise specified, and the relative humidity to less than 30%. (Maintain less than 30%relative humidity throughout the test.)
Downloaded from http://www.everyspec.com on 2012-06-04T5:34:26.

MIL-STD-810F1 January 2000
METHOD 510.4510.4-11
Step 2. Following stabilization of the test item temperature, introduce the required quantity of dust into thetest section for 60 r 5 seconds.
Step 3. Allow the dust to settle for 59 minutes.Step 4. Verify the dust fallout rate and, if required, repeat steps 2 and 3 above for the required number of
cycles as determined from paragraphs 2.3.2.6c and 4.1c(2).Step 5. Without unnecessarily disturbing the dust deposits, perform an operational check in accordance
with the approved test plan, and document results for comparison with pretest data.Step 6. Inspect the test item for dust penetration, giving special attention to bearings, grease seals,
lubricants, filters, ventilation points, etc. Document the results.
5. ANALYSIS OF RESULTS.
In addition to the guidance provided in Part One, paragraphs 5.14 and 5.17, the following information is provided toassist in the evaluation of the test results. Analyze any failure of a test item to meet the requirements of the materielspecifications, and consider related information such as:
5.1 Blowing and Settling Dust Tests.
Determine if:
a. Dust has penetrated the test item in sufficient quantity to cause binding, clogging, seizure or blocking ofmoving parts, non-operation contacts or relays, or the formation of electrically conductive bridges withresulting shorts.
b. Functional performance is within the specified requirements/tolerances.
c. Protective coatings were compromised.
d. Abrasion of the test item exceeds the specified levels.
5.2 Large-Particle Sand Test.
Determine if:
a. Abrasion of the test item exceeds the specified requirements.
b. The test item operates as required.
c. Protective coatings were compromised.
6. REFERENCE/RELATED DOCUMENTS.
a. Synopsis of Background Material for MIL-STD-210, Climatic Extremes for Military Equipment. Bedford,MA: Air Force Cambridge Research Laboratories, January 1974. DTIC number AD-780-508.
b. Industrial Ventilation. A Manual of Recommended Practice. Committee on Industrial Ventilation, P.O.Box 16153, Lansing, MI 48901.
c. International Electrotechnical Commission Publication 68, Test L, Dust and Sand.
d. International Electrotechnical Commission Publication 721-2-5, Test L: Dust and Sand.
Downloaded from http://www.everyspec.com on 2012-06-04T5:34:26.
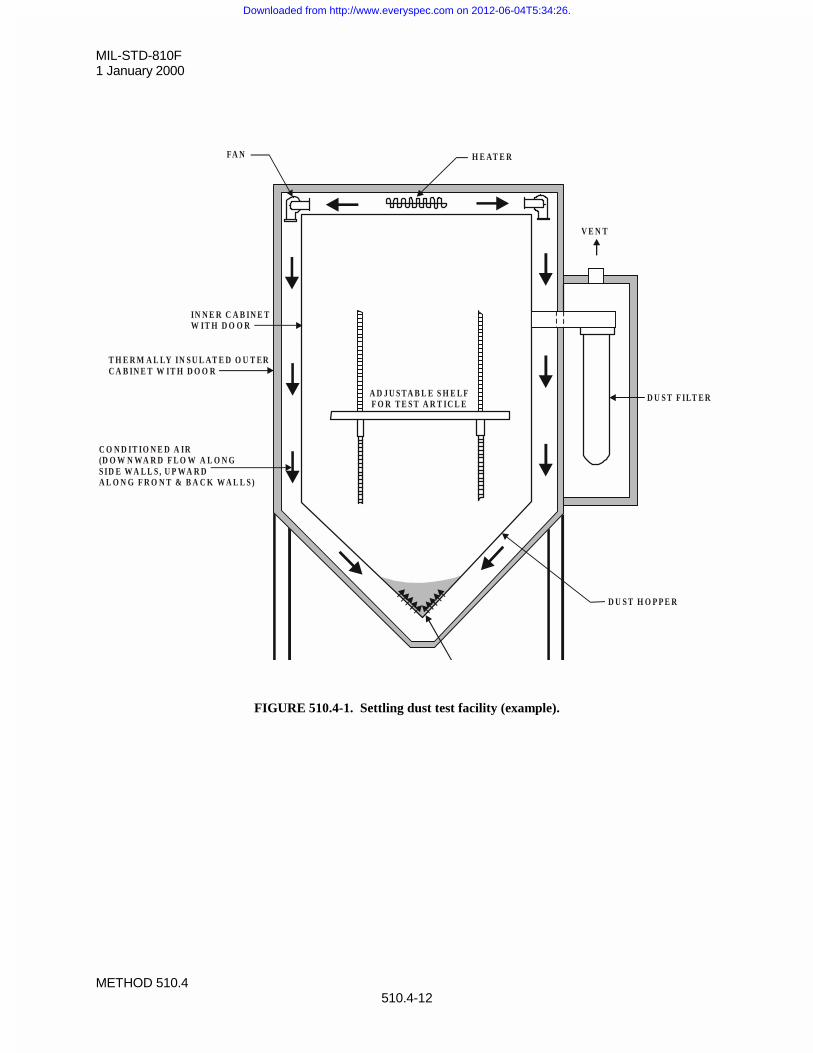
MIL-STD-810F1 January 2000
METHOD 510.4510.4-12
FIGURE 510.4-1. Settling dust test facility (example).
C O N D IT IO N E D A IR(D O W N WA R D F L O W A L O N GS ID E W A L L S , U P WA R DA L O N G F R O N T & B A C K W A L L S )
T H E R M A L LY IN S U L AT E D O U T E RC A B IN E T W IT H D O O R
IN N E R C A B IN E TW IT H D O O R
D U S T F ILT E R
V E N T
H E AT E RFA N
A D J U S TA B L E S H E L FF O R T E S T A R T IC L E
D U S T H O P P E R
Downloaded from http://www.everyspec.com on 2012-06-04T5:34:26.
MIL- STD-810F1 January 2000
METHOD 511.4511.4-1
METHOD 511.4
EXPLOSIVE ATMOSPHERE
NOTE: Tailoring is essential. Select methods, procedures, and parameter levels based on the tailoring processdescribed in Part One, paragraph 4.2.2, and Appendix C. Apply the general guidelines for laboratory test methodsdescribed in Part One, paragraph 5 of this standard.
1. SCOPE.
1.1 Purpose.
The explosive atmosphere test is performed to demonstrate the ability of materiel to operate in fuel-air explosiveatmospheres without causing ignition.
1.2 Application.
This method applies to all materiel designed for use in the vicinity of fuel-air explosive atmospheres associated withaircraft, automotive, and marine fuels at or above sea level. Use other explosive atmosphere safety tests (e.g.,electrical or mine safety) if more appropriate.
1.3 Limitations.
a. This test utilizes an explosive mixture that has a relatively low flash point which may not berepresentative of some actual fuel-air or aerosol (such as suspended dust) mixtures.
b. The explosive atmosphere test is a conservative test. If the test item does not ignite the test fuel-airmixture, there is a low probability that the materiel will ignite prevailing fuel vapor mixtures in service. Conversely, the ignition of the test fuel-air mixture by the test item does not mean the materiel willalways ignite fuel vapors that occur in actual use.
c. This test is not appropriate for test altitudes above approximately 16km where the lack of oxygen inhibitsignition.
d. This method is not appropriate for determining the capability of sealed materiel to contain an explosion.
2. TAILORING GUIDANCE.
2.1 Selecting the Explosive Atmosphere Method.
After examining requirements documents and applying the tailoring process in Part One of this standard to determinewhere explosive atmospheres are foreseen in the life cycle of the test item, use the following to confirm the need forthis method and to place it in sequence with other methods.
2.1.1 Effects of explosive atmosphere environments.
Low levels of electrical energy discharge or electrical arcing by devices as simple as pocket transistor radios canignite mixtures of fuel vapor and air. A "hot spot" on the surface of the case of a hermetically sealed, apparentlyinert materiel case can ignite fuel-air mixtures. Fuel vapors in confined spaces can be ignited by a low energydischarge such as a spark from a short circuited flashlight cell, switch contacts, electrostatic discharge, etc.
2.1.2 Sequence among other methods.
a. General. See Part One, paragraph 5.5.
Downloaded from http://www.everyspec.com on 2012-06-04T5:34:26.
MIL-STD-810F1 January 2000
METHOD 511.4511.4-2
b. Unique to this method. Considering the approach to conserve test item life by applying what areperceived to be the least damaging environments first, generally apply the explosive atmosphere test latein the test sequence. Vibration and temperature stresses may distort seals and reduce their effectiveness,thus making ignition of flammable atmospheres more likely. Recommend the test item(s) first undergovibration and/or temperature testing.
2.2 Selecting Procedure Variations.
This method has one procedure. However, the test procedure may be varied. Before conducting this test, completethe tailoring process by selecting specific procedure variations (special test conditions/techniques for this procedure)based on requirements documents, Life Cycle Environmental Profile, Operational Environment Documentation (seePart One, figure 1-1), and information provided with this procedure. Consider the following in light of theoperational purpose and life cycle of the materiel.
2.2.1 Fuel.
Unless otherwise specified, use n-hexane as the test fuel, either reagent grade or 95% n-hexane with 5% other hexaneisomers. This fuel is used because its ignition properties in flammable atmospheres are equal to or more sensitivethan the similar properties of both 100/130-octane aviation gasoline, JP-4 and JP-8 jet engine fuel. Optimummixtures of n-hexane and air will ignite from hot-spot temperatures as low as 223°C, while optimum JP-4 fuel-airmixtures require a minimum temperature of 230°C for auto-ignition, and 100/130 octane aviation gasoline and airrequires 441°C for hot-spot ignition. Minimum spark energy inputs for ignition of optimum fuel vapor and airmixtures are essentially the same for n-hexane and for 100/130-octane aviation gasoline. Much higher spark energyinput is required to ignite JP-4 or JP-8 fuel and air mixtures. Use of fuels other than hexane is not recommended.
2.2.2 Fuel-vapor mixture.
Use a homogeneous fuel-air mixture in the correct fuel-air ratios for the explosive atmosphere test. Fuel weightcalculated to total 3.8 percent by volume of the test atmosphere represents 1.8 stoichiometric equivalents of n-hexanein air, giving a mixture needing only minimum energy for ignition. This yields an air/vapor ratio (AVR) of 8.33 byweight (reference f).
a. Required information to determine fuel weight:
(1) Chamber air temperature during the test.
(2) Fuel temperature.
(3) Specific gravity of n-hexane (see figure 511.4-1).
(4) Test altitude: ambient ground or as otherwise identified.
(5) Net volume of the test chamber: free volume less test item displacement expressed in liters.
b. Calculation of the volume of liquid n-hexane fuel for each test altitude:
(1) In metric units:
Volume of 95 percent n-hexane (ml) =
� � � �� � � �� �� �� � � � »
¼
º«¬
ª
��
hexanenofgravityspecificxKtempchamber
pascalspressurechamberxlitersvolchambernet10x27.4 4
(2) In English units:
Volume of 95 percent n-hexane (ml) =
� �� �� � � �� �
� �� � � � »»¼
º
««¬
ª
� hexanenofgravityspecificxRtempchamber
psiapressurechamberxftvolchambernet41.150
3
Downloaded from http://www.everyspec.com on 2012-06-04T5:34:26.
MIL- STD-810F1 January 2000
METHOD 511.4511.4-3
2.2.3 Temperature.
Heat the fuel-air mixture to the highest ambient air temperature at which the materiel is required to operate duringdeployment and provide the greatest probability of ignition. Perform all testing at this maximum air temperature. For forced-air-cooled materiel, use a test temperature that is the highest temperature at which the materiel can beoperated and performance evaluated in the absence of cooling air.
2.2.4 Effect of humidity on flammable atmosphere.
The effect of humidity upon the fuel-air composition need not be considered in the test if the ambient air dewpointtemperature is 10qC or less because this concentration of water vapor only increases the n-hexane fuel concentrationfrom 3.82 percent to 3.85 percent of the test atmosphere. If the atmospheric pressure is cycled from an equivalent of1525 meters above the test level to 1525 meters below, (a 34 percent change in pressure), the volume of n-hexanewill decrease from 4.61 percent to 3.08 percent. This decrease will compensate for the fuel enrichment effect thatresults from water vapor dilution of the test air supply.
2.2.5 Altitude simulation.
The energy required to ignite a fuel-air mixture increases as pressure decreases. Ignition energy does not dropsignificantly for test altitudes below sea level. Therefore, unless otherwise specified, perform all tests with at leasttwo explosive atmosphere steps, one at the highest anticipated operating altitude of the materiel (not to exceed12,200m where the possibility of an explosion begins to dissipate) and one between 78 and 107 kPa (11.3 and 15.5psi) which is representative of most ground ambient pressures. As noted in paragraph 1.3, because of the lack ofoxygen at approximately 16 km, do not perform this test at or above this altitude.
2.3 Definitions.
For the purpose of this method, the following definitions apply:
a. Simulated altitude. Any height that is produced in the test chamber.
b. Test altitude. The nominal simulated height(s) above sea level at which the test item will be tested, i.e.,the maximum altitude identified in paragraph 2.2.5.
3. INFORMATION REQUIRED.
3.1 Pretest.
The following information is required to conduct explosive atmosphere tests adequately.
a. General. Information listed in Part One, paragraphs 5.7 and 5.9, and Appendix A, Task 405 of thisstandard.
b. Specific to this method.
(1) The fuel volume and/or weight.
(2) The quantity of fuel required at each test point.
(3) The off/on cycling rate for the test item.
(4) Any information relative to the location of spark-emitting devices or high temperature components.
3.2 During Test.
Collect the following information during conduct of the test:
a. General. Information listed in Part One, paragraph 5.10, and in Appendix A, Task 406 of this standard.
b. Specific to this method.
(1) Periods of operation versus test altitude (on/off points).
Downloaded from http://www.everyspec.com on 2012-06-04T5:34:26.
MIL-STD-810F1 January 2000
METHOD 511.4511.4-4
(2) Quantity of fuel introduced for each test altitude.
3.3 Post-test.
a. General. See Part One, paragraph 5.13.
b. Specific to this method.
(1) Chamber test altitude and temperature for each operational check.
(2) Occurrence of any explosion caused by the test item.
(3) Initial analysis of any failures/problems.
4. TEST PROCESS.
4.1 Test Facility.
The required apparatus consists of a chamber or cabinet together with auxiliary instrumentation capable ofestablishing, maintaining and monitoring (see Part One, paragraph 5.18) the specified test conditions. Use achamber with a means of igniting the fuel-air mixture such as a spark-gap device, as well as a means of determiningthe explosiveness of a sample of the mixture such as a spark gap or glow plug ignition source with sufficient energyto ignite a 3.82 percent hexane mixture. An alternative method of determining the explosive characteristics of thevapor is by using a calibrated explosive gas meter which verifies the degree of explosiveness and the concentrationof the fuel-air mixture.
4.2 Controls.
Before each test, verify the critical parameters. Ensure spark devices function properly and the fuel atomizingsystem is free from deposits that could inhibit its functioning. Adjust the empty test chamber to the highest testaltitude, shut off the vacuum system and measure the rate of any air leakage. Verify that any leakage is not sufficientto prevent the test from being performed as required, i.e., introduce the test fuel and wait three minutes for fullvaporization, yet still be at least 1000m above the test altitude.
4.3 Test Interruption.
a. General. See Part One, paragraph 5.11 of this standard.
b. Specific to this method. If there is an unscheduled undertest interruption, restore the chamber airpressure to ground ambient pressure and purge the chamber to remove the flammable atmosphere. Achieve the required test altitude, inject the required volume of n-hexane and reinitiate the test using thesame test item.
4.4 Test Setup.
a. General. See Part One, paragraph 5.8.
b. Unique to this method.
(1) For test item thermal stabilization measurements, install thermocouples on the most massivefunctional part of the test item, and two thermocouples attached to the inside the of test chamber todetect any temperature increase due to burning of the mixture.
(2) Install the test item in the test chamber in such a manner that it may be operated and controlled fromthe exterior of the chamber via sealed cable ports. Remove or loosen the external covers of the testitem to facilitate the penetration of the explosive mixture. Test items requiring connection betweentwo or more units may, because of size limitations, have to be tested independently. In this case,extend any interconnections through the cable ports.
Downloaded from http://www.everyspec.com on 2012-06-04T5:34:26.
MIL- STD-810F1 January 2000
METHOD 511.4511.4-5
(3) Operate the test item to determine correct operation. If possible, identify the location of anysparking or high temperature components which could cause an explosion.
(4) When necessary, simulate in-service mechanical loads on drive assemblies and servo-mechanicalsystems, and electrical loads on switches and relays; duplicate torque, voltage, current, inductivereactance, etc. In all instances, operate the test item in a manner representative of service use.
4.5 Test Execution.
The following steps, alone or in combination, provide the basis for collecting necessary information concerning themateriel in an explosive atmosphere.
4.5.1 Preparation for test.
Before starting the test, review pretest information in the test plan to determine test details (e.g., procedures, test itemconfiguration, test temperature, test altitude, etc.).
4.5.2 Procedure I - Operation in explosive atmosphere.
Step 1. With the test item installed, seal the chamber and stabilize the test item and chamber inner walls towithin 10qC below the high operating temperature of the test item.
Step 2. Adjust the chamber air pressure to simulate the highest operating altitude of the test item (not to exceed12,200m) plus 2000 meters to allow for introducing, vaporizing, and mixing the fuel with the air asdescribed in 2.2.2.
Step 3. Slowly introduce the required volume of n-hexane into the test chamber.
Step 4. Circulate the test atmosphere and continue to reduce the simulated chamber altitude for at least threeminutes to allow for complete vaporization of fuel and the development of a homogeneous mixture.
Step 5. At a pressure equivalent to 1000m above the test altitude, verify the potential explosiveness of the fuel-air vapor by attempting to ignite a sample of the mixture taken from the test chamber using a spark-gapdevice or glow plug ignition source with sufficient energy to ignite a 3.82-percent hexane mixture. Ifignition does not occur, purge the chamber of the fuel vapor and repeat Steps 1-4. An alternativemethod of determining the explosive characteristics of the vapor is by using a calibrated explosive gasmeter which verifies the degree of explosiveness and the concentration of the fuel-air mixture.
Step 6. Operate the test item and continue operation from this step until completion of Step 7. Make and breakelectrical contacts as frequently and reasonably possible.
Step 7. To ensure adequate mixing of the fuel and air, slowly decrease the simulated chamber altitude at a rateno faster than 100 meters per minute by bleeding air into the chamber.
Step 8. Stop decreasing the altitude at 1000m below the test altitude, perform one last operational check andswitch off power to the test item.
Step 9. Verify the potential explosiveness of the air-vapor mixture as in Step 5 above. If ignition does notoccur, purge the chamber of the fuel vapor, and repeat the test from Step 1.
Step 10. Repeat steps 2-7. At site pressure, perform one last operational check and switch off power to the testitem.
Step 11. Verify the potential explosiveness of the air-vapor mixture as in Step 5 above. If ignition does notoccur, purge the chamber of the fuel vapor, and repeat the test from Step 10.
Step 12. Document the test results.
Downloaded from http://www.everyspec.com on 2012-06-04T5:34:26.
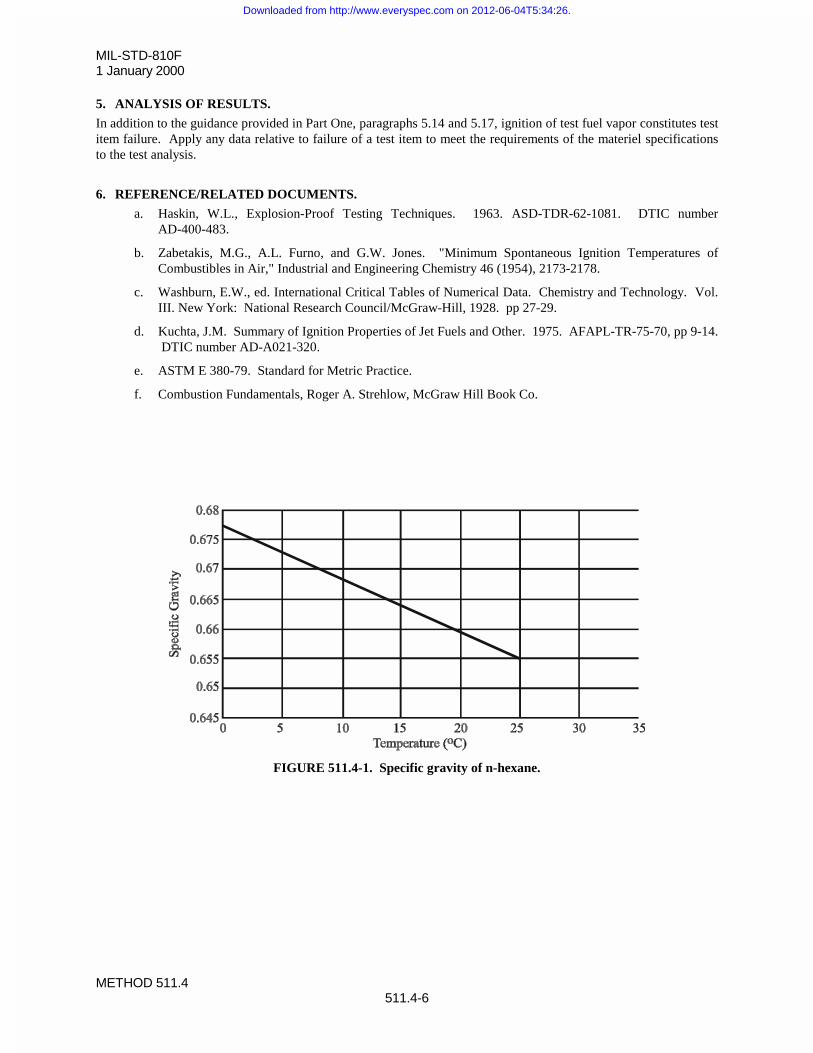
MIL-STD-810F1 January 2000
METHOD 511.4511.4-6
5. ANALYSIS OF RESULTS.
In addition to the guidance provided in Part One, paragraphs 5.14 and 5.17, ignition of test fuel vapor constitutes testitem failure. Apply any data relative to failure of a test item to meet the requirements of the materiel specificationsto the test analysis.
6. REFERENCE/RELATED DOCUMENTS.
a. Haskin, W.L., Explosion-Proof Testing Techniques. 1963. ASD-TDR-62-1081. DTIC numberAD-400-483.
b. Zabetakis, M.G., A.L. Furno, and G.W. Jones. "Minimum Spontaneous Ignition Temperatures ofCombustibles in Air," Industrial and Engineering Chemistry 46 (1954), 2173-2178.
c. Washburn, E.W., ed. International Critical Tables of Numerical Data. Chemistry and Technology. Vol.III. New York: National Research Council/McGraw-Hill, 1928. pp 27-29.
d. Kuchta, J.M. Summary of Ignition Properties of Jet Fuels and Other. 1975. AFAPL-TR-75-70, pp 9-14. DTIC number AD-A021-320.
e. ASTM E 380-79. Standard for Metric Practice.
f. Combustion Fundamentals, Roger A. Strehlow, McGraw Hill Book Co.
FIGURE 511.4-1. Specific gravity of n-hexane.
Downloaded from http://www.everyspec.com on 2012-06-04T5:34:26.
MIL-STD-810F1 January 2000
METHOD 512.4512.4-1
METHOD 512.4
IMMERSION
NOTE: Tailoring is essential. Select methods, procedures, and parameter levels based on the tailoring processdescribed in Part One, paragraph 4.2.2, and Appendix C. Apply the general guidelines for laboratory test methodsdescribed in Part One, paragraph 5 of this standard.
1. SCOPE.
1.1 Purpose.
The immersion test is performed to determine if materiel can withstand immersion or partial immersion (e.g.,fording) in water and operate as required during or following immersion.
1.2 Application.
Use this method for materiel that may be exposed to partial or complete immersion, with or without operation. Thistest may, in some cases, be used to verify watertightness in lieu of a rain test, provided the materiel configurationwould be the same for both situations, and the method of water ingress is well understood. There are documentedsituations in which the impact of rain causes pumping of water across seals during the rain test that does not occurwhen seals are held tight against a backing plate by the static pressure of the immersion test. In most cases, bothtests should be performed.
1.3 Limitations.
Immersion tests are not intended to be used for buoyant items unless the life cycle profile identifies specificapplications such as restraints (including palletized loads) that could hold the materiel under water.
2. TAILORING GUIDANCE.
2.1 Selecting the Immersion Method.
After examining requirements documents and applying the tailoring process in Part One of this standard to determinewhere immersion or fording is anticipated in the life cycle of materiel, use the following to confirm the need for thismethod and to place it in sequence with other methods.
2.1.1 Effects of leakage during immersion.
Penetration of water into materiel or packaging enclosures can result in problems. Consider the following typicalproblems to help determine if this method is appropriate for the materiel being tested. This list is not intended to beall-inclusive.
a. Fouling of lubricants between moving parts.
b. Formation of electrically conductive paths which may cause electrical or electronic equipment tomalfunction or become unsafe to operate.
c. Corrosion due to direct exposure to the water or to the relatively high humidity levels caused by thewater.
d. Impairment of the burning qualities of explosives, propellants, fuels, etc.
e. Failure of vehicle engines to operate.
Downloaded from http://www.everyspec.com on 2012-06-04T5:34:26.
MIL-STD-810F1 January 2000
METHOD 512.4512.4-2
2.1.2 Sequence among other methods.
a. General. See Part One, paragraph 5.5.
b. Unique to this method.
(1) There are at least two philosophies related to test sequence. One approach is to conserve test itemlife by applying what are perceived to be the least damaging environments first. For this approach,generally apply the immersion test prior to most other climatic tests.
(2) Another approach is to apply environments to maximize the likelihood of disclosing sequentialproblems. For this approach, consider the immersion test both before and after structural tests suchas shock and vibration to aid in determining the test item's resistance to dynamic tests.
2.2 Selecting Procedures.
This method includes two test procedures, Procedure I (Immersion) and Procedure II (Fording). Determine theprocedure(s) to be used.
2.2.1 Procedure selection considerations.
When selecting procedures, consider:
a. The operational purpose of the materiel. From the requirements documents, determine the functions tobe performed by the materiel when partially or completely immersed in water.
b. The natural exposure circumstances.
c. The test data required to determine whether the operational purpose of the materiel has been met.
2.2.2 Difference among procedures.
While both procedures involve some degree of immersion, they differ in that Procedure I (Immersion) primarilyaddresses leakage during immersion of encased materiel, while Procedure II (Fording) focuses on vehicles traversinga body of water or materiel secured to such vehicles.
2.3 Determine Test Levels and Conditions.
Having selected this method and relevant procedures (based on the materiel's requirements documents and thetailoring process), it is necessary to complete the tailoring process by selecting specific parameter levels and specialtest conditions/techniques for these procedures based on requirements documents, Life Cycle Environmental Profile,Operational Environment Documentation (see Part One, figure 1-1), and information provided with this procedure. From these sources of information, determine the functions to be performed by the materiel while immersed orfollowing exposure to immersion. Then, determine the depth and duration of immersion anticipated in areas inwhich the materiel is designed to be employed. To do this, consider the following in light of the operational purposeand life cycle of the materiel.
2.3.1 Identify climatic conditions.
Identify the appropriate climatic conditions for the geographic areas in which the materiel will be operated andstored, and whether or not test item needs to be operated during the test.
2.3.2 Determine exposure conditions.
Base the specific test conditions on field data if available. In the absence of field data, determine the test conditionsfrom the applicable requirements documents. If this information is not available, use the following guidance:
Downloaded from http://www.everyspec.com on 2012-06-04T5:34:26.
MIL-STD-810F1 January 2000
METHOD 512.4512.4-3
2.3.2.1 Test item configuration.
Use a test item configuration that reproduces, as close as possible, the anticipated materiel configuration duringstorage or use, such as:
a. Enclosed in a shipping/storage container or transit case.
b. Protected or unprotected.
c. Deployed realistically or with restraints, such as with openings that are normally covered.
2.3.2.2 Conditioning temperature.
Experience has shown that a temperature differential between the test item and the water can affect the outcome(leakage) of an immersion test. Increasing the test item temperature above the water temperature for the immersiontest (Procedure I) usually includes heating of the test item to establish a pressure differential (while cooling) todetermine if the seals or gaskets leak under relatively low pressure differential, and to induce expansion/contractionof materials. Although desired, establishing a specific temperature differential for fording tests is often impracticaldue to the size of the materiel. Also, consider materiel adjacent to heat-producing equipment such as engines, anduse temperatures indicative of actual exposure.
a. Unless otherwise identified, three options are provided for the conditioning of the test item:
(1) 27°C above the water temperature - to represent exposure to solar heating immediately prior toimmersion.
(2) 10°C above the water temperature to represent a typical temperature difference between materiel andwater.
(3) Equal to the water temperature to represent situations in which little or no temperature differentialexists. This may be used for large items for which adequate conditioning facilities are not available,provided the depth of immersion is adjusted to result in the same differential pressure.
b. Recommended the duration of conditioning immediately prior to immersion be at least two hours toensure maximum heat loss during immersion and cooling.
2.3.2.3 Depth of immersion.
a. Complete immersion. For testing the integrity of a test item, either use a 1m representative coveringdepth (measured from the uppermost surface of the test item to the surface of the water) or apply anequivalent pressure. The relevant depth/pressure equation follows:
P = 9.8d
Where:d = depth of the water in metersP = pressure in kPa.
NOTE: The equivalent head of sea water is 0.975 times the head of fresh water for the same pressure difference.
b. Partial immersion. Where materiel is unlikely to be completely immersed either due to anticipated waterdepths or to its ability to float, and being unlikely to be restrained, a partial immersion test may beappropriate. In this case, specify depths as being measured from the base of the materiel rather than fromthe top as in paragraph 2.4.2.1.
2.3.2.4 Depth of fording.
The fording test may also be used to cover the requirements of STANAG 2805, "Minimum Fordability andFloatation Requirements for Tactical Vehicles and Guns, and Minimum Immersion Requirements for CombatEquipment Normally Installed or Carried in Open Vehicles or Trailers" which specifies the following depths.
Downloaded from http://www.everyspec.com on 2012-06-04T5:34:26.
MIL-STD-810F1 January 2000
METHOD 512.4512.4-4
a. Shallow fording.
(1) Tanks and armored cars.
- Light tanks and armored cars - 1m.
- Other tanks (slightly more ground compression) - 1.05m.
(2) Vehicles under 2 ton payload - 0.5m
(3) Other vehicles - 0.75m
b. Deep fording. It is essential that all tactical vehicles and guns, either with built-in waterproofing or bythe use of waterproofing kits, be able to deep ford six (6) minutes in fresh or salt water to the depthsindicated below (the depth to take into account ramp angle as well as wave height):
(1) Fully enclosed armored vehicles should be able to deep ford to the top of the turret. (Alternatively,these vehicles to be fitted with flotation equipment.)
(2) All other prime movers or self propelled guns, except trailed loads, should be able to deep ford1.5m.
(3) All trailers or towed guns should be capable of complete immersion. (Alternatively, this materielshould be capable of flotation.)
2.3.2.5 Materiel fording.
Materiel designed to be transported on open vehicles and trailers (such as equipment trailers) should be capable ofwithstanding partial immersion as anticipated during fording exercises. Examples of fording depths for this type ofmateriel are as follow:
a. S-280 shelter: 53 cm
b. S-250 shelter: 76 cm
2.3.2.6 Duration of immersion or exposure.
Use a duration of immersion typical of that anticipated during use. If this duration is unknown, a 30-minuteimmersion period is considered adequate to develop leakage if it is to occur. Use one hour fording durations (otherthan as specified in 2.3.2.2) which may be extended if justified by the anticipated life cycle profile.
3. INFORMATION REQUIRED.
3.1 Pretest.
The following information is required to conduct immersion/fording tests adequately.
a. General. Information listed in Part One, paragraphs 5.7 and 5.9, and Appendix A, Task 405 of thisstandard.
b. Specific to this method.
(1) The temperature to which to heat the test item (above the water temperature) and duration.
(2) The fording/immersion depths.
(3) The immersion durations.
(4) Tiedown precautions (to prevent unrealistic stress).
Downloaded from http://www.everyspec.com on 2012-06-04T5:34:26.
MIL-STD-810F1 January 2000
METHOD 512.4512.4-5
3.2 During Test.
Collect the following information during conduct of the test:
a. General. Information listed in Part One, paragraph 5.10, and in Appendix A, Task 406 of this standard.
b. Specific to this method.
(1) Location of any bubbles (indicating leaks).
(2) Water temperature 15 minutes following immersion.
3.3 Post Test.
The following post test information is required.
a. General. Information listed in Part One, paragraph 5.13, and in Appendix A, Task 406 of this standard.
b. Specific to this method.
(1) Pretest water and test item temperatures.
(2) Quantity of any free water found inside the test item and probable point(s) of entry.
(3) Actual covering depth of water.
(4) Duration of immersion.
4. TEST PROCESS.
4.1 Test Facility.
a. For immersion tests, in addition to a chamber or cabinet capable of conditioning the test item to therequired temperature, use a water container that can achieve a covering depth of 1m (or other requireddepth) of water over the uppermost point of the test item and maintain the test item at that depth. Torepresent greater depths, it may be necessary to apply air pressure to the surface of the water.
b. For fording tests, use a facility equipped with a tie-down capability to prevent buoyant test items fromfloating.
c. A water soluble dye such as fluorescein may be added to the water to aid in locating water leaks.
4.2 Controls.
Before each test, verify the critical parameters. Ensure the immersion test pulldown/hold-down device is functioningproperly and that there are no safety problems.
4.3 Test Interruption.
a. General. See Part One, paragraph 5.11 of this standard.
b. Specific to this method.
(1) Undertest interruption. Treat an interruption that results in less severe conditions than specified as a"no test." Dry the test item and repeat the entire test procedure from the beginning. Treat anyfailure discovered during an undertest condition as a failure.
(2) Overtest interruption. If more severe conditions than intended are applied and a failure results,repeat the test, if possible, on a replacement item. If no failure occurs, the test need not be repeated.
4.4 Execution.
The following steps, alone or in combination, provide the basis for collecting necessary information concerning thetest item when partially or completely immersed in water.
Downloaded from http://www.everyspec.com on 2012-06-04T5:34:26.
MIL-STD-810F1 January 2000
METHOD 512.4512.4-6
4.4.1 Preparation for test.
4.4.1.1 Preliminary steps.
Before starting the test, review pretest information in the currently approved test plan to determine test details (e.g.,procedures, item configuration, cycles, durations, parameter levels for storage/operation, etc.). (See paragraph 3.1above.)
NOTE: Do not use sealing, taping, caulking, etc., except as required in the design specification for the materiel.
a. If possible, when testing a shipping/storage container or transit case without the test items enclosed,remove all dunnage, packing, padding material, etc., which may absorb water before the test so thatleakage can be detected. This option may not provide an adequate test of the container if the seals arenot representatively stressed because of the absence of the contents.
b. Secure items that may experience immersion when mounted on or secured to a carrying platformrepresentatively. If representative of the real life situation, stacking is an acceptable method ofrestraining items under water.
4.4.1.2 Pretest standard ambient checkout.
All items require a pretest standard ambient checkout to provide baseline data. Conduct the pretest checkout asfollows:
Step 1. Stabilize the test item temperature to standard ambient conditions.
Step 2. Conduct a complete visual examination of the test item with special attention to sealed areas,gaskets/seals, and structural integrity, and document the results. Take photographs, if appropriate. Verify that no free water is present; if so, dry.
Step 3. Conduct an operational checkout in accordance with the test plan and record the results.
Step 4. If the test item operates satisfactorily and seals appear to function as intended, proceed to Step 1 of thetest procedure. If not, resolve the problem and restart at Step 1 of pretest checkout.
4.4.2 Procedure I - Immersion.
Step 1. If weight gain is likely to be an acceptable method of determining leakage, weigh the test item.
Step 2. Three times immediately before the test, open and close (or remove and replace) any doors, covers, etc.,that would be opened during normal use to ensure any seals are functioning properly and are notadhering to the sealing surfaces.
Step 3. Measure and record the immersion water temperature.
Step 4. Condition the test item as in paragraph 2.3.2.2 and record the conditioning temperature and duration. Leave the test item's sealed areas (where appropriate) open throughout the conditioning cycle. Also,materiel occasionally incorporates valves or venting devices which may or may not be opened innormal service use. If the test item incorporates such devices, open them throughout the conditioningportion of the test.
Step 5. Close all sealed areas and valves; assemble the test item in its test configuration and, as quickly aspossible, immerse the test item in water so that the uppermost point of the test item is 1 r0.1m belowthe surface of the water, or as otherwise required by the test plan. The orientation of the test itemshould represent that of its expected in-service orientation. If several orientations are possible, selectthat which is most severe.
Step 6. Following a 30-minute immersion period (or as otherwise specified in the test plan), remove the testitem from the water, wipe the exterior surfaces dry (giving special attention to areas around seals andrelief valves) and, if applicable, equalize the air pressure inside by activating any manual valves. Becareful to not allow water to enter the test item while activating the manual valves.
Downloaded from http://www.everyspec.com on 2012-06-04T5:34:26.
MIL-STD-810F1 January 2000
METHOD 512.4512.4-7
Step 7. If appropriate, re-weigh the test item.
Step 8. Open the test item and examine the interior and contents for evidence of and quantity of any leakage,and for probable areas of entry, if leakage occurred.
Step 9. If appropriate, conduct an operational check of the test item and record results.
4.4.3 Procedure II - Fording.
Conduct the fording test in one of two ways: by towing or driving the test item through water at the appropriatedepth, or by securing the test item in a tank and flooding the tank to the required depth. Unless otherwise justified,condition the test item as in paragraph 2.3.2.2.
Step 1. If weight gain is likely to be an acceptable method of determining leakage, weigh the test item prior tothe test.
Step 2. With the test item in its fording configuration, ensure that any drain plugs or apparatus are closed, andeither:
a. tow or drive the test item into the water at the required depth or,
b. secure the test item in a watertight tank.
Step 3. If using the tank method, flood the tank to the required height above the bottom of the test item.
Step 4. Maintain the test item in the water for a duration as determined in paragraph 2.3.2.6.
Step 5. Either remove the test item from the water or drain the water from the facility, and inspect the interior ofthe test item for evidence of free water.
Step 6. Measure and record the amount of any free water, and the probable point(s) of entry. If appropriate, re-weigh the test item.
5. ANALYSIS OF RESULTS.
In addition to that specified in Part One, paragraphs 5.14 and 5.17, any evidence of water penetration into the testitem following this test must be assessed for its short and long term effects, as well as the requirements of the testitem specification. To assist in the evaluation of test results, consider the effects of free water as well as the increaseof relative humidity in closed containers following the evaporation of any free water.
6. REFERENCE/RELATED DOCUMENTS.
STANAG 2805, “Minimum Fordability and Floatation Requirements for Tactical Vehicles and Guns, and MinimumImmersion Requirements for Combat Equipment Normally Installed or Carried in Open Vehicles or Trailers forMobile Equipment.”
Downloaded from http://www.everyspec.com on 2012-06-04T5:34:26.

MIL-STD-810F1 January 2000
METHOD 512.4512.4-8
THIS PAGE INTENTIONALLY BLANK
Downloaded from http://www.everyspec.com on 2012-06-04T5:34:26.
MIL-STD-810F1 January 2000
METHOD 513.5513.5-1
METHOD 513.5
ACCELERATION
NOTE: Tailoring is essential. Select methods, procedures and parameter levels based on the tailoring processdescribed in Part One, paragraph 4, and Appendix C. Apply the general guidelines for laboratory test methodsdescribed in Part One, paragraph 5 of this standard.
1. SCOPE.
1.1 Purpose.
The acceleration test is performed to assure that materiel can structurally withstand the steady state inertia loads thatare induced by platform acceleration, deceleration, and maneuver in the service environment, and function withoutdegradation during and following exposure to these forces. Acceleration tests are also used to assure that materieldoes not become hazardous after exposure to crash inertia loads.
1.2 Application.
This test method is applicable to materiel that is installed in aircraft, helicopters, manned aerospace vehicles, air-carried stores, and ground-launched missiles.
1.3 Limitations.
1.3.1 Acceleration.
As addressed in this method, acceleration is a load factor (inertia load, "g" load) applied slowly enough and heldsteady for a period of time long enough such that the materiel has sufficient time to fully distribute the resultinginternal loads, and such that dynamic (resonant) response of the materiel is not excited. Where loads do not meetthis definition, more sophisticated analysis, design, and test methods are required.
1.3.2 Aerodynamic loads.
Materiel mounted such that any or all surfaces are exposed to aerodynamic flow during platform operations aresubject to aerodynamic loads in addition to inertia loads. This method is not generally applicable to these cases.Materiel subject to aerodynamic loads must be designed and tested to the worst case combinations of these loads.This often requires more sophisticated test methods usually associated with airframe structural (static and fatigue)tests.
1.3.3 Acceleration versus shock.
Acceleration loads are expressed in terms of load factors which, although dimensionless, are usually labeled as "g"loads. Shock environments (methods 516.5 and 517) are also expressed in "g" terms. This sometimes leads to themistaken assumption that acceleration requirements can be satisfied by shock tests or vice versa. Shock is a rapidmotion that excites dynamic (resonant) response of the materiel but with very little overall deflection (stress). Shocktest criteria and test methods cannot be substituted for acceleration criteria and test methods or vice versa.
Downloaded from http://www.everyspec.com on 2012-06-04T5:34:26.
MIL-STD-810F1 January 2000
METHOD 513.5513.5-2
2. TAILORING GUIDANCE.
2.1 Selecting the Acceleration Method.
After examining requirements documents and applying the tailoring process in Part One of this standard to determinewhere acceleration effects are foreseen in the life cycle of the materiel, use the following to confirm the need for thismethod and to place it in sequence with other methods.
2.1.1 Effects of acceleration.
Acceleration results in loads on mounting hardware and internal loads within materiel. Note that all elements of themateriel are loaded, including fluids. The following is a partial list of detrimental effects from high levels ofacceleration. Expectation that any of these may occur will confirm the need to test for this occurrence.
a. Structural deflections that interfere with materiel operation.
b. Permanent deformation and fractures that disable or destroy materiel.
c. Broken fasteners and supports that result in loose parts within materiel.
d. Broken mounting hardware that results in loose materiel within a platform.
e. Electronic circuit boards that short out and circuits that open up.
f. Inductances and capacitances that change value.
g. Relays that open or close.
h. Actuators and other mechanisms that bind.
i. Seals that leak.
j. Pressure and flow regulators that change value.
k. Pumps that cavitate.
l. Spools in servo valves that are displaced causing erratic and dangerous control system response.
2.1.2 Sequence among other methods.
a. General. See Part One, paragraph 5.5.
b. Unique to this method. Conduct the high temperature test (method 501.4) prior to acceleration.
2.2 Selecting a Procedure.
This method includes three test procedures.
a. Procedure I – Structural Test.
b. Procedure II – Operational Test.
c. Procedure III – Crash Safety Test.
2.2.1 Procedure selection considerations.
Subject materiel to be tested to both Procedure I and Procedure II tests unless otherwise specified. Subject mannedaircraft materiel that is located in occupied areas or in ingress and egress routes to Procedure III.
Downloaded from http://www.everyspec.com on 2012-06-04T5:34:26.
MIL-STD-810F1 January 2000
METHOD 513.5513.5-3
2.2.2 Difference among procedures.
2.2.1.1 Procedure I - Structural Test.
Procedure I is used to demonstrate that materiel will structurally withstand the loads induced by in-serviceaccelerations.
2.2.1.2 Procedure II - Operational Test.
Procedure II is used to demonstrate that materiel will operate without degradation during and after being subjected toloads induced by in-service acceleration.
2.2.1.3 Procedure III – Crash Safety Test.
Procedure III is used to demonstrate that materiel will not disintegrate or be torn loose from its mounts by crashaccelerations.
2.3 Determine Test Levels and Conditions.
The tests vary in acceleration level, axis of acceleration, duration, test apparatus, and on/off state of test item. Obtainacceleration values for individual materiel items from the platform structural loads analyses. When the applicableplatform is unknown, the values of tables 513.5-I, 513.5-II, and 513.5-III and the following paragraphs may be usedas preliminary test criteria pending definition of actual installation criteria.
2.3.1 Test axes.
For the purpose of these tests, the direction of forward acceleration is always considered to be the direction offorward acceleration of the platform. The test item is tested in each direction along three mutually perpendicularaxes for each test procedure. One axis is aligned with the forward acceleration of the platform (fore and aft, X), oneaxis is aligned with the spanwise direction of the platform (lateral, Y), and the third axis is perpendicular to the planeof the other two axes (up and down, Z). Figure 513.5-1 shows the three linear and three rotation axes as typicallydefined for vehicle acceleration.
2.3.2 Test levels and conditions - general.
Tables 513.5-I, 513.5-II, and 513.5-III list test levels for Procedure I (Structural Test), Procedure II (OperationalTest), and Procedure III (Crash Safety Test), respectively. When the orientation of the materiel item relative to theoperational platform is unknown, the highest pertinent level listed in a table applies to all test axes.
2.3.3 Test levels and conditions - fighter and attack aircraft.
The test levels as determined from tables 513.5-I and 513.5-II are based on accelerations at the center of gravity(CG) of the platform. For fighter and attack aircraft, the test levels, must be increased for materiel that is locatedaway from the vehicle CG to account for loads induced by roll, pitch, and yaw during maneuvers. When criteria aredeveloped for specific aircraft, maneuver cases are considered and the resulting additional angular accelerations mayadd or subtract effects from the linear acceleration effects. When the following relationships (a-f) are used, it mustbe assumed that the load factors always add. Thus absolute values are used in the equations. Add the load factorsderived below to the Operational Test (Procedure II) levels of table 513.5-II. Multiply the load factors derivedbelow by 1.5 and add to the Structural Test (Procedure I) levels of table 513.5-I. Do not add these values to theCrash Safety Test (Procedure III) levels of table 513.5-III.
a. Roll maneuver, up and down test direction. The additional load factor ('NZ) induced by roll, is computedas follows:
'NZ = (z/g) (d I/d t)2 + (y/g) d 2I/d t2
Downloaded from http://www.everyspec.com on 2012-06-04T5:34:26.
MIL-STD-810F1 January 2000
METHOD 513.5513.5-4
b. Roll maneuver, lateral left and lateral right directions. The additional load factor ('NY) induced by roll,is computed as follows:
'NY = (y/g) (d I/d t)2 + (z/g) d 2I/d t2
c. Pitch maneuver, up and down test directions. The additional load factor ('NZ) induced by pitch change,is computed as follows:
'NZ = (z/g) (d T/d t)2 + (x/g) d 2T/d t2
d. Pitch maneuver, fore and aft test directions. The additional load factor ('NX) induced by pitch change, iscomputed as follows:
'NX = (x/g) (d T/d t)2 + (z/g) d 2Td t2
e. Yaw maneuver, lateral left and right test directions. The additional load factor ('NY) induced by yaw, iscomputed as follows:
'NY = (y/g) (d \/d t)2 + (x/g) d 2\/d t2
f. Yaw maneuver, fore and aft test directions. The additional load factor ('NX) induced by yaw change, iscomputed as follows:
'Nx = (x/g) (d \/d t)2 + (y/g) d 2\/d t2
Where:x = fore and aft distance of materiel from the aircraft CG, m (in)y = lateral distance of materiel from the aircraft CG, m (in)z = vertical distance of materiel from the aircraft CG, m (in)g = acceleration of gravity, 9.81 m/sec2 (386 in/sec2)I = angle of rotation about the X axis (roll), radd I/d t = maximum roll velocity in rad/sec (if unknown use 5 rad/sec)d 2I/d t2 = maximum roll acceleration in rad/sec2 (if unknown use 20 rad/sec2)T= angle of rotation about the Y axis (pitch), radd T/d t = maximum pitch velocity in rad/sec (if unknown use 2.5 rad/sec)d 2T/d t2 = maximum pitch acceleration in rad/sec2 (if unknown use 5 rad/sec2)\ = angle of rotation about the Z axis (yaw), radd \/d t = maximum yaw velocity in rad/sec (if unknown use 4 rad/sec)d 2\/d t2 = maximum yaw acceleration in rad/sec2 (if unknown use 3 rad/sec2)
2.4 Special Considerations.
a. Sway space measurements. If a piece of materiel is mounted on vibration isolators or shock mounts,perform the tests with the materiel mounted on the isolators/mounts. Measure the deflections of theisolators/mounts while the test item is exposed to the test accelerations. These data are needed toindicate potential interference with adjacent materiel, (i.e., define sway space requirements).
b. Acceleration simulation. Careful assessment of the function and characteristics of the test item has to bemade in selecting the apparatus on which the acceleration tests are to be performed due to the differencesin the manner in which acceleration loads are produced. There are two types of apparatus that arecommonly used: the centrifuge and a track/rocket-powered-sled combination.
c. Centrifuge. The centrifuge generates acceleration loads by rotation about a fixed axis. The direction ofacceleration is always radially toward the center of rotation of the centrifuge, whereas the direction of theload induced by acceleration is always radially away from the axis of rotation. When mounted directlyon the test arm, the test item experiences both rotational and translational motion. The direction of theacceleration and the load induced is constant with respect to the test item for a given rotational speed, but
Downloaded from http://www.everyspec.com on 2012-06-04T5:34:26.

MIL-STD-810F1 January 2000
METHOD 513.5513.5-5
the test item rotates 360 degrees for each revolution of the arm. Certain centrifuges have counter-rotatingfixtures mounted on the test arm to correct for rotation of the test item. With this arrangement, the testitem maintains a fixed direction with respect to space, but the direction of the acceleration and theinduced load rotates 360 degrees around the test item for each revolution of the arm. Anothercharacteristic is that the acceleration and induced load are in direct proportion to the distance from thecenter of rotation. This necessitates the selection of a centrifuge of adequate size so that the portions ofthe test item nearest to and furthest from the center of rotation are subjected to not less than 90 percent ormore than 110 percent, respectively, of the specified test level.
d. Track/rocket-powered-sled. The track/rocket-powered sled test arrangement generates linearacceleration in the direction of the sled acceleration. The test item mounted on the sled is uniformlysubjected to the same acceleration level that the sled experiences. The acceleration test level and thetime duration at the test level is dependent upon the length of the track, the power of the rocket, and therocket charge. The sled track generally will produce a significant vibration environment due to trackroughness. Typically this vibration is significantly more severe than the normal in-service useenvironment. Careful attention to the attachment design may be needed to isolate the test item from thisvibration environment. In performing Procedure II tests, the support equipment necessary to operate thetest item is mounted on the sled and traverses the track with the test item. This requires the use of self-contained power units and a remote control system to operate the test item while traversing the track.Telemetering or ruggedized instrumentation is required to measure the performance of the test item whileit is exposed to the test load.
Downloaded from http://www.everyspec.com on 2012-06-04T5:34:26.
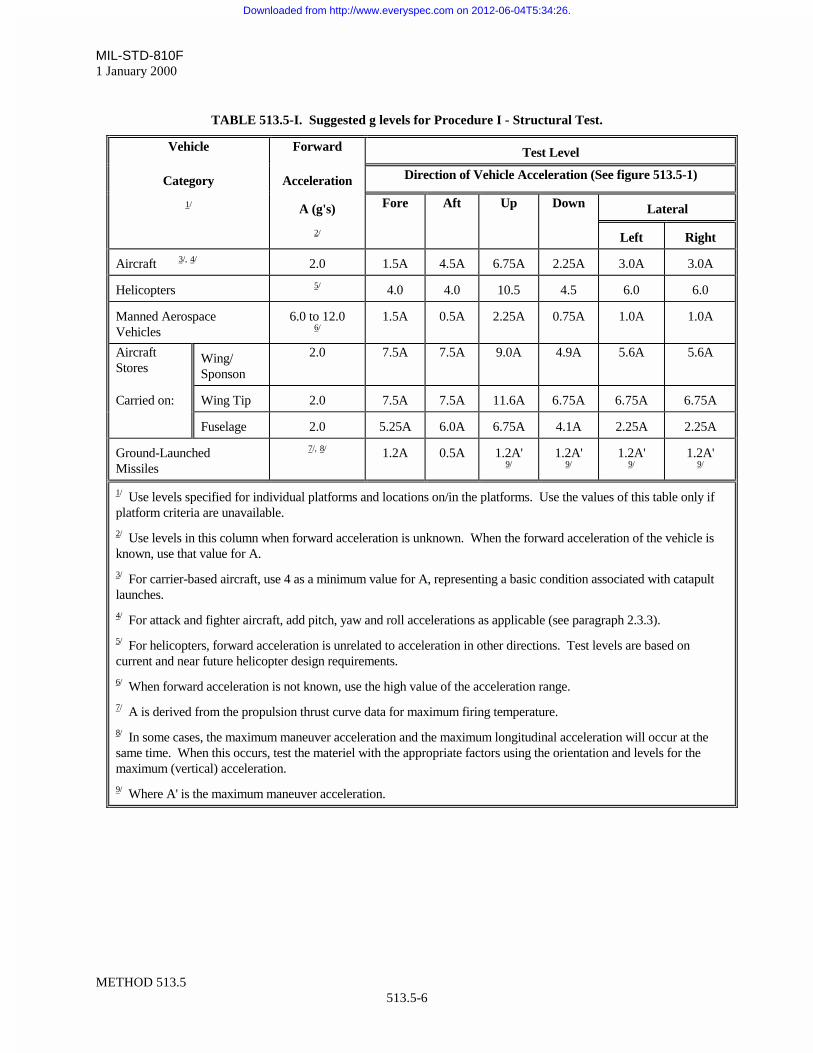
MIL-STD-810F1 January 2000
METHOD 513.5513.5-6
TABLE 513.5-I. Suggested g levels for Procedure I - Structural Test.
Vehicle Forward Test Level
Category Acceleration Direction of Vehicle Acceleration (See figure 513.5-1)
1/ A (g's) Fore Aft Up Down Lateral
2/ Left Right
Aircraft 3/, 4/ 2.0 1.5A 4.5A 6.75A 2.25A 3.0A 3.0A
Helicopters 5/ 4.0 4.0 10.5 4.5 6.0 6.0
Manned AerospaceVehicles
6.0 to 12.06/
1.5A 0.5A 2.25A 0.75A 1.0A 1.0A
AircraftStores
Wing/Sponson
2.0 7.5A 7.5A 9.0A 4.9A 5.6A 5.6A
Carried on: Wing Tip 2.0 7.5A 7.5A 11.6A 6.75A 6.75A 6.75A
Fuselage 2.0 5.25A 6.0A 6.75A 4.1A 2.25A 2.25A
Ground-LaunchedMissiles
7/, 8/ 1.2A 0.5A 1.2A'9/
1.2A'9/
1.2A'9/
1.2A'9/
1/ Use levels specified for individual platforms and locations on/in the platforms. Use the values of this table only ifplatform criteria are unavailable.
2/ Use levels in this column when forward acceleration is unknown. When the forward acceleration of the vehicle isknown, use that value for A.
3/ For carrier-based aircraft, use 4 as a minimum value for A, representing a basic condition associated with catapultlaunches.
4/ For attack and fighter aircraft, add pitch, yaw and roll accelerations as applicable (see paragraph 2.3.3).
5/ For helicopters, forward acceleration is unrelated to acceleration in other directions. Test levels are based oncurrent and near future helicopter design requirements.
6/ When forward acceleration is not known, use the high value of the acceleration range.
7/ A is derived from the propulsion thrust curve data for maximum firing temperature.
8/ In some cases, the maximum maneuver acceleration and the maximum longitudinal acceleration will occur at thesame time. When this occurs, test the materiel with the appropriate factors using the orientation and levels for themaximum (vertical) acceleration.
9/ Where A' is the maximum maneuver acceleration.
Downloaded from http://www.everyspec.com on 2012-06-04T5:34:26.
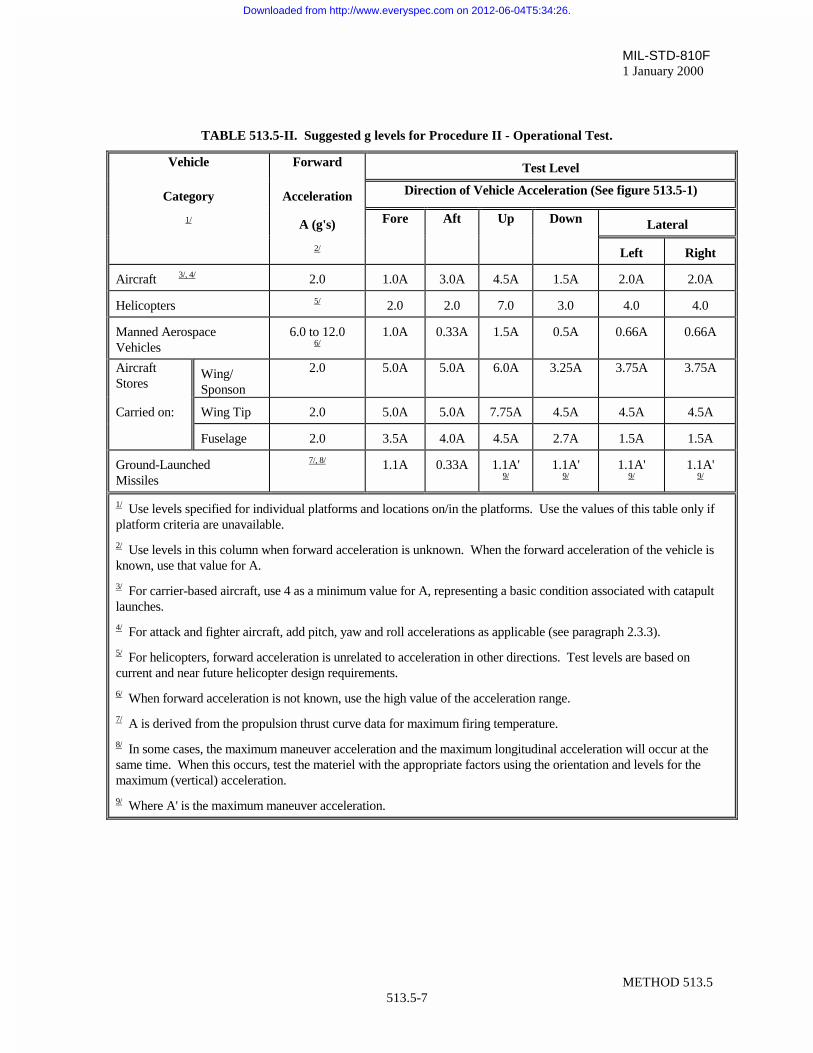
MIL-STD-810F1 January 2000
METHOD 513.5513.5-7
TABLE 513.5-II. Suggested g levels for Procedure II - Operational Test.
Vehicle Forward Test Level
Category Acceleration Direction of Vehicle Acceleration (See figure 513.5-1)
1/ A (g's) Fore Aft Up Down Lateral
2/ Left Right
Aircraft 3/, 4/ 2.0 1.0A 3.0A 4.5A 1.5A 2.0A 2.0A
Helicopters 5/ 2.0 2.0 7.0 3.0 4.0 4.0
Manned AerospaceVehicles
6.0 to 12.06/
1.0A 0.33A 1.5A 0.5A 0.66A 0.66A
AircraftStores
Wing/Sponson
2.0 5.0A 5.0A 6.0A 3.25A 3.75A 3.75A
Carried on: Wing Tip 2.0 5.0A 5.0A 7.75A 4.5A 4.5A 4.5A
Fuselage 2.0 3.5A 4.0A 4.5A 2.7A 1.5A 1.5A
Ground-LaunchedMissiles
7/, 8/ 1.1A 0.33A 1.1A'9/
1.1A'9/
1.1A'9/
1.1A'9/
1/ Use levels specified for individual platforms and locations on/in the platforms. Use the values of this table only ifplatform criteria are unavailable.
2/ Use levels in this column when forward acceleration is unknown. When the forward acceleration of the vehicle isknown, use that value for A.
3/ For carrier-based aircraft, use 4 as a minimum value for A, representing a basic condition associated with catapultlaunches.
4/ For attack and fighter aircraft, add pitch, yaw and roll accelerations as applicable (see paragraph 2.3.3).
5/ For helicopters, forward acceleration is unrelated to acceleration in other directions. Test levels are based oncurrent and near future helicopter design requirements.
6/ When forward acceleration is not known, use the high value of the acceleration range.
7/ A is derived from the propulsion thrust curve data for maximum firing temperature.
8/ In some cases, the maximum maneuver acceleration and the maximum longitudinal acceleration will occur at thesame time. When this occurs, test the materiel with the appropriate factors using the orientation and levels for themaximum (vertical) acceleration.
9/ Where A' is the maximum maneuver acceleration.
Downloaded from http://www.everyspec.com on 2012-06-04T5:34:26.
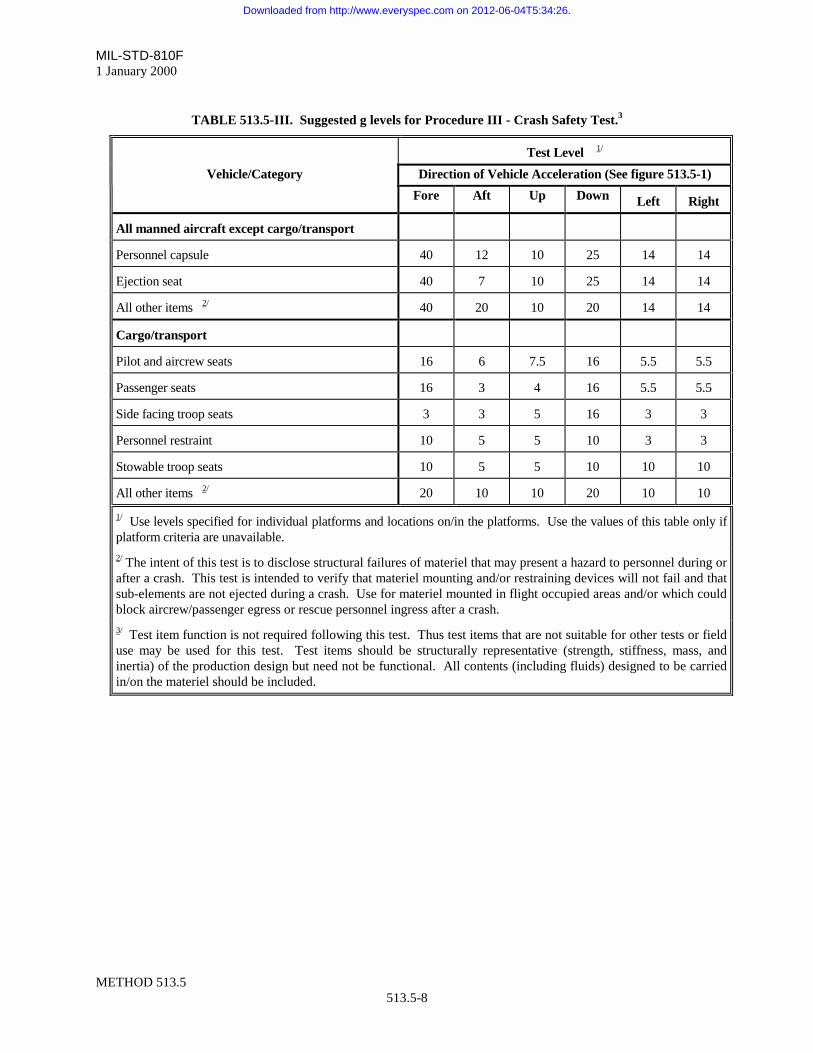
MIL-STD-810F1 January 2000
METHOD 513.5513.5-8
TABLE 513.5-III. Suggested g levels for Procedure III - Crash Safety Test.3
Test Level 1/
Vehicle/Category Direction of Vehicle Acceleration (See figure 513.5-1)
Fore Aft Up Down Left Right
All manned aircraft except cargo/transport
Personnel capsule 40 12 10 25 14 14
Ejection seat 40 7 10 25 14 14
All other items 2/ 40 20 10 20 14 14
Cargo/transport
Pilot and aircrew seats 16 6 7.5 16 5.5 5.5
Passenger seats 16 3 4 16 5.5 5.5
Side facing troop seats 3 3 5 16 3 3
Personnel restraint 10 5 5 10 3 3
Stowable troop seats 10 5 5 10 10 10
All other items 2/ 20 10 10 20 10 10
1/ Use levels specified for individual platforms and locations on/in the platforms. Use the values of this table only ifplatform criteria are unavailable.
2/ The intent of this test is to disclose structural failures of materiel that may present a hazard to personnel during orafter a crash. This test is intended to verify that materiel mounting and/or restraining devices will not fail and thatsub-elements are not ejected during a crash. Use for materiel mounted in flight occupied areas and/or which couldblock aircrew/passenger egress or rescue personnel ingress after a crash.
3/ Test item function is not required following this test. Thus test items that are not suitable for other tests or fielduse may be used for this test. Test items should be structurally representative (strength, stiffness, mass, andinertia) of the production design but need not be functional. All contents (including fluids) designed to be carriedin/on the materiel should be included.
Downloaded from http://www.everyspec.com on 2012-06-04T5:34:26.
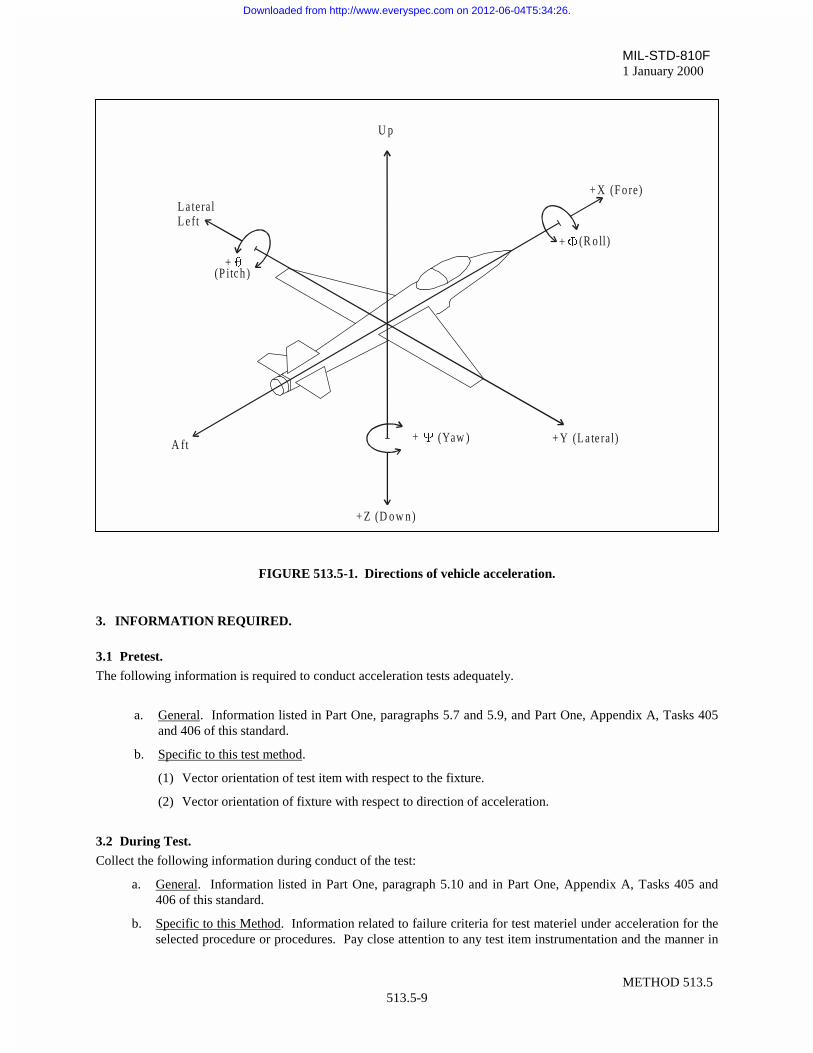
MIL-STD-810F1 January 2000
METHOD 513.5513.5-9
FIGURE 513.5-1. Directions of vehicle acceleration.
3. INFORMATION REQUIRED.
3.1 Pretest.
The following information is required to conduct acceleration tests adequately.
a. General. Information listed in Part One, paragraphs 5.7 and 5.9, and Part One, Appendix A, Tasks 405and 406 of this standard.
b. Specific to this test method.
(1) Vector orientation of test item with respect to the fixture.
(2) Vector orientation of fixture with respect to direction of acceleration.
3.2 During Test.
Collect the following information during conduct of the test:
a. General. Information listed in Part One, paragraph 5.10 and in Part One, Appendix A, Tasks 405 and406 of this standard.
b. Specific to this Method. Information related to failure criteria for test materiel under acceleration for theselected procedure or procedures. Pay close attention to any test item instrumentation and the manner in
U p
L a teralL e ft
(P itch )
+ X (F o re)
(R o ll)
A ft
+ Z (D o w n )
< + Y (L a te ral)
+
+
+ (Yaw )
T
)
Downloaded from http://www.everyspec.com on 2012-06-04T5:34:26.
MIL-STD-810F1 January 2000
METHOD 513.5513.5-10
which the information is received from the sensors. For example, the acquisition of sensor signals from atest item on a centrifuge must consider either the way of bringing the sensor signals out through thecentrifuge, a way of telemetering the sensor signals, or the effects of the acceleration on a recordermounted on the centrifuge near the sensor for obtaining the sensor signals.
3.3 Post-test.
a. General. Information listed in Part One, paragraph 5.13 and in Part One, Appendix A, Tasks 405 and406 of this standard.
b. Specific to this method.
(1) Vector orientation of test item with respect to the fixture.
(2) Vector orientation of fixture with respect to direction of acceleration.
4. TEST PROCESS.
4.1 Test Facility.
The required apparatus consists of either a centrifuge of adequate size or a track/rocket-powered-sled testarrangement. Recommend a centrifuge for all Procedure I (Structural Test), Procedure III (Crash Safety Test), andmost of Procedure II (Operational Test) evaluations. Use a track/rocket-powered-sled test arrangement forProcedure II evaluations when strictly linear accelerations are required. In general, acceleration tests will not beinstrumented. If there is need for test apparatus or test fixture/test item instrumentation, follow practices andprocedures outlined in reference b. Verification of the correct input acceleration to the test item will be according toprocedures established at the test facility.
4.2 Controls.
4.2.1 Calibration. Ensure any acceleration measurement for test verification have been made by instrumentationproperly calibrated to the amplitude and frequency ranges of measurement.
4.2.2 Tolerances. Maintain the acceleration level between 90 per cent and 110 percent of the specified level overthe full dimensions of the test item.
4.3 Test Interruption.
a. General. See Part One, paragraph 5.11, of this standard.
b. Specific to this method.
(1) If an unscheduled interruption occurs while the test item is at a specified test level, restart and runthe complete test. If interruptions result in several new starts, evaluate the test item for fatiguedamage. (Each application of acceleration is a single loading cycle. Duration of a loading cycledoes not influence the severity of the test.)
(2) If the test item is subjected to acceleration loads in excess of the level specified for the test, stop thetest, inspect the test item and perform a functional test. Based on the inspection and functional test,make an engineering decision as to whether to resume testing with the same test item or with a newtest item.
Downloaded from http://www.everyspec.com on 2012-06-04T5:34:26.
MIL-STD-810F1 January 2000
METHOD 513.5513.5-11
4.4 Test Execution.
4.4.1 Preparation for test.
4.4.1.1 Inspections.
All items require a pretest standard ambient checkout to provide baseline data and additional inspections andperformance checks during and after tests. Conduct inspections as follows:
Step 1. Examine the test item for physical defects, etc.Step 2. Prepare the test item for test, in its operating configuration if required, as specified in the test plan.Step 3. Obtain sufficient dimensional measurements of the test item to provide a reference guide for the
evaluation of physical damage that may be induced during the tests.Step 4. Examine the test item/fixture/centrifuge/sled combination for compliance with the test item and test
plan requirements.Step 5. If applicable, conduct an operational checkout in accordance with the test plan and document the
results.Step 6. Document the results.
4.4.1.2 Mounting of the test item.
Configure the test item for service application. Mount the test item on the test apparatus using the hardware that isnormally used to mount the materiel in its service installation.
a. Centrifuge mounting.
Step 1. Determine the location for the test item by measurement from the center of rotation of the centrifugeto the location on the centrifuge arm that will provide the g level established for the test. Mount thetest item so that its geometric center is at the location on the arm determined for the test load factor(g level). Calculate test levels as follows:
NT = K r n2
Where: NT = test load factor (load factor normal to the centrifuge plane of rotation)K = 1.118 x 10⁻³, r in meters (K = 2.480 x 10⁻⁵, r in inches)r = radial distance in meters, (inches) from the center of rotation to the mounting location
on centrifuge armn = angular velocity of centrifuge arm in revolutions per minute (rpm)
Step 2. Orient the test item on the centrifuge for the six test direction conventions as follows:
(a) Fore. Front or forward end of test item facing toward center of centrifuge.
(b) Aft. Reverse the test item 180 degrees from fore position.
(c) Up. Top of test item facing toward center of centrifuge.
(d) Down. Reverse item 180 degrees from up position.
(e) Lateral left. Left side of test item facing toward center of centrifuge.
(f) Lateral right. Right side of test item facing toward center of centrifuge.
Step 3. After the test item is properly oriented and mounted on the centrifuge, make measurements andcalculations to ensure the end of the test item nearest to the center of the centrifuge will be subjectedto no less than 90 percent of the g level established for the test. If the g level is found to be less than90 percent of the established g level, either mount the test item further out on the centrifuge arm andadjust the rotational speed accordingly, or use a larger centrifuge to ensure the end of the test itemnearest to the center of the centrifuge is subjected to at least 90 percent of the established g level.However, do not subject the opposite end of the test item (the end farthest from the center of thecentrifuge) to over 110 percent of the established g level. For large test items, consider exceptions
Downloaded from http://www.everyspec.com on 2012-06-04T5:34:26.
MIL-STD-810F1 January 2000
METHOD 513.5513.5-12
for load gradients based on the existing availability of large centrifuges in commercial or governmenttest facilities.
b. Track/rocket-powered-sled mounting. For track/rocket-powered-sled mounting, mount the test item andassociated test fixture or apparatus on the sled platform in accordance with the controlled accelerationdirection of the sled. (Ensure the test fixture or apparatus has been designed to isolate sled vibrationsfrom the test item.) Since the sled and test item experience the same g levels, only the orientation of thetest item on the sled is critical. Orient the test item on the sled according to the acceleration directionsshown on figure 513.5-1 and the controlled acceleration direction of the sled for the six test directions.
4.4.2 Procedure I - Structural Test.
Step 1. Install the test item and place it in its operational mode and orientation as in paragraph 4.4.1.2.Step 2. Bring the centrifuge to the speed required to induce the specified g level in the test item as
determined from paragraph 2.3 and table 513.5-I for the particular test item orientation. Maintainthis g level for at least one minute after the centrifuge rpm has stabilized.
Step 3. Functionally test and inspect the test item as specified in paragraph 4.4.1.1.Step 4. Repeat this test procedure for the remaining five test directions noted in paragraph 4.4.1.2.a, Step 2.Step 5. Upon completing the tests in the six test directions, functionally test and inspect the test item as
specified in paragraph 4.4.1.1.
4.4.3 Procedure II - Operational Test.
4.4.3.1 Centrifuge.
Step 1. Install the test item and place it in its operational mode and orientation as in paragraph 4.4.1.2.Step 2. Functionally test and inspect the test item as specified in paragraph 4.4.1.1.Step 3. With the test item operating, bring the centrifuge to the speed required to induce specified g level in
the test item as determined from paragraph 2.3 and table 513.5-II for the particular test itemorientation. Maintain this g level for at least one minute after the centrifuge rpm has stabilized.Conduct a performance check and document the results.
Step 4. Stop the centrifuge and inspect the test item as specified in paragraph 4.4.1.1.Step 5. Repeat Steps 1-3 for the five remaining orientations noted in paragraph 4.4.1.2.a, Step 2.Step 6. Upon completing the tests in the six test directions, functionally check and inspect the test item
according to paragraph 4.4.1.1.
4.4.3.2 Track/rocket-powered-sled.
Step 1. Install the test item and place it in its operational mode and orientation as in paragraph 4.4.1.2.Step 2. Functionally test and inspect the test item as specified in paragraph 4.4.1.1.Step 3. With the test item operating, accelerate the sled to the level required to induce the specified g level
in the test item as determined from paragraph 2.3 and table 513.5-II for the particular test itemorientation. Conduct a performance check while the test item is subjected to the specified g level.Document the results.
Step 4. Evaluate test run parameters and determine if the required test accelerations were achieved. Repeatthe test run as necessary to demonstrate acceptable performance of the test item while under requiredtest acceleration. Document test run parameters.
Step 5. Repeat this test procedure for the five remaining test directions noted in paragraph 4.4.1.2.a, Step 2.Upon completing the tests in the six test directions, functionally check and inspect the test itemaccording to paragraph 4.4.1.1.
4.4.4 Procedure III - Crash Safety Test.
Step 1. Install the test item and place it in its operational mode and orientation as in paragraph 4.4.1.2.Step 2. Bring the centrifuge to the speed required to induce the specified g level in the test item as
determined from paragraph 2.3 and table 513.5-III for the particular test item orientation. Maintainthis g level for at least one minute after the centrifuge rpm has stabilized.
Downloaded from http://www.everyspec.com on 2012-06-04T5:34:26.
MIL-STD-810F1 January 2000
METHOD 513.5513.5-13
Step 3. Inspect the test item as specified in paragraph 4.4.1.1.Step 4. Repeat this test procedure for the remaining five test directions noted in paragraph 4.4.1.2.a Step 2.Step 5. Upon completing the tests in the six test directions inspect the test item as specified in paragraph
4.4.1.1.
5. ANALYSIS OF RESULTS.
5.1 General.
Refer to the guidance in Part One, paragraphs 5.14 and 517, and to Part One, Annex A, Tasks 405 and 406.
5.2 Specific to this Method.
5.2.1 Structural test.
A test is successful if the test item is undamaged and fully functional at test completion.
5.2.2 Operational test.
A test is successful if the test item is fully functional at test accelerations and is undamaged and fully functional attest completion.
5.2.3 Crash safety test.
A test is successful if the test item remains structurally attached to the mounts and no parts, pieces, or contents aredetached from the item at test completion.
6. REFERENCE/RELATED DOCUMENTS.
a. Junker, V.J., The Evolution of USAF Environmental Testing. October 1965; AFFDL TR 65-197; DTICNo. AD 625543.
b. Handbook for Dynamic Data Acquisition and Analysis, IES-RP-DTE012.1, Institute of EnvironmentalSciences, 940 East Northwest Highway, Mount Prospect, Illinois 60056.
Downloaded from http://www.everyspec.com on 2012-06-04T5:34:26.

MIL-STD-810F1 January 2000
METHOD 513.5513.5-14
THIS PAGE INTENTIONALLY BLANK
Downloaded from http://www.everyspec.com on 2012-06-04T5:34:26.
MIL-STD-810F1 January 2000
METHOD 514.5514.5-i
METHOD 514.5
VIBRATION
CONTENTSParagraph Page
1. SCOPE.......................................................................................................................................... 1
1.1 Purpose. ........................................................................................................................................ 11.2 Application. .................................................................................................................................... 11.3 Limitations. .................................................................................................................................... 2
2. TAILORING GUIDANCE............................................................................................................... 2
2.1 Selecting the Method..................................................................................................................... 22.1.1 Effects of environment. ................................................................................................................. 32.1.2 Sequence. ..................................................................................................................................... 32.2 Selecting Procedures. ................................................................................................................... 42.2.1 Procedure selection considerations. ............................................................................................. 42.2.2 Difference among procedures....................................................................................................... 42.3 Determine Test Levels and Conditions. ........................................................................................ 52.3.1 Climatic conditions. ....................................................................................................................... 52.3.2 Test item configuration.................................................................................................................. 72.4 Test Item Operation. ..................................................................................................................... 7
3. INFORMATION REQUIRED......................................................................................................... 7
3.1 Pretest. .......................................................................................................................................... 73.2 During Test.................................................................................................................................... 83.3 Post-Test. ...................................................................................................................................... 8
4. TEST PROCESS........................................................................................................................... 8
4.1 Test Facility. .................................................................................................................................. 84.1.1 Procedure I - General vibration. .................................................................................................... 94.1.2 Procedure II - Loose cargo transportation..................................................................................... 94.1.3 Procedure III - Large assembly transportation. ............................................................................. 94.1.4 Procedure IV - Assembled aircraft store captive carriage and free flight. .................................... 94.2 Controls. ........................................................................................................................................ 94.2.1 Control strategy. .......................................................................................................................... 104.2.1.1 Acceleration input control strategy. ............................................................................................. 104.2.1.2 Force control strategy.................................................................................................................. 104.2.1.3 Acceleration limit strategy. .......................................................................................................... 104.2.1.4 Acceleration response control strategy. ...................................................................................... 104.2.1.5 Open loop waveform control strategy.......................................................................................... 104.2.2 Tolerances................................................................................................................................... 114.2.2.1 Acceleration spectral density....................................................................................................... 114.2.2.2 Peak sinusoidal acceleration....................................................................................................... 114.2.2.3 Frequency measurement. ........................................................................................................... 114.2.2.4 Cross axis accelerations. ............................................................................................................ 12
Downloaded from http://www.everyspec.com on 2012-06-04T5:34:26.
MIL-STD-810F1 January 2000
METHOD 514.5
514.5-ii
CONTENTS - Continued
Paragraph Page
4.3 Test Interruption. ......................................................................................................................... 124.4 Test Setup. .................................................................................................................................. 124.4.1 Procedure I - General vibration. .................................................................................................. 124.4.2 Procedure II - Loose cargo transportation................................................................................... 124.4.3 Procedure III - Large assembly transportation. ........................................................................... 134.4.4 Procedure IV - Assembled aircraft store captive carriage and free flight. .................................. 144.5 Test Execution............................................................................................................................. 154.5.1 Preparation for test...................................................................................................................... 154.5.1.1 Preliminary steps......................................................................................................................... 154.5.1.2 Pretest standard ambient checkout............................................................................................. 154.5.2 Procedure I - General vibration. .................................................................................................. 164.5.3 Procedure II - Loose cargo transportation................................................................................... 174.5.4 Procedure III - Large assembly transportation. ........................................................................... 174.5.5 Procedure IV - Assembled aircraft store captive carriage and free flight. .................................. 17
5. ANALYSIS OF RESULTS........................................................................................................... 19
5.1 Physics of failure. ........................................................................................................................ 195.2 Qualification tests. ....................................................................................................................... 205.3 Other tests................................................................................................................................... 20
6. REFERENCE/RELATED DOCUMENTS.................................................................................... 20
TABLE
TABLE 514-I. Vibration environment categories.......................................................................................... 6
ANNEX A. TAILORING GUIDANCE FOR VIBRATION EXPOSURE DEFINITION
1. SCOPE.......................................................................................................................................... 1
1.1 Purpose. ....................................................................................................................................... 11.2 Application. ................................................................................................................................... 1
2. VIBRATION ENVIRONMENTS..................................................................................................... 1
2.1 Manufacture/Maintenance............................................................................................................. 12.1.1 Category 1 - Manufacturing/Maintenance processes.................................................................... 12.1.2 Category 2 - Shipping and handling. ............................................................................................. 22.1.3 Category 3 - Environmental Stress Screen (ESS). ....................................................................... 22.2 Transportation. .............................................................................................................................. 22.2.1 Category 4 - Truck/trailer/tracked - restrained cargo. ................................................................... 32.2.2 Category 5 - Truck/trailer/tracked - loose cargo............................................................................ 42.2.3 Category 6 - Truck/trailer/tracked - large assembly cargo. ........................................................... 42.2.4 Category 7 - Aircraft - jet. .............................................................................................................. 52.2.5 Category 8 - Aircraft - propeller. .................................................................................................... 52.2.6 Category 9 - Aircraft - helicopter. .................................................................................................. 62.2.7 Category 10 - Ship - surface ship.................................................................................................. 6
Downloaded from http://www.everyspec.com on 2012-06-04T5:34:26.
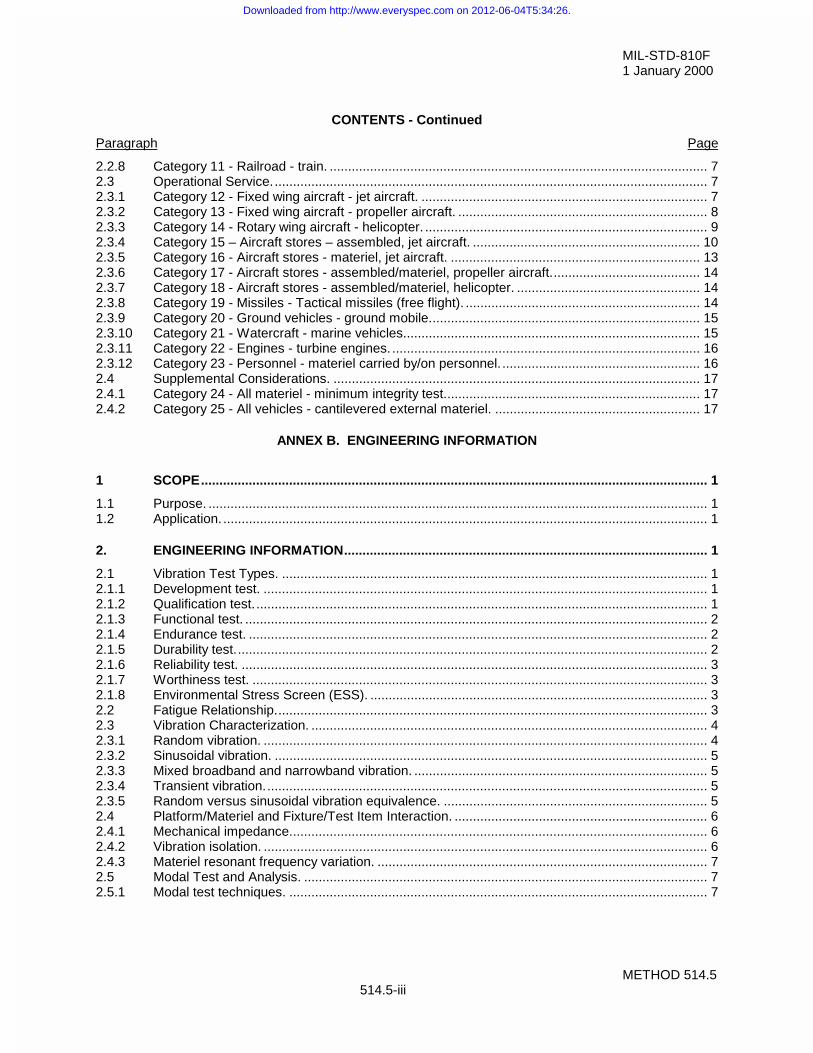
MIL-STD-810F1 January 2000
METHOD 514.5514.5-iii
CONTENTS - Continued
Paragraph Page
2.2.8 Category 11 - Railroad - train. ....................................................................................................... 72.3 Operational Service....................................................................................................................... 72.3.1 Category 12 - Fixed wing aircraft - jet aircraft. .............................................................................. 72.3.2 Category 13 - Fixed wing aircraft - propeller aircraft. .................................................................... 82.3.3 Category 14 - Rotary wing aircraft - helicopter. ............................................................................. 92.3.4 Category 15 – Aircraft stores – assembled, jet aircraft. .............................................................. 102.3.5 Category 16 - Aircraft stores - materiel, jet aircraft. .................................................................... 132.3.6 Category 17 - Aircraft stores - assembled/materiel, propeller aircraft......................................... 142.3.7 Category 18 - Aircraft stores - assembled/materiel, helicopter. .................................................. 142.3.8 Category 19 - Missiles - Tactical missiles (free flight). ................................................................ 142.3.9 Category 20 - Ground vehicles - ground mobile.......................................................................... 152.3.10 Category 21 - Watercraft - marine vehicles................................................................................. 152.3.11 Category 22 - Engines - turbine engines. .................................................................................... 162.3.12 Category 23 - Personnel - materiel carried by/on personnel. ...................................................... 162.4 Supplemental Considerations. .................................................................................................... 172.4.1 Category 24 - All materiel - minimum integrity test...................................................................... 172.4.2 Category 25 - All vehicles - cantilevered external materiel. ........................................................ 17
ANNEX B. ENGINEERING INFORMATION
1 SCOPE.......................................................................................................................................... 1
1.1 Purpose. ........................................................................................................................................ 11.2 Application. .................................................................................................................................... 1
2. ENGINEERING INFORMATION................................................................................................... 1
2.1 Vibration Test Types. .................................................................................................................... 12.1.1 Development test. ......................................................................................................................... 12.1.2 Qualification test............................................................................................................................ 12.1.3 Functional test. .............................................................................................................................. 22.1.4 Endurance test. ............................................................................................................................. 22.1.5 Durability test................................................................................................................................. 22.1.6 Reliability test. ............................................................................................................................... 32.1.7 Worthiness test. ............................................................................................................................ 32.1.8 Environmental Stress Screen (ESS). ............................................................................................ 32.2 Fatigue Relationship...................................................................................................................... 32.3 Vibration Characterization. ............................................................................................................ 42.3.1 Random vibration. ......................................................................................................................... 42.3.2 Sinusoidal vibration. ...................................................................................................................... 52.3.3 Mixed broadband and narrowband vibration. ................................................................................ 52.3.4 Transient vibration......................................................................................................................... 52.3.5 Random versus sinusoidal vibration equivalence. ........................................................................ 52.4 Platform/Materiel and Fixture/Test Item Interaction. ..................................................................... 62.4.1 Mechanical impedance.................................................................................................................. 62.4.2 Vibration isolation. ......................................................................................................................... 62.4.3 Materiel resonant frequency variation. .......................................................................................... 72.5 Modal Test and Analysis. .............................................................................................................. 72.5.1 Modal test techniques. .................................................................................................................. 7
Downloaded from http://www.everyspec.com on 2012-06-04T5:34:26.
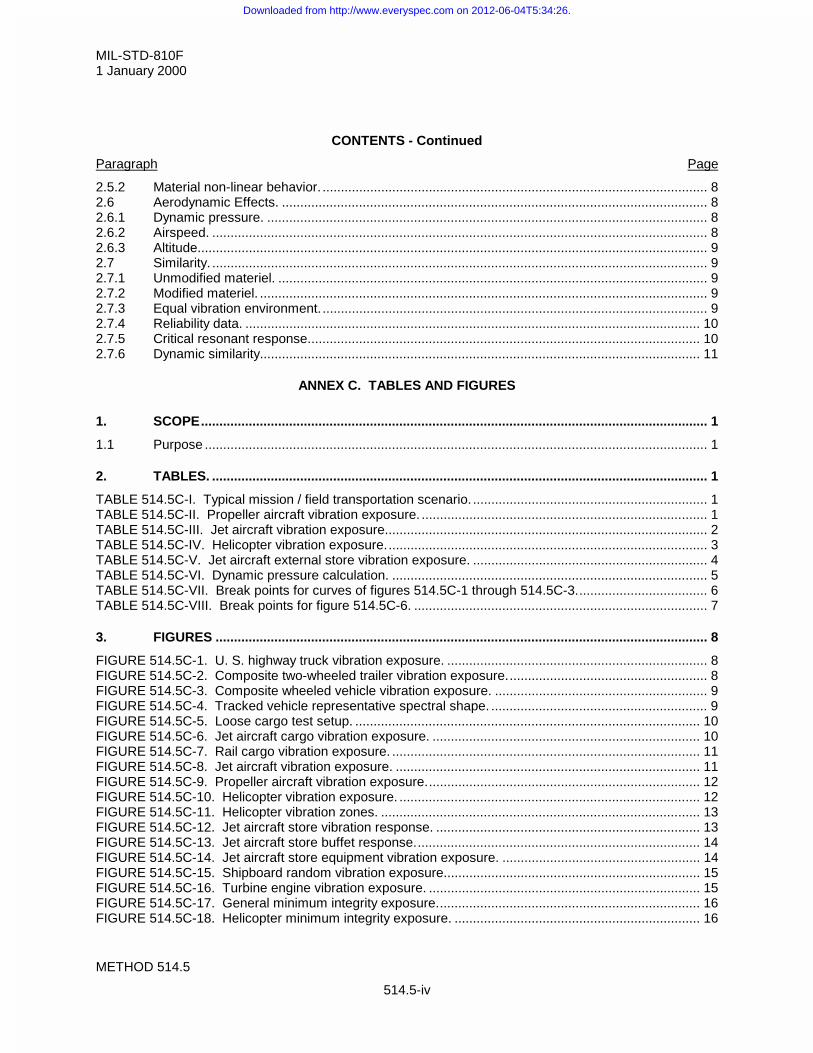
MIL-STD-810F1 January 2000
METHOD 514.5
514.5-iv
CONTENTS - Continued
Paragraph Page
2.5.2 Material non-linear behavior. ......................................................................................................... 82.6 Aerodynamic Effects. .................................................................................................................... 82.6.1 Dynamic pressure. ........................................................................................................................ 82.6.2 Airspeed. ....................................................................................................................................... 82.6.3 Altitude........................................................................................................................................... 92.7 Similarity. ....................................................................................................................................... 92.7.1 Unmodified materiel. ..................................................................................................................... 92.7.2 Modified materiel. .......................................................................................................................... 92.7.3 Equal vibration environment. ......................................................................................................... 92.7.4 Reliability data. ............................................................................................................................ 102.7.5 Critical resonant response........................................................................................................... 102.7.6 Dynamic similarity........................................................................................................................ 11
ANNEX C. TABLES AND FIGURES
1. SCOPE.......................................................................................................................................... 1
1.1 Purpose ......................................................................................................................................... 1
2. TABLES. ....................................................................................................................................... 1
TABLE 514.5C-I. Typical mission / field transportation scenario. ................................................................ 1TABLE 514.5C-II. Propeller aircraft vibration exposure. .............................................................................. 1TABLE 514.5C-III. Jet aircraft vibration exposure........................................................................................ 2TABLE 514.5C-IV. Helicopter vibration exposure........................................................................................ 3TABLE 514.5C-V. Jet aircraft external store vibration exposure. ................................................................ 4TABLE 514.5C-VI. Dynamic pressure calculation. ...................................................................................... 5TABLE 514.5C-VII. Break points for curves of figures 514.5C-1 through 514.5C-3.................................... 6TABLE 514.5C-VIII. Break points for figure 514.5C-6. ................................................................................ 7
3. FIGURES ...................................................................................................................................... 8
FIGURE 514.5C-1. U. S. highway truck vibration exposure. ....................................................................... 8FIGURE 514.5C-2. Composite two-wheeled trailer vibration exposure....................................................... 8FIGURE 514.5C-3. Composite wheeled vehicle vibration exposure. .......................................................... 9FIGURE 514.5C-4. Tracked vehicle representative spectral shape. ........................................................... 9FIGURE 514.5C-5. Loose cargo test setup. .............................................................................................. 10FIGURE 514.5C-6. Jet aircraft cargo vibration exposure. ......................................................................... 10FIGURE 514.5C-7. Rail cargo vibration exposure. .................................................................................... 11FIGURE 514.5C-8. Jet aircraft vibration exposure. ................................................................................... 11FIGURE 514.5C-9. Propeller aircraft vibration exposure........................................................................... 12FIGURE 514.5C-10. Helicopter vibration exposure. .................................................................................. 12FIGURE 514.5C-11. Helicopter vibration zones. ....................................................................................... 13FIGURE 514.5C-12. Jet aircraft store vibration response. ........................................................................ 13FIGURE 514.5C-13. Jet aircraft store buffet response.............................................................................. 14FIGURE 514.5C-14. Jet aircraft store equipment vibration exposure. ...................................................... 14FIGURE 514.5C-15. Shipboard random vibration exposure...................................................................... 15FIGURE 514.5C-16. Turbine engine vibration exposure. .......................................................................... 15FIGURE 514.5C-17. General minimum integrity exposure........................................................................ 16FIGURE 514.5C-18. Helicopter minimum integrity exposure. ................................................................... 16
Downloaded from http://www.everyspec.com on 2012-06-04T5:34:26.
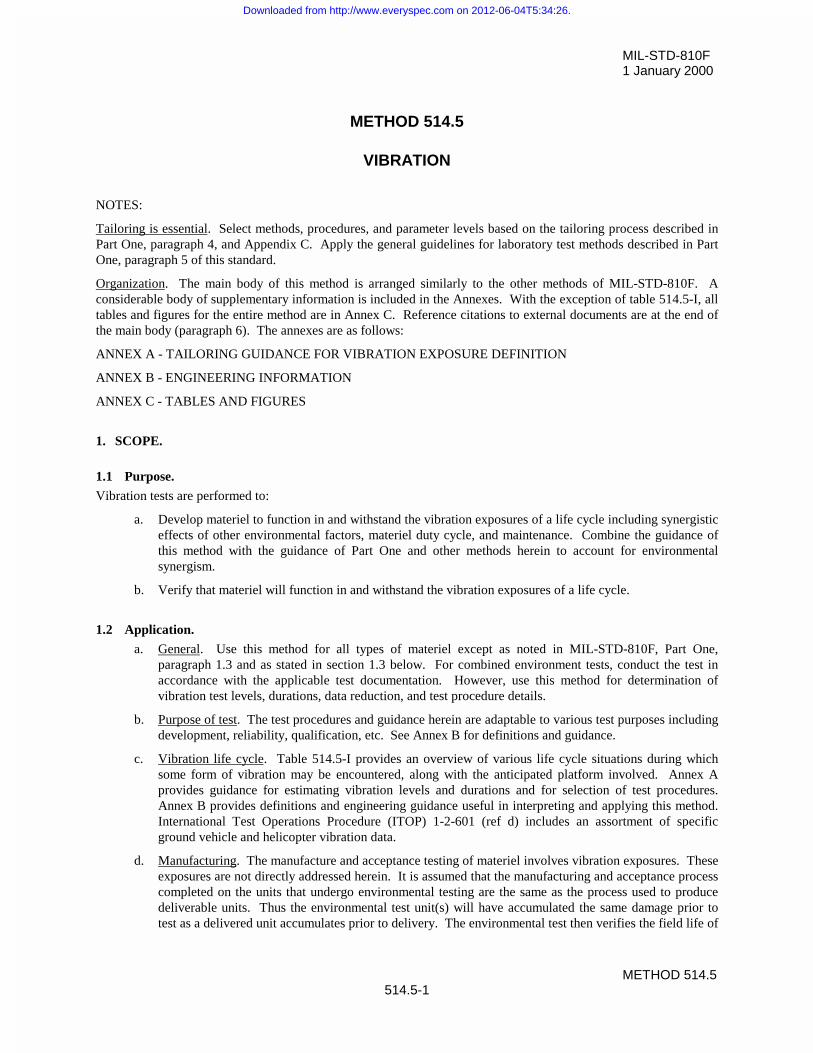
MIL-STD-810F1 January 2000
METHOD 514.5514.5-1
METHOD 514.5
VIBRATION
NOTES:
Tailoring is essential. Select methods, procedures, and parameter levels based on the tailoring process described inPart One, paragraph 4, and Appendix C. Apply the general guidelines for laboratory test methods described in PartOne, paragraph 5 of this standard.
Organization. The main body of this method is arranged similarly to the other methods of MIL-STD-810F. Aconsiderable body of supplementary information is included in the Annexes. With the exception of table 514.5-I, alltables and figures for the entire method are in Annex C. Reference citations to external documents are at the end ofthe main body (paragraph 6). The annexes are as follows:
ANNEX A - TAILORING GUIDANCE FOR VIBRATION EXPOSURE DEFINITION
ANNEX B - ENGINEERING INFORMATION
ANNEX C - TABLES AND FIGURES
1. SCOPE.
1.1 Purpose.
Vibration tests are performed to:
a. Develop materiel to function in and withstand the vibration exposures of a life cycle including synergisticeffects of other environmental factors, materiel duty cycle, and maintenance. Combine the guidance ofthis method with the guidance of Part One and other methods herein to account for environmentalsynergism.
b. Verify that materiel will function in and withstand the vibration exposures of a life cycle.
1.2 Application.
a. General. Use this method for all types of materiel except as noted in MIL-STD-810F, Part One,paragraph 1.3 and as stated in section 1.3 below. For combined environment tests, conduct the test inaccordance with the applicable test documentation. However, use this method for determination ofvibration test levels, durations, data reduction, and test procedure details.
b. Purpose of test. The test procedures and guidance herein are adaptable to various test purposes includingdevelopment, reliability, qualification, etc. See Annex B for definitions and guidance.
c. Vibration life cycle. Table 514.5-I provides an overview of various life cycle situations during whichsome form of vibration may be encountered, along with the anticipated platform involved. Annex Aprovides guidance for estimating vibration levels and durations and for selection of test procedures.Annex B provides definitions and engineering guidance useful in interpreting and applying this method.International Test Operations Procedure (ITOP) 1-2-601 (ref d) includes an assortment of specificground vehicle and helicopter vibration data.
d. Manufacturing. The manufacture and acceptance testing of materiel involves vibration exposures. Theseexposures are not directly addressed herein. It is assumed that the manufacturing and acceptance processcompleted on the units that undergo environmental testing are the same as the process used to producedeliverable units. Thus the environmental test unit(s) will have accumulated the same damage prior totest as a delivered unit accumulates prior to delivery. The environmental test then verifies the field life of
Downloaded from http://www.everyspec.com on 2012-06-04T5:34:26.
MIL-STD-810F1 January 2000
METHOD 514.5
514.5-2
delivered units. When a change is made to the manufacturing process that involves increased vibrationexposure, evaluate this increased vibration exposure to ensure the field life of subsequent units is notshortened. An example might be a pre-production unit completely assembled in one building, whereasproduction units are partially assembled at one site and then transported to another site for finalassembly. Such exposures could be incorporated as pre-conditioning to the test program.
e. Environmental Stress Screen (ESS). Many materiel items are subjected to ESS, burn-in, or otherproduction acceptance test procedures prior to delivery to the government and sometimes duringmaintenance. As in basic production processes, it is assumed that both the test units and the field unitsreceive the same vibration exposures so that environmental test results are valid for the field units.Where units do not necessarily receive the same exposures, such as multiple passes through ESS, applythe maximum allowable exposures to the units used for environmental test as pre-conditioning for theenvironmental tests. (See Annex A, paragraph 2.1.3 and Annex B, paragraph 2.1.8.)
1.3 Limitations.
a. Safety testing. This method may be used to apply specific safety test requirements as coordinated withthe responsible safety organization. However, vibration levels or durations for specific safety relatedissues are not provided or discussed.
b. Platform/materiel interaction. In this method, vibration requirements are generally expressed as inputs tomateriel that is considered to be a rigid body with respect to the vibration exciter (platform, shaker, etc.).While this is often not true, it is an acceptable simplification for smaller materiel items. For largemateriel items, it is necessary to recognize that the materiel and the exciter vibrate as a single flexiblesystem. There is no simple rule to determine the validity of this assumption (see Annex B, paragraph2.4). Further, proper treatment of a given materiel item may vary with platform. An example might be agalley designed for an aircraft. For the operational environment, installation on an operating aircraft,consider the galley structure as aircraft secondary structure, and design and test accordingly. Designsubassemblies within the galley (e.g., coffee maker) for vibration levels based on guidance of Annex Aand tested in accordance with Procedure I. When packaged for shipment, the packaging, galley, andsubassemblies are considered a single materiel item, and tested accordingly. Another example is ashelter transported to the field as a pre-assembled office, laboratory, etc. Consider the shelter as largemateriel and develop accordingly. A suitable test would be the large assembly transport test of paragraph4.4.3. Where impedance mismatch between platform/materiel and laboratory vibration exciter/test itemare significantly different, force control or acceleration limiting control strategies may be required toavoid unrealistically severe vibration response (see paragraph 4.2). Control limits should be based uponfield and laboratory measurements. For sensitive materiel for which over-conservative testingphilosophy must not be applied, force or acceleration limiting control is an option. In certain cases inwhich the field measured response is well defined on a small component, the duration of the vibration isshort, then execution of the laboratory test under open loop waveform control based upon the fieldmeasured data is an option.
c. Manufacture and maintenance. Vibration associated with processes at the manufacturer’s facility, orexperienced during maintenance is not addressed herein. Guidance concerning transportationenvironments may be applicable to transportation elements of manufacture or maintenance processes.
d. Environmental Stress Screen (ESS). No guidance for selection of ESS exposures is contained herein.Some discussion is in Annex A, paragraph 2.1.3.
2. TAILORING GUIDANCE.
2.1 Selecting the Method.
Essentially all materiel will experience vibration, whether during manufacture, transportation, maintenance, oroperational use. The procedures of this method address most of the life cycle situations during which vibration islikely to be experienced. Select the procedure or procedures most appropriate for the materiel to be tested and the
Downloaded from http://www.everyspec.com on 2012-06-04T5:34:26.

MIL-STD-810F1 January 2000
METHOD 514.5514.5-3
environment to be simulated. See table 514.5-I for a general listing of vibration exposures and test procedures asrelated to environmental life cycle elements. See Annex A for guidance on determining vibration levels anddurations.
a. Conservatism in selection of levels. In the past, vibration test criteria often contained added margin toaccount for variables that cannot be included in criteria derivation. These include (among many others)undefined worst case situations, synergism with other environmental factors (temperature, acceleration,etc.), and three-axis orthogonal versus three dimensional vibration. Due to strong pressure towardminimum cost and weight, this margin is often not included. When margin is not included, be aware thatany improvements in weight or cost are purchased with added risk to materiel life and function.
b. Conservatism with measured data. The guidance in this document encourages the use of materiel-specific measured data as the basis for vibration criteria. Due to limitations in numbers of transducers,accessibility of measurement points, linearity of data at extreme conditions, and other causes,measurements do not include all extreme conditions. Further, there are test limitations such as single axisversus multi-axis, and practical fixtures versus platform support. Apply margin to measured data inderiving test criteria to account for these variables. When sufficient measured data are available, usestatistical methods as shown in method 516.5.
c. Conservatism with predicted data. Annex A of this method and other sources such as the MissionEnvironmental Requirements Integration Technology (MERIT) computer program provide informationwhich can be used to generate alternate criteria for those cases where measured data are unavailable.These data are based on envelopes of wide ranges of cases and are conservative for any one case.Additional margin is not recommended.
2.1.1 Effects of environment.
Vibration results in dynamic deflections of and within materiel. These dynamic deflections and associated velocitiesand accelerations may cause or contribute to structural fatigue and mechanical wear of structures, assemblies, andparts. In addition, dynamic deflections may result in impacting of elements and/or disruption of function. Sometypical symptoms of vibration-induced problems follow. This list is not intended to be all-inclusive:
a. Chafed wiring.
b. Loose fasteners/components.
c. Intermittent electrical contacts.
d. Electrical shorts.
e. Deformed seals.
f. Failed components.
g. Optical or mechanical misalignment.
h. Cracked and/or broken structures.
i. Migration of particles and failed components.
j. Particles and failed components lodged in circuitry or mechanisms.
k. Excessive electrical noise.
l. Fretting corrosion in bearings.
2.1.2 Sequence.
Tailor the test sequence as a function of the life cycle environments of the specific Program (See Part One, paragraph5.5).
Downloaded from http://www.everyspec.com on 2012-06-04T5:34:26.
MIL-STD-810F1 January 2000
METHOD 514.5
514.5-4
a. General. The accumulated effects of vibration-induced stress may affect materiel performance underother environmental conditions such as temperature, altitude, humidity, leakage, or electromagneticinterference (EMI/EMC). When evaluating the cumulative environmental effects of vibration and otherenvironments, expose a single test item to all environmental conditions, with vibration testing generallyperformed first. If another environment (e.g., temperature cycling) is projected to produce damage thatwould make the materiel more susceptible to vibration, perform tests for that environment beforevibration tests. For example, thermal cycles might initiate a fatigue crack that would grow undervibration or vice versa.
b. Unique to this method. Generally, expose the test item to the sequence of individual vibration tests thatfollow the sequence of the life cycle. For most tests, this can be varied if necessary to accommodate testfacility schedules or for other practical reasons. However, always perform some tests in the life cyclesequence. Complete all manufacture associated preconditioning (including ESS) before any of thevibration tests. Complete any maintenance associated preconditioning (including ESS) prior to testsrepresenting mission environments. Perform tests representing critical end-of-mission environments last.
2.2 Selecting Procedures.
Identify the environments of the materiel life cycle during the tailoring process as described in Part One. Table514.5-I provides a list of vibration environments by category versus test procedure. Descriptions of each categorylisted in this table are included in Annex A along with information for tailoring the test procedures of paragraph 4below, and alternate test criteria for use when measured data are not available. In general, test materiel for eachcategory to which it will be exposed during an environmental life cycle. Tailor test procedures to best accomplishthe test purpose (see Annex B, paragraph 2.1), and to be as realistic as possible (Annex A, paragraph 1.2).
2.2.1 Procedure selection considerations.
Depending on relative severity, it may be acceptable to delete vibration tests representing particular life cycleelements for a materiel test program. Base such decisions on consideration of both vibration amplitude and fatiguedamage potential across the frequency range of importance. Make analytical estimates of fatigue damage potentialon the basis of simple, well-understood models of the materiel.
a. Transportation vibration more severe than application environment. Transportation vibration levels areoften more severe than application vibration levels for ground-based and some shipboard materiel. Inthis case, both transportation and platform vibration tests are usually needed because the transportationtest is performed with the test item non-operating and the platform test is performed with the test itemoperating.
b. Application vibration more severe than transportation vibration. If the application vibration levels aremore severe than the transportation levels, it may be feasible to delete transportation testing. It may alsobe feasible to change the application test spectrum shape or duration to include transportationrequirements in a single test. In aircraft applications, a minimum integrity test (see Annex A, paragraph2.4.1) is sometimes substituted for transportation and maintenance vibration requirements.
c. Transportation configuration versus application configuration. In evaluation of the relative severity ofenvironments, include the differences in transportation configuration (packaging, shoring, folding, etc.)and application configuration (mounted to platform, all parts deployed for service, etc.). In addition,transportation environments are usually defined as inputs to the packaging, whereas applicationenvironments are expressed as inputs to the materiel mounting structure or as response of the materiel tothe environment.
2.2.2 Difference among procedures.
a. Procedure I - General Vibration. Use Procedure I for those cases where a test item is secured to avibration exciter and vibration is applied to the test item at the fixture/test item interface. Steady state ortransient vibration may be applied as appropriate.
Downloaded from http://www.everyspec.com on 2012-06-04T5:34:26.
MIL-STD-810F1 January 2000
METHOD 514.5514.5-5
b. Procedure II - Loose Cargo Transportation. Use this procedure for materiel to be carried in/on trucks,trailers, or tracked vehicles and not secured to (tied down in) the carrying vehicle. The test severity isnot tailorable and represents loose cargo transport in military vehicles traversing rough terrain.
c. Procedure III - Large Assembly Transportation. This procedure is intended to replicate the vibration andshock environment incurred by large assemblies of materiel installed or transported by wheeled ortracked vehicles. It is applicable to large assemblies or groupings forming a high proportion of vehiclemass, and to materiel forming an integral part of the vehicle. In this procedure, use the specified vehicletype to provide the mechanical excitation to the test materiel. The vehicle is driven over surfacesrepresentative of service conditions, resulting in realistic simulation of both the vibration environmentand the dynamic response of the test materiel to the environment. Generally, measured vibration data arenot used to define this test. However, measured data are often acquired during this test to verify thatvibration and shock criteria for materiel subassemblies are realistic.
d. Procedure IV - Assembled Aircraft Store Captive Carriage and Free Flight. Apply Procedure IV tofixed wing aircraft carriage and free flight portions of the environmental life cycles of all aircraft stores,and to the free flight phases of ground or sea launched missiles. Use Procedure I, II or III for otherportions of the store’s life cycle as applicable. Steady state or transient vibration may be applied asappropriate. Do not apply Procedure I to fixed wing aircraft carriage or free flight phases.
2.3 Determine Test Levels and Conditions.
Select excitation form (steady state or transient), excitation levels, control strategies, durations and laboratoryconditions to simulate the vibration exposures of the environmental life cycle as accurately as possible. Wheneverpossible, acquire measured data as a basis for these parameters. Annex A includes descriptions of various phasestypical of an environmental life cycle along with discussions of important parameters and guidance for developingtest parameters. Annex B has further guidance in interpretation of technical detail.
2.3.1 Climatic conditions.
Many laboratory vibration tests are conducted under Standard Ambient Test Conditions as discussed in Part One,paragraph 5. However, when the life cycle events being simulated occur in environmental conditions significantlydifferent than standard conditions, consider applying those environmental factors during vibration testing. Individualclimatic test methods of this standard include guidance for determining levels of other environmental loads.Methods 520.2, “Temperature, Humidity, Vibration, Altitude,” and 523.2, “Vibro-Acoustic/Temperature,” containspecific guidance for combined environments testing.
Downloaded from http://www.everyspec.com on 2012-06-04T5:34:26.
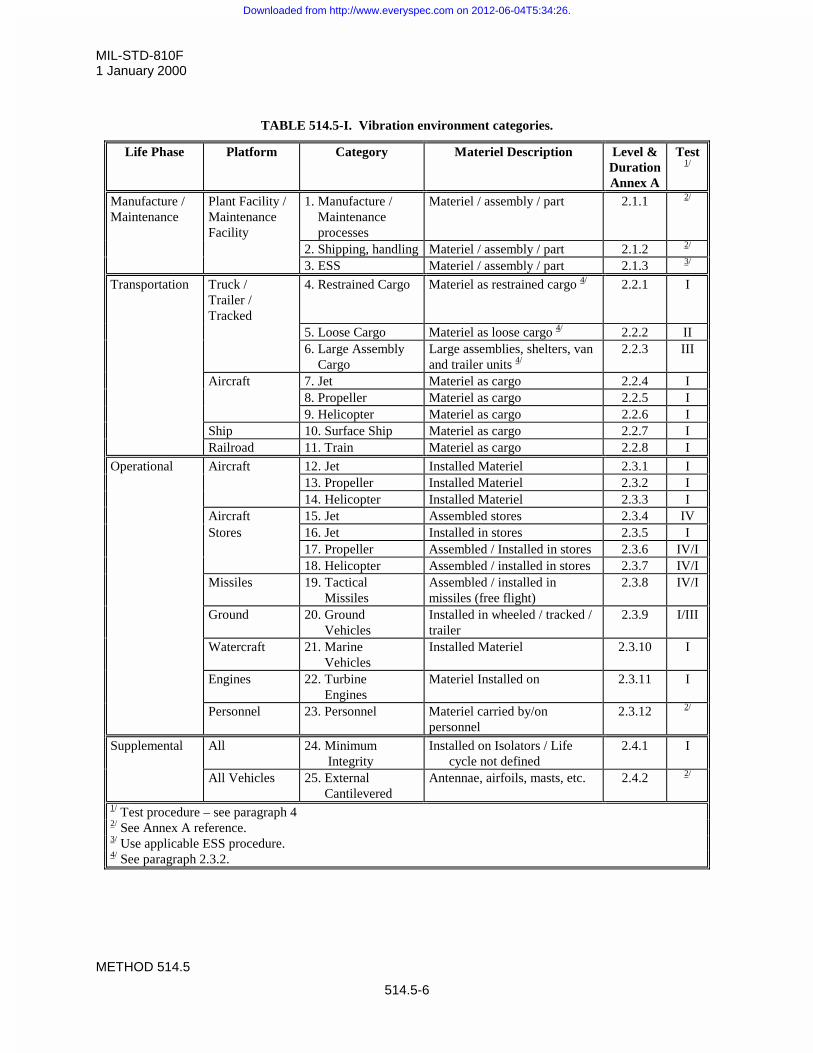
MIL-STD-810F1 January 2000
METHOD 514.5
514.5-6
TABLE 514.5-I. Vibration environment categories.
Life Phase Platform Category Materiel Description Level &DurationAnnex A
Test1/
Manufacture /Maintenance
Plant Facility /MaintenanceFacility
1. Manufacture / Maintenance processes
Materiel / assembly / part 2.1.1 2/
2. Shipping, handling Materiel / assembly / part 2.1.2 2/
3. ESS Materiel / assembly / part 2.1.3 3/
Transportation Truck /Trailer /Tracked
4. Restrained Cargo Materiel as restrained cargo 4/ 2.2.1 I
5. Loose Cargo Materiel as loose cargo 4/ 2.2.2 II6. Large Assembly Cargo
Large assemblies, shelters, vanand trailer units 4/
2.2.3 III
Aircraft 7. Jet Materiel as cargo 2.2.4 I8. Propeller Materiel as cargo 2.2.5 I9. Helicopter Materiel as cargo 2.2.6 I
Ship 10. Surface Ship Materiel as cargo 2.2.7 IRailroad 11. Train Materiel as cargo 2.2.8 I
Operational Aircraft 12. Jet Installed Materiel 2.3.1 I13. Propeller Installed Materiel 2.3.2 I14. Helicopter Installed Materiel 2.3.3 I
Aircraft 15. Jet Assembled stores 2.3.4 IVStores 16. Jet Installed in stores 2.3.5 I
17. Propeller Assembled / Installed in stores 2.3.6 IV/I18. Helicopter Assembled / installed in stores 2.3.7 IV/I
Missiles 19. Tactical Missiles
Assembled / installed inmissiles (free flight)
2.3.8 IV/I
Ground 20. Ground Vehicles
Installed in wheeled / tracked /trailer
2.3.9 I/III
Watercraft 21. Marine Vehicles
Installed Materiel 2.3.10 I
Engines 22. Turbine Engines
Materiel Installed on 2.3.11 I
Personnel 23. Personnel Materiel carried by/onpersonnel
2.3.12 2/
Supplemental All 24. Minimum Integrity
Installed on Isolators / Life cycle not defined
2.4.1 I
All Vehicles 25. External Cantilevered
Antennae, airfoils, masts, etc. 2.4.2 2/
1/ Test procedure – see paragraph 42/ See Annex A reference.3/ Use applicable ESS procedure.4/ See paragraph 2.3.2.
Downloaded from http://www.everyspec.com on 2012-06-04T5:34:26.
MIL-STD-810F1 January 2000
METHOD 514.5514.5-7
2.3.2 Test item configuration.
Configure the test item for each test, as it will be in the corresponding life cycle phase. In cases representingtransportation, include all packing, shoring, padding, or other configuration modifications of the particular shipmentmode. The transportation configuration may be different for different modes of transportation.
a. Loose cargo. The method contained herein is a general representation based on experience as well asmeasurement, and is not tailorable (see Annex A, paragraph 2.2.2 for details). The most realisticalternative for truck, trailer, or other ground transportation is to utilize Procedure III. Note thatProcedure III requires the transportation vehicle and a full cargo load.
b. Restrained cargo. Procedure I assumes no relative motion between the vehicle cargo deck or cargocompartment and the cargo. This applies directly to materiel that is tied down or otherwise restrainedsuch that no relative motion is allowed considering vibration, shock, and acceleration loads. Whenrestraints are not used or are such as to allow limited relative motions, provide allowance in the test setup and in the vibration excitation system to account for this motion. Procedure III is an alternative forground transportation.
c. Stacked cargo. Stacking or bundling of sets or groups of materiel items may effect the vibrationtransmitted to individual items. Ensure the test item configuration includes appropriate numbers andgroupings of materiel items.
2.4 Test Item Operation.
Whenever practical, ensure test items are active and functioning during vibration tests. Monitor and record achievedperformance. Obtain as much data as possible that defines the sensitivity of the materiel to vibration. Where testsare conducted to determine functional capability while exposed to the environment, function the test item. In othercases, function the item where practical. Functioning during transportation will not be possible in almost all cases.Also, there are cases where the functional configuration varies with mission phase, or where operation at high levelsof vibration may not be required and may be likely to result in damage.
3. INFORMATION REQUIRED.
The following information is required to conduct and document vibration tests adequately. Tailor the lists to thespecific circumstances, adding or deleting items as necessary. Although generally not required in the past, performfixture and materiel modal surveys when practical. These data are useful in evaluating test results, and in evaluatingthe suitability of materiel against changing requirements or for new applications. These data can be particularlyvaluable in future programs where the major emphasis will be to utilize existing materiel in new applications. (Whenmodal survey is ruled out for programmatic reasons, a simple resonance search can sometimes provide usefulinformation.)
3.1 Pretest.
a. General. See Part One, paragraphs, 5.7 and 5.9, and Appendix A, Tasks 405 and 406 of this standard.
b. Specific to this method.
(1) Test fixture requirements.
(2) Test fixture modal survey procedure.
(3) Test item/fixture modal survey procedure.
(4) Vibration exciter control strategy.
(5) Test tolerances.
(6) Requirements for combined environments.
Downloaded from http://www.everyspec.com on 2012-06-04T5:34:26.
MIL-STD-810F1 January 2000
METHOD 514.5
514.5-8
(7) Test schedule(s) and duration of exposure(s).
(8) Axes of exposure.
(9) Measurement instrumentation configuration.
(10) Test shutdown procedures for test equipment or test item problems, failures, etc.
(11) Test interruption recovery procedure.
(12) Test completion criteria.
c. Specific to Procedure.
(1) Procedure II - Loose cargo vibration. Define the orientation of test item(s) in relation to the axis ofthrow of the test table.
(2) Procedure III - Large assembly transportation. Define the test vehicle(s), loading(s), surface(s),distance(s), and speed(s).
NOTE: Modal surveys of both test fixtures and test items can be extremely valuable. Large test items on largecomplex fixtures are almost certain to have fixture resonances within the test range. These resonances result in largeovertests or undertests at specific frequencies and locations within a test item. Where fixture and test itemresonances couple, the result can be catastrophic. Similar problems often occur with small test items, even when theshaker/fixture system is well designed because it is very difficult and often impractical to achieve a lowest fixtureresonant frequency above 2000 Hz. In cases where the fixture/item resonance coupling cannot be eliminated,consider special vibration control techniques such as acceleration or force limit control.
3.2 During Test.
Collect the information listed in Part One, paragraph 5.10, and in Appendix A, Tasks 405 and 406 of this standard.
3.3 Post-Test.
a. General. See Part One, paragraph 5.13, and Appendix A, Task 406 of this standard.
b. Specific to this method.
(1) Summary and chronology of test events, test interruptions, and test failures.
(2) Discussion and interpretation of test events.
(3) Functional verification data.
(4) Test item modal analysis data.
(5) Fixture modal analysis data.
(6) All vibration measurement data.
4. TEST PROCESS.
Tailor the following sections as appropriate for the individual contract or program. Note that if these sections aredirectly referenced in a contract, they will generally not comply with current and future Department of Defenserequirements for contractual language.
4.1 Test Facility.
Use a test facility, including all auxiliary equipment, capable of providing the specified vibration environments andthe control strategies and tolerances discussed in paragraph 4.2. In addition, use measurement transducers, datarecording and data reduction equipment capable of measuring, recording, analyzing and displaying data sufficient to
Downloaded from http://www.everyspec.com on 2012-06-04T5:34:26.
MIL-STD-810F1 January 2000
METHOD 514.5514.5-9
document the test and to acquire any additional data required. Unless otherwise specified, perform the specifiedvibration tests and take measurements at standard ambient conditions as specified in Part One, paragraph 5.1.
4.1.1 Procedure I - General vibration.
This procedure utilizes standard laboratory vibration exciters (shakers), slip tables, and fixtures. Choose the specificexciters to be used based on size and mass of test items and fixtures, the frequency range required, and the lowfrequency stroke length (displacement) required.
4.1.2 Procedure II - Loose cargo transportation.
Simulation of this environment requires use of a package tester (figure 514.5C-5) that imparts a 25.4 mm (1.0 inch)peak-to-peak, circular motion to the table at a frequency of 5 Hz. This motion takes place in a vertical plane. Thefigure shows the required fixturing. This fixturing does not secure the test item(s) to the bed of the package tester.Ensure the package tester is large enough for the specific test item(s) (dimensions and weight).
a. Test bed. Cover the test bed of the package tester with a cold rolled steel plate (see note), 5 to 10 mm(0.2 to 0.4 in) thick, and secure the plate with bolts, the tops of the heads of which are slightly below thesurface. Space the bolts at sufficient intervals around the four edges and through the center area toprevent diaphragming of the steel plate. Do not start a test on an area of steel plate that is severelydamaged or worn through.
b. Fencing. The fence opposite the vertical impact wall is not intended as an impact surface, but is used torestrain the test item from leaving the tester. The distance to this restraining fence should be sufficient toprevent constant impact, but still prevent one or more of multiple test items from “walking” away fromthe others. The height of the test enclosure (sideboards, impact wall, and restraining fence) should be atleast 5 cm higher than the height of the test item to prevent unrealistic impacting of the test item on thetop of the enclosure.
Note: Comparison of plywood bed and steel bed data show no statistical difference. Also, steel bed requires lessmaintenance and U. S. Army trucks use steel beds. See reference a.
4.1.3 Procedure III - Large assembly transportation.
The test facility for this method is a test surface(s) and vehicle(s) representative of transportation and/or servicephases of the environmental life cycle. The test item is loaded on the vehicle and restrained or mounted to representthe life cycle event. The vehicle is then driven over the test surface in a manner that reproduces the transportation orservice conditions. The test surfaces may include designed test tracks (e.g., test surfaces at the U. S. Army AberdeenTest Center, reference b), typical highways, or specific highways between given points (e.g., a specified routebetween a manufacturing facility and a military depot). Potentially, such testing can include all environmentalfactors (vibration, shock, temperature, humidity, pressure, etc.) related to wheeled vehicle transport.
4.1.4 Procedure IV - Assembled aircraft store captive carriage and free flight.
This procedure utilizes standard laboratory vibration exciters (shakers) driving the test item directly or through alocal fixture. The test item is supported by a test frame independent of the vibration exciters (see paragraph 4.4.4).Select the specific exciters based on size and mass of test items and fixtures, frequency range, and low frequencystroke length (displacement) required.
4.2 Controls.
The accuracy in providing and measuring vibration environments is highly dependent on fixtures and mountings forthe test item, the measurement system and the exciter control strategy. Ensure all instrumentation considerations arein accordance with the best practices available (see reference c). Careful design of the test set up, fixtures,transducer mountings and wiring, along with good quality control will be necessary to meet the tolerances ofparagraph 4.2.2 below.
Downloaded from http://www.everyspec.com on 2012-06-04T5:34:26.
MIL-STD-810F1 January 2000
METHOD 514.5
514.5-10
4.2.1 Control strategy.
Select a control strategy that will provide the required vibration at the required location(s) in or on the test item.Base this selection on the characteristics of the vibration to be generated and platform/material interaction (seeparagraph 1.3b above and Annex B, paragraph 2.4). Generally, a single strategy is appropriate. There are caseswhere multiple strategies are used simultaneously.
4.2.1.1 Acceleration input control strategy.
Input control is the traditional approach to vibration testing. Control accelerometers are mounted on the fixture atthe test item mounting points. Exciter motion is controlled with feedback from the control accelerometer(s) toprovide defined vibration levels at the fixture/test item interface. Where appropriate, the control signal can be theaverage of the signals from more than one test item/fixture accelerometer. This represents the platform input to themateriel and assumes that the materiel does not influence platform vibration.
4.2.1.2 Force control strategy.
Dynamic force gages are mounted between the exciter/fixture and the test item. Exciter motion is controlled withfeedback from the force gages to replicate field measured interface forces. This strategy is used where the field(platform/materiel) dynamic interaction is significantly different from the laboratory (exciter/test item) dynamicinteraction. This form of control inputs the correct field-measured forces at the interface of the laboratory vibrationexciter and test item. This strategy is used to prevent overtest or undertest of materiel mounts at the lowest structuralresonances that may otherwise occur with other forms of control.
4.2.1.3 Acceleration limit strategy.
Input vibration criteria is defined as in paragraph 4.2.1.1. In addition, vibration response limits at specific points onthe materiel are defined (typically based on field measurements). Monitoring accelerometers are located at thesepoints. The test item is excited as in paragraph 4.2.1.1 using test item mounting point accelerometer signals tocontrol the exciters. The input criteria are experimentally modified as needed to limit responses at the monitoringaccelerometers to the predefined limits. Changes to the specified input criteria are limited in frequency bandwidthand in level to the minimum needed to achieve the required limits.
4.2.1.4 Acceleration response control strategy.
Vibration criteria are specified for specific points on, or within the test item. Control accelerometers are mounted atthe vibration exciter/fixture interface. Monitoring accelerometers are mounted at the specified points within theitem. An arbitrary low level vibration, controlled with feedback from the control accelerometers, is input to the testitem. The input vibration is experimentally adjusted until the specified levels are achieved at the monitoringaccelerometers. This strategy is commonly used with assembled aircraft stores where store response to the dynamicenvironment is measured or estimated. It is also applicable for other materiel when field measured response data areavailable.
4.2.1.5 Open loop waveform control strategy.
Monitoring accelerometers are mounted at locations on/in the test item for which measured data are available. Theexciter is driven by an appropriately compensated time/voltage waveform obtained directly from (1) field measureddata, or (2) a specified digitized waveform, and monitor acceleration responses are measured. In general, thecompensated voltage waveform will be determined in the same way that a voltage waveform is determined for ashock test, i.e., from a convolution of the desired response waveform with the system impulse response function.This strategy is not generally applicable to the procedures of method 514.5. It is more generally used for control oftransient or short duration, time-varying random vibration of method 516.5.
Downloaded from http://www.everyspec.com on 2012-06-04T5:34:26.
MIL-STD-810F1 January 2000
METHOD 514.5514.5-11
4.2.2 Tolerances.
Use the following tolerances unless otherwise specified. In cases where these tolerances cannot be met, achievabletolerances should be established and agreed to by the cognizant engineering authority and the customer prior toinitiation of test. Protect measurement transducer(s) to prevent contact with surfaces other than the mountingsurface(s).
4.2.2.1 Acceleration spectral density.
Care must be taken to examine field measured response probability density information for non-Gaussian behavior.In particular, determine the relationship between the measured field response data and the laboratory replicated datarelative to three sigma peak height limiting that may be introduced in the laboratory test.
a. Vibration environment. Maintain the acceleration spectral density at a control transducer within +2.0 dBor �1.0 dB over the specified frequency range. This tolerance is usually readily attainable with small,compact test items (such as small and medium sized rectangular electronic packages), well-designedfixtures, and modern control equipment. When test items are large or heavy, when fixture resonancescannot be eliminated, or when steep slopes (> 20 dB/octive) occur in the spectrum, these tolerances mayhave to be increased. When increases are required, exercise care to ensure the selected tolerances are theminimum attainable, and that attainable tolerances are compatible with test objectives. In any case,tolerances should not exceed r3 dB over the entire test frequency range and +3, �6 above 500 Hz. Thesetolerances should be limited to a maximum of 5% of the test frequency range. Otherwise, change thetests, fixtures, or facilities so test objectives can be met. For Procedure IV, Assembled Aircraft Stores,the allowable deviation is r3 dB.
b. Vibration measurement. Use a vibration measurement system that can provide acceleration spectraldensity measurements within r0.5 dB of the vibration level at the transducer mounting surface (ortransducer target mounting surface) over the required frequency range. Do not use a measurementbandwidth that exceeds 2.5 Hz at 25 Hz or below or 5 Hz at frequencies above 25 Hz. For control andanalysis systems of fast Fourier transform (FFT) type, use a resolution of at least 400 frequency lines.For wider frequency ranges the use of 800 frequency lines is recommended. Ensure the number ofstatistical degrees of freedom is not be less than 120.
c. Root mean square (RMS) “g.” Do not use RMS g for defining or controlling vibration tests because itcontains no spectral information. RMS levels are useful in monitoring vibration tests since RMS can bemonitored continuously, whereas measured spectra are available on a delayed, periodic basis. Also,RMS values are sometimes useful in detecting errors in test spectra definition. Define the tolerances onRMS g monitoring values based on the test variables and the test equipment. Do not use randomvibration RMS g as a comparison with sinusoidal peak g. These values are unrelated.
4.2.2.2 Peak sinusoidal acceleration.
a. Vibration environment. Ensure the peak sinusoidal acceleration at a control transducer does not deviatefrom that specified by more than r10% over the specified frequency range.
b. Vibration measurement. Ensure the vibration measurement system provides peak sinusoidal accelerationmeasurements within r5% of the vibration level at the transducer mounting surface (or transducer targetmounting surface) over the required frequency range.
c. RMS g. The RMS g of a sinusoid equals 0.707 times peak g. It is not related to RMS g of a random(g2/Hz) spectrum; do not use this to compare sine criteria (g) to random criteria (g2/Hz).
4.2.2.3 Frequency measurement.
Ensure the vibration measurement system provides frequency measurements within r1.25% at the transducermounting surface (or transducer target mounting surface) over the required frequency range.
Downloaded from http://www.everyspec.com on 2012-06-04T5:34:26.
MIL-STD-810F1 January 2000
METHOD 514.5
514.5-12
4.2.2.4 Cross axis accelerations.
Ensure vibration acceleration in two axes mutually orthogonal and orthogonal to the drive axis is less than or equalto 0.45 times the acceleration (0.2 times the spectral density) in the drive axis at any frequency. In a randomvibration test the cross axis acceleration spectral density often has high but narrow peaks. Consider these in tailoringcross-axis tolerances.
4.3 Test interruption.
a. General. See Part One, paragraph 5.11, of this standard.
b. Specific to this method.
(1) When interruptions are due to failure of the test item, analyze the failure to determine root cause.With this information, make a decision to restart, to replace, to repair failed components and resume,or to declare the test complete. Tailor this decision to the test and the test objectives. See Annex B,paragraph 2.1 for descriptions of common test types and a general discussion of test objectives.
(2) If a qualification test is interrupted because of a failed component and the component is replaced,continuation of the test from the point of interruption will not verify the adequacy of the replacedcomponent. Each replaced component must experience the full vibration requirement prior to itsacceptance. Additional guidance is provided in paragraph 5.2.
4.4 Test Setup.
See Part One, paragraph 5.8.
4.4.1 Procedure I - General vibration.
Configure the test item appropriately for the life cycle phase to be simulated.
a. Transportation. Configure the test item for shipment including protective cases, devices, and/or packing.Mount the test item to the test fixture(s) by means of restraints and/or tie-downs dynamicallyrepresentative of life cycle transportation events.
b. Operational service. Configure the test item for service use. Secure the test item to the test fixture(s) atthe mounting point(s) and use the same type of mounting hardware as used during life cycle operationalservice. Provide all mechanical, electrical, hydraulic, pneumatic or other connections to the materiel thatwill be used in operational service. Ensure these connections dynamically simulate the serviceconnections and that they are fully functional unless otherwise specified.
4.4.2 Procedure II - Loose cargo transportation.
Two different setups of fencing are required depending on the type of test item. The two types are those that aremore likely to slide on the test surface or “rectangular cross section items” (typically packaged items), and thosemost likely to roll on the surface or “circular cross section items.” (Note that "multiple test items" refers to identicaltest items and not to a mixture of unrelated items.)
a. Rectangular cross section items. Position the test item on the package tester bed in its most likelyshipping orientation. If the most likely shipping orientation cannot be determined, place the test item onthe bed with the longest axis of the test item parallel to the long axis of the table (throw axis). Positionthe wooden impact walls and sideboards so as to allow impacting on only one end wall (no rebounding)and to prevent rotation of the test item through 90 degrees. Do not separate multiple test items bysideboards. The first half of the test is to be conducted with this orientation. The second half is to beconducted with the orientation of the test item rotated 90 degrees.
b. Circular cross section items with 4 or more test items. Place the impact walls so as to form a square testarea with the walls parallel and perpendicular to the throw axis. Use the following formulae to determine
Downloaded from http://www.everyspec.com on 2012-06-04T5:34:26.
MIL-STD-810F1 January 2000
METHOD 514.5514.5-13
the dimensions. Determine the slenderness ratio for individual test items by RT = L/D, where RT = theitem slenderness ratio; L = the item length; D = the item diameter. Calculate an RR value for defining thetest area as follows:
R R = N L / [0.767 L N1/2 - 2 SW - (N -1) SB]
where:
SW = spacing between the test item and the side wall
SB = spacing between test items
(SW and SB are chosen based on test item geometry to provide realistic impacting with impact wallsand between test items. 25 mm is a typical value for both.)
N = number of test items where N > 3
If the RT > RR, the length of each side of the test area is given by “X” where:
X = 0.767 L N1/2
If RT < RR, the length of each side of the test area is given by “W” where:
W = N D + 2 SW + (N -1)SB
c. Circular cross section items with 3 or fewer test items. Determine the slenderness ratio for individual testitems by RT = L/D. Calculate an RR value for defining the test area as follows:
RR = N L / [1.5 L - 2 SW - (N -1) SB]
If RT > RR, the length of each side of the test area is given by “X” where:
X = 1.5 L
If RT < RR, the length of each side of the test area is given by “W” where:
W = N D + 2 SW + (N -1) SB
Place the test item on the package tester, inside the impact walls, in a random manner. Because part ofthe damage incurred during these tests is due to items impacting each other, use more than 3 test items ifpossible.
4.4.3 Procedure III - Large assembly transportation.
Install the test item in/on the vehicle in its intended transportation or service configuration. If the assembly is to becontained within a shelter, or if other units are attached to the materiel assembly in its in-service configuration, alsoinstall these items in their design configuration.
a. Test surfaces. When setting up the test, consider the test surfaces available at the particular test location(see reference b). Also, ensure the selection of test surfaces, test distances, and test speeds areappropriate for the specified vehicles and their anticipated use.
b. Test loads. Response of the vehicle to the test terrain is a function of the total load and the distribution ofthe load on the vehicle. In general, a harsher ride occurs with a lighter load while a heavier load willresult in maximum levels at lower frequencies. Multiple test runs with variations in load may be requiredto include worst case, average, or other relevant cases.
c. Tie-down/mounting arrangements. During the test, it is important to reproduce the more adversearrangements that could arise in normal use. For example, during transportation, relaxation of tie-downstrap tension could allow the cargo to lift off the cargo bed and result in repeated shock conditions.Excessive tightening of webbing straps could prevent movement of test items and thereby reduce oreliminate such shocks.
Downloaded from http://www.everyspec.com on 2012-06-04T5:34:26.
MIL-STD-810F1 January 2000
METHOD 514.5
514.5-14
4.4.4 Procedure IV - Assembled aircraft store captive carriage and free flight.
a. Captive carriage test fixture. Suspend the test item from a structural support frame by means of theoperational service store suspension equipment (bomb rack, launcher, pylon, etc.). Ensure that theflexible modes of the support frame are as high as practical, at least twice the first flexible frequency ofthe store, and that they do not coincide with store modes. Include and load (torque, clamp, latch, etc.)sway braces, lugs, hooks or other locking and load carrying devices that attach the store to the suspensionequipment and the suspension equipment to the carrier aircraft, as required for captive carriage inservice. Ensure that the layout of the structural support frame and the test area is such that there isadequate access for the vibration exciters and test materiel.
(1) Configure the assembled store for captive carriage and mount it to the structural support frame.Softly suspend the structural support frame within the test chamber. Ensure that rigid body modes ofthe store, suspension equipment, and structural support frame combination are between 5 and 20 Hz,and lower than one half the lowest flexible mode frequency of the store. Use structural support thatis sufficiently heavy and of sufficient pitch and roll inertias to approximately simulate carrier aircraftdynamic reaction mass. If the structural support is too heavy or its inertia too large, the storesuspension equipment and store hardback will be over-stressed. This is because unrealistically highdynamic bending moments are needed to match acceleration spectral densities. Conversely, if thestructural support is too light or its inertia too low, there will be an undertest of the suspensionequipment and store hardback.
(2) Do not use the structural support to introduce vibration into the store. In the past, stores have beenhard mounted to large shakers. Do not attempt this because this has proven to be inadequate.Recent test experience with F-15, F-16, and F/A-18 stores indicates that including a structuralsupport/reaction mass greatly improves the match between flight measured data and laboratoryvibrations, particularly at lower frequencies.
(3) In cases in which the frequency requirements in (1) and (2) cannot be met, consider force controlstrategy (see paragraph 4.2.1.2).
b. Free flight test fixture. Configure the assembled test store for free flight and softly suspend it within thetest chamber. Ensure rigid body modes of the suspended store are between 5 and 20 Hz and lower thanone half the lowest flexible mode frequency of the store.
c. Orientation. With the store suspended for test, the longitudinal axis is the axis parallel to the groundplane and passing through the longest dimension of the store. The vertical axis is mutually perpendicularto the ground plane and the longitudinal axis. The lateral axis is mutually perpendicular to longitudinaland vertical axes.
d. Vibration excitation. Store longitudinal vibration is typically less than vertical and lateral vibration.Vertical and lateral excitation of store modes usually results in sufficient longitudinal vibration. When astore is relatively slender (length greater than 4 times the height or width), drive the store in the verticaland lateral axes. In other cases, drive the store in the vertical, lateral, and longitudinal axes. If a storecontains material that is not vibration tested except at assembled store level, or the store containscomponents that are sensitive to longitudinal vibration, include longitudinal excitation.
(1) Transmit vibration to the store by means of rods (stingers) or other suitable devices running fromvibration exciters to the store. Separate drive points at each end of the store in each axis arerecommended. Ideally, the store will be driven simultaneously at each end. However, it can bedriven at each end separately. A single driving point in each axis aligned with the store aerodynamiccenter has also been successful. Use drive points on the store surface that are relatively hard andstructurally supported by the store internal structure or by test fixture(s) (usually external ringsaround the local store diameter) that distribute the vibratory loads into the store primary structure.
(2) This test is intended to represent a highly random, highly uncorrelated vibration condition. Thus,when two vibration exciters are used simultaneously, the two drive signals are uncorrelated. Notethat two drive signals that start out uncorrelated and that are from two separate controllers may
Downloaded from http://www.everyspec.com on 2012-06-04T5:34:26.
MIL-STD-810F1 January 2000
METHOD 514.5514.5-15
become correlated unless uncorrelation is forced. In general, the use of two vibration exciters willrequire some knowledge of current dual drive testing capabilities that include specification of thevibration exciter cross spectral density matrices.
e. Instrumentation. Mount transducers on the store and/or the store excitation devices to monitorcompliance of vibration levels with requirements, to provide feedback signals to control the vibrationexciter, and to measure materiel function. Additionally, it is usually important to overall programobjectives to add transducers to measure local vibration environment throughout the store. Note thevibration exciter control strategy used, e.g., single point response, multipoint response, force limit,waveform, etc. Also note the relationship, if any, between field measurement data and laboratorymeasurement data.
(1) Mount accelerometers to monitor vibration levels at the forward and aft extremes of the primary loadcarrying structure of the store. Do not mount these accelerometers on fairings, unsupported areas ofskin panels, aerodynamic surfaces, or other relatively soft structures. In some cases (see paragraph4.4.4c above), transducers are required in the vertical and lateral directions. In other cases,transducers are required in vertical, lateral, and longitudinal directions. Designate these transducersas the test monitor transducers.
(2) An alternate method is to monitor the test with strain gages that are calibrated to provide dynamicbending moment. This has proven successful where integrity of the store primary structure is amajor concern. Flight measured dynamic bending moment data is required for this method. Also,use accelerometers positioned as discussed above to verify that general vibration levels are asrequired.
(3) As feedback control transducers, use either accelerometers on or near the store/vibrationtransmission device(s)/vibration exciter interface, force transducer(s) in series with thestore/vibration transmission device(s)/vibration exciter, or dynamic bending moment strain gages. Aclear understanding of the vibration exciter control strategy and its effects on the overallmeasurements is necessary.
4.5 Test Execution.
The following steps, alone or in combination, provide the basis for collecting necessary information concerning thedurability and function of a test item in a vibration environment.
4.5.1 Preparation for test.
4.5.1.1 Preliminary steps.
Before starting test, review pretest information in the test plan to determine test details (procedure(s), test itemconfiguration(s), levels, durations, vibration exciter control strategy, failure criteria, item functional requirements,instrumentation requirements, facility capability, fixture(s), etc.).
a. Select appropriate vibration exciters and fixtures.
b. Select appropriate data acquisition system (e.g., instrumentation, cables, signal conditioning, recording,analysis equipment).
c. Operate vibration equipment without the test item installed to confirm proper operation.
d. Ensure that the data acquisition system functions as required.
4.5.1.2 Pretest standard ambient checkout.
All items require a pretest standard ambient checkout to provide baseline data. Conduct the pretest checkout asfollows:
Step 1. Examine the test item for physical defects, etc. and document the results.
Downloaded from http://www.everyspec.com on 2012-06-04T5:34:26.
MIL-STD-810F1 January 2000
METHOD 514.5
514.5-16
Step 2. Prepare the test item for test, in its operating configuration if required, as specified in the test plan.
Step 3. Examine the test item/fixture/exciter combination for compliance with test item and test planrequirements.
Step 4. If applicable, conduct an operational checkout in accordance with the test plan and document theresults for comparison with data taken during or after the test.
4.5.2 Procedure I - General vibration.
Step 1. Perform a visual inspection of the test item and an operational check. If a failure is noted, proceedas in paragraph 4.3.
Step 2. Conduct fixture modal survey and verify that fixture meets requirements, if required.
Step 3. Mount the test item to the test fixture in a manner dynamically representative of the life cycle eventsimulated.
Step 4. Install sufficient transducers on or near the test item/fixture/vibration exciter combination to measurevibration at the test item/fixture interface, to control the vibration exciter as required by the controlstrategy, and measure any other required parameters. Mount control transducer(s) as close aspossible to the test item/fixture interface. Ensure that the total accuracy of the instrumentationsystem is sufficient to verify that vibration levels are within the tolerances of paragraph 4.2.2 and tomeet additionally specified accuracy requirements.
Step 5. Conduct test item modal survey, if required.
Step 6. Perform a visual inspection of the test item and, if applicable, an operational check. If failure isnoted, proceed as in paragraph 4.3.
Step 7. Apply low level vibration to the test item/fixture interface. If required, include other environmentalstresses.
Step 8. Verify that the vibration exciter, fixture, and instrumentation system functions as required.
Step 9. Apply the required vibration levels to the test item/fixture interface, as well as any other requiredenvironmental stresses.
Step 10. Verify that vibration levels at test item/fixture interface are as specified. If the exposure duration is1/2 hour or less accomplish this step immediately after full levels are first applied, and immediatelybefore scheduled shut down. Otherwise, accomplish this step immediately after full levels are firstapplied, every half-hour thereafter, and immediately before scheduled shut down.
Step 11. Monitor vibration levels and, if applicable, test item performance continuously through the exposure.If levels shift or a failure occurs, shut down the test in accordance with the test shut down procedure(paragraph 3.1b(10)). Determine the reason for the shift and proceed in accordance with the testinterruption recovery procedure (paragraph 3.1b(11)).
Step 12. When the required duration has been achieved, stop the vibration. Depending on the test objectives,the test plan may call for additional exposures at varied levels prior to shut down. If so, repeat steps6 through 12 as required by the test plan before proceeding.
Step 13. Inspect the test item, fixture, vibration exciter, and instrumentation. If failure, wear, looseness, orother anomalies are found, proceed in accordance with the test interruption recovery procedure(paragraph 3.1b(11)).
Step 14. Verify that the instrumentation functions as required and perform an operational check of the testitem. If a failure is noted, proceed as in paragraph 4.3.
Step 15. Repeat steps 1 through 14 for each required excitation axis.
Downloaded from http://www.everyspec.com on 2012-06-04T5:34:26.
MIL-STD-810F1 January 2000
METHOD 514.5514.5-17
Step 16. Repeat steps 1 through 15 for each required vibration exposure.
Step 17. Remove the test item from the fixture and Inspect the test item, mounting hardware, packaging, etc.Refer to paragraph 4.3 if there are failures.
4.5.3 Procedure II - Loose cargo transportation.
Step 1. Perform a visual inspection of the test item and an operational check.
Step 2. Conduct test item modal survey, if required.
Step 3. Place the test item(s) on the package tester within the restraining fences in accordance withparagraphs 4.1.2 and 4.4.2.
Step 4. Install instrumentation sufficient to measure any required parameters. Ensure that the total accuracyof the instrumentation system is sufficient to meet specified accuracy requirements.
Step 5. Operate the package tester for one-half of the prescribed duration.
Step 6. Perform a visual inspection of the test item and an operational check. If a failure is noted, proceedas in paragraph 4.3.
Step 7. Reorient the test item(s) and/or the fencing/impact walls in accordance with paragraph 4.4.2.
Step 8. Operate the package tester for one-half of the prescribed duration.
Step 9. Perform a visual inspection of the test item and an operational check. If a failure is noted, proceedas in paragraph 4.3.
4.5.4 Procedure III - Large assembly transportation.
Step 1. Perform a visual inspection of the test item and an operational check. If a failure is noted, proceedas in paragraph 4.3.
Step 2. Mount the test item(s) on/in the test vehicle as required in the test plan.
Step 3. Install transducers on or near the test item sufficient to measure vibration at the test item/vehicleinterface and to measure any other required parameters. Protect transducers to prevent contact withsurfaces other than the mounting surface.
Step 4. Subject the vehicle containing the test item to the specified test conditions.
Step 5. Perform a visual inspection of the test item and an operational check. If a failure is noted, proceedas in paragraph 4.3.
Step 6. Repeat steps 1 through 5 for additional test runs, test loads, or test vehicles as required by the testplan.
4.5.5 Procedure IV - Assembled aircraft store captive carriage and free flight.
Step 1. With the store suspended within the test chamber and the instrumentation functional, verify that thestore suspension system functions as required by measuring the suspension frequencies.
Step 2. If required, conduct a test item modal survey.
Step 3. Place the test item in an operational mode and verify that it functions properly.
Step 4. Apply low level vibration to the vibration exciter/store interface(s) to ensure that the vibrationexciter and instrumentation system function properly. For acceleration feedback control, use aninitial input level 9 dB down from the required forward test monitor transducer spectrum. For forcefeedback control, use a flat force spectrum where the response at the test monitor accelerometer is atleast 9 dB below the required test monitor value at all frequencies. For bending moment feedback
Downloaded from http://www.everyspec.com on 2012-06-04T5:34:26.
MIL-STD-810F1 January 2000
METHOD 514.5
514.5-18
control, use an initial input level that is 9 dB down from the required test monitor transducerspectrum.
Step 5. Adjust the vibration exciter(s) such that the test monitor transducers in the excitation axis meet thetest requirements. For acceleration control, identify the test monitor transducer spectrum peaks thatexceed the input spectrum by 6 dB or more (frequencies may differ fore and aft). For force feedbackcontrol, identify major peaks from the force measurements to check monitor accelerometer transferfunctions. For both cases, equalize the input spectra until the identified peaks equal or exceed therequired test levels. The resulting input spectra should be as smooth and continuous as possiblewhile achieving the required peak responses. (It is not necessary to fill in valleys in the test monitortransducer spectra; however, it is not acceptable to notch out the input in these valleys.) For bendingmoment control raise and shape the input spectrum until it matches the required spectrum (peaks andvalleys).
Step 6. When the input vibration is adjusted such that the required input response (A1) is achieved, measurethe off-axis response(s) (A2, A3). Verify that off-axis response levels are within requirements usingthe following equations. If the result obtained from the equation is greater than the value establishedfor the equation, reduce the input vibration level until the achieved input and off-axis response levelsbalance the equation. Apply these equations at each peak separately. Use the first equation fortesting that requires vibration application in two separate mutually perpendicular axes, and use thesecond equation for testing that requires vibration application in three separate mutuallyperpendicular axes.
2 = (R1/A1 + R2/A2) or, 3 = (R1/A1 + R2/A2 + R3/A3)where;Ri = Test requirement level in g2/Hz or (N-m)2/Hz or (in-lb)2/Hz for i = 1 - 3, andAi = Response level in g2/Hz or (N-m)2/Hz or (in-lb)2/Hz for i = 1 - 3
For example:For testing that requires vibration application in three separate mutually perpendicular axes, andwhen vibration is being applied in the vertical axis, use the equation below as follows.
3 = (R1/A1 + R2/A2 + R3/A3)
where;R1 = Vertical axis test requirement levelA1 = Vertical axis response levelR2 = Horizontal axis test requirement levelA2 = Horizontal axis response levelR3 = Longitudinal axis test requirement levelA3 = Longitudinal axis response level
For vibration being applied in the horizontal axis, use the equation below as follows.
3 = (R1/A1 + R2/A2 + R3/A3)
where;R1 = Horizontal axis test requirement levelA1 = Horizontal axis response levelR2 = Vertical axis test requirement levelA2 = Vertical axis response levelR3 = Longitudinal axis test requirement levelA3 = Longitudinal axis response level
Downloaded from http://www.everyspec.com on 2012-06-04T5:34:26.
MIL-STD-810F1 January 2000
METHOD 514.5514.5-19
For vibration being applied in the longitudinal axis, use the equation below as follows.
3 = (R1/A1 + R2/A2 + R3/A3)
where;R1 = Longitudinal axis test requirement levelA1 = Longitudinal axis response levelR2 = Vertical axis test requirement levelA2 = Vertical axis response levelR3 = Horizontal axis test requirement levelA3 = Horizontal axis response level
Step 7. Verify that vibration levels are as specified. If the exposure duration is 1/2 hour or less, accomplishthis step immediately after full levels are first applied, and immediately before scheduled shut down.Otherwise, accomplish this step immediately after full levels are first applied, every half-hourthereafter, and immediately before scheduled shut down.
Step 8. Monitor the vibration levels and test item performance continuously through the exposure. If levelsshift, performance deviates beyond allowable limits, or failure occurs, shut down the test inaccordance with the test shut down procedure (paragraph 3.1b(10)). Determine the reason for theanomaly and proceed in accordance with the test interruption recovery procedure (paragraph3.1b(11)).
Step 9. When the required duration has been achieved, stop the vibration. Depending on the test objectives,the test plan may call for additional exposures at varied levels prior to shut down. If so, repeat steps6 through 9 as required by the test plan before proceeding.
Step 10. Inspect the test item, fixture, vibration exciter, and instrumentation. If failure, wear, looseness orother anomalies are found, proceed in accordance with the test interruption recovery procedure(paragraph 3.1b(11)).
Step 11. Verify that the instrumentation functions as required and perform an operational check of the testitem for comparison with data collected in paragraph 4.5.1.2. If a failure is noted, proceed as inparagraph 4.3.
Step 12. Repeat steps 1 through 11 for each required excitation axis.
Step 13. Repeat steps 1 through 12 for each required vibration exposure.
Step 14. Remove the test item from the fixture and inspect the test item and mounting hardware. Refer toparagraph 4.3 if there are failures.
5. ANALYSIS OF RESULTS.
In addition to the guidance provided in Part One, paragraph 5.14, the following is provided to assist in the evaluationof the test results.
5.1 Physics of Failure.
Analyses of vibration related failures must relate the failure mechanism to the dynamics of the failed item and to thedynamic environment. It is not enough to determine that something broke due to high cycle fatigue or wear. It isnecessary to relate the failure to the dynamic response of the materiel to the dynamic environment. Thus, include infailure analyses a determination of resonant mode shapes, frequencies, damping values and dynamic straindistributions in addition to the usual material properties, crack initiation locations, etc. (See Annex B, paragraph2.5).
Downloaded from http://www.everyspec.com on 2012-06-04T5:34:26.

MIL-STD-810F1 January 2000
METHOD 514.5
514.5-20
5.2 Qualification Tests.
When a test is intended to show formal compliance with contract requirements the following definitions arerecommended.
a. Failure definition. "Materiel is deemed to have failed if it suffers permanent deformation or fracture; ifany fixed part or assembly loosens; if any moving or movable part of an assembly becomes free orsluggish in operation; if any movable part or control shifts in setting, position or adjustment, and if testitem performance does not meet specification requirements while exposed to functional levels andfollowing endurance tests." Ensure this statement is accompanied by references to appropriatespecifications, drawings, and inspection methods.
b. Test completion. "A vibration qualification test is complete when all elements of the test item havesuccessfully passed a complete test. When a failure occurs, stop the test, analyze the failure, and repairthe test item. Continue the test until all fixes have been exposed to a complete test. Each individualelement is considered qualified when it has successfully passed a complete test. Qualified elements thatfail during extended tests are not considered failures and can be repaired to allow test completion."
5.3 Other Tests.
For tests other than qualification tests, prepare success and/or failure criteria and test completion criteria that reflectthe purpose of the tests.
6. REFERENCE/RELATED DOCUMENTS.
a. Methodology Investigation, Final Report of the TECOM Package Tester Characterization, AD B217688,September 1996.
b. Test Operations Procedure (TOP) 1-1-011, Vehicle Test Facilities at Aberdeen Proving Ground, 6 July1981; DTIC AD No. A103325.
c. Handbook for Dynamic Data Acquisition and Analysis, IES-RP-DTE012.1, Institute of EnvironmentalSciences, 940 East Northwest Highway, Mount Prospect, IL 60056.
d. International Test Operating Procedure (ITOP) 1-2-601, FR/GE/UK/US. Laboratory VibrationSchedules. 19 October 1992. DTIC AD No B169566L.
e. International Test Operating Procedure (ITOP) 1-1-050. Development of Laboratory Vibration TestSchedules. 6 June 1997. DTIC AD No B227368.
f. Tevelow, Frank L., The Military Logistical Transportation Vibration Environment: Its Characterizationand Relevance to MIL-STD Fuse Vibration Testing. Harry Diamond Laboratories, December 83. HDL-SR-83-11.
g. Connon, William H. (III). Methodology Investigation, Final Report, Ground Vehicle-Loose CargoVibration Schedules. January 1987. DTIC AD No. B1114819L.
h. White, George O., Methodology Investigation, Final Report, Loose Cargo Testing of UnpackagedSeparate Loading Projectiles. May 1990, DTIC No. B144437.
i. Wafford, J. H. and J. F. Dreher, Aircraft Equipment Vibration Test Criteria Based on Vibration Inducedby Jet and Fan Engine Exhaust Noise. Shock and Vibration Bulletin 43, Part 3, 1973, pp. 141-151.
j. Dreher, J. F., Aircraft Equipment Random Vibration Test Criteria Based on Vibration Induced byTurbulent Air Flow Across Aircraft External Surfaces. Shock and Vibration Bulletin 43, Part 3, 1973,pp. 127-139.
k. Hinegardner, W. D., et al., Vibration and Acoustics Measurements on the RF-4C Aircraft. Wright-Patterson AFB, OH: ASD Systems Engineering Group, 1967, TM-SEF-67-4.
Downloaded from http://www.everyspec.com on 2012-06-04T5:34:26.

MIL-STD-810F1 January 2000
METHOD 514.5514.5-21
l. Bartel, H. W and J. M. McAvoy, Cavity Oscillation in Cruise Missile Carrier Aircraft. Air Force WrightAeronautical Laboratories, June 1981. AFWAL-TR-81-3036.
m. Tipton, A. G., Weapon Bay Cavity Noise Environments Data Correlation and Prediction for the B-1Aircraft. Air Force Wright Aeronautical Laboratories, June 1980. AFWAL-TR-80-3050.
n. Thomas, C. E., Flight Survey of C-130A Aircraft. March 1972. ASD-TR-62-2167. DTIC No. AD-274-904.
o. Bolds, P. G., Flight Vibration Survey C-133 Aircraft. April 1972. ASD-TDR-62-383. DTIC No. AD-277-128.
p. Kuhn, D. L., Analysis of the Vibration Environment for Airborne Reconnaissance Integrated ElectronicsSystem (ARIES) Installed on EP-3E Aircraft. Indianapolis: Naval Avionics Center 443, 1975.Document No. ESL-163.
q. Kuhn, D. L. and R. M. Johnson., Evaluation of the Vibration Environment for the Doppler RangingInformation System. Indianapolis: Naval Avionics Center 443, 1982. Document No. ESL-420.
r. Analysis of the Vibration Environment for TACAMO IV B System Installed on ED-130 Aircraft.Indianapolis: Naval Avionics Center 443, 1976. Document No. ESL-199.
s. Kuhn, D. L., Evaluation of Flight Data for the Big Look Antenna System OE-319/APS Installed on EP-3E aircraft. Indianapolis: Naval Avionics Center 443, 1981. Document No. ESL-418.
t. Kuhn, D. L., Analysis of Flight Data for Deepwell System Installed in EP-3E Aircraft. Indianapolis:Naval Avionics Center 443, 1975. Document No. ESL-169.
u. Dreher, J. F., E. D. Lakin, and E. A. Tolle, Vibroacoustic Environment and Test Criteria for AircraftStores During Captive Flight. Shock and Vibration Bulletin 39, Supplement (1969), pp. 15-40.
v. Dreher, J. F., Effects of Vibration and Acoustical Noise on Aircraft/Stores Compatibility. Aircraft StoreSymposium Proceedings, Vol. 6, November 1969.
w. Piersol, A. G., Vibration and Acoustic Test Criteria for Captive Flight of Externally Carried Stores,December 1971. AFFDL-TR-71-158. DTIC No. AD-893-005L.
x. Frost, W. G., P. B. Tucker, and G. R. Waymon, Captive Carriage Vibration of Air-to-Air Missiles onFighter Aircraft. Journal of Environmental Sciences, 21:15, (September/October 1978), pp. 11-15.
y. Mechanical Vibrations; Den Hartog, J. P., Fourth Edition, McGraw-Hill Book Company. 1956.
z. A Modern Course in Aeroelasticity. Dowell, E. H., et al, Second Edition, Kluwer Academic Publisher,1989.
aa. Shock and Vibration Handbook. Edited by Harris, Cyril M. and Charles E. Crede; McGraw-Hill BookCompany.
bb. Bendat, Julius S., and Piersol, Allan G., Engineering Applications of Correlation and Spectral Analysis,2nd Edition, John Wiley & Sons, Inc., New York, 1993.
cc. Allemang, Randall J. and David L. Brown, Experimental Modal Analysis and Dynamic ComponentSynthesis - Measurement Techniques for Experimental Modal Analysis. Vol. II. December 1987.AFWAL-TR-87-3069.
dd. Allemang, Randall J. and David L. Brown, Experimental Modal Analysis and Dynamic ComponentSynthesis - Modal Parameter Estimation. Vol. III. December 1987. AFWAL-TR-87-3069.
ee. Allemang, Randall J. and David L. Brown, Experimental Modal Analysis and Dynamic ComponentSynthesis - System Modeling Techniques. Vol. VI. December 1987. AFWAL-TR-87-3069.
ff. Airplane Aerodynamics, Dommasch, Daniel O, Sidney S. Sherby and Thomas F. Connolly, PitmanPublishing Corporation, 1958.
Downloaded from http://www.everyspec.com on 2012-06-04T5:34:26.

MIL-STD-810F1 January 2000
METHOD 514.5
514.5-22
gg. U.S. Standard Atmosphere, 1962.
hh. MIL-HDBK-167, Mechanical Vibrations of Shipboard Equipment (Type I – Environmental and Type II– Internally Excited).
ii. Mission Environmental Requirements Integration Technology (MERIT), Final Report (draft), 15September 1996, McDonald Douglas Aerospace
Downloaded from http://www.everyspec.com on 2012-06-04T5:34:26.
MIL-STD-810F1 January 2000ANNEX A
METHOD 514.5514.5A-1
ANNEX A
TAILORING GUIDANCE FOR VIBRATION EXPOSURE DEFINITION
1. SCOPE.
1.1 Purpose.
This Annex provides information intended to be useful in determining the vibration levels and durations ofenvironmental life cycle events and in defining the tests necessary to develop materiel to operate in and survive theseenvironments.
1.2 Application.
It is highly recommended that actual environments be measured and materiel life cycle durations be used to developmateriel design and test criteria whenever possible. Existing databases can sometimes be used in lieu ofmeasurements. A preliminary environmental life cycle based on data provided herein can be useful as a planningtool. A preliminary life cycle definition can be used to concentrate limited resources on those vibration exposuresmost significant to the materiel. Guidance for setting design and test exposure values is given below withdescriptions of vibration environments of many typical life cycle events. Suggested alternate criteria (levels anddurations) or other guidance is recommended for those cases where measured data defining the actual environmentsare not available. Table 514.5-I contains an outline of the following section with references to the paragraphnumbers.
2. VIBRATION ENVIRONMENTS.
2.1 Manufacture/Maintenance.
The following areas are not usually considered as part of the environmental life cycle. However these activities mayresult in vibratory fatigue damage to the materiel. Evaluate these environments and, where significant, include themin design and as preconditioning to environmental tests.
2.1.1 Category 1 - Manufacturing/Maintenance processes.
All materiel will experience some vibration during manufacture and maintenance.
a. Manufacture. If manufacturing processes are identical for all items (including test items), this exposureis common and additional testing is not required. However, evaluate this environment and include it indesign calculations when significant. When different serial number items (lots) experience significantdifferences in vibration exposure during manufacture, select vibration test specimens from those itemsthat experience the maximum vibration exposure.
b. Maintenance. Evaluate this environment and include it in design and test exposures when significant.
c. Exposure levels. Measure exposure levels. Where levels vary between serial number items, use themaximum values.
d. Exposure durations. Determine exposure durations from the manufacturing and/or maintenanceprocesses. Where durations vary between serial number items, use the maximum values.
Downloaded from http://www.everyspec.com on 2012-06-04T5:34:26.
MIL-STD-810F1 January 2000ANNEX A
METHOD 514.5
514.5A-2
2.1.2 Category 2 - Shipping and handling.
Parts, subassemblies, and materiel are subject to vibration of handling and transportation within and betweenmanufacturing and maintenance facilities. If handling and transportation are identical for all items (including testarticles), this exposure is common and testing is not required. However, evaluate this environment and include it indesign calculations when significant. When there are significant differences between exposures to different serialnumber items (lots), select vibration test articles from those items that experience the maximum vibration exposure.
a. Exposure levels. Where transportation is by normal commercial means, use the applicable guidance ofAnnex A, paragraph 2.2. For other conditions, measure exposure levels.
b. Exposure durations. Where transportation is by normal commercial means, use the applicable guidanceof Annex A, paragraph 2.2. Determine exposure durations from manufacturing and maintenanceplanning.
2.1.3 Category 3 - Environmental Stress Screen (ESS).
Parts, subassemblies, and materiel are often subject to ESS vibration exposures during manufacturing andmaintenance. While exposure levels are identical for each like item, exposure times are not. Items can be subjectedto multiple cycles of ESS prior to production acceptance. Further, exposures are often significant with respect tovibratory fatigue. Include maximum allowable exposures in design calculations and as environmental testpreconditioning.
a. Exposure levels. Use specified exposure levels for part, subassembly, and materiel ESS.
b. Exposure durations. Use the maximum allowable production and maintenance exposure durations forpart, subassembly, and materiel ESS.
2.2 Transportation.
a. Test item configuration. In all transportation exposures, configure the test item (packaged or not) asappropriate for the specific transportation phase. The following criteria are defined as inputs topackaged (or transportation configured) materiel. Use test items that are real materiel in real packaging.Making a vibration measurement on a simulated (dummy) item and comparing this to other vibrationexposures of the materiel life cycle is generally not adequate. See paragraph 1.3.b in the front part of thismethod, and Annex B, paragraph 2.4.
b. Configuration variation with transportation phase. Packaging is sometimes reconfigured for differenttransportation phases. For example, shipping containers may have low frequency shock isolation systemsto protect against dropping and bumping while loading and unloading. This low frequency system maybe bypassed by blocking or bracing when the container is loaded in the cargo area of the transportvehicle. The guidance provided below is for the vibration portion of the environment while beingtransported by various vehicles. See method 516.5 for guidance on shock environments.
c. Shock or vibration isolation. Materiel as packaged for shipment should not have very low resonantfrequencies (see Annex B, paragraph 2.4.2). Otherwise, damage due to impacting of fixed andsuspended elements or over-extension of suspension elements is likely. Packaging/configuring fortransport should include blocking softly suspended internal elements to prevent low frequency relativemotion between suspended elements and surrounding structures. The minimum suspension frequencyshould be two times the frequency of any low frequency spike or hump in the input spectra. In addition,the minimum suspension frequency of materiel packaged for transport on fixed wing aircraft should be20 Hz (see Annex A, paragraphs 2.2.4 and 2.2.5).
d. Materiel orientation. When packaged materiel orientation is fixed relative to the transportation vehicle,vibration exposures should be related to vehicle orientation (e.g., vertical, longitudinal, transverse).When orientation within the vehicle can vary, vibration exposures should be derived from envelopes ofpossible orientations (e.g., longitudinal and transverse combined, vertical).
Downloaded from http://www.everyspec.com on 2012-06-04T5:34:26.
MIL-STD-810F1 January 2000ANNEX A
METHOD 514.5514.5A-3
Note: Annex A, paragraph 2.2.3, below, for truck/trailer large assembly cargo can be tailored to any cargo size ortiedown configuration when high accuracy of ground vehicle transport environmental measurement or test isrequired.
2.2.1 Category 4 - Truck/trailer/tracked - restrained cargo.
These transportation environments are characterized by broadband vibration resulting from the interaction of vehiclesuspension and structures with road and surface discontinuities. Representative conditions experienced on movingmateriel from point of manufacture to end-use are depicted in Part One, figure 4-2. This environment may bedivided into two phases, truck transportation over U.S. highways and mission/field transportation. Mission/fieldtransportation is further broken down into two-wheeled trailer/wheeled vehicles and tracked vehicle categories.
a. Truck transportation over U. S. highways. This involves movement from the manufacturer’s plant to anycontinental United States storage or user installation. (Data are available for U.S. roads but not for roadsin other countries.) This movement is usually accomplished by large truck and/or tractor-trailercombination. Mileage for this transportation generally ranges from 3200 to 6400 kilometers (2000 to4000 miles) over improved or paved highways.
b. Mission/field transportation. This involves movement of materiel as cargo where the platform may betwo-wheeled trailers, 2-1/2 to 10 ton trucks, semi-trailers, and/or tracked vehicles. Typical distances forthis phase are 500 to 800 kilometers (300 to 500 miles). Road conditions for mission/field support differfrom the common carrier in that, in addition to the paved highway, the vehicles will traverse unimprovedroads and unprepared terrain (off-the-road) under combat conditions.
c. Exposure levels. Whenever possible, measure vibration on the transport vehicles using the roadconditions (surfaces, speeds, and maneuvers) of the materiel’s Life Cycle Environment Profile. Includerealistic load configurations (approximately 75% of the vehicle load capacity by weight). Use these datato develop exposure levels (see examples in ITOP 1-2-601 (reference d)). Alternatively, derive exposurelevels as discussed below.
(1) Truck transportation over U. S. highways. Derive exposure levels from Annex C, figure 514.5C-1.These figures are based upon data measured at the cargo floor of seven different configurations oftrucks and semitrailer combinations. Both conventional suspensions and air-cushioned suspensionsare represented. The data were collected from typical interstate highways with rough portions aspart of the database.
(2) Two-wheeled trailer and wheeled vehicles. Exposures are shown in Annex C, figures 514.5C-2 and514.5C-3. Both trucks and two-wheeled trailers are utilized between the Forward Supply Point(FSP) and at the Using Unit (USU). Trailer vibration levels are significantly higher; use these torepresent the wheeled vehicle environment. However, when materiel is too large for the two-wheeled trailer, use the composite wheeled levels.
(3) Tracked vehicles. A representative tracked vehicle spectrum shape is given in Annex C, figure514.5C-4. Note that this figure is based on sweeping across the narrow band spikes as discussed inreference f that also contains detailed criteria for some tracked vehicles. Testing to this requirementwill require a narrow band random-on-random vibration exciter control strategy.
d. Exposure durations. Base durations on the materiel Life Cycle Environment Profile. Annex C, table514.5C-I shows the typical field/mission transportation scenario with the most typical vehicles.
(1) Truck transportation over U. S. highways. The exposure duration for common carrier/truck is 60minutes per 1609 kilometers (1000 miles) of road travel (per axis). (See ITOP 1-1-050 (reference e)for guidance.)
(2) Two-wheeled trailer and wheeled vehicles. The exposure duration for two-wheeled trailer is 32minutes per 51.5 kilometers (32 miles) traveled (per axis) and the exposure duration for compositewheeled vehicle is 40 minutes per 804.6 kilometers (500 miles) traveled (per axis).
Downloaded from http://www.everyspec.com on 2012-06-04T5:34:26.
MIL-STD-810F1 January 2000ANNEX A
METHOD 514.5
514.5A-4
(3) Tracked vehicles. Use environmental life cycle durations. See reference f for further guidance.
2.2.2 Category 5 - Truck/trailer/tracked - loose cargo.
The cargo has freedom to bounce, scuff and collide with other cargo and with the sides of the vehicle. The loosecargo environment includes conditions experienced by cargo transported in a vehicle traversing irregular surfaces.This test replicates the repetitive random shock environment incurred by cargo transported under these conditions.This test does not address general cargo deck vibration or individual shocks or impacts inflicted during handling oraccidents.
a. Exposure levels. This environment is a function of package geometry and inertial properties, vehiclegeometry, and the complex vibratory motion of the vehicle cargo bed. No database exists for inputvibration to simulate this environment. However, the test discussed below will provide a generallyconservative simulation of the environment.
(1) Two methodology studies (references g and h) determined that a standard package tester (300 rpm,circular synchronous mode) (Annex C, figure 514.5C-5) provides a reasonable simulation of theloose cargo transportation environment. The movement of the package tester bed is a 2.54 cm (1.0inch) diameter orbital path at 5 Hz (each point on the bed moves in a circular path in a planeperpendicular to the horizontal plane). The test item is allowed to collide with established test setuprestraints.
(2) This test is not tailorable and cannot be directly interpreted in terms of materiel design requirements.
b. Exposure durations. A duration of 20 minutes represents 240 km (150 miles) of transportation(encompassing truck, two-wheeled trailer, and tracked vehicle), over the various road profiles found inthe transport scenario from the Corps storage area to a Using Unit (see Annex C, table 514.5C-I).Scenario times in the materiel Life Cycle Environment Profile should be ratioed to define exposure times.
2.2.3 Category 6 - Truck/trailer/tracked - large assembly cargo.
For large materiel, it is necessary to recognize that the materiel and the transport vehicle vibrate as a flexible system(see Annex B, paragraph 2.4). In such cases, transportation conditions may be simulated using the actual transportvehicle as the vibration exciter. The test assemblage may consist of materiel mounted in a truck, trailer, trackedvehicle, or materiel mounted in a shelter that is then mounted on a truck, trailer, or dolly set. Ensure the materiel ismounted and secured on the transport vehicle(s) that is used during actual transport. Provide instrumentation tomeasure vertical vibration of the materiel mounts, cargo floor, or shelter floor. Provide additional instrumentation asneeded to determine the vibration of the materiel and critical subassemblies.
Note: This procedure is suitable for measuring or testing for the transportation or ground mobile environment ofmateriel of any size or weight. For smaller cargo loads, the assemblage should be either the specific design cargoload or the most critical cargo load(s) for the transport vehicle as appropriate.
a. Exposure levels. The assemblage should be in its deployment configuration and mounted on the vehiclefor which it was designed. If the assemblage is to be contained in a shelter, it should be installed withinthe shelter in the deployment configuration. The exposure consists of traversing the transport vehicleover a prepared test course. The test course and vehicle speeds should represent the transportationterrain/road conditions of the Life Cycle Environment Profile. Note that transport vehicle speeds may belimited either by the vehicle's safe operating speed over a specific course profile or by the speed limit setfor the specific course. An example based on test surfaces available at the U.S. Army Aberdeen TestCenter (reference b) is as follows. Drive the test vehicle over each of the following test surfaces.Operate at the specified speeds unless these exceed safe driving conditions. In this case, define andcoordinate maximum safe operating speeds with the authority responsible for the environmentalrequirements.
(1) Coarse washboard (150 mm waves 2 m apart) 8 km/hr
Downloaded from http://www.everyspec.com on 2012-06-04T5:34:26.
MIL-STD-810F1 January 2000ANNEX A
METHOD 514.5514.5A-5
(2) Belgian block 24 km/hr
(3) Radial washboard (50 mm to 100 mm waves) 24 km/hr
(4) Two inch washboard (50 mm) 16 km/hr
(5) Three inch spaces bump (75 mm) 32 km/hr
b. Exposure durations. Ensure the durations (distances over) of each test course segment/speedcombination are in accordance with the scenario(s) of the Life Cycle Environment Profile.
2.2.4 Category 7 - Aircraft - jet.
Cargo vibration environments on jet aircraft are broadband random in nature. The maximum vibrations are usuallyengine exhaust noise generated and occur during takeoff. Levels drop off rapidly after takeoff to lower level cruiselevels that are boundary layer noise generated. These sources are discussed in Annex A, paragraph 2.3.1.
a. Low frequency vibration. Vibration criteria typically begins at 15 Hz. At frequencies below 15 Hz, it isassumed that the cargo does not respond dynamically (see Annex B, paragraph 2.4). Airframe lowfrequency vibration (gust response, landing impact, maneuvers, etc.) is experienced as steady inertialloads (acceleration). That part of the environment is included in method 513.5.
b. Large cargo items. Cargo items that are large relative to the airframe in dimensions and/or mass mayinteract with aircraft structural dynamics (see Annex B, paragraph 2.4). This is particularly true if themateriel has natural frequencies below 20 Hz. This interaction may have serious consequences withregard to aircraft loads and flutter. Evaluate materiel that fits this description by the aircraft structuralengineers prior to carriage. Contact the System Program Office responsible for the aircraft type for thisevaluation.
c. Exposure levels.
(1) Vibration qualification criteria for most jet cargo airplanes are available through the System ProgramOffice responsible for the aircraft type. These criteria are intended to qualify equipment forpermanent installation on the airplanes and are conservative for cargo. However, function criteriafor equipment located in the cargo deck zones can be used for cargo if necessary. The guidance ofAnnex A, paragraph 2.3.1 can also be used to generate conservative criteria for specific airplanesand cargo.
(2) Annex C, figure 514.5C-6 shows the cargo compartment zone functional qualification levels of theC-5, C/KC-135, C-141, E-3, KC-10, and T-43 aircraft. Also, shown on the figure is a curve labeled"General Exposure." These are the recommended criteria for jet aircraft cargo. This curve is basedon the worst case zone requirements of the most common military jet transports so that even thoughit does not envelope all peaks in the various spectra, it should still be mildly conservative for cargo.Also, since it does not allow the valleys in the individual spectra, it should cover other jet transportswith different frequency characteristics. The envelope represents take-off, the worst case for cargo.Vibration during other flight conditions is substantially less.
d. Exposure durations. When Annex C, figure 514.5C-6 is used, select a duration of one minute pertakeoff. Determine the number of takeoffs from the Life Cycle Environment Profile. Otherwise, takedurations from the Life Cycle Environment Profile.
2.2.5 Category 8 - Aircraft - propeller.
Cargo vibration environments on propeller aircraft are dominated by relatively high amplitude, approximatelysinusoidal spikes at propeller passage frequency and harmonics. Because of engine speed variations, the frequenciesof the spikes vary over a bandwidth. There is wide band vibration at lower levels across the spectra. This wide bandvibration is primarily due to boundary layer flow over the aircraft. These sources are discussed in Annex A,paragraph 2.3.2.
Downloaded from http://www.everyspec.com on 2012-06-04T5:34:26.
MIL-STD-810F1 January 2000ANNEX A
METHOD 514.5
514.5A-6
a. Low frequency vibration. Vibration criteria typically begin at 15 Hz. At frequencies below 15 Hz it isassumed that the cargo does not respond dynamically (see Annex B, paragraph 2.4). Airframe lowfrequency vibration (gust response, landing impact, maneuvers, etc.) are experienced as steady inertialloads (acceleration). That part of the environment is included in method 513.
b. Large cargo items. Cargo items that are large relative to the airframe in dimensions and/or mass mayinteract with aircraft structural dynamics (see Annex B, paragraph 2.4). This is particularly true if themateriel has natural frequencies below 20 Hz. This interaction may have serious consequences withregard to aircraft loads and flutter. Materiel that fits this description must be evaluated by aircraftstructural engineers prior to carriage. Contact the System Program Office responsible for the aircrafttype for this evaluation.
c. Exposure levels. Contact the System Program Office responsible for the aircraft for vibration criteria. Ifno criteria are available, measurements of cargo deck vibration in the aircraft are recommended. As alast resort the guidance of Annex A, paragraph 2.3.2 can be used.
d. Exposure durations. Take durations from the Life Cycle Environment Profile.
2.2.6 Category 9 - Aircraft - helicopter.
a. Environment characterization. Vibration of cargo carried in helicopters is characterized by a continuouswideband, low-level background with strong narrowband peaks superimposed. This environment is acombination of many sinusoidal or near sinusoidal components due to main and tail rotors, rotatingmachinery and low-level random components due to aerodynamic flow. These sources are discussed inAnnex A, paragraph 2.3.3.
b. Sling loads. Cargo carried as sling loads below a helicopter is normally subjected to low level randomvibration due to turbulent flow around the cargo with narrow band peaks due to helicopter main rotorblade passage. In addition, there will be low frequency (primarily vertical) motions due to the slingsuspension modes (similar to vibration isolator modes, see Annex B, paragraph 2.4.2). Choose slingsbased on sling stiffness and suspended mass such that suspension frequencies (fs) do not coincide withhelicopter main rotor forcing frequencies (f i). Ensure suspension frequencies are not within a factor oftwo of forcing frequencies (fs < fi / 2 or fs > 2 fi). Determine main rotor forcing frequencies (shaftrotation frequency, blade passage frequency, and harmonics) for several helicopters from Annex C, table514.5C-IV. When inappropriate combinations of cargo and slings are used, violent vibration can occur.The cargo is likely to be dropped to protect the helicopter.
c. Exposure levels.
(1) Helicopter internal cargo vibration is a complex function of location within the helicopter cargo bayand the interaction of the cargo mass and stiffness with the helicopter structure. Measurements ofthe vibration of the cargo in the specific helicopter are necessary to determine vibration with anyaccuracy. Approximate criteria may be derived from Annex A, paragraph 2.3.3. A revised versionof reference f, scheduled for 1998 release, contains tailored criteria for specific helicopters.
(2) There is no current source of data to define slung cargo vibration levels. However, these levelsshould be low and should not be a significant factor in design of materiel that has a reasonabledegree of ruggedness. Materiel that has been designed for vibration levels and durations equal to orexceeding the suggested minimum integrity test of Annex A, paragraph 2.4.1 should not be affectedby this environment.
(3) Exposure durations. Take durations from the Life Cycle Environment Profile or from reference f.
2.2.7 Category 10 - Ship - surface ship.
The vibration environment of cargo carried in ships is fundamentally the same as for materiel installed on ships. SeeAnnex A, paragraph 2.3.10.
Downloaded from http://www.everyspec.com on 2012-06-04T5:34:26.
MIL-STD-810F1 January 2000ANNEX A
METHOD 514.5514.5A-7
a. Exposure levels. See Annex A, paragraph 2.3.10.
b. Exposure durations. See Annex A, paragraph 2.3.10.
2.2.8 Category 11 - Railroad - train.
Cargo vibration levels for rail transport are generally low in level and moderately wideband. Vertical axis vibrationis typically more severe than lateral and longitudinal. See ITOP 1-1-050 (reference e).
a. Exposure levels. Annex C, figure 514.5C-7 provides a general definition of railcar vibration. The levelsare such that this environment will not significantly affect materiel or packaging design in most cases. Inthose cases where the levels of Annex C, figure 514.5C-7 are significant to materiel, take measurementsto determine the actual environments.
b. Exposure durations. Take durations from the Life Cycle Environment Profile.
2.3 Operational Service.
This section applies to materiel installed in a vehicle, aircraft store, turbine engine, or carried by personnel. Suchmateriel may be permanently installed or removable.
2.3.1 Category 12 - Fixed wing aircraft - jet aircraft.
The vibration environment for materiel installed in jet aircraft (except engine-mounted, see Annex A, paragraph2.3.11 and gunfire-induced, see method 519.5) stems from four principal mechanisms. These are (1) engine noiseimpinging on aircraft structures; (2) turbulent aerodynamic flow over external aircraft structures, (3) turbulentaerodynamic flow and acoustic resonance phenomena within cavities open to the external airflow, particularly openweapon bays, and (4) airframe structural motions due to maneuvers, aerodynamic buffet, landing, taxi, etc.Vibration can also be produced by installed materiel items. These vibrations are generally important only locally ator near the source and may not be significant even in that local area.
a. Airframe structural response. Airframe structural motions are the responses of flexible airframestructures to transient events. Examples of such events are landing impact, arrested landings, catapult,rebound of wings and pylons when heavy stores are ejected, and separated flow or shed vortex excitationof flight surfaces during maneuvers. Catapult take-off and arrested landing also result in structuralmotions. These are included in method 516.5 as transient vibrations. Airframe structural motions aremost important for the outer regions of flexible structures (i.e., outer 1/2 of wings, empennage, pylons,etc.). These vibrations are characteristic of the particular airframe involved and must be evaluatedthrough measured data. In other areas of the airframe (fuselage, inboard wing, etc.) these vibrations arerelatively mild and are generally covered by the fallback criteria described below or by minimumintegrity criteria (Annex A, paragraph 2.4.1).
b. Jet noise and aerodynamically induced vibration. Jet noise induced vibration is usually dominant invehicles that operate at lower dynamic pressures, i.e., limited to subsonic speeds at lower altitudes andtransonic speeds at high altitudes (reference i). Aerodynamically induced vibration usually predominatesin vehicles that operate at transonic speeds at lower altitudes or supersonic speeds at any altitude(references j and k).
c. Cavity noise induced vibration. Where there are openings in the aircraft skin with airflow across theopening, the corresponding cavity within the aircraft is subject to very high levels of aerodynamic andacoustic fluctuating pressures. This is because of general flow disruption and, more importantly, to aphenomenon known as cavity resonance. The fluctuating pressures can be crudely predicted analytically(see references l and m) and somewhat more accurately measured in wind tunnel measurements. Flighttest measurement is the only accurate method available to determine these pressures. Further, given thepressures, it is very difficult to predict the resulting vibration and no simple method is available. This
Downloaded from http://www.everyspec.com on 2012-06-04T5:34:26.
MIL-STD-810F1 January 2000ANNEX A
METHOD 514.5
514.5A-8
vibration should be measured. These vibrations are likely to be important in the local areas surroundingsmall cavities such as flare launchers, cooling air exhaust openings, etc. With large cavities (particularlyweapons bays), the resulting vibration is likely to be a major element of the overall aircraft environment.Method 515.5 contains an acoustic test simulating this environment. That procedure may be used formateriel located inside the cavity but it is not suitable for simulating the vibration environments for areasnear the cavity. Where cavities remain open continuously, the vibration is continuous. When doors orcovers open, there will be a transient vibration. As the doors remain open, there is a steady statevibration, followed by another transient vibration as the doors close. When doors open and closequickly, the entire event can sometimes be characterized as a single transient vibration.
d. Materiel induced vibration. In addition, installed materiel can produce significant vibration. Anymateriel that involves mechanical motion may produce vibration. This is particularly true of those thathave rotating elements such as motors, pumps, and gearboxes. The vibration output of installed materielvaries widely and is highly dependent on the mounting as well as the characteristics of the materiel.There is no basis for predicting local environments due to materiel. Materiel items must be evaluatedindividually. General aircraft environments as discussed above can generally be expected to cover thecontribution of installed materiel.
e. Exposure levels. Vibration criteria in the form of qualification test levels (see Annex B, paragraph 2.1.2)have been established for most airplanes developed for the military. Obtain these criteria through theprogram office responsible for the particular aircraft. This is the recommended basis for developingexposure levels. In cases where satisfactory criteria are not available, measured data may be availablethrough the aircraft program office. Otherwise, measurements of actual vibrations are recommended.
(1) As a last resort, the guidance of Annex C, table 514.5C-III and figure 514.5C-8 may be used todevelop levels. Define both jet noise induced and aerodynamic noise induced levels for each flightcondition of interest. The level for that flight condition is the envelope of the two.
(2) This applies to materiel that is small (light) relative to the structure that supports it. As materiel getsheavier, dynamic interaction with supporting structures increases. For typical full-scale mannedaircraft, this effect is usually ignored for materiel weighing less than 36 kg (80 lb). A simple massloading factor is included in Annex C, table 514.5C-III for heavier materiel. However, evaluate theinstallation of materiel weighing more than roughly 72 kg (160 lb.) for dynamic interaction. (SeeAnnex B, paragraph 2.4.)
(3) Materiel mounted on vibration isolators (shock mounts) is dynamically uncoupled from the supportstructure. Unless it is very large (heavy) relative to the support structure (see Annex B, paragraph2.4.2), its influence on vibration of the support structure will be minimal and the mass loading factordiscussed above does not apply. Use the exposure levels discussed above as input to the vibrationisolators.
f. Exposure durations. Take durations from the Life Cycle Environment Profile.
2.3.2 Category 13 - Fixed wing aircraft - propeller aircraft.
The vibration environment for materiel installed in propeller aircraft (except engine-mounted, see Annex Aparagraph 2.3.11, and gunfire induced, see method 519) is primarily propeller induced. The vibration frequencyspectra consists of a broadband background with superimposed narrow band spikes (see references n through t). Thebackground spectrum results from various random sources (see Annex A, paragraph 2.3.1) combined with manylower level periodic components due to the rotating elements (engines, gearboxes, shafts, etc.) associated withturboprops. The spikes are produced by the passage of pressure fields rotating with the propeller blades. Theseoccur in relatively narrow bands centered on the propeller passage frequency (number of blades multiplied by thepropeller rpm) and harmonics.
a. Constant propeller speed. Most current propeller aircraft are constant-speed machines. This means thatrpm is held constant and power changes are made through fuel flow changes and variable-pitch blades,
Downloaded from http://www.everyspec.com on 2012-06-04T5:34:26.
MIL-STD-810F1 January 2000ANNEX A
METHOD 514.5514.5A-9
vanes, and propellers. These machines produce the fixed frequency spikes of Annex C, figure 514.5C-9.These spikes have a bandwidth because there is minor rpm drift, the vibration is not pure sinusoidal(Annex B, paragraph 2.3.3), and to account for materiel resonant frequency differences as modeled ortested and as manufactured and installed on the aircraft.
b. Varying propeller speed. When propeller speed varies during operation, a spectrum or set of spectrasimilar to Annex C, figure 514.5C-9 is required to define vibration levels. The spikes on these spectrawould have bandwidths encompassing the propeller speed variations of operation. Separate spectra maybe required to describe individual mission segments.
c. Source dwell testing. These vibration environments can be approximated in the laboratory by the sourcedwell test described in Annex B, paragraph 2.3.3. Vibration problems in this type of environment aretypically associated with the coincidence of materiel vibration modes and excitation spikes. Intelligentdesigns use notches between spikes as safe regions for materiel vibration modes. It is particularlyimportant to assure that vibration isolation frequencies do not coincide with spike frequencies. Sourcedwell tests minimize the likelihood that materiel will be overstressed at non-representative conditions,and ensure reasonable design provisions will not be subverted.
d. Exposure levels. Whenever possible, use flight vibration measurements to develop vibration criteria. Inthe absence of flight measurements, the levels of Annex C, table 514.5C-II can be used with the spectraof Annex C, figure 514.5C-9. These levels are based on C-130 and P-3 aircraft measurements(references p through t) and are fairly representative of the environments of these aircraft. The decline ofspike acceleration spectral density with frequency is based on data analyzed in a spectral density format.
e. Exposure durations. Take durations from the Life Cycle Environment Profile.
2.3.3 Category 14 - Rotary wing aircraft - helicopter.
Helicopter vibration (for engine-mounted materiel, see Annex A, paragraph 2.3.11, and for gunfire inducedvibration, see method 519.5) is characterized by dominant peaks superimposed on a broadband background, asdepicted in Annex C, figure 514.5C-10. The peaks are sinusoids produced by the major rotating components (mainrotor, tail rotor, engine, gearboxes, shafting, etc.). The peaks occur at the rotation speed (frequency) of eachcomponent (i. e., 1P for main rotor, 1T for tail rotor, and 1S where S designates a locally predominate rotatingelement) and harmonics of these speeds (e. g., 2P, 3P, 4P). The broadband background is a mixture of loweramplitude sinusoids and random vibrations due to sources such as aerodynamic flow noise (see Annex A, paragraph2.3.1). Vibration levels and spectrum shapes vary widely between helicopter types and throughout each helicopter,depending on strength and location of sources and the geometry and stiffness of the structure. Thus, the need formeasured data is acute.
a. Broadband background. The broadband background is expressed as random vibration for design and testpurposes as a matter of expediency. The definition of and application to design and test of all lower levelsinusoidal and random components is not practical.
b. Dominant sinusoids. The dominant sinusoids are generated by rotating components of the helicopter,primarily the main rotor(s), but also tail rotor, engine(s), drive shafts, and gear meshing. The normaloperating speeds of these components are generally constant, varying less than five percent. However,recent designs have taken advantage of variable rotor speed control that generates a pseudo steady staterotor speed at values between 95 and 110 per cent of the nominal rotor speed. This complicates themateriel design and test process since all rotating component speeds, pseudo or otherwise, should beaccounted for.
c. Variable rotor speeds. Variable speed helicopters are also possible; in this case they also account for thefull range of rotation speeds. A range of 0.975 times minimum speed to 1.025 times maximum speed isrecommended.
d. Design practice. An obvious requirement for helicopter materiel design is to avoid a match or nearmatch between materiel resonant frequencies and the dominant sinusoids. A minimum clearance between
Downloaded from http://www.everyspec.com on 2012-06-04T5:34:26.
MIL-STD-810F1 January 2000ANNEX A
METHOD 514.5
514.5A-10
operating speed and resonant frequency of at least five per cent is recommended. It is important to notethat helicopter frequencies and amplitudes are unique for each helicopter type and, to some degree, eachmodel of a given type.
e. Exposure levels.
(1) For reasons stated above, the exposure levels for materiel installed in helicopters should be derivedfrom field measurement (a revised version of reference f due for release in 1998 contains criteria forspecific helicopters). When measured data are not available, levels can be derived from Annex C,figures 514.5C-10 and 514.5C-11, and table 514.5C-IV. These levels are intended to envelopepotential worst-case environments. They do not represent environments under which vibrationsensitive materiel should be expected to perform to specification. However, the materiel is expectedto survive undamaged and to function to specification at the completion of the test. Materiel costsare often strongly influenced by the performance required in a vibration environment. Consequently,field measurement based vibration criteria can be very important.
(2) To determine levels, divide the aircraft into zones as shown in Annex C, figure 514.5C-11. Use thesource frequencies of the main rotor in determining the values of A1, A2, A3, and A4 (Annex C,table 514.5C-IV) for all materiel locations except those defined below. For materiel located in thehorizontal projection of the tail rotor disc, use the source frequencies of the tail rotor. In addition,ensure criteria for materiel located in an overlap of main and tail rotor zones includes both sets offrequencies. Fundamental main and tail rotor source frequencies of several helicopters are given inAnnex C, table 514.5C-IV. For materiel located on or in close proximity to drive train componentssuch as gearboxes and drive shafts, use the source frequencies of that drive train component (i.e.,gear mesh frequencies, shaft rotational speeds). Determine these from the drive train data for theparticular helicopter.
f. Exposure durations. When measured data are used to establish exposure levels, take durations from theLife Cycle Environment Profile. When levels are derived from Annex C, figures 514.5C-10 and 514.5C-11, and table 514.5C-IV, use a duration of four (4) hours in each of three (3) orthogonal axes for a totaltest time of twelve (12) hours. This represents a 2600-hour operational life. The fatigue relationshipshown below may be used to trade test time for exposure level. Make the calculation separately for eachsinusoid and each segment of the broadband background.
t f = 4.0 (A D / A T)M
where:
t f = actual test time per axis
A D = default test amplitude
A T = actual test amplitude
M = 6 (materiel exponent for sinusoidal vibration, see Annex B, paragraph 2.2)
2.3.4 Category 15 – Aircraft stores – assembled, jet aircraft.
Assembled jet aircraft stores may encounter three distinct vibration environments; external captive carriage, internalcaptive carriage, and free flight.
Note: High frequency vibration (beginning at or below 1000 Hz) cannot be practically transmitted to a storemechanically. Combine store vibration and acoustic testing (method 523.2). These test excitations in combinationproduce a much more realistic test.
a. Captive flight – external carriage. Vibration (for gunfire induced vibration see method 519.5)experienced by a store carried externally on a jet aircraft arises primarily from four sources:
Downloaded from http://www.everyspec.com on 2012-06-04T5:34:26.
MIL-STD-810F1 January 2000ANNEX A
METHOD 514.5514.5A-11
(1) Engine noise is produced by turbulence in the boundary of the jet exhaust plume. This turbulence ismaximum at initiation of takeoff when the velocity difference between the jet and ambient air ismaximum. This source is generally of primary importance when the store is carried on an aircraftthat uses pure jet or very low bypass engines since these engines have the highest exhaust velocities.Further, it is important at higher frequencies because sources discussed below dominate at lowerfrequencies (references u, v, and w).
(2) In-flight store vibration is primarily caused by aerodynamic turbulence distributed over the surfaceof the store.
(a) In single carriage, excitation is relatively independent of the carrying aircraft and mountinglocation on the aircraft. Local flow disturbances such as pylon wakes will vary considerablybetween aircraft and between store stations on a given aircraft. In general, these do not greatlyeffect overall store vibration. But, they may severely effect local structures such as tail finsthat, in turn, may increase levels of store vibration. See Annex A, paragraph 2.4.2 forguidance on local flow effects. When stores are carried close together, the turbulence fieldaround each is increased. A store carried behind another store is exposed to the turbulencegenerated by the forward store.
(b) An extensive program of measurement and analysis was accomplished to characterize thisenvironment (references u, v, and w). Vibratory excitation is influenced by storeconfiguration, structural configuration, mass density, and flight dynamic pressure. The highfrequency portion of the resulting vibration is best represented by a combination ofmechanical vibration and the acoustic noise exposures of method 523.2. The low and mediumfrequency portion of this environment is better simulated by mechanical excitation. Thestudies mentioned above resulted in a method to accomplish this defining the responsevibration of the store rather than specifying input vibration. Note that this method alsoincludes low frequency vibration transmitted from the carrying aircraft (see below).
(3) Vibrations of the carrying aircraft are transmitted to the store through the attaching structures. Thetotal vibrating system (aircraft, pylon, bomb rack, and store) is a low frequency system. That is, thelowest natural frequency of the system is typically below 20 Hertz and the store is isolated from highfrequency aircraft vibration. Depending on the particular circumstances, these vibrations are oftenbest represented as transient vibration (see Annex B, paragraph 2.3.4).
(a) The low frequency vibration of the airframe transmitted to the store is not separable in thegeneral case from the low frequency turbulence generated vibration. This vibration is accountedfor by the method discussed under “Aerodynamic turbulence” above.
(b) Flight test measurements on the F-15 with various external stores, (reference x) have shownintense, very low frequency vibrations associated with aircraft buffet during high angle of attackmaneuvers. Other aircraft, such as F-14, F-16, and F-18, or next generation fighters, have thepotential to produce intense buffet vibrations during maneuvers.
(c) The F-15 buffet maneuver envelope is roughly bounded by speeds of 0.7 to 1.0 Mach andaltitudes of approximately 3 to 10.7 kilometers (10,000 to 35,000 ft). Flight test measurementshave shown the maximum F-15 buffet vibration to occur in the flight regime of 0.8 to 0.9 Mach,4.6 to 7.6 km (15,000 to 25,000 ft) altitude, 8q to 12q angle of attack, and dynamic pressure lessthan 26.3 kN�m2 (550 lb�ft2). Similar measurements on F/A-18 have shown the maximum buffetmaneuver vibration to occur in the regime of 0.85 to 0.95 Mach, 1.5 to 4.6 km (5,000 to 15,000ft.), 8q to 10q angle of attack, and dynamic pressure less than 33.5 kN�m2 (700 lb�ft2). Althoughthe vibration levels during high-performance maneuvers are very intense, they generally do notlast for more than 10 seconds, reaching maximum in less than a second and deteriorating in 5 to10 seconds. Typically F-15 external stores will experience 30 seconds of maneuver buffetvibration for each hour of captive-carriage flight.
Downloaded from http://www.everyspec.com on 2012-06-04T5:34:26.
MIL-STD-810F1 January 2000ANNEX A
METHOD 514.5
514.5A-12
(d) Buffet vibration is typically concentrated between 10 and 50 Hz. Vibration response of thestore is dominated by store structural resonances. Store loads that occur at frequencies belowthe lowest store natural frequency are effectively static loads. Buffet levels vary over a widerange on a given aircraft as well as between aircraft. Thus, buffet vibration requirements shouldbe derived from in-flight vibration measurement when possible. As an alternative tomeasurements, the lowest store vibratory modes can be exercised at conservative levels to showthat the store will be robust enough for any encountered buffet vibration. Note that this does notcover the static loads associated with buffet. In order to include these loads, it is necessary toduplicate flight measured dynamic bending moments as discussed as an option in the frontsection of this method (paragraph 4.2.1.2, Force control strategy). This would require extendingthe test frequency down to the lowest frequency of airplane buffet response and must be done incoordination with the responsible strength and loads engineers.
(4) Stores are also susceptible to vibration generated by internal materiel and local aerodynamic effects.There are no accepted criteria or methodology for predicting these environments. However, theseenvironments can be dominating vibration sources and should not be ignored. Whenever they arepresent, they should be accounted for through development tests and measurements.
(a) Internal materiel vibration is typically produced by rotating elements such as electric orhydraulic motors. Any device that generates or incorporates physical motion can producevibration. Ram air turbines (RAT) are sometimes used to generate electrical or hydraulicpower. A RAT can produce high levels of rotating element vibration in addition to severeaerodynamic turbulence at and behind the rotating blades.
(b) Acoustic resonance of simple cavities is typically handled as an acoustic environment (seemethod 515.5). Any hole, opening, inlet, etc. that allows airflow to enter the store or a cavity inthe store can produce high intensity acoustic resonance responses.
b. Captive flight – internal carriage. There are two distinct vibration environments for stores carried in aclosed, internal, aircraft bay. These environments occur when the bay is closed to the aircraft externalenvironment and when the bay is open to this environment. Aircraft capable of high angle of attackmaneuvers may be susceptible to buffet. Since buffet vibration is mechanically transmitted to the store,the bay will provide no protection. Thus the buffet vibration method discussed above applies.
(1) The general vibration environment of a store in a closed bay is very mild. The store is protectedfrom the jet engine noise and aerodynamic turbulence environments and isolated from aircraftvibration. If a store is qualified for external carriage on any jet aircraft, this should more thanadequately account for this case. There is no known method to predict this environment for thegeneral case. Measured data may be available for specific aircraft, but generally measurements willbe necessary if this environment must be defined.
(2) When the bay is opened in flight, a dramatic event occurs. This event is referred to as cavityresonance (references l and m) and results in high levels of turbulence inside the bay. This is wideband turbulence, and unless suppression devices are installed in the bay, with very high spikes acrossthe spectrum. The low frequency portions of the disturbance are not likely to drive the store becausedisturbance wavelengths greatly differ from store dimensions. The high frequency part of thespectrum will significantly affect the store. Store vibration resulting from this turbulence cannot beadequately predicted. Acoustic characterizations of the turbulence exist for most active aircraft andthe resulting vibration is best represented by the acoustic noise exposures of method 515.5.
(a) Generally, store flight surfaces (control surfaces, wings, stabilizers, etc.) are small enough(small surface area) and/or stiff enough (lowest resonant frequency above 100 Hz) that they arenot significantly excited by this environment. However, in cases in which the control surfacesof the store are relatively large or soft, they may be excited by the open-bay environment. Inthese cases the store response can result in flight surface failure, high levels of store vibration orboth.
Downloaded from http://www.everyspec.com on 2012-06-04T5:34:26.
MIL-STD-810F1 January 2000ANNEX A
METHOD 514.5514.5A-13
(b) In some instances, a store is carried in one configuration or position until use. Just prior to use,the configuration or position may change, for example, a weapon carried on a rotary launcherinside a weapons bay of a large bomber. The weapon moves from clock position to clockposition as other weapons on the launcher are launched. The weapon is exposed to the bay openenvironment either each time another weapon is launched, or for a relatively long period whileseveral are launched. Another example is a weapon that is extended out of the bay on thelaunch mechanism prior to launch. Here the environment will change considerably withposition. A third example is an optical sensor pod. This type of store can be carried internally,extended into the air stream, configuration changed (e.g., covers over optical windows retract),operated, configuration changed back, and retracted into the closed bay many times in alifetime. Such variations in environment and configuration must be accounted for.
Note: Door opening, position changes, configuration changes, door closing, etc., should be expected to happenrapidly. Each of these events and possibly a whole sequence of events can happen rapidly enough so that theyshould be treated as transient (see Annex B, paragraph 2.3.4 and method 516.5) rather than steady state vibration.
c. Free flight. Vibration will be experienced by stores that are deployed from aircraft, ground vehicles, orsurface ships. The sources of vibration for the free flight environment are engine exhaust noise, vibrationand noise produced by internal equipment, and boundary layer turbulence.
(1) Generally, engine exhaust noise levels will be too low to excite significant vibration in the store.This is because the engine only operates when the ratio of the exhaust velocity to the ambient airspeed is low and (except in unusual cases) the exhaust plume is behind the store.
(2) Vibration produced by onboard materiel can be severe in specific cases. Examples are ram airturbines, engines, and propellers. There is no general basis for predicting store vibrations from suchsources. Each case must be evaluated individually and it is likely that measurements will berequired.
(3) Boundary layer turbulence induced vibration should be as for captive carriage except that storevibration mode frequencies may shift, flight dynamic pressures may be different, and turbulencefrom the carrier aircraft and nearby stores will be absent.
d. Exposure levels. Select test levels and spectra for three of the vibration environments, captive flight, freeflight, and buffet from Annex C, table 514.5C-V and figures 514.5C-12 and 514.5C-13. The use of thesetables and figures is suggested only when there is an absence of satisfactory flight measurements. Exceptfor buffet portions, these criteria are closely based on references u, v, and w. These document the resultsof an extensive study and include a large amount of information and insight. The buffet criteria are basedon reference x and additional measurements and experience with the F-15 aircraft. It represents F-15wing pylon buffet that is the worst known buffet environment. F-15 fuselage store stations buffetenvironments are generally less severe. Criteria for the other environments must be determined for eachspecific case.
e. Exposure durations. Take durations from the Life Cycle Environment Profile.
2.3.5 Category 16 - Aircraft stores - materiel, jet aircraft.
Materiel installed within a jet aircraft store will experience the store vibration discussed in Annex A, paragraph2.3.4. The input exposure levels for materiel within the store are essentially the same as response levels of the store.If gunfire, cavity resonance, buffet-maneuver, and free-flight conditions occur for the store, the materiel will also beexposed to these conditions.
a. Exposure levels. Base vibration criteria on in-flight measurements when possible. If satisfactory flightmeasurements are not available, derive levels from Annex C, table 514.4C-V and figures 514.5C-13 and514.5C-14. Note: use input control for vibration testing of this materiel rather than response control (seeparagraph 4.2.1).
b. Exposure durations. Take durations from the Life Cycle Environment Profile.
Downloaded from http://www.everyspec.com on 2012-06-04T5:34:26.
MIL-STD-810F1 January 2000ANNEX A
METHOD 514.5
514.5A-14
2.3.6 Category 17 - Aircraft stores - assembled/materiel, propeller aircraft.
There is no known source of general guidance or measured data for the vibration of propeller aircraft stores (exceptgunfire induced, see method 519.5). However, since the excitation sources are the same, it seems likely that storevibration will be similar to that of the carrying aircraft. See Annex A, paragraph 2.3.2 and Annex B, paragraph 2.3.3for a discussion of this vibration. Maneuver buffet vibration experienced by stores of highly maneuverable propelleraircraft should be similar to that experienced by jet aircraft stores. See the buffet vibration portion of Annex A,paragraph 2.3.4.
a. Exposure levels. There is no known source of data. For accurate definition of propeller aircraft storevibration, measurement of the actual environment is essential. The criteria of Annex C, table 514.5C-IIand figure 515.5C-9 may be used to develop preliminary estimates of general vibration. The criteria ofAnnex C, figure 514.5C-13 may be applied for maneuver buffet vibration.
b. Exposure durations. Take durations from the Life Cycle Environment Profile.
2.3.7 Category 18 - Aircraft stores - assembled/materiel, helicopter.
Complex periodic waveforms characterize the service environment encountered by assembled stores externallycarried on helicopters. Unlike stores carried on fixed-wing aircraft, externally mounted helicopter stores receivelittle aerodynamic excitation, particularly when compared with the rotor-induced vibration. Thus, most of thevibratory energy reaches the store and materiel through the attachment points between the aircraft and the store.Some excitation, however, is added along the entire store structure due to periodic rotor induced pressurefluctuations. The result is a complex response, unique to the particular aircraft-store configuration. Therefore,realistic definition of the environment depends almost totally upon the use of in-flight vibration measurements. Forstores exposed to gunfire, refer to method 519.5.
a. Exposure levels. Derive exposure levels for helicopter-carried store materiel from field measurements(reference f contains criteria for specific helicopters). When measured data are not available, initialestimates can be derived from Annex C, figures 514.5C-10 and 514.5C-11, and table 514.5C-IV prior toacquisition of field data. These levels are intended as worst-case environments and representenvironments for which it may be difficult to develop vibration sensitive materiel. Materiel costs areoften strongly influenced by the performance required in a vibration environment. Consequently, fieldmeasurement based vibration criteria are very important. To determine levels, locate the store relative tothe helicopter zones as shown in Annex C, figure 514.5C-11. Most stores will be inside a verticalprojection of the main rotor disc and should use the source frequencies of the main rotor in determiningthe values of A1, A2, A3, and A4 (see Annex C, table 514.5C-IV). Fundamental main rotor sourcefrequencies of several helicopters are given in table 514.5C-IV.
b. Exposure durations. When measured data are used to establish exposure levels, take durations from theLife Cycle Environment Profile. When levels are derived from Annex C, figures 514.5C-10 and 514.5C-11, and table 514.5C-IV, use a duration of four (4) hours in each of three (3) orthogonal axes for a totaltime of twelve (12) hours. This represents a 2500-hour operational life. Use the fatigue relationship ofAnnex A, paragraph 2.2 to trade test time for exposure level. Perform the calculation separately for eachsinusoid and each segment of the broadband background.
2.3.8 Category 19 - Missiles - Tactical missiles (free flight).
There is no known source of general guidance or measured data for tactical missile carriage or launch vibrationenvironments. Environments for jet aircraft, propeller aircraft, and helicopter carried missiles are discussed inAnnex A, paragraphs 2.3.4 through 2.3.7. Tactical carriage ground environments are discussed in Annex A,paragraph 2.3.9. Free flight environments are covered in Annex A, paragraphs 2.3.4.c and 2.3.5 in regard to aircraftcarried missiles. These environments should be generally applicable to tactical missiles during free flight missionsegments.
Downloaded from http://www.everyspec.com on 2012-06-04T5:34:26.
MIL-STD-810F1 January 2000ANNEX A
METHOD 514.5514.5A-15
a. Exposure levels. There is no known source of data. For accurate definition of tactical missile storevibration, measurement of the actual environment is essential. The criteria of Annex C, table 514.5C-Vand figure 515.5C-12 and figure 515.5C-14 may be used to develop preliminary estimates of free flightvibration.
b. Exposure durations. Take durations from the Life Cycle Environment Profile.
2.3.9 Category 20 - Ground vehicles - ground mobile.
The ground mobile environment consists of broadband random vibration with peaks and notches. These peaks andnotches are considerably higher and lower than the mean level. (See ITOP 1-2-601.) Terrain, road, and surfacediscontinuities, vehicle speed, loading, structural characteristics, and suspension system all affect this vibration.Note that gunfire criteria (method 519.5) are not applicable since it is based on the response of aircraft-typestructures that are significantly different than ground vehicle structures.
a. Wheeled vehicles. There is presently no analytical model of these environments suitable for generalizedapplication. The spectra of Annex C, figures 514.5C-1 through 514.5C-3 are typical of cargo bedresponses in wheeled vehicles and trailers. This may be unrealistic for installed materiel since it does notconsider vehicle structural response beyond the heavily supported cargo bed. The large assembly cargotest of Annex A, paragraph 2.2.3 can be adapted to provide highly accurate tests for this materiel.
b. Track-laying vehicles. Track-laying vehicle environment (Annex C, figure 514.5C-4) is characterized bythe strong influence of track-laying pattern. This environment is best represented by superimposingnarrowband random (track-laying components) vibration at selected frequencies over a broadbandrandom base.
c. Exposure levels. As discussed above, generalized methodology for estimating ground vehicle vibrationlevels have not been developed. Whenever possible, actual vibration environments should be measuredand the results used to formulate accurate levels and spectrum shapes. When this is not possible or whenpreliminary estimates are made, for wheeled vehicles, the information, levels, and curves presented inAnnex A, paragraphs 2.2.1 and 2.2.2 may be adapted. Numerous measurements have been made andused to develop test criteria for tracked vehicles. Reference f contains criteria that may be used directlyor adapted as necessary.
d. Exposure durations. Take durations from the Life Cycle Environment Profile. Guidance is given inreference f relating durations to exposure levels for various tracked vehicles.
2.3.10 Category 21 - Watercraft - marine vehicles.
Marine vibration spectra have a random component induced by the variability of cruising speeds, sea states,maneuvers, etc., and a periodic component imposed by propeller shaft rotation and hull resonance. Materielmounted on masts (such as antennas) can be expected to receive higher input than materiel mounted on the hull ordeck. The overall ship's structure, materiel mounting structure, and materiel transmissibility (amplifications) greatlyaffect materiel vibration. Development of shipboard materiel should address both the levels of environmental inputsand the coincidence of materiel/mounting resonances and input frequencies. Note that gunfire vibration criteria permethod 519.5 are not applicable since they are based on the response of aircraft type structures that are significantlydifferent than marine vehicle structures.
a. Exposure levels.
(1) Ship/watercraft vibrations are a very complex function of natural environmental forcing function(wave action, wind), induced forcing function (propeller shaft speeds, operation of other equipment,etc.), ship/watercraft structure, materiel mounting structure and materiel response. Even roughlyaccurate general vibration criteria are not available. Use measurements of actual environments todevelop exposure criteria.
Downloaded from http://www.everyspec.com on 2012-06-04T5:34:26.
MIL-STD-810F1 January 2000ANNEX A
METHOD 514.5
514.5A-16
(2) An arbitrary qualification test requirement has been developed for shipboard materiel. This may beused as a crude definition of a total onboard life exposure. It consists of the random levels of AnnexC, figure 515.5C-15 for a duration of two hours along each of three orthogonal axes, and thesinusoidal requirements of MIL-STD-167, Type I (reference hh), with levels enveloping the highestvalues for each frequency. Note that this criteria applies to ships and not to other watercraft. Nocriteria are known to be available for other watercraft.
b. Exposure durations. Take durations from the Life Cycle Environment Profile.
2.3.11 Category 22 - Engines - turbine engines.
Vibration spectra for materiel mounted directly on turbine engines consists of a broadband background with narrowband spikes superimposed. The broadband background is the sum of random flow turbulence and low-level quasi-sinusoidal peaks generated by various rotating machinery elements. The narrow band spikes are due to the rotationof the main engine rotor(s) and the frequencies are the rotor rotational speed(s) and harmonics.
a. Constant speed. Many turbine engines are constant speed. This means that the rpm is held constant andpower changes are made through fuel flow changes and variable pitch blades, vanes, and propellers.These machines produce the fixed frequency spikes of Annex C, figure 514.5C-16. These spikes have anassociated bandwidth because there is minor rpm drift, the vibration is quasi-sinusoidal (see Annex B,paragraph 2.3.3), and the materiel resonant frequencies vary with serial number and mounting conditions.
b. Variable speed. Other turbine engines are not constant speed machines. For these engines, the rpmvaries with power setting. To represent these engines, adjust the spikes of Annex C, figure 514.5C-16 toinclude the engine rpm range. Typically, the engine will have an rpm range associated with a powersetting (i.e., idle, cruise, max continuous, take off, etc.). Thus, several spectra with different spikefrequencies may be needed to represent all of the power conditions encountered during an engine lifecycle.
c. Multiple rotors. Turbofan engines usually have two and sometimes three mechanically independentrotors operating at different speeds. Modify the spectra of Annex C, figure 514.5C-16 to include spikesfor each rotor.
d. Design criteria. These vibration environments can be approximated in the laboratory by the narrowbandrandom over broadband random test described in Annex B, paragraph 2.3. Many vibration problems inthis type of environment are associated with the coincidence of materiel resonant modes and theexcitation spikes. The notches between spikes are used in intelligent design as safe regions for criticalvibration modes. Source dwell tests minimize the likelihood that materiel will be overstressed at non-representative conditions and that reasonable design provisions will not be subverted.
e. Engine mounts. Engine vibration levels are affected by the engine mounting structure (see Annex B,paragraph 2.4). Thus, the same engine mounted in two different platforms may produce differing levels.Engine test stand levels are very likely to be different than platform levels. Note that the locations offrequency peaks in the vibration spectrum are engine driven and will not change with the installation.
f. Exposure levels. Measured values should be used when possible. Annex C, figure 514.5-16 levels canbe used when measured data are not obtainable. These levels are rough envelopes of data measured onseveral Air Force aircraft engines.
g. Exposure durations. Take durations from the Life Cycle Environment Profile.
2.3.12 Category 23 - Personnel - materiel carried by/on personnel.
The human body has highly damped, low frequency modes of vibration. Materiel carried on the body is protectedfrom the vibration environment. Vibrations sufficient to harm materiel would be intolerable if transmitted throughthe body. Develop personnel materiel to withstand typical vibration environments (shipping, transportation, etc.)when the materiel is not carried by personnel.
Downloaded from http://www.everyspec.com on 2012-06-04T5:34:26.
MIL-STD-810F1 January 2000ANNEX A
METHOD 514.5514.5A-17
a. Exposure levels. No personal materiel vibration exposures are required.
b. Exposure durations. No personal materiel vibration exposure durations are required.
2.4 Supplemental Considerations.
2.4.1 Category 24 - All materiel - minimum integrity test.
In many cases, materiel is designed and tested to requirements based only on operational service environments.Other phases of the environmental life cycle are assumed to be less stringent or not considered. The minimumintegrity test is intended to provide reasonable assurance that materiel can withstand transportation and handlingincluding field installation, removal, and repair. This is particularly important for materiel mounted on vibrationisolators in service and subjected to handling, transportation, etc., without isolators.
a. Basis for levels. Vibration levels and durations of Annex C, figures 514.5C-17 and 514.5C-18 are notbased on application environments. Rather, experience has shown that materiel that withstands theseexposures functions satisfactorily in the field, and that materiel tested to lower levels does not. Theseexposures are sometimes called "junk level" tests.
b. Delicate materiel. Use care with delicate materiel. Do not apply this test when the levels are felt to betoo high for the materiel. Rather, evaluate the full environmental life cycle and make provisions toensure that the materiel is adequately protected from vibration and shock during all phases of theenvironmental life cycle.
c. Limitations. Do not apply minimum integrity tests to materiel that has been designed and tested to allenvironments of its life cycle, or to materiel that is otherwise tested to levels and durations that areequivalent to the minimum integrity test by the vibratory fatigue relationships of Annex B, paragraph 2.2.
d. Exposure levels. Test levels are shown in Annex C, figure 514.5C-17 for general use, and on figure514.5C-18 for helicopter materiel. Note that these exposures are to be applied directly to the materiel(hard mounted) and not through vibration isolation devices. These exposures are based on typicalelectronic boxes. When materiel is too large, unnecessarily high loads are induced in mounting andchassis structures, while higher frequency vibrations at subassemblies are too low. In these cases, applythe minimum integrity test to subassemblies. The maximum test weight of a materiel or subassemblyshould be approximately 36 kg (80 lb).
e. Exposure durations. Test durations are shown in Annex C, figure 514.5C-17 for general use and onfigure 514.5C-18 for helicopter materiel.
2.4.2 Category 25 - All vehicles - cantilevered external materiel.
Materiel that consists of or includes cantilever elements mounted external to a platform are subject to specialproblems. These problems are relatively rare but when they occur usually result in rapid and complete failure.These problems occur when the cantilevered elements are excited to vibrate in their cantilever bending or torsionmodes by interaction with fluid flows.
a. Excitation mechanisms. Cantilever elements immersed in a fluid flow can vibrate due to several types ofself excited vibration and by forced response to pressure fluctuations. The three primary mechanisms areintroduced below. For a general discussion of self-excited vibrations and more information on thesethree mechanisms, see reference y, Chapter 7 and reference z, section 3.6 and chapters 5 and 6.
(1) Flutter is a mechanism where the vibrations of a "wing" in a flow are such as to produce lift forcesand moments that reinforce and amplify the vibration. A "wing" is a cantilever beam with slendercross section (i.e., the dimension parallel to the airflow is much larger than the dimensionperpendicular to the flow). Flutter is not the result of an environmental forcing function. It is amechanism inherent in a design and once started it needs no further environmental excitation tosustain and amplify the motion. Flutter is a separate engineering specialty and should be handled by
Downloaded from http://www.everyspec.com on 2012-06-04T5:34:26.
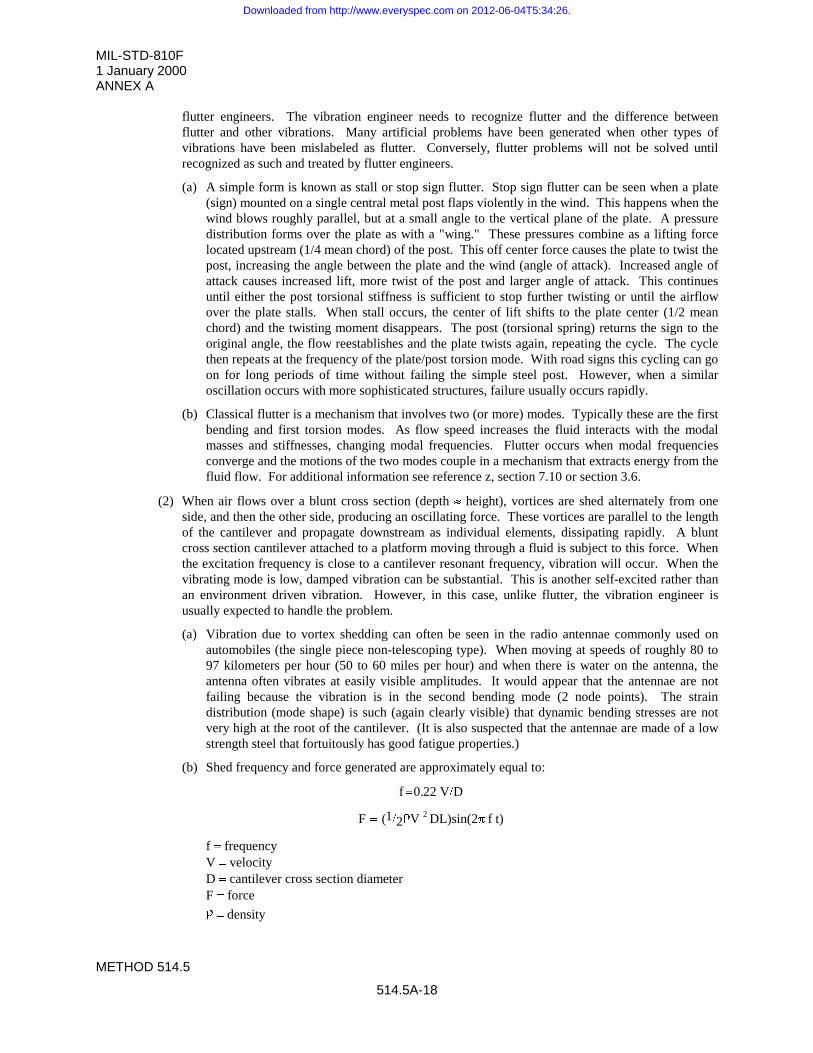
MIL-STD-810F1 January 2000ANNEX A
METHOD 514.5
514.5A-18
flutter engineers. The vibration engineer needs to recognize flutter and the difference betweenflutter and other vibrations. Many artificial problems have been generated when other types ofvibrations have been mislabeled as flutter. Conversely, flutter problems will not be solved untilrecognized as such and treated by flutter engineers.
(a) A simple form is known as stall or stop sign flutter. Stop sign flutter can be seen when a plate(sign) mounted on a single central metal post flaps violently in the wind. This happens when thewind blows roughly parallel, but at a small angle to the vertical plane of the plate. A pressuredistribution forms over the plate as with a "wing." These pressures combine as a lifting forcelocated upstream (1/4 mean chord) of the post. This off center force causes the plate to twist thepost, increasing the angle between the plate and the wind (angle of attack). Increased angle ofattack causes increased lift, more twist of the post and larger angle of attack. This continuesuntil either the post torsional stiffness is sufficient to stop further twisting or until the airflowover the plate stalls. When stall occurs, the center of lift shifts to the plate center (1/2 meanchord) and the twisting moment disappears. The post (torsional spring) returns the sign to theoriginal angle, the flow reestablishes and the plate twists again, repeating the cycle. The cyclethen repeats at the frequency of the plate/post torsion mode. With road signs this cycling can goon for long periods of time without failing the simple steel post. However, when a similaroscillation occurs with more sophisticated structures, failure usually occurs rapidly.
(b) Classical flutter is a mechanism that involves two (or more) modes. Typically these are the firstbending and first torsion modes. As flow speed increases the fluid interacts with the modalmasses and stiffnesses, changing modal frequencies. Flutter occurs when modal frequenciesconverge and the motions of the two modes couple in a mechanism that extracts energy from thefluid flow. For additional information see reference z, section 7.10 or section 3.6.
(2) When air flows over a blunt cross section (depth | height), vortices are shed alternately from oneside, and then the other side, producing an oscillating force. These vortices are parallel to the lengthof the cantilever and propagate downstream as individual elements, dissipating rapidly. A bluntcross section cantilever attached to a platform moving through a fluid is subject to this force. Whenthe excitation frequency is close to a cantilever resonant frequency, vibration will occur. When thevibrating mode is low, damped vibration can be substantial. This is another self-excited rather thanan environment driven vibration. However, in this case, unlike flutter, the vibration engineer isusually expected to handle the problem.
(a) Vibration due to vortex shedding can often be seen in the radio antennae commonly used onautomobiles (the single piece non-telescoping type). When moving at speeds of roughly 80 to97 kilometers per hour (50 to 60 miles per hour) and when there is water on the antenna, theantenna often vibrates at easily visible amplitudes. It would appear that the antennae are notfailing because the vibration is in the second bending mode (2 node points). The straindistribution (mode shape) is such (again clearly visible) that dynamic bending stresses are notvery high at the root of the cantilever. (It is also suspected that the antennae are made of a lowstrength steel that fortuitously has good fatigue properties.)
(b) Shed frequency and force generated are approximately equal to:
f 0. 22 V�D
F ( 1�2UV 2 DL)sin(2S f t)
f frequencyV velocityD cantilever cross section diameterF forceU density
Downloaded from http://www.everyspec.com on 2012-06-04T5:34:26.
MIL-STD-810F1 January 2000ANNEX A
METHOD 514.5514.5A-19
t timeL the exposed length (perpendicular to the cross section)
(For non-circular cross sections, D becomes the dimension perpendicular to the flow in thefrequency equation and the dimension parallel to the flow in the force equation. See referencey, section 7.6 for more information.)
(3) Forced vibration of external cantilevers by fluctuations in a fluid flow is the same response toaerodynamic turbulence that is a primary source of vibration in aircraft. The factors that make this aspecial case for cantilevers are the dynamic characteristics of the cantilevers. First, a cantileverexposes a large surface area to the excitation relative to the cross section of the support structure.Second, a cantilever tends to respond with high amplitude motion and large root stresses in thesupporting base. Third, when the cantilever has the form of a "wing," aerodynamic lift and dragforces can be produced that add to the fluctuating pressure loads. These aerodynamic forces areproduced because the turbulence is a tumbling of the fluid with variations in flow direction and flowvelocity. These variations effect the "wing" as variations in angle of attack and flow velocity.
(a) There are two types of excitation that are important. One is the broadband random turbulencebehind any relatively blunt flow obstruction or behind a stalled airfoil. The other is vortices. Avortex forms when the pressures on two sides of a "wing" are different. The flow from the highpressure side wraps around the tip to the low pressure side. This results in a rotating flowtrailing downstream of the tip. This rotating flow or vortex is left in the wake of the "wing," ishighly stable, and persists for long distances downstream. Such a vortex is highly structuredwith a sharply peaked frequency distribution.
(b) Vortex generators (small "wings") are often seen on airplane wings. The vortices generatedhelp to hold the flow in the desired locations over the wing. This phenomenon can be clearlyseen during takeoff of Boeing 737 aircraft equipped with CFM 56 (large diameter) engineswhen the air is humid. There is a vortex generator (small "wing") roughly 20 centimeters by 20centimeters (8 inches by 8 inches) on the inboard side of each engine cowling. When theaircraft rotates to takeoff attitude, a vortex is formed that moves up over the wing and extendsback parallel to the fuselage. Moisture condenses in the vortex, making it clearly visible topassengers seated at windows beside the engine and over the wing.
b. Platform environments.
(1) Fixed wing aircraft and external stores.
(a) Any "wing" can flutter. However, this is not likely with blade antennas or the wings, controlsurfaces, and fins on stores. This is because first bending and first torsion mode frequencies aretypically well separated. Any "wing" that has closely spaced bending and torsion modefrequencies should be evaluated by flutter engineers.
(b) Fixed wing aircraft usually do not have blunt cross section external cantilevers. Anythingoutside the mold lines is generally streamlined (i.e., airfoil shaped) to reduce drag. However, ifblunt cross sections are used, care should be exercised to ensure that shed frequencies andcantilever frequencies are well separated.
(c) Many fixed wing aircraft have problems due to turbulence forced vibration. Typical problemsare failed blade antennae, failed fins on external stores, and failed wings and control surfaces onmissiles. Blade antenna problems are usually caused by locating the antenna down stream of aflow disturbance such as a cockpit canopy, a radome that projects into the air stream, or a cavityin the aircraft skin. Severe broadband flow turbulence carries downstream behind the disturbingelement for a distance of three to five times the maximum cross sectional dimension of thedisturbing element.
(d) Fins on external stores are typically exposed to turbulence behind the carrying pylon, rack, orleading store. There is a case where a vortex forms in a corner of an engine inlet during high
Downloaded from http://www.everyspec.com on 2012-06-04T5:34:26.
MIL-STD-810F1 January 2000ANNEX A
METHOD 514.5
514.5A-20
speed throttle chops. This vortex drops down and moves toward the airplane centerline as itextends aft. There is a single fuselage external store station that is wiped by this vortex. Aspecific missile carried at this station experienced high vibration levels of wings and controlsurfaces leading to rapid failure. The missile had to be redesigned to allow carriage on that onestation.
(2) Helicopters and external stores.
(a) Flutter of "wings" on a helicopter is not likely due to the relatively low air speeds. However, ifotherwise unexplainable failures occur in "wing" like elements, a flutter engineer should beconsulted.
(b) Flight speeds of helicopters are lower than fixed wing aircraft and streamlining is not asimportant. Thus, blunt cross section cantilevers are more likely to be used. When blunt crosssections are used, care should be exercised to insure that vortex shed frequencies and cantileverfrequencies are well separated.
(c) Helicopters are also subject to turbulence. However, turbulence produced vibratory loads areproportional to flow speed and helicopter speeds make problems due to turbulence relativelyunlikely. It is still prudent to locate cantilevered materiel away from known turbulence.
(3) Ground vehicles.
(a) The flapping of the fabric cover of an open truck is a form of flutter. Structures of this type will"flutter" and must be strong enough and tied down well enough to prevent carrying away.However, to replace a fabric cover with a stiffened structure is not reasonable. Flutter problemsat ground vehicle speeds should be limited to cases of this type.
(b) Streamlining is usually not a significant factor in ground vehicle design. Thus, blunt cross-section cantilevers and vortex shedding are relatively likely. Exercise care to ensure vortexshed frequencies and cantilever frequencies are separated.
(c) Forced vibration problems should be extremely rare due to low flow speeds. However,turbulence does exist at any flow speed and could possibly effect large, low frequencystructures. The low frequency turbulence produced by large trucks effects the handling ofsmaller vehicles in close proximity. Vortices in the wakes of large trucks can often be seen indisturbances of roadside dust.
(4) Watercraft.
(a) For the portion of the platform above water, the discussion for ground vehicles applies.Portions of the platform below water are in a higher density fluid, even though flow speeds arelow, the pressures are high. Wake turbulence of watercraft is clearly visible at the watersurface. "Wing" materiel is subject to flutter and blunt cantilevers including "wing" elementswith blunt trailing edges are subject to vortex shedding. Much of the original work in thistechnology dealt with watercraft problems.
(b) Hulls and externally mounted underwater materiel are generally designed for smooth flow at thebow and along the sides but with squared off "boat tail" sterns. Turbulence driven forcedvibration should not be a problem in smooth flow areas. However, anything locateddownstream of a "boat tail" will be subjected to high levels of flow turbulence.
c. Exposure levels.
(1) Exposure levels are not pertinent to flutter or other instabilities. These mechanisms, if they occur,will either drive the system to rapid, complete failure or will persist at high levels resulting in rapidfatigue or wear failure. The correct procedure is to design the materiel such that these mechanismsdo not occur. When instabilities are discovered, the correct procedure is to understand and theneliminate the mechanism. This is accomplished by determining the mode shapes and frequencies of
Downloaded from http://www.everyspec.com on 2012-06-04T5:34:26.
MIL-STD-810F1 January 2000ANNEX A
METHOD 514.5514.5A-21
those resonances participating in the instability and, if possible, the characteristics of the flow field.Eliminating the mechanism is done by changing modal frequencies, mode shapes, modal damping,and/or flow characteristics. This is accomplished by changing modal mass, stiffness, or dampingand/or by changing aerodynamic shapes. (See reference z, section 6.1.) Dynamic absorbers areoften useful in changing modal properties (see reference y, sections 3.2 and 3.3).
(2) Vortex shedding driven vibration also generally leads to rapid fatigue or wear failure. This problemtypically involves a single mode of vibration of the materiel. If possible, the problem should beeliminated by separating the shed frequency and the resonant frequency (ideally by a factor of 2). Ifthis is not practical, it may be possible to survive this mechanism for useful periods of time withgood design. Good design consists of using materials with good fatigue properties, elimination ofhigh stress points, and adding damping. In order to define exposure levels, it is necessary tomeasure the motions of the cantilever on the platform in the operating environment. Thesemeasurements are used to define modal responses. When laboratory tests are required, responsecontrol is necessary. This is because the primary energy input is directly from the fluid flow.Response of the cantilever to this input is greater than the response to the vibration environment atthe mount.
(3) Local turbulence is not predictable except in a very general sense. Problems of this type should beavoided whenever possible by locating materiel away from known turbulence areas. Beyond this, itis necessary to operate the platform through its operational envelope and evaluate problems as theyoccur. When problems are discovered, the first approach should be to determine the source of theturbulent wake that is causing the problem and to move the materiel out of this wake. If this is notpossible, proceed as discussed for vortex shedding problems.
d. Exposure durations. As discussed above, problems should be solved by eliminating instabilitymechanisms or by moving materiel away from turbulence. If it is necessary to define exposure durations,take them from the life cycle profile. Note that these problems may occur in very specific regions of anoperating envelope. It may be necessary to break missions down to a very detailed level in order todefine realistic durations.
Downloaded from http://www.everyspec.com on 2012-06-04T5:34:26.

MIL-STD-810F1 January 2000ANNEX A
METHOD 514.5
514.5A-22
THIS PAGE INTENTIONALLY BLANK
Downloaded from http://www.everyspec.com on 2012-06-04T5:34:26.
MIL-STD-810F1 January 2000ANNEX B
METHOD 514.5514.5B-1
ANNEX B
ENGINEERING INFORMATION
1. SCOPE.
1.1 Purpose.
This Annex provides information intended to be useful in interpreting the main body and Annex A of method 514.5.
1.2 Application.
The following discussions concern basic engineering information. They are intended as a quick introduction to thesubject matter and are offered without detailed explanations, mathematics, or references. If further information orunderstanding is required, the technical literature and engineering textbooks should be consulted. Reference aa isrecommended as a starting point.
2. ENGINEERING INFORMATION.
2.1 Vibration Test Types.
The following presents discussions of general types of vibration tests. The nomenclature and descriptions are basedon U. S. Air Force aircraft practices. Other test types, definitions, and names will be found in practice. All of thesetest types may not be applied to a given materiel item. A typical materiel development might include developmenttesting and durability testing, while another might include qualification and reliability testing. Environmentalworthiness testing is included when needed. Environmental Stress Screening (ESS) is a part of most current DODacquisitions. All of the tests, including ESS, consume vibratory fatigue life. It should be assumed that aqualification test, a durability test, or a reliability test consumes the test article such that it is not suitable for fielddeployment. Development tests and worthiness tests may or may not consume a complete life depending on thespecific test goals. It is important to insure that ESS consumes only an appropriate, hopefully negligible, portion oftotal life and that this portion is accounted for in the total life cycle of vibration exposures. In all cases it is vital totailor test methodology, requirements, and success or failure criteria to achieve the desired results.
2.1.1 Development test.
Development testing is used to determine characteristics of materiel, to uncover design and construction deficiencies,and to evaluate corrective actions. Begin as early as practical in the development and continue as the designmatures. The ultimate purpose is to assure that developed materiel is compatible with the environmental life cycleand that formal testing does not result in failure. The tests have a variety of specific objectives. Therefore, allowconsiderable freedom in selecting test vibration levels, excitation, frequency ranges, and durations. Typicalprograms might include modal analysis to verify analytical mode shapes and frequencies, and sine dwell, swept sine,transient, or random excitation transient vibration to evaluate function, fatigue life, or wear life. The test types,levels, and frequencies are selected to accomplish specific test objectives. Levels may be lower than life cycleenvironments to avoid damage to a prototype, higher to verify structural integrity, or raised in steps to evaluateperformance variations and fragility.
2.1.2 Qualification test.
Qualification testing is conducted to determine compliance of a materiel with specific environmental requirements.Note that these tests are a simplified, shortened expression of the environmental life cycle. For most items, thisconsists of a functional test and an endurance test (sometimes combined). The functional test represents the worstcase vibration (or envelope of worst case conditions) of the environmental life cycle. The endurance test is an
Downloaded from http://www.everyspec.com on 2012-06-04T5:34:26.
MIL-STD-810F1 January 2000ANNEX B
METHOD 514.5
514.5B-2
accelerated fatigue test representing an entire life cycle. Typically, vibration is not combined with otherenvironmental stresses although part of the vibration test may be at high temperature and part at low temperature.An exception might be the transportation of large assemblies where a production assembly is subjected to the testenvironment and then fielded.
2.1.3 Functional test.
Functional testing is conducted to verify that the materiel functions as required while exposed to worst caseoperational vibration. Fully verify function at the beginning, middle and end of each test segment. Monitor basicfunction at all times during each test run. Functional test levels are normally maximum service levels. Whenseparate functional and endurance tests are required, split the functional test duration, with one half accomplishedbefore the endurance test and one half after the endurance test (in each axis). The duration of each half should besufficient to fully verify materiel function or one half hour (per axis), whichever is greater. This arrangement hasproven to be a good way of adequately verifying that materiel survives endurance testing in all respects. In somecases, materiel that must survive severe worst case environments may not be required to function or function atspecification levels during worst case conditions. Typically "operating" and "non-operating" envelopes areestablished. Tailor functional tests to accommodate non-operating portions by modifying required functionalmonitoring requirements as appropriate.
2.1.4 Endurance test.
In the past, endurance test duration was normally set at one hour per axis. This approach has serious shortcomings.
a. Conventional approach. In the past, test levels were usually established by raising functional levels toaccount for equivalent fatigue damage. Another approach was to assume that if enough stress cycles(usually assumed to be 106 cycles) were accumulated without failure, that this demonstrated that thestresses were below the material endurance limit. Each of these approaches has serious shortcomings.The first requires testing at vibration levels well above levels seen in service. This ignores nonlinearityof material properties, joint friction, isolator performance, heat buildup, etc. The second ignores the factthat many materials (particularly those typical of electrical/electronic devices) do not exhibit endurancelimits and that 106 stress cycles may not be sufficient for those that do.
b. Recommended approach. Use the simplified fatigue relationship below (see Annex B, paragraph 2.2,below) to determine the time at maximum service levels (functional levels) that is equivalent to avibration lifetime (levels vary throughout each mission). Use the equivalent time as the functional testduration, thereby combining functional and endurance tests. There may be cases when this test durationis too long to be compatible with program restraints. In these cases, use as long of a test duration as ispractical and use the fatigue relationship to define the test level. While this approach does notcompletely eliminate nonlinearity questions, it does limit levels to more realistic maximums.
2.1.5 Durability test.
Durability testing is a simulation of the environmental life cycle to a high degree of accuracy. A durability analysisprecedes the test and is used to determine which environmental factors (vibration, temperature, altitude, humidity,etc.) must be included in the test to achieve realistic results. Although the test is intended to be a real time simulationof the life cycle, it may be shortened by truncation if feasible. Truncation is the elimination of time segments that areshown by the durability analysis to be benign with regard to materiel function and life. Durability analyses shoulduse fatigue and fracture data applicable to each material rather than the simplified expressions of Annex B,paragraph 2.2 below.
a. Worst case levels. Mission portions of the environmental life cycle are represented in the durability testby mission profiles. Mission profiles are statistical definitions of environmental stress and materiel dutycycle versus time. Mission profiles often do not include worst case environmental stresses because theyare encountered too rarely to be significant statistically. However, it is important to verify that materiel
Downloaded from http://www.everyspec.com on 2012-06-04T5:34:26.
MIL-STD-810F1 January 2000ANNEX B
METHOD 514.5514.5B-3
will survive and function as needed during extreme conditions. Therefore, insert maximumenvironmental levels into the durability test, in a realistic manner. For example, in the case of a fighterairplane, the maximum levels would be inserted during an appropriate combat mission segment ratherthan a more benign segment such as cruise.
b. Success criteria. Pass/fail criteria for durability tests are established for the particular effort. Criteriacould include no failures, a maximum number of failures, a maximum amount of maintenance to fixfailures, or some combination of these.
2.1.6 Reliability test.
Reliability testing is accomplished to obtain statistical definitions of materiel failure rates. These tests may bedevelopment tests or qualification tests. The accuracy of the resulting data is improved by improving realism of theenvironmental simulation. Test requirements are developed by engineers responsible for materiel reliability.Multiple test items are often exposed to segments of a life cycle rather than one materiel test item exposed to acomplete life cycle. The environmental simulation is established to fit these requirements and is generally similar tothe durability testing discussed above.
2.1.7 Worthiness test.
When unqualified materiel is to be evaluated in the field, verification that the materiel will function satisfactorily isnormally required for safety and/or test efficiency reasons. This is accomplished by environmental worthiness test.The worthiness test is identical to a qualification test except that it covers only the life cycle of the field evaluation.Levels are usually typical operating levels unless safety is involved; then maximum operating levels are necessary.Durations are either equivalent to a complete system/subsystem test, long enough to check materiel function, or anarbitrary short time (5 or 10 minutes). For safety driven worthiness test, the test item is considered to be consumedby the test (the test item may not be used in the field). An identical item of hardware is used in the field evaluation.When safety is not an issue, an item may be subjected to a minimum time functional test and then used in the fieldevaluation. When it is required to evaluate the cumulative environmental effects of vibration and environments suchas temperature, altitude, humidity, leakage or EMI/EMC, a single test item should be exposed to all environmentalconditions.
2.1.8 Environmental Stress Screen (ESS).
ESS is not an environmental test. It is a production or maintenance acceptance inspection technique. However, it isan environmental life cycle event and should be included as preconditioning or as part of the test as appropriate.Materiel may be subject to multiple ESS cycles and maintenance ESS vibration exposures may differ fromproduction acceptance exposures. ESS should be included in development tests only as appropriate to the test goals.Qualification tests should include maximum lifetime ESS exposure. Worthiness safety tests should include themaximum ESS exposure appropriate to the particular materiel. When materiel is to be subjected to worthiness testand then used in the field, it may be wise to substitute a worthiness test for ESS. This subjects the materiel to theminimum amount of vibration while showing field worthiness. Durability tests should include maximum ESS eventsin the correct positions in the life cycle simulation. For reliability tests, it may be appropriate to vary the ESSexposures between minimum and maximum.
2.2 Fatigue Relationship.
The following relationship may be used to determine vibratory fatigue equivalency between vibration exposures, tosum vibratory fatigue damage of separate vibration exposures, and to define accelerated test levels for vibrationendurance tests:
�W0� W1� �T1 �T0�1/4 or �g0�
g1� �T1�T0�
1/ 6
Downloaded from http://www.everyspec.com on 2012-06-04T5:34:26.
MIL-STD-810F1 January 2000ANNEX B
METHOD 514.5
514.5B-4
W random vibration level (acceleration spectral density, g2/Hz)g sinusoidal vibration level (peak acceleration, g)T Time
This relationship is a simplified expression of linear fatigue damage accumulation. The exponent is the materialconstant (slope of a log/log fatigue or S/N curve). The values given are widely used for Air Force avionics. Othervalues are used for other types of materiel. For example, missile programs have used exponents ranging from 1/3.25to 1/6.6. Space programs sometimes use 1/2. Many materials exhibit exponents between 1/6 and 1/6.5. This widevariation is based on degree of conservatism desired as well as material properties. More sophisticated analysesbased on fatigue data (S/N curves) for specific materials should be used when practical. Note that using material S/Ncurves results in different equivalencies for different parts in a given materiel item. A decision will be required as towhich equivalency to use to establish test criteria.
2.3 Vibration Characterization.
The majority of vibration experienced by materiel in operational service is broadband in spectral content. That is,vibration is present at all frequencies over a relatively wide frequency range at varying intensities. Vibrationamplitudes may vary randomly, periodically, or mixed random and periodic. Usually, random vibration bestsimulates these environments. Situations do occur where combined sinusoidal and random vibration and sinusoidalalone are appropriate. Most vibration tests run with steady state excitation. Steady state vibration is appropriate attimes in simulation of transient events. However, there are cases where transient events can only be satisfactorilyrepresented by transient vibration excitation.
2.3.1 Random vibration.
Random vibration is expressed as acceleration spectral density (also referred to as power spectral density, or PSD)spectra. The acceleration spectral density at a given frequency is the square of the root mean square (rms) value ofthe acceleration divided by the bandwidth of the measurement. This gives a value expressed in terms of a one Hertzbandwidth centered on the given frequency. Accuracy of spectral values depends on the product of the measurementbandwidth and the time over which the spectral value is computed. The normalized random error for a spectralestimate is given by 1/(BT)1/2, where B is the analysis bandwidth in Hz. and T is the averaging time in seconds. Ingeneral, use the smallest practical bandwidth or minimum frequency resolution bandwidth, with 1 Hz being ideal. Inmost cases, acceleration amplitude has a normal (Gaussian) distribution. Other amplitude distributions may beappropriate in specific cases. Ensure that test and analysis hardware and software are appropriate when non-Gaussian distributions are encountered.
a. Frequency range. Acceleration spectral density is defined over a relevant frequency range. This range isbetween the lowest and highest frequencies at which the materiel may be effectively excited bymechanical vibration. Typically, the low frequency is one half the frequency of the lowest resonance ofthe materiel or the lowest frequency at which significant vibration exists in the environment. The highfrequency is two times the highest materiel resonant frequency, the highest frequency at which significantvibration exists in the environment, or the highest frequency at which vibration can be effectivelytransmitted mechanically. It is generally accepted that the highest frequency for mechanicallytransmitted vibration is 2000 Hz, although practically it is often lower. (When frequencies around andabove 2000 Hz are needed, it is generally necessary to augment the vibration with acoustic noise - seemethod 523.2.)
b. Rms values. The use of rms values to specify random vibration is not valid. The spectrum rms value isthe square root of the area under the spectral density curve over the total frequency range. It contains nofrequency information. Rms values are useful as a general error check and as a measure of power neededto run a vibration shaker. Definitions of vibration should always include frequency spectra.
Downloaded from http://www.everyspec.com on 2012-06-04T5:34:26.
MIL-STD-810F1 January 2000ANNEX B
METHOD 514.5514.5B-5
2.3.2 Sinusoidal vibration.
Sine vibration is expressed as an acceleration and a frequency. An environment dominated by sine vibration ischaracterized by a fundamental frequency and harmonics (multiples) of that fundamental. Often there will be morethan one fundamental frequency. Each fundamental will generate harmonics. The service vibration environment insome cases (low performance propeller aircraft and helicopters for example) contains excitation that is basicallysinusoidal in nature and with a very low broadband background. The excitation derives from engine rotationalspeeds, propeller and turbine blade passage frequencies, rotor blade passage, and their harmonics. Environmentssuch as this may be best simulated by a sinusoidal test. Ensure that the frequency range of the sinusoidal exposure isrepresentative of the platform environment.
2.3.3 Mixed broadband and narrowband vibration.
In some cases, the vibration environment is characterized by quasi-periodic excitation from reciprocating or rotatingstructures and mechanisms (e.g., rotor blades, propellers, pistons, gunfire). When this form of excitationpredominates, source dwell vibration is appropriate. Source dwell is characterized by broadband random vibration,with higher level narrowband random, or sinusoidal vibration superimposed. Exercise care when determining levelsof random and sinusoidal vibration from measured data since data reduction techniques affect the apparentamplitudes of these different types of signals.
a. Narrowband random over broadband random. Ensure that the amplitudes and frequencies of the totalspectrum envelope the environment. The narrowband bandwidth(s) should encompass or be cycledthrough frequencies representative of variations of the environment and variations of materiel resonantfrequency (see Annex B, paragraph 2.4.3).
b. Sinusoid(s) over broadband random background. Ensure that the random spectrum is continuous overthe frequency range and that it envelops all of the environment except for the amplitude(s) to berepresented by the sinusoid(s). The sinusoid(s) amplitude(s) should envelop the sinusoid(s) in theenvironment. Cycle the sinusoid(s) frequency(s) through bands representative of frequency variations inthe environment and resonant frequency variations in materiel (see Annex B, paragraph 2.4.3).
2.3.4 Transient vibration.
Transient vibration is a time-varying "windowed" portion of a random vibration that is of comparatively shortduration, e.g., 0.5 second to 7.5 seconds. Currently, such a measured environment is replicated in the laboratory on avibration exciter under open loop waveform control. Verification of the laboratory test is provided by (1) display ofthe laboratory measured amplitude time history; (2) an optimally smooth estimate of the amplitude time history time-varying root-mean-square, and (3) either an energy spectral density estimate or a Shock Response Spectrum (SRS)estimate for comparatively short environments (transient vibration duration less than the period of the first naturalmode of the test item) or a time-varying autospectral density estimate of longer duration environments, e.g., 2.5 to7.5 seconds. In general, since the environment is being replicated in the laboratory under open loop waveformcontrol, if the impulse response function of the system is correctly determined and correctly applied, then thereplication should be near identical to the measured environment. The transient vibration environment is animportant environment for stores resident in platform weapon bays that may be exposed to such environments manytimes in the life of training missions. (See references c, bb, and method 516.5.)
2.3.5 Random versus sinusoidal vibration equivalence.
In the past, most vibration was characterized in terms of sinusoids. Currently, most vibration is correctly understoodto be random in nature and is characterized as such. This results in a demand to determine equivalence betweenrandom and sine vibration. This demand is generated by the need to utilize materiel that was developed to sinerequirements.
a. General equivalence. Sine and random characterizations of vibration are based on distinctly differentsets of mathematics. In order to compare the effects of given random and sine vibration on materiel, it is
Downloaded from http://www.everyspec.com on 2012-06-04T5:34:26.
MIL-STD-810F1 January 2000ANNEX B
METHOD 514.5
514.5B-6
necessary to know the details of materiel dynamic response. A general definition of equivalence is notfeasible.
b. grms. Often, attempts are made to compare the peak acceleration of sine to the rms acceleration ofrandom. The only similarity between these measures is the dimensional units that are typicallyacceleration in standard gravity units (g). Peak sine acceleration is the maximum acceleration at onefrequency (see Annex B, paragraph 2.3.2). Random rms is the square root of the area under a spectraldensity curve (see Annex B, paragraph 2.3.1). These are not equivalent!
2.4 Platform/Materiel and Fixture/Test Item Interaction.
Generally, it is assumed that the vibration environment of the materiel is not affected by the materiel itself. That is,the vibration of the platform at the materiel attachment point would be the same whether or not the materiel isattached. Since the entire platform, including all materiel, vibrates as a system, this is not strictly correct. However,when the materiel does not add significantly to the mass or stiffness of the platform, the assumption is correct withinreasonable accuracy. The following sections discuss the limitations of this assumption. Note that these effects alsoapply to sub-elements within materiel and to the interactions of materiel with vibration excitation devices (shakers,slip tables, fixtures, etc.).
2.4.1 Mechanical impedance.
a. Large mass items. At platform natural frequencies where structural response of the platform is high, themateriel will load the supporting structures. That is, the mass of the materiel is added to the mass of thestructure, and it inertially resists structural motions. If the materiel mass is large compared to theplatform mass, it causes the entire system to vibrate differently by lowering natural frequencies andchanging mode shapes. If the materiel inertia is large compared to the stiffness of the local supportstructure, it causes the local support to flex, introducing new low frequency local resonances. These newlocal resonances may act as vibration isolators (see Annex B, paragraph 2.4.2 below).
b. Items acting as structural members. When materiel is installed such that it acts as a structural member ofthe platform, it will affect vibrations and it will be structurally loaded. This is particularly important forrelatively large materiel items but it applies to materiel of any size. In these cases, the materiel structureadds to the stiffness of the platform and may significantly affect vibration modes and frequencies.Further, the materiel will be subjected to structural loads for which it may not have been designed. Anexample is a beam tied down to the cargo deck of a truck, aircraft, or ship. If the tie-downs are notdesigned to slip at appropriate points, the beam becomes a structural part of the deck. When the deckbends or twists, the beam is loaded and it changes the load paths of the platform structure. This may becatastrophic for the beam, the platform, or both. Be careful in the design of structural attachments toassure that the materiel does not act as a structural member.
c. Large item mass relative to supporting structures. When materiel items are small relative to the overallplatform but large relative to supporting structures, account for the change in local vibration levels, ifpractical. This effect is discussed in Annex A, paragraph 2.3.1 for materiel mounted in jet aircraft. Notethat due to differences in environments, relative sizes, and structural methods, the factor defined inAnnex C, table 514.5C-III is only applicable to materiel mounted in full sized jet aircraft.
d. Large item size relative to platform. When materiel is large in size or mass relative to the platform,always consider these effects. This is imperative for aircraft and aircraft stores. Catastrophic failure ofthe aircraft is possible. It is also imperative to consider these effects in design of vibration test fixtures.Otherwise, the vibration transmitted to the test materiel may be greatly different than intended.
2.4.2 Vibration isolation.
Vibration isolators (shock mounts), isolated shelves, and other vibration isolation devices add low-frequencyresonances to the dynamic system that attenuate high-frequency vibration inputs to materiel. Vibration inputs at the
Downloaded from http://www.everyspec.com on 2012-06-04T5:34:26.

MIL-STD-810F1 January 2000ANNEX B
METHOD 514.5514.5B-7
isolation frequencies (materiel six degree-of-freedom rigid body modes) are amplified, resulting in substantial rigidbody motions of the isolated materiel. Effective performance of these devices depends on adequate frequencyseparation (factor of two minimum) between materiel resonant frequencies and isolation frequencies, and onadequate sway space (clearance around isolated materiel) to avoid impacts of the isolated materiel with surroundingmateriel (possibly also vibration isolated and moving) and structure.
a. Sway space. Include sway amplitude and isolation characteristics (transmissibility versus frequency) inall design analyses and measure them in all vibration tests. Isolation devices are nonlinear withamplitude. Evaluate these parameters at vibration levels ranging from minimum to maximum. Note:these comments also apply to isolated sub-elements within materiel items.
b. Minimum ruggedness. All materiel should have a minimum level of ruggedness, even if protected byisolation in service use and shipping. Thus, when materiel development does not include all shippingand handling environments of the materiel life cycle, include the appropriate minimum integrityexposures in materiel (Annex A, paragraph 2.4.1).
2.4.3 Materiel resonant frequency variation.
The installed resonant frequencies of materiel varies from those of the laboratory test. One cause is the smallvariations between serial items from an assembly process. Tightness of joints, slight differences in dimensions ofparts and subassemblies, and similar differences effect both the resonant frequencies and the damping of the variousmodes of the item. A second cause is the interaction between the materiel and the mounting. As installed for fielduse, a materiel item is tied to mounting points that have an undefined local flexibility and that move relative to eachother in six degrees of freedom as the platform structure vibrates in its modes. In a typical laboratory test, the testitem is tied to a massive, very stiff fixture intended to transmit single axis vibration uniformly to each mountingpoint. In each case the mounting participates in the vibration modes of the materiel item and in each case theinfluence is different. When defining test criteria, consider these influences. Both in the cases of measured data andarbitrary criterion, add an allowance to narrow band spectral elements. Plus and minus five per cent has been chosenfor the propeller aircraft criteria of Annex A, paragraph 2.3.2. This was chosen because it seemed to be a reasonablenumber, and because enveloped C-130 and P-3 aircraft data (references p through t) in g2/Hz form exhibitedapproximately this bandwidth.
2.5 Modal Test and Analysis.
Modal test and analysis is a technique for determining the structural dynamic characteristics of materiel and testfixtures. Modal tests, (reference cc) also known as ground vibration tests (GVT) and ground vibration surveys(GVS), apply a known dynamic input to the test item and the resulting responses are measured and stored. Modalanalysis methods are applied to the measured data to extract modal parameters (resonant frequencies, mode shapes,modal damping, etc.). Modal parameters are used to confirm or generate analytical models, investigate problems,determine appropriate instrumentation locations, evaluate measured vibration data, design test fixtures, etc. Modalanalysis methods range from frequency domain, single degree of freedom methods to time domain, multi-degree offreedom methods (references dd and ee).
2.5.1 Modal test techniques.
Modal analysis may be accomplished in various ways. The simplest method consists of inputting sine vibration witha shaker, adjusting the frequency and amplitude output of the shaker to excite a structural mode, measuring outputswith a roving accelerometer, and hand plotting the results. This process is repeated for each structural mode ofinterest. A more sophisticated approach would utilize multi-shaker wide band random excitation, simultaneousmeasurement of signals from an accelerometer and force gage array, and computer computation and storage offrequency response functions (FRF). Techniques such as random burst and instrumented hammer excitation areavailable. Select methodology that will result in well-understood usable data, and that will provide the level or detailneeded for the specific test goals.
Downloaded from http://www.everyspec.com on 2012-06-04T5:34:26.
MIL-STD-810F1 January 2000ANNEX B
METHOD 514.5
514.5B-8
2.5.2 Material non-linear behavior.
Dynamic inputs should be at as realistic levels as possible and at as many levels as practical because materielresponse is generally nonlinear with amplitude.
2.6 Aerodynamic Effects.
A primary source of vibration in aircraft and aircraft stores is the aerodynamic flow over the vehicle. Oscillatingpressures (turbulence) within the flow drive vibration of the airframe surfaces. These pressures and thus thevibration are a linear function of dynamic pressure and a non-linear function of Mach number. When a flowbecomes supersonic, it smoothes out and turbulence drops off. Then, as speed increases, further turbulence builds upagain. This phenomenon is well illustrated in the vibration data contained in reference k. The Mach correctionsgiven in Annex C, table 514.5C-V are based on an average of this data. The following definitions and the values andthe formulas of Annex C, table 514.5C-VI are provided for use in calculating airspeeds and dynamic pressures. Theformulas are somewhat complex and in the past it was common to use simplified graphical equivalents. With theavailability of modern computers and programmable calculators these simplifications are no longer justified. Thesource of the formulas is reference ff and the source of the atmospheric values is reference gg.
2.6.1 Dynamic pressure.
The total pressure of a gas acting on an object moving through it is made up of static pressure plus dynamic pressure(q). The proportions vary with speed of the body through the gas. Dynamic pressure is related to speed by q 1/2 U
V2 where U is the density of the gas and V is the velocity of the object through the gas.
2.6.2 Airspeed.
The speed of an aircraft moving through the atmosphere is measured in terms of airspeed or Mach number. Thereare several forms of airspeed designation. These are discussed below. At sea level these are equal, but as altitudeincreases they diverge. Equations and data required for airspeed and dynamic pressure calculations are provided inAnnex C, table 514.5C-VI. These are based on references ff and gg.
a. Calibrated airspeed. Airspeed is usually specified and measured in calibrated airspeed. Calibratedairspeed is typically expressed in nautical miles per hour (knots) and designated knots calibrated airspeed (Kcas). Kcas is not true airspeed. It is derived from quantities that are directly measurable inflight. Since it is not true airspeed, it cannot be used in the simple formula for q given above.
b. Indicated airspeed. Another form of airspeed measurement is indicated airspeed. Calibrated airspeed isindicated airspeed when empirical corrections are added to account for factors in the specific aircraftinstallation. Indicated airspeed is expressed in various units (kilometers per hour, miles per hour, andknots) but in military aircraft, it is normally in knots indicated airspeed (Kias).
c. Equivalent airspeed. Equivalent airspeed is a form directly related to dynamic pressure. It is sometimesused in engineering calculations since other forces (lift, drag, and structural air-loads) acting on anairframe are also proportional to dynamic pressure. However, it is not used in airspeed measurementsystems or flight handbooks. Equivalent airspeed may be expressed in various units but it is usually seenas knots equivalent airspeed (Keas).
d. True airspeed. This is the actual airspeed. To calculate true airspeed with an aircraft air data system,local atmospheric properties must be accurately known. This was not practical until recent years andaircraft generally do not use true airspeed in handbooks nor to navigate. True airspeed may be expressedin various units but it is usually seen as knots true airspeed (Ktas).
e. Mach number. Mach number is the ratio of true airspeed to the speed of sound. When Mach number ismeasured by an aircraft air data system, it is true Mach number.
Downloaded from http://www.everyspec.com on 2012-06-04T5:34:26.
MIL-STD-810F1 January 2000ANNEX B
METHOD 514.5514.5B-9
2.6.3 Altitude.
Aircraft air data systems measure local atmospheric pressure and convert this value to pressure altitude through astandard atmosphere model that relates pressure, temperature, and density. Pressure altitude is used in the equationsrelating airspeeds and dynamic pressure. Care must be exercised to assure that altitudes are pressure altitudes.Often, low altitude values for modern military aircraft are given as absolute height above local terrain. These valuesshould be changed to pressure altitude values. Guidance from engineers familiar with mission profile development isrequired to make this adjustment.
2.7 Similarity.
It is often desirable to use materiel in an application other than that for which it was developed. Also, changes aremade to existing materiel or the environmental exposures of an application change. The question arises as to how toverify that the materiel is suitable for the application. This is usually accomplished through a process called"qualification by similarity." Unfortunately, this process has never had a generally accepted definition. In practice itsometimes devolves to a paper exercise that provides traceability but has no engineering content. The following isan adaptation of a set of criterion that was provided to an Air Force avionics program. It is suggested as a basis forvibration similarity criteria. Tailor the criteria for materiel type, platform environments, and program restraints.Change the emphasis from circuit cards to the particular critical elements when the materiel is not an electronic box.Also, change the fatigue equation exponents as appropriate.
2.7.1 Unmodified materiel.
Qualify unmodified materiel (items that have not been changed in any way) by documented evidence that one of thefollowing is met:
a. The materiel was successfully qualified by test to vibration criteria that equals or exceeds the vibrationrequirements of the application.
b. The materiel has demonstrated acceptable reliability in an application where vibration environments andexposure durations are equal to or more stringent than the vibration requirements of the application.
c. The materiel was successfully qualified by test to vibration criteria that is exceeded by applicationrequirements by no more than 6 dB in maximum test level, and by no more than 50% in fatigue damagepotential at each frequency. In addition, vibration response at critical resonances is such that materiel lifeand function will be acceptable in the application.
2.7.2 Modified materiel.
Qualify modified materiel (items that have been changed in any way) by documented evidence that the unmodifiedmateriel meets the vibration requirements for the application supplemented by analyses and/or test datademonstrating that the modified materiel is dynamically similar to the unmodified materiel.
2.7.3 Equal vibration environment.
Previous test(s) or other vibration exposure(s) are considered to equal the application requirement when all of thefollowing conditions are met:
a. Previous exposures were the same type of vibration as the application requirement. That is, randomvibration must be compared to random criteria and sine must be compared to sine.
b. The exposure frequency range encompasses the application frequency range. Use a low frequency limitof the range that is the low frequency limit of the application requirement, or 1/2 of the lowest materielresonant frequency, whichever is higher. The high frequency limit of the range is the high frequencylimit of the application requirement.
Downloaded from http://www.everyspec.com on 2012-06-04T5:34:26.
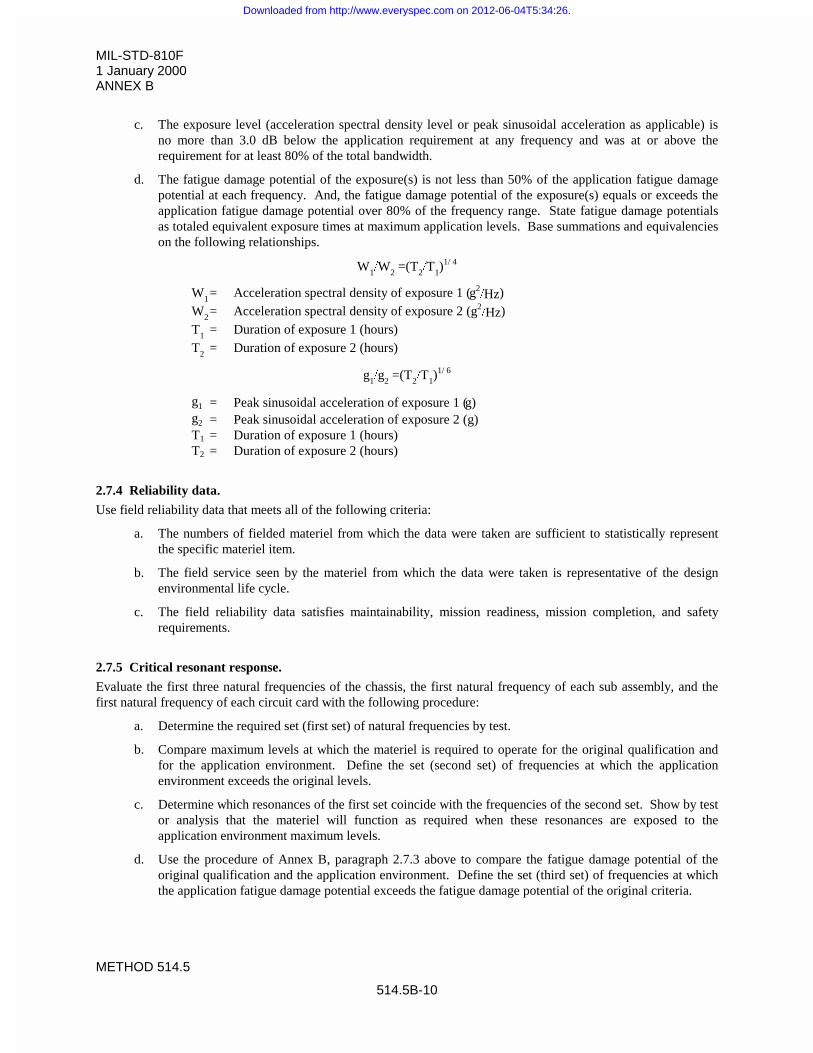
MIL-STD-810F1 January 2000ANNEX B
METHOD 514.5
514.5B-10
c. The exposure level (acceleration spectral density level or peak sinusoidal acceleration as applicable) isno more than 3.0 dB below the application requirement at any frequency and was at or above therequirement for at least 80% of the total bandwidth.
d. The fatigue damage potential of the exposure(s) is not less than 50% of the application fatigue damagepotential at each frequency. And, the fatigue damage potential of the exposure(s) equals or exceeds theapplication fatigue damage potential over 80% of the frequency range. State fatigue damage potentialsas totaled equivalent exposure times at maximum application levels. Base summations and equivalencieson the following relationships.
W1�W2 =(T2�T1)1/ 4
W1= Acceleration spectral density of exposure 1 ( g2�Hz)
W2= Acceleration spectral density of exposure 2 (g2�Hz)
T1 = Duration of exposure 1 (hours)T2 = Duration of exposure 2 (hours)
g1�g2 =(T2�T1)1/ 6
g1 = Peak sinusoidal acceleration of exposure 1 (g)g2 = Peak sinusoidal acceleration of exposure 2 (g)T1 = Duration of exposure 1 (hours)T2 = Duration of exposure 2 (hours)
2.7.4 Reliability data.
Use field reliability data that meets all of the following criteria:
a. The numbers of fielded materiel from which the data were taken are sufficient to statistically representthe specific materiel item.
b. The field service seen by the materiel from which the data were taken is representative of the designenvironmental life cycle.
c. The field reliability data satisfies maintainability, mission readiness, mission completion, and safetyrequirements.
2.7.5 Critical resonant response.
Evaluate the first three natural frequencies of the chassis, the first natural frequency of each sub assembly, and thefirst natural frequency of each circuit card with the following procedure:
a. Determine the required set (first set) of natural frequencies by test.
b. Compare maximum levels at which the materiel is required to operate for the original qualification andfor the application environment. Define the set (second set) of frequencies at which the applicationenvironment exceeds the original levels.
c. Determine which resonances of the first set coincide with the frequencies of the second set. Show by testor analysis that the materiel will function as required when these resonances are exposed to theapplication environment maximum levels.
d. Use the procedure of Annex B, paragraph 2.7.3 above to compare the fatigue damage potential of theoriginal qualification and the application environment. Define the set (third set) of frequencies at whichthe application fatigue damage potential exceeds the fatigue damage potential of the original criteria.
Downloaded from http://www.everyspec.com on 2012-06-04T5:34:26.

MIL-STD-810F1 January 2000ANNEX B
METHOD 514.5514.5B-11
e. Determine which resonances of the first set coincide with the frequencies of the third set. Show by testor analysis that the required materiel life will be obtained when these resonances are exposed to theapplication fatigue damage potential.
2.7.6 Dynamic similarity.
Consider modified materiel as dynamically similar to baseline materiel when all of the following apply:
a. The total change in mass of the unit and of each subassembly is within r10%.b. The unit center of gravity is within r10% of the original location in any direction.c. The mounting configuration is unchanged.d. The mounting configuration of circuit cards is unchanged.e. The first three natural frequencies of the chassis and the first natural frequency of each subassembly are
within r5% of the original frequencies.f. The first natural frequency of each circuit board is within r10% of the original frequency.g. Each modified circuit card is vibrated for one hour in the axis perpendicular to the plane of the board.
Use a test exposure that is 0.04 g2/Hz from 15 to 1000 Hz rolled off at 6 dB per octave to 2000 Hz.Maintain electrical continuity throughout the card during and after the test. (Where vibration levels anddurations at board level are known, these may be substituted for the stated exposure.)
h. Changes to mounts, chassis, internal support structures, and circuit card materials are to materials withequal or greater high cycle fatigue strength.
Downloaded from http://www.everyspec.com on 2012-06-04T5:34:26.

MIL-STD-810F1 January 2000ANNEX B
METHOD 514.5
514.5B-12
THIS PAGE INTENTIONALLY BLANK
Downloaded from http://www.everyspec.com on 2012-06-04T5:34:26.
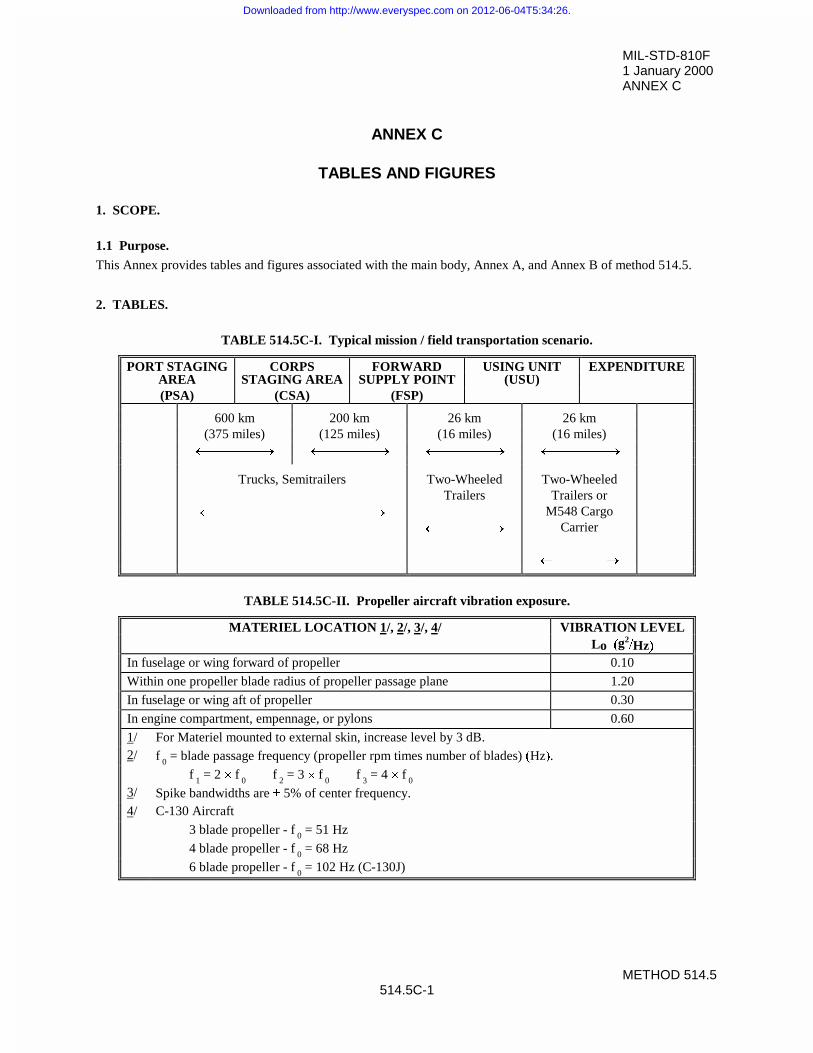
MIL-STD-810F1 January 2000ANNEX C
METHOD 514.5514.5C-1
ANNEX C
TABLES AND FIGURES
1. SCOPE.
1.1 Purpose.
This Annex provides tables and figures associated with the main body, Annex A, and Annex B of method 514.5.
2. TABLES.
TABLE 514.5C-I. Typical mission / field transportation scenario.
PORT STAGING CORPS FORWARD USING UNIT EXPENDITUREAREA STAGING AREA SUPPLY POINT (USU)(PSA) (CSA) (FSP)
600 km 200 km 26 km 26 km(375 miles) (125 miles) (16 miles) (16 miles)
m����o m����o m����o m����o
Trucks, Semitrailers Two-Wheeled Two-WheeledTrailers Trailers or
m������������o M548 Cargom����o Carrier
m����o
TABLE 514.5C-II. Propeller aircraft vibration exposure.
MATERIEL LOCATION 1/, 2/, 3/, 4/ VIBRATION LEVELLo ��g2
��Hz��In fuselage or wing forward of propeller 0.10
Within one propeller blade radius of propeller passage plane 1.20
In fuselage or wing aft of propeller 0.30
In engine compartment, empennage, or pylons 0.60
1/ For Materiel mounted to external skin, increase level by 3 dB.2/ f 0 = blade passage frequency (propeller rpm times number of blades) �Hz�.
f 1 = 2 u f 0 f 2 = 3 u f 0 f 3 = 4 u f 0
3/ Spike bandwidths are r 5% of center frequency.4/ C-130 Aircraft
3 blade propeller - f 0 = 51 Hz
4 blade propeller - f 0 = 68 Hz
6 blade propeller - f 0 = 102 Hz (C-130J)
Downloaded from http://www.everyspec.com on 2012-06-04T5:34:26.
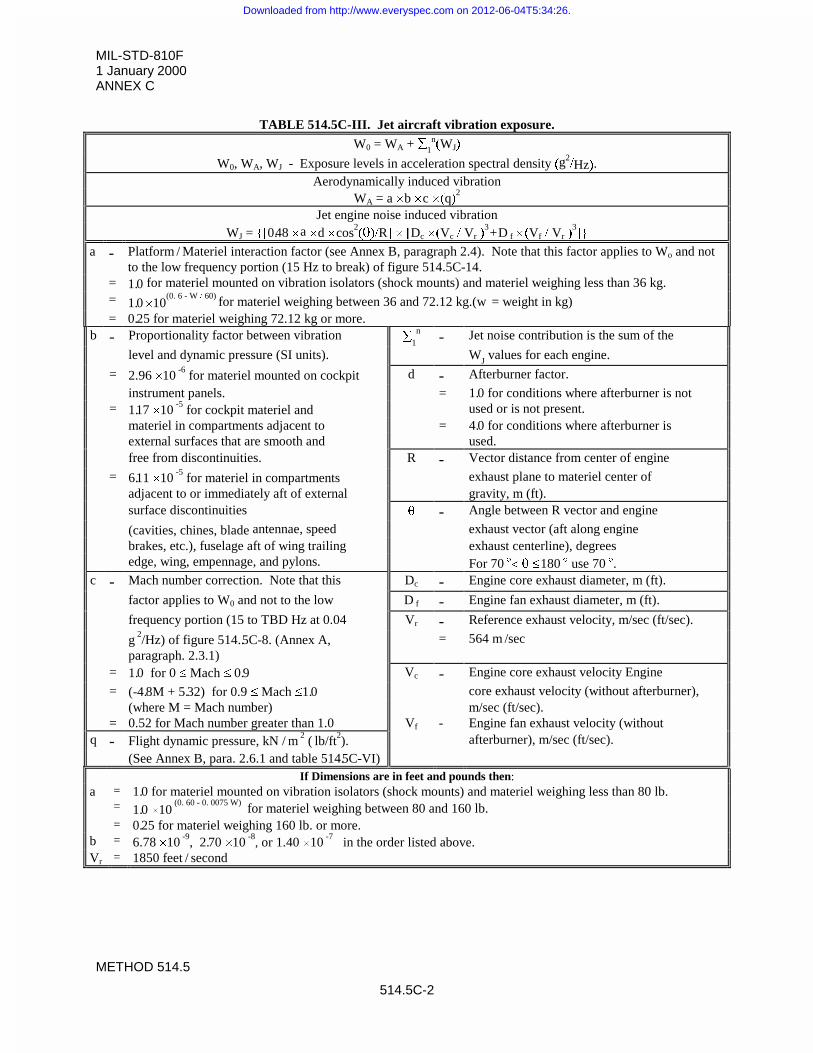
MIL-STD-810F1 January 2000ANNEX C
METHOD 514.5
514.5C-2
TABLE 514.5C-III. Jet aircraft vibration exposure.
W0 = WA + ¦1n�WJ�
W0, WA, WJ - Exposure levels in acceleration spectral density �g2�Hz�.
Aerodynamically induced vibrationWA = a u b u c u �q�2
Jet engine noise induced vibrationWJ = ^>0.48 u a u d u cos2
�T��R@ u >Dc u �Vc � Vr �3 + D f u �Vf � Vr �
3@`
a - Platform / Materiel interaction factor (see Annex B, paragraph 2.4). Note that this factor applies to Wo and notto the low frequency portion (15 Hz to break) of figure 514.5C-14.
= 1. 0 for materiel mounted on vibration isolators (shock mounts) and materiel weighing less than 36 kg.= 1. 0 u10
(0. 6 - W � 60) for materiel weighing between 36 and 72.12 kg.(w = weight in kg)= 0. 25 for materiel weighing 72.12 kg or more.
b - Proportionality factor between vibration ¦1
n - Jet noise contribution is the sum of the
level and dynamic pressure (SI units). WJ values for each engine.
= 2.96 u10 -6 for materiel mounted on cockpit d - Afterburner factor.
instrument panels. = 1. 0 for conditions where afterburner is not= 1.17 u10 -5 for cockpit materiel and used or is not present.
materiel in compartments adjacent to = 4. 0 for conditions where afterburner isexternal surfaces that are smooth and used.free from discontinuities. R - Vector distance from center of engine
= 6.11 u10 -5 for materiel in compartments exhaust plane to materiel center ofadjacent to or immediately aft of external gravity, m (ft).surface discontinuities T - Angle between R vector and engine
(cavities, chines, blade antennae, speed exhaust vector (aft along enginebrakes, etc.), fuselage aft of wing trailing exhaust centerline), degreesedge, wing, empennage, and pylons. For 70 q� T d 180 q use 70 q.
c - Mach number correction. Note that this Dc - Engine core exhaust diameter, m (ft).
factor applies to W0 and not to the low D f - Engine fan exhaust diameter, m (ft).
frequency portion (15 to TBD Hz at 0.04 Vr - Reference exhaust velocity, m/sec (ft/sec).
g 2/Hz) of figure 514..5C-8. (Annex A,paragraph. 2.3.1)
= 564 m /sec
= 1. 0 for 0 d Mach d 0. 9 Vc - Engine core exhaust velocity Engine
= (-4. 8M + 5. 32) for 0.9 d Mach d1. 0 core exhaust velocity (without afterburner),
=(where M = Mach number)0.52 for Mach number greater than 1.0 Vf -
m/sec (ft/sec).Engine fan exhaust velocity (without
q - Flight dynamic pressure, kN / m 2 ( lb/ft2). afterburner), m/sec (ft/sec).
(See Annex B, para. 2.6.1 and table 514.5C-VI)If Dimensions are in feet and pounds then:
a = 1. 0 for materiel mounted on vibration isolators (shock mounts) and materiel weighing less than 80 lb.= 1. 0 u10
(0. 60 - 0. 0075 W) for materiel weighing between 80 and 160 lb.
= 0. 25 for materiel weighing 160 lb. or more.b = 6.78 u10 -9, 2. 70 u10 -8
, or 1.40 u10 -7 in the order listed above.Vr = 1850 feet / second
Downloaded from http://www.everyspec.com on 2012-06-04T5:34:26.
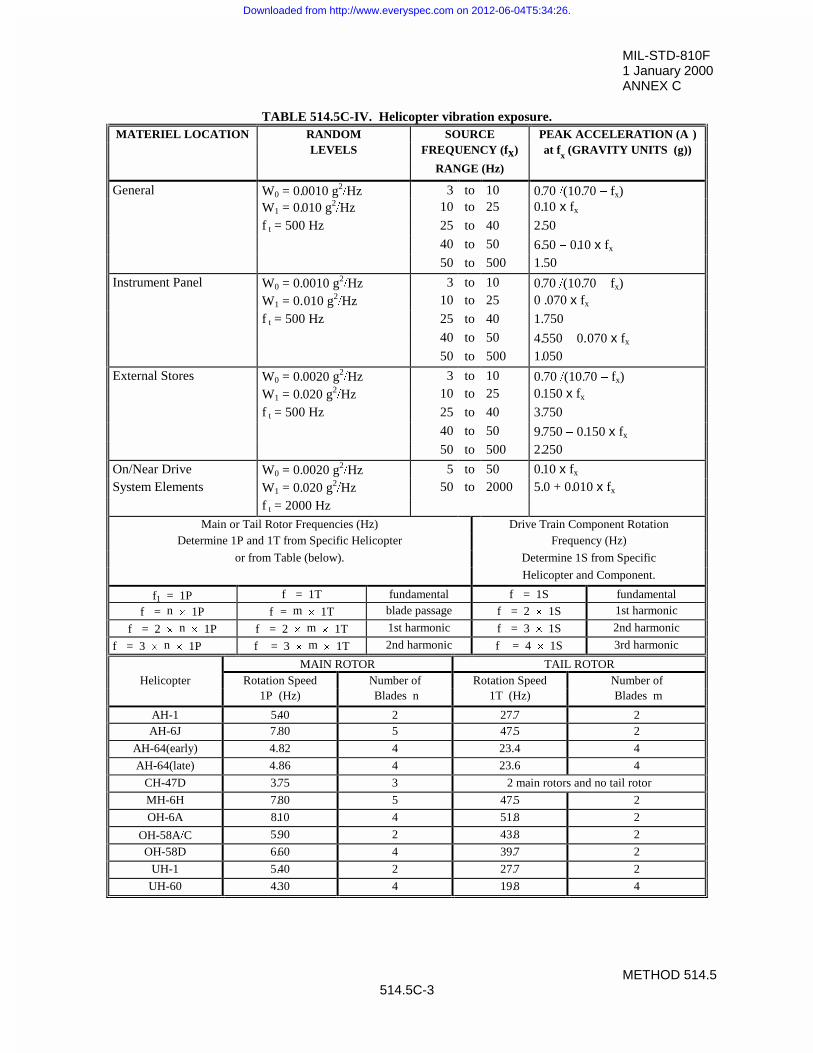
MIL-STD-810F1 January 2000ANNEX C
METHOD 514.5514.5C-3
TABLE 514.5C-IV. Helicopter vibration exposure.MATERIEL LOCATION RANDOM SOURCE PEAK ACCELERATION (A )
LEVELS FREQUENCY (fx) at fx (GRAVITY UNITS (g))
RANGE (Hz)
General W0 = 0. 0010 g2�Hz 3 to 10 0. 70 �(10. 70 � fx)
W1 = 0. 010 g2�Hz 10 to 25 0. 10 x fx
f t = 500 Hz 25 to 40 2. 50
40 to 50 6. 50 � 0.10 x fx
50 to 500 1. 50
Instrument Panel W0 = 0. 0010 g2�Hz 3 to 10 0. 70 �(10. 70 � fx)
W1 = 0. 010 g2�Hz 10 to 25 0 . 070 x fx
f t = 500 Hz 25 to 40 1. 750
40 to 50 4. 550 � 0. 070 x fx
50 to 500 1. 050
External Stores W0 = 0. 0020 g2�Hz 3 to 10 0. 70 �(10. 70 � fx)
W1 = 0. 020 g2�Hz 10 to 25 0. 150 x fx
f t = 500 Hz 25 to 40 3. 750
40 to 50 9. 750 � 0. 150 x fx
50 to 500 2. 250
On/Near Drive W0 = 0. 0020 g2�Hz 5 to 50 0. 10 x fx
System Elements W1 = 0. 020 g2�Hz 50 to 2000 5. 0 + 0. 010 x fx
f t = 2000 HzMain or Tail Rotor Frequencies (Hz) Drive Train Component Rotation
Determine 1P and 1T from Specific Helicopter Frequency (Hz)
or from Table (below). Determine 1S from Specific
Helicopter and Component.
f1 = 1P f = 1T fundamental f = 1S fundamental
f = n u 1P f = m u 1T blade passage f = 2 u 1S 1st harmonic
f = 2 u n u 1P f = 2 u m u 1T 1st harmonic f = 3 u 1S 2nd harmonic
f = 3 u n u 1P f = 3 u m u 1T 2nd harmonic f = 4 u 1S 3rd harmonic
MAIN ROTOR TAIL ROTORHelicopter Rotation Speed Number of Rotation Speed Number of
1P (Hz) Blades n 1T (Hz) Blades m
AH-1 5.40 2 27. 7 2AH-6J 7. 80 5 47. 5 2
AH-64(early) 4.82 4 23.4 4
AH-64(late) 4.86 4 23.6 4
CH-47D 3. 75 3 2 main rotors and no tail rotor
MH-6H 7. 80 5 47. 5 2
OH-6A 8.10 4 51. 8 2
OH-58A�C 5. 90 2 43. 8 2
OH-58D 6. 60 4 39. 7 2
UH-1 5. 40 2 27. 7 2
UH-60 4. 30 4 19. 8 4
Downloaded from http://www.everyspec.com on 2012-06-04T5:34:26.
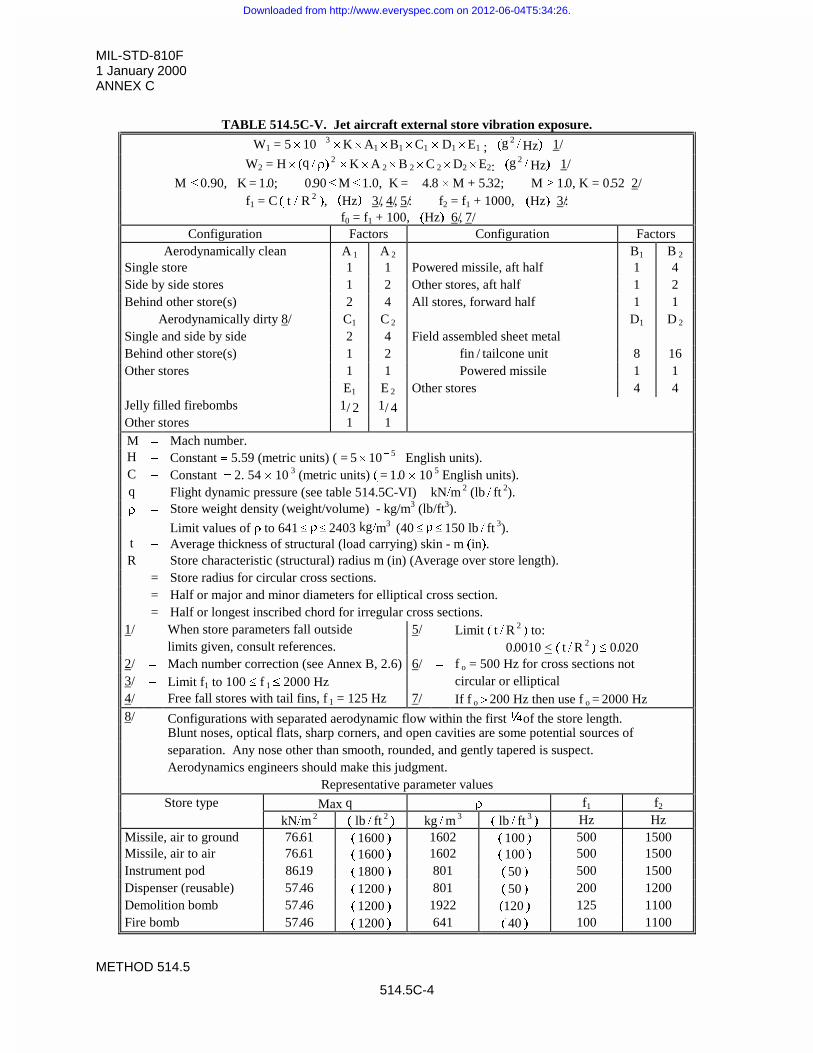
MIL-STD-810F1 January 2000ANNEX C
METHOD 514.5
514.5C-4
TABLE 514.5C-V. Jet aircraft external store vibration exposure.
W1 = 5 u 10 � 3 u K u A1 u B1 u C1 u D1 u E1 ; �g 2 � Hz� 1/
W2 = H u �q � U� 2
u K u A 2 u B 2 u C 2 u D2 u E2: �g 2 � Hz� 1/
M d 0.90, K = 1. 0; 0. 90 d M d 1.0, K = � 4. 8 u M + 5. 32; M t 1. 0, K = 0. 52 2/f1 = C � t � R
2 �, �Hz� 3/, 4/, 5/: f2 = f1 + 1000, �Hz� 3/:f0 = f1 + 100, �Hz� 6/, 7/
Configuration Factors Configuration FactorsAerodynamically clean A 1 A 2 B1 B 2
Single store 1 1 Powered missile, aft half 1 4Side by side stores 1 2 Other stores, aft half 1 2Behind other store(s) 2 4 All stores, forward half 1 1
Aerodynamically dirty 8/ C1 C 2 D1 D 2
Single and side by side 2 4 Field assembled sheet metalBehind other store(s) 1 2 fin / tailcone unit 8 16Other stores 1 1 Powered missile 1 1
E1 E 2 Other stores 4 4Jelly filled firebombs 1/ 2 1/ 4Other stores 1 1M � Mach number.H � Constant 5.59 (metric units) ( = 5 u 10
� 5 English units).C � Constant 2. 54 u 10
3 (metric units) � = 1. 0 u 10 5 English units).
q � Flight dynamic pressure (see table 514.5C-VI) � kN�m 2 (lb � ft
2).U � Store weight density (weight/volume) - kg/m3 (lb/ft3).
Limit values of U to 641 d U d 2403 kg�m3 (40 d U d 150 lb � ft 3).
t � Average thickness of structural (load carrying) skin - m �in�.R � Store characteristic (structural) radius m (in) (Average over store length).
= Store radius for circular cross sections.= Half or major and minor diameters for elliptical cross section.= Half or longest inscribed chord for irregular cross sections.
1/ � When store parameters fall outside 5/ � Limit � t � R 2 � to:
limits given, consult references. 0. 0010 < � t � R 2 � d 0. 020
2/ � Mach number correction (see Annex B, 2.6) 6/ � f o = 500 Hz for cross sections not3/ � Limit f1 to 100 d f 1 d 2000 Hz circular or elliptical4/ � Free fall stores with tail fins, f 1 = 125 Hz 7/ � If f o ! 200 Hz then use f o = 2000 Hz8/ � Configurations with separated aerodynamic flow within the first óof the store length.
Blunt noses, optical flats, sharp corners, and open cavities are some potential sources ofseparation. Any nose other than smooth, rounded, and gently tapered is suspect.Aerodynamics engineers should make this judgment.
Representative parameter valuesStore type Max q U f1 f2
kN�m 2
� lb � ft 2 � kg � m
3� lb � ft
3 � Hz HzMissile, air to ground 76. 61 � 1600 � 1602 � 100 � 500 1500Missile, air to air 76. 61 � 1600 � 1602 � 100 � 500 1500Instrument pod 86.19 � 1800 � 801 � 50 � 500 1500Dispenser (reusable) 57. 46 � 1200 � 801 � 50 � 200 1200Demolition bomb 57. 46 � 1200 � 1922 �120 � 125 1100Fire bomb 57. 46 � 1200 � 641 � 40 � 100 1100
Downloaded from http://www.everyspec.com on 2012-06-04T5:34:26.
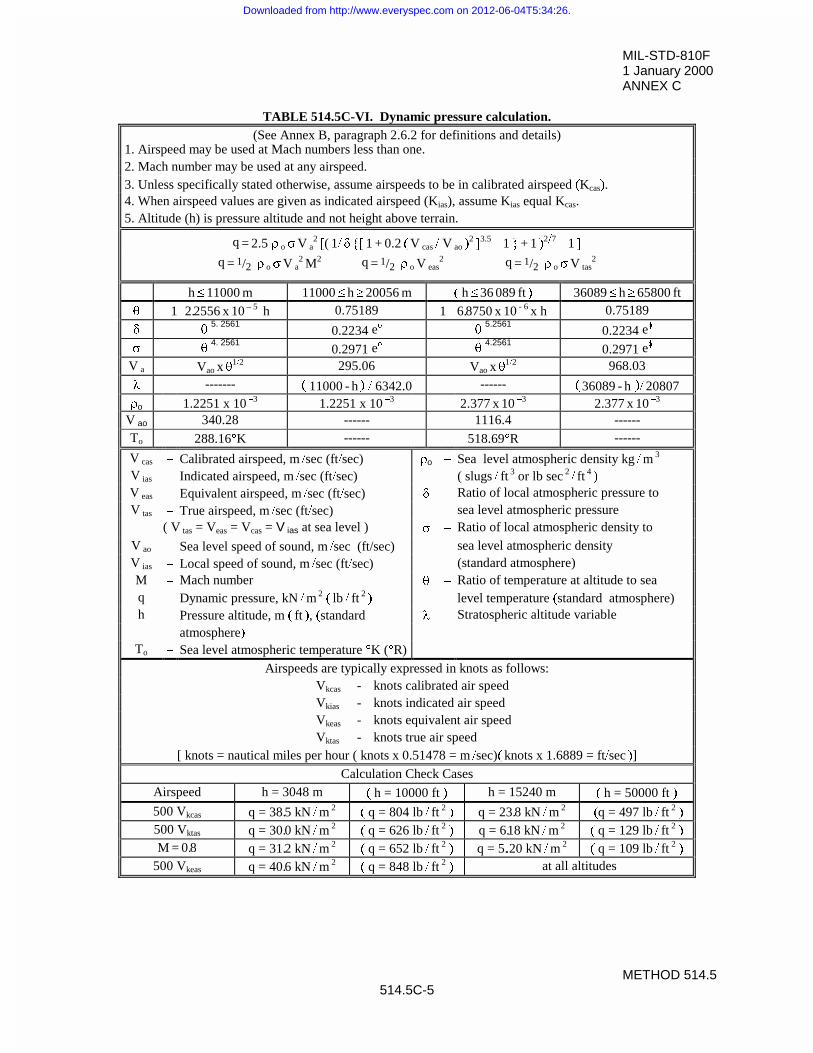
MIL-STD-810F1 January 2000ANNEX C
METHOD 514.5514.5C-5
TABLE 514.5C-VI. Dynamic pressure calculation.(See Annex B, paragraph 2.6.2 for definitions and details)
1. Airspeed may be used at Mach numbers less than one.2. Mach number may be used at any airspeed.3. Unless specifically stated otherwise, assume airspeeds to be in calibrated airspeed �Kcas�.4. When airspeed values are given as indicated airspeed (Kias), assume Kias equal Kcas.5. Altitude (h) is pressure altitude and not height above terrain.
q = 2.5 U o V V a2
>( 1� G ^> 1 + 0.2 � V cas � V ao �2 @
3.5 � 1 ` + 1 �
2�7 � 1 @
q = 1/2 U o V V a
2 M
2 q = 1/2 U o V eas
2 q = 1/2 U o V V tas
2
h d 11000 m 11000 d h t 20056 m � h d 36 089 ft � 36089 d h t 65800 ft
T 1�2. 2556 x 10 – 5 h 0.75189 1� 6. 8750 x 10
- 6 x h 0.75189
G T5. 2561
0.2234 eIT
5.25610.2234 eI
V T4. 2561
0.2971 eIT
4.25610.2971 eI
V a Vao x T1�2 295.06 Vao x T
1�2 968.03
O ------- � 11000 - h � � 6342.0 ------ � 36089 - h �� 20807Uo 1.2251 x 10
�3 1.2251 x 10 �3 2.377 x 10
�3 2.377 x 10 �3
V ao 340.28 ------ 1116.4 ------To 288.16qK ------ 518.69qR ------
V cas � Calibrated airspeed, m �sec (ft�sec) Uo � Sea level atmospheric density kg � m 3
V ias � Indicated airspeed, m �sec (ft�sec) ( slugs � ft 3 or lb sec
2 � ft
4 �
V eas � Equivalent airspeed, m �sec (ft�sec) G � Ratio of local atmospheric pressure toV tas � True airspeed, m �sec (ft�sec) sea level atmospheric pressure
( V tas = Veas = Vcas = V ias at sea level ) V � Ratio of local atmospheric density to
V ao � Sea level speed of sound, m �sec (ft/sec) sea level atmospheric densityV ias � Local speed of sound, m �sec (ft�sec) (standard atmosphere)M � Mach number T � Ratio of temperature at altitude to seaq � Dynamic pressure, kN � m
2 � lb � ft 2 � level temperature �standard atmosphere)
h � Pressure altitude, m � ft �, �standard O � Stratospheric altitude variableatmosphere�
To � Sea level atmospheric temperature qK (qR)
Airspeeds are typically expressed in knots as follows:Vkcas - knots calibrated air speedVkias - knots indicated air speedVkeas - knots equivalent air speedVktas - knots true air speed
[ knots = nautical miles per hour ( knots x 0.51478 = m �sec)� knots x 1.6889 = ft�sec �]
Calculation Check CasesAirspeed h = 3048 m � h = 10000 ft � h = 15240 m � h = 50000 ft �
500 Vkcas q = 38. 5 kN � m 2
� q = 804 lb � ft 2 � q = 23. 8 kN � m
2 �q = 497 lb � ft 2 �
500 Vktas q = 30. 0 kN � m 2
� q = 626 lb � ft 2 � q = 6.18 kN � m
2� q = 129 lb � ft
2 �M = 0. 8 q = 31. 2 kN � m
2� q = 652 lb � ft
2 � q = 5..20 kN � m 2
� q = 109 lb � ft 2 �
500 Vkeas q = 40. 6 kN � m 2
� q = 848 lb � ft 2 � at all altitudes
Downloaded from http://www.everyspec.com on 2012-06-04T5:34:26.
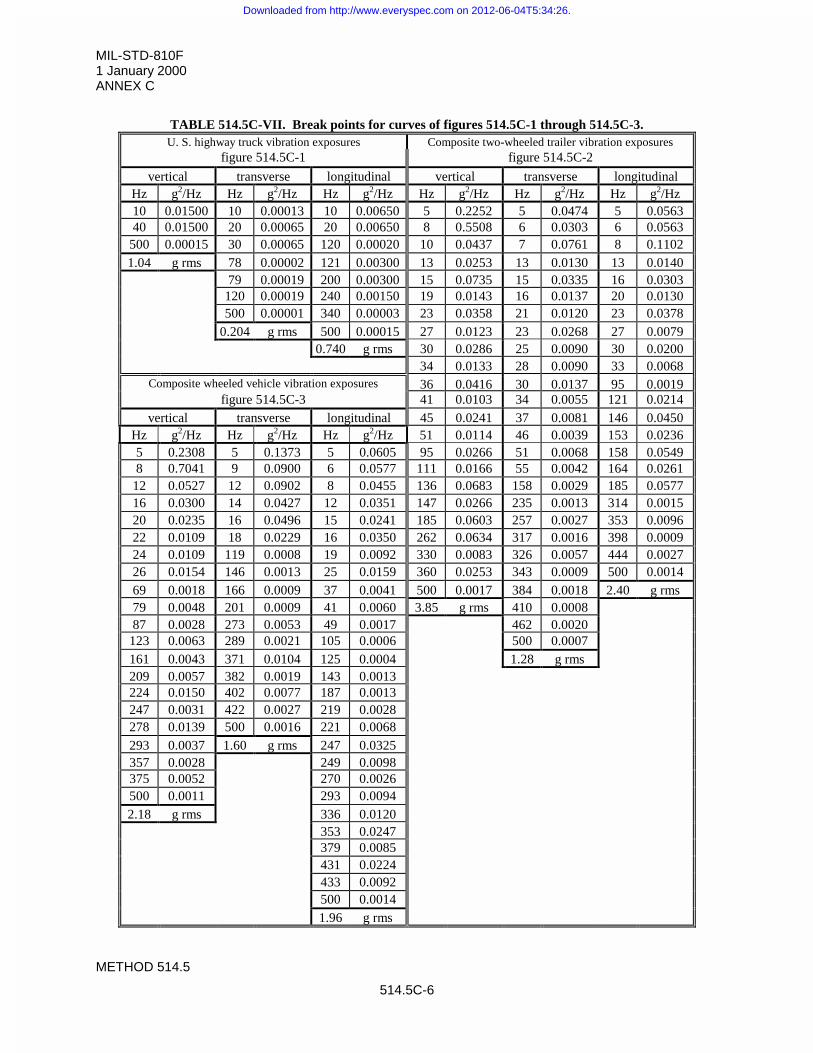
MIL-STD-810F1 January 2000ANNEX C
METHOD 514.5
514.5C-6
TABLE 514.5C-VII. Break points for curves of figures 514.5C-1 through 514.5C-3.U. S. highway truck vibration exposures Composite two-wheeled trailer vibration exposures
figure 514.5C-1 figure 514.5C-2
vertical transverse longitudinal vertical transverse longitudinalHz g2/Hz Hz g2/Hz Hz g2/Hz Hz g2/Hz Hz g2/Hz Hz g2/Hz10 0.01500 10 0.00013 10 0.00650 5 0.2252 5 0.0474 5 0.056340 0.01500 20 0.00065 20 0.00650 8 0.5508 6 0.0303 6 0.0563
500 0.00015 30 0.00065 120 0.00020 10 0.0437 7 0.0761 8 0.11021.04 g rms 78 0.00002 121 0.00300 13 0.0253 13 0.0130 13 0.0140
79 0.00019 200 0.00300 15 0.0735 15 0.0335 16 0.0303120 0.00019 240 0.00150 19 0.0143 16 0.0137 20 0.0130500 0.00001 340 0.00003 23 0.0358 21 0.0120 23 0.0378
0.204 g rms 500 0.00015 27 0.0123 23 0.0268 27 0.00790.740 g rms 30 0.0286 25 0.0090 30 0.0200
34 0.0133 28 0.0090 33 0.0068Composite wheeled vehicle vibration exposures 36 0.0416 30 0.0137 95 0.0019
figure 514.5C-3 41 0.0103 34 0.0055 121 0.0214vertical transverse longitudinal 45 0.0241 37 0.0081 146 0.0450
Hz g2/Hz Hz g2/Hz Hz g2/Hz 51 0.0114 46 0.0039 153 0.02365 0.2308 5 0.1373 5 0.0605 95 0.0266 51 0.0068 158 0.05498 0.7041 9 0.0900 6 0.0577 111 0.0166 55 0.0042 164 0.0261
12 0.0527 12 0.0902 8 0.0455 136 0.0683 158 0.0029 185 0.057716 0.0300 14 0.0427 12 0.0351 147 0.0266 235 0.0013 314 0.001520 0.0235 16 0.0496 15 0.0241 185 0.0603 257 0.0027 353 0.009622 0.0109 18 0.0229 16 0.0350 262 0.0634 317 0.0016 398 0.000924 0.0109 119 0.0008 19 0.0092 330 0.0083 326 0.0057 444 0.002726 0.0154 146 0.0013 25 0.0159 360 0.0253 343 0.0009 500 0.001469 0.0018 166 0.0009 37 0.0041 500 0.0017 384 0.0018 2.40 g rms79 0.0048 201 0.0009 41 0.0060 3.85 g rms 410 0.000887 0.0028 273 0.0053 49 0.0017 462 0.0020
123 0.0063 289 0.0021 105 0.0006 500 0.0007161 0.0043 371 0.0104 125 0.0004 1.28 g rms209 0.0057 382 0.0019 143 0.0013224 0.0150 402 0.0077 187 0.0013247 0.0031 422 0.0027 219 0.0028278 0.0139 500 0.0016 221 0.0068293 0.0037 1.60 g rms 247 0.0325357 0.0028 249 0.0098375 0.0052 270 0.0026500 0.0011 293 0.00942.18 g rms 336 0.0120
353 0.0247379 0.0085431 0.0224433 0.0092500 0.00141.96 g rms
Downloaded from http://www.everyspec.com on 2012-06-04T5:34:26.
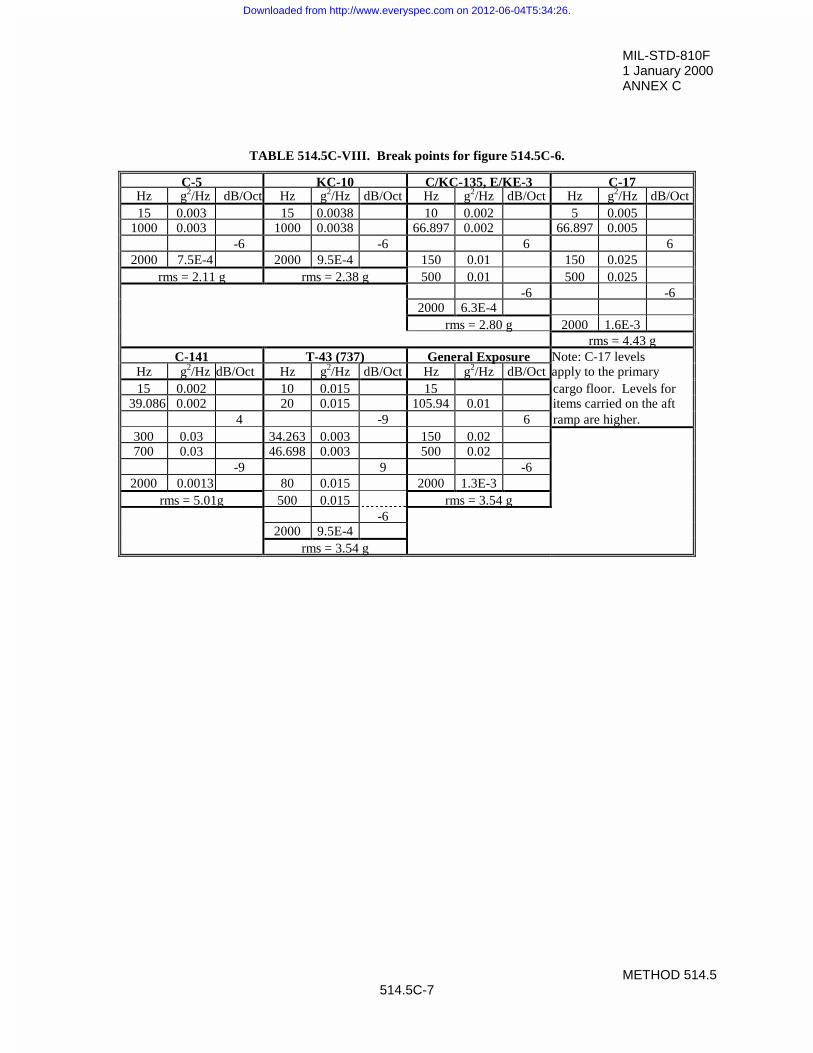
MIL-STD-810F1 January 2000ANNEX C
METHOD 514.5514.5C-7
TABLE 514.5C-VIII. Break points for figure 514.5C-6.
C-5 KC-10 C/KC-135, E/KE-3 C-17Hz g2/Hz dB/Oct Hz g2/Hz dB/Oct Hz g2/Hz dB/Oct Hz g2/Hz dB/Oct15 0.003 15 0.0038 10 0.002 5 0.005
1000 0.003 1000 0.0038 66.897 0.002 66.897 0.005-6 -6 6 6
2000 7.5E-4 2000 9.5E-4 150 0.01 150 0.025rms = 2.11 g rms = 2.38 g 500 0.01 500 0.025
-6 -62000 6.3E-4
rms = 2.80 g 2000 1.6E-3rms = 4.43 g
C-141 T-43 (737) General Exposure Note: C-17 levelsHz g2/Hz dB/Oct Hz g2/Hz dB/Oct Hz g2/Hz dB/Oct apply to the primary15 0.002 10 0.015 15 cargo floor. Levels for
39.086 0.002 20 0.015 105.94 0.01 items carried on the aft4 -9 6 ramp are higher.
300 0.03 34.263 0.003 150 0.02700 0.03 46.698 0.003 500 0.02
-9 9 -62000 0.0013 80 0.015 2000 1.3E-3
rms = 5.01g 500 0.015 rms = 3.54 g-6
2000 9.5E-4rms = 3.54 g
Downloaded from http://www.everyspec.com on 2012-06-04T5:34:26.
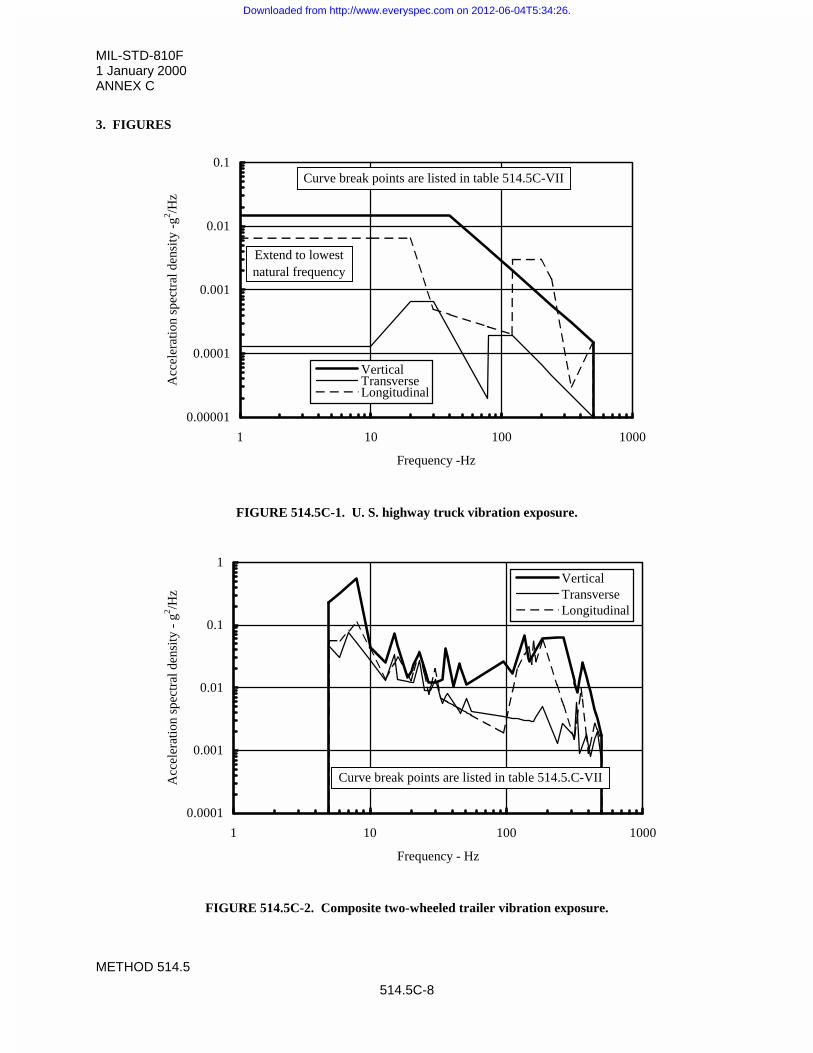
MIL-STD-810F1 January 2000ANNEX C
METHOD 514.5
514.5C-8
3. FIGURES
0.00001
0.0001
0.001
0.01
0.1
1 10 100 1000
Frequency -Hz
Acc
eler
atio
n sp
ectr
al d
ensi
ty -
g2 /Hz
VerticalTransverseLongitudinal
Extend to lowest natural frequency
Curve break points are listed in table 514.5C-VII
FIGURE 514.5C-1. U. S. highway truck vibration exposure.
0.0001
0.001
0.01
0.1
1
1 10 100 1000
Frequency - Hz
Acc
eler
atio
n sp
ectr
al d
ensi
ty -
g2 /H
z
VerticalTransverseLongitudinal
Curve break points are listed in table 514.5.C-VII
FIGURE 514.5C-2. Composite two-wheeled trailer vibration exposure.
Downloaded from http://www.everyspec.com on 2012-06-04T5:34:26.
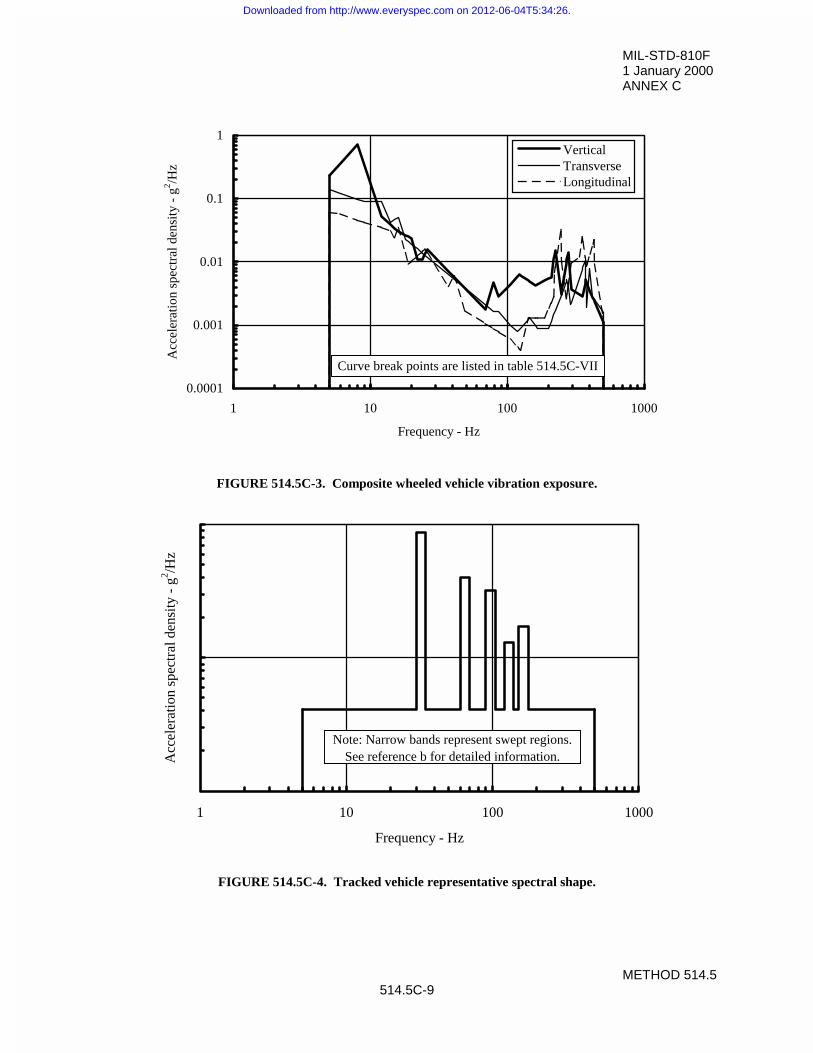
MIL-STD-810F1 January 2000ANNEX C
METHOD 514.5514.5C-9
0.0001
0.001
0.01
0.1
1
1 10 100 1000
Frequency - Hz
Acc
eler
atio
n sp
ectr
al d
ensi
ty -
g2 /H
z
VerticalTransverseLongitudinal
Curve break points are listed in table 514.5C-VII
FIGURE 514.5C-3. Composite wheeled vehicle vibration exposure.
1 10 100 1000
Frequency - Hz
Acc
eler
atio
n sp
ectr
al d
ensi
ty -
g2 /H
z
Note: Narrow bands represent swept regions.See reference b for detailed information.
FIGURE 514.5C-4. Tracked vehicle representative spectral shape.
Downloaded from http://www.everyspec.com on 2012-06-04T5:34:26.
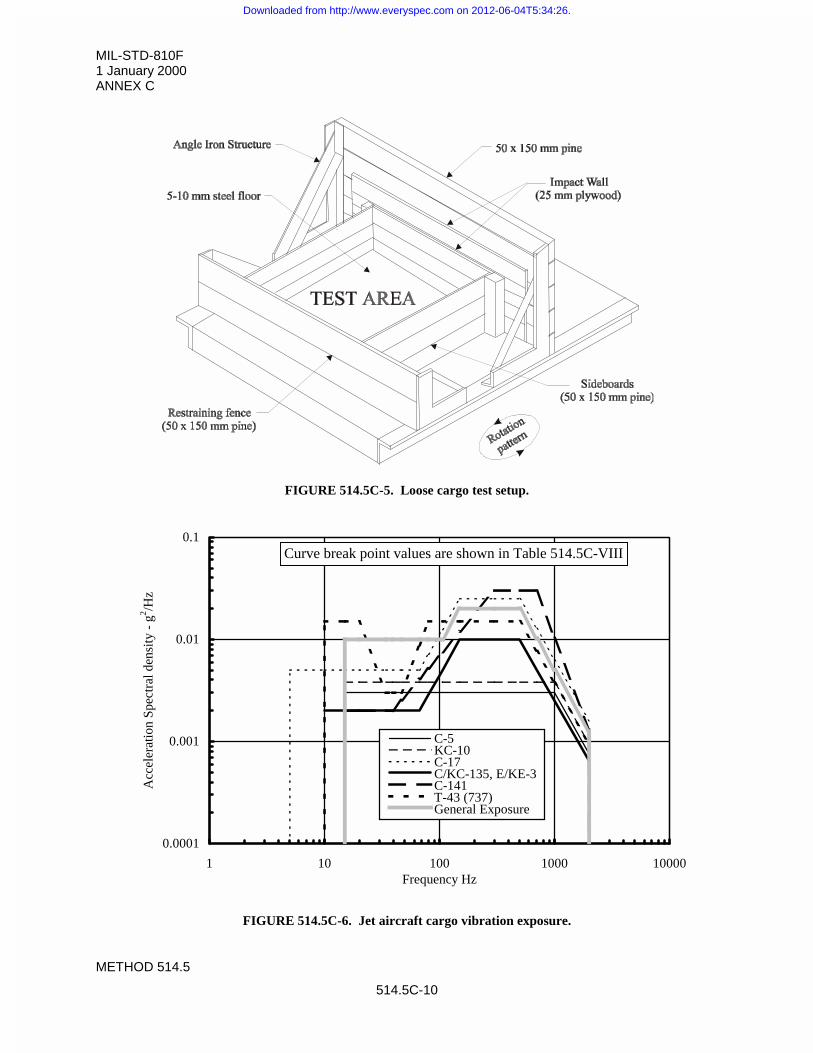
MIL-STD-810F1 January 2000ANNEX C
METHOD 514.5
514.5C-10
FIGURE 514.5C-5. Loose cargo test setup.
0.0001
0.001
0.01
0.1
1 10 100 1000 10000Frequency Hz
Acc
eler
atio
n Sp
ectr
al d
ensi
ty -
g2 /H
z
C-5KC-10C-17C/KC-135, E/KE-3C-141T-43 (737)General Exposure
Curve break point values are shown in Table 514.5C-VIII
FIGURE 514.5C-6. Jet aircraft cargo vibration exposure.
Downloaded from http://www.everyspec.com on 2012-06-04T5:34:26.
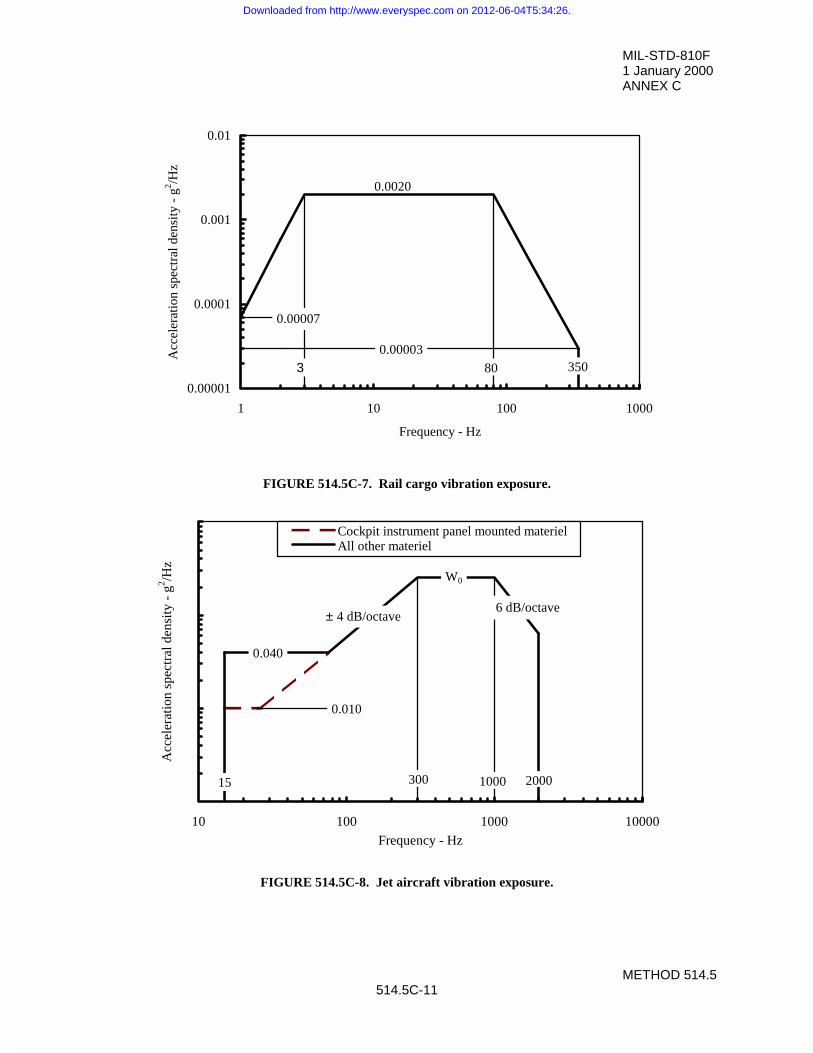
MIL-STD-810F1 January 2000ANNEX C
METHOD 514.5514.5C-11
0.00001
0.0001
0.001
0.01
1 10 100 1000
Frequency - Hz
Acc
eler
atio
n sp
ectr
al d
ensi
ty -
g2 /H
z0.0020
0.00007
3 80
0.00003350
FIGURE 514.5C-7. Rail cargo vibration exposure.
10 100 1000 10000Frequency - Hz
Acc
eler
atio
n sp
ectr
al d
ensi
ty -
g2 /H
z
Cockpit instrument panel mounted materielAll other materiel
W0
300
0.040
0.010
± 4 dB/octave� 6 dB/octave
15 20001000
FIGURE 514.5C-8. Jet aircraft vibration exposure.
Downloaded from http://www.everyspec.com on 2012-06-04T5:34:26.
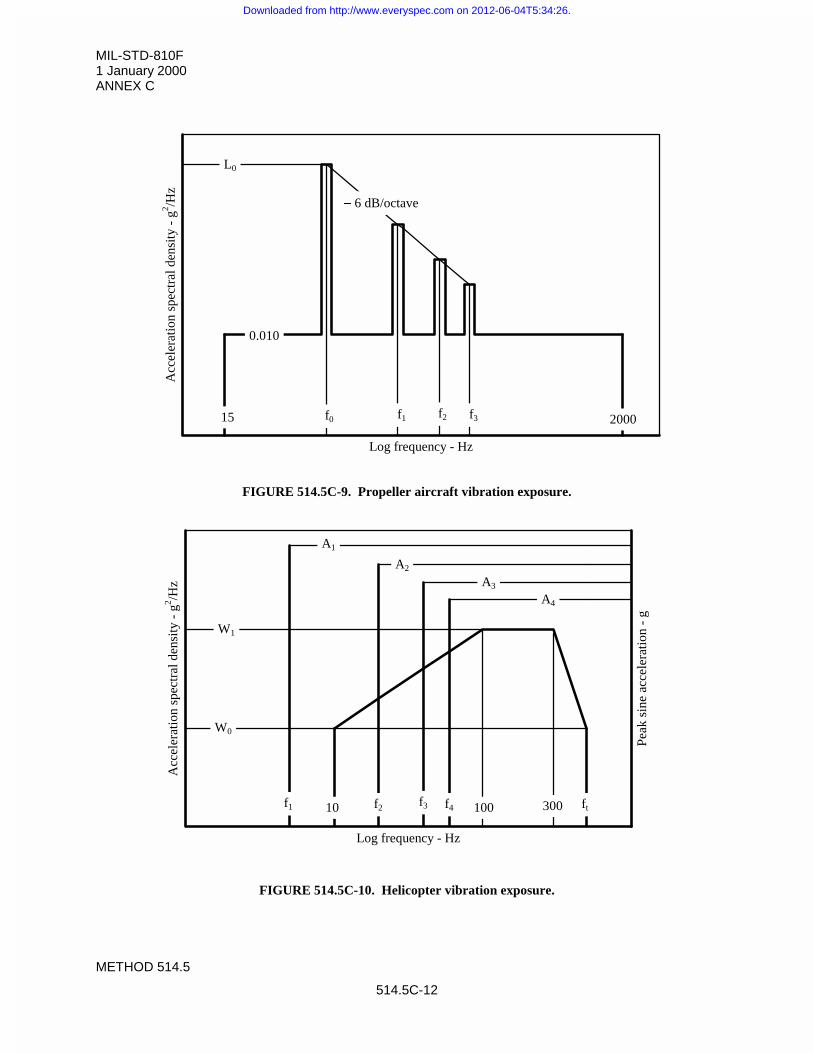
MIL-STD-810F1 January 2000ANNEX C
METHOD 514.5
514.5C-12
Log frequency - Hz
Acc
eler
atio
n sp
ectr
al d
ensi
ty -
g2 /H
zL0
0.010
� 6 dB/octave
15 2000f0 f1 f2 f3
FIGURE 514.5C-9. Propeller aircraft vibration exposure.
Log frequency - Hz
Acc
eler
atio
n sp
ectr
al d
ensi
ty -
g2 /H
z
Peak
sin
e ac
cele
ratio
n -
gW1
W0
A1
A2
A3
A4
10010 300f1 f2 f3 f4 ft
FIGURE 514.5C-10. Helicopter vibration exposure.
Downloaded from http://www.everyspec.com on 2012-06-04T5:34:26.
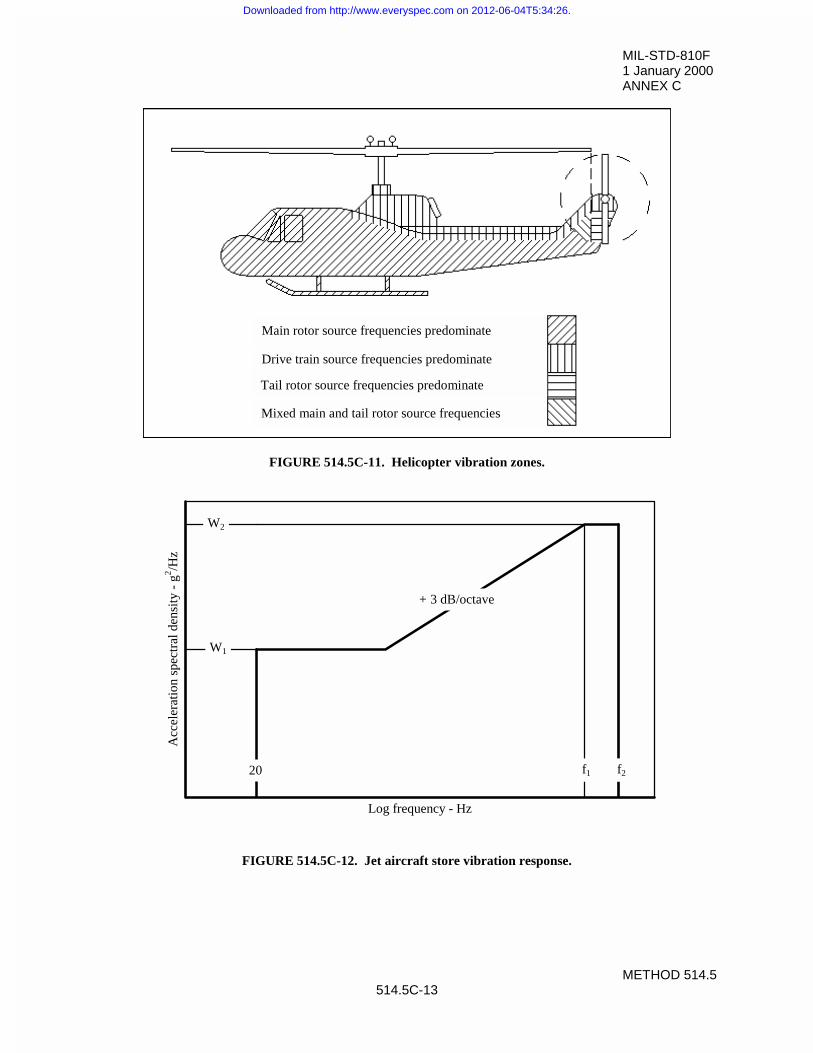
MIL-STD-810F1 January 2000ANNEX C
METHOD 514.5514.5C-13
Main rotor source frequencies predominate
Drive train source frequencies predominate
Tail rotor source frequencies predominate
Mixed main and tail rotor source frequencies
FIGURE 514.5C-11. Helicopter vibration zones.
Log frequency - Hz
Acc
eler
atio
n sp
ectr
al d
ensi
ty -
g2 /H
z
W1
W2
f1 f220
+ 3 dB/octave
FIGURE 514.5C-12. Jet aircraft store vibration response.
Downloaded from http://www.everyspec.com on 2012-06-04T5:34:26.
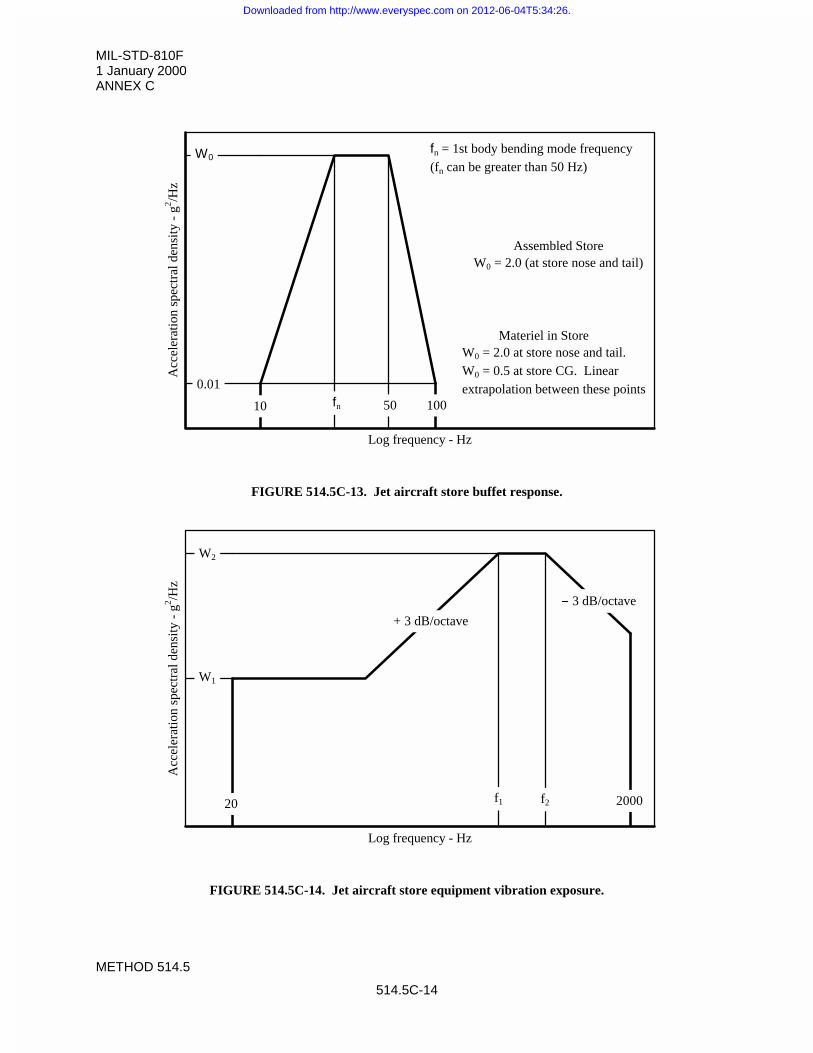
MIL-STD-810F1 January 2000ANNEX C
METHOD 514.5
514.5C-14
Log frequency - Hz
Acc
eler
atio
n sp
ectr
al d
ensi
ty -
g2 /H
z
W0
fn
0.01
10 50 100
fn = 1st body bending mode frequency(fn can be greater than 50 Hz)
Assembled StoreW0 = 2.0 (at store nose and tail)
Materiel in StoreW0 = 2.0 at store nose and tail. W0 = 0.5 at store CG. Linear extrapolation between these points
FIGURE 514.5C-13. Jet aircraft store buffet response.
Log frequency - Hz
Acc
eler
atio
n sp
ectr
al d
ensi
ty -
g2 /H
z
W1
W2
20 f1 f2 2000
+ 3 dB/octave
� 3 dB/octave
FIGURE 514.5C-14. Jet aircraft store equipment vibration exposure.
Downloaded from http://www.everyspec.com on 2012-06-04T5:34:26.
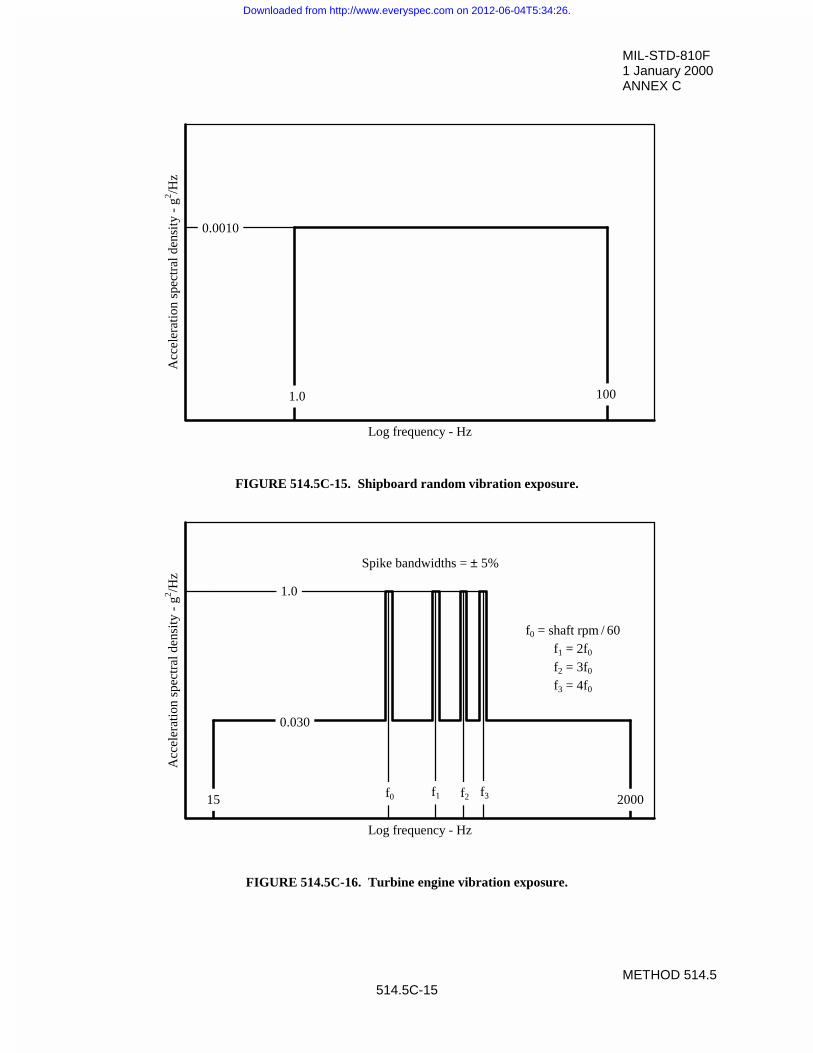
MIL-STD-810F1 January 2000ANNEX C
METHOD 514.5514.5C-15
Log frequency - Hz
Acc
eler
atio
n sp
ectr
al d
ensi
ty -
g2 /H
z
0.0010
1.0 100
FIGURE 514.5C-15. Shipboard random vibration exposure.
Log frequency - Hz
Acc
eler
atio
n sp
ectr
al d
ensi
ty -
g2 /H
z
15 2000
0.030
1.0
f0 f1 f2 f3
Spike bandwidths = ± 5%
f0 = shaft rpm / 60f1 = 2f0
f2 = 3f0
f3 = 4f0
FIGURE 514.5C-16. Turbine engine vibration exposure.
Downloaded from http://www.everyspec.com on 2012-06-04T5:34:26.
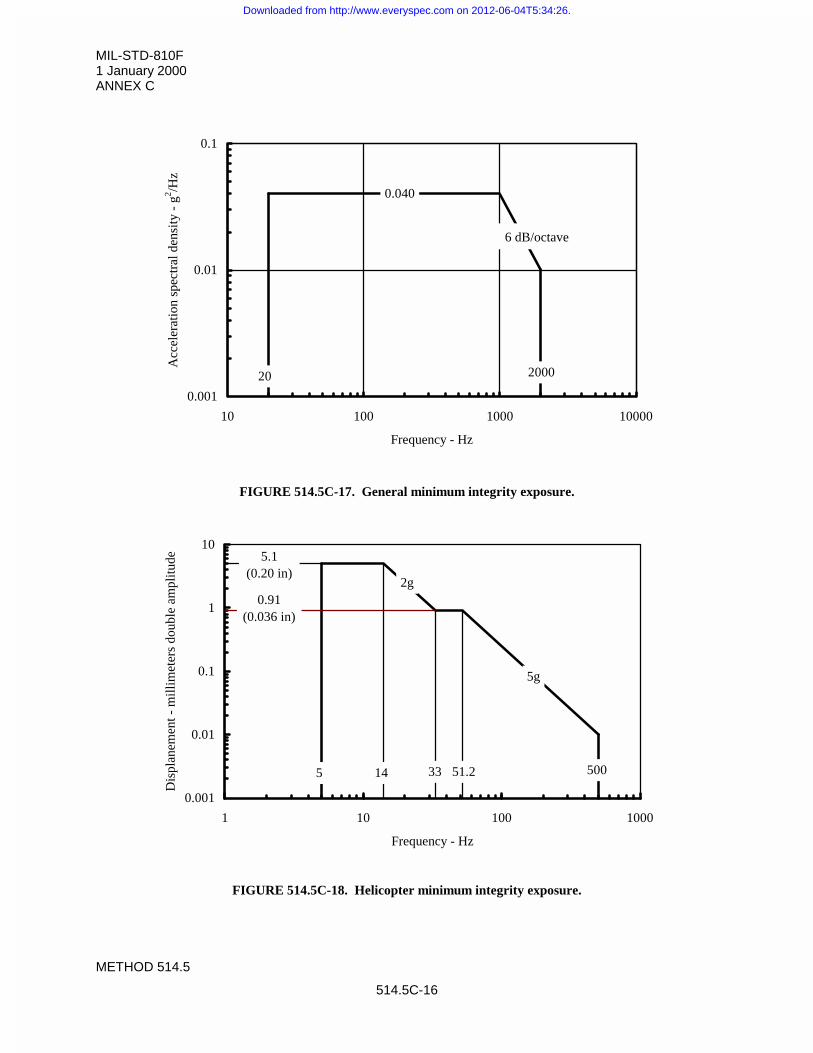
MIL-STD-810F1 January 2000ANNEX C
METHOD 514.5
514.5C-16
0.001
0.01
0.1
10 100 1000 10000
Frequency - Hz
Acc
eler
atio
n sp
ectr
al d
ensi
ty -
g2 /H
z
20 2000
0.040
� 6 dB/octave
FIGURE 514.5C-17. General minimum integrity exposure.
0.001
0.01
0.1
1
10
1 10 100 1000
Frequency - Hz
Dis
plan
emen
t - m
illim
eter
s do
uble
am
plitu
de 5.1(0.20 in)
0.91(0.036 in)
5 14 33 51.2 500
2g
5g
FIGURE 514.5C-18. Helicopter minimum integrity exposure.
Downloaded from http://www.everyspec.com on 2012-06-04T5:34:26.
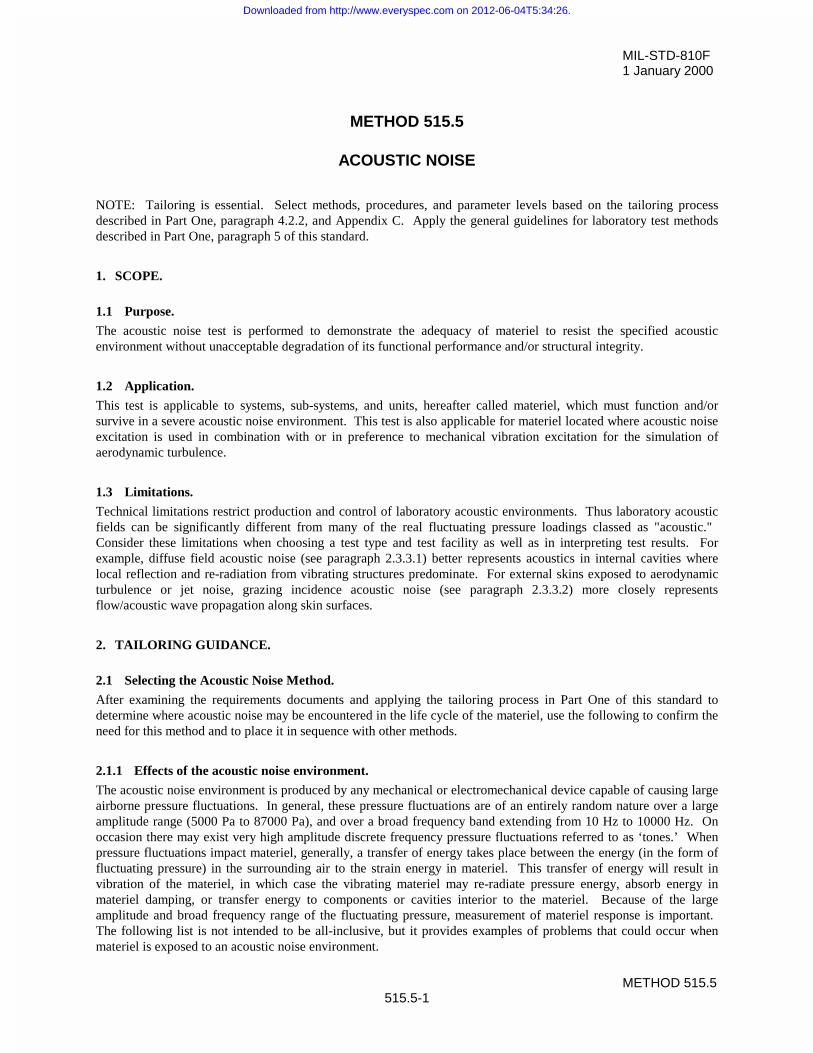
MIL-STD-810F1 January 2000
METHOD 515.5515.5-1
METHOD 515.5
ACOUSTIC NOISE
NOTE: Tailoring is essential. Select methods, procedures, and parameter levels based on the tailoring processdescribed in Part One, paragraph 4.2.2, and Appendix C. Apply the general guidelines for laboratory test methodsdescribed in Part One, paragraph 5 of this standard.
1. SCOPE.
1.1 Purpose.
The acoustic noise test is performed to demonstrate the adequacy of materiel to resist the specified acousticenvironment without unacceptable degradation of its functional performance and/or structural integrity.
1.2 Application.
This test is applicable to systems, sub-systems, and units, hereafter called materiel, which must function and/orsurvive in a severe acoustic noise environment. This test is also applicable for materiel located where acoustic noiseexcitation is used in combination with or in preference to mechanical vibration excitation for the simulation ofaerodynamic turbulence.
1.3 Limitations.
Technical limitations restrict production and control of laboratory acoustic environments. Thus laboratory acousticfields can be significantly different from many of the real fluctuating pressure loadings classed as "acoustic." Consider these limitations when choosing a test type and test facility as well as in interpreting test results. Forexample, diffuse field acoustic noise (see paragraph 2.3.3.1) better represents acoustics in internal cavities wherelocal reflection and re-radiation from vibrating structures predominate. For external skins exposed to aerodynamicturbulence or jet noise, grazing incidence acoustic noise (see paragraph 2.3.3.2) more closely representsflow/acoustic wave propagation along skin surfaces.
2. TAILORING GUIDANCE.
2.1 Selecting the Acoustic Noise Method.
After examining the requirements documents and applying the tailoring process in Part One of this standard todetermine where acoustic noise may be encountered in the life cycle of the materiel, use the following to confirm theneed for this method and to place it in sequence with other methods.
2.1.1 Effects of the acoustic noise environment.
The acoustic noise environment is produced by any mechanical or electromechanical device capable of causing largeairborne pressure fluctuations. In general, these pressure fluctuations are of an entirely random nature over a largeamplitude range (5000 Pa to 87000 Pa), and over a broad frequency band extending from 10 Hz to 10000 Hz. Onoccasion there may exist very high amplitude discrete frequency pressure fluctuations referred to as ‘tones.’ Whenpressure fluctuations impact materiel, generally, a transfer of energy takes place between the energy (in the form offluctuating pressure) in the surrounding air to the strain energy in materiel. This transfer of energy will result invibration of the materiel, in which case the vibrating materiel may re-radiate pressure energy, absorb energy inmateriel damping, or transfer energy to components or cavities interior to the materiel. Because of the largeamplitude and broad frequency range of the fluctuating pressure, measurement of materiel response is important. The following list is not intended to be all-inclusive, but it provides examples of problems that could occur whenmateriel is exposed to an acoustic noise environment.
Downloaded from http://www.everyspec.com on 2012-06-04T5:34:26.
MIL-STD-810F1 January 2000
METHOD 515.5515.5-2
a. Wire chafing
b. Component acoustic and vibratory fatigue
c. Component connecting wire fracture
d. Cracking of printed circuit boards
e. Failure of wave guide components
f. Intermittent operation of electrical contacts
g. Cracking of small panel areas and structural elements
h. Optical misalignment
i. Loosening of small particles that may become lodged in circuits and mechanisms
j. Excessive electrical noise
2.1.2 Sequence among other methods.
a. General. See Part One, paragraph 5.5.
b. Unique to this method. Like vibration, the effects of acoustically induced stresses may affect materielperformance under other environmental conditions, such as temperature, humidity, pressure,electromagnetic, etc. When it is required to evaluate the effects of acoustic noise together with otherenvironments and when a combined test is impractical, expose a single test item to all relevantenvironmental conditions in turn. Consider an order of application of the tests that is compatible with theLife Cycle Environmental Profile.
2.2 Selecting Procedures.
This method includes three acoustic noise test procedures. Determine which of the following procedure(s) to beused.
a. Procedure I (Diffuse Field Acoustic Noise)
b. Procedure II (Grazing Incidence Acoustic Noise)
c. Procedure III (Cavity Resonance Acoustic Noise).
2.2.1 Procedure selection considerations.
The choice of test procedure is governed by the in-service acoustic environments and test purpose. Identify theseenvironments from consideration of the Life Cycle Environmental Profile as described in Part One, Appendix A,Task 402. When selecting procedures, consider:
a. The operational purpose of the materiel. From the requirements documents, determine the functions tobe performed by the materiel in an acoustic noise environment, the total lifetime exposure to acousticnoise, and any limiting conditions.
b. The natural exposure circumstances.
c. The test data required to determine if the operational purpose (function and life) of the materiel has beenmet.
d. The procedure sequence within the acoustic noise method. If more than one of the enclosed proceduresis to be applied to the same test item, it is generally more appropriate to conduct the less damagingprocedure first.
Downloaded from http://www.everyspec.com on 2012-06-04T5:34:26.
MIL-STD-810F1 January 2000
METHOD 515.5515.5-3
2.2.2 Difference among procedures.
While all procedures involve acoustic noise, they differ on the basis of how the acoustic noise fluctuating pressure isgenerated and transferred to the materiel.
a. Procedure I – Diffuse Field Acoustic Noise. Procedure I has a uniform intensity shaped spectrum ofacoustic noise that impacts all the exposed materiel surfaces.
b. Procedure II – Grazing Incidence Acoustic Noise. Procedure II includes a high intensity, rapidlyfluctuating acoustic noise with a shaped spectrum that impacts the materiel surfaces in a particulardirection – generally along the long dimension of the materiel.
c. Procedure III – Cavity Resonance Acoustic Noise. In Procedure III, the intensity and, to a great extent,the frequency content of the acoustic noise spectrum is governed by the relationship between thegeometrical configuration of the cavity and the materiel within the cavity.
2.3 Determine Test Levels and Conditions.
2.3.1 General.
Having selected this method and relevant procedures (based on the materiel’s requirements and the tailoringprocess), it is necessary to complete the tailoring process by selecting specific parameter levels and special testconditions/techniques for these procedures based on the requirements documents, Life Cycle Environmental Profile,Operational Environment Documentation (see Part One, figure 1-1), and information provided with this procedure. From these sources of information, determine test excitation parameters and the functions to be performed by themateriel in acoustic noise environments or following exposure to these environments.
2.3.2 Use of measured and related data.
Wherever possible, use specifically measured data to develop the test excitation parameters and obtain a bettersimulation of the actual environment. Obtain data at the materiel location, preferably on the specific platform or,alternatively, on the same platform type. In general, the data will be a function of the intended form of simulation. In some cases, only microphone sound pressure levels will be useful, and in other cases materiel accelerationresponse measurements will be useful.
2.3.3 Types of Acoustic Excitation.
2.3.3.1 Diffuse field acoustic noise.
A diffuse field is generated in a reverberation chamber. Normally wide band random excitation is provided and thespectrum is shaped. This test is applicable to materiel or structures that have to function or survive in an acousticnoise field such as that produced by aerospace vehicles, power plants and other sources of high intensity acousticnoise. Since this test provides an efficient means of inducing vibration above 100 Hz, the test may also be used tocomplement a mechanical vibration test, using acoustic energy to induce mechanical responses in internally mountedmateriel. In this role the test is applicable to items such as installed materiel in airborne stores carried externally onhigh performance aircraft. However, since the excitation mechanism induced by a diffuse field is different from thatinduced by aerodynamic turbulence, when used in this role, this test is not necessarily suitable for testing thestructural integrity of thin shell structures interfacing directly with the acoustic noise. A practical guideline is thatacoustic tests are not required if materiel is exposed to broadband random noise at a sound pressure level less than130 dB (ref 20 PPascal) overall, and if its exposure in every one Hertz band is less than 100 dB (ref 20 PPascal). Adiffuse field acoustic test is usually defined by the following parameters.
a. The spectrum levels.
b. The frequency range.
c. The overall sound pressure level.
d. The duration of the test.
Downloaded from http://www.everyspec.com on 2012-06-04T5:34:26.
MIL-STD-810F1 January 2000
METHOD 515.5515.5-4
2.3.3.2 Grazing incidence acoustic noise.
Grazing incidence acoustic noise is generated in a duct, popularly known as a progressive wave tube. Normally, wideband random noise with a shaped spectrum is directed along the duct. This test is applicable to assembled systemsthat have to operate or survive in a service environment of pressure fluctuations over the surface, such as exist inaerodynamic turbulence. These conditions are particularly relevant to aircraft panels, where aerodynamic turbulencewill exist on one side only, and to externally carried stores subjected to aerodynamic turbulence excitation over theirtotal external exposed surface. In the case of a panel, the test item will be mounted in the wall of the duct so thatgrazing incidence excitation is applied to one side only. An aircraft carried store such as a missile will be mountedco-axially within the duct such that the excitation is applied over the whole of the external surface. A grazingincidence acoustic noise test is usually defined by the following parameters:
a. The spectrum levels.
b. The frequency range.
c. The overall sound pressure level.
d. The duration of the test.
2.3.3.3 Cavity resonance.
A resonance condition is generated when a cavity, such as that represented by an open weapons bay on an aircraft, isexcited by the airflow over it. This causes oscillation of the air within the cavity at frequencies dependent upon thecavity dimensions and the aerodynamic flow conditions. In turn, this can induce vibration of the structure and ofcomponents in and near the cavity. The resonance condition can be simulated by the application of a sinusoidalacoustic source, tuned to the correct frequency of the open cavity. The resonance condition will occur when thecontrol microphone response reaches a maximum in a sound field held at a constant sound pressure level over thefrequency range. A cavity resonance test is defined by the following parameters:
a. The noise frequency.
b. The overall sound pressure level within the cavity.
c. The duration of the test.
2.3.3.4 Additional technical guidance.
Additional guidance is given in Annex B.
2.4 Test Item Configuration.
(See Part One, paragraph 5.8.) Where relevant, function the test item and measure and record performance dataduring each test phase and/or each acoustic level applied.
3. INFORMATION REQUIRED.
The following information is necessary to properly conduct the acoustic test.
3.1 Pretest.
a. General. See the information listed in Part One, paragraphs 5.7, 5.8, 5.9, 5.11 and 5.12, and Part One,Appendix A, Tasks 405 and 406 of this standard.
b. Specific to this method.
(1) Establish test levels and durations using projected Life Cycle Environmental Profiles, available dataor data acquired directly from an environmental data-gathering program. When these data are notavailable, use the guidance on developing initial test severities in Annex A. Consider these overallsound pressure levels (OASPL) as initial values until measured data are obtained. The test selected
Downloaded from http://www.everyspec.com on 2012-06-04T5:34:26.
MIL-STD-810F1 January 2000
METHOD 515.5515.5-5
may not necessarily be an adequate simulation of the complete environment and consequently asupporting assessment may be necessary to complement the test results.
(2) If the test item is required to operate during the test; the operating checks required are pretest, duringthe test, and post test. For the pre- and post test checks, specify whether they are performed with thetest item installed in the test facility. Define the details required to perform the test, including themethod of attachment or suspension of the test item, the effect of gravity and any consequentprecautions. Identify the control and monitor points, or a procedure to select these points. Definetest interruption, test completion and failure criteria.
3.2 During Test.
a. General. See the information listed in Part One, paragraph 5.10, and in Part One, Appendix A, Tasks405 and 406.
b. Specific to this method.
(1) Collect outputs of microphones, test control averages, test item operating parameters, and any otherrelevant transducers at appropriate test times.
(2) Collect log/records of materiel operating parameters.
(3) Give particular attention to interactions of the input excitation (diffuse and uniform, directional ortonal).
(4) Record transient behavior in the input representing a test anomaly.
3.3 Post Test.
a. General. See the information listed in Part One, paragraph. 5.13, and in Part One, Appendix A, Tasks405 and 406 of this standard.
b. Specific to this method. Identify any indication of failure under specified failure criteria. Account fortolerance excesses when testing large materiel, the number of simultaneous test items in Procedure I, andany other environmental conditions at which testing was carried out, if other than standard laboratoryconditions.
4. TEST PROCESS.
4.1 Test Facility.
Ensure the apparatus used to perform the acoustic test has sufficient capacity to adequately reproduce the inputrequirements. Diffuse acoustic field apparatus that produce uniform acoustic fields above 165 dB are rare. For highlevel acoustic input (above 165 dB), consider testing using grazing incidence acoustic noise. For measured data thatindicates tonal input, consider a facility that can be configured to produce a cavity resonance condition.
4.2 Control.
The control strategy depends upon the type of test and the size of the materiel.
4.2.1 Control options.
4.2.1.1 Single point noise control.
Define the single point, providing an optimum control position in the chamber or progressive wave tube.
Downloaded from http://www.everyspec.com on 2012-06-04T5:34:26.
MIL-STD-810F1 January 2000
METHOD 515.5515.5-6
4.2.1.2 Multiple point noise control.
Select the control points to define a controlled volume within the reverberation chamber. Base control upon theaverage of the sound spectrum levels at each microphone. Where the range of measurements at the monitoringpositions does not exceed 5 dB (OASPL) a simple arithmetic average of the sound spectrum levels (in dB) may beused. For a range of 5 dB or greater, use an average of the non-logarithmic sound spectrum levels (i.e., PPa ormicrobar), then convert to dB.
4.2.1.3 Vibration response control.
Where it is necessary to achieve a given vibration acceleration response on the test item, adjust the acoustic testspectrum to achieve the required response which may be monitored at either a single point or as the average frommultiple monitoring points. Refer to method 514.5 for further guidance.
4.2.2 Control methods.
Control can be by either open or closed loop. Open loop control is adequate for progressive wave tubes and forsmall chambers having a single noise source. Closed loop control is more effective for large chambers havingmultiple noise sources that cover different bands in the test frequency range.
4.2.3 Overall accuracy of control.
Ensure the uncertainty of measurement of the total measurement system, including statistical errors, does not exceedone-third of the specified tolerance for the overall sound pressure level.
4.2.4 Calibration and tolerance.
Test tolerances are given in table 515.5-I. Ensure the calibration and test tolerance procedures for test control aregenerally consistent with the guidance provided in Part One, paragraphs 5.3.2 and 5.2, respectively.
4.2.5 Test interruption.
a. General. See Part One, paragraph 5.11 of this standard.
b. Specific to this method. Interruption of an acoustic noise test is unlikely to generate any adverse effects. Normally, continue the test from the point of interruption.
4.3 Instrumentation.
Ensure that all test environment monitoring instrumentation and test item function monitoring instrumentation isconsistent with the calibration and test tolerance procedures, and are generally consistent with the guidance providedin Part One, paragraphs 5.3.2 and 5.2, respectively.
4.4 Data Analysis.
Detailed data analysis for verification of the input to the test item, i.e., the acoustic field and the response monitoringof the test item, are to be in accordance with the test plan.
Downloaded from http://www.everyspec.com on 2012-06-04T5:34:26.
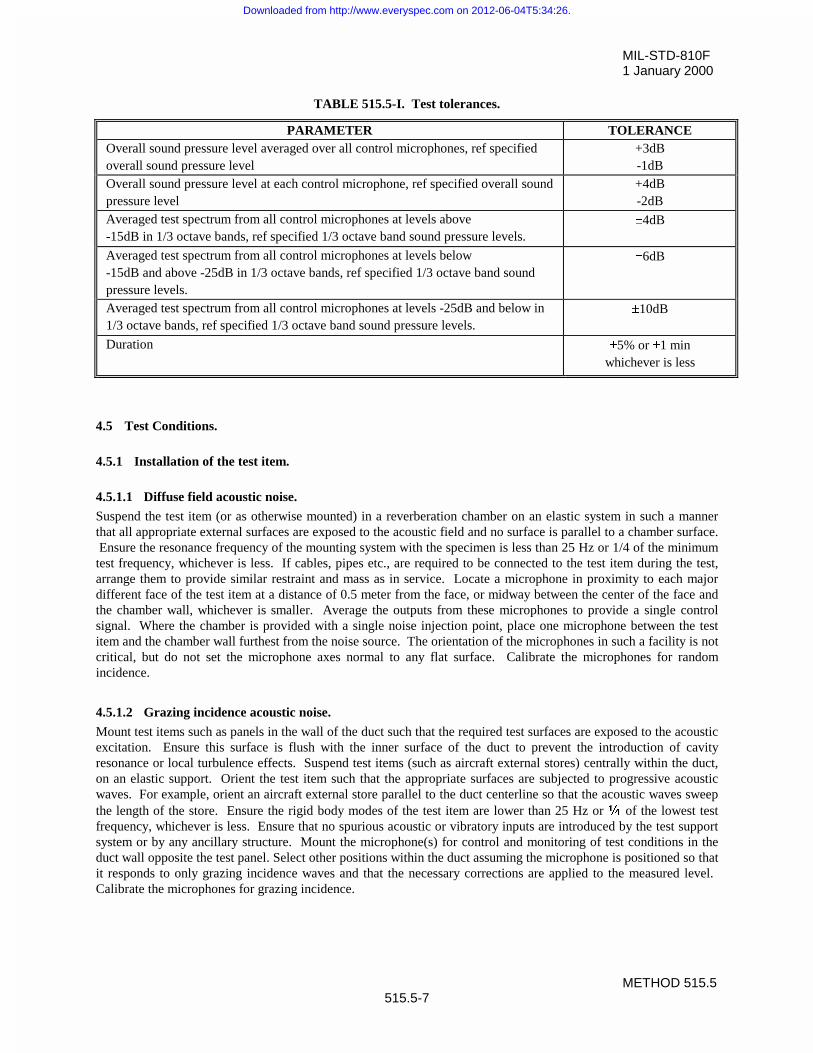
MIL-STD-810F1 January 2000
METHOD 515.5515.5-7
TABLE 515.5-I. Test tolerances.
PARAMETER TOLERANCEOverall sound pressure level averaged over all control microphones, ref specifiedoverall sound pressure level
+3dB-1dB
Overall sound pressure level at each control microphone, ref specified overall soundpressure level
+4dB-2dB
Averaged test spectrum from all control microphones at levels above-15dB in 1/3 octave bands, ref specified 1/3 octave band sound pressure levels.
r4dB
Averaged test spectrum from all control microphones at levels below-15dB and above -25dB in 1/3 octave bands, ref specified 1/3 octave band soundpressure levels.
r6dB
Averaged test spectrum from all control microphones at levels -25dB and below in1/3 octave bands, ref specified 1/3 octave band sound pressure levels.
r10dB
Duration r5% or r1 minwhichever is less
4.5 Test Conditions.
4.5.1 Installation of the test item.
4.5.1.1 Diffuse field acoustic noise.
Suspend the test item (or as otherwise mounted) in a reverberation chamber on an elastic system in such a mannerthat all appropriate external surfaces are exposed to the acoustic field and no surface is parallel to a chamber surface. Ensure the resonance frequency of the mounting system with the specimen is less than 25 Hz or 1/4 of the minimumtest frequency, whichever is less. If cables, pipes etc., are required to be connected to the test item during the test,arrange them to provide similar restraint and mass as in service. Locate a microphone in proximity to each majordifferent face of the test item at a distance of 0.5 meter from the face, or midway between the center of the face andthe chamber wall, whichever is smaller. Average the outputs from these microphones to provide a single controlsignal. Where the chamber is provided with a single noise injection point, place one microphone between the testitem and the chamber wall furthest from the noise source. The orientation of the microphones in such a facility is notcritical, but do not set the microphone axes normal to any flat surface. Calibrate the microphones for randomincidence.
4.5.1.2 Grazing incidence acoustic noise.
Mount test items such as panels in the wall of the duct such that the required test surfaces are exposed to the acousticexcitation. Ensure this surface is flush with the inner surface of the duct to prevent the introduction of cavityresonance or local turbulence effects. Suspend test items (such as aircraft external stores) centrally within the duct,on an elastic support. Orient the test item such that the appropriate surfaces are subjected to progressive acousticwaves. For example, orient an aircraft external store parallel to the duct centerline so that the acoustic waves sweepthe length of the store. Ensure the rigid body modes of the test item are lower than 25 Hz or ó of the lowest testfrequency, whichever is less. Ensure that no spurious acoustic or vibratory inputs are introduced by the test supportsystem or by any ancillary structure. Mount the microphone(s) for control and monitoring of test conditions in theduct wall opposite the test panel. Select other positions within the duct assuming the microphone is positioned so thatit responds to only grazing incidence waves and that the necessary corrections are applied to the measured level. Calibrate the microphones for grazing incidence.
Downloaded from http://www.everyspec.com on 2012-06-04T5:34:26.
MIL-STD-810F1 January 2000
METHOD 515.5515.5-8
4.5.1.3 Cavity resonance acoustic noise.
Suspend the test item (or as otherwise mounted) in a reverberation chamber such that only that part of the cavity tobe tested is exposed to the direct application of acoustic energy. Protect all other surfaces so that their level ofacoustic excitation is reduced by 20 dB. Do not use protective coverings that provide any additional vibrationdamping to the structure. Do not locate the microphone for control of the test within the cavity to be tested.
4.5.2 Effects of gravity.
Tests will normally be carried out with the test item mounted in the correct attitude, unless it is shown that theperformance of the test item is not affected by gravity.
4.5.3 Preparation for test.
4.5.3.1 Preconditioning.
Unless otherwise specified, allow the test item to stabilize at ambient conditions.
4.5.3.2 Inspection and performance checks.
Inspection and performance checks may be carried out before and after testing. Define the requirements for thesechecks in the test plan. If these checks are required during the test sequence, specify the time intervals at which theyare required.
4.5.4 Procedures.
In the test plan stipulate whether the test item is or is not to be operating during the test.
4.5.4.1 Procedure 1 - Diffuse field acoustic noise testing.
Step 1. Install the test item in the reverberation chamber in accordance with paragraph 4.5.1.1.
Step 2. Select microphone positions for control, monitoring, and control strategy in accordance withparagraph 4.5.1.1.
Step 3. When using open loop control, remove the test item and confirm the specified overall sound pressurelevel and spectrum can be achieved in an empty chamber, then replace the test item in the chamber.
Step 4. Precondition the test item in accordance with paragraph 4.5.3.1.
Step 5. Conduct initial checks in accordance with paragraph 4.5.3.2.
Step 6. Apply the test spectrum for the specified time. If required, carry out inspections and performancechecks in accordance with paragraph 4.5.3.2.
Step 7. Record the test acoustic field at each microphone, any average used in test control, and otherpertinent transducer outputs. Make the recordings at the beginning, midpoint, and end of each testrun. Where test runs are longer than one hour, record every one-half hour.
Step 8. Carry out the final inspection.
Step 9. Remove the test item from the chamber.
Step 10. In all cases, record the information required.
4.5.4.2 Procedure 2 - Grazing incidence acoustic noise testing.
Step 1. Install the test item in accordance with paragraph 4.5.1.2.
Step 2. Select microphone positions for control, monitoring, and control strategy in accordance with 4.5.1.2.
Step 3. Precondition the test item in accordance with 4.5.3.1.
Downloaded from http://www.everyspec.com on 2012-06-04T5:34:26.
MIL-STD-810F1 January 2000
METHOD 515.5515.5-9
Step 4. Conduct initial checks in accordance with 4.5.3.2.
Step 5. Apply the test spectrum for the specified time. If required, carry out inspections and performancechecks in accordance with paragraph 4.5.3.2.
Step 6. Record the test acoustic field at each microphone, any average used in test control, and otherpertinent transducer outputs. Make recordings at the beginning, end and midpoint of each test run.Where test runs are longer than one hour, record every one-half hour.
Step 7. Carry out the final inspection.
Step 8. Remove the test item from the duct.
Step 9. In all cases, record the information required.
4.5.4.3 Procedure 3 - Cavity resonance acoustic noise testing.
Step 1. Install the test item into the chamber in accordance with paragraph 4.5.1.3.
Step 2. Locate the control microphone in accordance with paragraph 4.5.1.2.
Step 3. Precondition the test item in accordance with paragraph 4.5.3.1.
Step 4. Conduct initial checks in accordance with paragraph 4.5.3.2.
Step 5. Apply the sinusoidal acoustic excitation at the required frequencies (see table 5.5.5A-II). Adjust thetest parameters to the specified levels and apply for the specified time. If required, carry outinspections and performance checks in accordance with paragraph 4.5.3.2.
Step 6. Record the test acoustic field at each microphone, any average used in test control, and otherpertinent transducer outputs. Make recordings at the beginning, midpoint, and end of each test run. Where test runs are longer than one hour, record every one-half hour.
Step 7. Perform the final inspection.
Step 8. Remove the test item from the chamber.
Step 9. In all cases, record the information required.
5. ANALYSIS OF RESULTS.
Refer to Part One, paragraphs 5.14 and 5.17, and Part One, Annex A, Tasks 405 and 406.
6. REFERENCE/RELATED DOCUMENTS.
a. NATO STANAG 4370, Environmental Testing.
b. NATO Allied Environmental Engineering and Test Publication (AECTP) 400, MechanicalEnvironmental Testing.
Downloaded from http://www.everyspec.com on 2012-06-04T5:34:26.

MIL-STD-810F1 January 2000
METHOD 515.5515.5-10
THIS PAGE INTENTIONALLY BLANK
Downloaded from http://www.everyspec.com on 2012-06-04T5:34:26.
MIL-STD-810F1 January 2000ANNEX A
METHOD 515.5515.5A-1
ANNEX A
GUIDANCE FOR INITIAL TEST SEVERITY
1. BROAD BAND RANDOM AND INCIDENCE NOISE TESTING.
1.1 Overall Sound Pressure Level (OASPL).
From the known area of operation for the materiel, the test overall sound pressure level and duration may beobtained from table 515.5A-I.
1.2 Test Spectrum.
The applied test spectrum associated with these levels is shown on figure 515.5A-1 with breakpoints defined in table515.5A-III. Achieve the test spectrum while maintaining the test parameters within the tolerances given in table515.5-I.
1.3 Simulation of Aerodynamic Turbulence.
Where a broadband noise test is required for the simulation of aerodynamic turbulence, derive the test levels anddurations in conjunction with those for the complementary mechanical test.
2. CAVITY RESONANCE TESTING.
For cavity resonance testing, the sound pressure level Bo, frequencies fN and duration T will be as calculated ordefined in table 515.5A-II.
3. EXTERNAL STORES TESTING.
3.1 Test Spectrum.
A typical store profile is shown on figure 515.5A-2. The applied test spectrum is shown on figure 515.5A-3.
3.2 Test Parameters.
For acoustic testing of external stores, the associated levels and definitions are shown in table 515.5A-IV.
Downloaded from http://www.everyspec.com on 2012-06-04T5:34:26.
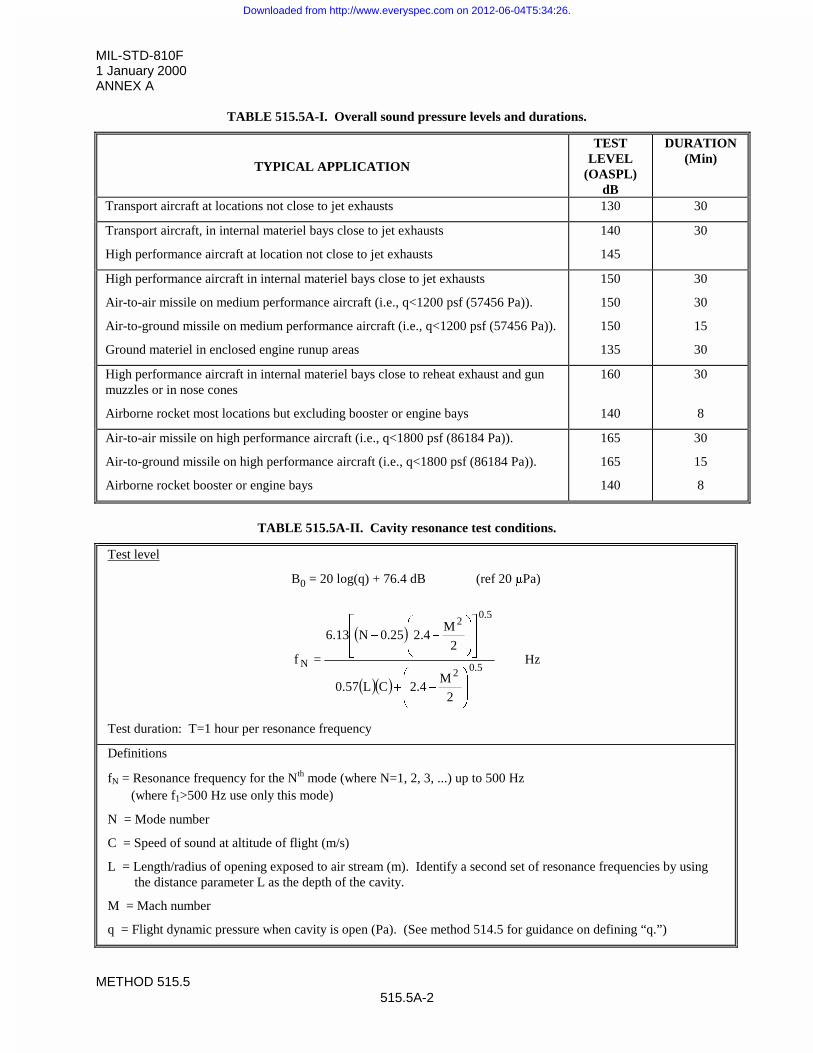
MIL-STD-810F1 January 2000ANNEX A
METHOD 515.5515.5A-2
TABLE 515.5A-I. Overall sound pressure levels and durations.
TYPICAL APPLICATION
TESTLEVEL
(OASPL)dB
DURATION(Min)
Transport aircraft at locations not close to jet exhausts 130 30
Transport aircraft, in internal materiel bays close to jet exhausts
High performance aircraft at location not close to jet exhausts
140
145
30
High performance aircraft in internal materiel bays close to jet exhausts
Air-to-air missile on medium performance aircraft (i.e., q<1200 psf (57456 Pa)).
Air-to-ground missile on medium performance aircraft (i.e., q<1200 psf (57456 Pa)).
Ground materiel in enclosed engine runup areas
150
150
150
135
30
30
15
30
High performance aircraft in internal materiel bays close to reheat exhaust and gunmuzzles or in nose cones
Airborne rocket most locations but excluding booster or engine bays
160
140
30
8
Air-to-air missile on high performance aircraft (i.e., q<1800 psf (86184 Pa)).
Air-to-ground missile on high performance aircraft (i.e., q<1800 psf (86184 Pa)).
Airborne rocket booster or engine bays
165
165
140
30
15
8
TABLE 515.5A-II. Cavity resonance test conditions.
Test level
B0 = 20 log(q) + 76.4 dB (ref 20 PPa)
� �
� �� �5.02
5.02
N
2
M4.2CL57.0
2
M4.225.0N13.6
=f
¸¸
¹
·
¨¨
©
§
��
»
»
¼
º
«
«
¬
ª
¸¸
¹
·
¨¨
©
§
��
Hz
Test duration: T=1 hour per resonance frequency
Definitions
fN = Resonance frequency for the Nth mode (where N=1, 2, 3, ...) up to 500 Hz (where f1>500 Hz use only this mode)
N = Mode number
C = Speed of sound at altitude of flight (m/s)
L = Length/radius of opening exposed to air stream (m). Identify a second set of resonance frequencies by using the distance parameter L as the depth of the cavity.
M = Mach number
q = Flight dynamic pressure when cavity is open (Pa). (See method 514.5 for guidance on defining “q.”)
Downloaded from http://www.everyspec.com on 2012-06-04T5:34:26.
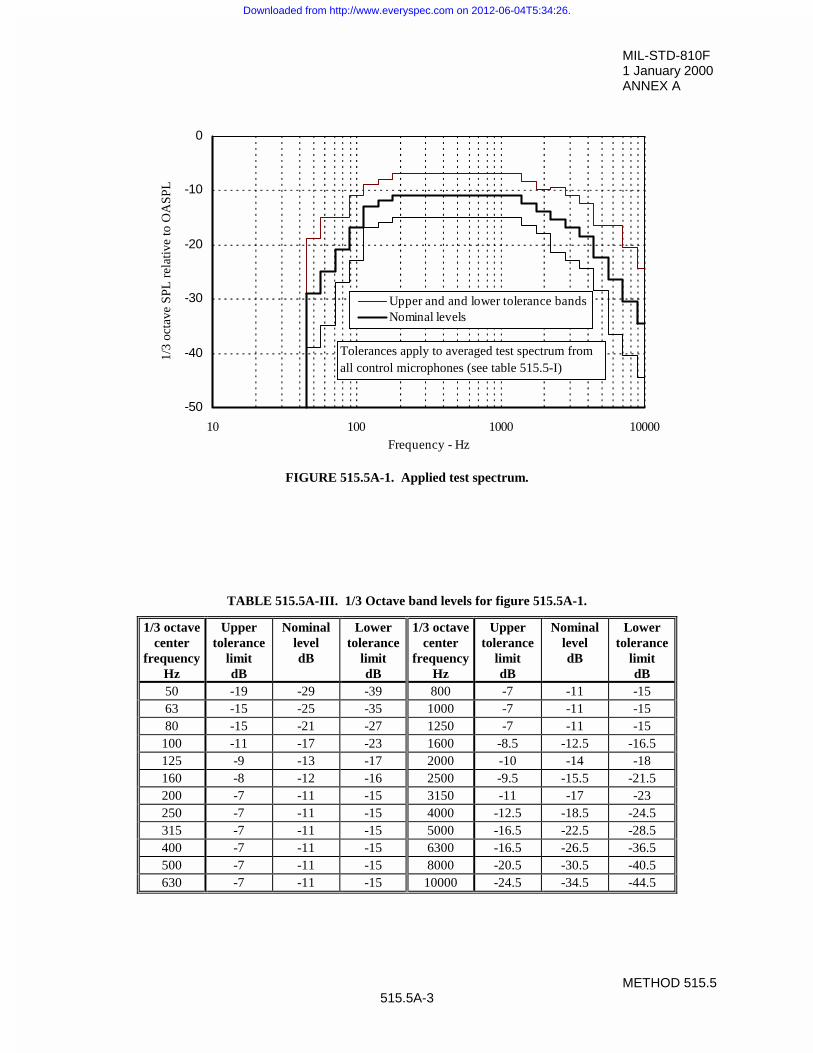
MIL-STD-810F1 January 2000ANNEX A
METHOD 515.5515.5A-3
-50
-40
-30
-20
-10
0
10 100 1000 10000Frequency - Hz
1/3
octa
ve S
PL r
elat
ive
to O
ASP
L
Upper and and lower tolerance bandsNominal levels
Tolerances apply to averaged test spectrum from all control microphones (see table 515.5-I)
FIGURE 515.5A-1. Applied test spectrum.
TABLE 515.5A-III. 1/3 Octave band levels for figure 515.5A-1.
1/3 octavecenter
frequencyHz
Uppertolerance
limitdB
NominalleveldB
Lowertolerance
limitdB
1/3 octavecenter
frequencyHz
Uppertolerance
limitdB
NominalleveldB
Lowertolerance
limitdB
50 -19 -29 -39 800 -7 -11 -1563 -15 -25 -35 1000 -7 -11 -1580 -15 -21 -27 1250 -7 -11 -15
100 -11 -17 -23 1600 -8.5 -12.5 -16.5125 -9 -13 -17 2000 -10 -14 -18160 -8 -12 -16 2500 -9.5 -15.5 -21.5200 -7 -11 -15 3150 -11 -17 -23250 -7 -11 -15 4000 -12.5 -18.5 -24.5315 -7 -11 -15 5000 -16.5 -22.5 -28.5400 -7 -11 -15 6300 -16.5 -26.5 -36.5500 -7 -11 -15 8000 -20.5 -30.5 -40.5630 -7 -11 -15 10000 -24.5 -34.5 -44.5
Downloaded from http://www.everyspec.com on 2012-06-04T5:34:26.
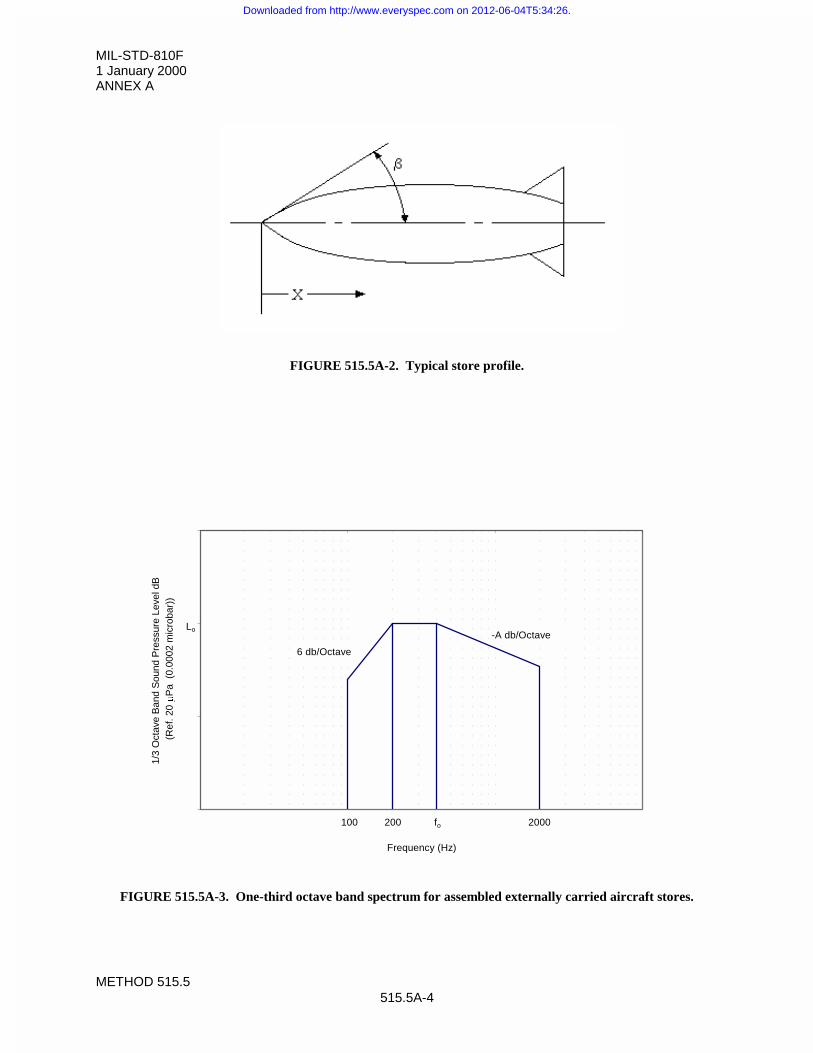
MIL-STD-810F1 January 2000ANNEX A
METHOD 515.5515.5A-4
FIGURE 515.5A-2. Typical store profile.
FIGURE 515.5A-3. One-third octave band spectrum for assembled externally carried aircraft stores.
Frequency (Hz)
1/3
Oct
ave
Ban
d S
ound
Pre
ssur
e Le
vel d
B (
Ref
. 20 P
Pa
(0.
0002
mic
roba
r))
Lo
200100 2000fo
6 db/Octave
-A db/Octave
Downloaded from http://www.everyspec.com on 2012-06-04T5:34:26.
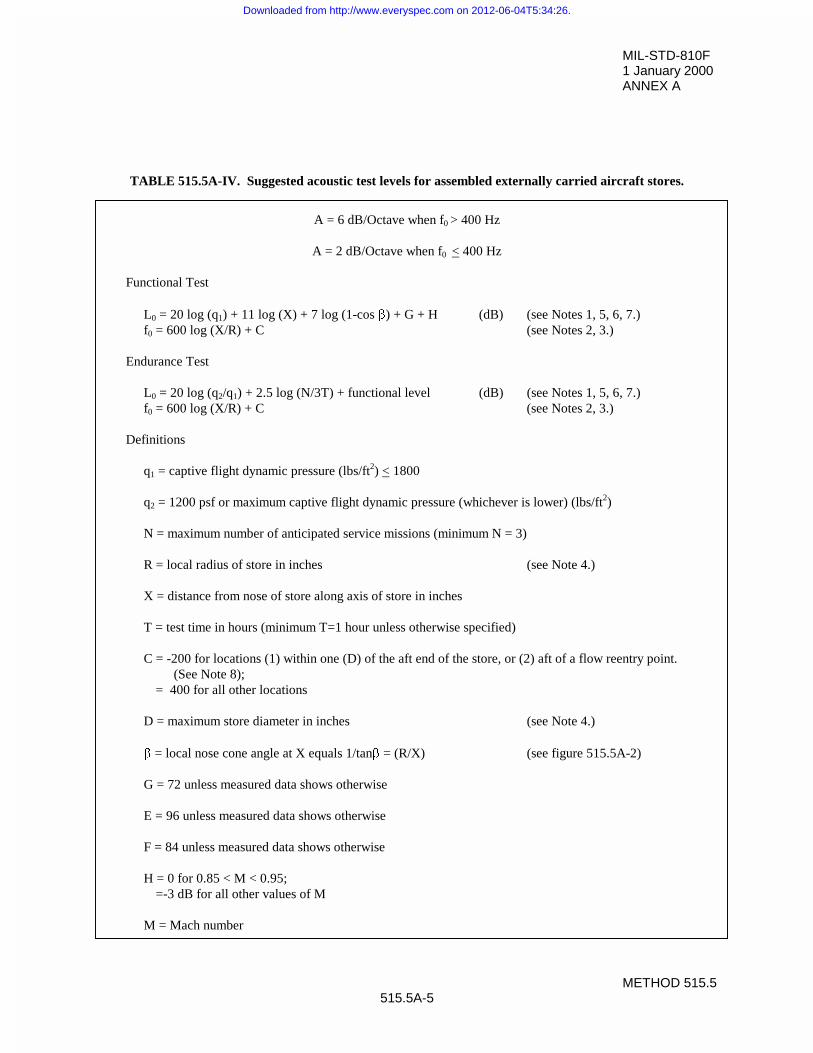
MIL-STD-810F1 January 2000ANNEX A
METHOD 515.5515.5A-5
TABLE 515.5A-IV. Suggested acoustic test levels for assembled externally carried aircraft stores.
A = 6 dB/Octave when f0 > 400 Hz
A = 2 dB/Octave when f0 < 400 Hz
Functional Test
L0 = 20 log (q1) + 11 log (X) + 7 log (1-cos E) + G + H (dB) (see Notes 1, 5, 6, 7.)f0 = 600 log (X/R) + C (see Notes 2, 3.)
Endurance Test
L0 = 20 log (q2/q1) + 2.5 log (N/3T) + functional level (dB) (see Notes 1, 5, 6, 7.)f0 = 600 log (X/R) + C (see Notes 2, 3.)
Definitions
q1 = captive flight dynamic pressure (lbs/ft2) < 1800
q2 = 1200 psf or maximum captive flight dynamic pressure (whichever is lower) (lbs/ft2)
N = maximum number of anticipated service missions (minimum N = 3)
R = local radius of store in inches (see Note 4.)
X = distance from nose of store along axis of store in inches
T = test time in hours (minimum T=1 hour unless otherwise specified)
C = -200 for locations (1) within one (D) of the aft end of the store, or (2) aft of a flow reentry point. (See Note 8);
= 400 for all other locations
D = maximum store diameter in inches (see Note 4.)
E = local nose cone angle at X equals 1/tanE = (R/X) (see figure 515.5A-2)
G = 72 unless measured data shows otherwise
E = 96 unless measured data shows otherwise
F = 84 unless measured data shows otherwise
H = 0 for 0.85 < M < 0.95;=-3 dB for all other values of M
M = Mach number
Downloaded from http://www.everyspec.com on 2012-06-04T5:34:26.
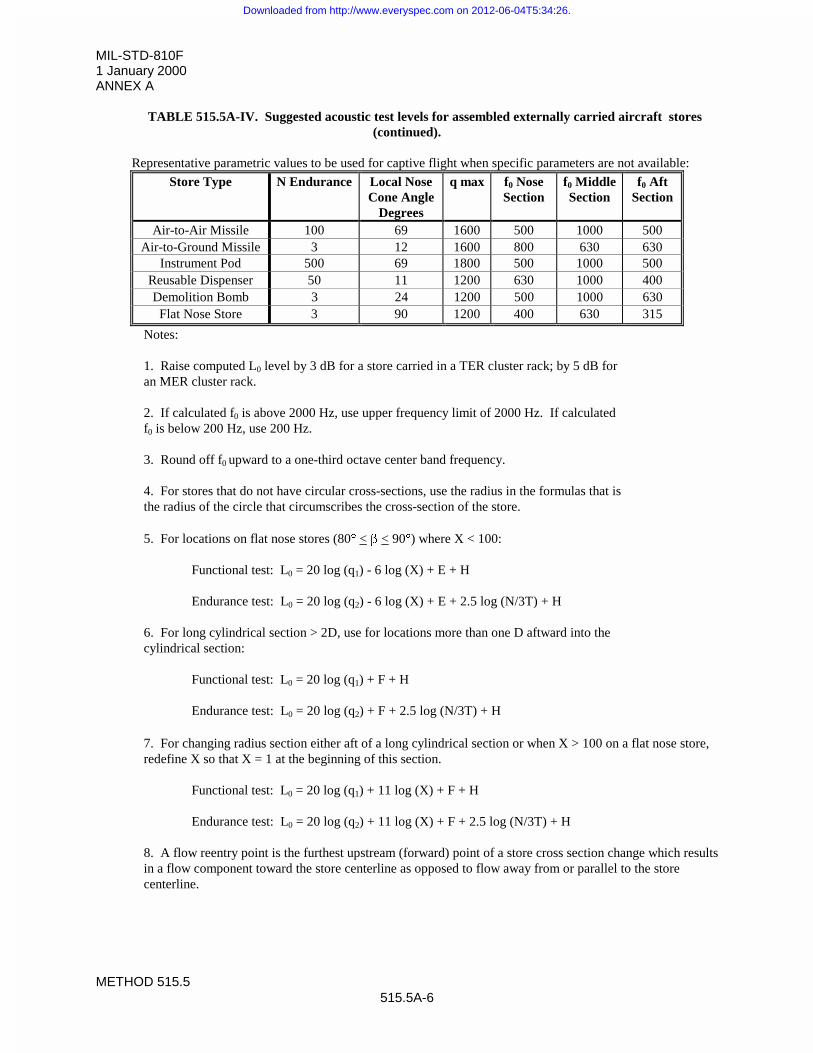
MIL-STD-810F1 January 2000ANNEX A
METHOD 515.5515.5A-6
TABLE 515.5A-IV. Suggested acoustic test levels for assembled externally carried aircraft stores(continued).
Representative parametric values to be used for captive flight when specific parameters are not available:
Store Type N Endurance Local NoseCone Angle
Degrees
q max f0 NoseSection
f0 MiddleSection
f0 AftSection
Air-to-Air Missile 100 69 1600 500 1000 500Air-to-Ground Missile 3 12 1600 800 630 630
Instrument Pod 500 69 1800 500 1000 500Reusable Dispenser 50 11 1200 630 1000 400Demolition Bomb 3 24 1200 500 1000 630
Flat Nose Store 3 90 1200 400 630 315
Notes:
1. Raise computed L0 level by 3 dB for a store carried in a TER cluster rack; by 5 dB foran MER cluster rack.
2. If calculated f0 is above 2000 Hz, use upper frequency limit of 2000 Hz. If calculatedf0 is below 200 Hz, use 200 Hz.
3. Round off f0 upward to a one-third octave center band frequency.
4. For stores that do not have circular cross-sections, use the radius in the formulas that isthe radius of the circle that circumscribes the cross-section of the store.
5. For locations on flat nose stores (80q < E < 90q) where X < 100:
Functional test: L0 = 20 log (q1) - 6 log (X) + E + H
Endurance test: L0 = 20 log (q2) - 6 log (X) + E + 2.5 log (N/3T) + H
6. For long cylindrical section > 2D, use for locations more than one D aftward into thecylindrical section:
Functional test: L0 = 20 log (q1) + F + H
Endurance test: L0 = 20 log (q2) + F + 2.5 log (N/3T) + H
7. For changing radius section either aft of a long cylindrical section or when X > 100 on a flat nose store,redefine X so that X = 1 at the beginning of this section.
Functional test: L0 = 20 log (q1) + 11 log (X) + F + H
Endurance test: L0 = 20 log (q2) + 11 log (X) + F + 2.5 log (N/3T) + H
8. A flow reentry point is the furthest upstream (forward) point of a store cross section change which resultsin a flow component toward the store centerline as opposed to flow away from or parallel to the storecenterline.
Downloaded from http://www.everyspec.com on 2012-06-04T5:34:26.
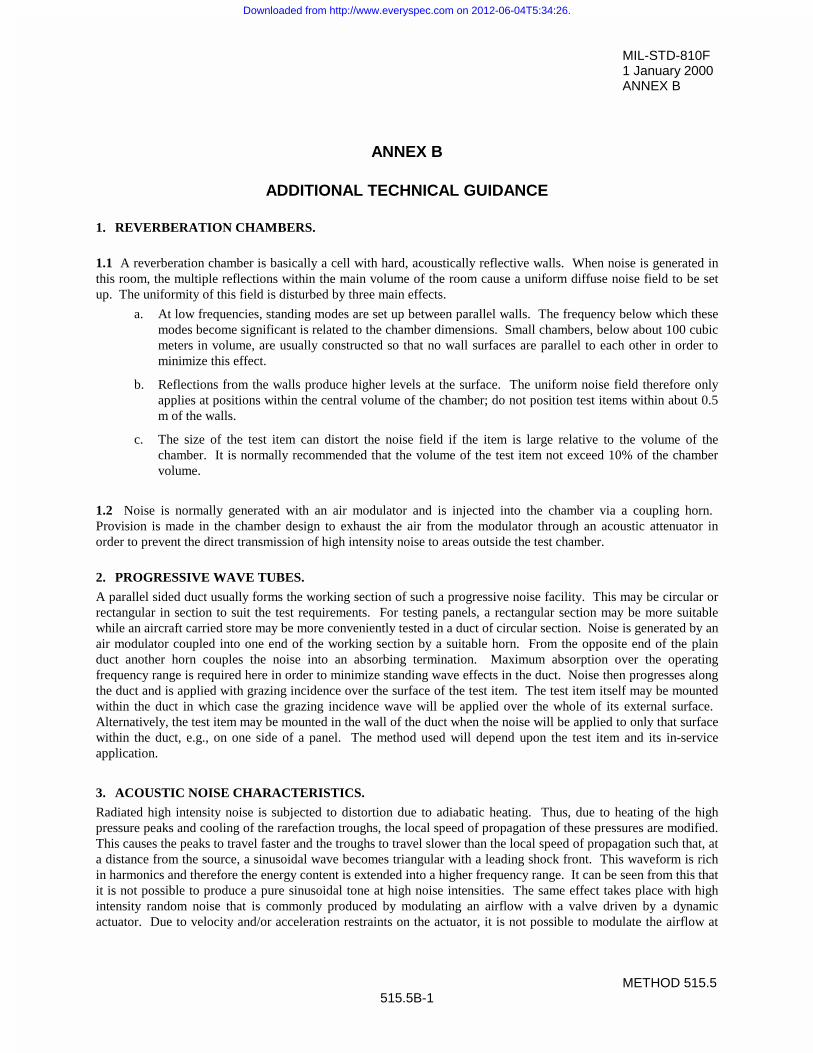
MIL-STD-810F1 January 2000ANNEX B
METHOD 515.5515.5B-1
ANNEX B
ADDITIONAL TECHNICAL GUIDANCE
1. REVERBERATION CHAMBERS.
1.1 A reverberation chamber is basically a cell with hard, acoustically reflective walls. When noise is generated inthis room, the multiple reflections within the main volume of the room cause a uniform diffuse noise field to be setup. The uniformity of this field is disturbed by three main effects.
a. At low frequencies, standing modes are set up between parallel walls. The frequency below which thesemodes become significant is related to the chamber dimensions. Small chambers, below about 100 cubicmeters in volume, are usually constructed so that no wall surfaces are parallel to each other in order tominimize this effect.
b. Reflections from the walls produce higher levels at the surface. The uniform noise field therefore onlyapplies at positions within the central volume of the chamber; do not position test items within about 0.5m of the walls.
c. The size of the test item can distort the noise field if the item is large relative to the volume of thechamber. It is normally recommended that the volume of the test item not exceed 10% of the chambervolume.
1.2 Noise is normally generated with an air modulator and is injected into the chamber via a coupling horn. Provision is made in the chamber design to exhaust the air from the modulator through an acoustic attenuator inorder to prevent the direct transmission of high intensity noise to areas outside the test chamber.
2. PROGRESSIVE WAVE TUBES.
A parallel sided duct usually forms the working section of such a progressive noise facility. This may be circular orrectangular in section to suit the test requirements. For testing panels, a rectangular section may be more suitablewhile an aircraft carried store may be more conveniently tested in a duct of circular section. Noise is generated by anair modulator coupled into one end of the working section by a suitable horn. From the opposite end of the plainduct another horn couples the noise into an absorbing termination. Maximum absorption over the operatingfrequency range is required here in order to minimize standing wave effects in the duct. Noise then progresses alongthe duct and is applied with grazing incidence over the surface of the test item. The test item itself may be mountedwithin the duct in which case the grazing incidence wave will be applied over the whole of its external surface. Alternatively, the test item may be mounted in the wall of the duct when the noise will be applied to only that surfacewithin the duct, e.g., on one side of a panel. The method used will depend upon the test item and its in-serviceapplication.
3. ACOUSTIC NOISE CHARACTERISTICS.
Radiated high intensity noise is subjected to distortion due to adiabatic heating. Thus, due to heating of the highpressure peaks and cooling of the rarefaction troughs, the local speed of propagation of these pressures are modified.This causes the peaks to travel faster and the troughs to travel slower than the local speed of propagation such that, ata distance from the source, a sinusoidal wave becomes triangular with a leading shock front. This waveform is richin harmonics and therefore the energy content is extended into a higher frequency range. It can be seen from this thatit is not possible to produce a pure sinusoidal tone at high noise intensities. The same effect takes place with highintensity random noise that is commonly produced by modulating an airflow with a valve driven by a dynamicactuator. Due to velocity and/or acceleration restraints on the actuator, it is not possible to modulate the airflow at
Downloaded from http://www.everyspec.com on 2012-06-04T5:34:26.
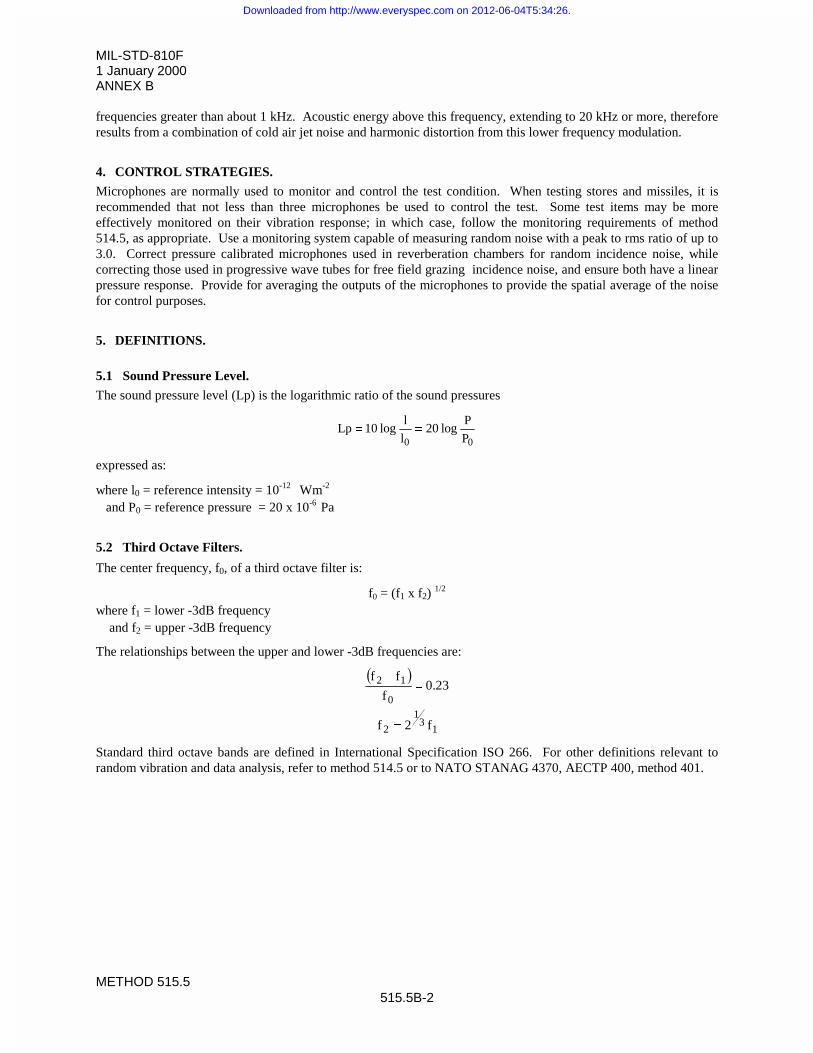
MIL-STD-810F1 January 2000ANNEX B
METHOD 515.5515.5B-2
frequencies greater than about 1 kHz. Acoustic energy above this frequency, extending to 20 kHz or more, thereforeresults from a combination of cold air jet noise and harmonic distortion from this lower frequency modulation.
4. CONTROL STRATEGIES.
Microphones are normally used to monitor and control the test condition. When testing stores and missiles, it isrecommended that not less than three microphones be used to control the test. Some test items may be moreeffectively monitored on their vibration response; in which case, follow the monitoring requirements of method514.5, as appropriate. Use a monitoring system capable of measuring random noise with a peak to rms ratio of up to3.0. Correct pressure calibrated microphones used in reverberation chambers for random incidence noise, whilecorrecting those used in progressive wave tubes for free field grazing incidence noise, and ensure both have a linearpressure response. Provide for averaging the outputs of the microphones to provide the spatial average of the noisefor control purposes.
5. DEFINITIONS.
5.1 Sound Pressure Level.
The sound pressure level (Lp) is the logarithmic ratio of the sound pressures
00 P
Plog20
l
llog10Lp
expressed as:
where l0 = reference intensity = 10-12 Wm-2
and P0 = reference pressure = 20 x 10-6 Pa
5.2 Third Octave Filters.
The center frequency, f0, of a third octave filter is:
f0 = (f1 x f2) 1/2
where f1 = lower -3dB frequency and f2 = upper -3dB frequency
The relationships between the upper and lower -3dB frequencies are:
� �23.0
f
ff
0
12
�
13
1
2 f2f
Standard third octave bands are defined in International Specification ISO 266. For other definitions relevant torandom vibration and data analysis, refer to method 514.5 or to NATO STANAG 4370, AECTP 400, method 401.
Downloaded from http://www.everyspec.com on 2012-06-04T5:34:26.
MIL-STD-810F1 January 2000
METHOD 516.5516.5-i
METHOD 516.5
SHOCK
CONTENTSParagraph Page
1. SCOPE............................................................................................................................ 1
1.1 Purpose........................................................................................................................... 11.2 Application....................................................................................................................... 11.3 Limitations. ...................................................................................................................... 2
2. TAILORING GUIDANCE. ............................................................................................... 2
2.1 Selecting the Shock Method. .......................................................................................... 22.1.1 Effects of shock. ............................................................................................................. 22.1.2 Sequence among other methods.................................................................................... 32.2 Selecting a Procedure..................................................................................................... 32.2.1 Procedure selection considerations. ............................................................................... 32.2.2 Difference among procedures. ....................................................................................... 42.2.3 Test Interruption.............................................................................................................. 52.3 Determine Test Levels and Conditions. .......................................................................... 52.3.1 General considerations – Terminology and illustration for complex transient. ............... 52.3.2 Test conditions.............................................................................................................. 112.3.3 Test axes and number of shock events – general considerations................................ 152.3.4 Test axes and number of shock events – special consideration for complex
transients only. .............................................................................................................. 152.4 Test Item Configuration................................................................................................. 16
3. INFORMATION REQUIRED......................................................................................... 16
3.1 Pretest........................................................................................................................... 163.2 During Test. .................................................................................................................. 173.3 Post-test. ....................................................................................................................... 17
4. TEST PROCESS. ......................................................................................................... 17
4.1 Test Facility. .................................................................................................................. 174.2 Controls......................................................................................................................... 184.2.1 Calibration. .................................................................................................................... 184.2.2 Tolerance. ..................................................................................................................... 184.2.2.1 Classical pulses and complex transient pulses-time domain........................................ 184.2.2.2 Complex transient pulses-SRS. .................................................................................... 184.3 Instrumentation. ............................................................................................................ 194.4 Data Analysis. ............................................................................................................... 194.5 Test Execution. ............................................................................................................. 204.5.1 Preparation for test. ...................................................................................................... 204.5.1.1 Preliminary guidelines. .................................................................................................. 204.5.1.2 Pretest checkout. .......................................................................................................... 204.5.1.3 Procedures overview..................................................................................................... 204.5.2 Procedure I - Functional Shock..................................................................................... 204.5.2.1 Controls......................................................................................................................... 214.5.2.2 Test tolerances. ............................................................................................................ 214.5.2.3 Procedure I.................................................................................................................... 21
Downloaded from http://www.everyspec.com on 2012-06-04T5:34:26.
MIL-STD-810F1 January 2000
METHOD 516.5516.5-ii
CONTENTS
Paragraph Page4.5.2.4 Analysis of results. ........................................................................................................ 224.5.3 Procedure II - Materiel to be Packaged. ....................................................................... 224.5.3.1 Controls......................................................................................................................... 224.5.3.2 Test tolerances. ............................................................................................................ 234.5.3.3 Procedure II................................................................................................................... 234.5.3.4 Analysis of results. ........................................................................................................ 244.5.4 Procedure III - Fragility.................................................................................................. 244.5.4.1 Controls......................................................................................................................... 244.5.4.2 Test tolerances. ............................................................................................................ 254.5.4.3 Procedure III.................................................................................................................. 254.5.4.4 Analysis of results. ........................................................................................................ 274.5.5 Procedure IV - Transit Drop. ......................................................................................... 274.5.5.1 Controls......................................................................................................................... 274.5.5.2 Test tolerances. ............................................................................................................ 274.5.5.3 Procedure IV. ................................................................................................................ 274.5.5.4 Analysis of results. ........................................................................................................ 284.5.6 Procedure V - Crash Hazard......................................................................................... 284.5.6.1 Controls......................................................................................................................... 284.5.6.2 Test tolerances. ............................................................................................................ 304.5.6.3 Procedure V. ................................................................................................................. 304.5.6.4 Analysis of results. ........................................................................................................ 304.5.7 Procedure VI - Bench handling. .................................................................................... 304.5.7.1 Controls......................................................................................................................... 304.5.7.2 Test tolerances. ............................................................................................................ 304.5.7.3 Procedure VI. ................................................................................................................ 304.5.7.4 Analysis of results. ........................................................................................................ 314.5.8 Procedure VII - Rail impact. .......................................................................................... 314.5.8.1 Controls......................................................................................................................... 314.5.8.2 Test tolerances. ............................................................................................................ 324.5.8.3 Procedure VII. ............................................................................................................... 324.5.8.4 Analysis of results. ........................................................................................................ 344.5.9 Procedure VIII - Catapult Launch/Arrested Landing. .................................................... 354.5.9.1 Controls......................................................................................................................... 354.5.9.2 Test tolerances. ............................................................................................................ 374.5.9.3 Procedure VIII. .............................................................................................................. 374.5.9.4 Analysis of results. ........................................................................................................ 38
5. REFERENCE/RELATED DOCUMENTS.......................................................................... 38
FIGURES
FIGURE 516.5-1. Sample shock response acceleration time history............................................. 6FIGURE 516.5-2. Truncated sample shock response acceleration time history effective
durations TE and Te........................................................................................... 7FIGURE 516.5-3. Truncated sample shock acceleration time history short time average
RMS (averaging time approximately 13% of Te)............................................... 7FIGURE 516.5-4. Sample shock response acceleration maximax SRS. ....................................... 9FIGURE 516.5-5. Sample shock response acceleration pseudo-velocity SRS.............................. 9FIGURE 516.5-6. Sample shock response acceleration ESD estimate. ...................................... 10FIGURE 516.5-7. Sample shock response acceleration FS estimate.......................................... 10
Downloaded from http://www.everyspec.com on 2012-06-04T5:34:26.
MIL-STD-810F1 January 2000
METHOD 516.5516.5-iii
CONTENTS
Paragraph PageFIGURE 516.5-8. Test SRS for use if measured data are not available (for Procedure I -
Functional Shock & Procedure V - Crash Hazard). ........................................ 13FIGURE 516.5-9. Random test input ASD yielding equivalent test SRS spectrum shown
on figure 516.5-8 (for Procedure I - Functional Shock). ................................. 14FIGURE 516.5-10. Terminal peak sawtooth shock pulse configuration and its tolerance limits
(for use when shock response spectrum analysis capability is not availablein Procedure I – Functional Shock and Procedure V Crash Hazard). ........... 14
FIGURE 516.5-11. Trapezoidal shock pulse configuration and its tolerance limits (for usewhen shock response spectrum analysis capability is not available inProcedure II – Materiel to be Packaged, and Procedure III - Fragility). ........ 16
FIGURE 516.5-12. Sample measured store three axis catapult launch componentresponse acceleration time histories. ............................................................ 36
FIGURE 516.5-13. Sample measured store three axis arrested landing componentresponse acceleration time histories. ............................................................ 37
TABLES
TABLE 516.5-I. Test shock response spectra for use if measured data are not available........... 13TABLE 516.5-II. Terminal peak sawtooth pulse test parameters (refer to figure 516.5-10). ........ 21TABLE 516.5-III. Trapezoidal pulse parameters (refer to figure 516.5-11)................................... 23TABLE 516.5-IV. Suggested drop height for Procedure II. ........................................................... 23TABLE 516.5-V. Trapezoidal pulse test parameters (refer to figure 516.5-11). ........................... 25TABLE 516.5-VI. Transit drop test. ............................................................................................... 29TABLE 516.5-VII. Terminal peak sawtooth pulse test parameters (refer to figure 516.5-10)....... 29TABLE 516.5-VIII. Impact test time speed (miles per hour - based on 22’0” rail). ....................... 34
ANNEX A. STATISTICAL CONSIDERATIONS FORDEVELOPING LIMITS ON PREDICTED AND PROCESSED DATA
1. SCOPE............................................................................................................................ 1
1.1 Purpose........................................................................................................................... 11.2 Application....................................................................................................................... 1
2. DEVELOPMENT............................................................................................................. 1
2.1 Basic Estimate Assumptions........................................................................................... 12.2 Basic Estimate Summary Preprocessing........................................................................ 12.3 Parametric Upper Limit Statistical Estimate Assumptions. ............................................. 22.3.1 NTL - Upper normal one-sided tolerance limit. ............................................................... 22.3.2 NPL - Upper normal prediction limit. ............................................................................... 32.4 Nonparametric Upper Limit Statistical Estimate Assumptions........................................ 32.4.1 ENV – Upper limit............................................................................................................ 32.4.2 DFL – Upper distribution-free tolerance limit. ................................................................. 42.4.3 ETL – Upper empirical tolerance limit. ............................................................................ 4
3. EXAMPLE....................................................................................................................... 5
3.1 Input Test Data Set. ........................................................................................................ 53.2 Parametric Upper Limits. ................................................................................................ 53.3 Nonparametric Upper Limits. .......................................................................................... 53.4 Observations. .................................................................................................................. 63.5 MATLAB m-function “ul.”................................................................................................. 6
Downloaded from http://www.everyspec.com on 2012-06-04T5:34:26.
MIL-STD-810F1 January 2000
METHOD 516.5516.5-iv
CONTENTS
Paragraph Page
4. RECOMMENDED PROCEDURES................................................................................. 8
4.1 Recommended Statistical Procedures for Upper Limit Estimates. ................................. 84.2 Uncertainty Factors. ........................................................................................................ 8
FIGURES
FIGURE 516.5A-1. Input test data set. ........................................................................................... 5FIGURE 516.5A-2. Parametric and non-parametric upper limits.................................................... 6FIGURE 516.5A-3. MATLAB m-function “ul” for upper limit determination. ................................... 7
TABLES
TABLE 516.5A-I. Normal tolerance factors for upper tolerance limit. ............................................ 3TABLE 516.5A-II. Input test data set. ............................................................................................. 8
ANNEX B. EFFECTIVE SHOCK DURATION
1. SCOPE............................................................................................................................ 1
1.1 Purpose........................................................................................................................... 11.2 Application....................................................................................................................... 1
2. DEVELOPMENT............................................................................................................. 1
2.1 Assumptions on Shock Envelope Development. ............................................................ 12.2 Te versus TE. ................................................................................................................... 2
3. RECOMMENDED PROCEDURES FOR SYNTHESIS AND ANALYSIS....................... 3
3.1 Synthesis Recommended for Te. .................................................................................... 33.2 Synthesis Uncertainty Factors for Te............................................................................... 33.3 Analysis Relationship to Te.............................................................................................. 3
FIGURES
FIGURE 516.5B-1a. Typical shock time history with envelope, TE and Te. .................................... 2FIGURE 516.5B-1b. Typical shock time history RMS with envelope and Te. ................................. 2FIGURE 516.5B-2. Scatter plot TE versus Te................................................................................ 3
ANNEX C. AUTOSPECTRAL DENSITY WITH EQUIVALENT TESTSHOCK RESPONSE SPECTRA
1. SCOPE............................................................................................................................ 1
1.1 Purpose........................................................................................................................... 11.2 Application....................................................................................................................... 1
2. DEVELOPMENT............................................................................................................. 1
2.1 Assumptions on Autospectral Density. ........................................................................... 12.2 Assumptions on Shock Response Spectra..................................................................... 1
3. RECOMMENDED PROCEDURES................................................................................. 1
3.1 Recommended for ASD.................................................................................................. 13.2 Recommended for SRS.................................................................................................. 1
Downloaded from http://www.everyspec.com on 2012-06-04T5:34:26.

MIL-STD-810F1 January 2000
METHOD 516.5516.5-v
CONTENTS
Paragraph PageFIGURES
FIGURE 516.5C-1a. Sample gaussian time history for functional test for ground materiel............ 2FIGURE 516.5C-1b. Sample gaussian time history for functional test for flight materiel. .............. 2FIGURE 516.5C-2a. SRS comparison for functional test for ground materiel................................ 3FIGURE 516.5C-2b. SRS comparison for functional test for flight materiel. .................................. 3
Downloaded from http://www.everyspec.com on 2012-06-04T5:34:26.

MIL-STD-810F1 January 2000
METHOD 516.5516.5-vi
THIS PAGE INTENTIONALLY BLANK
Downloaded from http://www.everyspec.com on 2012-06-04T5:34:26.
MIL-STD-810F1 January 2000
METHOD 516.5516.5-1
METHOD 516.5
SHOCK
NOTE: Tailoring is essential. Select methods, procedures, and parameter levels based on the tailoring processdescribed in Part One, paragraph 4, and Appendix C. Apply the general guidelines for laboratory test methodsdescribed in Part One, paragraph 5 of this standard.
1. SCOPE.
1.1 Purpose.
Shock tests are performed to:
a. provide a degree of confidence that materiel can physically and functionally withstand the relativelyinfrequent, non-repetitive shocks encountered in handling, transportation, and service environments. This may include an assessment of the overall materiel system integrity for safety purposes in any one orall of the handling, transportation, and service environments;
b. determine the materiel's fragility level, in order that packaging may be designed to protect the materiel'sphysical and functional integrity; and
c. test the strength of devices that attach materiel to platforms that can crash.
1.2 Application.
Use this method to evaluate the physical and functional performance of materiel likely to be exposed to mechanicallyinduced shocks in its lifetime. Such mechanical shock environments are generally limited to a frequency range not toexceed 10,000 Hz and a time duration of not more than 1.0 second. (In most cases of mechanical shock thesignificant materiel response frequencies will not exceed 2,000 Hz and the duration of materiel response will notexceed 0.1 second.) The materiel response to the mechanical shock environment will, in general, be highlyoscillatory, of short duration, and have a substantial initial rise time with large positive and negative peak amplitudesof about the same order of magnitude.1 The peak responses of materiel to mechanical shock will, in general, beenveloped by a decreasing form of exponential function in time. In general, mechanical shock applied to a complexmulti-modal materiel system will cause the materiel to respond to (1) forced frequencies imposed on the materielfrom the external excitation environment, and (2) the materiel's resonant natural frequencies either during or afterapplication of the excitation. Such response may cause:
a. materiel failure as a result of increased or decreased friction between parts, or general interferencebetween parts;
b. changes in materiel dielectric strength, loss of insulation resistance, variations in magnetic andelectrostatic field strength;
c. materiel electronic circuit card malfunction, electronic circuit card damage, and electronic connectorfailure. (On occasion, circuit card contaminants having the potential to cause short circuit may bedislodged under materiel response to shock.);
d. permanent mechanical deformation of the materiel as a result of overstress of materiel structural and non-structural members;
e. collapse of mechanical elements of the materiel as a result of the ultimate strength of the componentbeing exceeded;
1 For high impact velocity shock, e.g., penetration shocks, there may be significantly less or no oscillatory behaviorwith substantial area under the acceleration response curve.
Downloaded from http://www.everyspec.com on 2012-06-04T5:34:26.
MIL-STD-810F1 January 2000
METHOD 516.5516.5-2
f. accelerated fatiguing of materials (low cycle fatigue);
g. potential piezoelectric activity of materials, and
h. materiel failure as a result of cracks in fracturing crystals, ceramics, epoxies, or glass envelopes.
1.3 Limitations.
a. This method does not include the effects of shock experienced by materiel as a result of pyrotechnicdevice initiation. For this type of shock see method 517, Pyroshock.
b. This method does not include the effects experienced by materiel to very high level localized impactshocks, e.g., ballistic impacts. For this type of shock, devise specialized tests based on experimentaldata, and consult method 522, Ballistic Shock.
c. This method does not include the high impact shock effects experienced by materiel aboard a ship. Consider performing shock tests for shipboard materiel in accordance with MIL-S-901 (reference k).
d. This method does not include the effects experienced by fuse systems. Perform shock tests for safety andoperation of fuses and fuse components in accordance with MIL-STD-331 (reference l).
e. This method does not include the effects experienced by materiel that is subject to high pressure waveimpact, e.g., pressure impact on a materiel surface as a result of firing of a gun. For this type of shockand subsequent materiel response, devise specialized tests based on experimental data and consultmethod 519.5, Gunfire Vibration.
f. This method does not include the shock effects experienced by very large extended materiel, e.g.,building pipe distribution systems, over which varied parts of the materiel may experience different andunrelated shock events. For this type of shock, specialized tests based on experimental data must bedevised.
g. This method does not include special provisions for performing shock tests at high or low temperatures. Perform tests at room ambient temperature unless otherwise specified. Guidelines found in this sectionof the standard, however, may be helpful in setting up and performing shock tests at high or lowtemperatures.
h. This method does not include engineering guidelines related to unplanned test interruption as a result oftest equipment or other malfunction. Generally, if an interruption occurs during a shock pulse input,repeat that shock pulse input. Care must be taken to ensure stresses induced by the interrupted pulse donot invalidate subsequent test results. It is incumbent on all test facilities that data from suchinterruptions be recorded and analyzed before continuing with the test sequence. In addition, the overallintegrity of the materiel must be inspected to ensure pre-shock test materiel integrity.
2. TAILORING GUIDANCE.
2.1 Selecting the Shock Method.
After examining requirements documents and applying the tailoring process in Part One of this standard to determinewhere mechanical shock environments are foreseen in the life cycle of the materiel, use the following to confirm theneed for this method and to place it in sequence with other methods.
2.1.1 Effects of shock.
Mechanical shock has the potential for producing adverse effects on the physical and functional integrity of allmateriel. In general, the level of adverse effects increases with both the magnitude and the duration of the shockenvironment. Durations of shock that correspond with natural frequency periods of the materiel and/or periods ofmajor frequency components in input shock environment waveforms that correspond with natural frequency periodsof the materiel will magnify the adverse effects on the materiel's overall physical and functional integrity.
Downloaded from http://www.everyspec.com on 2012-06-04T5:34:26.
MIL-STD-810F1 January 2000
METHOD 516.5516.5-3
2.1.2 Sequence among other methods.
a. General. See Part One, paragraph 5.5.
b. Unique to this method. Sequencing among other methods will depend upon the type of testing i.e.,developmental, qualification, endurance, etc and the general availability of test items for test. Normally,schedule shock tests early in the test sequence, but after any vibration tests.
(1) If the shock environment is deemed particularly severe, and the chances of materiel survival withoutmajor structural or functional failure are small, the shock test should be first in the test sequence. This provides the opportunity to redesign the materiel to meet the shock requirement before testingto the more benign environments with potential cost savings.
(2) If the shock environment is deemed severe but the chances of the materiel survival without structuralor functional failure is good, perform the shock test after vibration and thermal tests, allowing thestressing of the test item prior to shock testing to uncover combined vibration, temperature, andshock environmental failures.
(3) In cases in which the shock test levels are deemed less severe than the vibration test levels, the shocktests may be deleted from the testing sequence.
(4) There are often advantages to applying shock tests before climatic tests, provided this sequencerepresents realistic service conditions. Test experience has shown that climate-sensitive defectsoften show up more clearly after the application of shock environments. However, internal orexternal thermal stresses may permanently weaken materiel resistance to vibration and shock thatmay go undetected if shock tests are applied before climatic tests.
2.2 Selecting a Procedure.
This method includes eight test procedures.
a. Procedure I - Functional Shock.
b. Procedure II - Materiel to be packaged.
c. Procedure III – Fragility.
d. Procedure IV - Transit Drop.
e. Procedure V - Crash Hazard.
f. Procedure VI - Bench Handling.
g. Procedure VII - Rail Impact.
h. Procedure VIII - Catapult Launch/Arrested Landing.
2.2.1 Procedure selection considerations.
Based on the test data requirements, determine which test procedure, combination of procedures, or sequence ofprocedures is applicable. In many cases, one or more of the procedures will apply. Consider all shock environmentsanticipated for the materiel during its life cycle, both in its logistic and operational modes. When selectingprocedures, consider:
a. The operational purpose of the materiel. From requirement documents, determine the operations orfunctions to be performed by the materiel before, during and after the shock environment.
b. The natural exposure circumstances. Procedures I through VII specify single shocks which result frommomentum exchange between materiel or materiel support structures and another body. Procedure VIII(catapult launch) contains a sequence of two shocks separated by a comparatively short durationvibration, i.e., transient vibration. Procedure VIII (Catapult Launch/Arrested Landing) may beconsidered a single shock followed by a transient vibration.
Downloaded from http://www.everyspec.com on 2012-06-04T5:34:26.
MIL-STD-810F1 January 2000
METHOD 516.5516.5-4
c. Data required. The test data required to document the test environment and to verify the performance ofthe materiel before, during, and after test.
d. Procedure sequence. Refer to paragraph 2.1.2.
2.2.2 Difference among procedures.
a. Procedure I - Functional Shock. Procedure I is intended to test materiel (including mechanical,electrical, hydraulic, and electronic) in its functional mode and to assess the physical integrity, continuityand functionality of the materiel to shock. In general, the materiel is required to function during theshock and to survive without damage to shocks representative of those that may be encountered duringoperational service.
b. Procedure II - Materiel to be packaged. Procedure II is to be used when materiel will require a shippingcontainer. It specifies a minimum critical shock resistance level to a handling drop height. The shockdefinition may be furnished to a package designer as a design criterion. This procedure is not intendedfor the test of extremely fragile materiel, e.g., missile guidance systems, precision-aligned test equipment,gyros, inertial guidance platforms, etc. For extremely fragile materiel where quantification of shockresistance is required Procedure III should be considered. See paragraph 2.3 below for processingtechniques useful in expressing shock resistance criteria.
c. Procedure III - Fragility. Procedure III is used to determine a materiel’s ruggedness or fragility so thatpackaging can be designed for the materiel, or so the materiel can be redesigned to meet transportationand/or handling requirements. This procedure is used to determine the critical shock conditions at whichthere is reasonable chance of structural and/or functional system degradation. To achieve the mostrealistic criteria, perform the procedure at environmental temperature extremes. See paragraph 2.3 belowfor processing techniques useful in expressing shock fragility criteria.
d. Procedure IV - Transit Drop. Procedure IV is intended for materiel either outside of or within its transitor combination case, or as prepared for field use (carried to a combat situation by man, truck, rail, etc.). This procedure is used to determine if the materiel is capable of withstanding the shocks normallyinduced by loading and unloading when it is (1) outside of its transit or combination case, e.g., duringroutine maintenance, when being removed from a rack, being placed in its transit case, etc., or (2) insideits transit or combination case. Such shocks are accidental, but may impair the functioning of themateriel. This procedure is not intended for shocks encountered in a normal logistic environment asexperienced by materiel inside shipping containers and defined in the materiel’s life cycle profile (seeProcedure II – Materiel to be Packaged).
e. Procedure V - Crash Hazard. Procedure V is for materiel mounted in air or ground vehicles that couldbreak loose from its mounts, tiedowns or containment configuration during a crash and present a hazardto vehicle occupants and bystanders. This procedure is intended to verify the structural integrity ofmateriel mounts, tiedowns or containment configuration during simulated crash conditions. The testshould be used to verify the overall structural integrity of the materiel, i.e., parts of the materiel are notejected under the shock. This procedure is not intended for materiel transported as cargo for whichmethod 513.5, Acceleration, or method 514.5, Vibration, could be applied.
f. Procedure VI - Bench Handling. Procedure VI is intended for materiel that may typically experiencebench handling, bench maintenance, or packaging. It is used to determine the ability of the materiel towithstand representative levels of shock encountered during typical bench handling, bench maintenance,or packaging. Such shocks might occur during materiel repair. This procedure may include testing formateriel with protrusions that may be easily damaged without regard to gross shock on the total materiel.The nature of such testing is highly specialized and must be performed on a case-by-case basis, notingthe configuration of the materiel protrusions and the case scenarios for damage during such activities asbench handling, maintenance, and packaging. This procedure is appropriate for medium-to-large testmateriel out of its transit or combination case that has a maximum dimension greater than approximately23 cm (9 inches). Small materiel systems, in general, will be tested to higher levels during Procedure IV,Transit Drop.
Downloaded from http://www.everyspec.com on 2012-06-04T5:34:26.
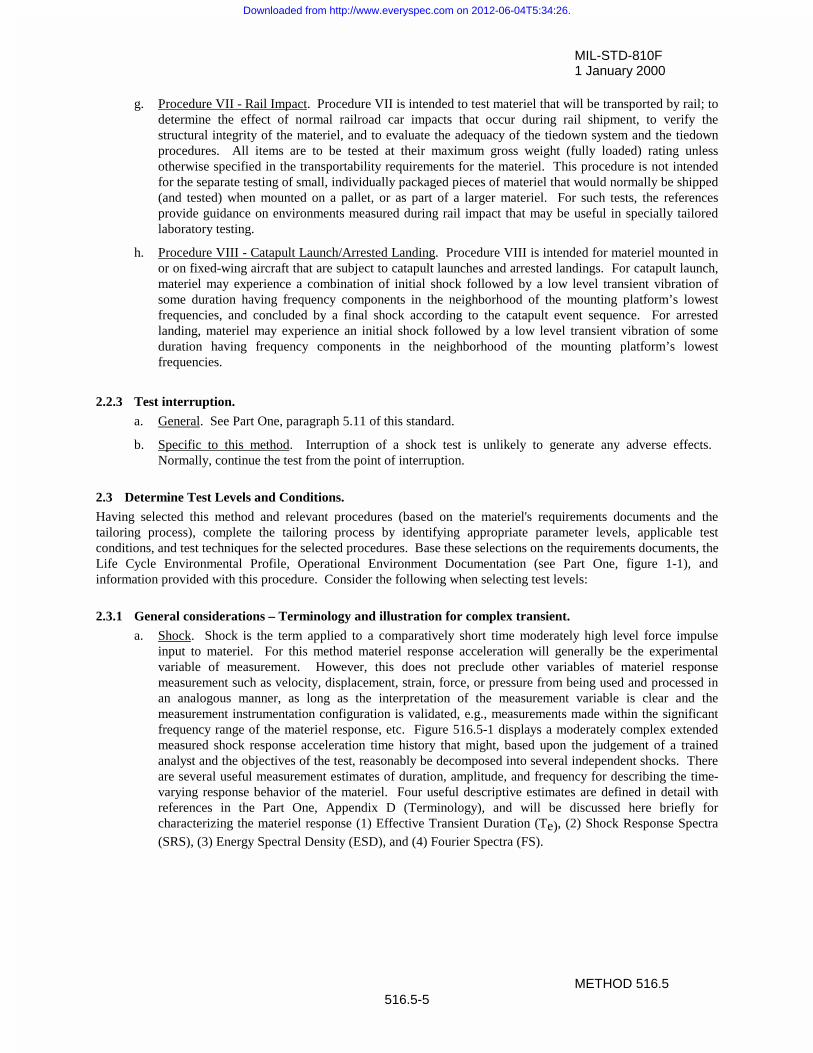
MIL-STD-810F1 January 2000
METHOD 516.5516.5-5
g. Procedure VII - Rail Impact. Procedure VII is intended to test materiel that will be transported by rail; todetermine the effect of normal railroad car impacts that occur during rail shipment, to verify thestructural integrity of the materiel, and to evaluate the adequacy of the tiedown system and the tiedownprocedures. All items are to be tested at their maximum gross weight (fully loaded) rating unlessotherwise specified in the transportability requirements for the materiel. This procedure is not intendedfor the separate testing of small, individually packaged pieces of materiel that would normally be shipped(and tested) when mounted on a pallet, or as part of a larger materiel. For such tests, the referencesprovide guidance on environments measured during rail impact that may be useful in specially tailoredlaboratory testing.
h. Procedure VIII - Catapult Launch/Arrested Landing. Procedure VIII is intended for materiel mounted inor on fixed-wing aircraft that are subject to catapult launches and arrested landings. For catapult launch,materiel may experience a combination of initial shock followed by a low level transient vibration ofsome duration having frequency components in the neighborhood of the mounting platform’s lowestfrequencies, and concluded by a final shock according to the catapult event sequence. For arrestedlanding, materiel may experience an initial shock followed by a low level transient vibration of someduration having frequency components in the neighborhood of the mounting platform’s lowestfrequencies.
2.2.3 Test interruption.
a. General. See Part One, paragraph 5.11 of this standard.
b. Specific to this method. Interruption of a shock test is unlikely to generate any adverse effects. Normally, continue the test from the point of interruption.
2.3 Determine Test Levels and Conditions.
Having selected this method and relevant procedures (based on the materiel's requirements documents and thetailoring process), complete the tailoring process by identifying appropriate parameter levels, applicable testconditions, and test techniques for the selected procedures. Base these selections on the requirements documents, theLife Cycle Environmental Profile, Operational Environment Documentation (see Part One, figure 1-1), andinformation provided with this procedure. Consider the following when selecting test levels:
2.3.1 General considerations – Terminology and illustration for complex transient.
a. Shock. Shock is the term applied to a comparatively short time moderately high level force impulseinput to materiel. For this method materiel response acceleration will generally be the experimentalvariable of measurement. However, this does not preclude other variables of materiel responsemeasurement such as velocity, displacement, strain, force, or pressure from being used and processed inan analogous manner, as long as the interpretation of the measurement variable is clear and themeasurement instrumentation configuration is validated, e.g., measurements made within the significantfrequency range of the materiel response, etc. Figure 516.5-1 displays a moderately complex extendedmeasured shock response acceleration time history that might, based upon the judgement of a trainedanalyst and the objectives of the test, reasonably be decomposed into several independent shocks. Thereare several useful measurement estimates of duration, amplitude, and frequency for describing the time-varying response behavior of the materiel. Four useful descriptive estimates are defined in detail withreferences in the Part One, Appendix D (Terminology), and will be discussed here briefly forcharacterizing the materiel response (1) Effective Transient Duration (Te), (2) Shock Response Spectra(SRS), (3) Energy Spectral Density (ESD), and (4) Fourier Spectra (FS).
Downloaded from http://www.everyspec.com on 2012-06-04T5:34:26.
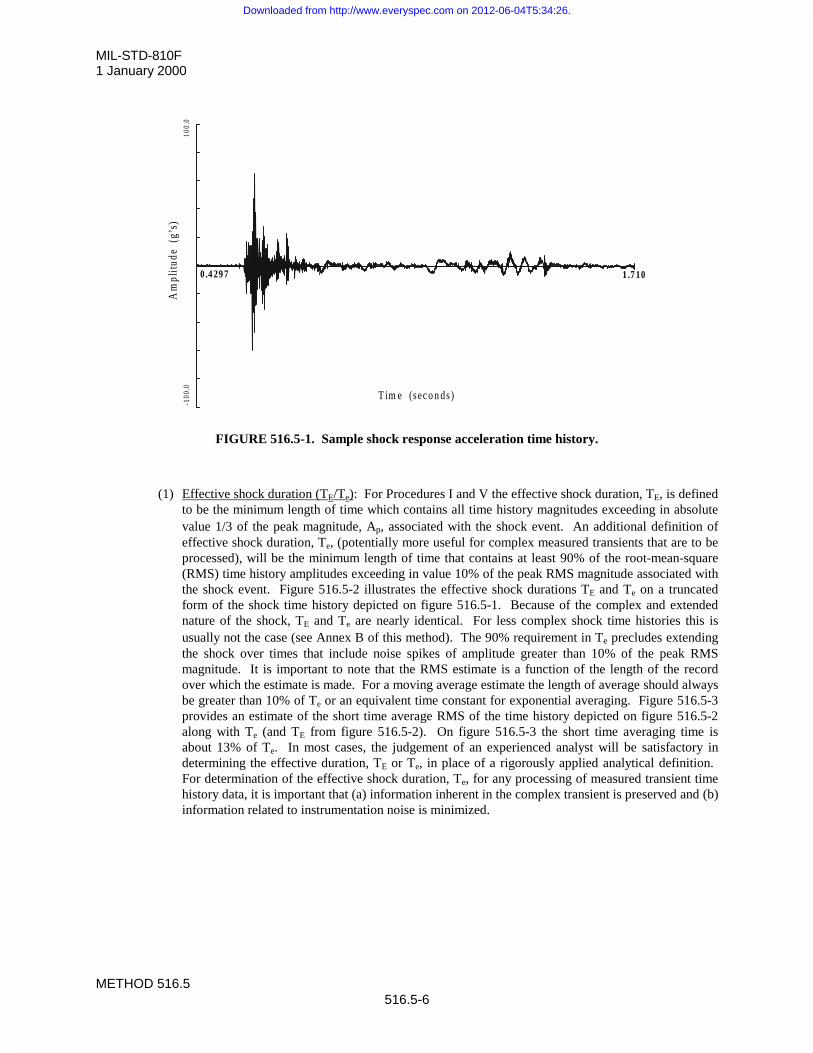
MIL-STD-810F1 January 2000
METHOD 516.5516.5-6
FIGURE 516.5-1. Sample shock response acceleration time history.
(1) Effective shock duration (TE/Te): For Procedures I and V the effective shock duration, TE, is definedto be the minimum length of time which contains all time history magnitudes exceeding in absolutevalue 1/3 of the peak magnitude, Ap, associated with the shock event. An additional definition ofeffective shock duration, Te, (potentially more useful for complex measured transients that are to beprocessed), will be the minimum length of time that contains at least 90% of the root-mean-square(RMS) time history amplitudes exceeding in value 10% of the peak RMS magnitude associated withthe shock event. Figure 516.5-2 illustrates the effective shock durations TE and Te on a truncatedform of the shock time history depicted on figure 516.5-1. Because of the complex and extendednature of the shock, TE and Te are nearly identical. For less complex shock time histories this isusually not the case (see Annex B of this method). The 90% requirement in Te precludes extendingthe shock over times that include noise spikes of amplitude greater than 10% of the peak RMSmagnitude. It is important to note that the RMS estimate is a function of the length of the recordover which the estimate is made. For a moving average estimate the length of average should alwaysbe greater than 10% of Te or an equivalent time constant for exponential averaging. Figure 516.5-3provides an estimate of the short time average RMS of the time history depicted on figure 516.5-2along with Te (and TE from figure 516.5-2). On figure 516.5-3 the short time averaging time isabout 13% of Te. In most cases, the judgement of an experienced analyst will be satisfactory indetermining the effective duration, TE or Te, in place of a rigorously applied analytical definition. For determination of the effective shock duration, Te, for any processing of measured transient timehistory data, it is important that (a) information inherent in the complex transient is preserved and (b)information related to instrumentation noise is minimized.
1 .7 100 .4 29 7
Am
plit
ude
(g’
s)10
0.0
-100
.0
T im e (sec o n ds )
Downloaded from http://www.everyspec.com on 2012-06-04T5:34:26.
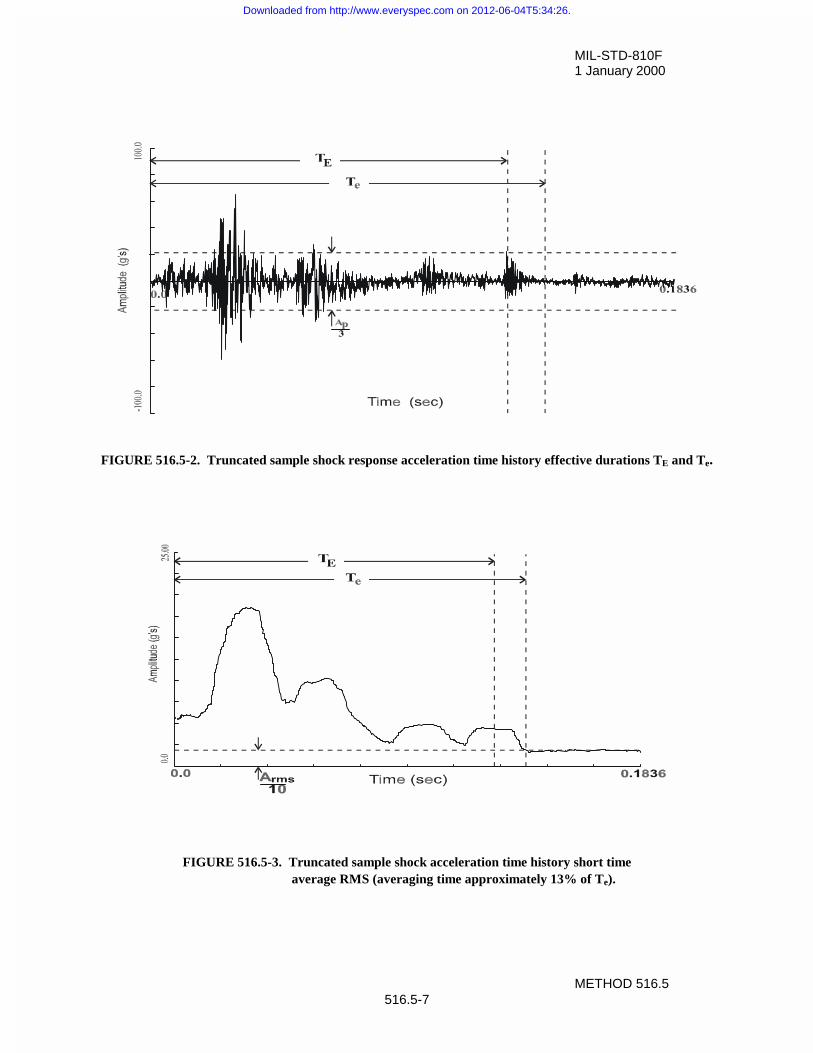
MIL-STD-810F1 January 2000
METHOD 516.5516.5-7
FIGURE 516.5-2. Truncated sample shock response acceleration time history effective durations TE and Te.
FIGURE 516.5-3. Truncated sample shock acceleration time history short time average RMS (averaging time approximately 13% of Te).
Downloaded from http://www.everyspec.com on 2012-06-04T5:34:26.
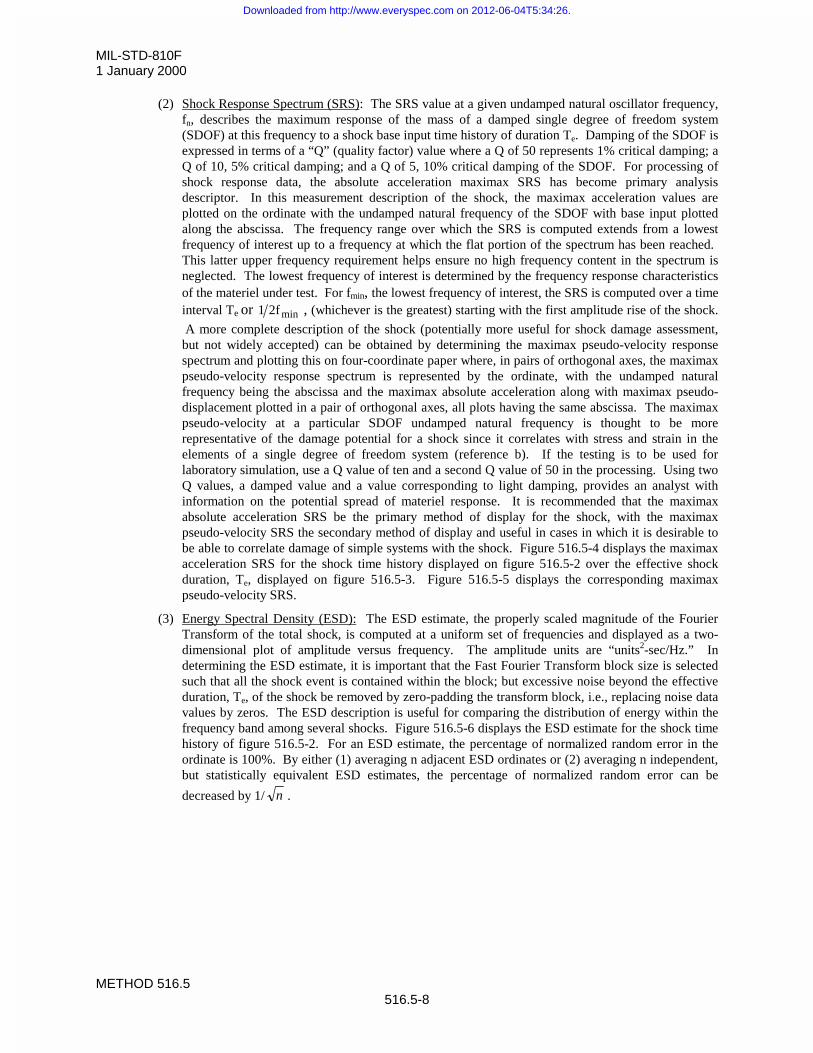
MIL-STD-810F1 January 2000
METHOD 516.5516.5-8
(2) Shock Response Spectrum (SRS): The SRS value at a given undamped natural oscillator frequency,fn, describes the maximum response of the mass of a damped single degree of freedom system(SDOF) at this frequency to a shock base input time history of duration Te. Damping of the SDOF isexpressed in terms of a “Q” (quality factor) value where a Q of 50 represents 1% critical damping; aQ of 10, 5% critical damping; and a Q of 5, 10% critical damping of the SDOF. For processing ofshock response data, the absolute acceleration maximax SRS has become primary analysisdescriptor. In this measurement description of the shock, the maximax acceleration values areplotted on the ordinate with the undamped natural frequency of the SDOF with base input plottedalong the abscissa. The frequency range over which the SRS is computed extends from a lowestfrequency of interest up to a frequency at which the flat portion of the spectrum has been reached. This latter upper frequency requirement helps ensure no high frequency content in the spectrum isneglected. The lowest frequency of interest is determined by the frequency response characteristicsof the materiel under test. For fmin, the lowest frequency of interest, the SRS is computed over a timeinterval Te or minf21 , (whichever is the greatest) starting with the first amplitude rise of the shock.
A more complete description of the shock (potentially more useful for shock damage assessment,but not widely accepted) can be obtained by determining the maximax pseudo-velocity responsespectrum and plotting this on four-coordinate paper where, in pairs of orthogonal axes, the maximaxpseudo-velocity response spectrum is represented by the ordinate, with the undamped naturalfrequency being the abscissa and the maximax absolute acceleration along with maximax pseudo-displacement plotted in a pair of orthogonal axes, all plots having the same abscissa. The maximaxpseudo-velocity at a particular SDOF undamped natural frequency is thought to be morerepresentative of the damage potential for a shock since it correlates with stress and strain in theelements of a single degree of freedom system (reference b). If the testing is to be used forlaboratory simulation, use a Q value of ten and a second Q value of 50 in the processing. Using twoQ values, a damped value and a value corresponding to light damping, provides an analyst withinformation on the potential spread of materiel response. It is recommended that the maximaxabsolute acceleration SRS be the primary method of display for the shock, with the maximaxpseudo-velocity SRS the secondary method of display and useful in cases in which it is desirable tobe able to correlate damage of simple systems with the shock. Figure 516.5-4 displays the maximaxacceleration SRS for the shock time history displayed on figure 516.5-2 over the effective shockduration, Te, displayed on figure 516.5-3. Figure 516.5-5 displays the corresponding maximaxpseudo-velocity SRS.
(3) Energy Spectral Density (ESD): The ESD estimate, the properly scaled magnitude of the FourierTransform of the total shock, is computed at a uniform set of frequencies and displayed as a two-dimensional plot of amplitude versus frequency. The amplitude units are “units2-sec/Hz.” Indetermining the ESD estimate, it is important that the Fast Fourier Transform block size is selectedsuch that all the shock event is contained within the block; but excessive noise beyond the effectiveduration, Te, of the shock be removed by zero-padding the transform block, i.e., replacing noise datavalues by zeros. The ESD description is useful for comparing the distribution of energy within thefrequency band among several shocks. Figure 516.5-6 displays the ESD estimate for the shock timehistory of figure 516.5-2. For an ESD estimate, the percentage of normalized random error in theordinate is 100%. By either (1) averaging n adjacent ESD ordinates or (2) averaging n independent,but statistically equivalent ESD estimates, the percentage of normalized random error can be
decreased by 1/ n .
Downloaded from http://www.everyspec.com on 2012-06-04T5:34:26.
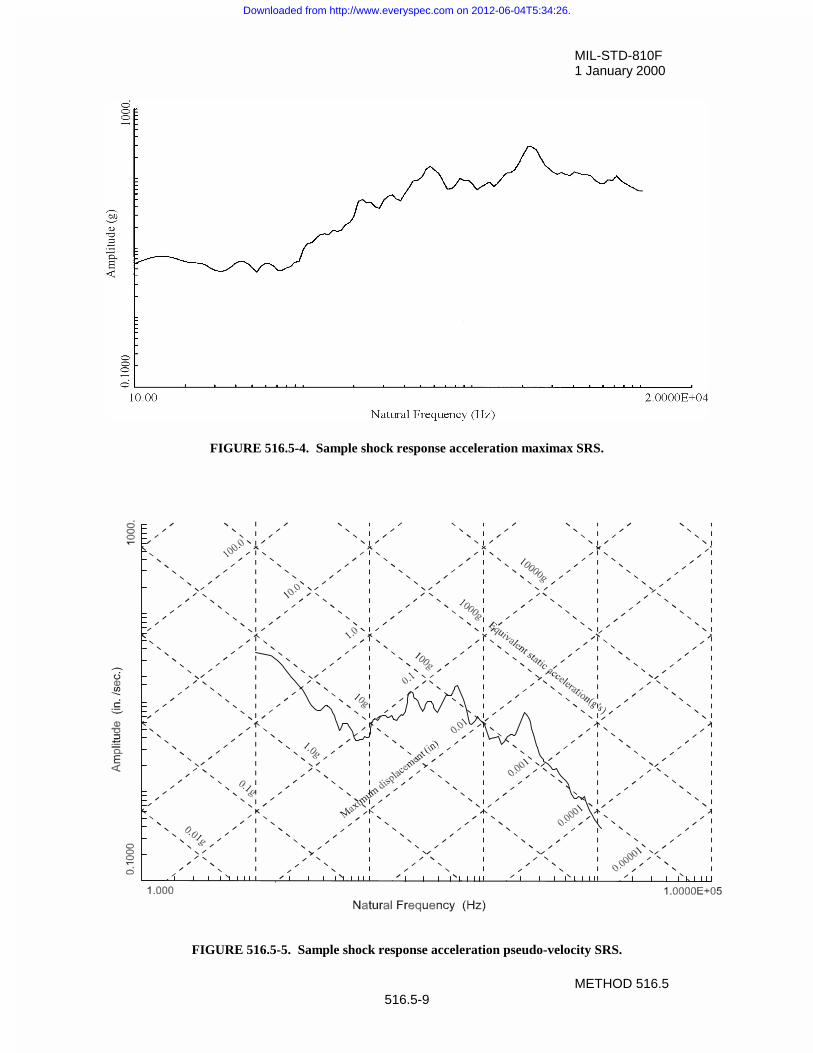
MIL-STD-810F1 January 2000
METHOD 516.5516.5-9
FIGURE 516.5-4. Sample shock response acceleration maximax SRS.
FIGURE 516.5-5. Sample shock response acceleration pseudo-velocity SRS.
(g ’s )
Downloaded from http://www.everyspec.com on 2012-06-04T5:34:26.
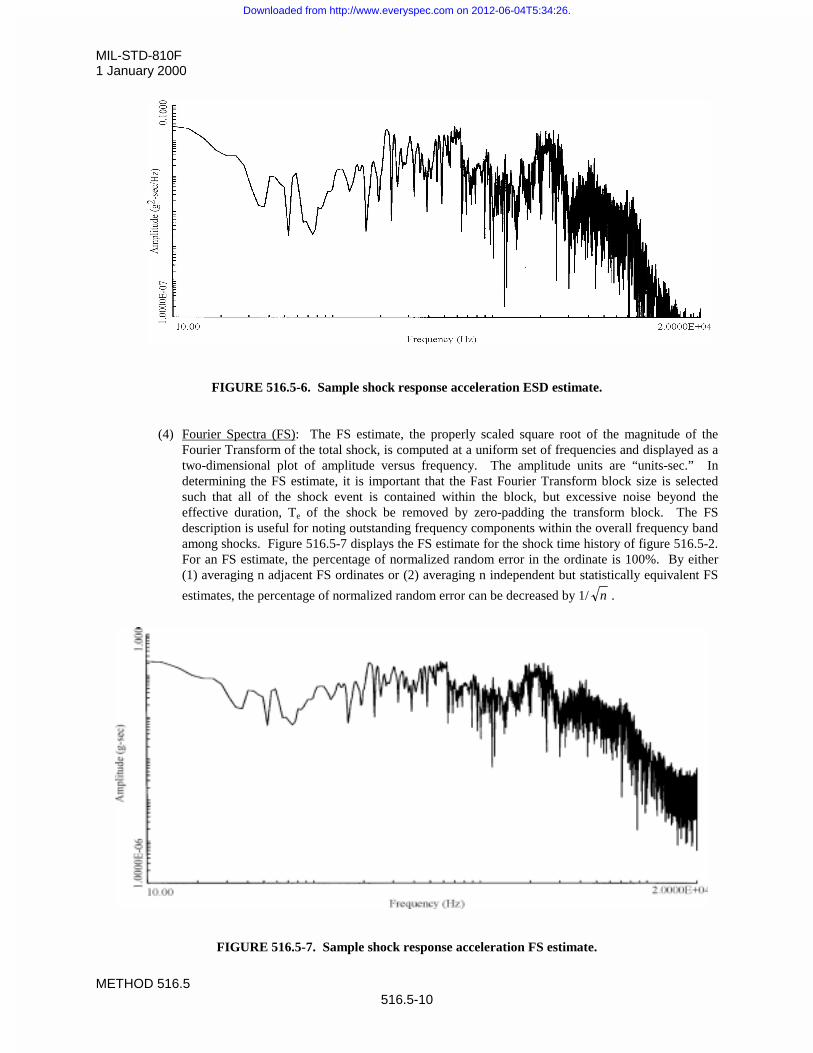
MIL-STD-810F1 January 2000
METHOD 516.5516.5-10
FIGURE 516.5-6. Sample shock response acceleration ESD estimate.
(4) Fourier Spectra (FS): The FS estimate, the properly scaled square root of the magnitude of theFourier Transform of the total shock, is computed at a uniform set of frequencies and displayed as atwo-dimensional plot of amplitude versus frequency. The amplitude units are “units-sec.” Indetermining the FS estimate, it is important that the Fast Fourier Transform block size is selectedsuch that all of the shock event is contained within the block, but excessive noise beyond theeffective duration, Te of the shock be removed by zero-padding the transform block. The FSdescription is useful for noting outstanding frequency components within the overall frequency bandamong shocks. Figure 516.5-7 displays the FS estimate for the shock time history of figure 516.5-2.For an FS estimate, the percentage of normalized random error in the ordinate is 100%. By either(1) averaging n adjacent FS ordinates or (2) averaging n independent but statistically equivalent FS
estimates, the percentage of normalized random error can be decreased by 1/ n .
FIGURE 516.5-7. Sample shock response acceleration FS estimate.
Downloaded from http://www.everyspec.com on 2012-06-04T5:34:26.
MIL-STD-810F1 January 2000
METHOD 516.5516.5-11
b. Shock/Random Vibration. In general, any one test procedure will not be required along any axis forwhich a sufficiently severe random vibration test procedure is required, provided that system integrityrequirements are comparable. Random vibration test severity is sufficient if the shock response spectrumover a short duration of the signal based upon a three-sigma Gaussian acceleration response of a SDOF,exceeds the shock test response spectrum everywhere in the specified range of natural frequencies. TheQ value to be used in the analysis is generally taken to be ten, which is equivalent to five percent ofcritical viscous damping. The three-sigma shock response spectrum for the random test is given, as afunction of natural frequency of the SDOF, by
2
1
)(G2
3)f(A »¼
º«¬
ª¸¹
ᬩ
§ S fQf
in units of acceleration, where G(f) is the acceleration ASD at frequency f (reference a). Annex C of thismethod discusses the relationship between ASD levels and corresponding SRS levels for purposes ofsubstituting a comparatively high level random vibration test for a relatively low level shock test.
c. Statistical Estimate Processing. At times it may be convenient or even necessary to combine equivalentlyprocessed response estimates in some statistical manner. Reference g discusses some options instatistically summarizing processed results from a series of tests. The best option is dependent upon thesize of sample in general. Processed results from the SRS, ESD, or FS are typically logarithmicallytransformed to provide estimates that are more normally distributed. This transformation is importantsince often very few estimates are available from a test series and the probability distribution of theuntransformed estimates cannot be assumed to be normally distributed. In virtually all cases,combination of processed results will fall under the category of small sample statistics and need to beconsidered with care with other parametric or less powerful nonparametric methods of statistical analysis.Annex 516.5A addresses the appropriate techniques for the statistical combination of processed testresults as a function of the size of the sample.
d. Other Processing. Other descriptive processes that tend to decompose the shock into component parts,e.g., product model, time domain moments, wavelets, etc., may be useful, but are beyond the scope ofthis document.
2.3.2 Test conditions.
Derive the test SRS and Te from statistical processing of (1) time history measurements of the materiel’s functionalenvironment, (2) from a carefully scaled measurement of a dynamically similar environment, (3) from prediction, or(4) from a combination of sources. For tailoring purposes, every attempt needs to be made to obtain measured dataunder conditions similar to service environment conditions in the Life Cycle Profile. In test SRS and Te derivationand subsequent execution rank from the most desirable to the least desirable as follows:
- measured data summarized and shock created by way of direct reproduction of the measured data undershaker waveform control;
- measured data summarized and shock synthesized by way of a complex transient making sure thatmeasured Te is approximately the test Te, and the measured waveform is similar to the synthesizedwaveform, i.e., amplitude and zero crossing similarity.
- no measured data but previous SRS estimates available and shock synthesized by way of a complextransient with Te specified in some reasonable way taking into consideration the natural frequencyresponse characteristics of the materiel;
- no measured data but classical pulse shock descriptions available for use in reproducing the shock. (The use of classical pulse description is unacceptable unless use of such pulses can be justified on thebasis of analysis.)
Downloaded from http://www.everyspec.com on 2012-06-04T5:34:26.
MIL-STD-810F1 January 2000
METHOD 516.5516.5-12
a. Measured data available. Te required for the test will be determined by examining representative timehistory measurements. Te will extend from the first significant response time history point to theanalytically derived Te or to the noise floor of the instrumentation system, whichever is shortest. SRS
required for the test will be determined from analytical computations. For Te < minf2
1, Te for test may
be extended to minf2
1. The SRS analysis will be performed on the AC coupled time history for Q = 10
at a sequence of natural frequencies spaced at 1/12 octave or less spacing to span at least 5 to 2,000 Hz.
(1) When a sufficient number of representative shock spectra are available, an appropriate statisticalenveloping technique should be employed to determine the required test spectrum with a statisticalbasis (see Annex A of this method). The Te for test should be taken as the maximum of the Te or
minf2
1, which ever is greater.
(2) When insufficient measured data are available for statistical analysis, an increase over the maximumof the available spectral data should be used to establish the required test spectrum. This shouldaccount for stochastic variability in the environment and uncertainty in any predictive methodsemployed. The degree of increase is based on engineering judgment and should be supported byrationale. In these cases, it is often convenient to envelope the SRS estimates and proceed to addeither a 3dB or 6dB margin to the SRS, depending on the degree of test level conservativenessdesired (see Annex A paragraph A3.2. of this method). The Te for test should be taken as the
maximum of the Te or minf2
1, which ever is greater.
b. Measured data not available. If a measured data base is not available, then for Procedure I - Functionalshock and Procedure V - Crash hazard, employ the applicable SRS spectrum from figure 516.5-8 as thetest spectrum for each axis, provided Te of the test shock time history falls between the values in theaccompanying table (516.5-I). This spectrum approximates that of the perfect terminal-peak sawtoothpulse. It is highly recommended that the test be performed with a waveform that is composed of either(1) a superposition of damped sinusoids with selected properties at a finite number of designatedfrequencies or (2) a superposition of amplitude modulated sine waves with selected properties at a finitenumber of designated frequencies, such that this waveform has an SRS that approximates the SRS onfigure 516.5-8 where the duration of this waveform is a maximum of Te provided in table 516.5-I. Inreality, any complex test transient is suitable if it equals or exceeds this spectrum requirement over thefrequency range of 5 to 2000 Hz, and meets the duration requirement. Use of the classical terminal-peaksawtooth pulse and the classical trapezoidal pulse is the least permissible test alternative in the case of nodata being available (see paragraph 2.3.2c). In cases in which there is a vibration requirement for themateriel in addition to a shock requirement it may be possible to perform the vibration test in lieu of theshock test in the tailoring procedure. An example of this form of tailoring is contained in Procedure I -Functional Shock. Figure 516.5-9 provides two ASD curves to be used for comparison with specifiedASD test environments to determine if random vibration is of sufficient severity to be used in lieu ofmeasured or specified shock levels. The SRS for stationary random environments developed from theseASD curves, envelopes the appropriate SRS spectra on figure 516.5-8. For some empirical justificationof this, see Annex C of this method.
c. Classical shock pulses. Unless the procedure requires the use of a classical shock pulse, the use of such apulse is not acceptable unless it can be demonstrated that measured data is within the tolerances of theclassical shock pulses. Only two classical shock pulses are defined for testing in the method – theterminal peak sawtooth pulse and the trapezoidal pulse. The terminal peak sawtooth pulse along with itsparameters and tolerances is provided on figure 516.5-10 and is an alternative for testing in Procedure I -Functional shock and Procedure V - Crash hazard.
Downloaded from http://www.everyspec.com on 2012-06-04T5:34:26.
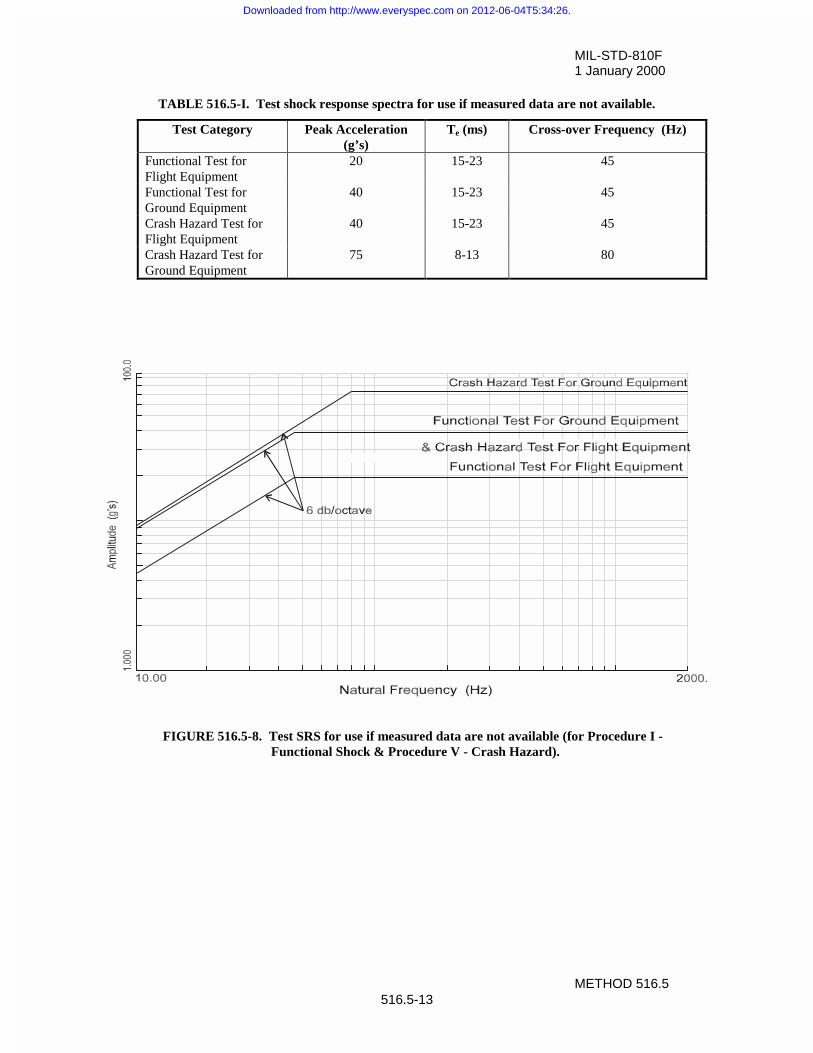
MIL-STD-810F1 January 2000
METHOD 516.5516.5-13
TABLE 516.5-I. Test shock response spectra for use if measured data are not available.
Test Category Peak Acceleration(g’s)
Te (ms) Cross-over Frequency (Hz)
Functional Test forFlight Equipment
20 15-23 45
Functional Test forGround Equipment
40 15-23 45
Crash Hazard Test forFlight Equipment
40 15-23 45
Crash Hazard Test forGround Equipment
75 8-13 80
FIGURE 516.5-8. Test SRS for use if measured data are not available (for Procedure I -Functional Shock & Procedure V - Crash Hazard).
Downloaded from http://www.everyspec.com on 2012-06-04T5:34:26.
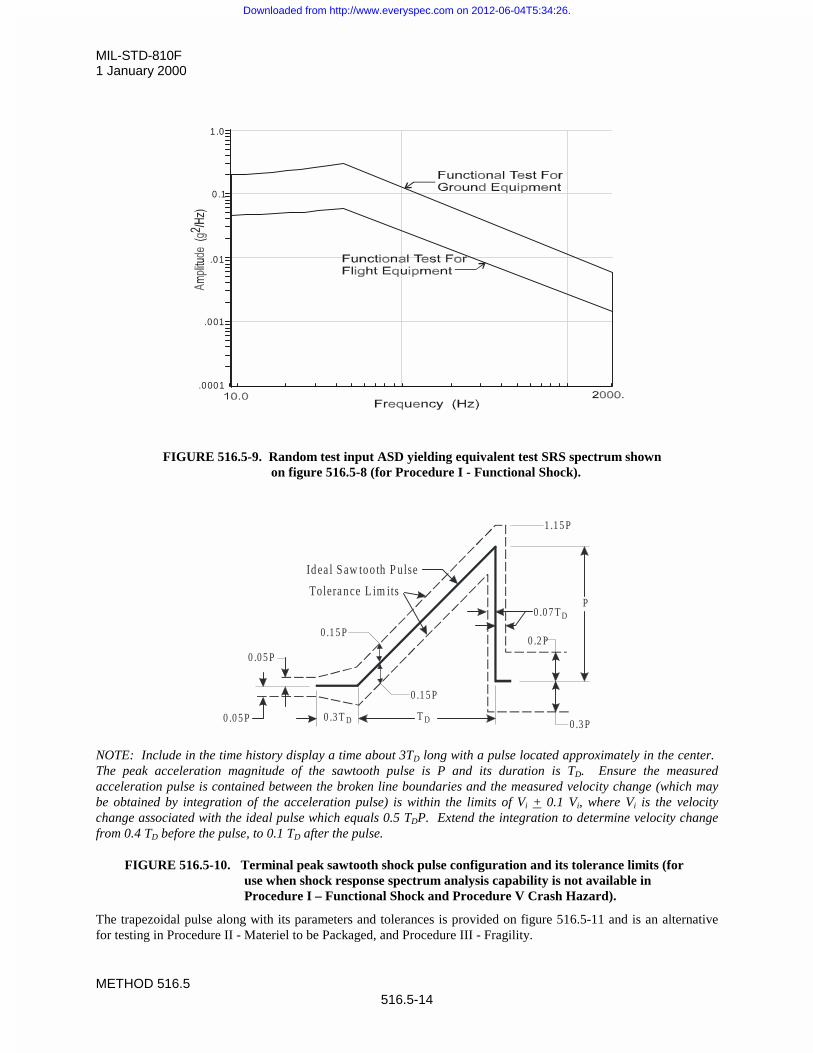
MIL-STD-810F1 January 2000
METHOD 516.5516.5-14
FIGURE 516.5-9. Random test input ASD yielding equivalent test SRS spectrum shownon figure 516.5-8 (for Procedure I - Functional Shock).
NOTE: Include in the time history display a time about 3TD long with a pulse located approximately in the center. The peak acceleration magnitude of the sawtooth pulse is P and its duration is TD. Ensure the measuredacceleration pulse is contained between the broken line boundaries and the measured velocity change (which maybe obtained by integration of the acceleration pulse) is within the limits of Vi + 0.1 Vi, where Vi is the velocitychange associated with the ideal pulse which equals 0.5 TDP. Extend the integration to determine velocity changefrom 0.4 TD before the pulse, to 0.1 TD after the pulse.
FIGURE 516.5-10. Terminal peak sawtooth shock pulse configuration and its tolerance limits (foruse when shock response spectrum analysis capability is not available inProcedure I – Functional Shock and Procedure V Crash Hazard).
The trapezoidal pulse along with its parameters and tolerances is provided on figure 516.5-11 and is an alternativefor testing in Procedure II - Materiel to be Packaged, and Procedure III - Fragility.
.0001
.001
.01
0 .1
1 .0
0 .1 5 P
0 .1 5 P
T D0 .3 T D 0 .3 P
0 .2 P
0 .0 7 T DP
1 .1 5 P
0 .0 5 P
0 .0 5 P
Id ea l S aw to o th P ulse
Toleran ce L im its
Downloaded from http://www.everyspec.com on 2012-06-04T5:34:26.
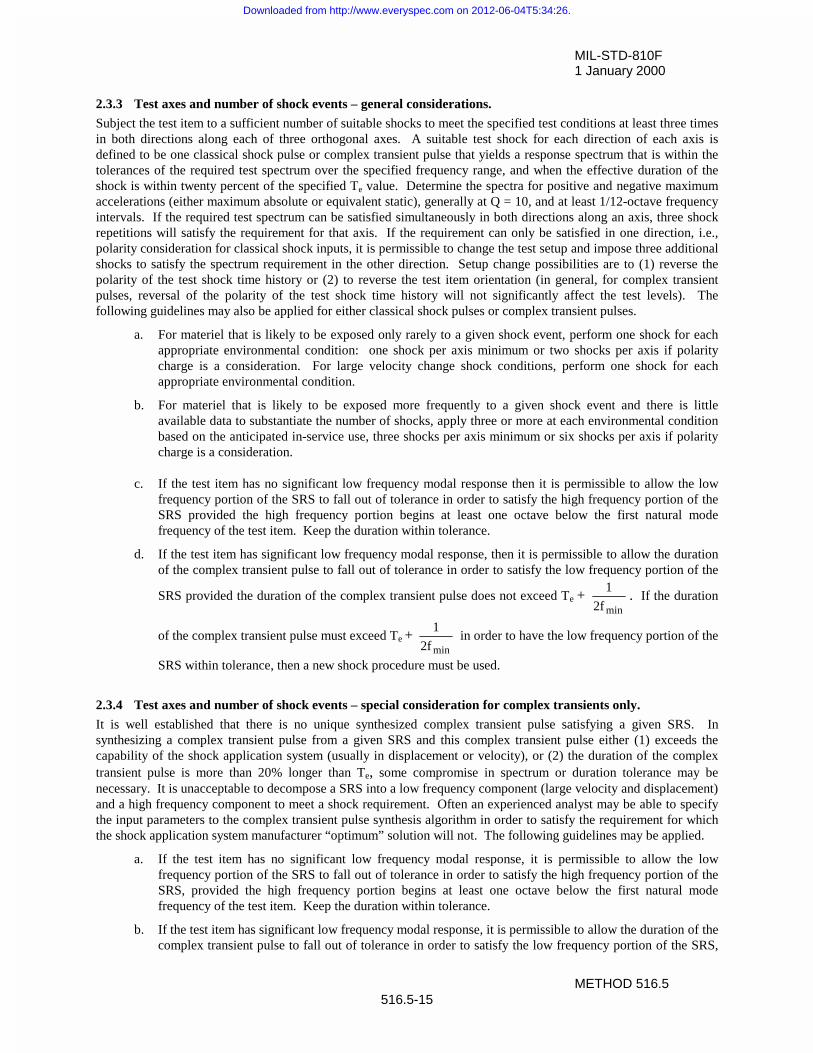
MIL-STD-810F1 January 2000
METHOD 516.5516.5-15
2.3.3 Test axes and number of shock events – general considerations.
Subject the test item to a sufficient number of suitable shocks to meet the specified test conditions at least three timesin both directions along each of three orthogonal axes. A suitable test shock for each direction of each axis isdefined to be one classical shock pulse or complex transient pulse that yields a response spectrum that is within thetolerances of the required test spectrum over the specified frequency range, and when the effective duration of theshock is within twenty percent of the specified Te value. Determine the spectra for positive and negative maximumaccelerations (either maximum absolute or equivalent static), generally at Q = 10, and at least 1/12-octave frequencyintervals. If the required test spectrum can be satisfied simultaneously in both directions along an axis, three shockrepetitions will satisfy the requirement for that axis. If the requirement can only be satisfied in one direction, i.e.,polarity consideration for classical shock inputs, it is permissible to change the test setup and impose three additionalshocks to satisfy the spectrum requirement in the other direction. Setup change possibilities are to (1) reverse thepolarity of the test shock time history or (2) to reverse the test item orientation (in general, for complex transientpulses, reversal of the polarity of the test shock time history will not significantly affect the test levels). Thefollowing guidelines may also be applied for either classical shock pulses or complex transient pulses.
a. For materiel that is likely to be exposed only rarely to a given shock event, perform one shock for eachappropriate environmental condition: one shock per axis minimum or two shocks per axis if polaritycharge is a consideration. For large velocity change shock conditions, perform one shock for eachappropriate environmental condition.
b. For materiel that is likely to be exposed more frequently to a given shock event and there is littleavailable data to substantiate the number of shocks, apply three or more at each environmental conditionbased on the anticipated in-service use, three shocks per axis minimum or six shocks per axis if polaritycharge is a consideration.
c. If the test item has no significant low frequency modal response then it is permissible to allow the lowfrequency portion of the SRS to fall out of tolerance in order to satisfy the high frequency portion of theSRS provided the high frequency portion begins at least one octave below the first natural modefrequency of the test item. Keep the duration within tolerance.
d. If the test item has significant low frequency modal response, then it is permissible to allow the durationof the complex transient pulse to fall out of tolerance in order to satisfy the low frequency portion of the
SRS provided the duration of the complex transient pulse does not exceed Te + minf2
1. If the duration
of the complex transient pulse must exceed Te + minf2
1 in order to have the low frequency portion of the
SRS within tolerance, then a new shock procedure must be used.
2.3.4 Test axes and number of shock events – special consideration for complex transients only.
It is well established that there is no unique synthesized complex transient pulse satisfying a given SRS. Insynthesizing a complex transient pulse from a given SRS and this complex transient pulse either (1) exceeds thecapability of the shock application system (usually in displacement or velocity), or (2) the duration of the complextransient pulse is more than 20% longer than Te, some compromise in spectrum or duration tolerance may benecessary. It is unacceptable to decompose a SRS into a low frequency component (large velocity and displacement)and a high frequency component to meet a shock requirement. Often an experienced analyst may be able to specifythe input parameters to the complex transient pulse synthesis algorithm in order to satisfy the requirement for whichthe shock application system manufacturer “optimum” solution will not. The following guidelines may be applied.
a. If the test item has no significant low frequency modal response, it is permissible to allow the lowfrequency portion of the SRS to fall out of tolerance in order to satisfy the high frequency portion of theSRS, provided the high frequency portion begins at least one octave below the first natural modefrequency of the test item. Keep the duration within tolerance.
b. If the test item has significant low frequency modal response, it is permissible to allow the duration of thecomplex transient pulse to fall out of tolerance in order to satisfy the low frequency portion of the SRS,
Downloaded from http://www.everyspec.com on 2012-06-04T5:34:26.
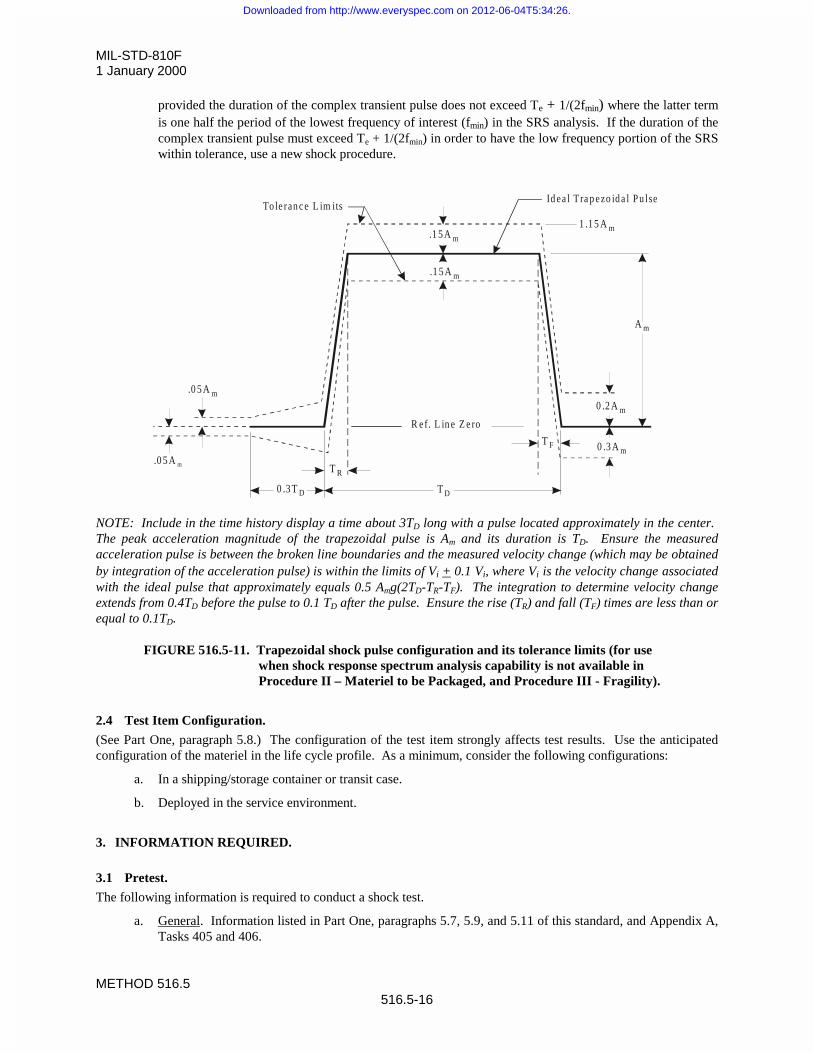
MIL-STD-810F1 January 2000
METHOD 516.5516.5-16
provided the duration of the complex transient pulse does not exceed Te + 1/(2fmin) where the latter termis one half the period of the lowest frequency of interest (fmin) in the SRS analysis. If the duration of thecomplex transient pulse must exceed Te + 1/(2fmin) in order to have the low frequency portion of the SRSwithin tolerance, use a new shock procedure.
NOTE: Include in the time history display a time about 3TD long with a pulse located approximately in the center. The peak acceleration magnitude of the trapezoidal pulse is Am and its duration is TD. Ensure the measuredacceleration pulse is between the broken line boundaries and the measured velocity change (which may be obtainedby integration of the acceleration pulse) is within the limits of Vi + 0.1 Vi, where Vi is the velocity change associatedwith the ideal pulse that approximately equals 0.5 Amg(2TD-TR-TF). The integration to determine velocity changeextends from 0.4TD before the pulse to 0.1 TD after the pulse. Ensure the rise (TR) and fall (TF) times are less than orequal to 0.1TD.
FIGURE 516.5-11. Trapezoidal shock pulse configuration and its tolerance limits (for usewhen shock response spectrum analysis capability is not available inProcedure II – Materiel to be Packaged, and Procedure III - Fragility).
2.4 Test Item Configuration.
(See Part One, paragraph 5.8.) The configuration of the test item strongly affects test results. Use the anticipatedconfiguration of the materiel in the life cycle profile. As a minimum, consider the following configurations:
a. In a shipping/storage container or transit case.
b. Deployed in the service environment.
3. INFORMATION REQUIRED.
3.1 Pretest.
The following information is required to conduct a shock test.
a. General. Information listed in Part One, paragraphs 5.7, 5.9, and 5.11 of this standard, and Appendix A,Tasks 405 and 406.
1 .1 5 A m.1 5 A m
.1 5 A m
A m
0 .2 A m
0 .3 A mT F
T R
T D0 .3 T D
.0 5 A m
.0 5 A m
R ef. L in e Z e ro
To le ran c e L im itsId ea l Tra p ezo id a l Pu lse
Downloaded from http://www.everyspec.com on 2012-06-04T5:34:26.
MIL-STD-810F1 January 2000
METHOD 516.5516.5-17
b. Specific to this method.
(1) Test fixture modal survey procedure.
(2) Test item/fixture modal survey procedure.
(3) Shock environment. Either:
(a) the predicted SRS or the complex shock pulse synthesis form (superposition of dampedsinusoids, amplitude modulated sine waves, or other) specifying spectrum shape, peak spectrumvalues, spectrum break points, and pulse duration, or
(b) the measured data selected for use in conjunction with the SRS synthesis technique outlined inthe procedures. (If the SRS synthesis technique is used, ensure both the spectral shape andsynthesized shock duration are as specified.), or
(c) the measured data that are input as a compensated waveform into a shaker/shock system underdirect waveform control.
(4) Techniques used in the processing of the input and the response data.
3.2 During Test.
Collect the following information during conduct of the test:
a. General. Information listed in Part One, paragraph 5.10 and in Part One, Appendix A, Tasks 405 and406 of this standard.
b. Specific to this Method. Information related to failure criteria for test materiel under acceleration for theselected procedure or procedures. Pay close attention to any test item instrumentation and the manner inwhich the information is received from the sensors. For large velocity shock, ensure instrumentationcabling does not add noise to measurements as a result of cable movement.
3.3 Post-test.
Record the following post-test information.
a. General. Information listed in Part One, paragraph. 5.13 of this standard, and in Part One, Appendix A,Tasks 405 and 406.
b. Specific to this method.
(1) Duration of each exposure and number of exposures.
(2) Status of the test item after each visual examination.
(3) Response time histories and the information processed from these time histories. In general, under-processed information, the absolute acceleration maximax SRS and the pseudo-velocity SRS shouldbe supplied as a function of single degree of freedom oscillator undamped natural frequency. Incertain cases, the ESD and FS may be supplied.
(4) Test item and/or fixture modal analysis data.
4. TEST PROCESS.
4.1 Test Facility.
Use a shock-producing apparatus capable of meeting the test conditions as determined according to the appropriateparagraphs of this method. The shock apparatus may be of the free fall, resilient rebound, nonresilient rebound,hydraulic, compressed gas, electrodynamic shaker, electrohydraulic shaker, rail car or other activating types capableof eliciting test item response over the time, amplitude and frequency ranges specified. For all types of shock-producing apparatus, careful attention needs to be paid to the time, amplitude, and frequency ranges over which theapparatus is capable of delivering a shock input. For example, an electrodynamic shaker can suitably reproduce
Downloaded from http://www.everyspec.com on 2012-06-04T5:34:26.
MIL-STD-810F1 January 2000
METHOD 516.5516.5-18
synthesized shock records from 5 Hz to 3000 Hz; however, an electrohydraulic shaker may have only a DC to 500Hz controllable frequency reproduction range. Procedures II and III require test apparatus capable of producingrelatively large displacement. Procedure VII is a special test setup utilizing rail cars and provides both moderatelyhigh response frequencies along with very low frequency response. Procedure VIII for catapult launch is bestsatisfied by application of two shock pulses with an intervening “transient vibration.”
4.2 Controls.
4.2.1 Calibration.
The shock apparatus will be user calibrated for conformance with the specified test requirement from the selectedprocedure where the response measurements will be made with traceable laboratory calibrated measurement devices.Conformance to test specifications will, in general, use a “calibration load” in the test setup. The calibration loadwill, in general, be a mass/stiffness simulant of the test item. “Mass/stiffness simulants” imply that the modaldynamic characteristics of the test item are replicated to the extent possible in the simulant – particularly those modaldynamic characteristics that may interact with the modal dynamic configuration of the fixturing and/or the testdevice. For calibration, produce two consecutive input applications to a calibration load which satisfy the testconditions outlined in Procedures I, II, III, V, VI, or VIII. Procedure IV is not a calibrated test and Procedure VIIhas a unique set of prescribed calibration procedures. After processing the measured response data from thecalibration load and verifying that it is in conformance with the test specification tolerances, remove the calibrationload and perform the shock test on the test item. Use of calibration loads for setup is highly recommended in allcases.
4.2.2 Tolerance.
For test validation, use the tolerances specified under each individual procedure, along with the guidelines providedbelow. In cases in which such tolerances cannot be met, establish achievable tolerances that are agreed to by thecognizant engineering authority and the customer prior to initiation of test. In any case, where tolerances areestablished independently of the guidance provided below, establish those tolerances that are within the limitationsof the specified measurement calibration, instrumentation, signal conditioning, and data analysis procedures.
4.2.2.1 Classical pulses and complex transient pulses-time domain.
For the classical pulses of the terminal-peak sawtooth pulse and the trapezoidal pulse tolerance limits on the timedomain representation of the pulses (both for amplitude and duration) are as specified on figure 516.5-10 and figure516.5-11, respectively. For complex transient pulses specified in the time domain the major peaks and valleys of themeasured pulses, (peaks and valleys within 75% of the maximum peak and valley specified, respectively) 90% of thepeak and valley levels are to be within r10% of the specified peaks and valleys, respectively. This tolerance limitassumes that the shock test machine is able to replicate the specified shock accurately under a waveform controlprocedure. Such time domain specification is useful for shock replication from measured data and for fragility testsperformed using a electrodynamic or electrohydraulic test machine. Inherent in the tolerance specification is theassumption that the measured peak and valley sequence is ordered as the specified peak and valley time history peakand valley sequence.
4.2.2.2 Complex transient pulses-SRS.
For complex transient pulses specified by way of the maximax SRS on figure 516.5-8 and for the other complextransient pulses specified from measured data generally the tolerances are specified in terms of amplitude over aspecified frequency bandwidth and a tolerance on the pulse duration. If prior measured data is available or a seriesof shocks are performed all acceleration maximax SRS computed with a one-twelfth octave frequency resolution areto be within –1.5 dB and +3dB over a minimum of 90% of the overall frequency bandwidth from 10 Hz to 2 kHz. For the remaining 10% part of the frequency band all SRS are to be within –3dB and +6dB. The duration of thecomplex transient is to be within r20% of the effective duration of the measured pulse, Te. In addition, the followingguidance is provided for use of (1) the pseudo-velocity response spectra and (2) multiple measurements to specify ashock environment. All tolerances are specified on the maximax acceleration SRS. Any tolerances specified on the
Downloaded from http://www.everyspec.com on 2012-06-04T5:34:26.
MIL-STD-810F1 January 2000
METHOD 516.5516.5-19
pseudo-velocity response spectra must be derived from the tolerances on the maximax acceleration SRS and beconsistent with those tolerances including tolerance on the duration of the pulse. The test tolerances are stated interms of single measurement tolerance. For an array of measurements defined in terms of a "zone" (reference g)amplitude tolerance may be specified in terms of an average of the measurements within a "zone." It should benoted, however, this is in effect a relaxation of the single measurement tolerance and that individual measurementsmay be substantially out of tolerance while the average is within tolerance. In general, when specifying testtolerances based on averaging for more than two measurements within a zone, the tolerance band should not exceedthe 95/50 one-sided normal tolerance upper limit computed for the logarithmically transformed SRS estimates nor beless than the mean minus 1.5dB. Any use of "zone" tolerances and averaging must have support documentationprepared by a trained analyst. Tolerance on the duration of the pulse shall apply to the input pulse duration to themeasurement array.
4.3 Instrumentation.
In general, acceleration will be the quantity measured to meet the specification. On occasion other devices may beemployed, e.g., linear displacement/voltage transducer, force gage, laser velocimeter, rate gyro, etc. In these casesgive special consideration to the instrument specification to satisfy the calibration, measurement, and analysisrequirements. Calibrate all measurement instrumentation to traceable national calibration standards (see Part One,paragraph 5.3.2). In addition, instrumentation to measure test item function may be required. In this case, obtainsuitable calibration standards and adhere to them.
a. Accelerometer.
(1) Transverse sensitivity of less than or equal to 5%.
(2) An amplitude linearity within 10% from 5% to 100% of the peak acceleration amplitude required fortesting.
(3) For Procedures I, II, III, IV, V, VI, and VIII, a flat frequency response within r10% across thefrequency range 2 Hz - 2000 kHz.
(4) For cases in which response below 2 Hz is desired, piezoresistive accelerometer measurement isrequired with a flat frequency response within r10% across the measurement specificationbandwidth.
(5) The measurement device and its mounting will be compatible with the requirements and guidelinesprovided in reference f.
b. Other measurement devices. Any other measurement devices used to collect data must be demonstratedto be consistent with the requirements of the test, in particular, the calibration and tolerance informationprovided in paragraph 4.2.
c. Signal conditioning. Use only signal conditioning that is compatible with the instrumentationrequirements on the test and is compatible with the requirements and guidelines provided in reference f. In particular, filtering of the analog voltage signals will be consistent with the time history responserequirements (in general, demonstrable linearity of phase throughout the frequency domain of response)and the filtering will be so configured that anomalous acceleration data caused by clipping will not bemisinterpreted as response data. In particular, use extreme care in filtering the acceleration signals at theamplifier output. The signal into the amplifier should never be filtered for fear of filtering badmeasurement data and the inability to detect the bad measurement data. The signal from the signalconditioning must be anti-alias filtered before digitizing.
4.4 Data Analysis.
a. An analog anti-alias filter configuration will be used that will:
(1) not alias more than a 5 percent measurement error into the frequency band of interest.
(2) have linear phase-shift characteristics in the data passband.
Downloaded from http://www.everyspec.com on 2012-06-04T5:34:26.
MIL-STD-810F1 January 2000
METHOD 516.5516.5-20
(3) have a pass band uniform to within one dB across the frequency band of interest (see paragraph 4.3).
b. In subsequent processing of the data, use any additional digital filtering that is compatible with the anti-alias analog filtering. In particular, additional digital filtering must maintain phase linearity forprocessing of shock time histories.
c. Analysis procedures will be in accordance with those requirements and guidelines provided in referencef. In particular, validate the shock acceleration amplitude time histories according to the procedures inreference f. Integrate each amplitude time history to detect any anomalies in the measurement system,e.g., cable breakage, amplifier slew rate exceedance, data clipped, unexplained accelerometer offset, etc.,before processing the response time histories. If anomalies are detected, discard the invalid measuredresponse time history data.
4.5 Test Execution.
4.5.1 Preparation for test.
4.5.1.1 Preliminary guidelines.
Prior to initiating any testing, review the pretest information in the test plan to determine test details (e.g., procedure,calibration load, test item configuration, measurement configuration, shock level, shock duration, number of shocksapplied). Note all details of the test validation procedures.
4.5.1.2 Pretest checkout.
After calibration of the excitation input device and prior to conducting the test, perform a pretest checkout of the testitem at standard ambient conditions to provide baseline data. Conduct the checkout as follows:
Step 1. Conduct a complete visual examination of the test item with special attention to stress areas orareas identified as being particularly susceptible to damage and document the results.
Step 2. Where applicable, install the test item in its test fixture.Step 3. Conduct a test item operational check in accordance with the approved test plan and document
the results for compliance with Part One, paragraph 5.15.Step 4. If the test item operates satisfactorily, proceed to the first test. If not, resolve the problem and
restart at Step 1.
4.5.1.3 Procedures overview.
Paragraphs 4.5.2 through 4.5.9 provide the basis for collecting the necessary information concerning the systemunder shock. For failure analysis purposes, in addition to the guidance provided in Part One, paragraph 5.14, eachprocedure contains information to assist in the evaluation of the test results. Analyze any failure of a test item tomeet the requirements of the system specifications, and consider related information such as follows in paragraphs4.5.2 through 4.5.9.
4.5.2 Procedure I - Functional Shock.
The intent of this test is to disclose equipment malfunction that may result from shocks experienced by materielduring use in the field. Even though materiel has successfully withstood even more severe shocks during shipping ortransit shock tests, there are differences in support and attachment methods and in functional checking requirementsthat make this test necessary. Tailoring of the test is required when data are available, can be measured, or can beestimated from related data using accepted dynamic scaling techniques. When measured field data are not availablefor tailoring, use the information on figure 516.5-8 and the accompanying table 516.5-I to define the shock testsystem input SRS. In the calibration procedure, the calibration load will be subject to a properly compensatedcomplex waveform in accordance with the SRS described above for electrodynamic or electrohydraulic shocktesting. In general, tests using classical pulses, e.g., half-sine, terminal peak saw tooth, etc., are unacceptable unlessit can be demonstrated during tailoring that the field shock environment approximates such a form. If all othertesting resources have been exhausted it will be permissible to use the information on figure 516.5-10 for the
Downloaded from http://www.everyspec.com on 2012-06-04T5:34:26.
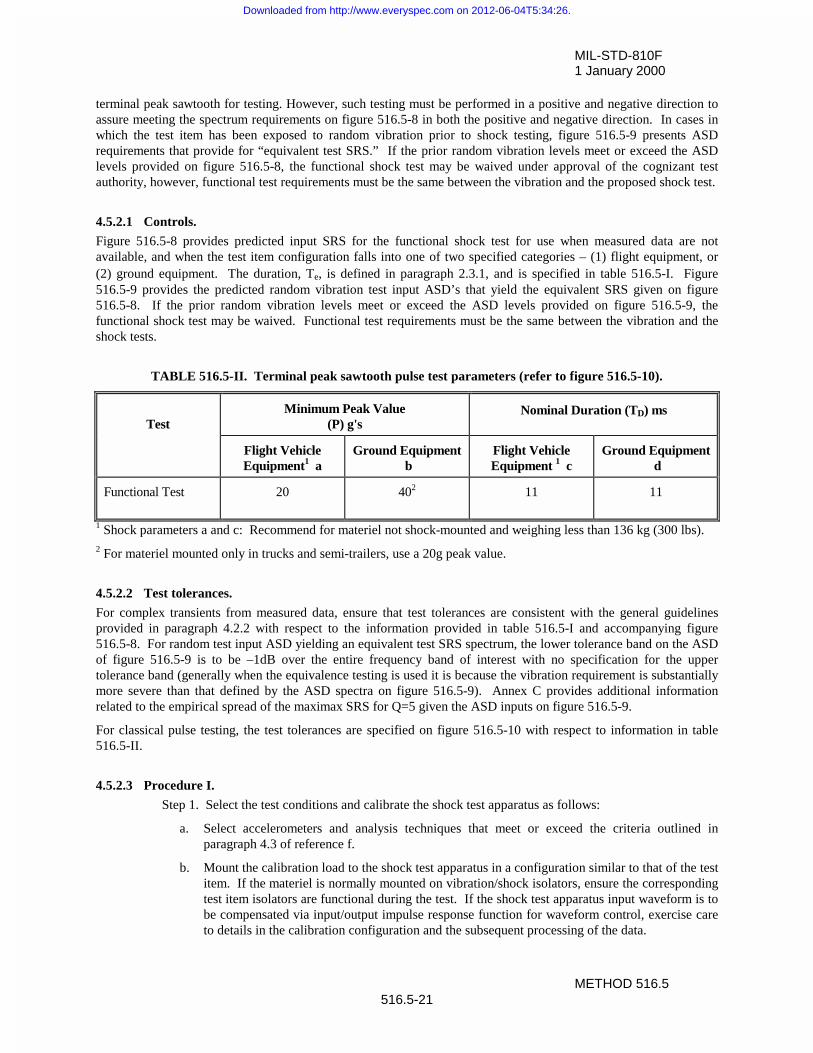
MIL-STD-810F1 January 2000
METHOD 516.5516.5-21
terminal peak sawtooth for testing. However, such testing must be performed in a positive and negative direction toassure meeting the spectrum requirements on figure 516.5-8 in both the positive and negative direction. In cases inwhich the test item has been exposed to random vibration prior to shock testing, figure 516.5-9 presents ASDrequirements that provide for “equivalent test SRS.” If the prior random vibration levels meet or exceed the ASDlevels provided on figure 516.5-8, the functional shock test may be waived under approval of the cognizant testauthority, however, functional test requirements must be the same between the vibration and the proposed shock test.
4.5.2.1 Controls.
Figure 516.5-8 provides predicted input SRS for the functional shock test for use when measured data are notavailable, and when the test item configuration falls into one of two specified categories – (1) flight equipment, or(2) ground equipment. The duration, Te, is defined in paragraph 2.3.1, and is specified in table 516.5-I. Figure516.5-9 provides the predicted random vibration test input ASD’s that yield the equivalent SRS given on figure516.5-8. If the prior random vibration levels meet or exceed the ASD levels provided on figure 516.5-9, thefunctional shock test may be waived. Functional test requirements must be the same between the vibration and theshock tests.
TABLE 516.5-II. Terminal peak sawtooth pulse test parameters (refer to figure 516.5-10).
TestMinimum Peak Value
(P) g'sNominal Duration (TD) ms
Flight VehicleEquipment1 a
Ground Equipment b
Flight VehicleEquipment 1 c
Ground Equipment d
Functional Test 20 402 11 11
1 Shock parameters a and c: Recommend for materiel not shock-mounted and weighing less than 136 kg (300 lbs).2 For materiel mounted only in trucks and semi-trailers, use a 20g peak value.
4.5.2.2 Test tolerances.
For complex transients from measured data, ensure that test tolerances are consistent with the general guidelinesprovided in paragraph 4.2.2 with respect to the information provided in table 516.5-I and accompanying figure516.5-8. For random test input ASD yielding an equivalent test SRS spectrum, the lower tolerance band on the ASDof figure 516.5-9 is to be –1dB over the entire frequency band of interest with no specification for the uppertolerance band (generally when the equivalence testing is used it is because the vibration requirement is substantiallymore severe than that defined by the ASD spectra on figure 516.5-9). Annex C provides additional informationrelated to the empirical spread of the maximax SRS for Q=5 given the ASD inputs on figure 516.5-9.
For classical pulse testing, the test tolerances are specified on figure 516.5-10 with respect to information in table516.5-II.
4.5.2.3 Procedure I.
Step 1. Select the test conditions and calibrate the shock test apparatus as follows:
a. Select accelerometers and analysis techniques that meet or exceed the criteria outlined inparagraph 4.3 of reference f.
b. Mount the calibration load to the shock test apparatus in a configuration similar to that of the testitem. If the materiel is normally mounted on vibration/shock isolators, ensure the correspondingtest item isolators are functional during the test. If the shock test apparatus input waveform is tobe compensated via input/output impulse response function for waveform control, exercise careto details in the calibration configuration and the subsequent processing of the data.
Downloaded from http://www.everyspec.com on 2012-06-04T5:34:26.
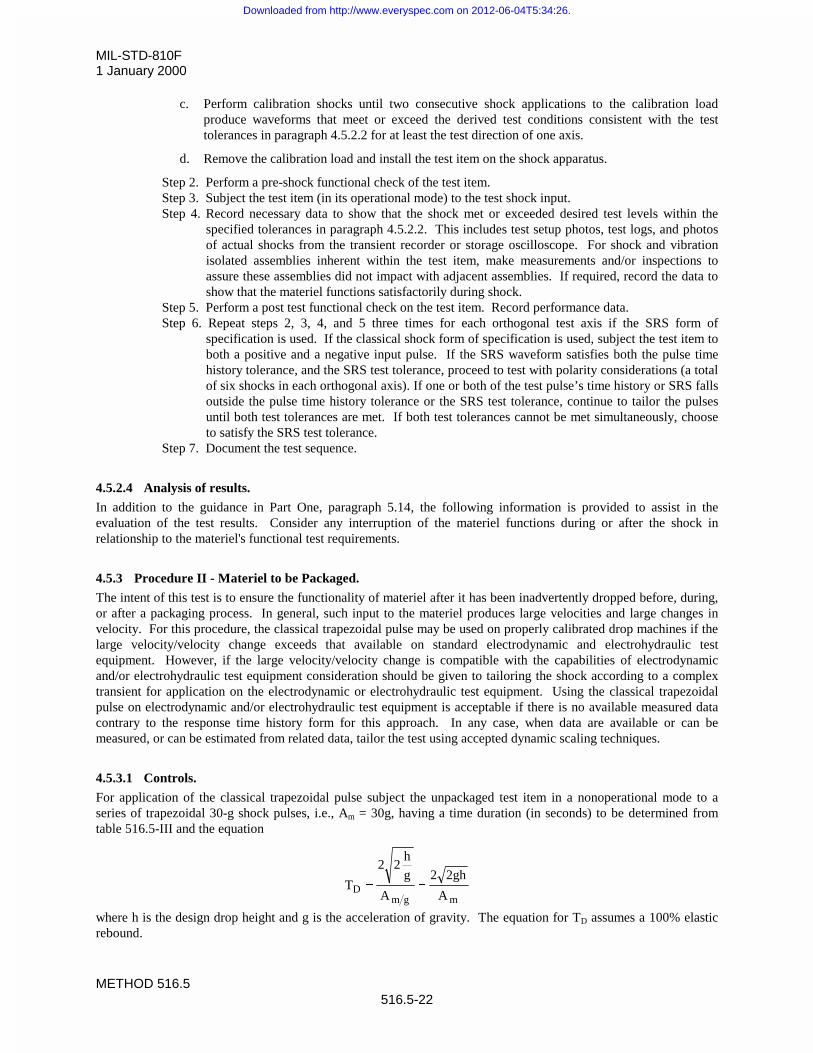
MIL-STD-810F1 January 2000
METHOD 516.5516.5-22
c. Perform calibration shocks until two consecutive shock applications to the calibration loadproduce waveforms that meet or exceed the derived test conditions consistent with the testtolerances in paragraph 4.5.2.2 for at least the test direction of one axis.
d. Remove the calibration load and install the test item on the shock apparatus.
Step 2. Perform a pre-shock functional check of the test item.Step 3. Subject the test item (in its operational mode) to the test shock input.Step 4. Record necessary data to show that the shock met or exceeded desired test levels within the
specified tolerances in paragraph 4.5.2.2. This includes test setup photos, test logs, and photosof actual shocks from the transient recorder or storage oscilloscope. For shock and vibrationisolated assemblies inherent within the test item, make measurements and/or inspections toassure these assemblies did not impact with adjacent assemblies. If required, record the data toshow that the materiel functions satisfactorily during shock.
Step 5. Perform a post test functional check on the test item. Record performance data.Step 6. Repeat steps 2, 3, 4, and 5 three times for each orthogonal test axis if the SRS form of
specification is used. If the classical shock form of specification is used, subject the test item toboth a positive and a negative input pulse. If the SRS waveform satisfies both the pulse timehistory tolerance, and the SRS test tolerance, proceed to test with polarity considerations (a totalof six shocks in each orthogonal axis). If one or both of the test pulse’s time history or SRS fallsoutside the pulse time history tolerance or the SRS test tolerance, continue to tailor the pulsesuntil both test tolerances are met. If both test tolerances cannot be met simultaneously, chooseto satisfy the SRS test tolerance.
Step 7. Document the test sequence.
4.5.2.4 Analysis of results.
In addition to the guidance in Part One, paragraph 5.14, the following information is provided to assist in theevaluation of the test results. Consider any interruption of the materiel functions during or after the shock inrelationship to the materiel's functional test requirements.
4.5.3 Procedure II - Materiel to be Packaged.
The intent of this test is to ensure the functionality of materiel after it has been inadvertently dropped before, during,or after a packaging process. In general, such input to the materiel produces large velocities and large changes invelocity. For this procedure, the classical trapezoidal pulse may be used on properly calibrated drop machines if thelarge velocity/velocity change exceeds that available on standard electrodynamic and electrohydraulic testequipment. However, if the large velocity/velocity change is compatible with the capabilities of electrodynamicand/or electrohydraulic test equipment consideration should be given to tailoring the shock according to a complextransient for application on the electrodynamic or electrohydraulic test equipment. Using the classical trapezoidalpulse on electrodynamic and/or electrohydraulic test equipment is acceptable if there is no available measured datacontrary to the response time history form for this approach. In any case, when data are available or can bemeasured, or can be estimated from related data, tailor the test using accepted dynamic scaling techniques.
4.5.3.1 Controls.
For application of the classical trapezoidal pulse subject the unpackaged test item in a nonoperational mode to aseries of trapezoidal 30-g shock pulses, i.e., Am = 30g, having a time duration (in seconds) to be determined fromtable 516.5-III and the equation
mgmD A
gh22
A
g
h22
T
where h is the design drop height and g is the acceleration of gravity. The equation for TD assumes a 100% elasticrebound.
Downloaded from http://www.everyspec.com on 2012-06-04T5:34:26.
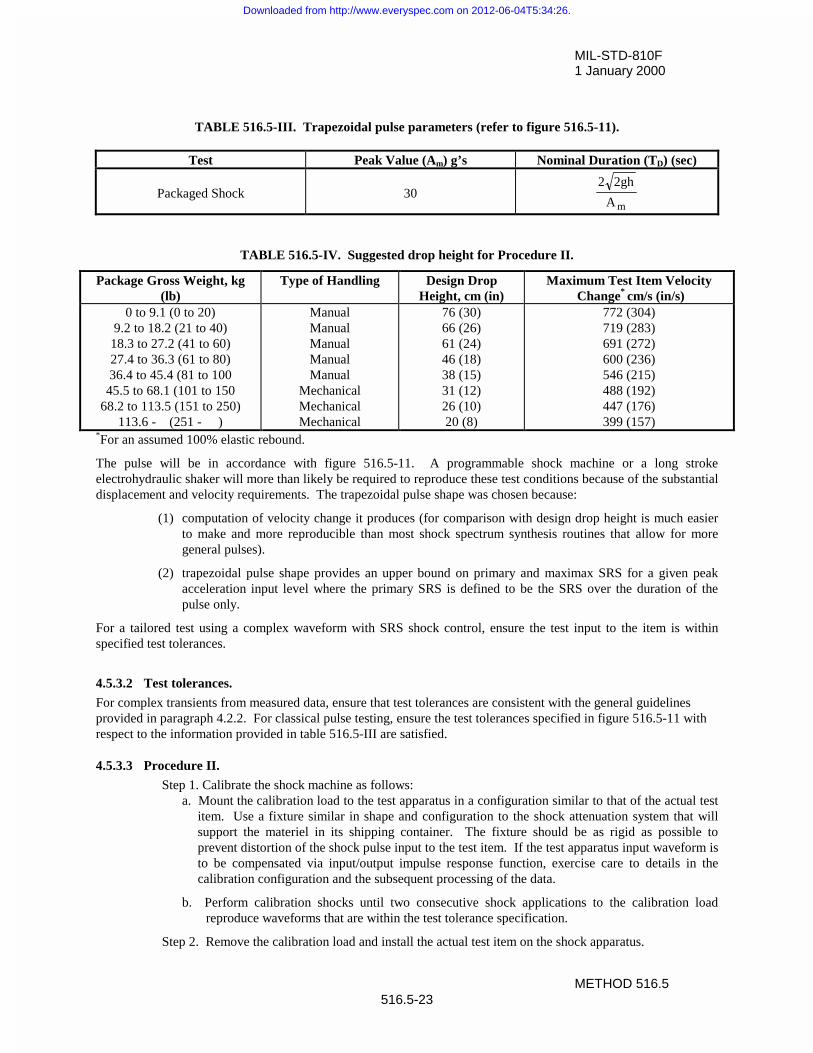
MIL-STD-810F1 January 2000
METHOD 516.5516.5-23
TABLE 516.5-III. Trapezoidal pulse parameters (refer to figure 516.5-11).
Test Peak Value (Am) g’s Nominal Duration (TD) (sec)
Packaged Shock 30mA
gh22
TABLE 516.5-IV. Suggested drop height for Procedure II.
Package Gross Weight, kg(lb)
Type of Handling Design DropHeight, cm (in)
Maximum Test Item Velocity Change*
cm/s (in/s)0 to 9.1 (0 to 20)
9.2 to 18.2 (21 to 40)18.3 to 27.2 (41 to 60)27.4 to 36.3 (61 to 80)36.4 to 45.4 (81 to 100
45.5 to 68.1 (101 to 15068.2 to 113.5 (151 to 250)
113.6 - (251 - )
ManualManualManualManualManual
MechanicalMechanicalMechanical
76 (30)66 (26)61 (24)46 (18)38 (15)31 (12)26 (10)20 (8)
772 (304)719 (283)691 (272)600 (236)546 (215)488 (192)447 (176)399 (157)
*For an assumed 100% elastic rebound.
The pulse will be in accordance with figure 516.5-11. A programmable shock machine or a long strokeelectrohydraulic shaker will more than likely be required to reproduce these test conditions because of the substantialdisplacement and velocity requirements. The trapezoidal pulse shape was chosen because:
(1) computation of velocity change it produces (for comparison with design drop height is much easierto make and more reproducible than most shock spectrum synthesis routines that allow for moregeneral pulses).
(2) trapezoidal pulse shape provides an upper bound on primary and maximax SRS for a given peakacceleration input level where the primary SRS is defined to be the SRS over the duration of thepulse only.
For a tailored test using a complex waveform with SRS shock control, ensure the test input to the item is withinspecified test tolerances.
4.5.3.2 Test tolerances.
For complex transients from measured data, ensure that test tolerances are consistent with the general guidelinesprovided in paragraph 4.2.2. For classical pulse testing, ensure the test tolerances specified in figure 516.5-11 withrespect to the information provided in table 516.5-III are satisfied.
4.5.3.3 Procedure II.
Step 1. Calibrate the shock machine as follows:a. Mount the calibration load to the test apparatus in a configuration similar to that of the actual test
item. Use a fixture similar in shape and configuration to the shock attenuation system that willsupport the materiel in its shipping container. The fixture should be as rigid as possible toprevent distortion of the shock pulse input to the test item. If the test apparatus input waveform isto be compensated via input/output impulse response function, exercise care to details in thecalibration configuration and the subsequent processing of the data.
b. Perform calibration shocks until two consecutive shock applications to the calibration loadreproduce waveforms that are within the test tolerance specification.
Step 2. Remove the calibration load and install the actual test item on the shock apparatus.
Downloaded from http://www.everyspec.com on 2012-06-04T5:34:26.
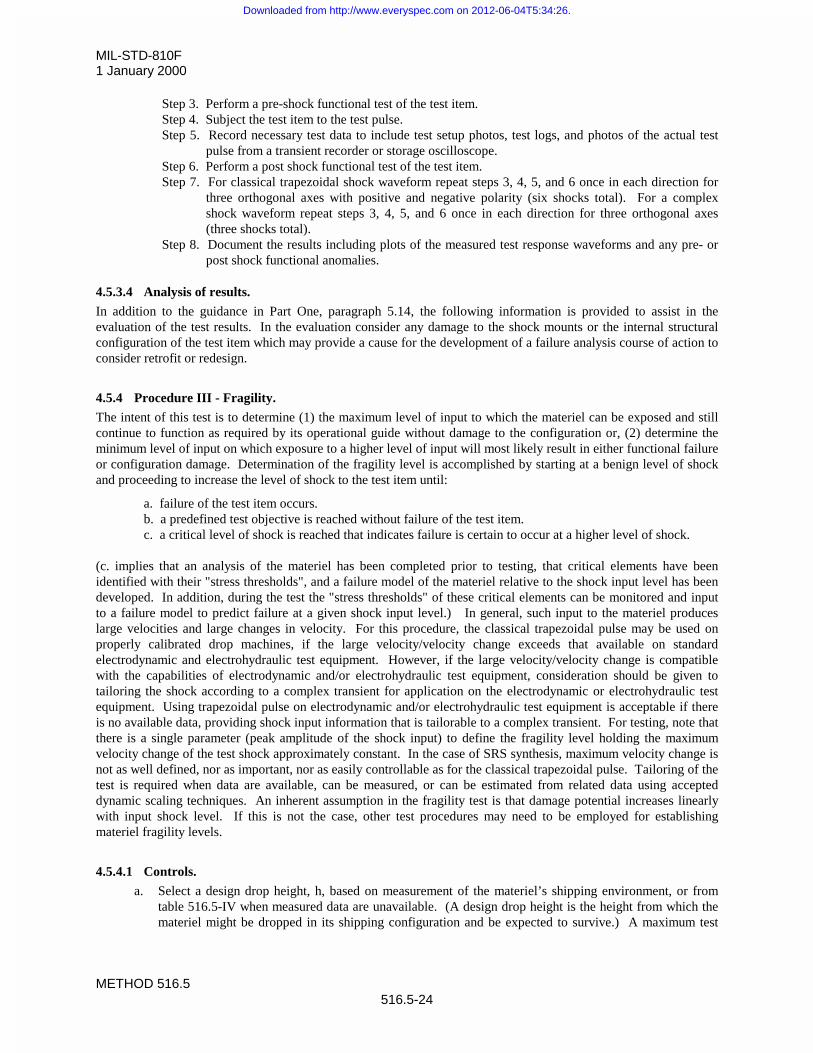
MIL-STD-810F1 January 2000
METHOD 516.5516.5-24
Step 3. Perform a pre-shock functional test of the test item.Step 4. Subject the test item to the test pulse.Step 5. Record necessary test data to include test setup photos, test logs, and photos of the actual test
pulse from a transient recorder or storage oscilloscope.Step 6. Perform a post shock functional test of the test item.Step 7. For classical trapezoidal shock waveform repeat steps 3, 4, 5, and 6 once in each direction for
three orthogonal axes with positive and negative polarity (six shocks total). For a complexshock waveform repeat steps 3, 4, 5, and 6 once in each direction for three orthogonal axes(three shocks total).
Step 8. Document the results including plots of the measured test response waveforms and any pre- orpost shock functional anomalies.
4.5.3.4 Analysis of results.
In addition to the guidance in Part One, paragraph 5.14, the following information is provided to assist in theevaluation of the test results. In the evaluation consider any damage to the shock mounts or the internal structuralconfiguration of the test item which may provide a cause for the development of a failure analysis course of action toconsider retrofit or redesign.
4.5.4 Procedure III - Fragility.
The intent of this test is to determine (1) the maximum level of input to which the materiel can be exposed and stillcontinue to function as required by its operational guide without damage to the configuration or, (2) determine theminimum level of input on which exposure to a higher level of input will most likely result in either functional failureor configuration damage. Determination of the fragility level is accomplished by starting at a benign level of shockand proceeding to increase the level of shock to the test item until:
a. failure of the test item occurs. b. a predefined test objective is reached without failure of the test item. c. a critical level of shock is reached that indicates failure is certain to occur at a higher level of shock.
(c. implies that an analysis of the materiel has been completed prior to testing, that critical elements have beenidentified with their "stress thresholds", and a failure model of the materiel relative to the shock input level has beendeveloped. In addition, during the test the "stress thresholds" of these critical elements can be monitored and inputto a failure model to predict failure at a given shock input level.) In general, such input to the materiel produceslarge velocities and large changes in velocity. For this procedure, the classical trapezoidal pulse may be used onproperly calibrated drop machines, if the large velocity/velocity change exceeds that available on standardelectrodynamic and electrohydraulic test equipment. However, if the large velocity/velocity change is compatiblewith the capabilities of electrodynamic and/or electrohydraulic test equipment, consideration should be given totailoring the shock according to a complex transient for application on the electrodynamic or electrohydraulic testequipment. Using trapezoidal pulse on electrodynamic and/or electrohydraulic test equipment is acceptable if thereis no available data, providing shock input information that is tailorable to a complex transient. For testing, note thatthere is a single parameter (peak amplitude of the shock input) to define the fragility level holding the maximumvelocity change of the test shock approximately constant. In the case of SRS synthesis, maximum velocity change isnot as well defined, nor as important, nor as easily controllable as for the classical trapezoidal pulse. Tailoring of thetest is required when data are available, can be measured, or can be estimated from related data using accepteddynamic scaling techniques. An inherent assumption in the fragility test is that damage potential increases linearlywith input shock level. If this is not the case, other test procedures may need to be employed for establishingmateriel fragility levels.
4.5.4.1 Controls.
a. Select a design drop height, h, based on measurement of the materiel’s shipping environment, or fromtable 516.5-IV when measured data are unavailable. (A design drop height is the height from which themateriel might be dropped in its shipping configuration and be expected to survive.) A maximum test
Downloaded from http://www.everyspec.com on 2012-06-04T5:34:26.
MIL-STD-810F1 January 2000
METHOD 516.5516.5-25
item velocity change may be taken from table 516.5-IV or determined by using the followingrelationship:
gh22V '
where'V = maximum product velocity change cm/s (in/s) (summation of impact velocity and rebound velocity)h = design drop height cm (in)g = 980.6 cm/s2 (386 in/s2)
The maximum test velocity change assumes 100% rebound. Programming materials, other thanpneumatic springs, may have less than 100% rebound, so the maximum test velocity needs to bedecreased accordingly. If the maximum test velocity specified is used for drop table shock machineprogramming materials other than pneumatic springs, the test is conservative (an overtest), and themaximum test item velocity is a bounding requirement.
b. Set the shock machine to a maximum acceleration level (Am) well below the anticipated fragility level(see table 516.5-V). Determine the appropriate pulse duration from the design drop height, h, and theexpression for TD in paragraph 4.5.3.1. If an initial value for Am does not exist, use 15g's. If no damageoccurs, increase Am incrementally while holding the maximum test item velocity change constant (i.e.,decrease the pulse duration) until damage to the test item occurs. This will establish the materiel’scritical acceleration fragility level.
c. Test levels used in this procedure represent the correlation of the best information currently availablefrom research and experience. If more applicable test level data become available, they should be used(reference c). In particular, if data are collected on a materiel drop and the SRS of the environmentcomputed, a scaled version of the SRS could be used to establish the acceleration fragility level withrespect to a measured environment on electrodynamic or electrohydraulic test equipment, provided thedisplacement and velocity limitations of the test equipment are not exceeded, and the maximum test itemvelocity change can be held approximately constant. In addition to the maximax acceleration responsespectra, compute the pseudovelocity response spectra.
4.5.4.2 Test tolerances.
It is assumed that the instrumentation noise in the measurements is low so that tolerances may be established. Forcomplex transients from measured data, ensure that test tolerances are consistent with the general guidelinesprovided in paragraph 4.2.2. For classical pulse testing, ensure the test tolerances specified on figure 516.5-11 withrespect to the information provided in table 516.5-V are satisfied.
TABLE 516.5-V. Trapezoidal pulse test parameters (refer to figure 516.5-11).
Test Peak Value (Am) g’s Nominal Duration (TD) (sec)
Fragility 10 to 50mA
gh22
4.5.4.3 Procedure III.
This test is designed to build up in severity until a test item failure occurs or a predetermined goal is reached. It maybe necessary to switch axes between each shock event unless critical axes are determined prior to test. In general, allaxes of importance will be tested at the same level before moving to another level. The order of test activity and thecalibration requirements for each test setup should be clearly established in the test plan. It is also desirable topreselect the steps in severity based on knowledge of the materiel item or the test environment and document this inthe test plan. It is important to note that unless critical stress thresholds are analytically predicted andinstrumentation used to track stress threshold buildup, there is no rational way to estimate the potential for stressthreshold exceedance at the next shock input level. The following procedures, one for a classical pulse and the other
Downloaded from http://www.everyspec.com on 2012-06-04T5:34:26.
MIL-STD-810F1 January 2000
METHOD 516.5516.5-26
for a complex transient, are written as if the test will be conducted in one axis alone. In cases where more test axesare required the procedure should be modified accordingly.
a. Classical Pulse. This part of the procedures assumes that the classical pulse approach is being used toestablish the fragility level by increasing the drop height of the test item thereby increasing the 'Vdirectly. The fragility level is given in terms of the measurement variable – peak acceleration of theclassical pulse.
Step 1. Mount the calibration load to the test apparatus in a configuration similar to that of the actual testitem. Use a fixture similar in configuration to the interface of the shock attenuation system (if any)that will support the materiel. The fixture should be as rigid as possible to prevent distortion of theshock pulse input to the test item.
Step 2. Perform calibration shocks until two consecutive shock applications to the calibration load reproducethe waveforms that are within the specified test tolerances. If response to the calibration shock isnonlinear with respect to shock input level, then other test procedures may need to be applied toestablish materiel fragility levels depending upon the extent of the nonlinearity prior to reaching the"stress threshold".
Step 3. Select a drop height low enough to assure that no damage will occur. For drop heights other thanthose in table 516.5-IV the maximum velocity change can be taken to be
gh22V '
Where'V = maximum test item velocity change, cm/s (in/s) (assumes full resilient rebound of test item)h = drop height, cm (in)g = acceleration of gravity 981 cm/s2 (386 in/s2)
Step 4. Mount the test item in the fixture. Inspect and functionally test the item to document the pre-testcondition.
Step 5. Perform the shock test at the selected level and examine the recorded data to assure the test is withintolerance.
Step 6. Visually examine and functionally test the materiel to determine if damage has occurred. If damageis found or pre-established goals have been reached, go to Step 10.
Step 7. If it is required to determine the fragility of the test item in more than one axis then proceed to testthe item in the other axes (before changing the drop height).
Step 8. If the test item integrity is preserved, select the next drop height.Step 9. Repeat steps 5 through 8 until the test objectives have been met.Step 10. Document the results correlating the drop height with the measurement variable selected to define
the fragility level. If the test item is damaged in one axis during test then replace the test item withan identically configured test item and proceed in testing starting at Step 4.
b. Synthesized Pulse. This part of the procedure assumes that the fragility level is some function of thepeak acceleration level determined from a maximax acceleration SRS of a complex transient. For acomplex transient specified in the time domain this procedure could use the peak acceleration of the timehistory to define the fragility level.
Step 1. Mount the calibration load to the test apparatus in a configuration similar to that of the actual testitem. Use a fixture similar in configuration to the interface of the shock attenuation system (if any)that will support the materiel. The fixture should be as rigid as possible to prevent distortion of theshock pulse input to the test item.
Step 2. Perform calibration shocks until two consecutive shock applications to the calibration load reproducemaximax acceleration SRS that are within the specified test tolerances. If response to the calibrationshock is nonlinear with respect to shock input level then other test procedures may need to beapplied to establish materiel fragility levels depending upon the extent of the nonlinearity prior toreaching the "stress threshold".
Step 3. Select a peak maximax acceleration SRS level low enough to assure that no damage will occur.
Downloaded from http://www.everyspec.com on 2012-06-04T5:34:26.
MIL-STD-810F1 January 2000
METHOD 516.5516.5-27
Step 4. Mount the test item in the fixture. Inspect and functionally test the item to document the pre-testcondition.
Step 5. Perform the shock test at the selected level and examine the recorded data to assure the test maximaxacceleration SRS is within tolerance.
Step 6. Visually examine and functionally test the materiel to determine if damage has occurred. If damageis found or pre-established goals have been reached, go to Step 10.
Step 7. If it is required to determine the fragility of the test item in more than one axis then proceed to testthe item in the other axes (before changing the peak maximax acceleration SRS level).
Step 8. If the test item integrity is preserved, select the next predetermined peak maximax acceleration SRSlevel.
Step 9. Repeat steps 5 through 8 until the test objectives have been met.Step 10. Document the results recording the peak maximax acceleration SRS to define the fragility level. If
the test item is damaged in one axis during test, then replace the test item with an identicallyconfigured test item and proceed in testing starting at Step 4.
4.5.4.4 Analysis of results.
Refer to the guidance in Part One, paragraph 5.14, to assist in the evaluation of the test results. The outcome of asuccessful fragility test is one specified measurement level of test item failure to each test axis. Consider that if thetest item fails either functionally or structurally at the lowest level of testing and there is no provision for testing atlower levels, then the test item's fragility level is indeterminate.
4.5.5 Procedure IV - Transit Drop.
The intent of this test is to determine the structural and functional integrity of the materiel to a transit drop in itstransit or combination case. Perform all tests with a quick release hook or drop tester. In general, there is noinstrumentation calibration for the test and measurement information is minimized, however, if measurements aremade, the maximax acceleration SRS and the pseudovelocity SRS will define the results of the test, along with themeasurement amplitude time history.
4.5.5.1 Controls.
Test levels for this test are shown in table 516.5-VI. Test the item in the same configuration that is used in atransportation, handling or a combat situation. For test items under 45kg (100 pounds), the 26-drop requirement(table 516.5-VI) may be divided among up to five samples of the same test item in any combination. Toppling of theitem following impact will occur in the field and, therefore, toppling of the test item following its initial impactshould not be restrained as long as the test item does not leave the required drop surface. Levels for this test were setby considering how materiel in the field might commonly be dropped. (For example, a light item might be carried byone man, chest high; thus it could drop 122 cm (48 inches).) Field data have shown that a typical piece of man-portable materiel will be dropped from heights up to 122 cm an average of four to six times during its life cycle. The26-drop requirement exists to ensure each vulnerable position (faces, edges, and corners) of a typical test itemreceives an impact.
4.5.5.2 Test tolerances.
Ensure the test height of drop is within 2.5% of the height of drop as specified in table 516.5-VI.
4.5.5.3 Procedure IV.
Step 1. After performing a visual inspection and operational check for baseline data, install the test item in itstransit or combination case as prepared for field use (if measurement information is to beobtained,install and calibrate such instrumentation in this step.)
Step 2. From paragraph 4.5.5.1 and table 516.5-VI, determine the height of the drops to be performed, thenumber of drops per test item, and the drop surface.
Downloaded from http://www.everyspec.com on 2012-06-04T5:34:26.
MIL-STD-810F1 January 2000
METHOD 516.5516.5-28
Step 3. Perform the required drops using the apparatus and requirements of paragraph 4.5.5.1 and table516.5-VI notes. Recommend visually and/or operationally checking the test item periodically duringthe drop test to simplify any follow-on failure evaluation that may be required.
Step 4. Document the impact point or surface for each drop and any obvious damage.Step 5. Following completion of the required drops, visually examine the test item(s).Step 6. Document the results.Step 7. Conduct an operational checkout in accordance with the approved test plan.Step 8. Document the results for comparison with data obtained in Step 1, above (if measurement information
was obtained during the drop examine the time history traces and process them in this step accordingto procedures outlined in the test plan).
4.5.5.4 Analysis of results.
Refer to the guidance in Part One, paragraph 5.14, to assist in the evaluation of the test results. In general, analysisof results will consist of visual and operational comparisons for before test and after test. Measurementinstrumentation and subsequent processing of acceleration time history information can provide valuable informationrelated to response characteristics of the test item and statistical variation in the shock environment.
4.5.6 Procedure V - Crash Hazard.
The intent of this procedure is to disclose structural failures of materiel or mounts for materiel in air or groundvehicles that may present a hazard to personnel or other materiel if the materiel breaks loose from its mount duringor after a vehicle crash. The test in this procedure is intended to verify that materiel mounting and/or restrainingdevices will not fail, and that sub-elements are not ejected during crash situations. Attach the test item to its shockfixture by its in-service mounting or tiedowns.
4.5.6.1 Controls.
Use figure 516.5-8 as the test spectrum for the axis of test with the effective shock duration, Te, between 15 and 23milliseconds for flight materiel, and between 8 and 13 milliseconds for ground materiel. If shock spectrum analysiscapabilities are not available, the classical terminal peak sawtooth pulse on figure 516.5-10 may be used as analternative to a complex transient waveform developed from the SRS on figure 516.5-8. Table 516.5-VII providesthe parameters for the terminal peak sawtooth pulse. An aircraft crash level of 40 g's is based on the assumption that,during a survivable crash, localized g levels can approach 40 g's. Ground transportation vehicles are designed with ahigher safety factor and, therefore, must sustain a much higher g level with correspondingly higher specified testlevels.
Downloaded from http://www.everyspec.com on 2012-06-04T5:34:26.
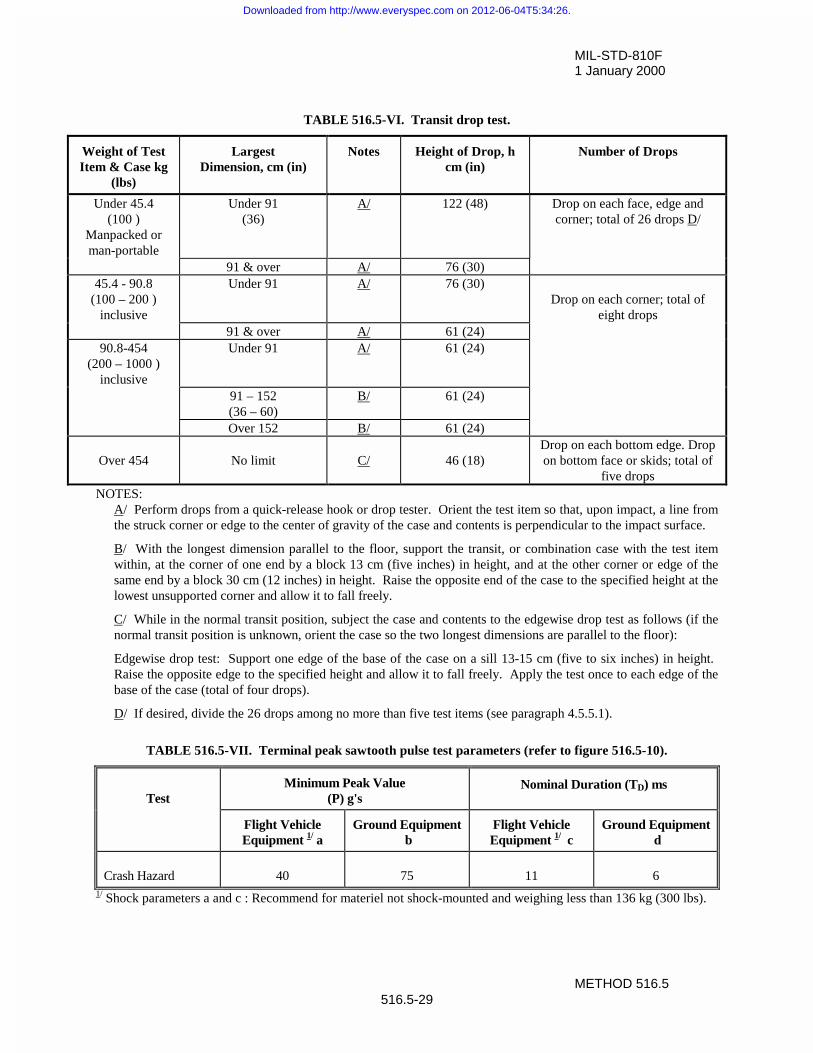
MIL-STD-810F1 January 2000
METHOD 516.5516.5-29
TABLE 516.5-VI. Transit drop test.
Weight of TestItem & Case kg
(lbs)
LargestDimension, cm (in)
Notes Height of Drop, hcm (in)
Number of Drops
Under 45.4(100 )
Manpacked orman-portable
Under 91(36)
A/ 122 (48) Drop on each face, edge andcorner; total of 26 drops D/
91 & over A/ 76 (30)45.4 - 90.8
(100 – 200 )inclusive
Under 91 A/ 76 (30)Drop on each corner; total of
eight drops91 & over A/ 61 (24)
90.8-454(200 – 1000 )
inclusive
Under 91 A/ 61 (24)
91 – 152(36 – 60)
B/ 61 (24)
Over 152 B/ 61 (24)
Over 454 No limit C/ 46 (18)Drop on each bottom edge. Dropon bottom face or skids; total of
five dropsNOTES:
A/ Perform drops from a quick-release hook or drop tester. Orient the test item so that, upon impact, a line fromthe struck corner or edge to the center of gravity of the case and contents is perpendicular to the impact surface.
B/ With the longest dimension parallel to the floor, support the transit, or combination case with the test itemwithin, at the corner of one end by a block 13 cm (five inches) in height, and at the other corner or edge of thesame end by a block 30 cm (12 inches) in height. Raise the opposite end of the case to the specified height at thelowest unsupported corner and allow it to fall freely.
C/ While in the normal transit position, subject the case and contents to the edgewise drop test as follows (if thenormal transit position is unknown, orient the case so the two longest dimensions are parallel to the floor):
Edgewise drop test: Support one edge of the base of the case on a sill 13-15 cm (five to six inches) in height. Raise the opposite edge to the specified height and allow it to fall freely. Apply the test once to each edge of thebase of the case (total of four drops).
D/ If desired, divide the 26 drops among no more than five test items (see paragraph 4.5.5.1).
TABLE 516.5-VII. Terminal peak sawtooth pulse test parameters (refer to figure 516.5-10).
TestMinimum Peak Value
(P) g'sNominal Duration (TD) ms
Flight VehicleEquipment 1/ a
Ground Equipment b
Flight VehicleEquipment 1/ c
Ground Equipment d
Crash Hazard 40 75 11 61/ Shock parameters a and c : Recommend for materiel not shock-mounted and weighing less than 136 kg (300 lbs).
Downloaded from http://www.everyspec.com on 2012-06-04T5:34:26.
MIL-STD-810F1 January 2000
METHOD 516.5516.5-30
4.5.6.2 Test tolerances.
For complex waveform replication based upon SRS, ensure the test tolerances are within those specified for the SRSin paragraph 4.2.2. For the classical pulse terminal peak sawtooth pulse described in table 516.5-VII, ensure thewaveform is within the tolerances specified on figure 516.5-10.
4.5.6.3 Procedure V.
Step 1. Secure the test item mount to the shock apparatus by its in-service mounting configuration. Use atest item that is dynamically similar to the materiel, or a mechanically equivalent mockup. If amockup is used, it will represent the same hazard potential, mass, center of mass, and mass momentsabout the attachment points as the materiel being simulated. (If measurement information is to becollected, mount and calibrate the instrumentation.)
Step 2. Perform two shocks in each direction (as determined in paragraph 2.3.3) along three orthogonal axesof the test item for a maximum of 12 shocks.
Step 3. Perform a physical inspection of the test setup. Operation of the test item is not required.Step 4. Document the results of the physical inspection including an assessment of potential hazards created
by either materiel breakage or structural deformation or both. Process any measurement dataaccording to the maximax acceleration SRS or the pseudovelocity SRS.
4.5.6.4 Analysis of results.
Refer to the guidance in Part One, paragraphs 5.14 and 5.17, to assist in the evaluation of the test results. Ifmeasurement information was obtained process this in accordance with paragraph 4.5.6.3, Step 4.
4.5.7 Procedure VI - Bench handling.
The intent of this test is to determine the ability of materiel to withstand the usual level of shock associated withtypical bench maintenance or repair. Use this test for any materiel that may experience bench or bench-typemaintenance. This test considers both the structural and functional integrity of the materiel.
4.5.7.1 Controls.
Ensure the test item is a fully functional representative of the materiel. Raise the test item at one edge 100 mm (4 in)above a solid wooden bench top or until the chassis forms an angle of 45q with the bench top or until point ofbalance is reached, whichever is less. (The bench top must be at least 4.25 cm (1.675 inches) thick.) Perform aseries of drops in accordance with specifications. The heights used during this test are defined by examining thetypical drops that are commonly made by bench technicians and assembly line personnel.
4.5.7.2 Test tolerances.
Ensure the test height of drop is within 2.5% of the height of drop as specified in paragraph 4.5.7.1.
4.5.7.3 Procedure VI.
Step 1. Following a functional and physical checkout, configure the item as it would be for servicing, e.g.,with the chassis and front panel assembly removed from its enclosure. Position the test item as itwould be for servicing. Generally, the test item will be non-operational during the test.
Step 2. Using one edge as a pivot, lift the opposite edge of the chassis until one of the following conditionsoccurs (whichever occurs first).
a. The lifted edge of the chassis has been raised 100 mm (4 in) above the horizontal bench top.b. The chassis forms an angle of 45q with the horizontal bench top.c. The lifted edge of the chassis is just below the point of perfect balance. Let the chassis drop
back freely to the horizontal bench top. Repeat using other practical edges of the samehorizontal face as pivot points, for a total of four drops.
Step 3. Repeat Step 2 with the test item resting on other faces until it has been dropped for a total of fourtimes on each face on which the test item could be placed practically during servicing.
Step 4. Visually inspect the test item.
Downloaded from http://www.everyspec.com on 2012-06-04T5:34:26.
MIL-STD-810F1 January 2000
METHOD 516.5516.5-31
Step 5. Document the results.Step 6. Operate the test item in accordance with the approved test plan.Step 7. Document the results for comparison with data obtained in step 1, above.
4.5.7.4 Analysis of results.
Refer to the guidance in Part One, paragraph 5.14, to assist in the evaluation of the test results. In general, anyfunctional or physical (mechanical or structural) change of configuration from Step 1 in paragraph 4.5.7.3 mustrecorded and analyzed.
4.5.8 Procedure VII - Rail impact.
4.5.8.1 Controls.
The Department of Defense (DoD) uses this test to determine the effect of normal railroad car impacts that occurduring rail shipment, to verify the structural integrity of the materiel, and to evaluate the adequacy of the tiedownsystem and the tiedown process.
a. Test facility/equipment.
(1) Buffer railcars. Empty cars are preferred for use as the buffer or struck cars. However, loaded carsmay also be used with prior approval by the Director, Military Traffic Management CommandTransportation Engineering Agency (MTMCTEA), ATTN: MTTE-DPE, 720 Thimble ShoalsBlvd., Suite 130, Newport News, VA 23606-2574. (MTMCTEA is the designated DoD agent forland transportation (AR 70-44).) In either case, the total weight of the buffer cars is to be at least113,400 kg (250,000 lbs). The first buffer car must be a standard draft gear car. The remainingbuffer cars should have standard draft gear, if possible. The following are required to perform therail impact test:
(2) A test railcar, equipped with chain tiedowns and end-of-car cushioned draft gear, unless other railcartypes are approved by MTMCTEA. Some materiel may require other types of railcars for testing tobe representative of the intended shipping methods.
NOTE: Cushioned draft gear is a significant change from previous equipment requirements.
(3) One locomotive.
(4) A minimum 61 m (200 ft) length of reasonably level, tangent track is required between the buffercars and test car to allow acceleration of locomotive and test car to specified impact speeds.
(5) If the alternate procedure (see paragraph 4.5.8.3b) is used to conduct the test, use a tangent trackwith a slight grade in lieu of a locomotive.
b. Preparation for test.
(1) Load and secure the test item as would be done for actual rail transport. If safety or other reasonspreclude the use of a test item representative of the actual materiel, use a substitute test item that isequal in weight and general character to the materiel. Prior to using a substitute test item, obtainapproval from MTMCTEA.
(2) The materiel developer is responsible for the development of transportation procedures andinstructions and is responsible for coordinating these with and obtaining approval from MTMCTEAwell in advance of rail impact testing. Mount the test item as would be done in actual service and inaccordance with the standard loading and bracing methods shown in Section No. 6 of the RulesGoverning the Loading of Department of Defense Materiel on Open Top Cars (procure copies fromthe Publications Department, Association of American Railroads, 50 F Street N. W., Washington,DC 20001-1530, (202) 639-2211). Do not use more than four tiedown provisions, typically two ateach end of the test item. Apply the first tiedown from each provision as near as possible to, butwithout exceeding 45 degrees from the horizontal (when viewed from the side). Apply additionaltiedowns to the next available tiedown point on the flatcar. Apply chains to the railcar near side (donot cross chains). All tiedown procedures require approval by MTMCTEA prior to testing. Only
Downloaded from http://www.everyspec.com on 2012-06-04T5:34:26.
MIL-STD-810F1 January 2000
METHOD 516.5516.5-32
use an arrangement of the test item and its blocking and tiedown to be tested that is identical to thatproposed or approved by MTMCTEA.
(3) Unless otherwise specified in the transportability requirements for the materiel, perform the test withthe test item at its maximum gross weight (fully loaded) rating.
c. Test setup.
(1) Buffer cars must have their air and hand brakes set. This provides a more conservative test. Carsmust be bunched to compress all slack and cushioning in the couplings, if any. The struck end offirst buffer car must have standard draft gear.
(2) Locate the test car between the buffer cars and the locomotive.
(3) Install one of the following timing devices (or equivalent) to obtain the impact speed of the test car.
(a) An electric timer capable of measuring within 0.16 km/h (+0.1 mph): Place the switch contactson the track in accordance with manufacturer's instructions.
(b) A stop watch and torpedoes: when used, measure the torpedo locations. Place the first torpedobeyond the face of the knuckle on the first buffer car and located one foot more than thedistance between the leading axle and knuckle face on the test car. Place the second torpedo 6.7m (22 ft) along the track from the first torpedo. The relationship of time lapse versus speed fortravel of a distance of 6.7 m (22 ft) is shown in table 516.5-VIII.
(c) Radar: In order to obtain an accurate speed, position the operator of the radar in line with thedirection of impact or as otherwise recommended by the radar manufacturer.
(4) Photograph the test setup including any securement items. This may be a valuable tool if there isany subsequent failure of the items of securement.
4.5.8.2 Test tolerances.
Ensure test tolerances are in accordance with tolerances specified in paragraph 4.5.8.1 and the test plan.
4.5.8.3 Procedure VII.
a. General considerations for main procedure.
(1) Brief the train crew on the procedure. Delegate one person to advise the appropriate member of thetrain crew when moves are to be made. Instruct all participants and observers to take precautions fortheir personal safety and observe safety practices of the carrier and/or company conducting the test. If desired, perform a test run without impacting the test item to establish accuracy of speed.
(2) Subject the test item to four impacts, the first three of which are in the same direction and at speedsof 6.4, 9.7, and 13 km/h (4, 6, and 8 mph) respectively, each speed with a tolerance of +0.8, -0.0km/h (0.5 mph).
(3) Perform the fourth impact at 13 km/h (+0.8, -0.0 km/h) and impact the opposite end of the test carfrom the first three impacts. If it is not possible to turn the test car because of track layout, this maybe accomplished by running the test item car to the opposite end of the buffer cars and impacting asabove.
(4) If the lading or securement items loosen or fail during the test, photograph and document theseitems. If it appears necessary to adjust the lading or securement items to continue the test, correctthe restraint and restart the test beginning with the 6.4 km/h (4 mph) impact.
(5) Pull the rail car carrying the test item a sufficient distance from the buffer cars. Next, push the testload car toward the buffer cars until the desired speed is obtained, and release it so it rolls freely intothe buffer cars having knuckles positioned for coupling.
(6) If the materiel can be shipped in two orientations (such as lengthwise and crosswise on the rail car),repeat the four impacts for each orientation.
b. General considerations for alternate procedure.
Downloaded from http://www.everyspec.com on 2012-06-04T5:34:26.
MIL-STD-810F1 January 2000
METHOD 516.5516.5-33
(1) A section of track can be calibrated using a test car and either radar or another speed-measuringdevice. Release the test car from the designated starting point and allow it to roll freely down theinclined track. For radar, a crew member riding the test car is in radio contact with the radaroperator who reads off the car speed to the rider. For other than radar, follow the same concept. The rider drops markers at track-side to indicate locations at which the desired speeds are obtained. After determining the 8 mph mark, stop the test car by use of the hand brake. Ensure no other carsare present on the test track during the calibration process. Repeat the process two times to ensurethe accuracy of speed locations. If it is difficult for the rider to safely drop the markers and stop thecar using the hand brake, use a free rolling locomotive for the initial calibration when markers aredropped with the locomotive's brakes applied after reaching 8 mph as indicated by radar. Thenrelease the test car from the same starting point and make adjustments in markers if needed prior toimpacting.
(2) After determining speed locations, perform impacts by locating the buffer cars at the proper locationfor desired impact speed and releasing the test car from the designated starting point. This requiresmoving the buffer cars every time a different speed is required.
(3) Use speeds and the direction of impacts as outlined in paragraph 4.5.8.3a.
(4) In lieu of positioning of the buffer cars at various positions on the track, release the test car fromcalibrated positions on the inclined track that correspond to the desired speeds.
(5) If the lading or securement items loosen or fail during the test, photograph and document theseitems. If it appears necessary to adjust the lading or securement items to continue the test, correctthe restraint and restart the test beginning with the 6.4 km/h impact.
c. Additional requirements.
(1) Repeat any impacts that are below the required test speeds. If any readjustment of the lading orreconditioning of the bracing or items of securement is necessary, correct, photograph and documentthe problem(s), correct the restraint and restart the entire test beginning with the 6.4 km/h impact. Accept any impacts above the required test speed providing the test item satisfies the requirementsof paragraph 4.5.8.4.
(2) If the tiedown chains or chock blocks become loose during the test, photograph and document theproblem(s). The test director will notify MTMCTEA of the modifications required, and jointlydecide if a retest will be required.
Downloaded from http://www.everyspec.com on 2012-06-04T5:34:26.
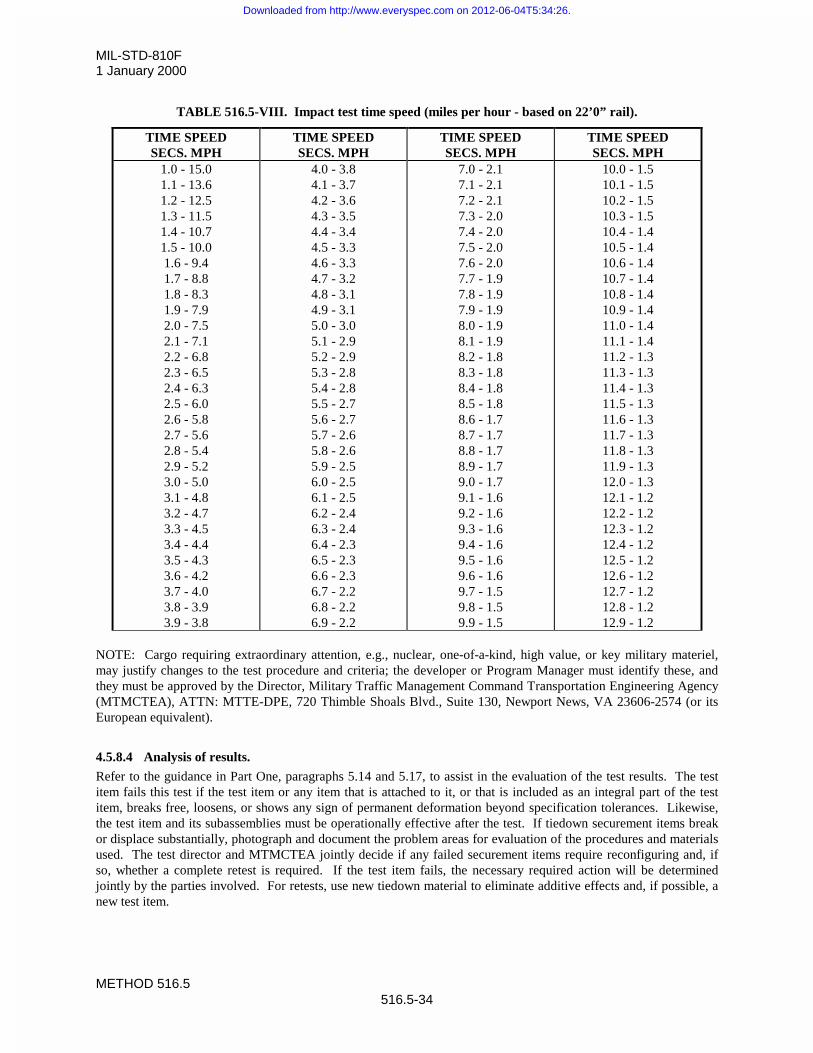
MIL-STD-810F1 January 2000
METHOD 516.5516.5-34
TABLE 516.5-VIII. Impact test time speed (miles per hour - based on 22’0” rail).
TIME SPEEDSECS. MPH
TIME SPEEDSECS. MPH
TIME SPEEDSECS. MPH
TIME SPEEDSECS. MPH
1.0 - 15.01.1 - 13.61.2 - 12.51.3 - 11.51.4 - 10.71.5 - 10.01.6 - 9.41.7 - 8.81.8 - 8.31.9 - 7.92.0 - 7.52.1 - 7.12.2 - 6.82.3 - 6.52.4 - 6.32.5 - 6.02.6 - 5.82.7 - 5.62.8 - 5.42.9 - 5.23.0 - 5.03.1 - 4.83.2 - 4.73.3 - 4.53.4 - 4.43.5 - 4.33.6 - 4.23.7 - 4.03.8 - 3.93.9 - 3.8
4.0 - 3.84.1 - 3.74.2 - 3.64.3 - 3.54.4 - 3.44.5 - 3.34.6 - 3.34.7 - 3.24.8 - 3.14.9 - 3.15.0 - 3.05.1 - 2.95.2 - 2.95.3 - 2.85.4 - 2.85.5 - 2.75.6 - 2.75.7 - 2.65.8 - 2.65.9 - 2.56.0 - 2.56.1 - 2.56.2 - 2.46.3 - 2.46.4 - 2.36.5 - 2.36.6 - 2.36.7 - 2.26.8 - 2.26.9 - 2.2
7.0 - 2.17.1 - 2.17.2 - 2.17.3 - 2.07.4 - 2.07.5 - 2.07.6 - 2.07.7 - 1.97.8 - 1.97.9 - 1.98.0 - 1.98.1 - 1.98.2 - 1.88.3 - 1.88.4 - 1.88.5 - 1.88.6 - 1.78.7 - 1.78.8 - 1.78.9 - 1.79.0 - 1.79.1 - 1.69.2 - 1.69.3 - 1.69.4 - 1.69.5 - 1.69.6 - 1.69.7 - 1.59.8 - 1.59.9 - 1.5
10.0 - 1.510.1 - 1.510.2 - 1.510.3 - 1.510.4 - 1.410.5 - 1.410.6 - 1.410.7 - 1.410.8 - 1.410.9 - 1.411.0 - 1.411.1 - 1.411.2 - 1.311.3 - 1.311.4 - 1.311.5 - 1.311.6 - 1.311.7 - 1.311.8 - 1.311.9 - 1.312.0 - 1.312.1 - 1.212.2 - 1.212.3 - 1.212.4 - 1.212.5 - 1.212.6 - 1.212.7 - 1.212.8 - 1.212.9 - 1.2
NOTE: Cargo requiring extraordinary attention, e.g., nuclear, one-of-a-kind, high value, or key military materiel,may justify changes to the test procedure and criteria; the developer or Program Manager must identify these, andthey must be approved by the Director, Military Traffic Management Command Transportation Engineering Agency(MTMCTEA), ATTN: MTTE-DPE, 720 Thimble Shoals Blvd., Suite 130, Newport News, VA 23606-2574 (or itsEuropean equivalent).
4.5.8.4 Analysis of results.
Refer to the guidance in Part One, paragraphs 5.14 and 5.17, to assist in the evaluation of the test results. The testitem fails this test if the test item or any item that is attached to it, or that is included as an integral part of the testitem, breaks free, loosens, or shows any sign of permanent deformation beyond specification tolerances. Likewise,the test item and its subassemblies must be operationally effective after the test. If tiedown securement items breakor displace substantially, photograph and document the problem areas for evaluation of the procedures and materialsused. The test director and MTMCTEA jointly decide if any failed securement items require reconfiguring and, ifso, whether a complete retest is required. If the test item fails, the necessary required action will be determinedjointly by the parties involved. For retests, use new tiedown material to eliminate additive effects and, if possible, anew test item.
Downloaded from http://www.everyspec.com on 2012-06-04T5:34:26.
MIL-STD-810F1 January 2000
METHOD 516.5516.5-35
4.5.9 Procedure VIII - Catapult Launch/Arrested Landing.
The intent of this test is to verify the functionality and structural integrity of materiel mounted in or on fixed wingaircraft that are subject to catapult launches and arrested landings.
4.5.9.1 Controls.
a. Measured data not available. Whenever possible, derive the test conditions from measured data onapplicable carrying aircraft (see Part One, paragraph 5.6, as well as the tasks at the end of Part One inAppendix A for information on the use of field/fleet data), since shock responses can be affected by localinfluences such as wing and fuselage bending modes, pylon interfaces, and structural damping. Whilethe pulse amplitudes associated with this environment are generally low, the long periods of applicationand high frequency of occurrence have the potential to cause significant dynamic and/or low cyclefatigue damage in improperly designed materiel. A typical aircraft may fly as many as 200 sorties peryear, of which more than two-thirds involve catapult launches and arrested landings. However, forlaboratory test purposes, 30 simulated catapult/arrested landing events in each of two axes (longitudinaland vertical) should provide confidence that the majority of significant defects will be identified forremedial action. If acceptable field-measured data are not available, the following guidance is offered inwhich sinusoidal burst is used to simulate each catapult or launch event. This time history has beensimplified to a constant amplitude sine burst of 2-second duration for simulation. In paragraph4.5.9.1a(5) measured data seems to indicate that response in the horizontal direction can be comparableto that in the vertical direction. For testing purposes, it is permissible to reduce the maximum amplitudein the horizontal direction to 75% of that in the vertical direction.
(1) Wave shape: damped sine wave.
(2) Wave frequency: determined by structural analysis of the specific aircraft and frequency of thefundamental mode.
(3) Burst amplitude: determined by structural analysis of the specific aircraft, the frequency of thefundamental mode and the location of the materiel relative to the shape of the fundamental mode.
(4) Wave damping (quality factor): Q = 20.
(5) Axis: vertical, horizontal, longitudinal.
(6) Number of bursts: determined by the specific application (for example, 30 bursts, each followed bya 10 second rest period).
b. Measured data available. If acceptable field measured data are available, the following guidance isoffered in which the catapult event is simulated by two shocks separated by a transient vibration, and thearrested landing event by one shock followed by transient vibration. The catapult launch/arrested landingshock environment differs from other typical shock events in that it is a transient periodic vibration(roughly sinusoidal) at a relatively low frequency determined by aircraft mass and landing gear dampingcharacteristics. Typical catapult launch shock time histories are shown on figure 516.5-12. These datarepresent measured acceleration response in the vertical, horizontal and longitudinal directions of a storecomponent mounted on the pylon of a platform. The data are DC coupled and lowpass filtered at 70 Hz.All three time histories demonstrate an initial transient, followed by a transient vibration (nearly twoseconds long), and concluded by a final transient. The longitudinal axis provides a profile of the DCcatapult acceleration which in general will not be important for testing purposes and can be removed byhigh pass filtering the time history at a frequency less than 10% of the lowest significant frequency in themaximax acceleration SRS. Procedures for accomplishing this filtering may necessarily be iterative(unless Fourier transform information is used) with high pass filtering beginning at a comparatively highfrequency and decreasing until the most significant SRS low frequency is identified. In general, catapultacceleration response will display two shock events corresponding to initial catapult load application tothe aircraft and catapult release from the aircraft separated by an oscillatory acceleration. Both the initialand the final shock events have a distinct oscillatory nature. It is essential that this test be run as a seriesof two shock transients separated by a two second period of time in which transient vibration may beinput. Typical arrested landing shock time histories are shown on figure 516.5-13. These data represent
Downloaded from http://www.everyspec.com on 2012-06-04T5:34:26.
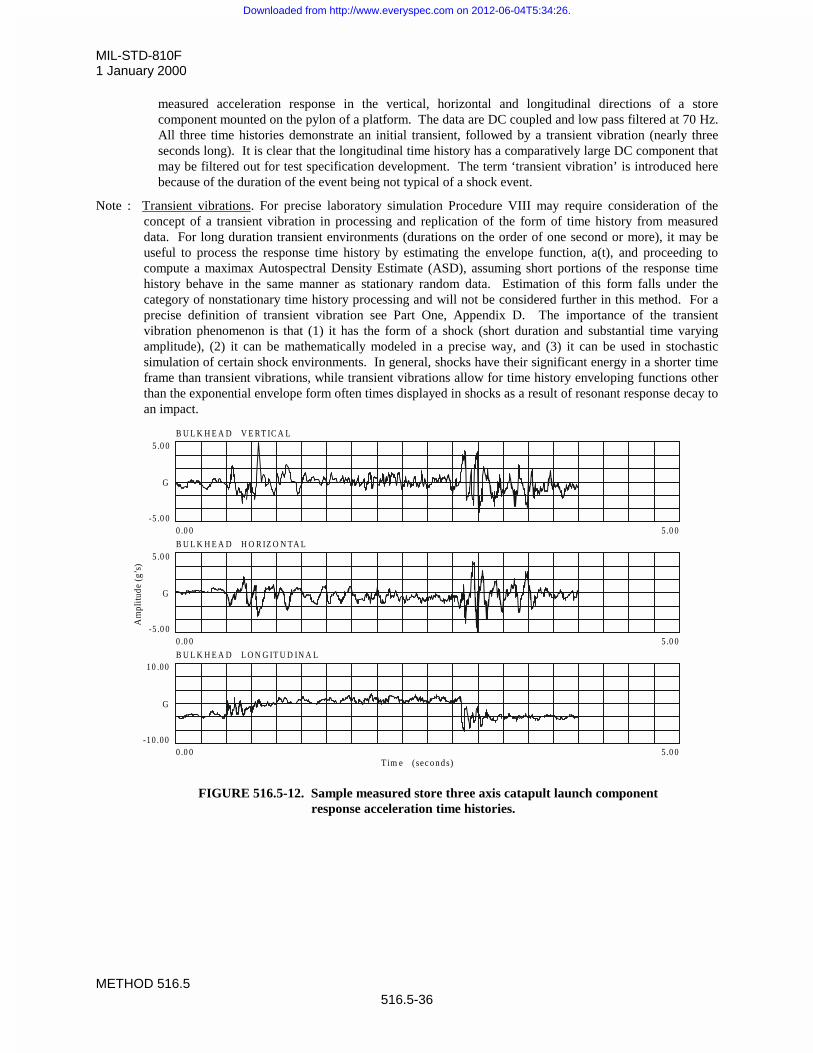
MIL-STD-810F1 January 2000
METHOD 516.5516.5-36
measured acceleration response in the vertical, horizontal and longitudinal directions of a storecomponent mounted on the pylon of a platform. The data are DC coupled and low pass filtered at 70 Hz.All three time histories demonstrate an initial transient, followed by a transient vibration (nearly threeseconds long). It is clear that the longitudinal time history has a comparatively large DC component thatmay be filtered out for test specification development. The term ‘transient vibration’ is introduced herebecause of the duration of the event being not typical of a shock event.
Note : Transient vibrations. For precise laboratory simulation Procedure VIII may require consideration of theconcept of a transient vibration in processing and replication of the form of time history from measureddata. For long duration transient environments (durations on the order of one second or more), it may beuseful to process the response time history by estimating the envelope function, a(t), and proceeding tocompute a maximax Autospectral Density Estimate (ASD), assuming short portions of the response timehistory behave in the same manner as stationary random data. Estimation of this form falls under thecategory of nonstationary time history processing and will not be considered further in this method. For aprecise definition of transient vibration see Part One, Appendix D. The importance of the transientvibration phenomenon is that (1) it has the form of a shock (short duration and substantial time varyingamplitude), (2) it can be mathematically modeled in a precise way, and (3) it can be used in stochasticsimulation of certain shock environments. In general, shocks have their significant energy in a shorter timeframe than transient vibrations, while transient vibrations allow for time history enveloping functions otherthan the exponential envelope form often times displayed in shocks as a result of resonant response decay toan impact.
FIGURE 516.5-12. Sample measured store three axis catapult launch componentresponse acceleration time histories.
B U L K H E A D V E RT IC A L5 .0 0
-5 .0 00 .0 0 5 .0 0
G
B U L K H E A D H O R IZ O N TA L5 .0 0
-5 .0 00 .0 0 5 .0 0
G
B U L K H E A D L O N G IT U D IN A L1 0 .0 0
-1 0 .0 00 .0 0 5 .0 0
G
Tim e (sec onds)
Am
plit
ude
(g’s
)
Downloaded from http://www.everyspec.com on 2012-06-04T5:34:26.
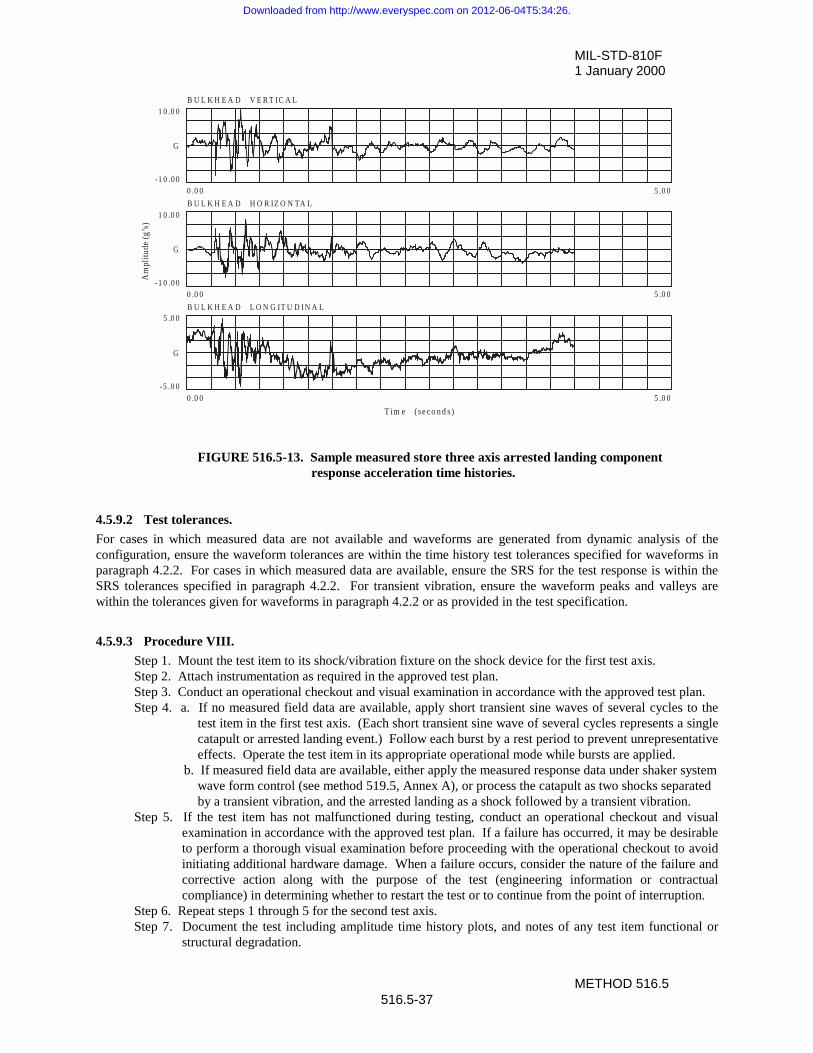
MIL-STD-810F1 January 2000
METHOD 516.5516.5-37
B U L K H E A D V E R T IC A L1 0 .0 0
-1 0 .0 00 .0 0 5 .0 0
G
B U L K H E A D H O R IZ O N TA L1 0 .0 0
-1 0 .0 00 .0 0 5 .0 0
G
B U L K H E A D L O N G IT U D I N A L5 .0 0
-5 .0 00 .0 0 5 .0 0
G
T im e (s e co n d s )
Am
plitu
de (
g’s)
FIGURE 516.5-13. Sample measured store three axis arrested landing componentresponse acceleration time histories.
4.5.9.2 Test tolerances.
For cases in which measured data are not available and waveforms are generated from dynamic analysis of theconfiguration, ensure the waveform tolerances are within the time history test tolerances specified for waveforms inparagraph 4.2.2. For cases in which measured data are available, ensure the SRS for the test response is within theSRS tolerances specified in paragraph 4.2.2. For transient vibration, ensure the waveform peaks and valleys arewithin the tolerances given for waveforms in paragraph 4.2.2 or as provided in the test specification.
4.5.9.3 Procedure VIII.
Step 1. Mount the test item to its shock/vibration fixture on the shock device for the first test axis.Step 2. Attach instrumentation as required in the approved test plan.Step 3. Conduct an operational checkout and visual examination in accordance with the approved test plan.Step 4. a. If no measured field data are available, apply short transient sine waves of several cycles to the
test item in the first test axis. (Each short transient sine wave of several cycles represents a singlecatapult or arrested landing event.) Follow each burst by a rest period to prevent unrepresentativeeffects. Operate the test item in its appropriate operational mode while bursts are applied.
b. If measured field data are available, either apply the measured response data under shaker systemwave form control (see method 519.5, Annex A), or process the catapult as two shocks separatedby a transient vibration, and the arrested landing as a shock followed by a transient vibration.
Step 5. If the test item has not malfunctioned during testing, conduct an operational checkout and visualexamination in accordance with the approved test plan. If a failure has occurred, it may be desirableto perform a thorough visual examination before proceeding with the operational checkout to avoidinitiating additional hardware damage. When a failure occurs, consider the nature of the failure andcorrective action along with the purpose of the test (engineering information or contractualcompliance) in determining whether to restart the test or to continue from the point of interruption.
Step 6. Repeat steps 1 through 5 for the second test axis.Step 7. Document the test including amplitude time history plots, and notes of any test item functional or
structural degradation.
Downloaded from http://www.everyspec.com on 2012-06-04T5:34:26.
MIL-STD-810F1 January 2000
METHOD 516.5516.5-38
4.5.9.4 Analysis of results.
In addition to the guidance in Part One, paragraphs 5.14 and 5.17, and Part One, Appendix A, Tasks 405 and 406, inthe evaluation consider any failure of the structural configuration of the test item, mount or launcher that may notdirectly impact failure of the functioning of the materiel but that would lead to failure under in-service conditions.
5. REFERENCE/RELATED DOCUMENTS.
a. Harris, C., and C. E. Crede, eds. Shock and Vibration Handbook, 2nd Edition, NY, McGraw-Hill, 1976.
b. Gaberson, H. A. and R. H. Chalmers. Model Velocity as a Criterion of Shock Severity, Shock andVibration Bulletin 40, Pt. 2, (1969) 31-49.
c. ANSI/ASTM D3332-77, Standard Methods for Fragility of Products Using Machines. 1977.
d. Conover, W.J., Practical Nonparametric Statistics. New York; Wiley, 1971, Chapter 3.
e. Piersol, A.G., Analysis of Harpoon Missile Structural Response to Aircraft Launches, Landings andCaptive Flight and Gunfire. Naval Weapons Center Report #NWC TP 58890. January 1977.
f. Handbook for Dynamic Data Acquisition and Analysis, IES-RP-DTE012.1, Institute of EnvironmentalSciences, 940 East Northwest Highway, Mount Prospect, Illinois 60056
g. Piersol, Allan G., Determination of Maximum Structural Responses From Predictions or Measurementsat Selected Points, Proceedings of the 65th Shock and Vibration Symposium, Volume I, SAVIAC, 1994.
h. Bendat, J. S. and A. G. Piersol, Random Data: Analysis and Measurement Procedures, John Wiley &Sons Inc., New York, 1986
i. Schock, R. W. and W. E. Paulson, TRANSPORTATION A Survey of Shock and VibrationEnvironments in the Four Major Modes of Transportation, Shock and Vibration Bulletin #35, Part 5,February 1966.
j. Ostrem, F. E., TRANSPORTATION AND PACKAGING A Survey of the Transportation Shock andVibration Input to Cargo, Shock and Vibration Bulletin #42, Part 1, January 1972.
k. MIL-S-901, “Shock Tests, H.I. (High Impact), Shipboard Machinery, Equipment and Systems,Requirements for.”
l. MIL-STD-331, “Fuze and Fuze Components, Environmental and Performance Tests for.”
Downloaded from http://www.everyspec.com on 2012-06-04T5:34:26.
MIL-STD-810F1 January 2000ANNEX A
METHOD 516.5516.5A-1
ANNEX A
STATISTICAL CONSIDERATIONS FORDEVELOPING LIMITS ON PREDICTED AND PROCESSED DATA
1. SCOPE.
1.1 Purpose.
This Annex provides information relative to the statistical characterization of a set of data for the purpose of definingan upper limit of the data set related to statistical/probabilistic considerations.
1.2 Application.
Information in this Annex is generally applicable to frequency domain estimates that are either predicted based ongiven information or time domain measurements processed in the frequency domain according to an appropriatetechnique i.e., for stationary random vibration the processing would be an ASD, for a very short transient theprocessing could be an SRS , ESD, or FS. Given estimates in the frequency domain information in this Annex willallow the establishment of upper limits of the data in a statistically correct way.
2. DEVELOPMENT.
2.1 Basic Estimate Assumptions.
Prediction estimates, measurement estimates, or a combination of prediction and measurement estimates may beconsidered in the same manner. It is assumed that uncertainty in individual measurements (processing error) doesnot effect the limit considerations. For measured field data digitally processed such that estimates of the SRS, ESD,FS, or ASD are obtained for single sample records, it becomes useful to examine and summarize the overall statisticsof "similar" estimates selected in a way so as to not bias the summary statistics. To ensure the estimates are notbiased, the measurement locations might be chosen randomly, consistent with the measurement objectives. Similarestimates may be defined as (1) estimates at a single location on materiel that has been obtained from repeatedtesting under essentially identical experimental conditions; (2) estimates on a system that have been obtained fromone test, where the estimates are taken (a) at several neighboring locations displaying a degree of responsehomogeneity or (b) in "zones" i.e., points of similar response at varying locations; or (3) some combination of (1)and (2). In any case, it is assumed that there is a certain degree of homogeneity among the estimates across thefrequency band of interest. This latter assumption generally requires that (1) the set of estimates for a givenfrequency have no significant “outliers” that can cause large sample variance estimates and (2) larger input stimulusto the system from which the measurements are taken implies larger estimate values.
2.2 Basic Estimate Summary Preprocessing.
There are two ways in which summaries may be obtained. The first way is to utilize an "enveloping" scheme on thebasic estimates to arrive at a conservative estimate of the environment, and some qualitative estimate of the spread ofbasic estimates relative to this envelope. This procedure is dependent upon the judgment of the analyst and, ingeneral, does not provide consistent results among analysts. The second way is to combine the basic estimates insome statistically appropriate way and infer the statistical significance of the estimates based upon probabilitydistribution theory. Reference g summarizes the current state of knowledge relative to this approach and itsrelationship to determining upper limits on sets of data. In general, the estimates referred to and their statistics arerelated to the same frequency band over which the processing takes place. Unfortunately, for a given frequencyband, the statistics behind the overall set of estimates are not easily accessible because of the unknown distributionfunction of amplitudes for the frequency band of interest. In most cases the distribution function can be assumed tobe normal, provided the individual estimates are transformed to a "normalizing" form by computing the logarithm tothe base ten of the estimates. For ESD and FS estimates, the averaging of adjacent components (assumed to bestatistically independent) increases the number of degrees of freedom in the estimates while decreasing the frequency
Downloaded from http://www.everyspec.com on 2012-06-04T5:34:26.
MIL-STD-810F1 January 2000ANNEX A
METHOD 516.5516.5A-2
resolution with the possible introduction of statistical bias in the estimates. For ASD estimates, averaging ofadjacent components can be useful provided the bias error in the estimate is small; i.e., the resolution filterbandwidth is a very small fraction of the overall estimate bandwidth. For SRS estimates, because they are based onmaximum response of a single-degree-of-freedom system as its natural frequency is varied, adjacent estimates tend tobe statistically dependent and therefore not well smoothed by averaging unless the SRS is computed for very narrowfrequency spacing. In such cases, smoothing of SRS estimates is better accomplished by reprocessing the originaltime history data at a broader natural frequency spacing, e.g., 1/6th octave as opposed to 1/12th octave. There is noapparent way to smooth dependent SRS estimates mathematically when reprocessing cannot be performed, and theacceptable alternative is some form of enveloping of the estimates. The larger the sample size the closer thelogarithm transform of the estimates is to the normal distribution unless there is a measurement selection bias error inthe experiment. Finally, it is important to note that generally, before application, the upper limits obtained in theparagraphs to follow are smoothed by straight line segments intersecting at spectrum “breakpoints”. No guidance isprovided in this annex relative to this “smoothing” or “enveloping” procedure, e.g., whether estimates should beclipped or enveloped and the relationship of the bandwidth of the estimates to the degree of clipping, etc., except thatsuch smoothing should be performed only by an experienced analyst. Reference g discusses this further.
2.3 Parametric Upper Limit Statistical Estimate Assumptions.
In all the formulas for the estimate of the statistical upper limit of a set of N predictions or measurements,
{ x1, x2, ……..xN },
it is assumed that (1) the estimates will be logarithm transformed to bring the overall set of measurements closer tothose sampled of a normal distribution and (2) the measurement selection bias error is negligible. Since the normaland “t” distribution are symmetric, the formulas below apply for the lower bound by changing the sign between themean and the standard deviation quantity to minus. It is assumed here that all estimates are at a single frequency orfor a single bandwidth, and that estimates among bandwidths are independent so that each bandwidth underconsideration may be processed individually, and the results summarized on one plot over the entire bandwidth as afunction of frequency. For
yi = log10(xi) i = 1,2,……,N
Mean estimate for true mean, Py is given by
iN
1iy y
N
1m ¦
and the unbiased estimate of the standard deviation for the true standard deviation Vy is given by
� �
1N
mys
2yi
N
1iy
�
�¦
2.3.1 NTL - Upper normal one-sided tolerance limit.
The upper normal one-sided tolerance limit on the proportion E of population values that will be exceeded with aconfidence coefficient, J, is given by NTL(N, Ã, J), where
� � JE�
JE,,Nyy ksm
10,,NNTL
where kN,E,J, is the one-sided normal tolerance factor given in table 516.5A-I for selected values of N, E and J. NTLis termed the upper one-sided normal tolerance interval (of the original set of estimates) for which 100 E% of thevalues will lie below the limit with 100 J % confidence. For E = 0.95 and J= 0.50, this is referred to as the 95/50limit.
Downloaded from http://www.everyspec.com on 2012-06-04T5:34:26.
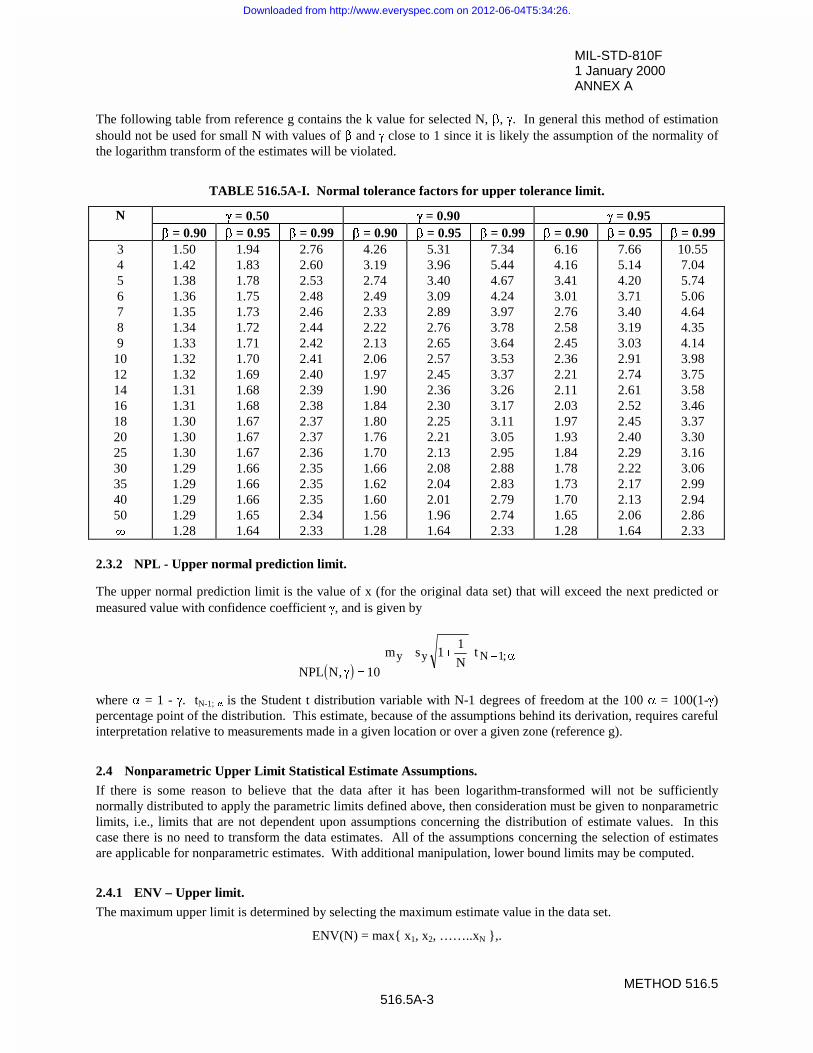
MIL-STD-810F1 January 2000ANNEX A
METHOD 516.5516.5A-3
The following table from reference g contains the k value for selected N, E, J. In general this method of estimationshould not be used for small N with values of E and J close to 1 since it is likely the assumption of the normality ofthe logarithm transform of the estimates will be violated.
TABLE 516.5A-I. Normal tolerance factors for upper tolerance limit.
N JJ = 0.50 JJ = 0.90 JJ = 0.95EE = 0.90 EE = 0.95 EE = 0.99 EE = 0.90 EE = 0.95 EE = 0.99 EE = 0.90 EE = 0.95 EE = 0.99
3456789
1012141618202530354050f
1.501.421.381.361.351.341.331.321.321.311.311.301.301.301.291.291.291.291.28
1.941.831.781.751.731.721.711.701.691.681.681.671.671.671.661.661.661.651.64
2.762.602.532.482.462.442.422.412.402.392.382.372.372.362.352.352.352.342.33
4.263.192.742.492.332.222.132.061.971.901.841.801.761.701.661.621.601.561.28
5.313.963.403.092.892.762.652.572.452.362.302.252.212.132.082.042.011.961.64
7.345.444.674.243.973.783.643.533.373.263.173.113.052.952.882.832.792.742.33
6.164.163.413.012.762.582.452.362.212.112.031.971.931.841.781.731.701.651.28
7.665.144.203.713.403.193.032.912.742.612.522.452.402.292.222.172.132.061.64
10.557.045.745.064.644.354.143.983.753.583.463.373.303.163.062.992.942.862.33
2.3.2 NPL - Upper normal prediction limit.
The upper normal prediction limit is the value of x (for the original data set) that will exceed the next predicted ormeasured value with confidence coefficient J, and is given by
� � 10,NNPL JN
11sm yy ��
D� ;1Nt
where D = 1 - J. tN-1; D is the Student t distribution variable with N-1 degrees of freedom at the 100 D = 100(1-J)percentage point of the distribution. This estimate, because of the assumptions behind its derivation, requires carefulinterpretation relative to measurements made in a given location or over a given zone (reference g).
2.4 Nonparametric Upper Limit Statistical Estimate Assumptions.
If there is some reason to believe that the data after it has been logarithm-transformed will not be sufficientlynormally distributed to apply the parametric limits defined above, then consideration must be given to nonparametriclimits, i.e., limits that are not dependent upon assumptions concerning the distribution of estimate values. In thiscase there is no need to transform the data estimates. All of the assumptions concerning the selection of estimatesare applicable for nonparametric estimates. With additional manipulation, lower bound limits may be computed.
2.4.1 ENV – Upper limit.
The maximum upper limit is determined by selecting the maximum estimate value in the data set.
ENV(N) = max{ x1, x2, ……..xN },.
Downloaded from http://www.everyspec.com on 2012-06-04T5:34:26.
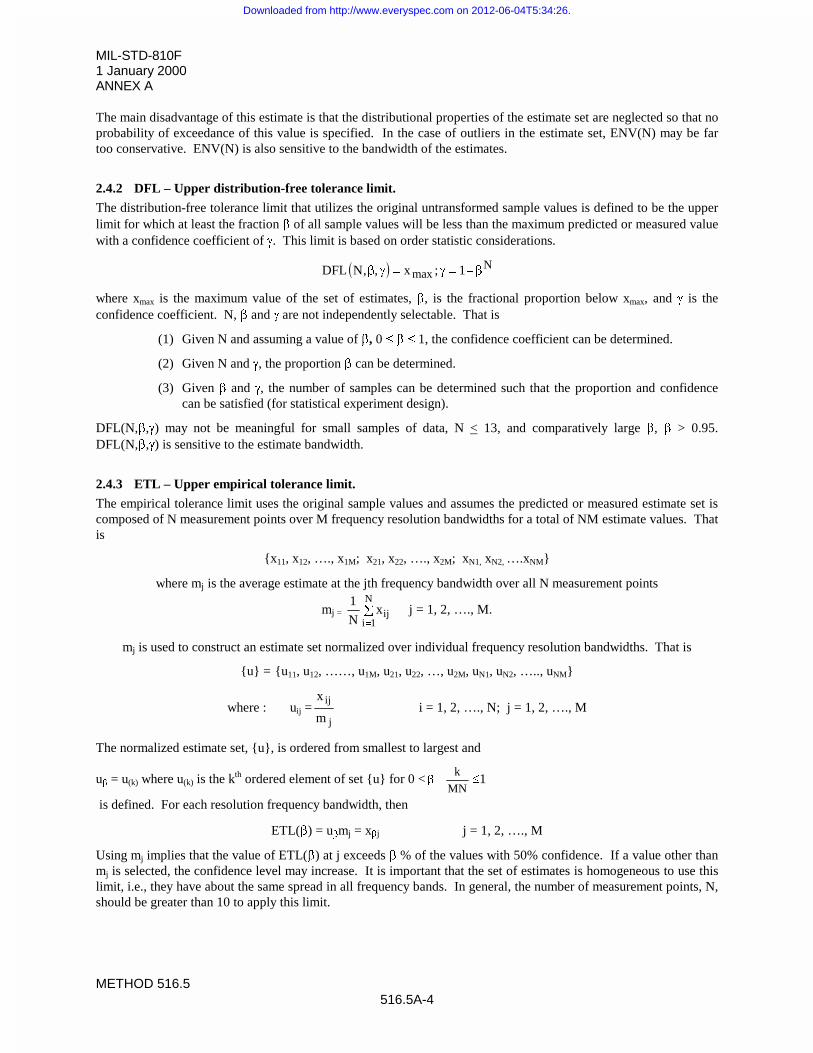
MIL-STD-810F1 January 2000ANNEX A
METHOD 516.5516.5A-4
The main disadvantage of this estimate is that the distributional properties of the estimate set are neglected so that noprobability of exceedance of this value is specified. In the case of outliers in the estimate set, ENV(N) may be fartoo conservative. ENV(N) is also sensitive to the bandwidth of the estimates.
2.4.2 DFL – Upper distribution-free tolerance limit.
The distribution-free tolerance limit that utilizes the original untransformed sample values is defined to be the upperlimit for which at least the fraction E of all sample values will be less than the maximum predicted or measured valuewith a confidence coefficient of J. This limit is based on order statistic considerations.
� � Nmax 1;x,,NDFL E� J JE
where xmax is the maximum value of the set of estimates, E, is the fractional proportion below xmax, and J is theconfidence coefficient. N, E and J are not independently selectable. That is
(1) Given N and assuming a value of E, 0 dd E dd 1, the confidence coefficient can be determined.
(2) Given N and J, the proportion E can be determined.
(3) Given E and J, the number of samples can be determined such that the proportion and confidencecan be satisfied (for statistical experiment design).
DFL(N,E,J) may not be meaningful for small samples of data, N < 13, and comparatively large E, E > 0.95.DFL(N,E,J) is sensitive to the estimate bandwidth.
2.4.3 ETL – Upper empirical tolerance limit.
The empirical tolerance limit uses the original sample values and assumes the predicted or measured estimate set iscomposed of N measurement points over M frequency resolution bandwidths for a total of NM estimate values. Thatis
{x11, x12, …., x1M; x21, x22, …., x2M; xN1, xN2, ….xNM}
where mj is the average estimate at the jth frequency bandwidth over all N measurement points
mj = ¦
N
1iijx
N
1 j = 1, 2, …., M.
mj is used to construct an estimate set normalized over individual frequency resolution bandwidths. That is
{u} = {u11, u12, ……, u1M, u21, u22, …, u2M, uN1, uN2, ….., uNM}
where : uij =j
ij
m
xi = 1, 2, …., N; j = 1, 2, …., M
The normalized estimate set, {u}, is ordered from smallest to largest and
uE = u(k) where u(k) is the kth ordered element of set {u} for 0 <MN
k E d1
is defined. For each resolution frequency bandwidth, then
ETL(E) = uEmj = xEj j = 1, 2, …., M
Using mj implies that the value of ETL(E) at j exceeds E % of the values with 50% confidence. If a value other thanmj is selected, the confidence level may increase. It is important that the set of estimates is homogeneous to use thislimit, i.e., they have about the same spread in all frequency bands. In general, the number of measurement points, N,should be greater than 10 to apply this limit.
Downloaded from http://www.everyspec.com on 2012-06-04T5:34:26.
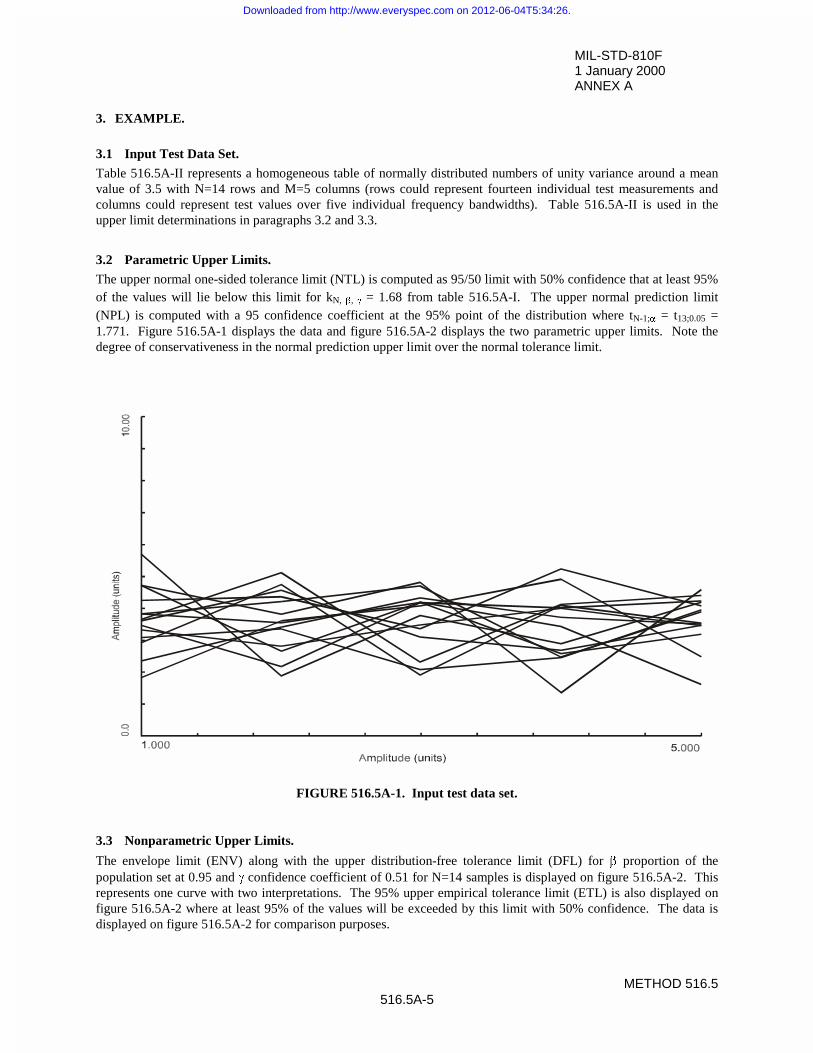
MIL-STD-810F1 January 2000ANNEX A
METHOD 516.5516.5A-5
3. EXAMPLE.
3.1 Input Test Data Set.
Table 516.5A-II represents a homogeneous table of normally distributed numbers of unity variance around a meanvalue of 3.5 with N=14 rows and M=5 columns (rows could represent fourteen individual test measurements andcolumns could represent test values over five individual frequency bandwidths). Table 516.5A-II is used in theupper limit determinations in paragraphs 3.2 and 3.3.
3.2 Parametric Upper Limits.
The upper normal one-sided tolerance limit (NTL) is computed as 95/50 limit with 50% confidence that at least 95%of the values will lie below this limit for kN, E, J = 1.68 from table 516.5A-I. The upper normal prediction limit(NPL) is computed with a 95 confidence coefficient at the 95% point of the distribution where tN-1;D = t13;0.05 =1.771. Figure 516.5A-1 displays the data and figure 516.5A-2 displays the two parametric upper limits. Note thedegree of conservativeness in the normal prediction upper limit over the normal tolerance limit.
FIGURE 516.5A-1. Input test data set.
3.3 Nonparametric Upper Limits.
The envelope limit (ENV) along with the upper distribution-free tolerance limit (DFL) for E proportion of thepopulation set at 0.95 and J confidence coefficient of 0.51 for N=14 samples is displayed on figure 516.5A-2. Thisrepresents one curve with two interpretations. The 95% upper empirical tolerance limit (ETL) is also displayed onfigure 516.5A-2 where at least 95% of the values will be exceeded by this limit with 50% confidence. The data isdisplayed on figure 516.5A-2 for comparison purposes.
Downloaded from http://www.everyspec.com on 2012-06-04T5:34:26.
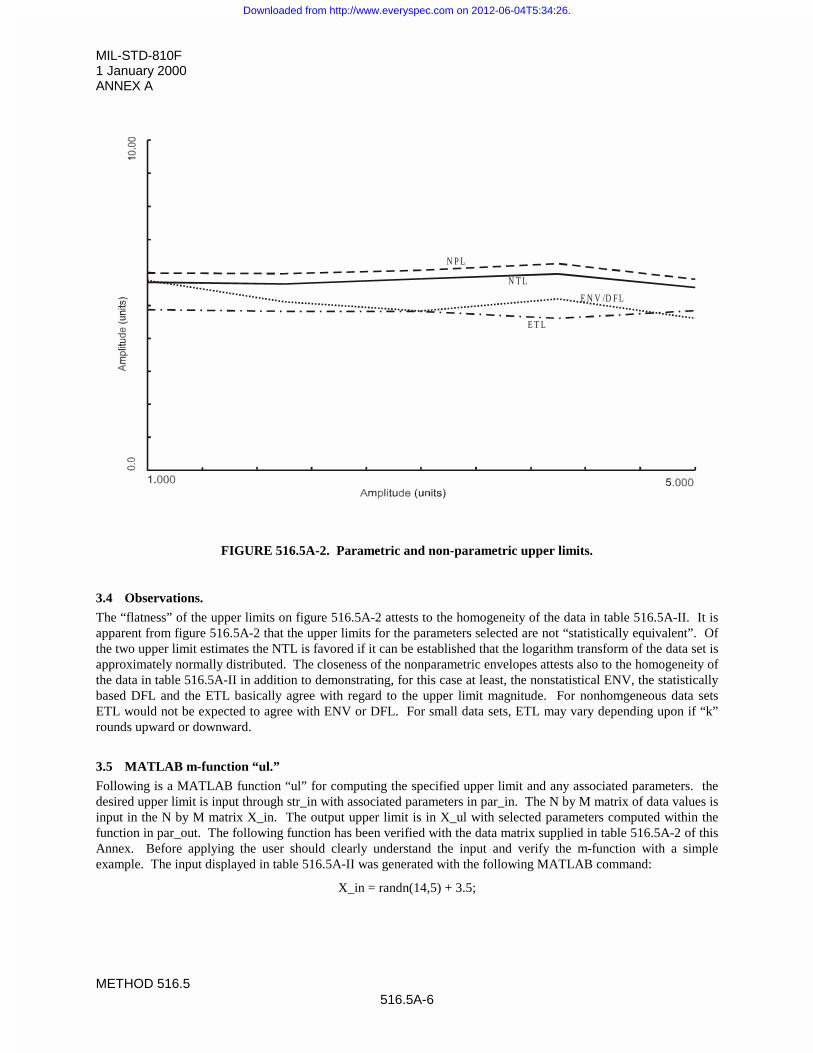
MIL-STD-810F1 January 2000ANNEX A
METHOD 516.5516.5A-6
FIGURE 516.5A-2. Parametric and non-parametric upper limits.
3.4 Observations.
The “flatness” of the upper limits on figure 516.5A-2 attests to the homogeneity of the data in table 516.5A-II. It isapparent from figure 516.5A-2 that the upper limits for the parameters selected are not “statistically equivalent”. Ofthe two upper limit estimates the NTL is favored if it can be established that the logarithm transform of the data set isapproximately normally distributed. The closeness of the nonparametric envelopes attests also to the homogeneity ofthe data in table 516.5A-II in addition to demonstrating, for this case at least, the nonstatistical ENV, the statisticallybased DFL and the ETL basically agree with regard to the upper limit magnitude. For nonhomgeneous data setsETL would not be expected to agree with ENV or DFL. For small data sets, ETL may vary depending upon if “k”rounds upward or downward.
3.5 MATLAB m-function “ul.”
Following is a MATLAB function “ul” for computing the specified upper limit and any associated parameters. thedesired upper limit is input through str_in with associated parameters in par_in. The N by M matrix of data values isinput in the N by M matrix X_in. The output upper limit is in X_ul with selected parameters computed within thefunction in par_out. The following function has been verified with the data matrix supplied in table 516.5A-2 of thisAnnex. Before applying the user should clearly understand the input and verify the m-function with a simpleexample. The input displayed in table 516.5A-II was generated with the following MATLAB command:
X_in = randn(14,5) + 3.5;
N P L
N T L
E N V /D F L
E T L
Downloaded from http://www.everyspec.com on 2012-06-04T5:34:26.
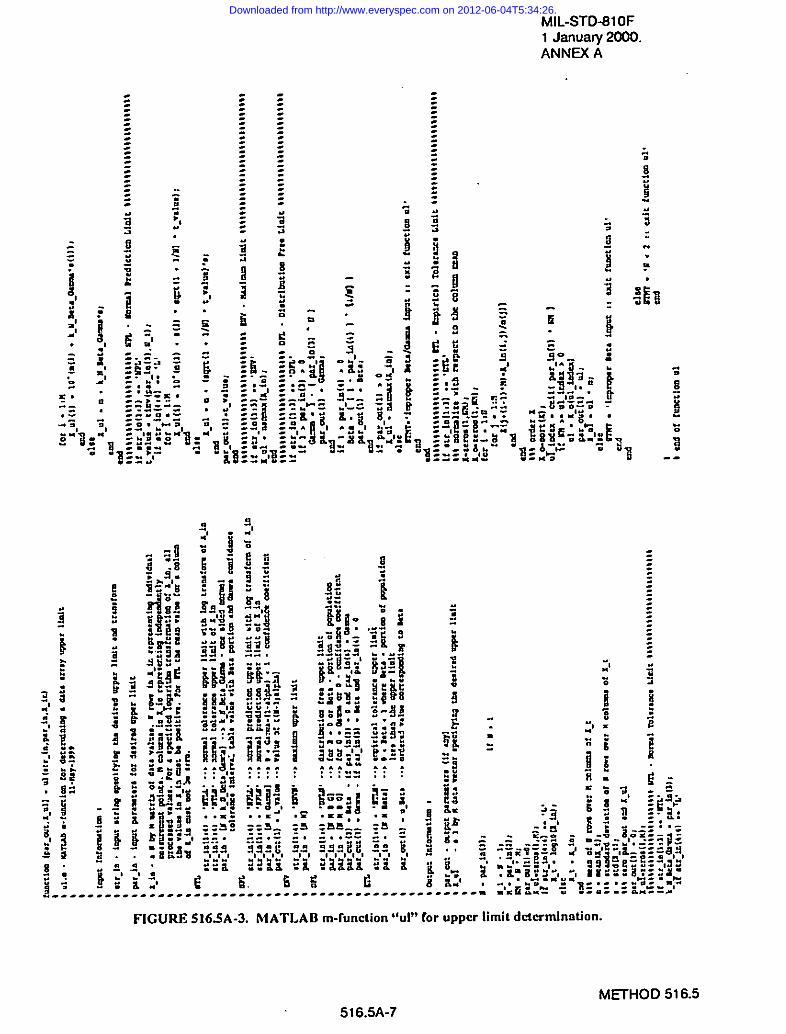
.
MIL-STD-61OF1 Januafy 2000.ANNEX A
FIGURE 516-5A-3. MATLAB m-function “uI’> for upper limit dctcrminntlon.
M~HOD 516.5
516.5A-7
Downloaded from http://www.everyspec.com on 2012-06-04T5:34:26.
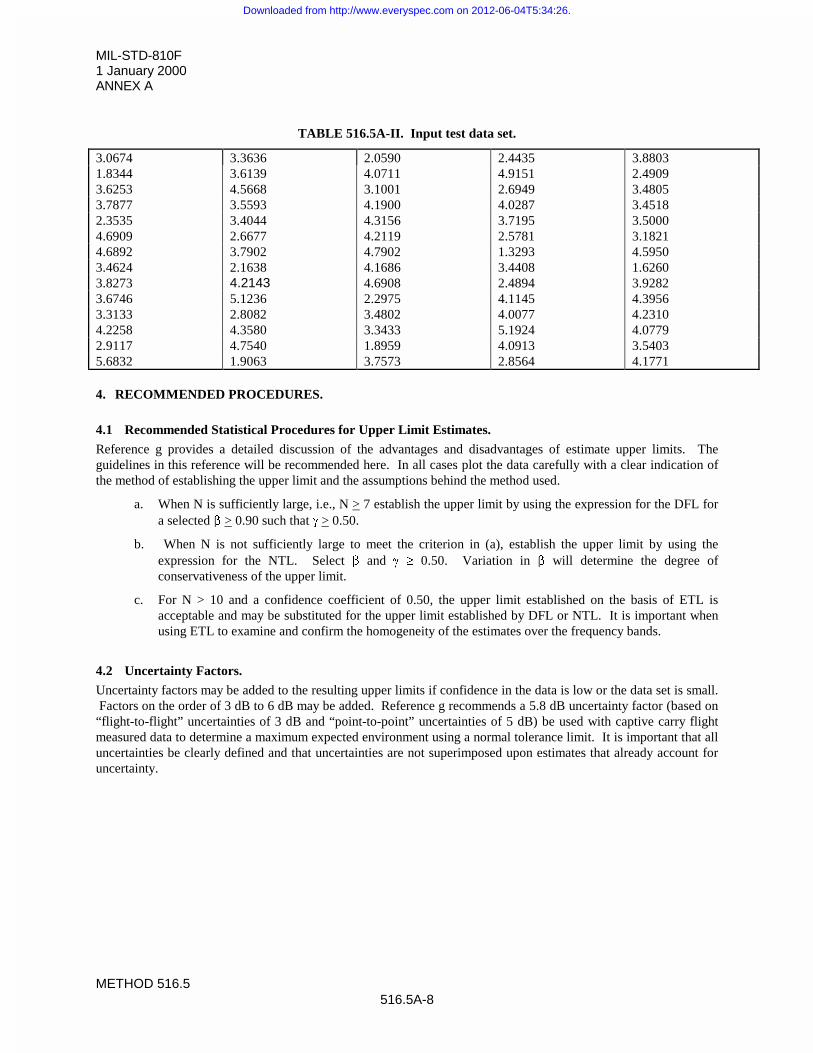
MIL-STD-810F1 January 2000ANNEX A
METHOD 516.5516.5A-8
TABLE 516.5A-II. Input test data set.
3.0674 3.3636 2.0590 2.4435 3.88031.8344 3.6139 4.0711 4.9151 2.49093.6253 4.5668 3.1001 2.6949 3.48053.7877 3.5593 4.1900 4.0287 3.45182.3535 3.4044 4.3156 3.7195 3.50004.6909 2.6677 4.2119 2.5781 3.18214.6892 3.7902 4.7902 1.3293 4.59503.4624 2.1638 4.1686 3.4408 1.62603.8273 4.2143 4.6908 2.4894 3.92823.6746 5.1236 2.2975 4.1145 4.39563.3133 2.8082 3.4802 4.0077 4.23104.2258 4.3580 3.3433 5.1924 4.07792.9117 4.7540 1.8959 4.0913 3.54035.6832 1.9063 3.7573 2.8564 4.1771
4. RECOMMENDED PROCEDURES.
4.1 Recommended Statistical Procedures for Upper Limit Estimates.
Reference g provides a detailed discussion of the advantages and disadvantages of estimate upper limits. Theguidelines in this reference will be recommended here. In all cases plot the data carefully with a clear indication ofthe method of establishing the upper limit and the assumptions behind the method used.
a. When N is sufficiently large, i.e., N > 7 establish the upper limit by using the expression for the DFL fora selected E > 0.90 such that J > 0.50.
b. When N is not sufficiently large to meet the criterion in (a), establish the upper limit by using theexpression for the NTL. Select E and J t 0.50. Variation in E will determine the degree ofconservativeness of the upper limit.
c. For N > 10 and a confidence coefficient of 0.50, the upper limit established on the basis of ETL isacceptable and may be substituted for the upper limit established by DFL or NTL. It is important whenusing ETL to examine and confirm the homogeneity of the estimates over the frequency bands.
4.2 Uncertainty Factors.
Uncertainty factors may be added to the resulting upper limits if confidence in the data is low or the data set is small. Factors on the order of 3 dB to 6 dB may be added. Reference g recommends a 5.8 dB uncertainty factor (based on“flight-to-flight” uncertainties of 3 dB and “point-to-point” uncertainties of 5 dB) be used with captive carry flightmeasured data to determine a maximum expected environment using a normal tolerance limit. It is important that alluncertainties be clearly defined and that uncertainties are not superimposed upon estimates that already account foruncertainty.
Downloaded from http://www.everyspec.com on 2012-06-04T5:34:26.

MIL-STD-810F1 January 2000ANNEX B
METHOD 516.5516.5B-1
ANNEX B
EFFECTIVE SHOCK DURATION
1. SCOPE.
1.1 Purpose.
This annex provides a basis and justification for the selection of the definition of an effective shock duration, Te.
1.2 Application.
Information in this annex is directed towards selection of an effective shock duration for laboratory testing basedupon measured data. Replication of field measured environments in the laboratory by use of synthesized complextransients on shaker control systems requires (1) satisfaction of the field measured SRS amplitude and (2)correspondence between the duration of the field measured transient and the laboratory synthesized transient. Incertain cases it may be apparent that one amplitude-varying shock over a long duration may actually be two or moredistinct shocks over the duration. The requirements for deciding if field measured data should be replicated in thelaboratory as a single shock or as multiple shocks are (1) a clear understanding of the physical phenomenon behindthe field measured environment along with an understanding of the frequency characteristics of the test item, and (2)the judgement of an experienced analyst.
2. DEVELOPMENT.
2.1 Assumptions on Shock Envelope Development.
The shock duration is essentially determined by the form of the envelope of the absolute value of the measured peaksof the shock time history. This tacitly assumes that for a shock time history the distribution of the positive andnegative peaks of the shock time history are essentially the same, i.e., the shock time history is symmetrical withrespect to polarity. It should be clear that the envelope of these peaks in general is a complex piecewise continuousfunction that has no simple analytical description. Figure 516.5B-1a displays a typical shock time history along withits envelope and two sets of vertical lines – one indicating the duration of TE and the other the duration of Te. Figure516.5B-1b displays short time average RMS along with one set of vertical lines indicating the duration of Te. In thedevelopment to follow it is assumed that the measured shock transient peak distribution in time has an initial segmentcharacterized by a rise time (tr) and a following segment characterized by a decay time (td) where in general td >tr. Itis assumed that the envelope of the initial peak amplitude distribution normalized to the absolute value of themaximum peak acceleration, Ap, is of a third order polynomial form
3
3
2
21)( ���
����
����
�
����
����
�
����
��
rrr t
ta
t
ta
t
tate
r 0 < t < tr and a1 + a2 + a3 = 1
It is assumed that the envelope of the trailing segment is characterized by a simple exponentially decaying functionnormalized to Ap
¸¹
ᬩ
§�
�1
)( rt
t
j eteD
tr < t < tr + tj
The initial segment has three degrees of freedom for fitting whereas the trailing segment has one degree of freedom.The segments will, in general, have a much more complex form than is representable by the simple expressions er(t)and ej(t). In general, the SRS amplitudes in the high frequency region are more sensitive to the initial segment formthan the trailing segment form whereas the low frequency SRS amplitudes are sensitive to both the duration of thetrailing segment and to the form of the trailing segment.
Downloaded from http://www.everyspec.com on 2012-06-04T5:34:26.
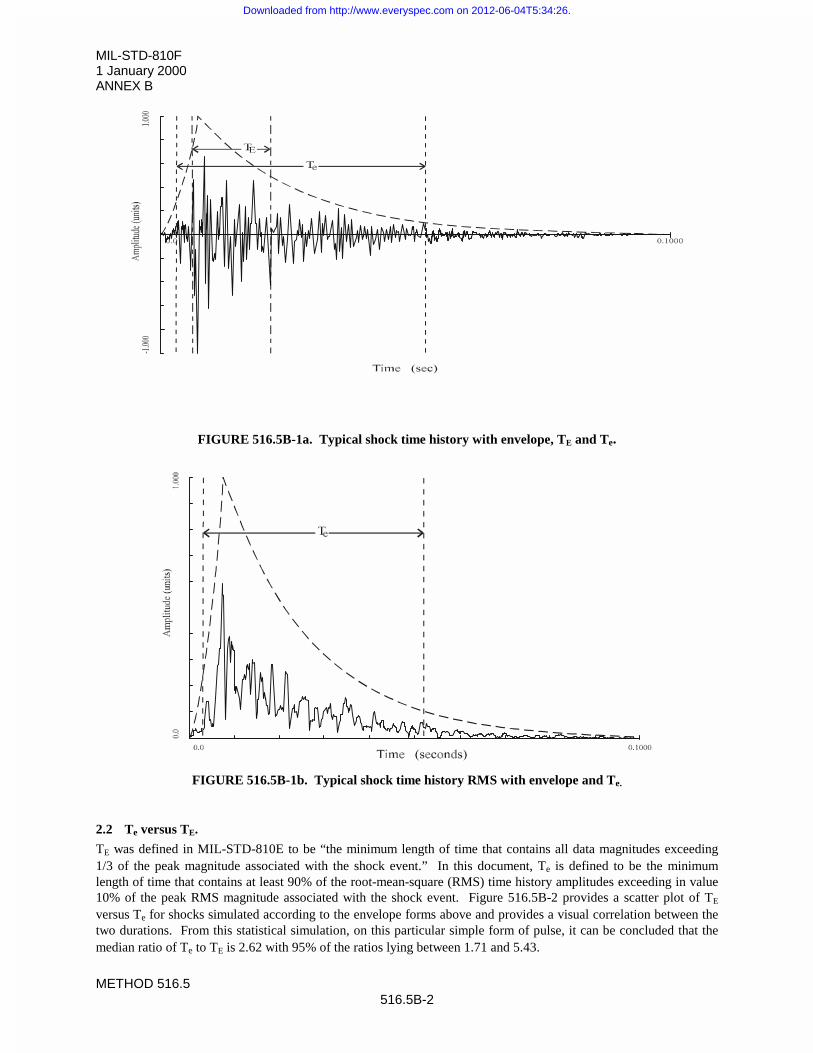
MIL-STD-810F1 January 2000ANNEX B
METHOD 516.5516.5B-2
FIGURE 516.5B-1a. Typical shock time history with envelope, TE and Te.
FIGURE 516.5B-1b. Typical shock time history RMS with envelope and Te.
2.2 Te versus TE.
TE was defined in MIL-STD-810E to be “the minimum length of time that contains all data magnitudes exceeding1/3 of the peak magnitude associated with the shock event.” In this document, Te is defined to be the minimumlength of time that contains at least 90% of the root-mean-square (RMS) time history amplitudes exceeding in value10% of the peak RMS magnitude associated with the shock event. Figure 516.5B-2 provides a scatter plot of TE
versus Te for shocks simulated according to the envelope forms above and provides a visual correlation between thetwo durations. From this statistical simulation, on this particular simple form of pulse, it can be concluded that themedian ratio of Te to TE is 2.62 with 95% of the ratios lying between 1.71 and 5.43.
Downloaded from http://www.everyspec.com on 2012-06-04T5:34:26.
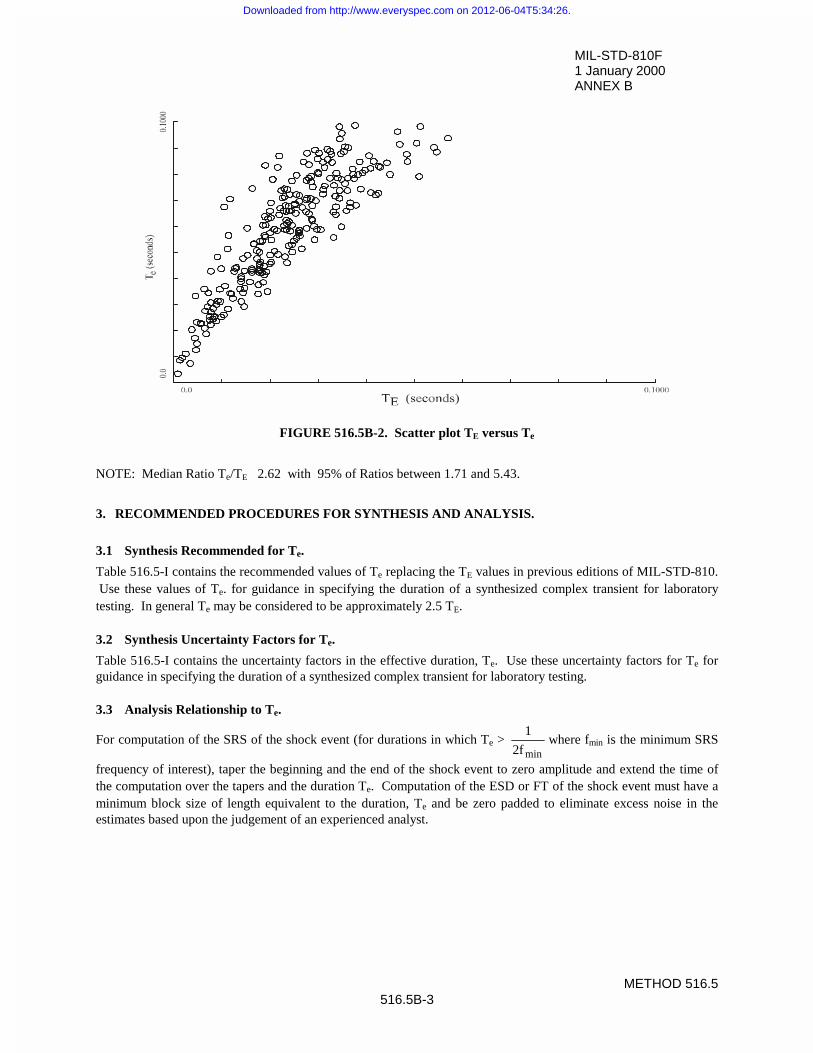
MIL-STD-810F1 January 2000ANNEX B
METHOD 516.5516.5B-3
FIGURE 516.5B-2. Scatter plot TE versus Te
NOTE: Median Ratio Te/TE 2.62 with 95% of Ratios between 1.71 and 5.43.
3. RECOMMENDED PROCEDURES FOR SYNTHESIS AND ANALYSIS.
3.1 Synthesis Recommended for Te.
Table 516.5-I contains the recommended values of Te replacing the TE values in previous editions of MIL-STD-810. Use these values of Te. for guidance in specifying the duration of a synthesized complex transient for laboratorytesting. In general Te may be considered to be approximately 2.5 TE.
3.2 Synthesis Uncertainty Factors for Te.
Table 516.5-I contains the uncertainty factors in the effective duration, Te. Use these uncertainty factors for Te forguidance in specifying the duration of a synthesized complex transient for laboratory testing.
3.3 Analysis Relationship to Te.
For computation of the SRS of the shock event (for durations in which Te > minf2
1where fmin is the minimum SRS
frequency of interest), taper the beginning and the end of the shock event to zero amplitude and extend the time ofthe computation over the tapers and the duration Te. Computation of the ESD or FT of the shock event must have aminimum block size of length equivalent to the duration, Te and be zero padded to eliminate excess noise in theestimates based upon the judgement of an experienced analyst.
Downloaded from http://www.everyspec.com on 2012-06-04T5:34:26.

MIL-STD-810F1 January 2000ANNEX B
METHOD 516.5516.5B-4
THIS PAGE INTENTIONALLY BLANK
Downloaded from http://www.everyspec.com on 2012-06-04T5:34:26.
MIL-STD-810F1 January 2000ANNEX C
METHOD 516.5516.5C-1
ANNEX C
AUTOSPECTRAL DENSITY WITH EQUIVALENT TESTSHOCK RESPONSE SPECTRA
1. SCOPE.
1.1 Purpose.
This Annex provides information for determination if a field measured or predicted stationary random vibration ASDprovides an environment that exceeds that for a field measured or predicted shock.
1.2 Application.
For field measured or predicted ASD data from high level stationary random vibration, if the data representative timehistory is such that it exceeds substantially the measured or predicted shock environment time history, the randomvibration test may be considered to provide an adequate test for the shock environment. Perform only the stationaryrandom vibration test.
2. DEVELOPMENT.
2.1 Assumptions on Autospectral Density.
Figure 516.5-9 provides two ASD plots for functional tests for ground materiel and flight materiel. Figures 516.5C-1a and 516.5C-1b provide the associated simulated Gaussian stationary amplitude time history segments over a 25ms period of time for the ground materiel and the flight materiel, respectively.
2.2 Assumptions on Shock Response Spectra.
Figures 516.5C-2a and 516.5C-2b provide the associated SRS plots for 250 simulations of the time histories onfigure 516.5C-1a and 516.5C-1b, respectively. In particular, the SRS plots represent the mean SRS and the upperand lower distribution free tolerance intervals based upon a 98% proportion of population with a 92% confidencecoefficient and the SRS spectra specified on figure 516.5-8. The SRS were computed for a Q=5 over approximatelyone second time interval, i.e., 10 times the period of the lowest frequency represented on figure 516.5-9.
3. RECOMMENDED PROCEDURES.
3.1 Recommended for ASD.
For measured stationary random vibration data, compute the ASD and compare with the ASD of figure 516.5-9. Ifthe measured ASD exceeds the ASD in this figure at every frequency with a maximum 5 Hz analysis filterbandwidth, perform only the random vibration test on the equipment.
3.2 Recommended for SRS.
For measured stationary random vibration data compute the ASD and compare with the ASD of figure 516.5-9. Ifthe measured ASD does not exceed the ASD on this figure at every frequency with a maximum 5 Hz analysis filterbandwidth, sample the measured random vibration data and proceed to compute an SRS over a selected period oftime no shorter than 10 times the period of the lowest frequency represented on figure 516.5-9. If the SRS exceedsthe SRS of figure 516.5-8 at every frequency, consider the random vibration test adequate. If the SRS does notexceed the SRS of figure 516.5-8 at every frequency, proceed to generate a complex transient from either fieldmeasured or predicted SRS data in order to test the equipment for shock.
Downloaded from http://www.everyspec.com on 2012-06-04T5:34:26.
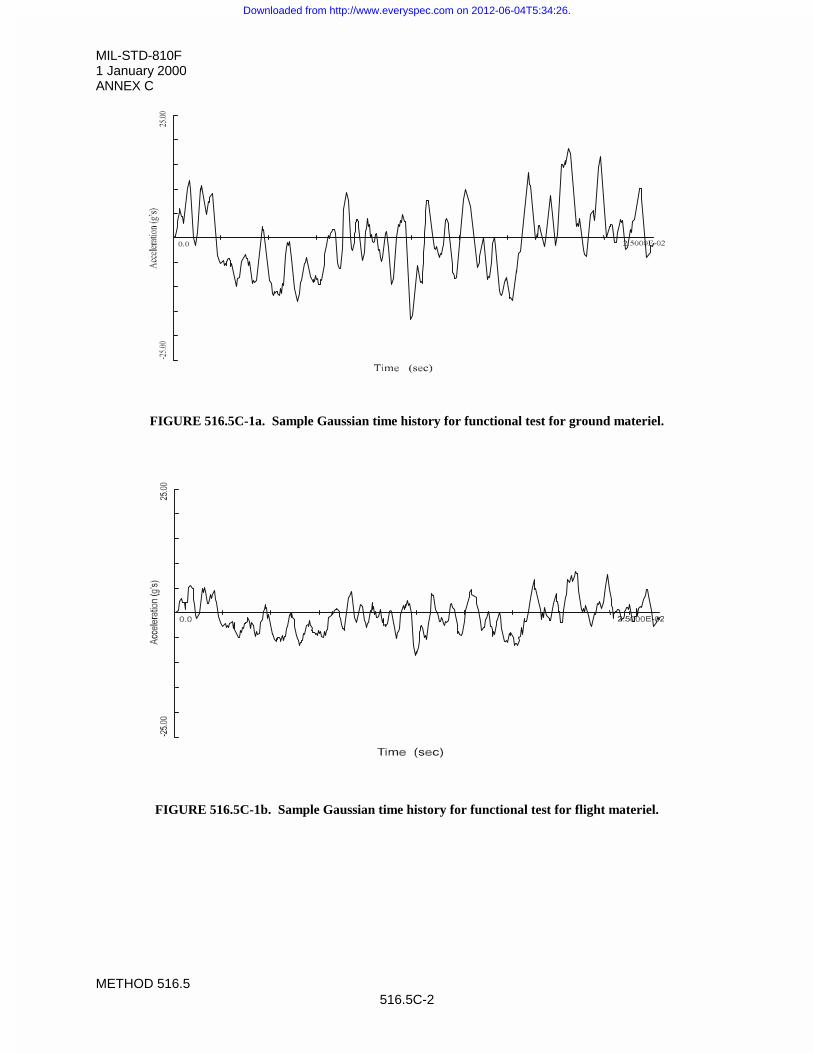
MIL-STD-810F1 January 2000ANNEX C
METHOD 516.5516.5C-2
FIGURE 516.5C-1a. Sample Gaussian time history for functional test for ground materiel.
FIGURE 516.5C-1b. Sample Gaussian time history for functional test for flight materiel.
Downloaded from http://www.everyspec.com on 2012-06-04T5:34:26.
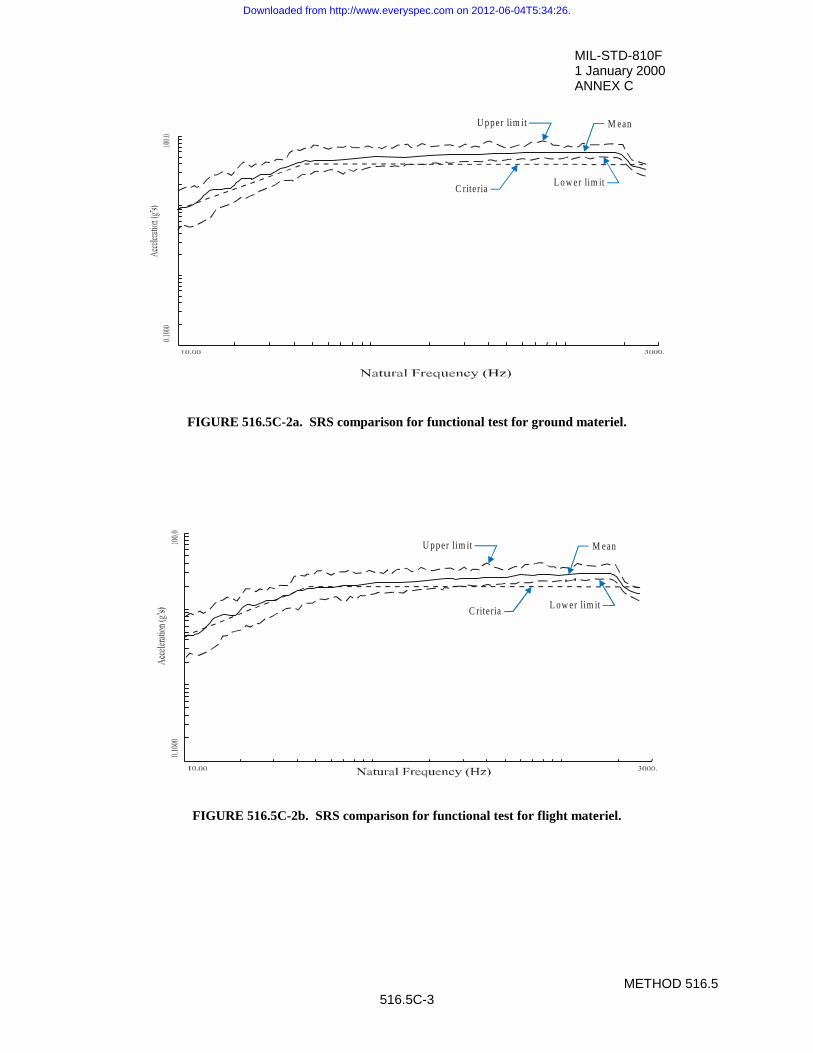
MIL-STD-810F1 January 2000ANNEX C
METHOD 516.5516.5C-3
FIGURE 516.5C-2a. SRS comparison for functional test for ground materiel.
FIGURE 516.5C-2b. SRS comparison for functional test for flight materiel.
C riteriaL ow er lim it
U pper lim it M ean
C riteriaL ow er lim it
U pper lim it M ean
Downloaded from http://www.everyspec.com on 2012-06-04T5:34:26.

MIL-STD-810F1 January 2000ANNEX C
METHOD 516.5516.5C-4
THIS PAGE INTENTIONALLY BLANK
Downloaded from http://www.everyspec.com on 2012-06-04T5:34:26.
MIL-STD-810F1 January 2000
METHOD 517517-1
METHOD 517
PYROSHOCK
NOTE: Tailoring is essential. Select methods, procedures, and parameter levels based on the tailoring processdescribed in Part One, paragraph 4, and Appendix C. Apply the general guidelines for laboratory test methodsdescribed in Part One, paragraph 5 of this standard.
1. SCOPE.
1.1 Purpose.
Pyroshock tests involving pyrotechnic (explosive- or propellant-activated) devices are performed to:
a. provide a degree of confidence that materiel can structurally and functionally withstand the infrequentshock effects caused by the detonation of a pyrotechnic device on a structural configuration to which themateriel is mounted.
b. experimentally estimate the materiel's fragility level in relation to pyroshock in order that shockmitigation procedures may be employed to protect the materiel’s structural and functional integrity.
1.2 Application.
1.2.1 Pyroshock.
Pyroshock is often referred to as pyrotechnic shock. For the purpose of this document, initiation of a pyrotechnicdevice will result in an effect that is referred to as a “pyroshock.” “Pyroshock” refers to the localized intensemechanical transient response of materiel caused by the detonation of a pyrotechnic device on adjacent structures. Anumber of devices are capable of transmitting such intense transients to a materiel. In general, the sources may bedescribed in terms of their spatial distribution - point sources, line sources and combined point and line sources(reference a). Point sources include explosive bolts, separation nuts, pin pullers and pushers, bolt and cable cuttersand pyro-activated operational hardware. Line sources include flexible linear shape charges (FLSC), mild detonatingfuses (MDF), and explosive transfer lines. Combined point and line sources include V-band (Marmon) clamps. Theloading from the pyrotechnic device may be accompanied by the release of structural strain energy from structurepreload or impact among structural elements as a result of the activation of the pyrotechnic device. Use this methodto evaluate materiel likely to be exposed to one or more pyroshocks in its lifetime. Pyroshocks are generally within afrequency range between 100 Hz and 1,000,000 Hz, and a time duration from 50 microseconds to not more than 20milliseconds. Acceleration response amplitudes to pyroshock may range from 300 g to 300,000 g. The accelerationresponse time history to pyroshock will, in general, be very oscillatory and have a substantial rise time, approaching10 microseconds. In general, pyroshocks generate material stress waves that will excite materiel to respond to veryhigh frequencies with wavelengths on the order of sizes of micro electronic chip configurations. Because of thelimited velocity change in the structure brought about by firing of the pyrotechnic device, and the localized nature ofthe pyrotechnic device, structural resonances of materiel below 500 Hz will normally not be excited and the systemwill undergo very small displacements with small overall structural/mechanical damage. The pyroshock accelerationenvironment in the neighborhood of the materiel will usually be highly dependent upon the configuration of themateriel and the intervening structure. The materiel or its parts may be in the near-field or far-field of thepyrotechnic device with the pyroshock environment in the near-field being the most severe, and that in the far-fieldthe least severe. There is not unanimous agreement on classifying pyroshock intensity according to thecharacteristics of a “near-field” and a “far-field.” It has been suggested that three fields be used for intensityclassification, i.e., a "mid-field" in pyroshock intensity intervening between the “near-field” and the “far-field.” Thisdocument reflects the current consensus on other than spacecraft material to restrict pyroshock intensity classificationto “near-field” and “far-field” for which the definitions are provided in paragraph 1.2.3. In general, some structureintervenes between the materiel and location of the pyrotechnic device.
Downloaded from http://www.everyspec.com on 2012-06-04T5:34:26.
MIL-STD-810F1 January 2000
METHOD 517517-2
1.2.2 Pyroshock - momentum exchange.
Pyroshock usually exhibits no momentum exchange between two bodies (a possible exception is the transfer of strainenergy from stress wave propagation from a device through structure to the materiel). Pyroshock results inessentially no velocity change in the materiel support structure. Frequencies below 100 Hz are never of concern.The magnitude of a pyroshock response at a given point reasonably far from the pyrotechnic source is, among otherthings, a function of the size of the pyrotechnic charge. Pyroshock is a result of linear elastic material wavespropagating in the support structure to the materiel without plastic deformation of large portions of the structureexcept at the charge point or line. In general, joints and bolted connections representing structure discontinuitiestend to greatly attenuate the pyroshock amplitudes. With regard to measurement technology, accelerometers, straingages and laser velocimeters are commonly used devices for measurement. In processing pyroshock data, it isimportant to be able to detect anomalies. A part of this detection is the integration of the acceleration amplitude timehistory to determine if it has the characteristics of a high frequency velocity trace. Pyroshock is “designed” into themateriel by placement of pyroshock devices for specific utility. Because to a great extent the pyroshock environmentis clearly defined by the geometrical configuration and the charge or the activating device, pyroshock response ofmateriel in the field may be moderately predictable and repeatable for materiel (reference a.).
1.2.3 Pyroshock - physical phenomenon.
Pyroshock is a physical phenomenon characterized by the overall material and mechanical response at a structurepoint from either (a) an explosive device, or (b) a propellant activated device. Such a device may produce extremelocal pressure (with perhaps heat and electromagnetic emission) at a point or along a line. The device provides anear instantaneous generation of local, high-magnitude, nonlinear material strain rates with subsequent transmissionof high-magnitude/high frequency material stress waves producing high acceleration/low velocity and short durationresponse at distances from the point or line source. The characteristics of pyroshock are:
a. near-the-source stress waves in the structure caused by high material strain rates (nonlinear materialregion) propagate into the near-field and beyond;
b. high frequency (100 Hz-1,000,000 Hz) and very broadband frequency input;
c. high acceleration (300 g-300,000 g) but low structural velocity and displacement response;
d. short-time duration (<20 msec);
e. high residual structure acceleration response (after the event);
f. caused by (1) an explosive device or (2) a propellant activated device (releasing stored strain energy)coupled directly into the structure; (for clarification, a propellant activated device includes items such asa clamp that releases strain energy causing a structure response greater than that obtained from thepropellant detonation alone);
g. highly localized point source input or line source input;
h. very high structural driving point impedance (P/v, where P is the detonation large force or pressure, andv, the structural velocity, is very small). At the source, the material driving point impedance can besubstantially less for high material particle velocity;
i. response time histories that are random in nature, providing little repeatability and substantialdependency on the materiel configuration details;
j. response at points on the structure that are greatly affected by structural discontinuities;
k. materiel and structural response that may be accompanied by substantial heat and electromagneticemission (from ionization of gases during explosion);
l. the nature of the response to pyroshock that suggests the materiel or its components may be classified asbeing in the near-field or far-field of the pyrotechnic device. The terms “near-field” and “far-field” relateto the shock intensity at the response point and such intensity is a function of the distance from the sourceand the structural configuration between the source and the response point.
Downloaded from http://www.everyspec.com on 2012-06-04T5:34:26.
MIL-STD-810F1 January 2000
METHOD 517517-3
(1) Near-field. In the near-field of the pyrotechnic device, the structure material stress wavepropagation effects govern the response. In the near-field of an intense pyrotechnic device, themateriel or any portion of the materiel is within 15 cm (6 in) of the point of detonation of the deviceor a portion of it (in the case of a line charge). If there are no intervening structural discontinuities,the materiel may be expected to experience peak accelerations in excess of 5000 g’s and substantialspectral content above 100,000 Hz. The near-field of a less intense pyrotechnic device can beconsidered to be within 7.5 cm (3 in) with a subsequent reduction in the peak acceleration levels andspectral levels.
(2) Far-field. In the far-field of the pyrotechnic device, the pyroshock response is governed by acombination of material stress wave propagation and structural resonance response effects. For anintense pyrotechnic device, the materiel or any portion of the materiel is beyond 15 cm (6 in) fromthe device. If there are no intervening structural discontinuities, the materiel may be expected toexperience peak accelerations between 1000 g’s and 5000 g’s, and substantial spectral content above10,000 Hz. The far-field of a less intense pyrotechnic device can be considered to be beyond 7.5 cm(3 in) with a subsequent reduction in the peak acceleration levels and spectral levels.
1.3 Limitations.
Because of the highly specialized nature of pyroshock, apply it only after giving careful consideration to informationcontained in references a, b, c, and d.
a. This method does not include the shock effects experienced by materiel as a result of any mechanicalshock/transient vibration, shipboard shock, or EMI shock. For these types of shocks, see the appropriatemethods in this or other standards.
b. This method does not include the effects experienced by fuze systems that are sensitive to shock frompyrotechnic devices. Shock tests for safety and operation of fuzes and fuse components may beperformed in accordance with MIL-STD-331.
c. This method does not include special provisions for performing pyroshock tests at high or lowtemperatures. Perform tests at room ambient temperature unless otherwise specified or if there is reasonto believe either operational high temperature or low temperature may enhance the pyroshockenvironment.
d. This method does not include guidance related to unplanned test interruption as a result of pyroshockdevice or mechanical test equipment malfunction in cases in which the pyroshock is being mechanicallysimulated. Generally, if the pyroshock device malfunctions or interruption occurs during a mechanicalshock pulse, repeat that shock pulse. Care must be taken to ensure stresses induced by the interruptedshock pulse do not invalidate subsequent test results. Inspect the overall integrity of the materiel toensure pre-shock test materiel structural and functional integrity. Record and analyze data from suchinterruptions before continuing with the test sequence.
e. This method is not intended to be applied to manned space vehicle testing (see reference a).
f. This method does not address secondary effects such as induced blast, EMI, and thermal effects.
g. This method does not apply to effects of hostile weapon penetration or detonation.
2. TAILORING GUIDANCE.
2.1 Selecting the Pyroshock Method.
After examining requirements documents and applying the tailoring process in Part One of this standard to determinewhere pyroshock effects are foreseen in the life cycle of the materiel, use the following to confirm the need for thismethod and to place it in sequence with other methods.
Downloaded from http://www.everyspec.com on 2012-06-04T5:34:26.
MIL-STD-810F1 January 2000
METHOD 517517-4
2.1.1 Effects of pyroshock.
In general, pyroshock has the potential for producing adverse effects on all electronic materiel. The level of adverseeffects generally increases with the level and duration of the pyroshock, and decreases with the distance from thesource (pyrotechnic device) of the pyroshock. Durations for pyroshock that produce material stress waves withwavelengths that correspond with the natural frequency wavelengths of micro electronic components within materielwill enhance adverse effects. In general, the structural configuration merely transmits the elastic waves and isunaffected by the pyroshock. Examples of problems associated with pyroshock follow, but the list is not intended tobe all-inclusive.
a. materiel failure as a result of destruction of the structural integrity of micro electronic chips;
b. materiel failure as a result of relay chatter;
c. materiel failure as a result of circuit card malfunction, circuit card damage, and electronic connectorfailure. On occasion, circuit card contaminants having the potential to cause short circuits may bedislodged under pyroshock.
d. materiel failure as a result of cracks and fracture in crystals, ceramics, epoxies, or glass envelopes.
2.1.2 Sequence among other methods.
a. General. See Part One, paragraph 5.5.
b. Unique to this method. Unless otherwise displayed in the life cycle profile and, since pyroshock isnormally experienced near the end of the life cycle, schedule pyroshock tests late in the test sequence. Ingeneral, the pyroshock tests can be considered independent of the other tests because of their uniquenature.
2.2 Selecting a Procedure.
This method includes four pyroshock test procedures:
a. Procedure I - Near-field with an actual configuration. Replication of pyroshock for the near-fieldenvironment using the actual materiel and the associated pyrotechnic shock test device configuration.
b. Procedure II - Near-field with a simulated configuration. Replication of pyroshock for the near-fieldenvironment using the actual materiel but with the associated pyrotechnic shock test device isolated fromthe test item, e.g., by being mounted on the back of a flat steel plate. (This normally will minimizetesting costs because fewer materiel configurations and/or platforms associated with the test item will bedamaged. This can be used for repeated tests at varying pyroshock levels.)
c. Procedure III - Far-field with a mechanical test device. Replication of pyroshock for the far-fieldenvironment with a mechanical device that simulates the pyroshock peak acceleration amplitudes andfrequency content (other than an electrodynamic shaker because of frequency range limitations of theelectrodynamic shaker).
d. Procedure IV - Far-field with an electrodynamic shaker. Replication of pyroshock for the far-fieldenvironment using an electrodynamic shaker to simulate the comparatively low frequency structuralresonant response to the pyroshock.
2.2.1 Procedure selection considerations.
Based on the test data requirements, determine which test procedure is applicable. In most cases, the selection of theprocedure will be dictated by the actual materiel configuration, carefully noting any structural discontinuities thatmay serve to mitigate the effects of the pyroshock on the materiel. In some cases, the selection of the procedure willbe driven by test practicality. Consider all pyroshock environments anticipated for the materiel during its life cycle,both in its logistic and operational modes. When selecting procedures, consider:
a. The operational purpose of the materiel. From the requirements documents, determine the functions tobe performed by the materiel either during or after exposure to the pyroshock environment.
Downloaded from http://www.everyspec.com on 2012-06-04T5:34:26.
MIL-STD-810F1 January 2000
METHOD 517517-5
b. The natural exposure circumstances for pyroshock. Determine if the materiel or portion of the materiellies within the near-field or far-field of the pyrotechnic device. If the materiel or a portion of the materiellies within the near-field of the pyrotechnic device, no special isolation of the materiel exists and, if thereare no prior measured field data, apply only Procedure I or II. If no portion of the materiel lies within thenear-field of the pyrotechnic device and measured field data exist, apply Procedure III if the processedfield data supports the amplitude and frequency range capabilities of the test devices. If the entiremateriel lies within the far-field and is subject to structural response, only apply Procedure IV if theprocessed data supports the comparatively low frequency range (to 3000 Hz) of an electrodynamicshaker. If the entire materiel lies within the far-field and the processed data does not support theelectrodynamic shaker comparatively low frequency range, apply Procedure III. In any case, one testwill be considered sufficient for testing over the entire amplitude and frequency range of exposure of themateriel. Do not break up any measured or predicted response to pyroshock into separate frequencyranges for the purpose of applying different testing procedures to different frequency ranges.
c. Required data. The test data required to verify that the materiel will survive and function as intended.
d. Procedure sequence. Refer to paragraph 2.1.2.
2.2.2 Difference among procedures.
a. Procedure I - Near-field with Actual Configuration. Procedure I is intended to test materiel (includingmechanical, electrical, hydraulic, and electronic) in its functional mode and actual configuration(materiel/pyrotechnic device physical configuration), and to ensure it can survive and function asrequired when tested using the actual pyrotechnic test device in its intended installed configuration. InProcedure I, it is assumed that the materiel or a portion of the materiel resides within the near-field of thepyrotechnic device.
b. Procedure II - Near-field with Simulated Configuration. Procedure II is intended to test materiel(including mechanical, electrical, hydraulic, and electronic) in its functional mode but with a simulatedstructural configuration, and to ensure it can survive and function as required when in its actualmateriel/pyrotechnic device physical configuration. In this procedure it is assumed that some part of themateriel lies within the near-field of an intense or less intense pyrotechnic device. Make every attempt touse this procedure to duplicate the actual platform/materiel structural configuration by way of a full-scaletest. If this is too costly or impractical, employ scaled tests provided that in the process of scaling,important configuration details are not omitted. In particular, only the structure portion directlyinfluencing the materiel may be involved in the test, provided it can be reasonably assumed that theremainder of the structure will not influence materiel response. On occasion, for convenience, a specialpyrotechnic testing device may be employed for testing the materiel, e.g., a flat steel plate to which themateriel is mounted and the pyrotechnic charge is attached.
c. Procedure III - Far-field Using a Mechanical Test Device. Pyroshock can be applied utilizingconventional high acceleration amplitude/frequency test input devices. Reference c provides a source ofalternative test input devices, their advantages, and limitations. In this procedure, it is assumed that allparts of the materiel lie in the far-field of the pyrotechnic device. Consult reference c for guidelines andconsiderations for such testing.
d. Procedure IV - Far-field Using an Electrodynamic Shaker. On occasion, pyroshock response can bereplicated utilizing conventional electrodynamic shakers. In this procedure, it is assumed that all parts ofthe materiel lie in the far-field of the pyrotechnic device, and the materiel is subject to the structureplatform resonant response alone.
2.3 Determine Test Levels and Conditions.
Having selected one of the four pyroshock procedures (based on the materiel’s requirements documents and thetailoring process), complete the tailoring process by identifying appropriate parameter levels, applicable testconditions and applicable test techniques for that procedure. Exercise extreme care in consideration of the details inthe tailoring process. Base these selections on the requirements documents, the Life Cycle Environmental Profile,
Downloaded from http://www.everyspec.com on 2012-06-04T5:34:26.
MIL-STD-810F1 January 2000
METHOD 517517-6
the Operational Environment Documentation (see Part One, figure 1-1), and information provided with thisprocedure. Consider the following basic information when selecting test levels.
2.3.1 General considerations - terminology.
a. In general, response acceleration will be the experimental variable of measurement for pyroshock.However, this does not preclude other variables of measurement such as velocity, displacement, or strainfrom being measured and processed in an analogous manner, as long as the interpretation, capabilities,and limitations of the measurement variable and measurement system are well-defined. Pay particularattention to the high frequency environment generated by the pyrotechnic device and the capabilities ofthe measurement system to faithfully record the materiel’s responses. References a and b detail thetradeoffs among pyroshock measurement techniques. In any case, implement the guidelines in referenceb. For the purpose of this method, the terms that follow will be helpful in the discussion relative toanalysis of response measurements from pyroshock testing. To facilitate the definition of the terms, eachof the terms is illustrated for a typical pyroshock measurement. Figure 517-1 provides an accelerationtime history plot of a measured far-field pyroshock with the instrumentation noise floor displayed beforethe pyroshock, the pyroshock, and the subsequent post-pyroshock noise floor. It is important to providemeasurement data including both the pre-pyroshock noise measurement and the post-pyroshockcombined noise and low level residual structure response. The vertical lines at three discrete times areused to identify a “short duration” truncated pyroshock response and a “long duration” pyroshockresponse. The pre-pyroshock time interval, before the first vertical line, contains the instrumentationsystem noise floor and serves as a measurement signal reference level. The pyroshock time intervalincludes all the significant response energy of the event. The post-pyroshock time interval, after the thirdvertical line, is of equal duration to the pre-pyroshock time interval and contains the measurement systemnoise in addition to some of the pyroshock residual noise considered inconsequential to the responseenergy in the pyroshock. In cases in which the pre-pyroshock and the post-pyroshock amplitude levelsare substantial compared to the pyroshock (the pyroshock has been mitigated and/or the measurementsystem noise is high), the identification of the pyroshock may be difficult and engineering judgment mustbe used relative to determining the start and the termination of the pyroshock event. In any case, analysisof pre-pyroshock and post-pyroshock measurement information in conjunction with the pyroshockmeasurement information is essential. Validate all data collected from a pyroshock. Reference bprovides guidelines for this. Perhaps one of the simplest and most sensitive criteria for validation is anintegration of the signal time history after removing any small residual offset. If the resulting integratedsignal has zero crossings and does not appear to monotonically increase, the pyroshock has passed thisvalidation test. Figure 517-2 provides the velocity plot for the long duration pyroshock on figure 517-1.
(1) Effective transient duration: The "effective transient duration," Te, is the minimum length of timewhich contains all significant amplitude time history magnitudes beginning at the noise floor of theinstrumentation system just prior to the initial most significant measurement, and proceeding to thepoint that the amplitude time history is a combination of measurement noise and substantiallydecayed structural response. In general, an experienced analyst is required to determine thepertinent measurement information to define the pyroshock event. The longer the duration of thepyroshock, the more low frequency information is preserved which may be important in far-field testconsiderations for the pyroshock. For near-field test considerations, in general, the effectivetransient duration will be much shorter because of the higher ranging of the measurement system.The amplitude criterion requires that the amplitude of the post-pyroshock amplitude time historyenvelope be no more than 12 dB above the noise floor of the measurement system depicted in thepre-pyroshock amplitude time history. From figure 517-1 there appear to be at least two logical timeintervals for the duration of the pyroshock. The first duration is immediately after the end of thehigh frequency information - the second vertical line on figure 517-1 at approximately 3.5milliseconds after the beginning of the pyroshock. The second duration is given by the third verticalline on figure 517-1, some 6.6 milliseconds after the beginning of the pyroshock and after some ofthe apparent low frequency structural response has been attenuated - the third vertical line on figure517-1. These judgments based on examination of the amplitude time history utilized an amplitudecriterion and a low frequency criterion. Figure 517-3 contains a plot of amplitude of the absolute
Downloaded from http://www.everyspec.com on 2012-06-04T5:34:26.
MIL-STD-810F1 January 2000
METHOD 517517-7
value of the pyroshock in dB versus time. This figure illustrates the difficulty in coming up withprecise criteria for determining the effective duration of a pyroshock. The initial noise floor level isnever obtained after the long duration pyroshock. Figure 517-4 illustrates the difference betweenSRS processing of two different pyroshock durations on figure 517-1, with the SRS, i.e., the shortduration pyroshock (3.5 ms), and the long duration pyroshock (6.6 ms). It is clear that the onlysignificant difference is near 100 Hz. The magnitude of the SRS at selected natural frequencies(particularly high frequencies) can be quite insensitive to the effective transient duration.
(2) Shock Response Spectrum analysis: Reference e defines the absolute acceleration maximax ShockResponse Spectrum (SRS) and provides examples of SRS computed for classical pulses. The SRSvalue at a given undamped oscillator natural frequency, fn, is defined to be the absolute value of themaximum of the positive and negative acceleration responses of a mass for a given base input to adamped single degree of freedom system. The base input is the measured shock over a specifiedduration (the specified duration should be the effective transient duration, Te). For processing ofpyroshock response data, the absolute acceleration maximax SRS has become the primary analysisdescriptor. In this measurement description of the pyroshock, the maximax absolute accelerationvalues are plotted on the ordinate with the undamped natural frequency of the single degree offreedom system with base input plotted along the abscissa. A more complete description of thepyroshock (and potentially more useful for pyroshock damage comparison in the far-field) can beobtained by determining the maximax pseudo-velocity response spectrum and plotting this on four-coordinate paper where, in pairs of orthogonal axes, (1) the maximax pseudo-velocity responsespectrum is represented by the ordinate with the undamped natural frequency being the abscissa, and(2) the maximax absolute acceleration along with the maximax pseudo-displacement plotted in a pairof orthogonal axes (reference e). The maximax pseudo-velocity at a particular oscillator undampednatural frequency is thought to be more representative of the damage potential for a shock since itcorrelates with stress and strain in the elements of a single degree of freedom system (references f, g,and h). The maximax pseudo-velocity response spectrum can be computed either by (1) dividing themaximax absolute acceleration response spectrum by the undamped natural frequency of the singledegree of freedom system, or (2) multiplying the maximax relative displacement by the undampednatural frequency of the single degree of freedom system. Both means of computation provideessentially the same spectra except possibly in the lower frequency region, in which case the secondmethod of computation is more basic to the definition of the maximax pseudo-velocity responsespectrum. Figure 517-5 provides the estimate of the maximax absolute acceleration SRS for thepyroshock record on figure 517-1. Figure 517-6 provides the estimate of the maximax pseudo-velocity for this record on four-coordinate paper. Note that information below 100 Hz is notconsidered valid for processing in these measurements. In general, compute the SRS over thepyroshock event duration and over the same duration for the pre-pyroshock and the post-pyroshockevents with twelfth octave spacing and a Q = 10 (Q=10 corresponds to a single degree of freedomsystem with 5% critical damping). If the testing is to be used for laboratory simulation, use a secondQ value of 50 (Q=50 corresponds to a single degree of freedom system with 1% critical damping) inthe processing. It is recommended that the maximax absolute acceleration SRS be the primarymethod of display for the pyroshock, with the maximax pseudo-velocity SRS as the secondarymethod of display and useful in cases in which it is desirable to correlate damage of simple systemswith the pyroshock.
(3) Energy Spectral Density: Reference a mentions the Energy Spectral Density (ESD) estimate for apyroshock of duration Te. In this description, the properly scaled magnitude of the FourierTransform of the total pyroshock is computed at a uniformly spaced set of frequencies and displayedas a two-dimensional plot of amplitude versus frequency. The amplitude units are (units2-sec/Hz).In determining the ESD estimate, it is important that the Fast Fourier Transform block size is pickedsuch that all of the pyroshock event is contained within the block but excessive noise beyond theduration of the pyroshock be removed by zero-padding within the block. The ESD description isuseful for comparing the distribution of energy within the frequency band among severalpyroshocks. However, if adjacent frequency components are not averaged, the percentage ofnormalized random error in the ordinate is 100%. By averaging n adjacent ordinates, the percentage
Downloaded from http://www.everyspec.com on 2012-06-04T5:34:26.
MIL-STD-810F1 January 2000
METHOD 517517-8
of normalized random error decreases as n1 with a decreased frequency resolution. Computation
of the ESD estimates for the pre-pyroshock and the post-pyroshock provide useful informationrelative to the distinct frequency character of the pyroshock as compared to the frequency characterof the pre-pyroshock noise and the post-pyroshock combination noise and structural response.Figure 517-7 provides ESD estimates for the pyroshock and the pre-pyroshock and post-pyroshockevents on figure 517-1.
(4) Fourier Spectra: Reference a mentions the Fourier Spectra (FS) estimate for a pyroshock of durationTe. In this description, the properly scaled square root of the magnitude of the Fourier Transform ofthe total pyroshock is computed at a uniformly spaced set of frequencies and displayed as a two-dimensional plot of amplitude versus frequency. The amplitude units are (units-sec). In determiningthe FS estimate, it is important that the Fast Fourier Transform block size is picked such that all ofthe transient is contained within the block, but excessive noise beyond the duration of the transientbe removed by zero-padding the block. For the FS estimate, this description is useful for notingoutstanding frequency components within the overall frequency band amongst pyroshocks. Ifadjacent frequency components are not averaged, the percentage normalized random error in theordinate is 100%. By averaging n adjacent ordinates, the percentage of normalized random error
decreases as 1/ n with a decreased frequency resolution. Computation of the FS estimates for thepre-pyroshock and the post-pyroshock provide useful information relative to the distinct frequencycharacter of the pyroshock as compared to the frequency character of the pre-pyroshock noise andthe post-pyroshock combination noise and structural response. Figure 517-8 provides FS estimatesfor the pyroshock and the pre-pyroshock and post-pyroshock events on figure 517-1. These plotscorrespond to the ESD plots on figure 517-7.
(5) Other methods: Over the past few years, at least two other techniques potentially useful inprocessing pyroshock data have been suggested. Reference i describes the utilization of timedomain or temporal moments for comparing the characteristics of the pyroshock over differentfrequency bands. The usefulness of this technique resides in the fact that if the pyroshock can berepresented by a simple nonstationary product model, the time domain moments must be constantover selected filter bandwidths. Thus, the pyroshock can be characterized by a model with potentialusefulness for stochastic simulation. Reference j explores this reasoning for mechanical shock.Reference k describes the use of wavelets for vibration. It has been suggested that waveletprocessing may be useful for pyroshock description, particularly if a pyroshock contains informationat intervals of time over the duration of the shock at different time scales, i.e., different frequencies.It is likely that this form of processing may become more prevalent in the future as the level ofexamination of transients becomes more sophisticated and if wavelet processing is shown to be moreuseful for description of phenomenon with substantial randomness.
b. In general, for pyroshock tests, a single response record is obtained. At times, it may be convenient oreven necessary to combine equivalent processed responses in some appropriate statistical manner.Reference l and method 516.5, Annex 516.5A of this standard discuss some options in statisticallysummarizing processed results from a series of tests. In general, processed results, either from the SRS,ESD, or FS are logarithmically transformed in order to provide estimates that are more normallydistributed. This is important since often very little data are available from a test series, and theprobability distribution of the untransformed estimates cannot be assumed to be normally distributed. Ingeneral, the combination of processed results will fall under the category of small sample statistics andneeds to be considered with care. Parametric or less powerful nonparametric methods of statisticalanalysis may usually be effectively applied.
2.3.2 Test conditions - shock spectrum transient duration and scaling.
Derive the SRS and the effective transient duration, Te, from measurements of the materiel’s environment or, ifavailable, from dynamically scaled measurements of a similar environment. Because of the inherent high degree ofmeasurement randomness and limited response prediction methodology associated with the response to a pyroshock,
Downloaded from http://www.everyspec.com on 2012-06-04T5:34:26.
MIL-STD-810F1 January 2000
METHOD 517517-9
extreme care must be exercised in dynamically scaling a similar event. For pyroshocks, there are two known scalinglaws for use with response from pyroshocks that may be helpful if used with care (reference a).
2.3.2.1 Pyroshock source energy scaling (SES).
The first scaling law is the Source Energy Scaling (SES) where the SRS is scaled at all frequencies by the ratio of thetotal energy release of two different devices. For Er and En, the total energy in two pyrotechnic shock devices, therelationship between the SRS processed levels at a given natural frequency fn and distance D1 is given by thefollowing expression:
� � � �¸¸
¹
·
¨¨
©
§
r
n1rn1nn E
ED,E|fSRSD,E|fSRS
In utilizing this relationship, it is assumed that either an increase or decrease in the total energy of the pyrotechnicshock devices will be coupled into the structure in exactly the same way, i.e., excessive energy from a device will gointo the structure as opposed to being dissipated in some other way, e.g., through the air. En and Er may come fromphysical considerations related to the pyrotechnic device or be computed from ESD estimates (or in the time domainby way of a Parseval form relationship) where it is assumed that the time history measurements quantify the energydifference. Reference a discusses conditions under which this scaling lawmay lead to over-prediction for En > Er orunder-prediction when En < Er.
2.3.2.2 Pyroshock response location distance scaling (RLDS).
The second scaling law is the Response Location Distance Scaling (RLDS) where the SRS is scaled at allfrequencies by an empirically derived function of the distance between two sources. For D1 and D2, the distancesfrom a pyrotechnic shock device (point source), the relationship between the SRS processed levels at a given naturalfrequency, fn, is given by the following expression :
� � � � � �� �� �� �12105.0nf4.2
n4
12 DDf108expDSRSDSRS �u� ��
In utilizing this relationship it is assumed that D1 and D2 can be easily defined as in the case of a pyrotechnic pointsource device. Figure 517.5-9 from reference a displays the ratio of SRS(fn|D2) to SRS(fn|D1) as a function of thenatural frequency, fn, for selected values of D2-D1. It is clear from this plot that, as the single degree of freedomnatural frequency increases, there is a marked decrease in the ratio for a fixed D2-D1 > 0 and as D2-D1 increases theattenuation becomes substantial. This scaling relationship when used for prediction between two configurations,relies very heavily upon (1) similarity of configuration and (2) the same type of pyrotechnic device. Consultreference a before applying this scaling relationship.
2.3.2.3 Measured data available from pyroshock.
a. If measured data are available, the data may be processed utilizing the SRS, FS, or ESD. Forengineering and historical purposes, the SRS has become the standard for measured data processing. Inthe discussion to follow, it will be assumed that the SRS is the processing tool. In general, the maximaxSRS spectrum (absolute acceleration or absolute pseudo-velocity) is the main quantity of interest. Withthis background, determine the shock response spectrum required for the test from analysis of themeasured environmental acceleration time history. After carefully qualifying the data, to make certainthere are no anomalies in the amplitude time history, according to the recommendations provided inreference b, compute the SRS. The analysis will be performed for Q = 10 at a sequence of naturalfrequencies at intervals of at least 1/6 octave and no finer than 1/12th octave spacing to span at least 100to 20,000 Hz, but not to exceed 100,000 Hz. When a sufficient number of representative shock spectraare available, employ an appropriate statistical technique (an enveloping technique) to determine therequired test spectrum. Annex 516.5A of method 516.5 references the appropriate statistical techniques.Parametric statistics can be employed if the data can be shown to satisfactorily fit an assumed underlyingprobability distribution. When a normal or lognormal distribution can be justified, Annex 516.5A andreference l provide a method for estimating such a test level. Test levels based upon a maximum
Downloaded from http://www.everyspec.com on 2012-06-04T5:34:26.
MIL-STD-810F1 January 2000
METHOD 517517-10
predicted environment defined to be equal to or greater than the 95th percentile value at least 50 percentof the time utilizes a one-sided tolerance interval approach.
b. When insufficient data are available for statistical analysis, use an increase over the maximum of theavailable spectral data to establish the required test spectrum to account for randomness and inherentvariability of the environment. The degree of increase is based upon engineering judgment and issupported by rationale for that judgment. In these cases, it is often convenient to envelope the SRS bycomputing the maximax spectra over the sample spectra and proceed to add a +6dB margin to the SRSmaximax envelope over the entire frequency range of interest.
c. When employing the pyroshock method, determine the effective transient duration, Te, from themeasurement time histories of the environmental data as suggested in paragraph 2.3.1. For allprocedures, the pyroshock amplitude time history used for the SRS analysis will be Te in duration. Inaddition, measurement data will be collected for a duration, Te, just prior to the pyroshock, and duration,Te, just after the pyroshock for subsequent analysis. In general, each individual axis of the threeorthogonal axes will have approximately the same shock test SRS and average effective duration as aresult of the omni-directional properties of a pyroshock in Procedure I and Procedure II. For ProceduresIII and IV, the form of shock test SRS may vary with axes. Use an SRS shaker shock replication methodwhen using Procedure IV; do not use classical shock pulse forms, e.g., half-sine, terminal-peak saw tooth,etc., in the testing.
2.3.2.4 Measured data not available from pyroshock.
If a database is not available for a particular configuration, use configuration similarity and any associated measureddata for prescribing a pyroshock. Because of the sensitivity of the pyroshock to the system configuration and thewide randomness and variability inherent in pyrotechnic measurements, the tester must proceed with caution. As abasic guide for pyroshock testing, figure 517-10 from reference p provides SRS estimates for four typical aerospaceapplication pyrotechnic point source devices. Figure 517-11 from reference a provides information on theattenuation of the peaks in the SRS, and of the ramp in the SRS of the point sources on figure 517-10 with distancefrom the source. Information on figure 517-10 and figure 517-11 come from reference m. Reference m alsorecommends that the attenuation of the peak SRS across joints be taken to be 40% per joint for up to three joints, andthat there be no attenuation of the ramp portion (portion linearly increasing with frequency on the log log plot) of theSRS. Figure 517-12 provides the degree of attenuation of the peak amplitude time history response as a function ofthe shock path distance from the source for seven aerospace structural configurations. This information wassummarized from reference n. The SES scaling law or the RLDS scaling law may provide guidance. In most cases,either Procedure II or Procedure III are the optimum procedures for testing, with the smallest risk of eithersubstantial undertest or gross overtest, when Procedure I is not an option. Proceed with caution with Procedure II orProcedure III, cognizant of the information contained in reference c. Generally, a test transient is deemed suitable ifits SRS equals or exceeds the given SRS requirement over the minimum frequency range of 100 to 20,000 Hz andthe effective transient duration (T) of the test transient is within 20% of that of the normal pyroshock responsetransient duration (Te). (See paragraph 4.2.2 for test tolerances.)
2.3.3 Test axes, duration, and number of shock events.
2.3.3.1 General.
A suitable test shock for each axis is one that yields an SRS that equals or exceeds the required test SRS over thespecified frequency range when using a specified duration for the test shock time history, and when the effectivetransient duration of the shock (Te) is within twenty percent of the specified Te value. For Procedure I, Te is notspecified, but is measured. Properly validate the test data and determine the maximax acceleration SRS for Q = 10,and at least at 1/12-octave frequency intervals. The following guidelines may also be applied. For materiel that islikely to be exposed once to a given pyroshock event, perform one shock for each appropriate environmentalcondition. For materiel that is likely to be exposed more frequently to pyroshock events and there are little availabledata to substantiate the number of pyroshocks, apply three or more at each environmental condition based on the
Downloaded from http://www.everyspec.com on 2012-06-04T5:34:26.
MIL-STD-810F1 January 2000
METHOD 517517-11
anticipated service use. Application of three or more shocks in one configuration is for enhancement of statisticalconfidence.
2.3.3.2 Procedure I.
For Procedure I, subject the test item to a sufficient number of suitable shocks to meet the specified test conditions orat least three shocks, whichever is greater. The objective of the test is to test the physical and functional integrity ofthe materiel under service use pyroshock in the near-field of the pyrotechnic device.
2.3.3.3 Procedure II.
For Procedure II, subject the test item to a sufficient number of suitable shocks to meet the specified test conditionsor at least three shocks. The objective of the test is to test the structural and functional integrity of the materiel underpyroshock in the near-field of the pyrotechnic device.
2.3.3.4 Procedure III.
For Procedure III, subject the test item to a sufficient number of suitable shocks to meet the specified test conditionsor at least three shocks. The measured response test requirements may be satisfied along more than one axis with asingle test shock configuration. Consequently, it is conceivable that a minimum of three test shock repetitions willsatisfy the requirements for all directions of all three orthogonal axes. At the other extreme, a total of nine shocksare required if each shock only satisfies the test requirements in one direction of one axis. The objective of the test isto test the structural and functional integrity of the system under pyroshock in the far-field of the pyrotechnic device.
2.3.3.5 Procedure IV.
For Procedure IV, subject the test item to a sufficient number of suitable shocks to meet the specified test conditionsor at least three shocks. The measured response will generally not be omni-directional. For Procedure IV, it may bepossible, but highly unlikely, to simultaneously meet the test requirements along more than one axis with a single testshock configuration. Consequently, it is conceivable that a minimum of three test shock repetitions could satisfy therequirements for all directions of all three orthogonal axes. At the other extreme, a total of nine shocks are requiredif each shock only satisfies the test requirements in one direction of one axis. The objective of the test is to test thestructural and functional integrity of the system under pyroshock in the far-field of the pyrotechnic device.
2.4 Test Item Configuration.
See Part One, paragraph 5.8. Configure the test item for pyroshock as would be anticipated for the materiel duringservice giving particular attention to the details of the mounting of the materiel to the platform. For Procedure II,provide special justification for the selection of the test item configuration. Pyroshock response variation isparticularly sensitive to the details of the materiel/platform configuration.
3. INFORMATION REQUIRED.
3.1 Pretest.
The following information is required to conduct a pyroshock test adequately.
a. General. Information listed in Part One, paragraphs 5.7 and 5.9, and Part One, Appendix A, Task 405 ofthis standard.
b. Specific to this method.
(1) Test system (test item/platform configuration) detailed configuration including
(a) location of the pyrotechnic device(b) location of the materiel
Downloaded from http://www.everyspec.com on 2012-06-04T5:34:26.
MIL-STD-810F1 January 2000
METHOD 517517-12
(c) the structural path between the pyrotechnic device and the materiel and any general couplingconfiguration of the pyrotechnic device to the platform and the platform to the materielincluding the identification of structural joints
(d) distance of the closest part of the materiel to the pyrotechnic shock device
(2) Pyroshock environment, including
(a) type of pyrotechnic device(b) if charge related - size of pyrotechnic device charge(c) if charge effect - stored strain energy in primary device(d) means of initiation of the pyrotechnic device(e) anticipated EMI or thermal effects
(3) Effective duration of pyroshock if Procedure III or Procedure IV is used, or the size and distributionof the pyrotechnic charge if Procedure I or Procedure II is used.
(4) General materiel configuration including measurement points on or near the materiel.
3.2 During Test.
Collect the following information while conducting the test:
a. General. Information listed in Part One, paragraph 5.10, and in Part One, Appendix A, Tasks 405 and406 of this standard.
b. Specific to this method.
(1) A means of assessing damage to fixture/materiel configurations before continuing the tests inProcedures I, II, and III.
(2) A record of previous shock time history information for analysis.
(3) An SRS analysis capability to determine if specified pyroshock levels are being replicated inProcedures II, III, and IV.
3.3 Post-test.
Record the following post-test information.
a. General. Information listed in Part One, paragraph 5.13, and in Appendix A, Tasks 405 and 406 of thisstandard.
b. Specific to this method.
(1) Duration of each exposure as recorded by the instrumented test fixture or test item, and the numberof specific exposures.
(2) Any data measurement anomalies, e.g., high instrumentation noise levels, loss of sensors or sensormount as a result of testing, etc.
(3) Status of the test item/fixture after each test.
(4) Status of measurement system after each test.
4. TEST PROCESS.
4.1 Test Facility.
Pyroshock can be applied utilizing actual pyrotechnic devices in the design configuration or in a simulatedconfiguration, conventional high acceleration amplitude/frequency test input devices or, under certain restrictedcircumstances, an electrodynamic shaker. The pyroshock apparatus may incorporate a compressed gas shock tube,metal-on-metal contact, ordnance-generated pyroshock simulator, actual pyrotechnic device on a scale model, actual
Downloaded from http://www.everyspec.com on 2012-06-04T5:34:26.
MIL-STD-810F1 January 2000
METHOD 517517-13
pyrotechnic device on a full scale model, or other activating types. For Procedure I or Procedure II, referencesrelated to ordnance devices must be consulted. For Procedure III, reference c provides a source of alternative testinput devices, their advantages and limitations. In Procedure III it is assumed that all parts of the materiel lie in thefar-field of the pyrotechnic device. Consult reference c for guidelines and consideration for such testing. ForProcedure IV, it is assumed that all parts of the materiel lie in the far-field of the pyrotechnic device and themeasured or predicted data are consistent with the 3000 Hz frequency limitations of the electrodynamic shaker inaddition to the acceleration amplitude limitations. It is also important to note that for large materiel, the velocityinput of the shaker may exceed the velocity of the materiel under the actual pyroshock environment. For velocitysensitive materiel, this may constitute an overtest. In the ensuing paragraphs, the portion of the test facilityresponsible for delivering the pyroshock to the materiel will be termed the shock apparatus. Such shock apparatusincludes the pyrotechnic shock device and the fixturing configuration in Procedure I and Procedure II, themechanical exciter and the fixturing configuration in Procedure III, and the electrodynamic shaker and the fixturingconfiguration in Procedure IV.
4.2 Controls.
4.2.1 Calibration.
Ensure the shock apparatus is calibrated for conformance with the specified test requirement from the selectedprocedure. For Procedure I there is no pre-shock calibration other than ensuring the configuration is in accordancewith the test plan. For Procedure II, before the test item is attached to the resonating plate, it will be necessary toattach a calibration load and obtain measured data under test conditions to be compared with the desired testresponse. Caution must be exercised so that the pre-test shocks do not degrade the resonating plate configuration.For Procedure III, calibration is crucial. Before the test item is attached to the shock apparatus, it will be necessaryto attach a calibration load and obtain measured data under test conditions to be compared with the desired testresponse. For Procedure IV, utilizing the SRS method with proper constraints on the effective duration of thetransient, calibration is necessary. Before the test item is attached to the shock apparatus, it will be necessary toattach a calibration load and obtain measured data under test conditions to be compared with the desired testresponse. For Procedure II, Procedure III, and Procedure IV, remove the calibration load and perform the shock teston the actual test item. Additional calibration procedures are provided in Part One, paragraph 5.3.2 and Part One,paragraph 5.2, respectively.
4.2.2 Tolerances.
The following are guidelines for test tolerances for pyroshock for the four procedures. All tolerances are specifiedon the maximax acceleration SRS. Any tolerances specified on the pseudo-velocity SRS must be derived from thetolerances on the maximax acceleration SRS and be consistent with those tolerances. For an array of measurementsdefined in terms of a "zone" (reference e) a tolerance may be specified in terms of an average of the measurementswithin a "zone". It should be noted, however, this is in effect a relaxation of the single measurement tolerance, andthat individual measurements may be substantially out of tolerance while the average is within tolerance. In general,when specifying test tolerances based on averaging for more than two measurements within a zone, the toleranceband should not exceed the 95/50 one-sided normal tolerance upper limit computed for the logarithmicallytransformed SRS estimates, or be less than the mean minus 1.5dB. Any use of "zone" tolerances and averaging musthave support documentation prepared by a trained analyst. Additional test tolerance procedures are provided in PartOne, paragraph 5.3.2 and Part One, paragraph 5.2, respectively.
4.2.2.1 Procedures I and II.
If prior measured data are available or a series of pyroshocks are performed, all acceleration maximax SRScomputed with a one-twelfth octave frequency resolution are to be within –3 dB and +6dB over a minimum of 80%of the overall frequency bandwidth from 100 Hz to 20 kHz. For the remaining 20% part of the frequency band, allSRS are to be within –6dB and +9dB. Ensure that at least 50% of the SRS magnitudes exceed the nominal testspecification.
Downloaded from http://www.everyspec.com on 2012-06-04T5:34:26.
MIL-STD-810F1 January 2000
METHOD 517517-14
4.2.2.2 Procedure III.
If prior measured data are available or a series of pyroshocks are performed, all acceleration maximax SRScomputed with a one-twelfth octave frequency resolution are to be within –3 dB and +6 dB over a minimum of 90%of the overall frequency bandwidth from 100 Hz to 10 kHz. For the remaining 10% part of the frequency band allSRS are to be within –6dB and +9dB. Ensure that at least 50% of the SRS magnitudes exceed the nominal testspecification.
4.2.2.3 Procedure IV.
If prior measured data are available or a series of pyroshocks are performed, all acceleration maximax SRScomputed with a one-twelfth octave frequency resolution are to be within –1.5 dB and +3 dB over a minimum of90% of the overall frequency bandwidth from 10 Hz to 3 kHz. For the remaining 10% part of the frequency band allSRS are to be within –3 dB and +6 dB. Ensure that at least 50% of the SRS magnitudes exceed the nominal testspecification.
4.3 Instrumentation.
In general, acceleration will be the quantity measured to meet specification with care taken to ensure accelerationmeasurements can be made that provide meaningful data (reference b). For pyroshock measurements in and close tothe near-field, loss of measurement system integrity is not unusual. On occasion, more sophisticated devices may beemployed, e.g., laser velocimeter. In these cases, give special consideration to the measurement instrumentamplitude and frequency range specifications in order to satisfy the measurement and analysis requirements.
a. Accelerometer.
(1) Transverse sensitivity of less than or equal to 5%.
(2) An amplitude linearity within 10% from 5% to 100% of the peak acceleration amplitude required fortesting.
(3) For all pyroshock measurement procedures a flat frequency response within +10% across thefrequency range 10 - 20,000 Hz. The devices may be of the piezoelectric type or the piezoresistivetype. Use measurement devices compatible with the requirements, guidelines, and precautionsprovided in reference b.
b. Signal conditioning. Use signal conditioning compatible with the instrumentation requirements on themateriel. In particular, filtering will be consistent with the response time history requirements. Usesignal conditioning compatible with the requirements and guidelines provided in reference b. Inparticular, use extreme care in filtering the acceleration signals either (1) directly at the attachment point,i.e., mechanical filtering to reduce the very high frequencies associated with the pyroshock, or (2) at theamplifier output. Never filter the signal into the amplifier for fear of filtering bad measurement data andthe inability to detect the bad measurement data at the amplifier output. The signal from the signalconditioning or recording device must be anti-alias filtered before digitizing with a linear phase shiftfilter over the frequency range of interest.
4.4 Data Analysis.
a. Digitizing will not alias more than a 5 percent measurement error into the frequency band of interest (100Hz to 20 kHz).
b. For filters used to meet the previous requirement, use a filter having linear phase-shift characteristics.
c. A filter (if used) with a pass band flatness within one dB across the frequency range specified for theaccelerometer (see paragraph 4.3).
d. Analysis procedures will be in accordance with those requirements and guidelines provided in referenceb. In particular, the pyroshock acceleration amplitude time histories will be validated according to theprocedures in reference b. Each amplitude time history will be integrated to detect any anomalies in themeasurement system e.g., cable breakage, slewrate of amplifier exceeded, data clipped, unexplained
Downloaded from http://www.everyspec.com on 2012-06-04T5:34:26.
MIL-STD-810F1 January 2000
METHOD 517517-15
accelerometer offset, etc. The integrated amplitude time histories will be compared against criteria givenin reference b. For Procedure I and Procedure II to detect emission from extraneous sources, e.g., EMI,configure an accelerometer without sensing element and process its response in the same manner as forthe other accelerometer measurements. If this accelerometer exhibits any character other than very lowlevel noise, consider the acceleration measurements to be contaminated by an unknown noise source inaccordance with the guidance in reference b.
4.5 Test Execution.
4.5.1 Preparation for test.
4.5.1.1 Preliminary steps.
Prior to initiating any testing, review pretest information in the test plan to determine test details (e.g., procedures,test item configuration, pyroshock levels, number of pyroshocks):
a. Choose the appropriate test procedure.
b. Determine the appropriate pyroshock levels for the test prior to calibration for Procedure II, ProcedureIII, and Procedure IV from previously processed data if this is available.
c. Ensure the pyroshock signal conditioning and recording device have adequate amplitude range andfrequency bandwidth. It may be difficult to estimate a peak signal and range the instrumentationappropriately. In general, there is no data recovery from a clipped signal, however, for over-rangedsignal conditioning, it is usually possible to get meaningful results for a signal 20 dB above the noisefloor of the measurement system. In some cases, redundant measurements may be appropriate - onemeasurement being over-ranged and one measurement ranged at the best estimate for the peak signal.The frequency bandwidth of most modern recording devices is usually adequate, but one must make surethat device input filtering does not limit the signal frequency bandwidth.
4.5.1.2 Pretest checkout.
All items require a pretest checkout at standard ambient conditions to provide baseline data. Conduct the checkoutas follows:
Step 1. Conduct a complete visual examination of the test item with special attention to micro-electroniccircuitry areas. Pay particular attention to its platform mounting configuration and potential stresswave transmission paths.
Step 2. Document the results.Step 3. Where applicable, install the test item in its test fixture.Step 4. Conduct an operational checkout in accordance with the approved test plan along with simple tests
for ensuring the measurement system is responding properly.Step 5. Document the results for comparison with data taken during and after the test.Step 6. If the test item operates satisfactorily, proceed to the first test. If not, resolve the problem and
restart at Step 1.Step 7. Remove the test item and proceed with the calibration (except for Procedure I).
4.5.1.3 Procedures.
The following procedures provide the basis for collecting the necessary information concerning the platform and testitem under pyroshock.
a. Procedure I - Near-field with actual configuration.
Step 1. Following the guidance of reference c, select test conditions and mount the test item (in generalthere will be no calibration when actual hardware is used in this procedure). Select accelerometersand analysis techniques that meet the criteria outlined in reference b.
Step 2. Perform a functional check on the test item.
Downloaded from http://www.everyspec.com on 2012-06-04T5:34:26.
MIL-STD-810F1 January 2000
METHOD 517517-16
Step 3. Subject the test item (in its operational mode) to the test transient by way of the pyrotechnic testdevice.
Step 4. Record necessary data that show the shock transients when processed with the SRS algorithm arewithin specified tolerances. This includes test setup photos, test logs, and plots of actual shocktransients. For shock-isolated assemblies within the test item, make measurements and/orinspections to ensure these assemblies did attenuate the pyroshock.
Step 5. Perform the functional check on the test item. Record performance data.Step 6. Repeat steps 2, 3, 4, and 5 a minimum of three times for statistical confidence if the integrity of the
test configuration can be preserved during test.Step 7. Document the test series.
b. Procedure II - Near-field with simulated configuration.
Step 1. Following the guidance of reference b, select test conditions and calibrate the shock apparatus asfollows:(a) Select accelerometers and analysis techniques that meet the criteria outlined in reference b.(b) Mount the calibration load (an actual test item, a rejected item, or a rigid dummy mass) to the
test apparatus in a manner similar to that of the actual materiel service mount. If the materiel isnormally mounted on shock isolators to attenuate the pyroshock, ensure the isolators arefunctional during the test.
(c) Perform calibration shocks until two consecutive shock applications to the calibration loadproduce shock transients that, when processed with the SRS algorithm, are within specifiedtolerances for at least one direction of one axis.
(d) Remove the calibrating load and install the actual test item on the shock apparatus paying closeattention to mounting details.
Step 2. Perform a functional check on the test item.Step 3. Subject the test item (in its operational mode) to the test pyroshock.Step 4. Record necessary data that show the shock transients when processed with the SRS algorithm are
within specified tolerances. If requirements are given in terms of more than one axis, examineresponses in the other axes to ensure the test specification has been met. This includes test setupphotos, test logs, and photos of actual shock transients. For shock isolated assemblies within the testitem, make measurements and/or inspections to assure the isolators attenuated the pyroshock.
Step 5. Perform the functional check on the test item. Record performance data.Step 6. Repeat steps 1, 2, 3, 4, and 5 three times for each orthogonal axis that is to be tested if the test shock
did not meet the test specification in the other axes.Step 7. Document the test series.
c. Procedure III - Far-field using mechanical test device.
Step 1. Following the guidance of reference b, select test conditions and calibrate the shock apparatus asfollows:(a) Select accelerometers and analysis techniques that meet the criteria outlined in reference b.(b) Mount the calibration load (an actual test item, a rejected item, or a rigid dummy mass) to the
test apparatus in a manner similar to that of the actual materiel service mount. If the materiel isnormally mounted on shock isolators to attenuate the pyroshock, ensure the isolators arefunctional during the test.
(c) Perform calibration shocks until two consecutive shock applications to the calibration loadproduce waveforms that, when processed with the SRS algorithm, are within specifiedtolerances for at least one direction of one axis.
(d) Remove the calibrating load and install the actual test item on the shock apparatus paying closeattention to mounting details.
Step 2. Perform a functional check of the test item.Step 3. Subject the test item (in its operational mode) to the test pyroshock.Step 4. Record necessary data that show the shock transients when processed with the SRS algorithm are
within specified tolerances. If requirements are given in terms of more than one axis, examineresponses in the other axes to ensure the test specification has been met. This includes test setup
Downloaded from http://www.everyspec.com on 2012-06-04T5:34:26.
MIL-STD-810F1 January 2000
METHOD 517517-17
photos, test logs, and photos of actual shock transients. For shock isolated assemblies within the testitem, make measurements and/or inspections to assure the isolators attenuated the pyroshock.
Step 5. Perform the functional check on the test item. Record performance data.Step 6. Repeat steps 1, 2, 3, 4, and 5 three times for each orthogonal axis that is to be tested if the test shock
did not meet the test specification in the other axes.Step 7. Document the tests.
d. Procedure IV - Far-field using electrodynamic shaker.
Step 1. Following the guidance of reference b, select test conditions and calibrate the shock apparatus asfollows:(a) Select accelerometers and analysis techniques that meet the criteria outlined in reference b.(b) Mount the calibration load (an actual test item, a rejected item, or a rigid dummy mass) to the
electrodynamic shaker in a manner similar to that of the actual materiel. If the materiel isnormally mounted on shock isolators to attenuate the pyroshock, ensure the isolators arefunctional during the test.
(c) Develop the SRS wavelet or damped sine compensated amplitude time history based on therequired test SRS.
(d) Perform calibration shocks until two consecutive shock applications to the calibration loadproduce shock transients that, when processed with the SRS algorithm, are within specified testtolerances for at least one direction of one axis.
(e) Remove the calibrating load and install the actual test item on the electrodynamic shakerpaying close attention to mounting details.
Step 2. Perform a functional check on the test item.Step 3. Subject the test item (in its operational mode) to the test electrodynamic pyroshock simulation.Step 4. Record necessary data that show the shock transients, when processed with the SRS algorithm, are
within specified tolerances. If requirements are given in terms of more than one axis, examineresponses in the other axes to ensure the test specification has been met. This includes test setupphotos, test logs, and photos of actual shock transients. For shock isolated assemblies within the testitem, make measurements and/or inspections to assure the isolators attenuated the pyroshock.
Step 5. Perform the functional check on the test item. Record performance data.Step 6. Repeat steps 2, 3, 4, and 5 three times for each orthogonal axis that is to be tested if the test shock
did not meet the test specification in the other axes.Step 7. Document the tests.
5. ANALYSIS OF RESULTS.
In addition to the guidance provided in Part One, paragraphs 5.14 and 5.17, and Part One, Appendix A, Tasks 405and 406, the following information is provided to assist in the evaluation of the test results. Analyze in detail anyfailure of a test item to meet the requirements of the system specifications and consider related information such as:
5.1 Procedure I - Near-field with Actual Configuration.
Carefully evaluate any failure in the structural configuration of the test item, e.g., minute cracks in circuit boards, thatmay not directly impact failure of the functioning of the materiel but that would lead to failure in its in-serviceenvironment conditions.
5.2 Procedure II - Near-field with Simulated Configuration.
Carefully evaluate any failure in the structural configuration of the test item, e.g., minute cracks in circuit boards, thatmay not directly impact failure of the functioning of the materiel but that would lead to failure in its in-serviceenvironment conditions.
5.3 Procedure III - Far-field Using Mechanical Test Device.
The mechanical shock simulation will, in general, provide a more severe low frequency environment (comparativelylarge velocity and displacement) than the actual pyroshock event and, hence, any structural failures, e.g., deformed
Downloaded from http://www.everyspec.com on 2012-06-04T5:34:26.

MIL-STD-810F1 January 2000
METHOD 517517-18
fasteners or mounts, may be more akin to those found in the SRS prescribed shock tests described in method 516.5.If this is the case and the cause of the structural failure is not readily apparent, another procedure may be required tosatisfy the test requirements.
5.4 Procedure IV - Far-field Using Electrodynamic Shaker.
The mechanical shock simulation will, in general, provide a more severe low frequency environment (comparativelylarge velocity) than the actual pyroshock event and, hence, any structural failures may be more akin to those found inthe SRS prescribed shock tests described in method 516.5. If this is the case and the cause of the structural failure isnot readily apparent, another procedure may be required to satisfy the test requirements.
6. REFERENCE/RELATED DOCUMENTS.
a. “Pyroshock Test Criteria,” NASA Technical Standard, NASA-STD-7003, May 18, 1999.
b. Handbook for Dynamic Data Acquisition and Analysis, IES-RP-DTE012.1, Institute of EnvironmentalSciences, 940 East Northwest Highway, Mount Prospect, Illinois 60056.
c. Bateman, V. I. and N. T. Davie, Recommended Practice for Pyroshock, IES Proceedings of the 42ndATM 1995, Institute of Environmental Sciences, Mount Prospect, Illinois.
d. Zimmerman, Roger M., Section 32, VII. Shock Test Techniques, 3) Pyroshock-Bibliography,Experimental Mechanics Division I, Sandia National Laboratories, Albuquerque, NM, April 19,1991.
e. Kelly, Ronald D. and George Richman, Principles and Techniques of Shock Data Analysis, The Shockand Vibration Information Center, SVM-5, United States Department of Defense.
f. Harris, Cyril M., ed. Shock and Vibration Handbook, 3rd Edition, NY, McGraw-Hill, 1988.
g. Gaberson, H. A. and R. H. Chalmers. Modal Velocity as a Criterion of Shock Severity, Shock andVibration Bulletin 40, Pt. 2, (1969) 31-49.
h. Gaberson, H. A. and R. H. Chalmers. Reasons for Presenting Shock Spectra with Velocity as theOrdinate, Proc. 66th Shock and Vibration Symp., Vol. II, pp 181-191, Oct/Nov. 1995.
i. Smallwood, David O., Characterization and Simulation of Transient Vibrations Using Band LimitedTemporal Moments, Shock and Vibration Journal, Volume 1, Issue 6, 1994, pp 507-527.
j. Merritt, Ronald G., A Note on Transient Vibration Model Detection, IES Proceedings of the 42nd ATM1995, Institute of Environmental Sciences, Mount Prospect, Illinois.
k. Newland, D. E., An Introduction to Random Vibrations, Spectral & Wavelet Analysis, John Wiley &Sons, Inc., New York 1995.
l. Piersol, Allan G., Procedures to Compute Maximum Structural Responses from Predictions orMeasurements at Selected Points, Shock and Vibration Journal, Vol 3, Issue 3, 1996, pp 211-221.
m. Barrett, S., The Development of Pyro Shock Test Requirements for Viking Lander Capsule Components,Proc. 21st ATM, Inst. Envir. SC., pp 5-10, Apr. 1975.
n. Kacena, W. J., McGrath, M. B., and Rader, W. P., Aerospace Systems Pyrotechnic Shock Data, NASACR-116437, -116450, -116401, -116402, -116403, -116406, and - 116019, Vol. I-VII, 1970.
o. MIL-STD-331, “Fuze and Fuze Components, Environmental and Performance Tests for.”
p. Himelblau, Harry, Dennis L. Kern, Allan G. Piersol, and Sheldon Rubin, Guidelines for DynamicEnvironmental Criteria (Preliminary Draft), Jet Propulsion Laboratory, California Institute ofTechnology, March 1997.
Downloaded from http://www.everyspec.com on 2012-06-04T5:34:26.
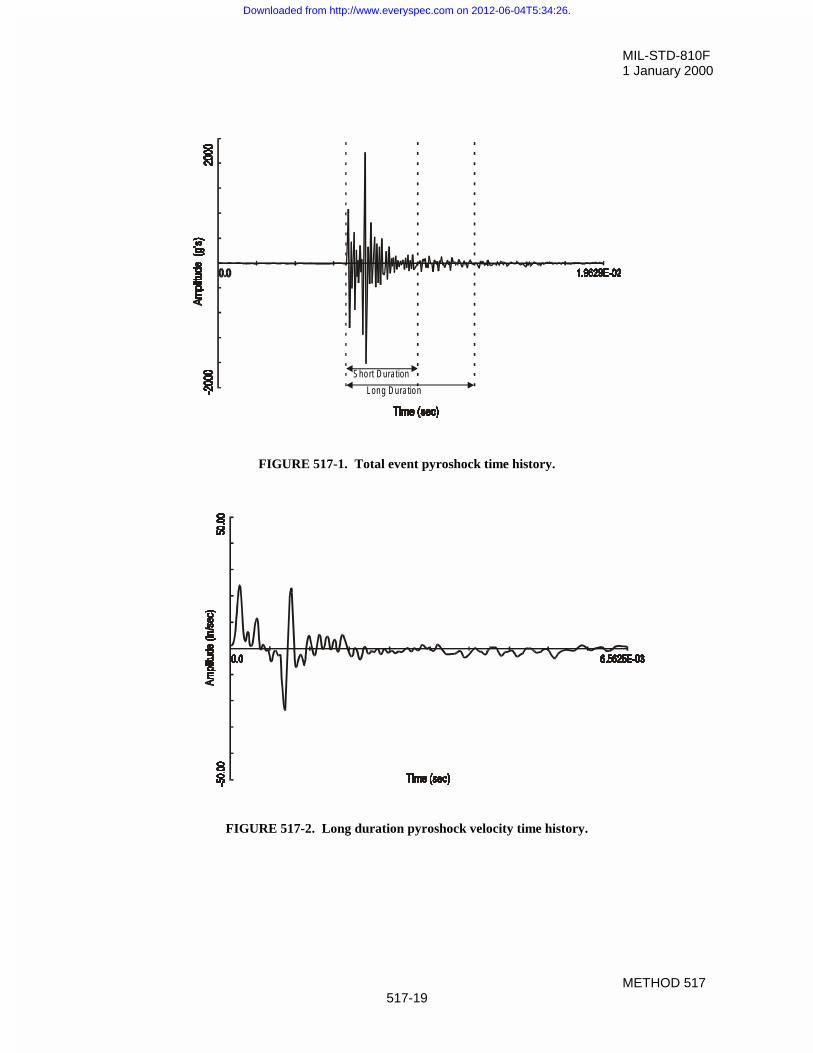
MIL-STD-810F1 January 2000
METHOD 517517-19
FIGURE 517-1. Total event pyroshock time history.
FIGURE 517-2. Long duration pyroshock velocity time history.
Lon g D ura tio n
Sho rt D uration
Downloaded from http://www.everyspec.com on 2012-06-04T5:34:26.
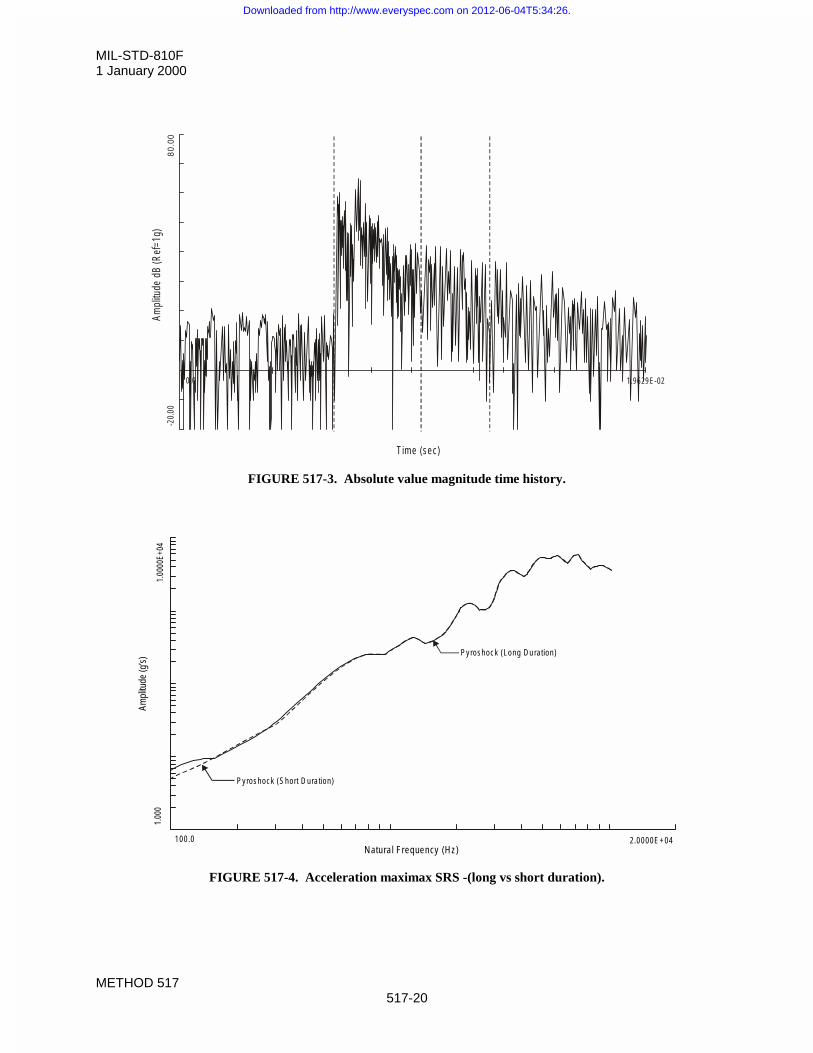
MIL-STD-810F1 January 2000
METHOD 517517-20
FIGURE 517-3. Absolute value magnitude time history.
FIGURE 517-4. Acceleration maximax SRS -(long vs short duration).
1.00
00E+
04
Ampl
itude
(g’s)
1.00
0
1 00 .0N atural Frequency (H z)
2 .0000E + 04
P y roshock (Long D u ra tion )
P y roshock (S hort D ura tion )
Ampl
itude
dB
(Ref
=1g)
80
.00
-20.
00
0 .0
Tim e (sec)
1.9629 E-02
Downloaded from http://www.everyspec.com on 2012-06-04T5:34:26.
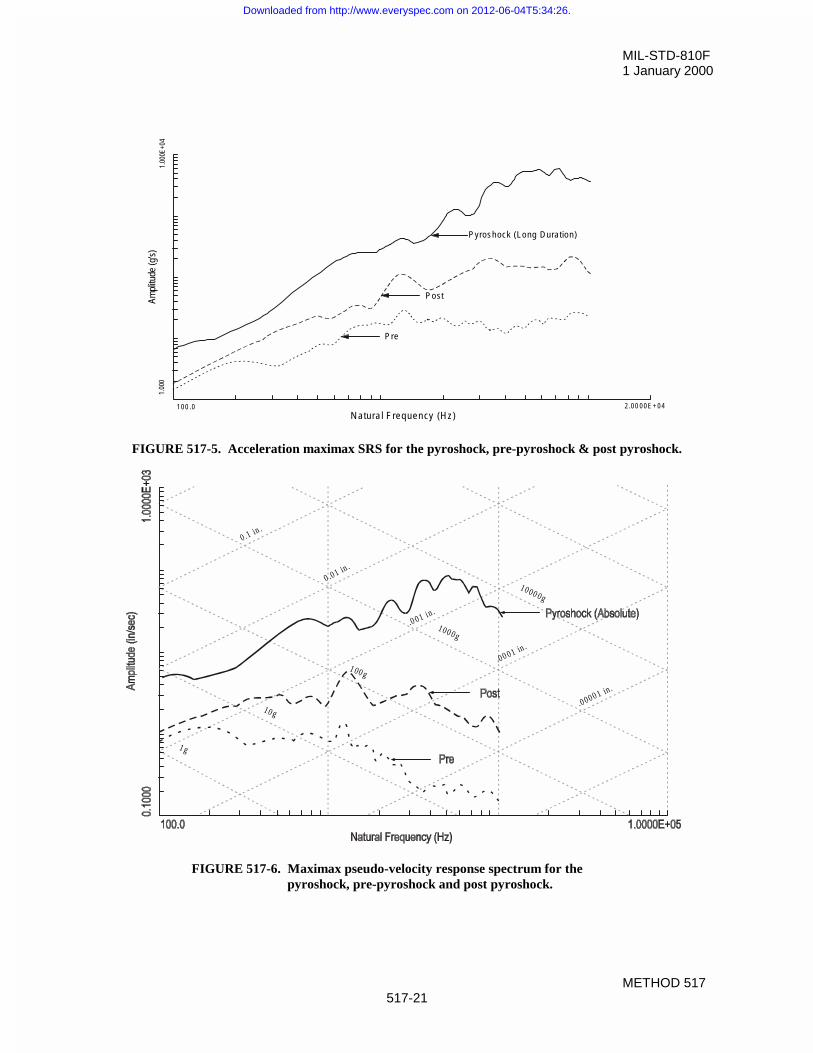
MIL-STD-810F1 January 2000
METHOD 517517-21
FIGURE 517-5. Acceleration maximax SRS for the pyroshock, pre-pyroshock & post pyroshock.
FIGURE 517-6. Maximax pseudo-velocity response spectrum for thepyroshock, pre-pyroshock and post pyroshock.
0 .1 in .
0 .01 in .
.0 01 in .
.00 01 in .
.0000 1 in .
1000 0g
100 0g
1 00 g
10 g
1 g
1.00
0E+0
4Am
plitu
de (g
’s)1.
000
P re
Post
Pyroshock (Long Duration)
2 .0 0 0 0 E + 0 4
N atura l F requency (H z)1 0 0 .0
Downloaded from http://www.everyspec.com on 2012-06-04T5:34:26.
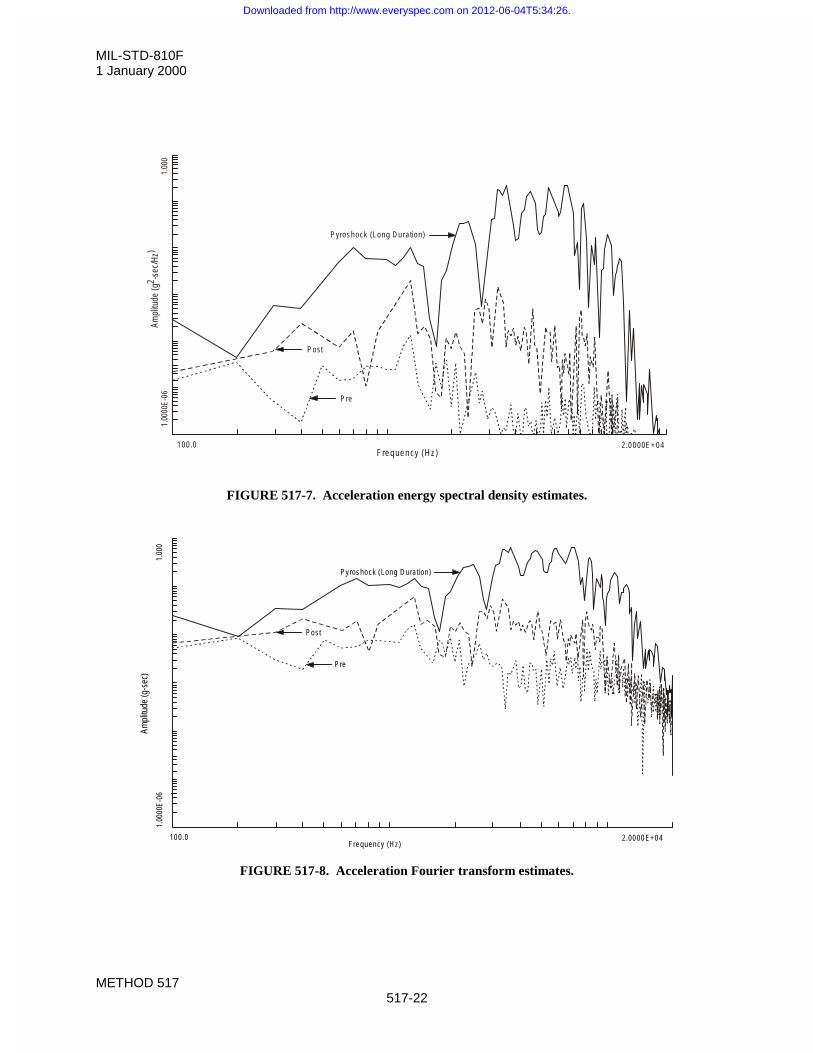
MIL-STD-810F1 January 2000
METHOD 517517-22
FIGURE 517-7. Acceleration energy spectral density estimates.
FIGURE 517-8. Acceleration Fourier transform estimates.
P ost
P re
P yroshock (Long D ura tion )
1.00
0Am
plitu
de (g
2 -sec
/Hz)
1.00
00E-
06
F re q ue n cy (H z)100 .0 2 .0000E + 04
P ost
P re
P y roshock (Long D ura tion)
Frequency (H z)100.0 2.0000 E+04
1.00
00E-
061.
000
Ampl
itude
(g-s
ec)
Downloaded from http://www.everyspec.com on 2012-06-04T5:34:26.
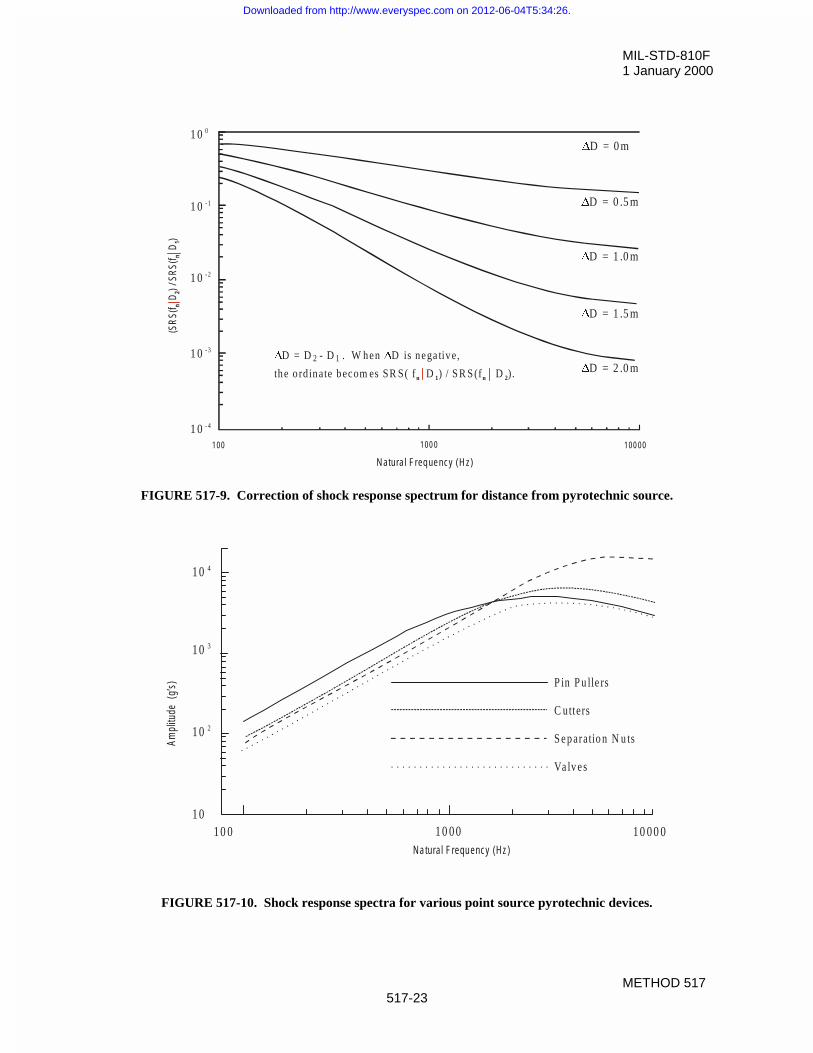
MIL-STD-810F1 January 2000
METHOD 517517-23
FIGURE 517-9. Correction of shock response spectrum for distance from pyrotechnic source.
FIGURE 517-10. Shock response spectra for various point source pyrotechnic devices.
1 0 0
1 0 2
1 0 3
1 0 4
N a tural F requ ency (H z)
1 0 0 0 1 0 0 0 01 0
Ampl
itude
(g’
s) P in P u lle rs
C utters
S e p aratio n N u ts
Va lv e s
'D = 0 m
'D = 0 .5 m
'D = 1 .0 m
'D = 1 .5 m
'D = 2 .0 m
100 00100 0100
1 0 - 4
1 0 - 3
1 0 - 2
1 0 - 1
1 0 0
(SR
S(f
D) /
SR
S(f
D)
n 2
n1
N atural Freq uency (H z)
D = D - D . W hen D is nega tive,
the o rdinate becom es SR S( f D ) / S R S (f D ).
' '2 1
n 1 n 2
Downloaded from http://www.everyspec.com on 2012-06-04T5:34:26.

MIL-STD-810F1 January 2000
METHOD 517517-24
FIGURE 517-11. Shock response spectrum vs distance from pyrotechnic source.
FIGURE 517-12. Peak pyroshock response vs distance from pyrotechnic source.
00
0 .5 1 .0 1 .5 2 .0 2 .5
2 0
4 0
6 0
8 0
1 0 0
Spectrum Ramp
Spectrum Peak
Perc
enta
ge o
f Sou
rce
Valu
e Re
mai
ning
Shock Path D is tance from Shock Source (m )
1
Perc
enta
ge o
f Sou
rce
Valu
e R
emai
ning
1 0
1 0 0
0 1 2 3
1 . H on eyco m b s tru c ture2 . L on ge ron o r s tring er3 . P rim a ry tru ss m e m be rs4 . C y lind rica l she ll5 . R in g fram e6 . C om p le x eq uip m e nt m ou ntin g struc tu re7 . C om p le x a irfra m e
1
2
3
4
5
6
7
Downloaded from http://www.everyspec.com on 2012-06-04T5:34:26.
MIL-STD-810F1 January 2000
METHOD 518518-1
METHOD 518
ACIDIC ATMOSPHERE
NOTE: Tailoring is essential. Select methods, procedures and parameter levels based on the tailoring processdescribed in Part One, paragraph 4.2.2, and Appendix C. Apply the general guidelines for laboratory test methodsdescribed in Part One, paragraph 5 of this standard.
1. SCOPE.
1.1 Purpose.
Use the acidic atmosphere test to determine the resistance of materials and protective coatings to corrosiveatmospheres.
1.2 Application.
Use this test method when the requirements documents state that the materiel is likely to be stored or operated inareas where acidic atmospheres exist, such as industrial areas or near the exhausts of any fuel-burning device.
1.3 Limitations.
This method is not a replacement for the salt fog method, nor is it suitable for evaluating the effects of hydrogensulfide that readily oxidizes in the test environment to form sulfur dioxide.
2. GUIDANCE/REQUIREMENTS.
2.1 Effects of the Environment.
Acidic atmospheres are of increasing concern, especially for materiel in the vicinity of industrial areas or near theexhausts of fuel burning devices. Examples of problems that could occur as a result of acidic atmosphere exposureare as follows. The list is not intended to be all-inclusive, and some of the examples may overlap the categories.Reference a. provides further information.
a. Chemical attack of surface finishes and non-metallic materials.
b. Corrosion of metals.
c. Pitting of cement and optics.
2.2 Test Procedure.
When an acidic atmosphere test is deemed necessary, the procedure included in this method is considered suitablefor most applications. The tailoring options are limited.
2.3 Sequence.
a. General. See Part One, paragraph 5.5.
b. Unique to this method. There are at least two philosophies related to test sequence. One approach is toconserve test item life by applying what are perceived to be the least damaging environments first. Forthis approach, generally apply the acidic atmosphere test late in the test sequence. Another approach isto apply environments to maximize the likelihood of disclosing synergetic effects. For this approach,consider acidic atmosphere testing following dynamic tests, such as vibration and shock. Perform acidicatmosphere testing after any humidity or fungus testing, and before any sand and dust testing or other
Downloaded from http://www.everyspec.com on 2012-06-04T5:34:26.
MIL-STD-810F1 January 2000
METHOD 518518-2
tests which damage protective coatings. Because this test is similar in severity to the salt fog test,recommend separate test items be used for each.
- Sand and dust testing deposits may inhibit acid effects as well as abrade protective coatings;- Acid deposits may inhibit mold/fungal growth;- Residual deposits may accelerate chemical reactions during humidity testing.
2.4 Determine Test Levels and Conditions.
Having selected this method and relevant procedures (based on the test item's requirements documents and thetailoring process), complete the tailoring process by identifying appropriate parameter levels and applicable testconditions and techniques for these procedures. Base these selections on the requirements documents, the Life CycleEnvironmental Profile, Operational Environment Documentation (see Part One, figure 1-1), and informationprovided with this procedure. Consider the essential parameters for defining the acidic atmosphere test that includeexposure temperature, exposure time (duration), test item configuration, chemical composition of the testatmosphere, and concentration of the test solution.
2.4.1 Temperature severities.
The test method and the exposure temperature used in this procedure are similar to that used in the salt fog test.
2.4.2 Test duration.
Two severity levels are defined (reference b.). In view of the complexity of naturally occurring corrosion processes,no strict equivalencies with real exposure can be quoted. Use severity "a" below for simulating infrequent periods ofexposure, or for exposure in areas of much lower acidity. Use severity "b" below to represent approximately 10years natural exposure in a moist, highly industrial area, or a shorter period in close proximity to vehicle exhaustsystems, particularly ship funnel exhausts where the potential acidity is significantly higher.
a. Three 2-hour spraying periods with 22 hours storage after each.
b. Four 2-hour spraying periods with 7 days storage after each.
2.4.3 Test item configuration.
The configuration of the materiel is an important factor in how an acidic atmosphere affects it. Therefore, during thetest use the anticipated configuration of the materiel during storage or use. As a minimum, consider the followingconfigurations:
a. In a shipping/storage container or transit case.
b. Protected or unprotected.
c. Deployed (realistically or with restraints, such as with openings that are normally covered).
d. Modified with kits for special applications.
2.4.4 Chemical composition and concentration.
For spraying, use a test solution containing 11.9mg (6 Pl) sulfuric acid (95-98%)/4 liters of solution and 8.8mg (6 Pl)nitric acid (68-71%)/4 liters solution in distilled or deionized water. This will produce a solution with a pH of 4.17which is representative of some of the worst rain pH’s recorded for rainfall in the eastern United States and otherheavily industrialized areas with acidic emissions. Reference c. provides information regarding the more commonchemical environmental contaminants together with some consequent likely forms of corrosion that material couldencounter.
WARNING: Strong acids are hazardous. The solution to be sprayed is harmful to people and clothing.Operators carrying out the test must take suitable precautions.
WARNING: Refer to the supplier’s Material Safety Data Sheet (MSDS) or equivalent for health hazard data.
Downloaded from http://www.everyspec.com on 2012-06-04T5:34:26.
MIL-STD-810F1 January 2000
METHOD 518518-3
a. Do not enter the chamber during spraying and, before entry after spraying, purge the chamber with cleanair to a level that will satisfy local safety requirements. Continue purging at intervals if necessary toensure the concentration of noxious fumes remains at a suitably low level.
b. Wear a suitable respirator and/or eye protection. Use rubber gloves to handle materiel.
c. See paragraph 4.1b for hazardous waste disposal information.
2.4.5 Operational considerations.
The test item will not normally be required to function during the test, but may be required to do so upon completionof the test, or on completion of a representative sequence of environmental tests.
3. INFORMATION REQUIRED.
3.1 Pretest.
The following information is required to conduct acidic atmosphere tests adequately.
a. General. Information listed in Part One, paragraphs 5.7 and 5.9, and Appendix A, Task 405 of thisstandard.
b. Specific to this method.
(1) Areas of the test item visually and functionally examined and an explanation of their inclusion orexclusion.
(2) Whether the test is a demonstration of performance or survival.
(3) Whether the requirement is to demonstrate safety, safety and performance, or resistance to chemicalattack after the test.
(4) If functional performance is to be assessed, the phases of the test when the test item is to functionand be assessed, and the levels of performance required.
3.2 During Test.
Collect the following information during conduct of the test:
a. General. Information listed in Part One, paragraph 5.10, and in Appendix A, Task 406 of this standard.
b. Specific to this method.
(1) Record of chamber temperature versus time conditions.
(2) Fallout quantities per unit of time (see paragraph 4.1g).
(3) pH.
3.3 Post Test.
The following post test information is required.
a. General. Information listed in Part One, paragraph 5.13, and in Appendix A, Task 406 of this standard.
b. Specific to this method.
(1) Areas of the test item visually and functionally examined and an explanation of their inclusion orexclusion.
(2) Test variables:
(a) Test solution pH.(b) Test solution fallout rate (ml/cm2/hr).
Downloaded from http://www.everyspec.com on 2012-06-04T5:34:26.
MIL-STD-810F1 January 2000
METHOD 518518-4
(3) Results of examination for corrosion, electrical, and physical effects.
(4) Observations to aid in failure analysis.
4. TEST PROCESS.
4.1 Test Facility.
a. For construction of the chamber, supporting racks, and spraying equipment use materials inert to the acidsolution being sprayed, and that will not cause electrolytic corrosion with material with which it comes incontact.
b. Ensure the test chamber has a waste collection system so that all waste material can be tested prior todisposal. Dispose of any material determined to be hazardous waste in accordance with local, state, andfederal regulations.
c. Do not respray acidic test solution drippings from the walls and ceilings of the chamber and from the testitem. Vent the exposure chamber to prevent pressure buildup.
d. Use a chamber capable of maintaining temperatures in the exposure zone at 35 r2qC. Continuouslycontrol this temperature during the test. Do not use immersion heaters within the chamber exposure areafor the purpose of maintaining the temperature within the exposure zone.
e. Use an acid solution reservoir and dispenser made of material that is non-reactive with the acid solution,e.g., glass, hard rubber, or plastic. The reservoir provides a continuous supply to a tank normally (butnot necessarily) situated inside the test section in which the acid solution level is held reasonablyconstant. The atomizers are connected to this tank.
f. Use a chamber with a means for injecting the acid solution into the test chamber and with an input airhumidifier to minimize clogging of the nozzles. Use atomizers of such design and construction as toproduce a finely divided, wet, dense fog. Use atomizing nozzles and a piping system made of materialthat is non-reactive to the acid solution. Use a facility designed to provide the required atomizationdistribution and fallout.
g. Use a test setup that includes a minimum of 2 fallout collection receptacles. One is to be at the perimeterof the test item nearest to the nozzle, and the other also at the perimeter of the test item but at the farthestpoint from the nozzle. If multiple nozzles are used, the same principles apply. Place the receptacles sothat they are not shielded by the test item and will not collect drops of solution from the test item or othersources.
h. Constant air pressure for the continuous, uniform atomization of the acid solution using a compressed airsupply, and produce a fallout such that each receptacle collects from 1 to 3 ml of solution per hour foreach 80 cm2 of horizontal collecting area (10 cm diameter).
4.2 Controls.
a. Compressed air. Preheat the oil and dirt-free compressed air used to produce the atomized solution (tooffset the cooling effects of expansion to atmospheric pressure) and pre-humidify it such that thetemperature is 35 r2°C and the relative humidity is in excess of 85% at the nozzle (see table 518-I).
b. Preheating. Heat the acid solution to within r6°C of the test section temperature before injection into thetest section.
c. Test section air circulation. Use an air velocity in the test chambers that is minimal (essentially zero).
Downloaded from http://www.everyspec.com on 2012-06-04T5:34:26.
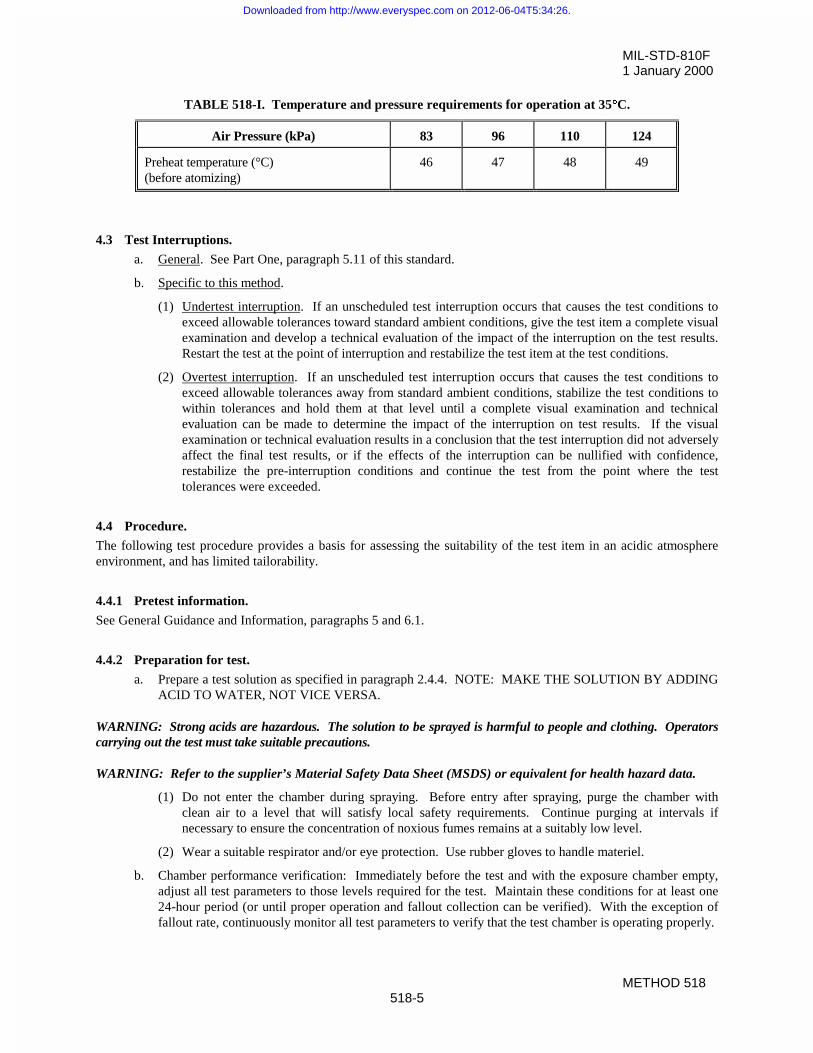
MIL-STD-810F1 January 2000
METHOD 518518-5
TABLE 518-I. Temperature and pressure requirements for operation at 35qqC.
Air Pressure (kPa) 83 96 110 124
Preheat temperature (°C)(before atomizing)
46 47 48 49
4.3 Test Interruptions.
a. General. See Part One, paragraph 5.11 of this standard.
b. Specific to this method.
(1) Undertest interruption. If an unscheduled test interruption occurs that causes the test conditions toexceed allowable tolerances toward standard ambient conditions, give the test item a complete visualexamination and develop a technical evaluation of the impact of the interruption on the test results.Restart the test at the point of interruption and restabilize the test item at the test conditions.
(2) Overtest interruption. If an unscheduled test interruption occurs that causes the test conditions toexceed allowable tolerances away from standard ambient conditions, stabilize the test conditions towithin tolerances and hold them at that level until a complete visual examination and technicalevaluation can be made to determine the impact of the interruption on test results. If the visualexamination or technical evaluation results in a conclusion that the test interruption did not adverselyaffect the final test results, or if the effects of the interruption can be nullified with confidence,restabilize the pre-interruption conditions and continue the test from the point where the testtolerances were exceeded.
4.4 Procedure.
The following test procedure provides a basis for assessing the suitability of the test item in an acidic atmosphereenvironment, and has limited tailorability.
4.4.1 Pretest information.
See General Guidance and Information, paragraphs 5 and 6.1.
4.4.2 Preparation for test.
a. Prepare a test solution as specified in paragraph 2.4.4. NOTE: MAKE THE SOLUTION BY ADDINGACID TO WATER, NOT VICE VERSA.
WARNING: Strong acids are hazardous. The solution to be sprayed is harmful to people and clothing. Operatorscarrying out the test must take suitable precautions.
WARNING: Refer to the supplier’s Material Safety Data Sheet (MSDS) or equivalent for health hazard data.
(1) Do not enter the chamber during spraying. Before entry after spraying, purge the chamber withclean air to a level that will satisfy local safety requirements. Continue purging at intervals ifnecessary to ensure the concentration of noxious fumes remains at a suitably low level.
(2) Wear a suitable respirator and/or eye protection. Use rubber gloves to handle materiel.
b. Chamber performance verification: Immediately before the test and with the exposure chamber empty,adjust all test parameters to those levels required for the test. Maintain these conditions for at least one24-hour period (or until proper operation and fallout collection can be verified). With the exception offallout rate, continuously monitor all test parameters to verify that the test chamber is operating properly.
Downloaded from http://www.everyspec.com on 2012-06-04T5:34:26.
MIL-STD-810F1 January 2000
METHOD 518518-6
c. Conduct an operational checkout in accordance with the test plan and record the results for compliancewith Part One, paragraph 5.9. Handle the test item as little as possible, particularly on the significantsurfaces, and prepare it for test immediately before exposure. Unless otherwise specified, use test itemsfree of surface contamination such as oil, grease, or dirt, which could cause dewetting. Do not includethe use of corrosive solvents, solvents which deposit either corrosive or protective films, or abrasivesother than pure magnesium oxide in the cleaning methods.
4.4.3 Acidic atmosphere test procedure.
Step 1. With the test item installed in the test chamber in its storage configuration (or as otherwise specified inthe requirements documents), adjust the test chamber temperature to 35°C and temperature conditionthe test item for at least 2 hours before introducing the acid solution.
Step 2. Expose the test item to one of the two following severities as specified in the test plan. (See paragraph2.4.2.)a. Four 2-hour spraying periods with 7 days storage after each.
b. Three 2-hour spraying periods with 22 hours storage after each.
Step 3. At the completion of Step 2, stabilize the test item at standard ambient conditions.Step 4. Visually examine the test item to the extent practical.Step 5. If required, place the test item in an operational configuration and conduct an operational check of the
test item.Step 6. If required, test items may be cleaned by rinsing in distilled/deionized water and dried by the
application of heat (up to 55°C), where this is acceptable, or by other means. Collect the rinse waterand check it for hazardous substances prior to disposal (see paragraph 4.1b also).
Step 7. At the end of this test, and in conformity with the requirements documents, examine the test item forcorrosion and deterioration of parts, finishes, materials, and components.
5. ANALYSIS OF RESULTS.
In addition to the guidance provided in Part One, paragraphs 5.14 and 5.17, the following information is provided toassist in the evaluation of the test results. Analyze any corrosion for its immediate effect on the satisfactoryfunctioning of the test item. Satisfactory operation following this test is not the sole criterion for pass/fail.
6. REFERENCE/RELATED DOCUMENTS.
a. DEF STAN 00-50, Guide to Chemical Environmental Contaminants and Corrosion Affecting the Designof Military Materiel. (UK)
b. IEC 68-2-52, 1966, Test Kb, Salt Mist, Cyclic, NaCl solution.
c. Acid Deposition in the United Kingdom, Warren Spring Laboratory, ISBN 085624 323X. (UK)
d. NATO STANAG 4370, Environmental Testing.
e. NATO Allied Environmental Conditions and Test Publication (AECTP) 300, Climatic EnvironmentalTests, Method 319, “Acidic Atmosphere.”
Downloaded from http://www.everyspec.com on 2012-06-04T5:34:26.
MIL-STD-810F1 January 2000
METHOD 519.5519.5-i
METHOD 519.5
GUNFIRE VIBRATION
CONTENTSParagraph Page
1. SCOPE. .............................................................................................................................. 1
1.1 Purpose............................................................................................................................... 11.2 Application........................................................................................................................... 11.3 Limitations........................................................................................................................... 2
2. TAILORING GUIDANCE. ................................................................................................... 2
2.1 Selecting the Gunfire Method. ............................................................................................ 22.1.1 Effects of gunfire. ................................................................................................................ 22.1.2 Sequence among other methods........................................................................................ 22.2 Selecting a Procedure......................................................................................................... 32.2.1 Procedure selection considerations. ................................................................................... 32.2.2 Difference among procedures. ........................................................................................... 42.3 Determine Test Levels and Conditions. .............................................................................. 42.3.1 General considerations. ...................................................................................................... 52.3.2 Test conditions.................................................................................................................... 52.3.3 Test axes and number of gunfire events. ........................................................................... 52.4 Test Item Configuration. ..................................................................................................... 52.5 Controls............................................................................................................................... 52.5.1 Control options.................................................................................................................... 52.5.1.1 Open loop. .......................................................................................................................... 52.5.1.2 Single point control.............................................................................................................. 52.5.1.3 Multiple point control. .......................................................................................................... 62.5.2 Control methods.................................................................................................................. 62.5.2.1 Waveform control................................................................................................................ 62.5.2.2 Random vibration control. ................................................................................................... 6
3. INFORMATION REQUIRED............................................................................................... 6
3.1 Pretest................................................................................................................................. 63.2 During Test. ........................................................................................................................ 73.3 Post-test.............................................................................................................................. 7
4. TEST PROCESS. ............................................................................................................... 7
4.1 Test Facility. ........................................................................................................................ 74.2 Controls............................................................................................................................... 84.2.1 Direct reproduction of measured materiel response data................................................... 84.2.2 Statistically generated repetitive pulse – mean (deterministic) plus residual (stochastic)
pulse ………………………………………………………………………………………… 84.2.3 Repetitive pulse shock response spectrum ........................................................................ 84.2.4 High level random vibration/sine-on-random vibration/narrowband random-on-random
vibration............................................................................................................................... 94.3 Instrumentation. .................................................................................................................. 94.4 Data Analysis. ..................................................................................................................... 94.5 Test Execution. ................................................................................................................. 104.5.1 Preparation for test. .......................................................................................................... 10
Downloaded from http://www.everyspec.com on 2012-06-04T5:34:26.
MIL-STD-810F1 January 2000
METHOD 519.5
519.5-ii
CONTENTSParagraph Page
4.5.1.1 Preliminary guidelines. ...................................................................................................... 104.5.1.2 Pretest checkout. .............................................................................................................. 104.5.1.3 Procedure overview. ......................................................................................................... 104.5.1.4 Test item considerations................................................................................................... 114.5.2 Procedure I - Direct reproduction of measured materiel response data........................... 114.5.2.1 Controls............................................................................................................................. 114.5.2.2 Test tolerances. ................................................................................................................ 114.5.2.3 Procedure steps................................................................................................................ 114.5.2.4 Analysis of results. ............................................................................................................ 124.5.3 Procedure II - Statistically generated repetitive pulse – mean (deterministic) plus
residual (stochastic) pulse. ............................................................................................... 124.5.3.1 Controls............................................................................................................................. 124.5.3.2 Test tolerances. ................................................................................................................ 124.5.3.3 Procedure steps................................................................................................................ 124.5.3.4 Analysis of results. ............................................................................................................ 134.5.4 Procedure III – Repetitive pulse shock response spectrum (SRS)................................... 134.5.4.1 Controls............................................................................................................................. 134.5.4.2 Test tolerances. ................................................................................................................ 134.5.4.3 Procedure steps................................................................................................................ 134.5.4.4 Analysis of results. ............................................................................................................ 134.5.5 Procedure IV - High level random vibration/sine-on-random vibration/narrowband
random-on-random vibration. ........................................................................................... 144.5.5.1 Controls............................................................................................................................. 144.5.5.2 Test tolerances. ................................................................................................................ 144.5.5.3 Procedure steps................................................................................................................ 144.5.5.4 Analysis of results. ............................................................................................................ 15
5. REFERENCE/RELATED DOCUMENTS.......................................................................... 15
ANNEX A. DIRECT REPRODUCTION OF MEASURED MATERIEL RESPONSE DATA
1. SCOPE. .............................................................................................................................. 1
1.1 Purpose............................................................................................................................... 11.2 Application........................................................................................................................... 1
2. DEVELOPMENT................................................................................................................. 1
2.1 Basic Considerations for Environment Determination. ....................................................... 12.2 Test Configuration............................................................................................................... 12.3 Creating a Digital File of the Gunfire Vibration Materiel Response..................................... 12.4 Characterization of Vibration Exciter Drive Signal/Test Item Inverse Frequency
Response Function. ............................................................................................................ 22.5 Tapering the Inverse Frequency Response Function. ........................................................ 22.6 Computing the Impulse Response Function....................................................................... 22.7 Computing the Compensated Vibration Exciter Drive Signal.............................................. 22.8 Reproducing the Gunfire Materiel Response...................................................................... 22.9 Conclusion. ......................................................................................................................... 32.10 Reference/Related Documents........................................................................................... 3
Downloaded from http://www.everyspec.com on 2012-06-04T5:34:26.
MIL-STD-810F1 January 2000
METHOD 519.5519.5-iii
CONTENTSParagraph Page
3. RECOMMENDED PROCEDURES. ................................................................................... 3
3.1 Recommended Procedure.................................................................................................. 33.2 Uncertainty Factors............................................................................................................. 3
FIGURESFIGURE 519.5A-1. Digital flight data. ............................................................................................. 4FIGURE 519.5A-2. Swept sine vibration exciter input with resulting test item response................ 4FIGURE 519.5A-3. Modulus and phase of inverse frequency response function. ......................... 5FIGURE 519.5A-4. Modulus and phase of tapered inverse frequency response function. ............ 5FIGURE 519.5A-5. Impulse response function............................................................................... 6FIGURE 519.5A-6. Compensated vibration exciter drive signal along with resulting test
item response.................................................................................................. 6FIGURE 519.5A-7. Comparison of measured gunfire materiel response with laboratory simulated
gunfire test item response. .............................................................................. 7
ANNEX B. STATISTICALLY GENERATED REPETITIVE PULSE – MEAN(DETERMINISTIC) PLUS RESIDUAL (STACHASTIC) PULSE
1. SCOPE. .............................................................................................................................. 1
1.1 Purpose............................................................................................................................... 11.2 Application........................................................................................................................... 1
2. DEVELOPMENT................................................................................................................. 1
2.1 Nomenclature for Annex B.................................................................................................. 12.2 Introduction. ........................................................................................................................ 22.3 Assumptions. ...................................................................................................................... 22.4 Modeling and Statistics for Description of a Materiel Response Time-varying Random
Process. .............................................................................................................................. 32.5 Specific Application of the Model to the Measured Materiel Response. ............................. 52.6 Implementation. .................................................................................................................. 62.7 References/Related Documents......................................................................................... 6
3. RECOMMENDED PROCEDURES. ................................................................................... 7
3.1 Recommended Procedure.................................................................................................. 73.2 Uncertainty Factors............................................................................................................. 7
FIGURESFIGURE 519.5B-1. Fifty round 30mm gunfire event. ...................................................................... 8FIGURE 519.5B-2. Ensemble sample time history pulse (pulse 37). ............................................. 8FIGURE 519.5B-3. Ensemble residual sample time history pulse (pulse 37). ............................... 8FIGURE 519.5B-4. Ensemble time-varying mean estimate. .......................................................... 9FIGURE 519.5B-5. Ensemble time-varying standard deviation estimate. ...................................... 9FIGURE 519.5B-6. Ensemble time-varying root mean square estimate. ....................................... 9FIGURE 519.5B-7. Energy spectral density function estimate. .................................................... 10FIGURE 519.5B-8. Short time energy spectral density function estimate (data).......................... 10FIGURE 519.5B-9. Short time energy spectral density function estimate (residual). ................... 10FIGURE 519.5B-10. Non-stationary model deterministic functions.............................................. 11
Downloaded from http://www.everyspec.com on 2012-06-04T5:34:26.
MIL-STD-810F1 January 2000
METHOD 519.5
519.5-iv
CONTENTSParagraph Page
FIGURE 519.5B-11. Segmented ESD ratio. ................................................................................. 11FIGURE 519.5B-12. Smoothed simulation root variance estimate for the time-varying mean
for simulated ensembles sample sizes of 10, 25, and 50. Sample timehistories maximum and median. .................................................................. 11
FIGURE 519.5B-13. Smoothed simulation root variance esimtates for the time-varyingstandard deviation for simulated ensemble sample sizes of 10, 25, and50 sample time histories maximum and median Np = 10, 25, and 50. ........ 12
FIGURE 519.5B-14. Smoothed simulation root variance estimate for the time-varying rootmean square for simulated ensemble sample sizes of 10, 25 and 50.Sample time histories maximum and median. ............................................. 12
ANNEX C. REPETITIVE PULSE SHOCK RESPONSE SPECTRUM (SRS)
1. SCOPE. .............................................................................................................................. 1
1.1 Purpose............................................................................................................................... 11.2 Application........................................................................................................................... 1
2. DEVELOPMENT................................................................................................................. 1
2.1 Introduction. ........................................................................................................................ 12.1.1 Advantages of this procedure are: ...................................................................................... 12.1.2 Disadvantages of this procedure are: ................................................................................. 22.2 Test Configuration............................................................................................................... 22.3 Creating a Digital File of the Gunfire Materiel Response Vibration..................................... 22.4 Computing the Shock Response Spectra........................................................................... 22.5 Estimating Equivalent Half-Cycle Content of Representative Gunfire Materiel
Response Pulse.................................................................................................................. 22.6 Generating SRS Transient for Representative Gunfire Materiel Response Pulse. ............ 22.7 Simulating the Gunfire Materiel Response. ........................................................................ 32.8 Reference/Related Documents........................................................................................... 3
3. RECOMMENDED PROCEDURES. ................................................................................... 3
3.1 Recommended Procedure.................................................................................................. 33.2 Uncertainty Factors............................................................................................................. 3
TABLE
TABLE 519.5C-I. Amplitude modulated sine wave definition for SRS gunfire materielresponse pulse................................................................................................... 4
FIGURES
FIGURE 519.5C-1. Digitized flight data. ......................................................................................... 5FIGURE 519.5C-2. Comparison of representative gunfire pulse using .......................................... 5FIGURE 519.5C-3. SRS gunfire pulse generated using a digital controller.................................... 6FIGURE 519.5C-4. SRS pulse gunfire simulation-analytical pulse concatenation. ........................ 6
Downloaded from http://www.everyspec.com on 2012-06-04T5:34:26.
MIL-STD-810F1 January 2000
METHOD 519.5519.5-v
CONTENTSParagraph Page
ANNEX D. HIGH LEVEL RANDOM VIBRATION/SINE-ON-RANDOMVIBRATION/ NARROWBAND RANDOM-ON-RANDOM VIBRATION
1. SCOPE. .............................................................................................................................. 1
1.1 Purpose............................................................................................................................... 11.2 Application........................................................................................................................... 1
2. DEVELOPMENT................................................................................................................. 1
2.1 Introduction. ........................................................................................................................ 12.2 Predicting Gunfire Vibration Spectra................................................................................... 22.3 Duration of Test. ................................................................................................................. 32.4 Spectrum Generation Techniques. ..................................................................................... 32.5 Reference/Related Documents........................................................................................... 3
3. RECOMMENDED PROCEDURES. ................................................................................... 3
3.1 Recommended Procedure.................................................................................................. 33.2 Uncertainty Factors............................................................................................................. 3
TABLES
TABLE 519.5D-I. Suggested generalized parametric equations for gunfire-induced vibration....... 4TABLE 519.5D-II. Typical gun configurations associated with aircraft classes. ............................. 5TABLE 519.5D-III. Gun specifications. ........................................................................................... 6
FIGURES
FIGURE 519.5D-1. Generalized gunfire induced vibration spectrum shape. ................................. 7FIGURE 519.5D-2. The distance parameter (D) and the depth parameter (Rs)............................. 7FIGURE 519.5D-3. Multiple guns, closely grouped. ....................................................................... 8FIGURE 519.5D-4. Test level reduction due to gun standoff parameter. ....................................... 8FIGURE 519.5D-5. Test level reduction due to materiel mass loading. ......................................... 9FIGURE 519.5D-6. Test level reduction due to depth parameter. .................................................. 9FIGURE 519.5D-7. Decrease in vibration level with vector distance from gun muzzle. ............... 10FIGURE 519.5D-8. Gunfire peak vibration reduction with distance.............................................. 10
Downloaded from http://www.everyspec.com on 2012-06-04T5:34:26.

MIL-STD-810F1 January 2000
METHOD 519.5
519.5-vi
THIS PAGE INTENTIONALLY BLANK
Downloaded from http://www.everyspec.com on 2012-06-04T5:34:26.
MIL-STD-810F1 January 2000
METHOD 519.5519.5-1
METHOD 519.5
GUNFIRE VIBRATION
NOTE: Tailoring is essential. Select methods, procedures, and parameter levels based on the tailoring processdescribed in Part One, paragraph 4, and Appendix C. Apply the general guidelines for laboratory test methodsdescribed in Part One, paragraph 5 of this standard.
1. SCOPE.
1.1 Purpose.
Gunfire vibration tests are performed to provide a degree of confidence that materiel can physically and functionallywithstand the relatively infrequent, repetitive shock or transient vibration encountered in operational environmentsduring the firing of a low caliber gun.
1.2 Application.
Use this method to evaluate the physical and functional performance of materiel likely to be exposed to a gunfireenvironment in its lifetime. This test method is applicable where materiel is required to demonstrate its adequacy toresist repetitive gunfire environment without unacceptable degradation of its functional performance and/orstructural integrity. In general, the gunfire environment may be considered to be a repetitive shock or transientvibration produced by (1) gun muzzle blast pressure impinging on a materiel surface, (2) structure-borne repetitiveshock or transient vibration due to actuation of the gun mechanism, and/or a combination of (1) and (2). The closerthe materiel surface is to pressure pulse exposure, the more the measured environment appears as a repetitive shockproducing high rise time and rapid decay of materiel response, and the less role the structure-borne vibrationcontributes to the overall materiel response environment. The farther the materiel surface is from the pressure pulseexposure, the more the measured environment appears as a structure-borne repetitive shock or transient vibration thathas been filtered by structure intervening between the gun source and the materiel. In general, repetitive shock ortransient vibration applied to a complex multi-modal materiel system will cause the materiel to respond to (1) forcedfrequencies imposed on the materiel from the external excitation environment, and (2) the materiel's resonant naturalfrequencies either during or immediately after application of the excitation. Such response may cause:
a. materiel failure as a result of increased or decreased friction between parts, or general interferencebetween parts;
b. changes in materiel dielectric strength, loss of insulation resistance, variations in magnetic andelectrostatic field strength;
c. materiel electronic circuit card malfunction, electronic circuit card damage, and electronic connectorfailure. (On occasion, circuit card contaminants having the potential to cause short circuits may bedislodged under materiel response to gunfire environment);
d. permanent mechanical deformation of the materiel as a result of overstress of materiel structural and non-structural members;
e. collapse of mechanical elements of the materiel as a result of the ultimate strength of the element beingexceeded;
f. accelerated fatiguing of materials (low cycle fatigue);
g. potential piezoelectric activity of materials; and
h. materiel failure as a result of cracks and fracture in crystals, ceramics, epoxies, or glass envelopes.
Downloaded from http://www.everyspec.com on 2012-06-04T5:34:26.
MIL-STD-810F1 January 2000
METHOD 519.5
519.5-2
1.3 Limitations.
It may not be possible to replicate some operational service gunfire materiel response environments because ofimpedance mismatches. In particular, laboratory fixture limitations or other physical constraints may prevent thesatisfactory application of the gunfire induced excitation to a test item in the laboratory. In addition:
a. This method does not include the repetitive shock or transient vibration effects experienced by very largeextended materiel, e.g., airframe structural systems, over which varied parts of the materiel mayexperience different and uncorrelated external excitation. For this type of repetitive shock or transientvibration, specialized tests based on experimental data must be devised.
b. This method does not include special provisions for performing gunfire vibration tests at high or lowtemperatures. This includes the extreme temperature environments directly related to the gunfire pressurewave emission and materiel absorption of thermal energy. Perform tests at ambient temperature unlessotherwise specified. Guidelines found in this section of the standard, however, may be helpful in settingup and performing gunfire vibration tests at high or low temperatures, but not at gun pressure wavetemperatures.
c. This method is not intended to simulate blast pressure or acoustic effects as a result of exposure togunfire environment.
d. This method does not include engineering guidelines related to unplanned test interruption as a result oftest equipment or other malfunction. Generally, if interruption occurs during a gunfire vibration testinput, repeat that gunfire vibration test input. Care must be taken to ensure stresses induced by theinterrupted gunfire vibration test do not invalidate subsequent test results. It is incumbent on all testfacilities that data from such interruptions be recorded and analyzed before continuing with the testsequence. In addition, the materiel must be inspected prior to test to ensure pre-gunfire vibration testmateriel integrity.
2. TAILORING GUIDANCE.
2.1 Selecting the Gunfire Vibration Method.
After examining requirements documents and applying the tailoring process in Part One of this standard to determinewhere exposure to a gunfire environment is foreseen in the life cycle of the materiel, use the following to confirm theneed for this method and to place it in sequence with other methods.
2.1.1 Effects of a gunfire environment.
Exposure to a gunfire environment has the potential for producing adverse effects on the physical and functionalintegrity of all materiel. In general, the level of adverse effects increases with the caliber of the gun, proximity of themateriel to the gun, and the duration of the gunfire environment. The gunfire firing rate and the duration of gunfireenvironment exposure that correspond with natural frequencies of the materiel (along with its subharmonics andsuperharmonics) will magnify the adverse effects on the materiel's overall physical and functional integrity.
2.1.2 Sequence among other methods.
a. General. See Part One, paragraph 5.5.
b. Unique to this method. Sequencing among other methods will depend upon the type of testing i.e.,developmental, qualification, endurance, etc. and the general availability of test items. Normally,schedule gunfire vibration tests early in the test sequence, but after any vibration and shock tests.
(1) If the gunfire environment is deemed particularly severe and the chances of materiel survival withoutmajor structural or functional failure are small, perform the gunfire vibration test first in the test
Downloaded from http://www.everyspec.com on 2012-06-04T5:34:26.
MIL-STD-810F1 January 2000
METHOD 519.5519.5-3
sequence. This provides the opportunity to redesign the materiel to meet the gunfire vibrationrequirement before testing to the more benign environments.
(2) If the gunfire environment is deemed severe but the chances of the materiel survival withoutstructural or functional failure is good, perform the gunfire vibration test after vibration, thermal andshock tests, allowing the stressing of the test item prior to gunfire vibration testing to uncovercombined, vibration, temperature shock, and gunfire vibration environmental failures. (There areoften advantages to applying gunfire vibration tests before climatic tests, provided this sequencerepresents realistic service conditions. Climate-sensitive defects often show up more clearly afterthe application of severe gunfire environments. However, internal or external thermal stresses maypermanently weaken materiel resistance to vibration, shock, and gunfire that may go undetected ifgunfire vibration tests are applied before climatic tests.)
(3) In cases in which the gunfire vibration test levels are deemed less severe than the vibration testlevels, the gunfire vibration tests may be deleted from the testing sequence.
(4) The gunfire environment may affect materiel performance when materiel is tested simultaneously toother environmental conditions such as vibration, shock, temperature, humidity, pressure, etc. Ifmateriel is known to be sensitive to a combination of environments, test to those environmentssimultaneously. If it is impractical to test to a combination of environments simultaneously, andwhere it is necessary to evaluate the effects of the gunfire environment together with otherenvironments, expose a single test item to all relevant environmental conditions in turn. In general,gunfire may occur at any time during the specified operational conditions, so sequence it as close aspractical to the life cycle environmental profile. If in doubt, conduct it immediately after completingany vibration and shock testing.
2.2 Selecting a Procedure.
This method includes a set of three Pulse Procedures and one Vibration Procedure.
a. Pulse Procedures.
(1) Procedure I: Direct Reproduction of Measured Materiel Response Data.
(2) Procedure II: Statistically Generated Repetitive Pulse – Mean (Deterministic) Plus Residual(Stochastic) Pulse.
(3) Procedure III: Repetitive Pulse Shock Response Spectrum (SRS).
b. Vibration Procedure.
Procedure IV: High Level Random Vibration/Sine-on-Random Vibration / Narrowband Random-on-Random Vibration.
2.2.1 Procedure selection considerations.
Based on the test data requirements, determine which test procedure, combination of procedures, or sequence ofprocedures is applicable. In many cases, one or more of the procedures will apply. Consider all gunfireenvironments anticipated for the materiel during its life cycle, both in its logistic and operational modes. Whenselecting procedures, consider:
a. Materiel response. Materiel response to a substantial gunfire environment is characterized by a highlevel repetitive shock or transient vibration. Such an environment has principal frequency components atthe firing rate of the gun and its harmonics. In addition, there exists comparatively low level randomvibration energy distributed at other frequencies from DC to 2 kHz. The gunfire environment isconsidered to be non-stationary because it usually has a time varying root-mean-square (rms) level that issubstantially above the ambient or aircraft-induced environmental vibration level for a short period oftime. Because of the nature of the measured response data, the analysis is usually not easily interpretedin terms of either stationary measures of the environment such as autospectral density estimates, ortransient measures of the environment in terms of shock response spectra. In this case select one of the
Downloaded from http://www.everyspec.com on 2012-06-04T5:34:26.
MIL-STD-810F1 January 2000
METHOD 519.5
519.5-4
Pulse Procedures. Materiel response to a benign gunfire environment is characterized by a slightincrease in the ambient vibration level with no readily distinguishable pulse characteristics. Stationaryrandom vibration analysis techniques may be used to specify the test, and Procedure IV may be used. The choice of test procedures is also governed by the in-service gunfire environment and the availabilityof measured data. It is assumed in applying these procedures that the dynamics of the materiel are wellknown, in particular, the resonances of the materiel and the relationship of these resonances to thegunfiring rate and its harmonics. Improper test procedure selection may result in either anunconservative materiel undertest or a substantial materiel overtest. These procedures can be expected tocover the entire range of testing related to materiel exposed to gunfire environment. In summary,
(1) for severe materiel response to gunfire environment with measured data, use Procedures I, II, or III.
(2) for benign materiel response to aircraft gunfire with or without measured data use Procedure IV.
b. The operational purpose of the materiel. From requirement documents, determine the operations orfunctions to be performed by the materiel before, during, and after exposure to the gunfire environment.
c. The natural exposure circumstances. Materiel response to a gunfire environment is heavily dependentupon the caliber of the gun and the physical relationship between the gun and the materiel.
d. Data required. The test data required to document the test environment and to verify the performance ofthe materiel before, during, and after the test.
e. Procedure sequence. Refer to paragraph 2.1.2.
2.2.2 Difference among procedures.
a. Procedure I - Direct Reproduction of Measured Materiel Response Data. In-service gunfire environmentmateriel response is replicated under laboratory exciter waveform control to achieve a near exactreproduction of the measured gunfire environment materiel response time history. Use the guidelinesprovided in Annex A.
b. Procedure II - Statistically Generated Repetitive Pulse – Mean (Deterministic) Plus Residual (Stochastic)Pulse. This procedure is based upon a statistical fitting of a model to in-service response data. Statisticalcharacteristics of the in-service gunfire environment materiel response are modeled (usually by creating apulse ensemble and obtaining a time varying mean pulse and its associated residuals via nonstationarydata processing techniques). The statistical model of the gunfire environment response is replicatedunder laboratory exciter waveform control to achieve a statistical reproduction of the measured gunfireenvironment materiel response time history. Use the guidelines provided in Annex B.
c. Procedure III – Repetitive Pulse Shock Response Spectrum (SRS). The measured in-service gunfireenvironment materiel response time history is decomposed into individual pulses for analysis. Maximaxshock response spectra are computed over the individual pulses to characterize the gunfire environmentmateriel response by an SRS. A response time history is composed that has a duration equivalent to anindividual measured gunfire materiel environment response pulse and that exhibits the characteristicgunfire SRS. The derived gunfire pulse is repeated at the gunfiring rate. Use the guidelines provided inAnnex C.
d. Procedure IV: High Level Random Vibration/Sine-on-Random Vibration/Narrowband Random-on-Random Vibration. If no pulse form is indicated by the measured in-service gunfire environmentmateriel response time history (in general the firing rate of the gun cannot be determined from anexamination of the field measured materiel response time history), or the materiel is distant from the gunand only high level structure-borne random vibration is exhibited, use the guidelines provided for (1)vibration in method 514.5, (2) sine-on-random or narrowband random-on-random vibration, or (3) shortduration transient vibration in method 516.5, Procedure VIII. In the absence of measured data, use theguidelines provided in Annex D.
Downloaded from http://www.everyspec.com on 2012-06-04T5:34:26.
MIL-STD-810F1 January 2000
METHOD 519.5519.5-5
2.3 Determine Test Levels and Conditions.
Having selected this method and relevant procedures (based on the materiel's requirements documents and thetailoring process), complete the tailoring process by identifying appropriate parameter levels, applicable testconditions, and test techniques for the selected procedures. Base these selections on the requirements documents, theLife Cycle Environmental Profile, Operational Environment Documentation (see Part One, figure 1-1), andinformation provided with this procedure. Consider the following when selecting test levels.
2.3.1 General considerations.
Establish the test severities using available data or data acquired directly from an environmental data measurementprogram. When these data are not available, test severities and guidance may be found in Annex D. Annex D is tobe used for aircraft gunfire vibration only. Test guidance is provided in Annexes A through C for cases in whichmeasurement data are available and a precise replication is desired. The test selected may not necessarily be anadequate simulation of the complete environment; thus, a supporting assessment may be necessary to compliment thetest results.
2.3.2 Test conditions.
In all cases care must be taken to replicate the measured environmental materiel response data which may requireestablishing the correct interface impedances. When measured data is not available, the materiel response must be inaccordance with that defined in Procedure IV.
2.3.3 Test axes and number of gunfire events.
The test axes should be in accordance with the physical configuration for the in-service environment. Materialresponse to gunfire pressure pulses will generally involve testing in axes normal to the pressure direction. Materialresponse to structure-borne vibration will generally involve testing in all axes. The number of gunfire events shouldbe in accordance with the Environmental Life-Cycle Profile Document.
2.4 Test Item Configuration.
(See Part One, paragraph 5.8.) Configure the test item for gunfire vibration testing as would be anticipated duringin-service use including particular attention to the details of the mounting of the materiel to the platform. Gunfireresponse vibration can be sensitive to the details of the materiel/platform configuration and input impedances.
2.5 Controls.
The dynamic excitation is controlled to within specified bounds by sampling the dynamic response of the test item atspecific locations. These locations may be at or in close proximity to the materiel fixing points (controlled inputtests) or at defined points on the materiel (controlled response tests). The dynamic motions may be sampled at asingle point or at several locations (multi-point).
a. For Procedures I, II, and III the electrodynamic or electrohydraulic vibration exciter is operated in anopen loop waveform control configuration with materiel response replication at a single point.
b. For Procedure IV, either single or multi-point control may be used.
2.5.1 Control options.
2.5.1.1 Open loop.
The Pulse Procedures tests are of short duration and performed in an open loop mode after appropriate compensationof the analog voltage input waveform.
Downloaded from http://www.everyspec.com on 2012-06-04T5:34:26.
MIL-STD-810F1 January 2000
METHOD 519.5
519.5-6
2.5.1.2 Single point control.
Single point control is a minimum requirement for Procedure IV. Select a single point to represent, as close aspossible, the materiel hard point from which the field-measured data were obtained or upon which predictions arebased.
2.5.1.3 Multiple point control.
For Procedure IV where the materiel is distant from the gunfire input environment and the measured response data atappropriate hard points indicate no more than a random vibration environment slightly above ambient conditions,multiple point control may be desirable. Multiple point control will be based on the specified control strategy thatmay include the average of the ASD’s of the control points selected.
2.5.2 Control methods.
2.5.2.1 Waveform control.
Application of the techniques for Procedures I, II, and III will generally involve a computer with digital-to-analoginterface and analog-to-digital interface with the compensated analog output going directly to drive the exciter. Thisform of control is termed waveform control where the actual form of the time history (nonstationary or stationary) ispreserved in the laboratory replication. Perform signal processing off-line where the resulting properly compensatedvibration exciter drive signal will be stored as a digital signal. Certain modern control systems make specificprovisions for waveform control.
2.5.2.2 Random vibration control.
Whether the control console is digital or analog, use closed loop control. Because the loop time for the vibrationprocedure depends on the desired number of degrees of freedom and on the analysis and overall bandwidths, it isimportant to select these parameters so that test tolerances and control accuracy can be maintained.
3. INFORMATION REQUIRED.
3.1 Pretest.
The following information is required to conduct a gunfire vibration test.
a. General. Information listed in Part One, paragraphs 5.7, 5.8, 5.9, and 5.11 and Appendix A, Tasks 405and 406 of this standard.
b. Specific to this method.
(1) Knowledge of the test fixture, test item and combined test fixture/test item modal frequencies, andtheir relationship to the gunfiring rate. Ideally this would consist of an experimental modal surveyrelated to the test configuration. If this is not practical, a supporting analytical assessment of themodal characteristics of the test configuration needs to be supplied by a trained analyst.
(2) Gunfire environment. Either:
(a) measured data that are input as a compensated waveform into a exciter system under directwaveform control (Procedure I).
(b) measured data that have been statistically processed and a stochastically generated,compensated waveform developed as input into a exciter system under direct waveform control(Procedure II).
(c) measured data that have been statistically processed and a complex shock pulse SRS synthesisform of time history generated (superposition of damped sinusoids, amplitude modulated sinewaves, or other) and compensated that matches a SRS specifying spectrum shape, peakspectrum values, spectrum break points, pulse duration and gunfiring rate (Procedure III).
Downloaded from http://www.everyspec.com on 2012-06-04T5:34:26.
MIL-STD-810F1 January 2000
METHOD 519.5519.5-7
(d) measured high level random or transient vibration (methods 514.5 or 516.5, Procedure VIII),predicted sine-on-random spectrum; or predicted narrowband random-on-random (ProcedureIV).
(3) Techniques used in the processing of the input and the materiel response data.
3.2 During Test.
Collect the following information during conduct of the test:
a. General. Information in Part One, paragraph 5.10, and in Part One, Appendix A, Tasks 405 and 406 ofthis standard.
b. Specific to this method. Information related to failure criteria. Other environmental conditions at whichtesting is to be carried out if other than standard laboratory conditions, and the specific features of thetest assembly (exciter, fixture, interface connections, etc.). For test validation purposes, record achievedtest parameters, deviations from pre-test procedures including parameter levels, and any proceduralanomalies and any test failures.
3.3 Post-test.
Record the following post-test information.
a. General. Information listed in Part One, paragraph. 5.13, and in Appendix A, Tasks 405 and 406 of thisstandard.
b. Specific to this method.
(1) Duration of each exposure and number of exposures.
(2) Functional and physical integrity of the test item after each test based upon functional testing andvisual examination.
(3) Response time histories and the information processed from these time histories. In general, underprocessed information, for
(a) Procedure I. Data that correspond to the analysis performed on the measured data. Thisprocessing may include an autospectral density (ASD) estimate, an average Fourier spectra (FS)or energy spectral density (ESD) estimate, in cases of very short time history records an SRSestimate or some form of nonstationary processing with a time varying spectra.
(b) Procedure II. Data that correspond to the analysis performed on the measured data, which willgenerally require the creation of an ensemble of short time history (pulse) records. Thisprocessing may include an average FS or ESD estimate, an average SRS estimate or some formof nonstationary processing with a time varying spectra over the ensemble of collected data.
(c) Procedure III. Data that correspond to the analysis performed on the measured data that willgenerally require the creation of an ensemble of short time history (pulse) records. Since theinput is the repetition of a fixed waveform, the analysis of one input pulse by way of FS, ESD,or SRS will suffice to define the input. For the measured materiel response output, thisprocessing may include an average FS or ESD estimate, an average SRS estimate, or a singleSRS estimate computed over several pulses.
(d) Procedure IV. Data will be processed to display the frequency spectra defining the event. Ingeneral, this will be an ASD estimate over the duration of the event and displayed by thesoftware used to control the exciter.
(4) Results of operational checks.
(5) Test item and/or fixture modal analysis data.
Downloaded from http://www.everyspec.com on 2012-06-04T5:34:26.
MIL-STD-810F1 January 2000
METHOD 519.5
519.5-8
4. TEST PROCESS.
4.1 Test Facility.
Use a test facility, including all auxiliary equipment, capable of providing the specified gunfire materiel responseenvironments within the tolerances stated in paragraph 4.2. In addition, use measurement transducers, data recordingand data reduction equipment capable of measuring, recording, analyzing, and displaying data sufficient to documentthe test and to acquire any additional data required. Unless otherwise specified, perform the specified gunfirevibration tests and take measurements at standard ambient conditions as specified in Part One, paragraph 5.1.
4.2 Controls.
All measurement devices are to be calibrated in accordance with standard calibration procedures. The complete testparameter control chains (checking, compensation, servoing, recording, etc.) should not produce uncertaintiesexceeding one third of the tolerances specified in paragraphs 4.2.1 through 4.2.4. Because of the nature of thegunfire environment, tolerances may be given in the time, amplitude, and frequency domain according to theprocessing requirements of the procedure. In Procedures I, II, and III it is assumed that the test item responsemeasurement data collected is representative of the true environment and not a function of the local materielconfiguration, e.g., local resonances which may not be controllable to the tolerances in paragraphs 4.2.1 through4.2.4.1
4.2.1 Direct reproduction of measured materiel response data.
a. Time domain. Ensure the duration of one pulse is within 2.5% of the duration obtained from themeasured gunfiring rate.
b. Amplitude domain. Ensure materiel time history major positive and negative response peaks are withinr10% of the measured gunfire time history peaks.
c. Frequency domain. Compute an average ESD estimate over the ensemble created from the materiel timehistory response that is within r 3dB of the average ESD estimate computed over the ensemble createdfrom the measured gunfire time history over at least 90% of the frequency range. In cases in which anensemble from the data cannot be created, compute an ASD estimate of the time history records forcomparison provided the data is appropriately windowed to reduce spectral leakage. The tolerances forthe ASD analysis are r 3dB over at least 90% of the frequency range.
4.2.2 Statistically generated repetitive pulse – mean (deterministic) plus residual pulse (stochastic).
a. Time domain. Ensure the duration of one pulse is within 2.5% of the duration obtained from themeasured gunfiring rate.
b. Amplitude domain. Ensure materiel time history major positive and negative response peaks are withinr10% of the measured gunfire time history peaks.
c. Frequency domain. Compute an average ESD estimate over the ensemble created from the materiel timehistory response that is within r 3dB of the average ESD estimate computed over the ensemble createdfrom the measured gunfire time history over at least 90% of the frequency range.
4.2.3 Repetitive pulse shock response spectra.
a. Time domain. Ensure the duration of one pulse is within 5% of the duration obtained from the measuredgunfiring rate.
1 Use text fixturing that will ensure test item response in other axes does not exceed 25% of the test item response inthe test axis when measured in the time, amplitude, or frequency domain.
Downloaded from http://www.everyspec.com on 2012-06-04T5:34:26.
MIL-STD-810F1 January 2000
METHOD 519.5519.5-9
b. Amplitude domain. Ensure materiel time history major positive and negative response peaks are withinr10% of the measured gunfire time history peaks.
c. Frequency domain. Ensure the shock response spectrum (SRS) computed over the materiel time historyresponse from one simulated gunfire pulse is within –1dB and +3dB from the mean SRS computed overthe ensemble of field measured gunfire materiel response data over at least 90% of the frequency range. Use an SRS analysis of at least 1/6 octave frequency spacing.
4.2.4 High level random vibration/sine-on-random vibration/narrowband random-on-random vibration.
a. Time domain. Ensure the root-mean-square (RMS) value of the amplitude measured at the control pointin the test axis is within r 5% of the preset RMS value. Likewise, ensure the maximum variation of theRMS value at the fixing points in the test axis is r 10% of the preset RMS value.
b. Amplitude domain. Ensure the amplitude distribution of the instantaneous values of the randomvibration measured at the control point is nominally Gaussian. Use an amplitude distribution thatcontains all occurrences up to 2.7 standard deviations. Keep occurrences greater than 3.5 standarddeviations to a minimum.
c. Frequency domain. Ensure an ASD analysis of the materiel time history response is within r3 dB of anASD analysis computed over the field measured gunfire data or the predicted gunfire environment. Allow local exceedances up to r 6 dB above 500 Hz, but limit the accumulation of all local exceedancesto 5% of the overall test frequency range. Use a maximum analysis filter bandwidth of 5 Hz and attemptto have the number of independent statistical degrees of freedom (DOF) for control greater than 100.
4.3 Instrumentation.
In general, acceleration will be the quantity measured to meet specification with care taken to ensure accelerationmeasurements can be made that provide meaningful data (reference a). Give special consideration to themeasurement instrumentation amplitude and frequency range specifications in order to satisfy the measurement andanalysis requirements. All measurement instrumentation must be calibrated to traceable national calibrationstandards (see Part One, paragraph 5.3.2). In addition, instrumentation to measure test item function may berequired. In this case, obtain suitable calibration standards and adhere to them.
a. Accelerometer.
(1) Transverse sensitivity of less than or equal to 5%.
(2) An amplitude linearity within 10% from 5% to 100% of the peak acceleration amplitude required fortesting.
(3) For all gunfire vibration procedures, a flat frequency response within r10% across the frequencyrange 5 – 2 kHz. The measurement devices may be of the piezoelectric or piezoresistive type.
(4) For cases in which response below 2 Hz is desired, piezoresistive accelerometer measurements arerequired with a flat frequency response within r10% across the frequency range DC-2 kHz.
(5) The measurement device and its mounting will be compatible with the requirements and guidelinesprovided in reference a.
b. Other measurement devices. Any other measurement devices used to collect data must be demonstratedto be consistent with the requirements of the test, in particular, the calibration and tolerances provided inparagraph 4.2.
c. Signal conditioning. Use signal conditioning compatible with the instrumentation requirements on themateriel. In particular, filtering will be consistent with the response time history requirements. Usesignal conditioning requirements in accordance with the guidelines provided in reference a. Use extremecare in filtering the acceleration signals at the amplifier output. Do not filter the signal into the amplifierfor fear of filtering bad measurement data and the inability to detect the bad measurement data. Thesignal from the signal conditioning must be anti-alias filtered before digitizing.
Downloaded from http://www.everyspec.com on 2012-06-04T5:34:26.
MIL-STD-810F1 January 2000
METHOD 519.5
519.5-10
4.4 Data Analysis.
a. An analog anti-alias filter configuration will be used that will
(1) not alias more than a 5 percent measurement error into the frequency band of interest (1 Hz to 2kHz).
(2) have linear phase-shift characteristics in the data passband.
(3) have a passband uniform to within one dB across the frequency band of interest (see paragraph 4.3).
b. In subsequent processing of the data, use any additional filtering that is compatible with the anti-aliasanalog filtering. In particular, additional digital filtering must maintain phase linearity for processinggunfire time histories for Procedures I, II, and III.
c. It is suggested for Procedures I, II and III that the time history data be over-sampled by a factor of 10. Ideally, for 2 kHz data, a sample rate of 20,480 (with a linear phase anti-alias filter set at 2.5 kHz) will besuitable. A maximum 5 Hz analysis filter bandwidth is recommended.
d. Analysis procedures will be in accordance with those requirements and guidelines provided in referencea. In particular the test item response acceleration time histories will be qualified according to theprocedures in reference a. In severe cases of response acceleration it may be necessary that each timehistory be integrated to detect any anomalies in the measurement system e.g., cable breakage, amplifierslewrate exceedance, data clipped, unexplained accelerometer offset, etc. The integrated amplitude timehistories will be compared against criteria given in reference a.
4.5 Test Execution.
The following steps, alone or in combination, provide the basis for collecting necessary information concerning thedurability and function of a test item in a gunfire environment.
4.5.1 Preparation for test.
4.5.1.1 Preliminary guidelines.
Prior to initiating any testing, review the pretest information in the test plan to determine test details (e.g., procedure,calibration load (if any), test item configuration, measurement configuration, gunfire level, gunfire duration, numberof repetitions of gunfire event to be applied). Note in particular all details of the test validation procedures. Usefixturing that simulates actual in-service mounting attachments (including vibration isolators and fastener torque, ifappropriate). Install all the connections (cables, pipes, etc.) in a way that they impose stresses and strains on the testitem similar to those encountered in service. In certain cases consider the suspension of the test item at lowfrequency to avoid complex test fixture resonances that may coincide with measured materiel gunfire responseresonant frequencies.
4.5.1.2 Pretest checkout.
After appropriate compensation of the excitation input device and prior to conducting the test, perform a pretestcheckout of the test item at standard ambient conditions to provide baseline data. Conduct the checkout as follows:
Step 1. Conduct a complete visual examination of the test item with special attention to stress areas or areasidentified as being particularly susceptible to damage and document the results.
Step 2. Install the test item in its test fixture.
Step 3. Conduct a test item operational check in accordance with the approved test plan along with simpletests for ensuring the response measurement system is responding properly. Document the resultsfor compliance with information contained in Part One, paragraph 5.
Step 4. If the test item integrity has been verified, proceed to the first test. If not, resolve the problem andrestart at Step 1.
Downloaded from http://www.everyspec.com on 2012-06-04T5:34:26.
MIL-STD-810F1 January 2000
METHOD 519.5519.5-11
4.5.1.3 Procedure overview.
Paragraphs 4.5.2 through 4.5.5 provide the basis for collecting the necessary information concerning the test item ina gunfire vibration environment. For failure analysis purposes, in addition to the guidance provided in Part One,paragraph 5.14, each procedure contains information to assist in the evaluation of the test results. Analyze anyfailure of a test item to meet the requirements of the system specifications based on the guidelines in Part One,paragraph 5.14.
4.5.1.4 Test item considerations.
Test items can vary from individual materiel items to structural assemblies containing several items of materiel ofdifferent types.
a. General. Unless otherwise specified in the individual test plan, attach the materiel to the vibration exciterby means of a rigid fixture capable of transmitting the vibration conditions specified. Ensure the fixtureinputs vibration to racks, panels, and/or vibration isolators to simulate as accurately as possible thevibration transmitted to the materiel in service. When required, ensure materiel protected from vibrationby racks, panels and/or vibration isolators also passes the appropriate test requirements with the test itemhard-mounted to the fixture. (Refer to method 514.5 for further guidance relative to field/laboratoryimpedance mismatches.)
b. Stores. Where practical, perform testing in three mutually perpendicular axes with the mounting lugs inthe normal carriage position. Suspend the store from a structural frame by means of its normal mountinglugs, hooks, and sway braces, that simulate the operational mounting apparatus. Use a test setup suchthat the rigid body modes (translation and rotation) of vibration for the store/frame/suspension system arebetween 5 and 20 Hz. Apply compensated materiel response excitation to the store by means of a rod orother suitable mounting device running from a vibration exciter to a hard, structurally supported point onthe surface of the store. Alternatively, hard-mount the store directly to the exciter using its normalmounting lugs and a suitable fixture. Ensure the stiffness of the mounting fixture is such that its inducedresonant frequencies are as high as possible and do not interfere with the store response. For bothconfigurations, use launcher rails as part of the test setup, where applicable. Refer to method 514.5 forfurther guidance relative to field/laboratory impedance mismatches.
c. Subsystem testing. When identified in the test plan, subsystems of the materiel may be tested separately.The subsystems can be subjected to different gunfire levels. In this case, ensure the test plan stipulatesthe gunfire levels specific to each subsystem.
d. Test item operation. Refer to the test plan to determine whether the test item is or is not in operation. Because continuous gunfire vibration testing can cause unrealistic damage of the test item (e.g.,unrealistic heating of vibration isolators), interrupt the excitations by periods of rest, defined by the testplan. For additional details, refer to Annexes A, B, C, and D.
4.5.2 Procedure I - Direct reproduction of measured materiel response data.
4.5.2.1 Controls.
This procedure assumes that measured materiel response data are available in digital form and this response data willbe replicated in the laboratory on the test item.
4.5.2.2 Test tolerances.
Ensure test tolerances are in accordance with those specified in paragraph 4.2.
4.5.2.3 Procedure steps.
Step 1. Precondition in accordance with paragraphs 4.2 and 4.5.1.
Step 2. Choose control strategy and control and monitoring points in accordance with paragraph 2.5.
Downloaded from http://www.everyspec.com on 2012-06-04T5:34:26.
MIL-STD-810F1 January 2000
METHOD 519.5
519.5-12
Step 3. Perform operational checks in accordance with paragraph 4.5.1.
Step 4. Mount the test item on the vibration exciter or utilize some other means of suspension in accordancewith paragraph 4.5.1.
Step 5. Determine the time history representation of the vibration exciter drive signal required to provide thedesired gunfire materiel acceleration response on the test item. (Refer to Annex A).
Step 6. Apply the drive signal as an input voltage and measure the test item acceleration response at theselected control/monitoring point.
Step 7. Verify that the test item response is within the allowable tolerances specified in paragraph 4.2.1.
Step 8. Apply gunfire simulation for on and off periods and total test duration in accordance with the testplan. Perform operational and functional checks in accordance with the test plan.
Step 9. Repeat the previous steps along each of the other specified axes.
Step 10. In all cases, record the information required.
4.5.2.4 Analysis of results.
Refer to the guidance in Part One, paragraph 5.14, to assist in the evaluation of the test results. In addition, a displayof the measured test item response time history and analysis called for in paragraph 4.2.1 to satisfy the testtolerances.
4.5.3 Procedure II - Statistically generated repetitive pulse – mean (deterministic) plus residual (stochastic)pulse.
4.5.3.1 Controls.
This procedure assumes that measured response data is available in digital form, has been statistically modeled, andthe generated sample function response data will be replicated in the laboratory on the test item.
4.5.3.2 Test tolerances.
Ensure test tolerances are in accordance with those specified in paragraph 4.2.
4.5.3.3 Procedure steps.
Step 1. Generate a statistical representation of the field measured materiel response data. In general this willinvolve an off-line procedure designed to generate an ensemble of pulses based on measured data forinput to the vibration exciter (refer to Annex B).
Step 2. Precondition in accordance with paragraphs 4.2 and 4.5.1.
Step 3. Choose control strategy and control and monitoring points in accordance with paragraph 2.5.
Step 4. Perform operational checks in accordance with paragraph 4.5.1.
Step 5. Mount the test item on the vibration exciter (or use some other means of suspension) in accordancewith paragraph 4.5.1.
Step 6. Determine the time history representation of the vibration exciter drive signal required to provide thedesired gunfire materiel acceleration response on the test item. (Refer to Annex B).
Step 7. Apply the drive signal as an input voltage and measure the test item acceleration response at theselected control/monitoring point.
Step 8. Verify that the test item response is within the allowable tolerances specified in paragraph 4.2.2.
Downloaded from http://www.everyspec.com on 2012-06-04T5:34:26.
MIL-STD-810F1 January 2000
METHOD 519.5519.5-13
Step 9. Apply gunfire simulation for on and off periods and total test duration in accordance with the testplan. Perform operational and functional checks of the test item in accordance with the test plan.
Step 10. Repeat the previous steps along each of the other specified axes.
Step 11. In all cases, record the information required.
4.5.3.4 Analysis of results.
Refer to the guidance in Part One, paragraph 5.14, to assist in the evaluation of the test results. In addition, a displayof the measured test item response time history and analysis called for in paragraph 4.2.2 to satisfy the testtolerances.
4.5.4 Procedure III – Repetitive pulse shock response spectrum (SRS).
4.5.4.1 Controls.
This procedure assumes that measured response data are available in the digital form of a pulse and an associatedSRS. The test pulse is generated as in the case of SRS shock synthesis testing and replicated at the firing rate of thegun.
4.5.4.2 Test tolerances.
Ensure test tolerances are in accordance with those specified in paragraph 4.2.
4.5.4.3 Procedure steps.
Step 1. Separate the measured field data into individual pulses and compute Shock Response Spectra overthe individual pulses using damping factors of 5%, 2%, 1%, and 0.5% (Q = 10, 25, 50, and 100). (See Annex C.)
Step 2. Based upon the SRS estimates determined in Step 1, compare the mean shock spectra for each of thedamping factors to determine the predominant frequencies and to obtain an estimate of the durationor half cycle content comprising the individual predominant frequencies. An individual selectedpulse may be used instead of utilizing the mean SRS for each of the damping factors. (Refer toAnnex C.)
Step 3. Characterize the SRS time history using the results of Step 2 for specification of the complextransient duration, and choose a mean SRS or individual pulse from Step 2 for amplitudecharacterization.
Step 4. Precondition in accordance with paragraphs 4.2 and 4.5.1.
Step 5. Choose control strategy and control and monitoring points in accordance with paragraph 2.5.
Step 6. Perform operational checks in accordance with paragraph 4.5.1.
Step 7. Mount the test item on the vibration exciter (or use some other means of suspension) in accordancewith paragraph 4.5.1.
Step 8. After proper vibration exciter drive signal compensation, input the SRS transient through the excitercontrol system at the firing rate of the gun, and measure the test item acceleration response at theselected control monitoring point.
Step 9. Verify that the test item response is within the allowable tolerances specified in paragraph 4.2.3.
Step 10. Apply gunfire simulation on and off periods and total test duration in accordance with the test plan. Perform operational and functional checks of the test item in accordance with the test plan.
Step 11. Repeat the previous steps along each of the other specified axes.
Step 12. In all cases, record the information required.
Downloaded from http://www.everyspec.com on 2012-06-04T5:34:26.
MIL-STD-810F1 January 2000
METHOD 519.5
519.5-14
4.5.4.4 Analysis of results.
Refer to the guidance in Part One, paragraph 5.14, to assist in the evaluation of the test results. In addition, a displayof the measured test item response time history and SRS analysis called for in paragraph 4.2.3 to satisfy the testtolerances.
4.5.5 Procedure IV - High level random vibration/sine-on-random vibration/narrowband random-on-random vibration.
4.5.5.1 Controls.
This procedure assumes that either the gunfire environment is to be predicted or measured response data is availablein the form of an ASD estimate. This response data will be replicated in the laboratory by way of vibration controlor special software for gunfire vibration testing.
4.5.5.2 Test tolerances.
Ensure test tolerances are in accordance with those specified in paragraph 4.2.
4.5.5.3 Procedure steps.
Step 1. Compute an autospectral density analysis over the measured gunfire data using an analysis overallbandwidth of at least 2 kHz at a suitable processing analysis bandwidth (not to exceed 5 Hz), orcompute a combination discrete sine component and 2 kHz autospectral density prediction (refer toAnnex D).
Step 2. Based upon the guidance to follow, generate time history corresponding to a (1) high level timedomain windowed random vibration test spectrum, (2) sine-on-random vibration test spectrum, or(3) narrowband random-on-random vibration test spectrum.
a. if the ASD spectral estimate is computed from field measured materiel response data and appearsas a continuous spectra with no discrete components at harmonic frequencies then generate a highlevel random vibration time history having the same spectral content and proceed to generate atransient vibration time history by appropriate time domain windowing with a boxcar shapedwindow. The window on/off durations being functions of the in-service gunfire schedule.
b. if the ASD spectral estimate is computed from field measured materiel response data and appearsas a continuous spectra with discrete components at harmonic frequencies then generate either asine-on-random or narrowband random-on-random vibration time history having the samespectral content according to the knowledge of the in-service use. If the in-service use anticipatesa fixed firing rate gun then sine-on-random is the selected test method. If the in-service useanticipates a variable firing rate gun or several guns with fixed firing (or variable firing) rate thenthe narrowband random-on-random is the selected test method. Selection of the test parametersfor narrowband random-on-random (e.g., sweep rate and sweep bandwidth) is left to thediscretion of an experienced analyst for specification using the in-service gunfire schedule. Thetesting should not be limited by the software test capability. The on/off gunfire durations areselected as functions of the in-service gunfire schedule.
NOTE: It is important to realize for any ASD estimate with apparent discrete harmonic components theamplitude of the discrete harmonic components is sensitive to the way in which the stationaryrandom time history is processed. The amplitude of the discrete harmonic components is sensitive to(1) relationship between the “true” discrete frequency (gunfiring rate and harmonics) and theresolution analysis bandwidth selected in the processing and (2) the form of windowing and overlapused in the processing. Make every effort to process the time history data for the combined discreteand continuous spectra estimate for the (1) measured field materiel response and (2) measuredlaboratory test item response, in exactly the same way.
Downloaded from http://www.everyspec.com on 2012-06-04T5:34:26.
MIL-STD-810F1 January 2000
METHOD 519.5519.5-15
c. if the ASD spectral estimate is predicted for materiel response as a continuous spectra withdiscrete components at harmonic frequencies, then generate either a sine-on-random vibration ornarrow band random-on-random time history having the same spectral content according to theknowledge of the in-service use and the experience of an analyst. In general, narrow bandrandom-on-random will be used for gun configurations other than a single gun with a fixed firingrate. The on/off gunfire durations are selected as functions of the in-service gunfire schedule.
Step 3. Precondition the test item in accordance with paragraphs 4.2 and 4.5.1.
Step 4. Choose control strategy and control and monitoring points in accordance with paragraph 2.5.
Step 5. Perform operational checks in accordance with paragraph 4.5.1.
Step 6. Mount the test item on the vibration exciter (or use some other means of suspension) in accordancewith paragraph 4.5.1.
Step 7. Input the vibration profile through the exciter control system, and measure the test item accelerationresponse at the selected control monitoring point or points.
Step 8. Verify that the test item response is within the allowable tolerances specified in paragraph 4.2.4.
Step 9. Apply gunfire simulation on and off periods and total test duration in accordance with the test plan. Perform operational and functional checks of the test item in accordance with the test plan.
Step 10. Repeat the previous steps along each of the other specified axes.
Step 11. In all cases, record the information required.
4.5.5.4 Analysis of results.
Refer to the guidance in Part One, paragraphs 5.14 and 5.17 and Part One, Appendix A, Tasks 405 and 406 to assistin the evaluation of the test results. In addition a display of the measured test item response time history and analysisas called for in paragraph 4.2.4 to satisfy the test tolerances.
5. REFERENCE/RELATED DOCUMENTS.
a. Handbook for Dynamic Data Acquisition and Analysis, IEST-RP-DTE012.1, Institute of EnvironmentalSciences and Technology, 940 East Northwest Highway, Mount Prospect, IL 60056.
b. Harris, C., and C. E. Crede, eds., Shock and Vibration Handbook, 2nd Edition, NY, McGraw-Hill, 1976.
c. Piersol, A.G., Analysis of Harpoon Missile Structural Response to Aircraft Launches, Landings andCaptive Flight and Gunfire. Naval Weapons Center Report #NWC TP 58890. January 1977.
d. Piersol, Allan G., Determination of Maximum Structural Responses From Predictions or Measurementsat Selected Points, Proceedings of the 65th Shock and Vibration Symposium, Volume I, SAVIAC, 1994.
e. Bendat, J. S. and A. G. Piersol, Random Data: Analysis and Measurement Procedures, John Wiley &Sons Inc., NY, 1986.
Downloaded from http://www.everyspec.com on 2012-06-04T5:34:26.

MIL-STD-810F1 January 2000
METHOD 519.5
519.5-16
THIS PAGE INTENTIONALLY BLANK
Downloaded from http://www.everyspec.com on 2012-06-04T5:34:26.
MIL-STD-810F1 January 2000ANNEX A
METHOD 519.5519.5A-1
ANNEX A
DIRECT REPRODUCTION OF MEASURED MATERIEL RESPONSE DATA
1. SCOPE.
1.1 Purpose.
This Annex provides guidance and a basis for direct reproduction (in a laboratory test) of measured materielresponse data on a vibration exciter under waveform control in an open loop mode.
1.2 Application.
This technique is useful for the reproduction of single point materiel response that may be characterized asnonstationary or as a transient vibration (see Part One, Appendix D). Acceleration is considered the variable ofmeasurement in the discussion to follow although other variables could be used, provided the dynamic range of themeasured materiel response is consistent with the dynamic range of the electrodynamic exciter used as an inputdevice to reproduce the materiel response.
2. DEVELOPMENT.
2.1 Basic Considerations for Environment Determination.
It is assumed that an in-service test is performed with properly instrumented materiel where the measurements aremade at pre-selected points on the materiel. The measurement points exhibit minimum local resonances, yet themeasurement locations will allow the detection of significant overall materiel resonances. The measurementlocations may be determined prior to making an in-service test by examination of random vibration data on themateriel using various accelerometer mounting locations and fixturing configurations (the same as those to be used inlaboratory testing). In processing, ensure the field measured data is DC coupled (not high pass filtered) and sampledat ten times the highest frequency of interest with appropriate anti-alias filtering techniques. Examine the measureddata time history traces for any indication of clipping, or any accelerometer performance anomalies such as zeroshifting. If there is indication of accelerometer measurement anomalies, examine a potentially corrupted accelerationtime history carefully according to the procedures used in qualifying pyrotechnic shock data, e.g., time historyintegration to examine velocity and displacement characteristics, sample probability density function (PDF)estimates computed. (For further details refer to method 517 or to reference a. in paragraph 5.) If there are noindications of accelerometer anomalies, high pass filter the in-service measured data at a very low frequency, e.g., 1Hz, and place it in a digital file for manipulation. An example of gunfire simulation using Procedure I is discussedbelow. This procedure is performed with a personal computer (PC) with signal processing capability and analog-to-digital and digital-to-analog interfaces.
2.2 Test Configuration.
A specially instrumented test item is installed in a laboratory vibration fixture and mounted on an electrodynamicexciter. The test item employed during the laboratory simulation is the same materiel configuration used to collectthe gunfire vibration materiel response data during an in-service test, including accelerometer response measurementlocations.
2.3 Creating a Digital File of the Gunfire Vibration Materiel Response.
The first step in the environment replication process is to digitize the measured in-service data to obtain a materielresponse amplitude time history (figure 519.5A-1). Digital processing of the analog data is performed using a 2,000Hz, 48dB/octave linear phase anti-alias filter and a sample rate of 20,480 samples per second for good time historyresolution.
Downloaded from http://www.everyspec.com on 2012-06-04T5:34:26.
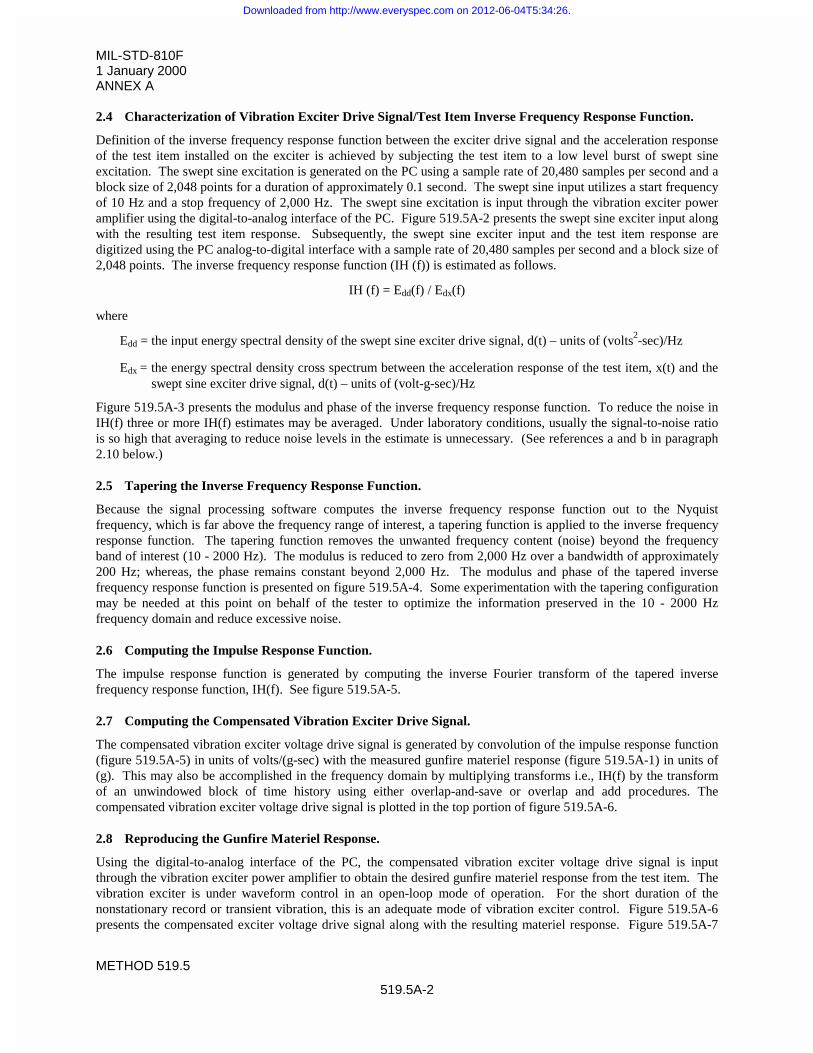
MIL-STD-810F1 January 2000ANNEX A
METHOD 519.5
519.5A-2
2.4 Characterization of Vibration Exciter Drive Signal/Test Item Inverse Frequency Response Function.
Definition of the inverse frequency response function between the exciter drive signal and the acceleration responseof the test item installed on the exciter is achieved by subjecting the test item to a low level burst of swept sineexcitation. The swept sine excitation is generated on the PC using a sample rate of 20,480 samples per second and ablock size of 2,048 points for a duration of approximately 0.1 second. The swept sine input utilizes a start frequencyof 10 Hz and a stop frequency of 2,000 Hz. The swept sine excitation is input through the vibration exciter poweramplifier using the digital-to-analog interface of the PC. Figure 519.5A-2 presents the swept sine exciter input alongwith the resulting test item response. Subsequently, the swept sine exciter input and the test item response aredigitized using the PC analog-to-digital interface with a sample rate of 20,480 samples per second and a block size of2,048 points. The inverse frequency response function (IH (f)) is estimated as follows.
IH (f) = Edd(f) / Edx(f)
where
Edd = the input energy spectral density of the swept sine exciter drive signal, d(t) – units of (volts2-sec)/Hz
Edx = the energy spectral density cross spectrum between the acceleration response of the test item, x(t) and theswept sine exciter drive signal, d(t) – units of (volt-g-sec)/Hz
Figure 519.5A-3 presents the modulus and phase of the inverse frequency response function. To reduce the noise inIH(f) three or more IH(f) estimates may be averaged. Under laboratory conditions, usually the signal-to-noise ratiois so high that averaging to reduce noise levels in the estimate is unnecessary. (See references a and b in paragraph2.10 below.)
2.5 Tapering the Inverse Frequency Response Function.
Because the signal processing software computes the inverse frequency response function out to the Nyquistfrequency, which is far above the frequency range of interest, a tapering function is applied to the inverse frequencyresponse function. The tapering function removes the unwanted frequency content (noise) beyond the frequencyband of interest (10 - 2000 Hz). The modulus is reduced to zero from 2,000 Hz over a bandwidth of approximately200 Hz; whereas, the phase remains constant beyond 2,000 Hz. The modulus and phase of the tapered inversefrequency response function is presented on figure 519.5A-4. Some experimentation with the tapering configurationmay be needed at this point on behalf of the tester to optimize the information preserved in the 10 - 2000 Hzfrequency domain and reduce excessive noise.
2.6 Computing the Impulse Response Function.
The impulse response function is generated by computing the inverse Fourier transform of the tapered inversefrequency response function, IH(f). See figure 519.5A-5.
2.7 Computing the Compensated Vibration Exciter Drive Signal.
The compensated vibration exciter voltage drive signal is generated by convolution of the impulse response function(figure 519.5A-5) in units of volts/(g-sec) with the measured gunfire materiel response (figure 519.5A-1) in units of(g). This may also be accomplished in the frequency domain by multiplying transforms i.e., IH(f) by the transformof an unwindowed block of time history using either overlap-and-save or overlap and add procedures. Thecompensated vibration exciter voltage drive signal is plotted in the top portion of figure 519.5A-6.
2.8 Reproducing the Gunfire Materiel Response.
Using the digital-to-analog interface of the PC, the compensated vibration exciter voltage drive signal is inputthrough the vibration exciter power amplifier to obtain the desired gunfire materiel response from the test item. Thevibration exciter is under waveform control in an open-loop mode of operation. For the short duration of thenonstationary record or transient vibration, this is an adequate mode of vibration exciter control. Figure 519.5A-6presents the compensated exciter voltage drive signal along with the resulting materiel response. Figure 519.5A-7
Downloaded from http://www.everyspec.com on 2012-06-04T5:34:26.
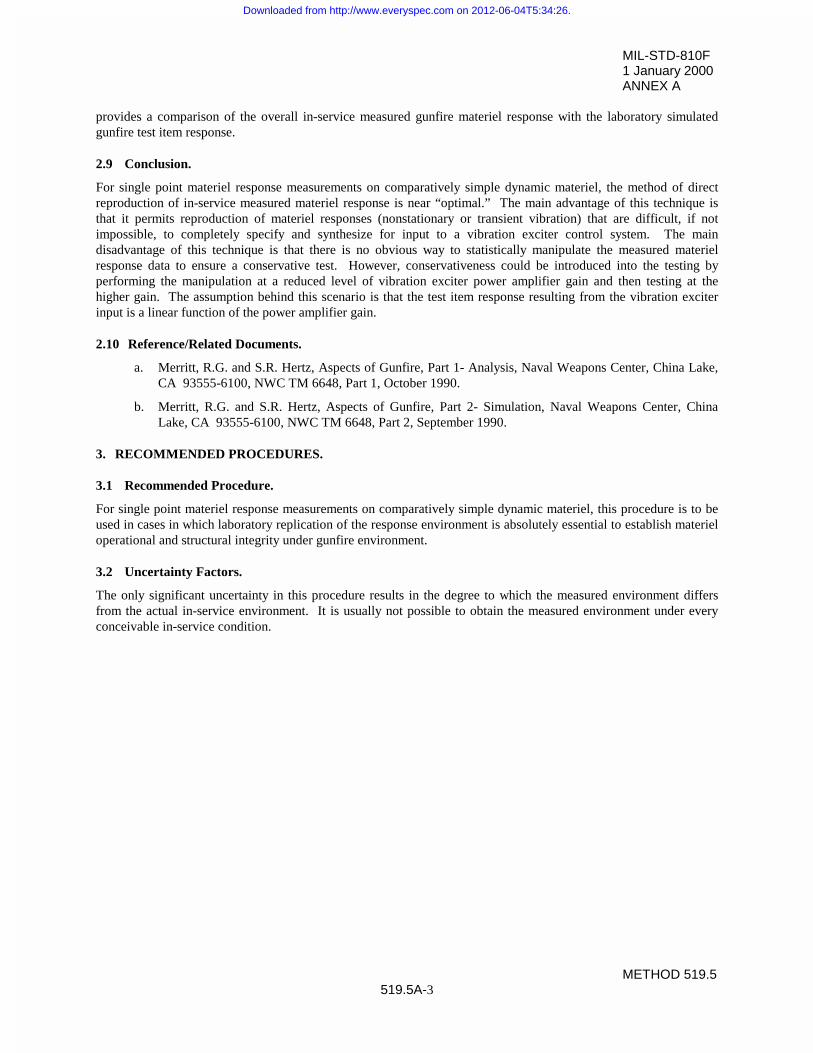
MIL-STD-810F1 January 2000ANNEX A
METHOD 519.5519.5A-3
provides a comparison of the overall in-service measured gunfire materiel response with the laboratory simulatedgunfire test item response.
2.9 Conclusion.
For single point materiel response measurements on comparatively simple dynamic materiel, the method of directreproduction of in-service measured materiel response is near “optimal.” The main advantage of this technique isthat it permits reproduction of materiel responses (nonstationary or transient vibration) that are difficult, if notimpossible, to completely specify and synthesize for input to a vibration exciter control system. The maindisadvantage of this technique is that there is no obvious way to statistically manipulate the measured materielresponse data to ensure a conservative test. However, conservativeness could be introduced into the testing byperforming the manipulation at a reduced level of vibration exciter power amplifier gain and then testing at thehigher gain. The assumption behind this scenario is that the test item response resulting from the vibration exciterinput is a linear function of the power amplifier gain.
2.10 Reference/Related Documents.
a. Merritt, R.G. and S.R. Hertz, Aspects of Gunfire, Part 1- Analysis, Naval Weapons Center, China Lake,CA 93555-6100, NWC TM 6648, Part 1, October 1990.
b. Merritt, R.G. and S.R. Hertz, Aspects of Gunfire, Part 2- Simulation, Naval Weapons Center, ChinaLake, CA 93555-6100, NWC TM 6648, Part 2, September 1990.
3. RECOMMENDED PROCEDURES.
3.1 Recommended Procedure.
For single point materiel response measurements on comparatively simple dynamic materiel, this procedure is to beused in cases in which laboratory replication of the response environment is absolutely essential to establish materieloperational and structural integrity under gunfire environment.
3.2 Uncertainty Factors.
The only significant uncertainty in this procedure results in the degree to which the measured environment differsfrom the actual in-service environment. It is usually not possible to obtain the measured environment under everyconceivable in-service condition.
Downloaded from http://www.everyspec.com on 2012-06-04T5:34:26.
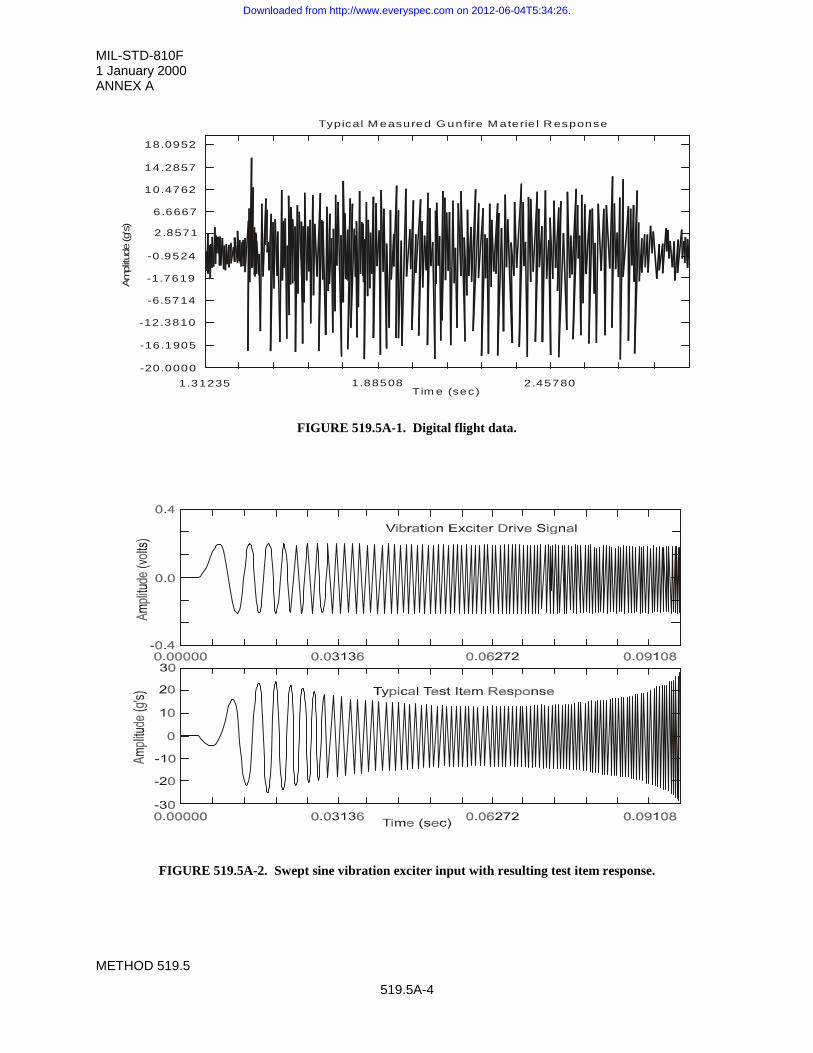
MIL-STD-810F1 January 2000ANNEX A
METHOD 519.5
519.5A-4
FIGURE 519.5A-1. Digital flight data.
FIGURE 519.5A-2. Swept sine vibration exciter input with resulting test item response.
18.0952
14.2857
10.4762
6.6667
2.8571
-0.9524
-1.7619
-6.5714
-12.3810
-16.1905
-20.0000
1.31235 1.88508 2.45780
Am
plitu
de (g’
s)Typical M easured G unfire M aterie l R esponse
Tim e (sec)
Downloaded from http://www.everyspec.com on 2012-06-04T5:34:26.
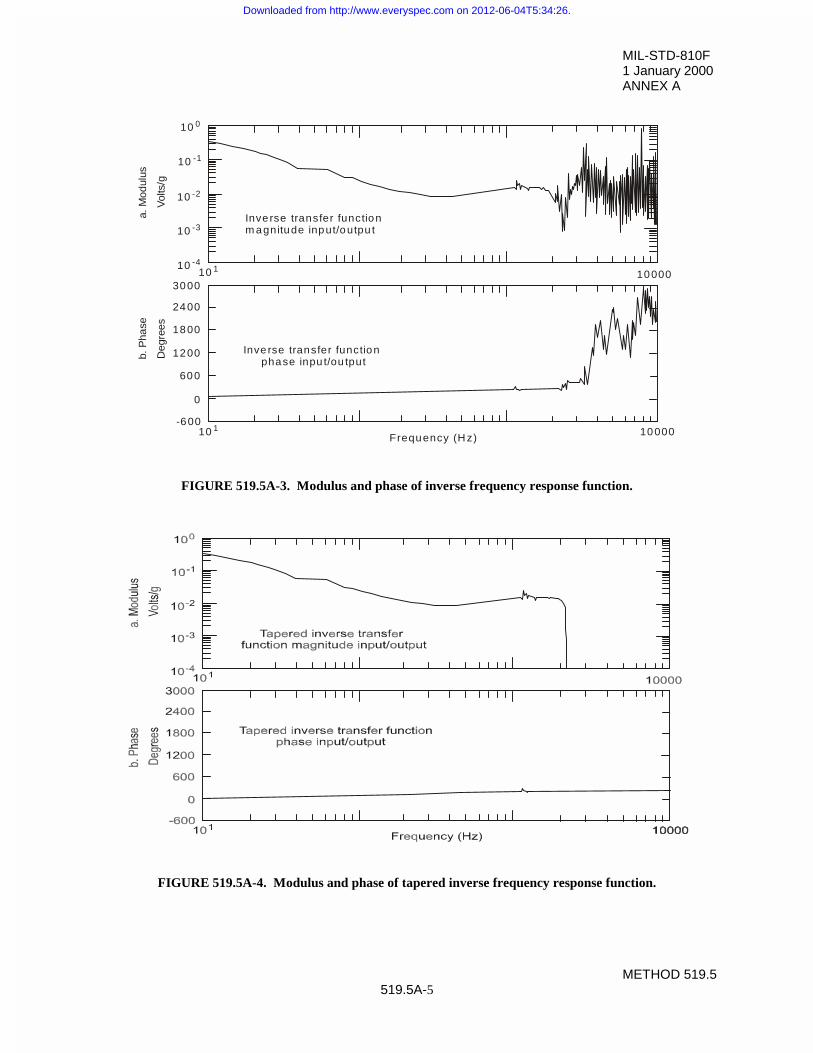
MIL-STD-810F1 January 2000ANNEX A
METHOD 519.5519.5A-5
FIGURE 519.5A-3. Modulus and phase of inverse frequency response function.
FIGURE 519.5A-4. Modulus and phase of tapered inverse frequency response function.
Deg
rees
Vol
ts/g
10 0
10 -1
10 -2
10 -3
10 -4
3000
2400
1800
1200
600
0
-600
10 1
10 1 10000
a. M
odul
usb.
Pha
se
Inve rse transfer functionm agnitude input/outpu t
Inve rse transfer function phase inpu t/ou tput
Frequency (H z)
10000
Downloaded from http://www.everyspec.com on 2012-06-04T5:34:26.
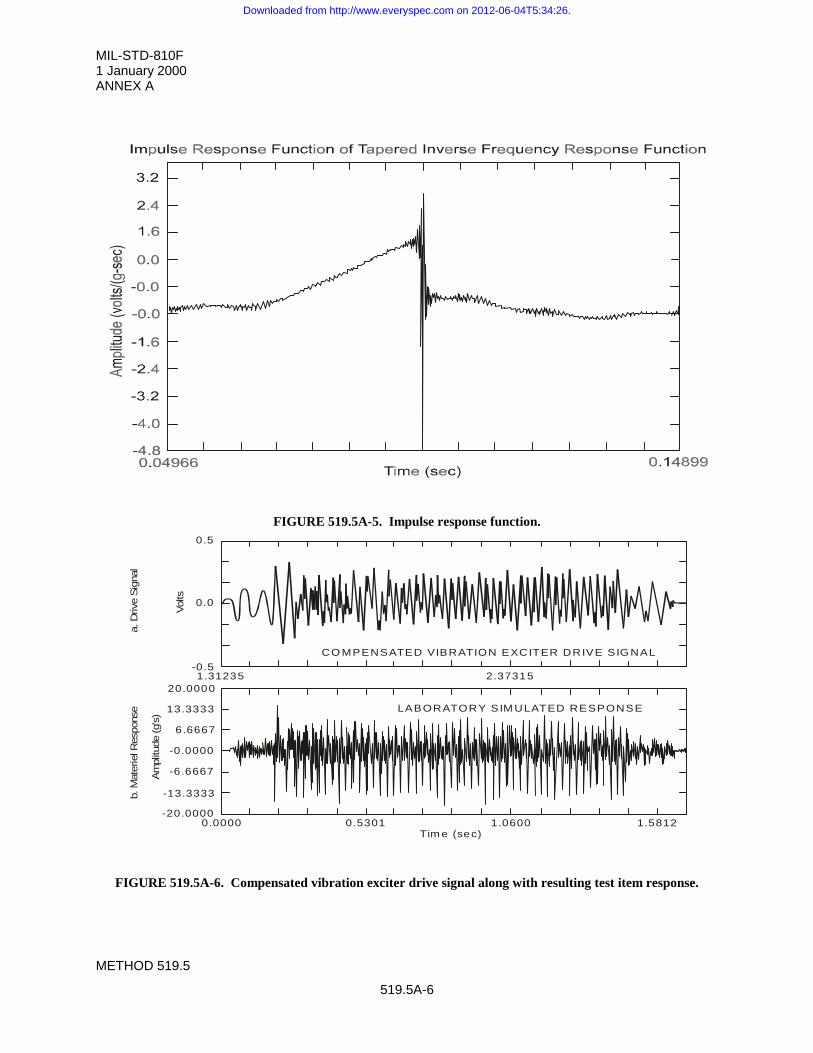
MIL-STD-810F1 January 2000ANNEX A
METHOD 519.5
519.5A-6
FIGURE 519.5A-5. Impulse response function.
FIGURE 519.5A-6. Compensated vibration exciter drive signal along with resulting test item response.
Vol
ts
Am
plitu
de (g'
s)
CO MPENSATED VIBRATION EXCITER DRIVE SIG NAL
LABORATORY SIM ULATED RESPONSE
0.5
0.0
-0.51.31235 2.37315
20.0000
13.3333
6.6667
-0.0000
-6.6667
-13.3333
-20.00000.0000 0.5301 1.0600 1.5812
Tim e (sec)
a. D
rive
Sig
nal
b. M
ater
iel R
espo
nse
Downloaded from http://www.everyspec.com on 2012-06-04T5:34:26.
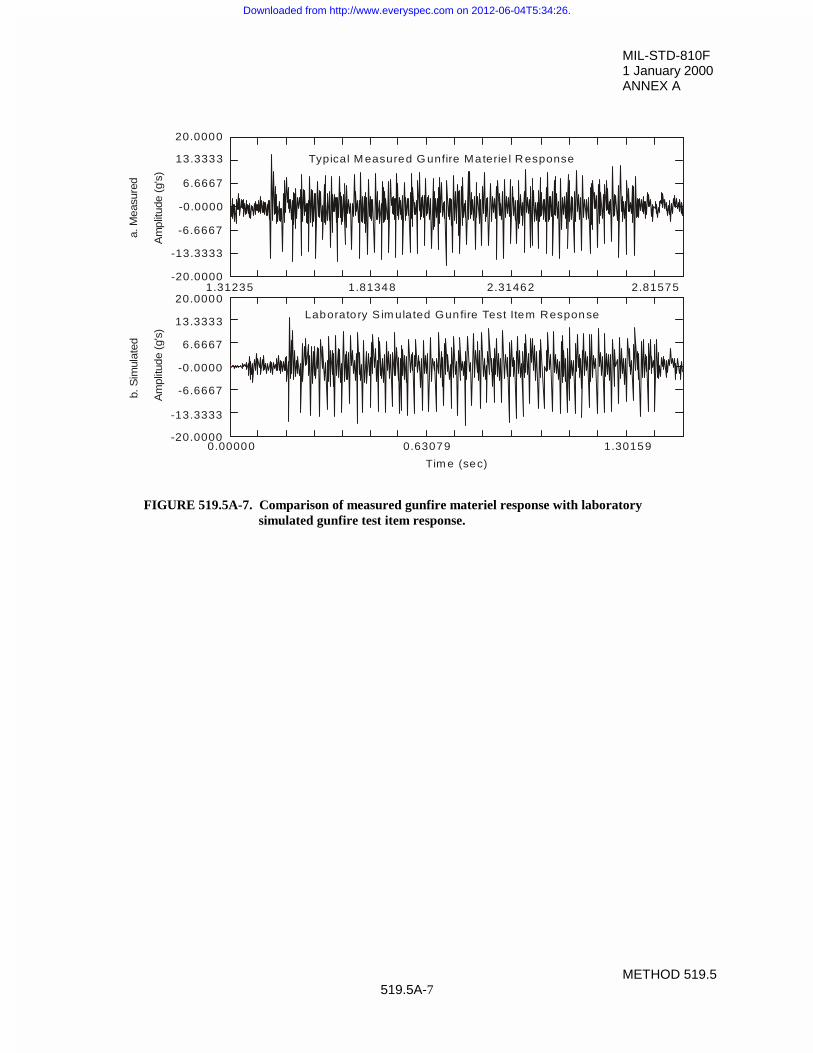
MIL-STD-810F1 January 2000ANNEX A
METHOD 519.5519.5A-7
FIGURE 519.5A-7. Comparison of measured gunfire materiel response with laboratorysimulated gunfire test item response.
Am
plitu
de (
g's)
Am
plitu
de (
g's)
Typical M easured G unfire Materie l R esponse
Laboratory S im ulated Gunfire Test Item Response
20.0000
-0.0000
-20.00001.31235 2.31462
20.0000
13.3333
6.6667
-0.0000
-6.6667
-13.3333
-20.00000.00000 0.63079 1.30159
Tim e (sec)
a. M
easu
red
b. S
imul
ated
13.3333
6.6667
-6.6667
-13.3333
1.81348 2.81575
Downloaded from http://www.everyspec.com on 2012-06-04T5:34:26.

MIL-STD-810F1 January 2000ANNEX A
METHOD 519.5
519.5A-8
THIS PAGE INTENTIONALLY BLANK
Downloaded from http://www.everyspec.com on 2012-06-04T5:34:26.

MIL-STD-810F1 January 2000ANNEX B
METHOD 519.5519.5B-1
ANNEX B
STATISTICALLY GENERATED REPETITIVE PULSE – MEAN (DETERMINISTIC)PLUS RESIDUAL (STOCHASTIC) PULSE
1. SCOPE.
1.1 Purpose.
This annex provides an overview of a technique for simulation of a time-varying random process given a samplefunction for the process that can be used to generate ensemble statistics describing the time-varying character of theprocess.
1.2 Application.
Details for the technique are found in reference a, other aspects of the technique are found in references c and d,more recent developments are found in references f, g, and h of this annex. The stochastic simulation technique tobe described here is for a single unknown time-varying random process for which a single sample function from theprocess is available. This single sample function is representative of a single gunfire physical configuration forwhich extrapolation to other configurations is undetermined. This technique:
a. is convenient to implement on a personal computer (PC) used to control a vibration exciter system;
b. has many features analogous to that of traditional stationary time history vibration exciter simulationbased on autospectral density estimate specification;
c. is very flexible in terms of the length of statistically equivalent records it can generate for laboratory testreplication of an in-service measured response environment;
d. has statistics that are easy to interpret and that approximate the true statistical variation in the unknownunderlying random process;
e. can be generalized to other forms of time-varying random processes with ensemble representation easily;
f. abandons a minimal number of higher order features of the measured response ensemble not consideredessential to conservative in-service measured response data replication by way of laboratory test itemresponse simulation testing.
The following paragraphs are directed toward an overview of this method of test item response simulation along withits limitations.
2. DEVELOPMENT.
2.1 Nomenclature for Annex B.
E > @ expected value of the quantity within the brackets
N, Np number of pulses in an ensemble
P (x, t) probability distribution function for a nonstationary random process
Rxx (W, t) auto-correlation function for a non-stationary random process
{xi(t)} random process
xi(t) ith sample function for the random process
XT(f) finite Fourier transform of x(t) over a finite interval of time, T
)t(xP true time�varying mean
Downloaded from http://www.everyspec.com on 2012-06-04T5:34:26.
MIL-STD-810F1 January 2000ANNEX B
METHOD 519.5
519.5B-2
)t(ˆ xP time-varying mean estimate
)t(xV true time-varying standard deviation
)t(ˆ xV time-varying standard deviation estimate
)t(2x< true time-varying mean square
)t(ˆ 2x< time-varying mean square estimate
Tp period in seconds of a stationary sample record
f1=1/Tp fundamental frequency of a stationary sample record in Hertz
T sampling time interval
fc=1/(2T) Nyquist cutoff frequency
2.2 Introduction.
In all that follows, the term "ensemble" is taken to mean a collection of sample time history records defined over aspecified time interval. In the case of a nonstationary environment, the only complete description of theenvironment, is given through (1) statistical estimates of all the probabilistic moments of the process as a function ofamplitude and time from the specification of P(x,t), or (2) a statistical estimate of the time-varying autocorrelationfunction, R(W,t). Generally, P(x,t) and R(W,t) are not available either directly in an analytic form or through accurateestimates based on the limited in-service measured response data. For practical purposes, for an in-service measuredenvironment estimating the (1) time-varying mean, (2) time-varying standard deviation, (3) time-varying root meansquare, (4) overall average energy spectral density, and (5) time-varying autocorrelation, assist in characterizing thenonstationary random process from which the sample ensemble is taken. Replication of at least (1) - (4) or all ofthese measured ensemble estimates in the simulation process will provide a satisfactory nonstationary test simulationof the in-service environment.
2.3 Assumptions.
To assist in deciding if the procedures described in this annex are applicable to particular measurement/testobjectives, the following basic assumptions are made. (In what follows it is assumed that acceleration is the materielresponse measurement variable. However, other measurement variables, e.g., strain, may be just as useful, providedthey are capable of capturing the characteristic amplitude/frequency range of interest.)
a. The in-service measured materiel response is obtained from measurements at "hard points" on themateriel to be tested. The term “hard points” implies that (a) local materiel response peculiar to thelocation of the measurement instrumentation (including structural nonlinearity) is not dominant in themateriel response measurement, and (b) measured materiel response at the selected point isrepresentative of the overall materiel response.
b. A sample time history trace of the measured in-service materiel response shows a distinct time-varyingquality that repeats in a time interval correlated with the firing rate of the gun.
c. A sample time history of the measured in-service materiel response may be decomposed into anensemble of shorter time history records (or pulses) having similar time-varying characteristics at equaltime intervals from the beginning of each of the shorter time history records (the exact method ofdecomposition of the sample time history record is left to the discretion of the analyst - this usually canbe accomplished by examining the measured “timing” or “firing” pulse for a repeated event or by way ofcross-correlation methods as applied to the sample time history).
d. For testing, configuration information for the test item similar to that configuration for which themeasured in-service materiel response data is available.
Downloaded from http://www.everyspec.com on 2012-06-04T5:34:26.
MIL-STD-810F1 January 2000ANNEX B
METHOD 519.5519.5B-3
e. Use of the procedures outlined in Annex A for Direct Reproduction of Measured Materiel Response Datafor determination of the test frequency response function for an electrodynamic or electrohydraulicvibration exciter.
f. Application of the test frequency response function to the simulated amplitude time history may beaccomplished through (a) an energy spectral density function formulation whereby each short timehistory or pulse is individually compensated by way of the convolution of the pulse time history with thesystem impulse response function, and the pulses concatenated into one long output voltage time historyfor input to the digital-to-analog interface, or (b) a long time history convolution, whereby theuncompensated long output time history is first generated and then convolved with the system impulseresponse function to provide the compensated voltage drive signal for input to the digital-to-analoginterface. Both of these techniques assume generation of a long compensated voltage waveform to berun in an open-loop mode on a vibration exciter system. For this open-loop run configuration, it issuggested that the length of the compensated waveform not exceed five seconds and the appropriate abortlimits are active on the vibration exciter system. (As sophistication in vibration exciter control systemsincreases, the energy spectral density formulation with waveform compensation on individual pulses andclosed loop control will become the norm for operation. At this time, practicality of this procedure islimited by the speed of processors in input and output to the vibration exciter system. In addition, (1) arationale for quantitatively judging the “adequacy” of the simulation in “real time,” based on the time-varying statistical estimates, and (2) a means of “real time” compensation of “inadequate” simulation inreal time has not been developed.)
g. The adequacy of the simulation in meeting the specification on the error between the measured in-servicemateriel response statistics and the measured test item response from the test simulation is based onutilizing equivalent sample sizes or correcting the error measure based on sample size differences.
h. In summary, at the time of this writing, the test simulation of a measured in-service materiel response isbased on
(1) pretest generation of the uncompensated test sample time history;
(2) compensation of the test sample time history;
(3) open-loop waveform control for the vibration exciter system;
(4) off line processing of the test item response sample time history for direct comparison with themeasured in-service materiel response sample time history.
2.4 Modeling and Statistics for Description of a Materiel Response Time-varying Random Process.
A very general model for modeling time-varying random processes is the “product model,” which assumes that thetime-varying characteristics of a random process can be separated from the frequency characteristics of the randomprocess (see reference b). For materiel response to a gunfire environment, a form of product model can be used toadequately describe this response. The procedures used in constructing the model require some experience. Unfortunately, this modeling does not provide for parameterized predictions of materiel response in other measureddata configurations. The basic statistics to be used to characterize a measured response environment with anensemble representation are the following:
a. the time-varying mean;
b. time-varying standard deviation;
c. time-varying root mean square;
d. average energy spectral density function (may be time dependent).
Error statistics for the simulation may be based on the error expressions for a. through d.
The following is a definition of the product model used in this development. Consideration is given to the time-varying frequency character over discrete time intervals, which can be explored in more detail through the
Downloaded from http://www.everyspec.com on 2012-06-04T5:34:26.
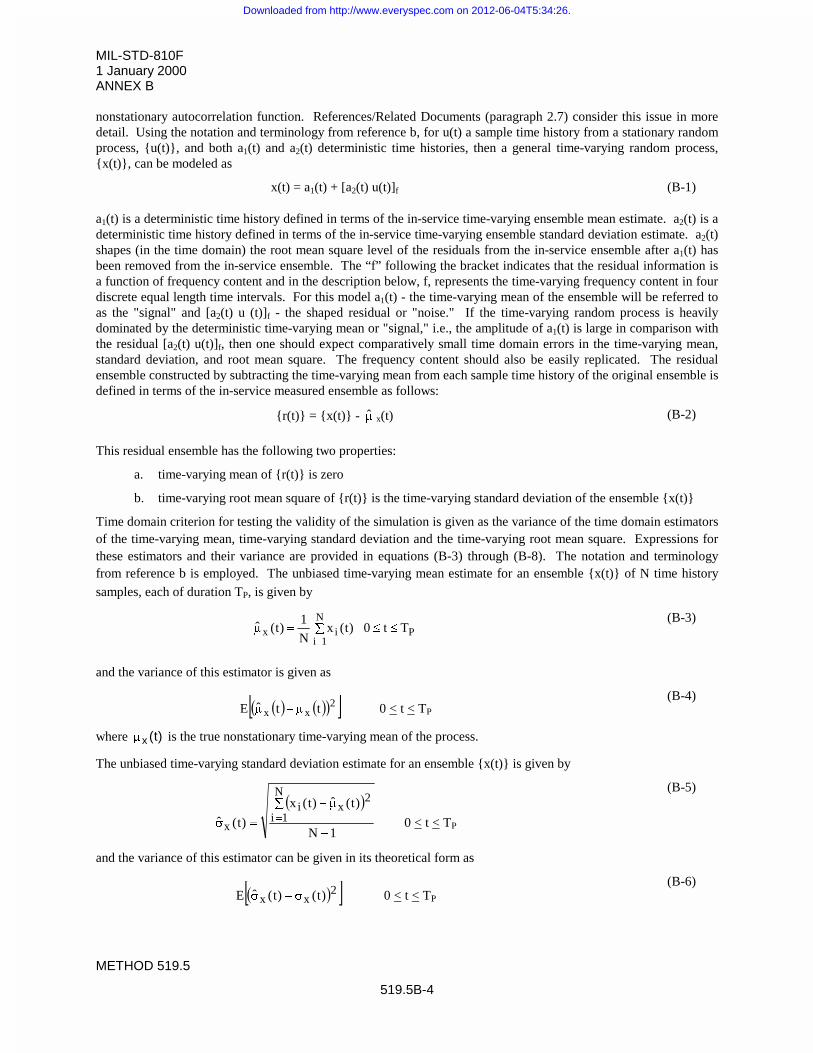
MIL-STD-810F1 January 2000ANNEX B
METHOD 519.5
519.5B-4
nonstationary autocorrelation function. References/Related Documents (paragraph 2.7) consider this issue in moredetail. Using the notation and terminology from reference b, for u(t) a sample time history from a stationary randomprocess, {u(t)}, and both a1(t) and a2(t) deterministic time histories, then a general time-varying random process,{x(t)}, can be modeled as
x(t) = a1(t) + [a2(t) u(t)]f (B-1)
a1(t) is a deterministic time history defined in terms of the in-service time-varying ensemble mean estimate. a2(t) is adeterministic time history defined in terms of the in-service time-varying ensemble standard deviation estimate. a2(t)shapes (in the time domain) the root mean square level of the residuals from the in-service ensemble after a1(t) hasbeen removed from the in-service ensemble. The “f” following the bracket indicates that the residual information isa function of frequency content and in the description below, f, represents the time-varying frequency content in fourdiscrete equal length time intervals. For this model a1(t) - the time-varying mean of the ensemble will be referred toas the "signal" and [a2(t) u (t)]f - the shaped residual or "noise." If the time-varying random process is heavilydominated by the deterministic time-varying mean or "signal," i.e., the amplitude of a1(t) is large in comparison withthe residual [a2(t) u(t)]f, then one should expect comparatively small time domain errors in the time-varying mean,standard deviation, and root mean square. The frequency content should also be easily replicated. The residualensemble constructed by subtracting the time-varying mean from each sample time history of the original ensemble isdefined in terms of the in-service measured ensemble as follows:
{r(t)} = {x(t)} - P x(t) (B-2)
This residual ensemble has the following two properties:
a. time-varying mean of {r(t)} is zero
b. time-varying root mean square of {r(t)} is the time-varying standard deviation of the ensemble {x(t)}
Time domain criterion for testing the validity of the simulation is given as the variance of the time domain estimatorsof the time-varying mean, time-varying standard deviation and the time-varying root mean square. Expressions forthese estimators and their variance are provided in equations (B-3) through (B-8). The notation and terminologyfrom reference b is employed. The unbiased time-varying mean estimate for an ensemble {x(t)} of N time history
samples, each of duration TP, is given by
PN
1iix Tt0)t(x
N
1)t(ˆ dd¦ P
(B-3)
and the variance of this estimator is given as
� � � �� �� �2xx ttˆE P�P 0 < t < TP
(B-4)
where )t(xP is the true nonstationary time-varying mean of the process.
The unbiased time-varying standard deviation estimate for an ensemble {x(t)} is given by
� �
1N
)t(ˆ)t(x
)t(ˆ
N
1i
2xi
x�
¦ P�
V 0 < t < TP
(B-5)
and the variance of this estimator can be given in its theoretical form as
� �� �2xx )t()t(ˆE V�V 0 < t < TP
(B-6)
Downloaded from http://www.everyspec.com on 2012-06-04T5:34:26.
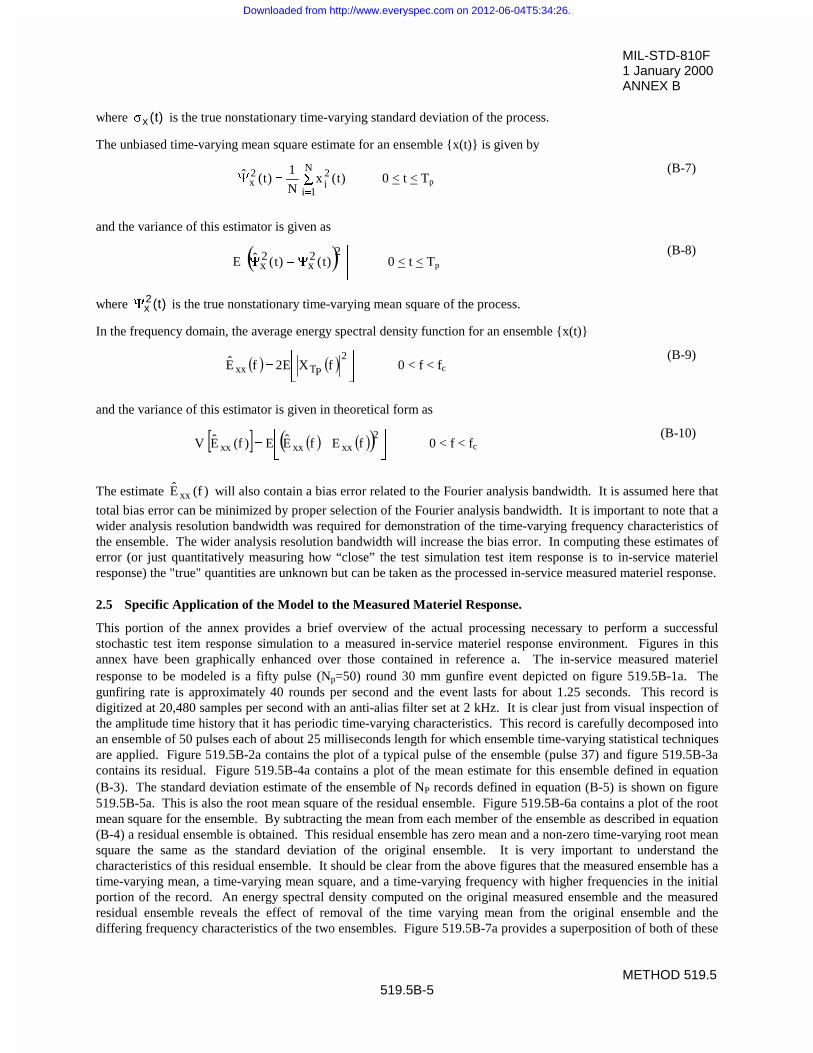
MIL-STD-810F1 January 2000ANNEX B
METHOD 519.5519.5B-5
where )t(xV is the true nonstationary time-varying standard deviation of the process.
The unbiased time-varying mean square estimate for an ensemble {x(t)} is given by
¦ <
N
1i
2i
2x )t(x
N
1)t(ˆ 0 < t < Tp
(B-7)
and the variance of this estimator is given as
� �»
¼
º
«
¬
ª<�<
22x
2x )t()t(ˆE 0 < t < Tp
(B-8)
where )t(2x< is the true nonstationary time-varying mean square of the process.
In the frequency domain, the average energy spectral density function for an ensemble {x(t)}
� � � �»¼
º
«¬
ª
2
PTxx fXE2fE 0 < f < fc(B-9)
and the variance of this estimator is given in theoretical form as
� � � � � �� �»¼
º
«¬
ª�
2xxxxxx fEfEE)f(EV 0 < f < fc
(B-10)
The estimate )f(E xx will also contain a bias error related to the Fourier analysis bandwidth. It is assumed here that
total bias error can be minimized by proper selection of the Fourier analysis bandwidth. It is important to note that awider analysis resolution bandwidth was required for demonstration of the time-varying frequency characteristics ofthe ensemble. The wider analysis resolution bandwidth will increase the bias error. In computing these estimates oferror (or just quantitatively measuring how “close” the test simulation test item response is to in-service materielresponse) the "true" quantities are unknown but can be taken as the processed in-service measured materiel response.
2.5 Specific Application of the Model to the Measured Materiel Response.
This portion of the annex provides a brief overview of the actual processing necessary to perform a successfulstochastic test item response simulation to a measured in-service materiel response environment. Figures in thisannex have been graphically enhanced over those contained in reference a. The in-service measured materielresponse to be modeled is a fifty pulse (Np=50) round 30 mm gunfire event depicted on figure 519.5B-1a. Thegunfiring rate is approximately 40 rounds per second and the event lasts for about 1.25 seconds. This record isdigitized at 20,480 samples per second with an anti-alias filter set at 2 kHz. It is clear just from visual inspection ofthe amplitude time history that it has periodic time-varying characteristics. This record is carefully decomposed intoan ensemble of 50 pulses each of about 25 milliseconds length for which ensemble time-varying statistical techniquesare applied. Figure 519.5B-2a contains the plot of a typical pulse of the ensemble (pulse 37) and figure 519.5B-3acontains its residual. Figure 519.5B-4a contains a plot of the mean estimate for this ensemble defined in equation(B-3). The standard deviation estimate of the ensemble of NP records defined in equation (B-5) is shown on figure519.5B-5a. This is also the root mean square of the residual ensemble. Figure 519.5B-6a contains a plot of the rootmean square for the ensemble. By subtracting the mean from each member of the ensemble as described in equation(B-4) a residual ensemble is obtained. This residual ensemble has zero mean and a non-zero time-varying root meansquare the same as the standard deviation of the original ensemble. It is very important to understand thecharacteristics of this residual ensemble. It should be clear from the above figures that the measured ensemble has atime-varying mean, a time-varying mean square, and a time-varying frequency with higher frequencies in the initialportion of the record. An energy spectral density computed on the original measured ensemble and the measuredresidual ensemble reveals the effect of removal of the time varying mean from the original ensemble and thediffering frequency characteristics of the two ensembles. Figure 519.5B-7a provides a superposition of both of these
Downloaded from http://www.everyspec.com on 2012-06-04T5:34:26.

MIL-STD-810F1 January 2000ANNEX B
METHOD 519.5
519.5B-6
ESD estimates. The Fourier analysis filter bandwidth for the ESD estimates is 5 Hz. An even more dramaticdepiction of the time-frequency character of the original ensemble is given on figure 519.5B-8a, T1 through T4. Inthis analysis the pulse length is divided into four equal time segments of 6.25 milliseconds each and the average ESDcomputed for each segment retaining a 20 Hz filter bandwidth. The estimates are averaged over the ensemble withno time domain tapering applied. When all four spectra are superimposed upon one another, it is clear that thevariation of frequency with time is substantial both for the original ensemble and for the residual ensemble (figure519.5B-9a). The residual ensemble is studied for its second order or correlation properties in references a, c and d. The actual steps used to perform the simulation according to the model outlined in equation (B-1) and to estimate theerror in the time-varying mean, standard deviation, root mean square, and the residual and overall energy spectrumestimate are contained in reference a. Figures 519.5B-10a and 10b depict the estimated deterministic functions a1(t)and a2(t), respectively. Figure 519.5B-11a displays the residual information before the residual is filtered, and figure519.5B-11b the residual after filtering is applied. Using information from references a and b only, Fourier basedprocessing (FFT and inverse FFT) is used to determine the simulated test ensemble. Segmentation in time in order tosimulate the time-varying frequency characteristics of the ensemble did provide for some minor discontinuity at thetime interval boundaries in the simulation. From Reference c it can be noted that it is also possible to segment thetime-varying characteristics in the frequency domain which also results in some minor discontinuities in thefrequency domain. The results of the simulation are displayed on the figures below in order to note the generalfidelity in the simulation. Figure 519.5B-1b represents a simulated ensemble with Np pulses to give an overallqualitative assessment of the simulation. Figure 519.5B-2b and figure 519.5B-3b provide plots of a typical pulse(pulse number 37) and its residual from this simulated ensemble, respectively. Figure 519.5B-4b is the mean for theensemble with figure 519.5B-5b the standard deviation, and figure 519.5B-6b the root mean square. Figures519.5B-7 through 519.5B-9 display measured information with corresponding simulated ESD information. Figure519.5B-12 contains the maximum, the median time-varying root variance estimates for the time-varying mean forsample sizes of 10, 25, and 50 pulses. This represents the error that might be expected at each time point as a resultof the simulation for the three sizes of ensembles. Corresponding information is provided on figure 519.5B-13 forthe time-varying standard deviation and on figure 519.5B-14 for the time-varying root mean square. In general foran ensemble with Np = 50 sample time histories, the maximum root variance is less than 2.5 g's with the medianbeing, in general, below 0.75 g's.
2.6 Implementation.
The technique outlined above may be implemented by pre-processing the data and generating the simulated materielresponse ensemble on a mainframe computer or a PC. In either case the simulated digital waveform must beappropriately compensated by the procedure described in Appendix A before the analog voltage signal to thevibration exciter is output. This technique of stochastic simulation is quite elaborate in detail but does provide for atrue stochastic time-varying laboratory simulation of materiel response based on measured in-service materielresponse. The technique is flexible, in that it can produce an unlimited number of “pulses,” all slightly different,with testing limited only by the length of time a vibration exciter controller can provide an adequate simulation in anopen-loop waveform mode of control. If it is assumed that vibration exciter output scales linearly with vibrationexciter master gain, degrees of test conservativeness in the stochastic simulation may be introduced.
2.7 References/Related Documents.
a. R. G. Merritt, Simulation of Ensemble Oriented Nonstationary Processes, Part 2 Proceedings of 1994IES 40th Annual Technical Meeting, Chicago, IL, May 1994.
b. J. S. Bendat and A. G. Piersol, Random Data: Analysis and Measurement Procedures, 2nd edition, JohnWiley & Sons Inc., New York, 1986.
c. D. O. Smallwood, Gunfire Characterization and Simulation Using Temporal Moments, Proceedings ofthe 65th Shock and Vibration Symposium, Volume 1, San Diego, CA, November 1994.
d. R. G. Merritt, An Example of the Analysis of a Sample Nonstationary Time History, Proceedings of1994 IES 40th Annual Technical Meeting, Chicago, IL, May 1994.
Downloaded from http://www.everyspec.com on 2012-06-04T5:34:26.

MIL-STD-810F1 January 2000ANNEX B
METHOD 519.5519.5B-7
e. C. Lanczos, Discourse on Fourier Series, Hafner Publishing Company, New York, 1966.
f. D. O. Smallwood, Characterization and Simulation of Gunfire with Wavelets, Proceedings of the 69thShock and Vibration Symposium, Minneapolis, MN, October 1998.
g. R.G. Merritt, A Note on Prediction of Gunfire Environment using the Pulse Method, Proceedings of1999 IEST 45th Annual Technical Meeting, Ontario, CA, May 1999.
h. D. O. Smallwood, Characterization and Simulation of Gunfire with Wavelets, Shock and Vibration,Volume 6, November 2, 1998, IOS Press, The Netherlands.
3. RECOMMENDED PROCEDURES.
3.1 Recommended Procedure.
For single point materiel response measurements on comparatively simple dynamic materiel, use this procedure incases in which laboratory replication of the response environment with potential statistical variation is absolutelyessential to establish materiel operational and structural integrity in a gunfire environment.
3.2 Uncertainty Factors.
This procedure includes statistical uncertainty in addition to uncertainty in the degree to which the measuredenvironment compares with the in-service environment. Uncertainty relative to the variety of in-service environmentconfigurations is not accounted for in this procedure. This procedure cannot be used to determine gunfireenvironment prediction errors.
Downloaded from http://www.everyspec.com on 2012-06-04T5:34:26.
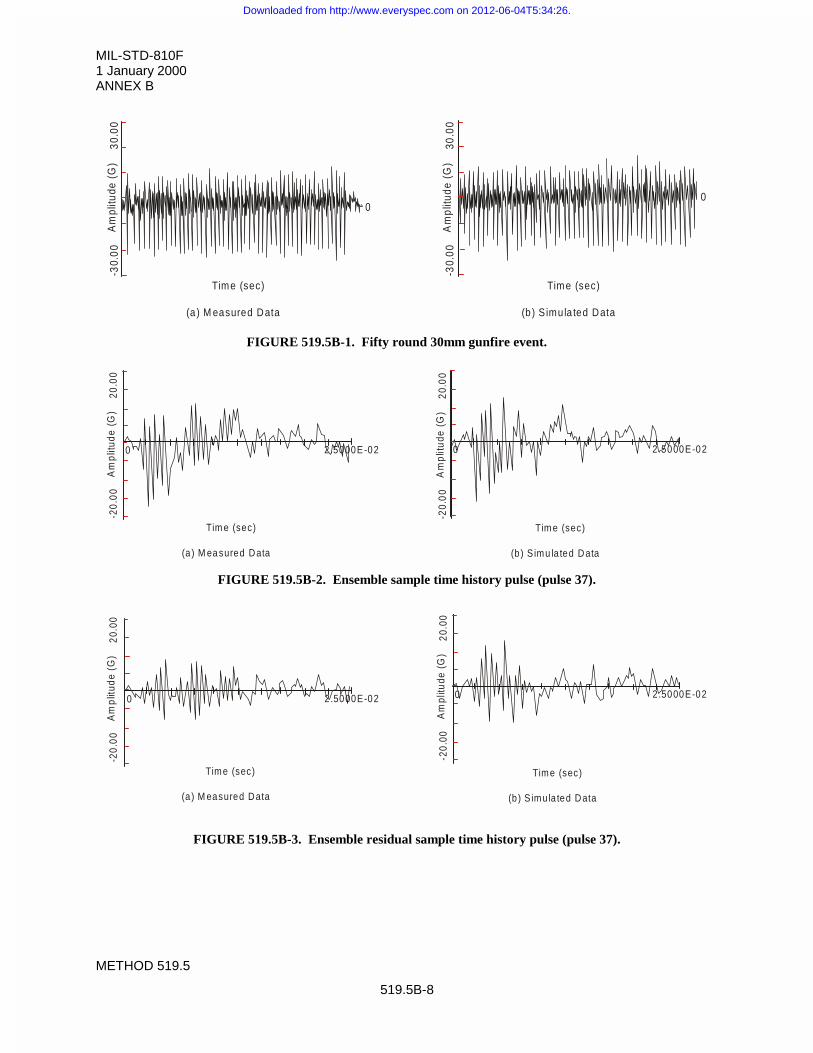
MIL-STD-810F1 January 2000ANNEX B
METHOD 519.5
519.5B-8
FIGURE 519.5B-1. Fifty round 30mm gunfire event.
FIGURE 519.5B-2. Ensemble sample time history pulse (pulse 37).
FIGURE 519.5B-3. Ensemble residual sample time history pulse (pulse 37).
30.0
0-3
0.00
Am
plitu
de (
G)
Time (sec)
(a ) M easured Data
0
30.0
0-3
0.00
Am
plitu
de (
G)
Time (sec)
(b ) S imula ted Data
0
20.0
0-2
0.00
Am
plitu
de (
G)
Tim e (sec)
(a ) M ea sured Data
0 2 .5000E-0220
.00
-20.
00
Am
plitu
de (
G)
Tim e (sec)
(b ) S imu la ted Data
0 2 .5000E-02
0 2.5000E-02
20.0
0-2
0.00
Am
plitu
de (
G)
Time (sec)
(a ) M easured Data
0 2 .5000E-02
20.0
0-2
0.00
Am
plitu
de (
G)
Time (sec)
(b ) S imu la ted Data
Downloaded from http://www.everyspec.com on 2012-06-04T5:34:26.
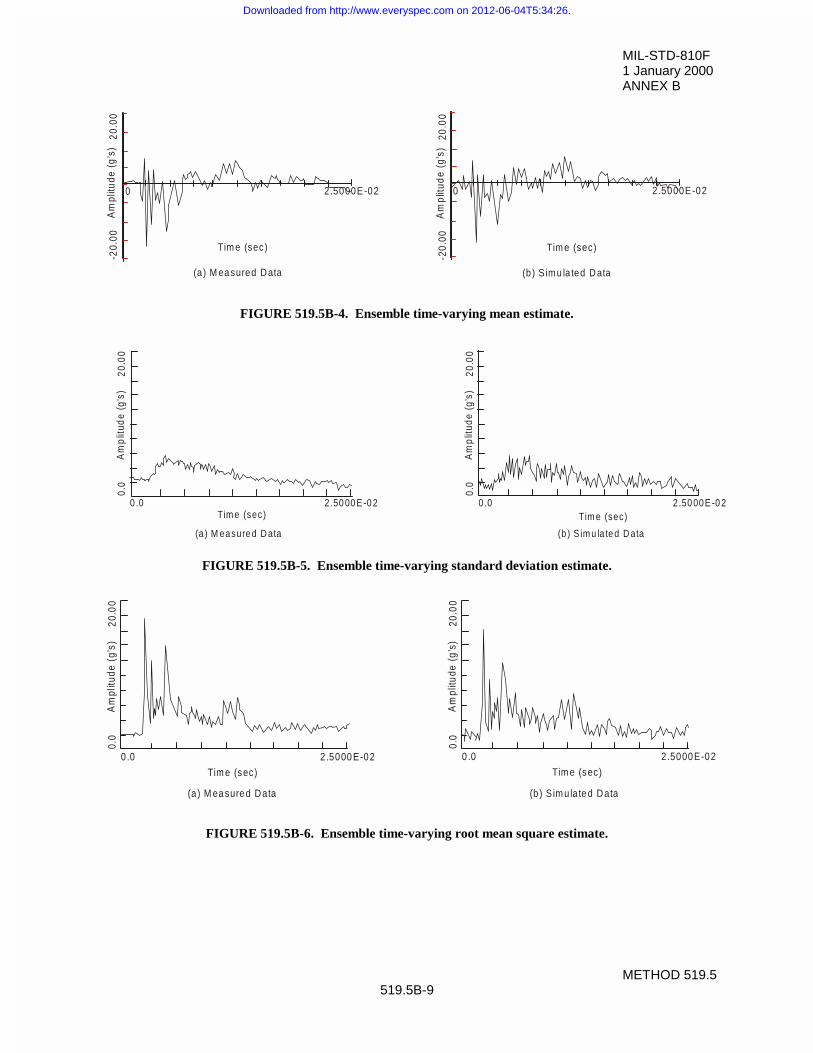
MIL-STD-810F1 January 2000ANNEX B
METHOD 519.5519.5B-9
FIGURE 519.5B-4. Ensemble time-varying mean estimate.
FIGURE 519.5B-5. Ensemble time-varying standard deviation estimate.
FIGURE 519.5B-6. Ensemble time-varying root mean square estimate.
20.0
0-2
0.00
Am
plitu
de (
g’s)
Tim e (sec)
(a ) M ea sured Data
0 2 .5000E-02
20.0
0-2
0.00
Am
plitu
de
(g’s
)
Tim e (sec)
(b ) S imu la ted Data
0 2 .5000E-02
2 .50 00E -0 20 .0
0.0
20.0
0A
mp
litud
e (g
’s)
Tim e (sec)
(a ) M easure d D ata
2 .50 00E -0 2
(b ) S im u la te d D ata
Tim e (sec)0 .0
0.0
20.0
0A
mp
litud
e (g
’s)
2 .5000 E-02
Tim e (sec)
0 .0
0.0
20.0
0A
mpl
itude
(g’
s)
(a ) M ea sure d Data (b ) S im u la te d Data
2 .5000 E-02
Tim e (sec)
0 .0
0.0
20.0
0A
mpl
itude
(g’
s)
Downloaded from http://www.everyspec.com on 2012-06-04T5:34:26.
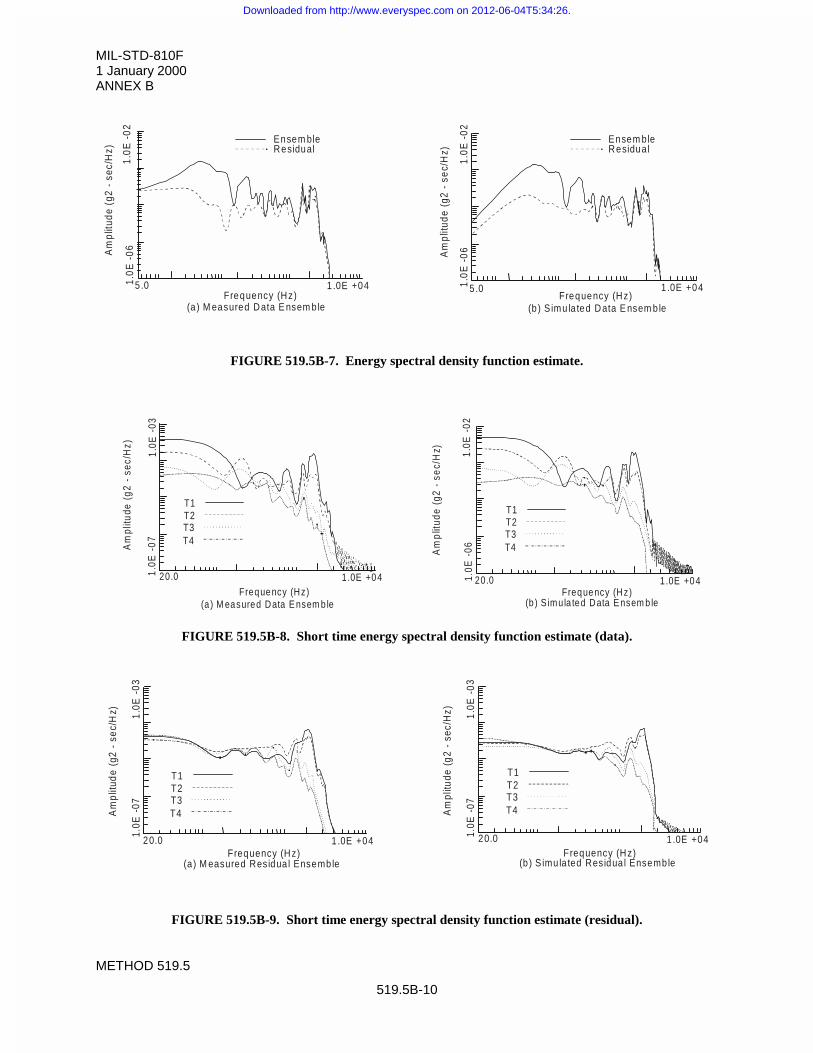
MIL-STD-810F1 January 2000ANNEX B
METHOD 519.5
519.5B-10
FIGURE 519.5B-7. Energy spectral density function estimate.
FIGURE 519.5B-8. Short time energy spectral density function estimate (data).
FIGURE 519.5B-9. Short time energy spectral density function estimate (residual).
Frequency (Hz)(a ) M easured Data E nsem ble
Am
plitu
de (
g2 -
sec
/Hz)
F requency (Hz)(b ) S imu la ted Data E nsem ble
Am
plitu
de (
g2 -
sec
/Hz)
Ensem bleResidual
Ensem bleResidual
1.0E
-06
1 .0E +045.0
1.0E
-02
1.0E
-02
1.0E
-06
1 .0E +045.0
Frequency (Hz)(a ) M easured Data E nsem b le
Am
plitu
de (
g2 -
sec
/Hz)
Frequency (Hz)(b ) S imula ted Data E nsem b le
Am
plitu
de (
g2 -
sec
/Hz)
T1 T2T3T4
T1 T2T3T4
1.0E
-07
1.0E
-03
1.0E
-02
1.0E
-06
20.0 1.0E +04 20.0 1.0E +04
Frequency (Hz)(a ) M easured Residua l Ensemble
Am
plitu
de (
g2 -
sec
/Hz)
F requency (Hz)(b ) S imu la ted Residua l Ensemble
T1 T2T3T4
T1 T2T3T4A
mpl
itude
(g2
- s
ec/H
z)1.0E
-03
1.0E
-07
1.0E
-03
1.0E
-07
20.0 1 .0E +04 20.0 1 .0E +04
Downloaded from http://www.everyspec.com on 2012-06-04T5:34:26.
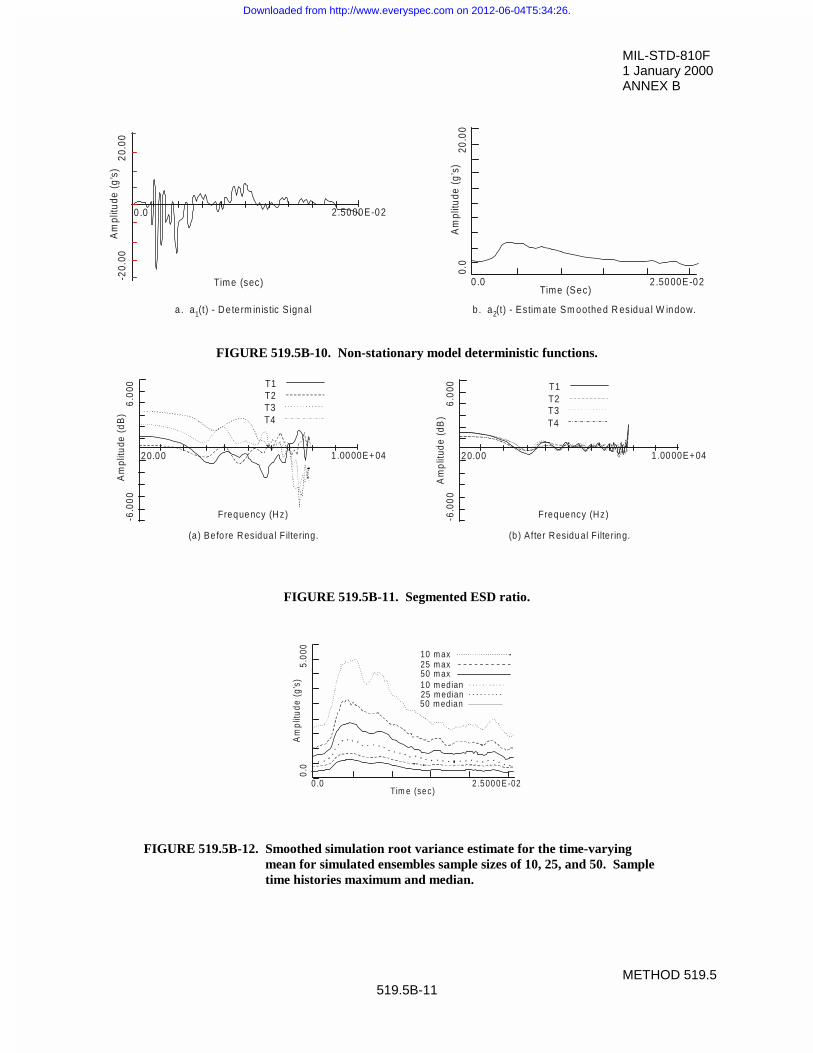
MIL-STD-810F1 January 2000ANNEX B
METHOD 519.5519.5B-11
FIGURE 519.5B-10. Non-stationary model deterministic functions.
FIGURE 519.5B-11. Segmented ESD ratio.
FIGURE 519.5B-12. Smoothed simulation root variance estimate for the time-varyingmean for simulated ensembles sample sizes of 10, 25, and 50. Sampletime histories maximum and median.
2 .5000E -02Tim e (sec)
0 .0
0.0
5.00
0A
mpl
itude
(g’
s)
10 m ax25 m ax50 m ax10 m edian25 m edian50 m edian
2 .5000E-02Time (Sec)
0 .0
0.0
20.0
0A
mpl
itude
(g’
s)
20.0
0-2
0.00
Am
plitu
de (
g’s)
Time (sec)
0 .0 2 .5000E-02
a. a (t) - De te rm in is tic S ignal1 b . a (t) - Estim ate Sm oothed R esidua l W indow.2
6.0
00-6
.00
0A
mpl
itude
(d
B)
Frequency (Hz)
20.00 1 .0000E+04
(a ) Be fo re Residual F iltering.
6.0
00-6
.00
0A
mp
litud
e (d
B)
Frequency (Hz)
20.00 1 .0000E+04
(b ) After Residual F iltering.
T1 T2T3T4
T1 T2T3T4
Downloaded from http://www.everyspec.com on 2012-06-04T5:34:26.
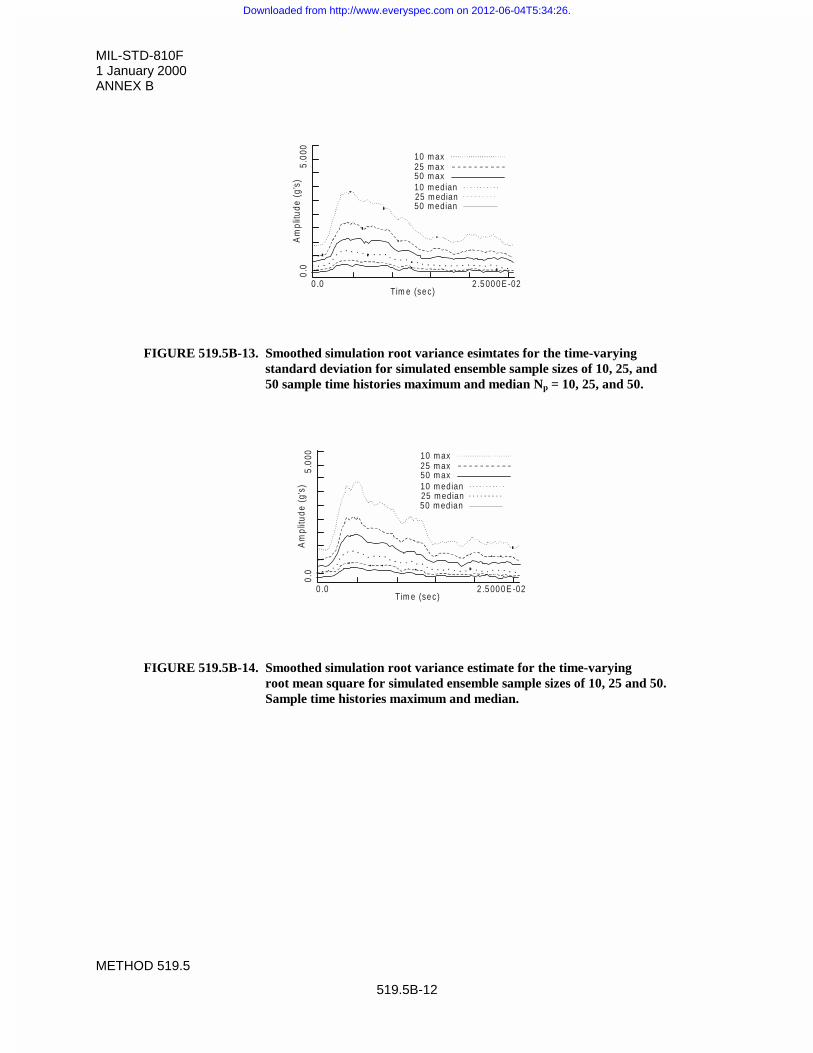
MIL-STD-810F1 January 2000ANNEX B
METHOD 519.5
519.5B-12
FIGURE 519.5B-13. Smoothed simulation root variance esimtates for the time-varyingstandard deviation for simulated ensemble sample sizes of 10, 25, and50 sample time histories maximum and median Np = 10, 25, and 50.
FIGURE 519.5B-14. Smoothed simulation root variance estimate for the time-varyingroot mean square for simulated ensemble sample sizes of 10, 25 and 50.Sample time histories maximum and median.
2 .5000E -02Tim e (sec)
0 .0
0.0
5.00
0A
mpl
itude
(g’
s)
10 m ax25 m ax50 m ax10 m edian25 m edian50 m edian
2 .5000E -02Tim e (sec)
0 .0
0.0
5.00
0A
mpl
itude
(g’
s)
10 m ax25 m ax50 m ax10 m edian25 m edian50 m edian
Downloaded from http://www.everyspec.com on 2012-06-04T5:34:26.
MIL-STD-810F1 January 2000ANNEX C
METHOD 519.5519.5C-1
ANNEX C
REPETITIVE PULSE SHOCK RESPONSE SPECTRUM (SRS)
1. SCOPE.
1.1 Purpose.
This annex provides guidance and a basis for a technique for laboratory simulation of a measured materiel responseof a gunfire environment. This technique is a form of the “Pulse Method” previously identified in MIL-STD-810E.
1.2 Application.
This technique is for a single unknown time-varying random process for which a single sample function from theprocess is available. This single sample function is representative of a single gunfire physical configuration forwhich extrapolation to other configurations is undetermined. This technique:
a. is convenient to implement on a vibration exciter control system with SRS capability;
b. has many features analogous to that of traditional SRS shock simulation based on SRS estimatespecification;
c. is very flexible in terms of the length of statistically equivalent records it can generate for laboratory testreplication of an in-service measured response environment;
d. is not restricted to one form of pulse, and
e. abandons a minimal number of higher order features of the measured response ensemble not consideredessential to conservative in-service measured response data replication by way of laboratory test itemresponse simulation testing.
The following paragraphs are directed toward an overview of this method of test item response simulation along withits limitations.
2. DEVELOPMENT.
2.1 Introduction.
The SRS method assumes that the measured materiel response time history can be decomposed into an ensemble ofindividual pulses. Maximax SRS are computed over the ensemble of pulses using various damping factors to assistin characterizing the frequency content of the individual pulses. The SRS mean is also computed over the ensembleof pulses for each damping factor to further characterize the materiel response pulses. Using the information fromthe SRS, an acceleration time history using amplitude modulated sine components or damped sinusoids issynthesized. The SRS time history is then used as the characteristic gunfire materiel response pulse, and input to thetest item at the firing rate of the gun. (See references a and b in paragraph 2.8.)
2.1.1 Advantages of this procedure are:
a. it makes use of standard laboratory shock test equipment;
b. the method reproduces the frequency characteristics of the measured materiel response data;
c. the SRS can be easily specified in documents and reproduced at various test facilities.
Downloaded from http://www.everyspec.com on 2012-06-04T5:34:26.
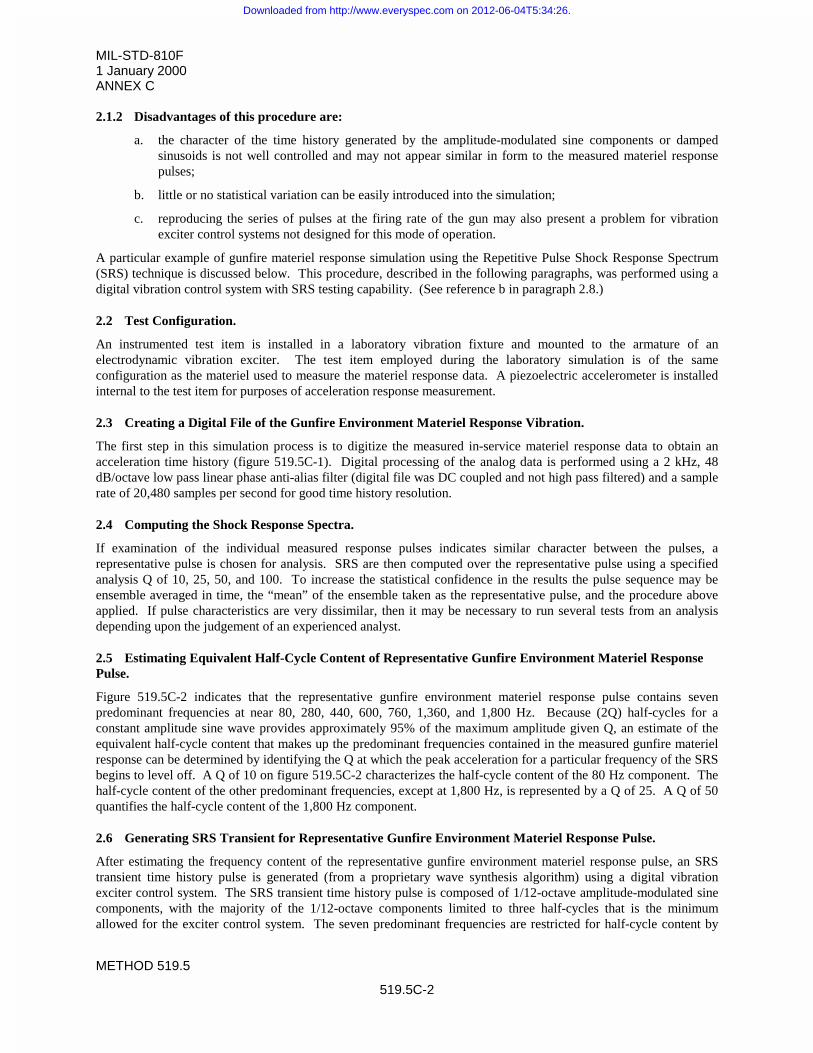
MIL-STD-810F1 January 2000ANNEX C
METHOD 519.5
519.5C-2
2.1.2 Disadvantages of this procedure are:
a. the character of the time history generated by the amplitude-modulated sine components or dampedsinusoids is not well controlled and may not appear similar in form to the measured materiel responsepulses;
b. little or no statistical variation can be easily introduced into the simulation;
c. reproducing the series of pulses at the firing rate of the gun may also present a problem for vibrationexciter control systems not designed for this mode of operation.
A particular example of gunfire materiel response simulation using the Repetitive Pulse Shock Response Spectrum(SRS) technique is discussed below. This procedure, described in the following paragraphs, was performed using adigital vibration control system with SRS testing capability. (See reference b in paragraph 2.8.)
2.2 Test Configuration.
An instrumented test item is installed in a laboratory vibration fixture and mounted to the armature of anelectrodynamic vibration exciter. The test item employed during the laboratory simulation is of the sameconfiguration as the materiel used to measure the materiel response data. A piezoelectric accelerometer is installedinternal to the test item for purposes of acceleration response measurement.
2.3 Creating a Digital File of the Gunfire Environment Materiel Response Vibration.
The first step in this simulation process is to digitize the measured in-service materiel response data to obtain anacceleration time history (figure 519.5C-1). Digital processing of the analog data is performed using a 2 kHz, 48dB/octave low pass linear phase anti-alias filter (digital file was DC coupled and not high pass filtered) and a samplerate of 20,480 samples per second for good time history resolution.
2.4 Computing the Shock Response Spectra.
If examination of the individual measured response pulses indicates similar character between the pulses, arepresentative pulse is chosen for analysis. SRS are then computed over the representative pulse using a specifiedanalysis Q of 10, 25, 50, and 100. To increase the statistical confidence in the results the pulse sequence may beensemble averaged in time, the “mean” of the ensemble taken as the representative pulse, and the procedure aboveapplied. If pulse characteristics are very dissimilar, then it may be necessary to run several tests from an analysisdepending upon the judgement of an experienced analyst.
2.5 Estimating Equivalent Half-Cycle Content of Representative Gunfire Environment Materiel ResponsePulse.
Figure 519.5C-2 indicates that the representative gunfire environment materiel response pulse contains sevenpredominant frequencies at near 80, 280, 440, 600, 760, 1,360, and 1,800 Hz. Because (2Q) half-cycles for aconstant amplitude sine wave provides approximately 95% of the maximum amplitude given Q, an estimate of theequivalent half-cycle content that makes up the predominant frequencies contained in the measured gunfire materielresponse can be determined by identifying the Q at which the peak acceleration for a particular frequency of the SRSbegins to level off. A Q of 10 on figure 519.5C-2 characterizes the half-cycle content of the 80 Hz component. Thehalf-cycle content of the other predominant frequencies, except at 1,800 Hz, is represented by a Q of 25. A Q of 50quantifies the half-cycle content of the 1,800 Hz component.
2.6 Generating SRS Transient for Representative Gunfire Environment Materiel Response Pulse.
After estimating the frequency content of the representative gunfire environment materiel response pulse, an SRStransient time history pulse is generated (from a proprietary wave synthesis algorithm) using a digital vibrationexciter control system. The SRS transient time history pulse is composed of 1/12-octave amplitude-modulated sinecomponents, with the majority of the 1/12-octave components limited to three half-cycles that is the minimumallowed for the exciter control system. The seven predominant frequencies are restricted for half-cycle content by
Downloaded from http://www.everyspec.com on 2012-06-04T5:34:26.
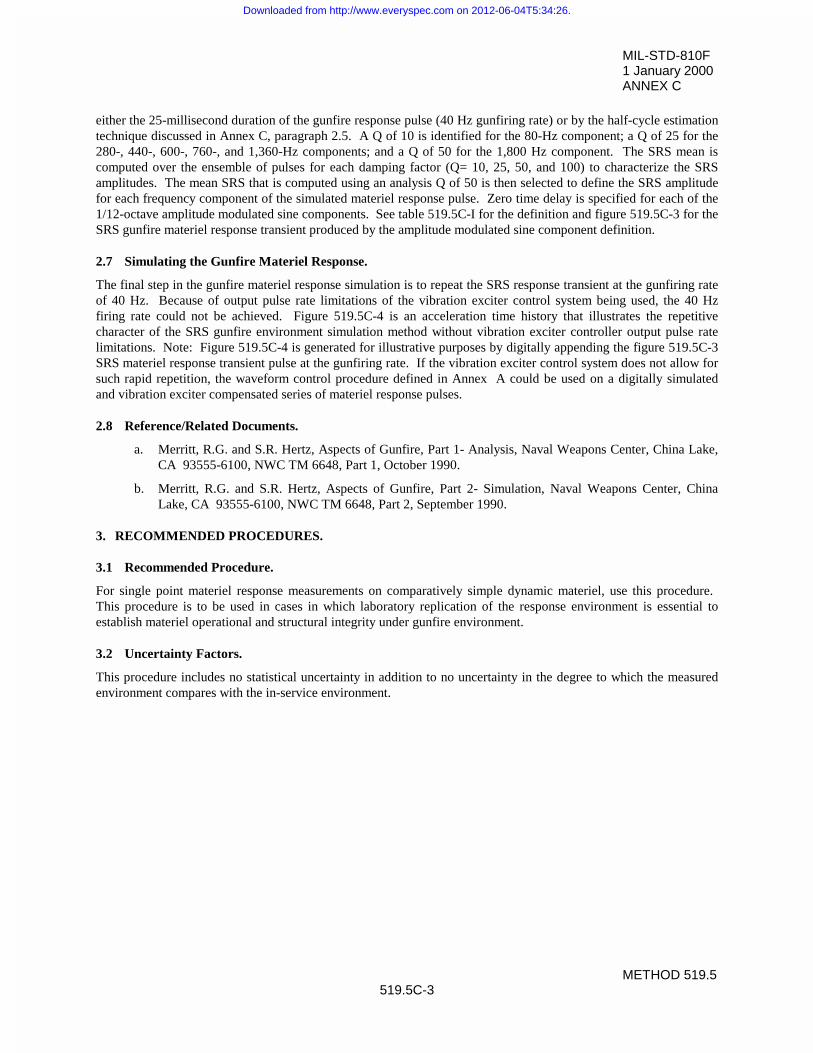
MIL-STD-810F1 January 2000ANNEX C
METHOD 519.5519.5C-3
either the 25-millisecond duration of the gunfire response pulse (40 Hz gunfiring rate) or by the half-cycle estimationtechnique discussed in Annex C, paragraph 2.5. A Q of 10 is identified for the 80-Hz component; a Q of 25 for the280-, 440-, 600-, 760-, and 1,360-Hz components; and a Q of 50 for the 1,800 Hz component. The SRS mean iscomputed over the ensemble of pulses for each damping factor (Q= 10, 25, 50, and 100) to characterize the SRSamplitudes. The mean SRS that is computed using an analysis Q of 50 is then selected to define the SRS amplitudefor each frequency component of the simulated materiel response pulse. Zero time delay is specified for each of the1/12-octave amplitude modulated sine components. See table 519.5C-I for the definition and figure 519.5C-3 for theSRS gunfire materiel response transient produced by the amplitude modulated sine component definition.
2.7 Simulating the Gunfire Materiel Response.
The final step in the gunfire materiel response simulation is to repeat the SRS response transient at the gunfiring rateof 40 Hz. Because of output pulse rate limitations of the vibration exciter control system being used, the 40 Hzfiring rate could not be achieved. Figure 519.5C-4 is an acceleration time history that illustrates the repetitivecharacter of the SRS gunfire environment simulation method without vibration exciter controller output pulse ratelimitations. Note: Figure 519.5C-4 is generated for illustrative purposes by digitally appending the figure 519.5C-3SRS materiel response transient pulse at the gunfiring rate. If the vibration exciter control system does not allow forsuch rapid repetition, the waveform control procedure defined in Annex A could be used on a digitally simulatedand vibration exciter compensated series of materiel response pulses.
2.8 Reference/Related Documents.
a. Merritt, R.G. and S.R. Hertz, Aspects of Gunfire, Part 1- Analysis, Naval Weapons Center, China Lake,CA 93555-6100, NWC TM 6648, Part 1, October 1990.
b. Merritt, R.G. and S.R. Hertz, Aspects of Gunfire, Part 2- Simulation, Naval Weapons Center, ChinaLake, CA 93555-6100, NWC TM 6648, Part 2, September 1990.
3. RECOMMENDED PROCEDURES.
3.1 Recommended Procedure.
For single point materiel response measurements on comparatively simple dynamic materiel, use this procedure. This procedure is to be used in cases in which laboratory replication of the response environment is essential toestablish materiel operational and structural integrity under gunfire environment.
3.2 Uncertainty Factors.
This procedure includes no statistical uncertainty in addition to no uncertainty in the degree to which the measuredenvironment compares with the in-service environment.
Downloaded from http://www.everyspec.com on 2012-06-04T5:34:26.
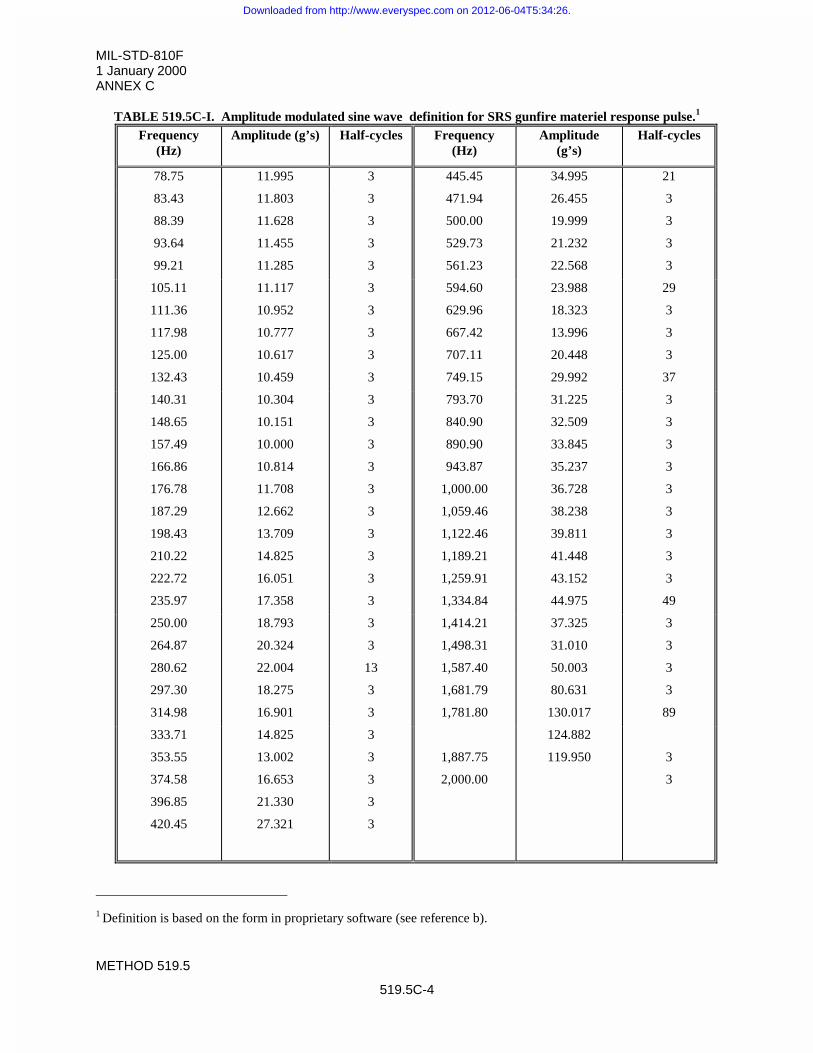
MIL-STD-810F1 January 2000ANNEX C
METHOD 519.5
519.5C-4
TABLE 519.5C-I. Amplitude modulated sine wave definition for SRS gunfire materiel response pulse.1
Frequency(Hz)
Amplitude (g’s) Half-cycles Frequency(Hz)
Amplitude(g’s)
Half-cycles
78.75 11.995 3 445.45 34.995 21
83.43
88.39
93.64
99.21
11.803
11.628
11.455
11.285
3
3
3
3
471.94
500.00
529.73
561.23
26.455
19.999
21.232
22.568
3
3
3
3
105.11
111.36
117.98
125.00
132.43
11.117
10.952
10.777
10.617
10.459
3
3
3
3
3
594.60
629.96
667.42
707.11
749.15
23.988
18.323
13.996
20.448
29.992
29
3
3
3
37
140.31
148.65
157.49
166.86
176.78
10.304
10.151
10.000
10.814
11.708
3
3
3
3
3
793.70
840.90
890.90
943.87
1,000.00
31.225
32.509
33.845
35.237
36.728
3
3
3
3
3
187.29
198.43
210.22
222.72
235.97
12.662
13.709
14.825
16.051
17.358
3
3
3
3
3
1,059.46
1,122.46
1,189.21
1,259.91
1,334.84
38.238
39.811
41.448
43.152
44.975
3
3
3
3
49
250.00
264.87
280.62
297.30
314.98
18.793
20.324
22.004
18.275
16.901
3
3
13
3
3
1,414.21
1,498.31
1,587.40
1,681.79
1,781.80
37.325
31.010
50.003
80.631
130.017
3
3
3
3
89
333.71
353.55
374.58
396.85
420.45
14.825
13.002
16.653
21.330
27.321
3
3
3
3
3
1,887.75
2,000.00
124.882
119.950 3
3
1 Definition is based on the form in proprietary software (see reference b).
Downloaded from http://www.everyspec.com on 2012-06-04T5:34:26.
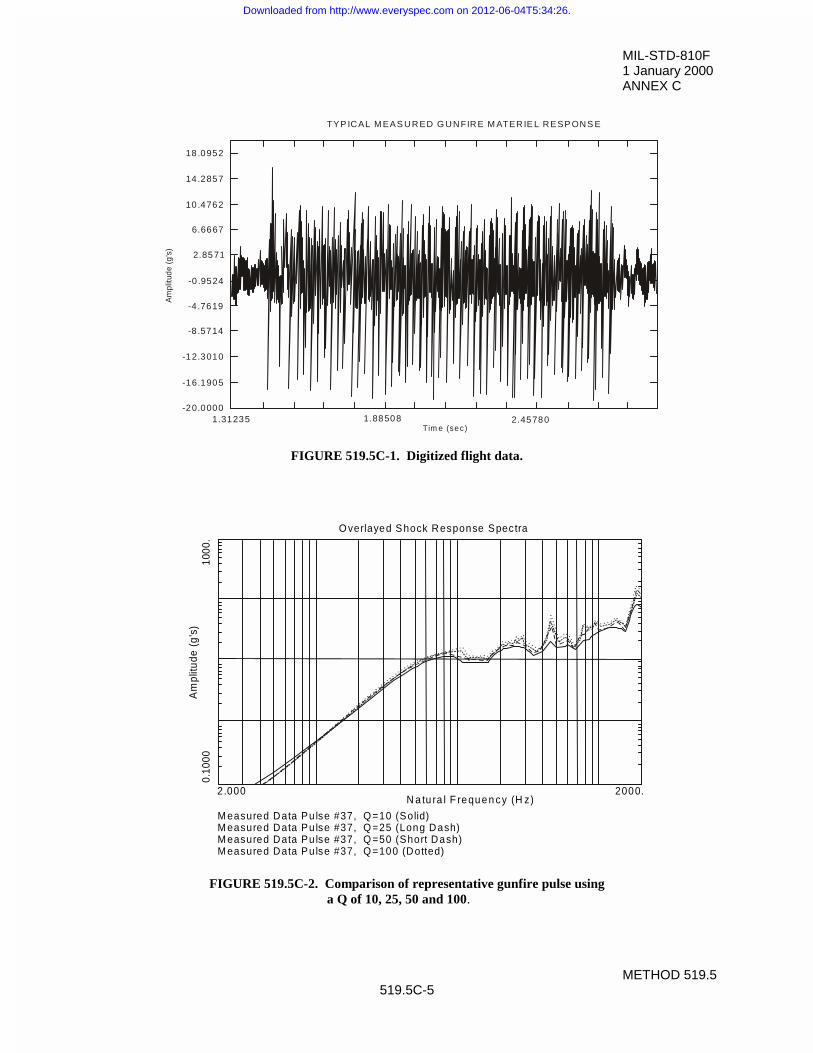
MIL-STD-810F1 January 2000ANNEX C
METHOD 519.5519.5C-5
FIGURE 519.5C-1. Digitized flight data.
FIGURE 519.5C-2. Comparison of representative gunfire pulse using a Q of 10, 25, 50 and 100.
1.88508Tim e (sec)
2.457801.31235-20.0000
-16.1905
-12.3010
-8 .5714
-4 .7619
-0 .9524
2.8571
6.6667
10.4762
14.2857
18.0952
TYP ICAL MEAS URED G UNFIRE M ATERIE L RESP ONS E
Am
plitu
de (
g’s)
2 .000 2000.N a tu ra l F requen cy (H z)
M easured Data Pu lse #37, Q =10 (Solid)M easured Data Pu lse #37, Q =25 (Long Dash)M easured Data Pu lse #37, Q =50 (Short Dash)M easured Data Pu lse #37, Q =100 (Dotted)
0.10
00A
mpl
itude
(g’
s)10
00.
O verlayed S hock Response Spectra
Downloaded from http://www.everyspec.com on 2012-06-04T5:34:26.
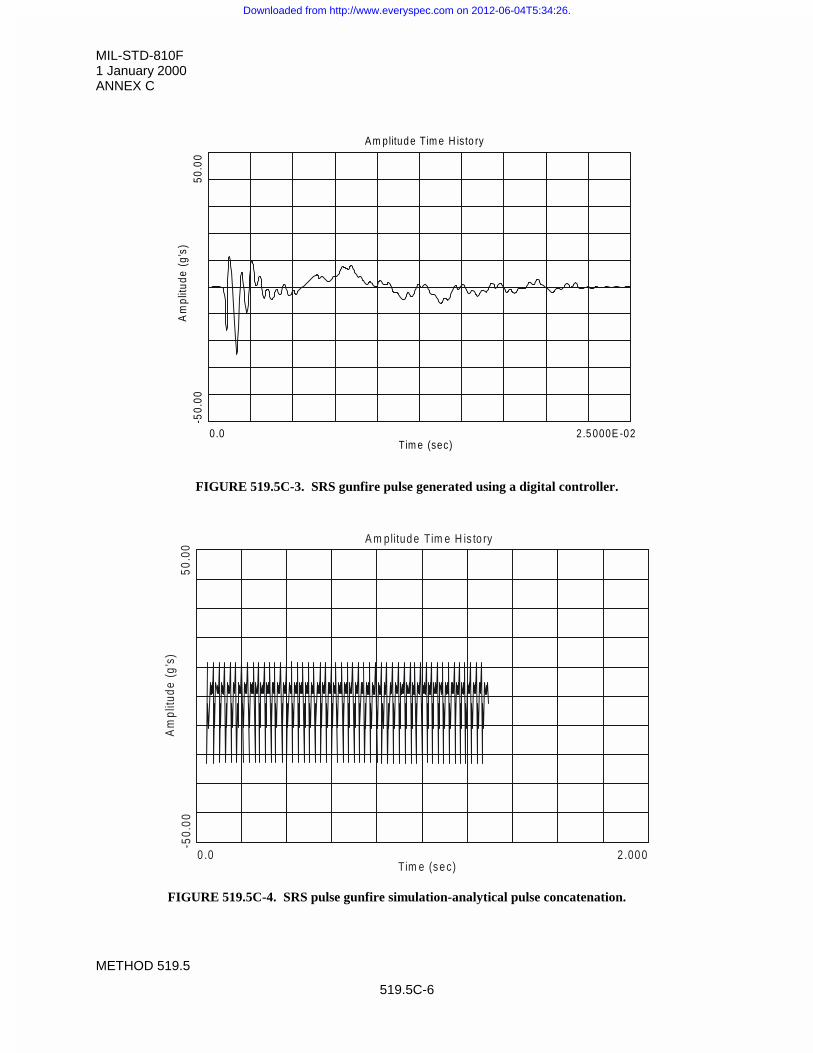
MIL-STD-810F1 January 2000ANNEX C
METHOD 519.5
519.5C-6
FIGURE 519.5C-3. SRS gunfire pulse generated using a digital controller.
FIGURE 519.5C-4. SRS pulse gunfire simulation-analytical pulse concatenation.
Am plitud e Tim e H isto ry
50.0
0A
mpl
itude
(g’
s)-5
0.00
0 .0Tim e (sec)
2.5 000E -02
A m plitud e Tim e H is to ry
50.0
0A
mpl
itude
(g’
s)-5
0.00
0 .0Tim e (se c)
2 .00 0
Downloaded from http://www.everyspec.com on 2012-06-04T5:34:26.
MIL-STD-810F1 January 2000ANNEX D
METHOD 519.5519.5D-1
ANNEX D
HIGH LEVEL RANDOM VIBRATION/SINE-ON-RANDOM VIBRATION/NARROWBAND RANDOM-ON-RANDOM VIBRATION
1. SCOPE.
1.1 Purpose.
This Annex provides the option of utilizing predicted gunfire vibration data (when measured data is not available), toensure that materiel mounted in an aircraft with onboard guns can withstand the vibration levels caused by (1) pulseoverpressures emitting from the muzzle of the gun impinging upon materiel support structure, and (2) structure-bornevibration. (This Annex constitutes a reformatting of method 519.4, Gunfire Vibration, Aircraft, in MIL-STD-810Ewith a limited number of enhancements.) This Annex also provides the option for using high level random vibration(measured data are available) when the measured data spectrum displays no outstanding discrete harmoniccomponents.
1.2 Application.
This Annex is applicable only for aircraft gunfire and materiel mounted in an aircraft with onboard guns. Guidancein this Annex is to be used only if in-service measured materiel response data is not available or will not be availablein the early stages of a development program. This Annex is not intended to justify the use of sine-on-random ornarrowband random-on-random for cases in which measured data displays a broadband spectra along withcomponents at discrete frequencies. Use the information in this Annex only if it is vital to the design of the materiel.If there is a possibility of obtaining early measurements of the materiel response mounted on the in-service platform,supplant the severity’s developed using the information in this Annex with the severity’s estimated from the materielresponse under in-service measurements and one of the other procedures used for testing. In particular, if themeasured materiel response in-service environment has the character of high level broadband random vibration withno characteristics conducive to application of Procedure II or Procedure III, then
a. apply Procedure I in the form of transient vibration, or
b. submit the materiel to a specified level of high level broadband random vibration (based on ASDestimates of the measured in-service materiel response) over a period of time consistent with low cyclefatigue assumptions in accelerated testing or as specified in the test plan (see method 514.5).
2. DEVELOPMENT.
2.1 Introduction.
This Annex is essentially a reorganized reproduction of the information contained in reference a. of paragraph 2.5.with some additional guidance. Mention of the pulse method in paragraph I-4.4.1 of reference a. has not beenincluded, but is covered in reference b. that provides insight into the use of the pulse method in conjunction with apredictive rationale. Procedure IV differs from the other three procedures in that it is a result of a predictionprocedure developed on the basis of an analysis of a comparatively small set of measured gunfire materiel responsedata. The predicted spectrum therefore provides estimates of materiel vibration response that may be substantiallydifferent from in-service measured vibration response of a particular materiel. For a particular materiel andgun/materiel configuration, materiel response to gunfire is generally not amenable to accurate prediction. Theprediction methodology provided below is generally subject to a large degree of uncertainty with respect to testlevel. This uncertainty is very apparent in gunfire configurations where the gun is less than a meter from themateriel.
Downloaded from http://www.everyspec.com on 2012-06-04T5:34:26.
MIL-STD-810F1 January 2000ANNEX D
METHOD 519.5
519.5D-2
2.2 Predicting Gunfire Vibration Spectra.
Gunfire vibration prediction spectra consist of a broadband spectrum representative of an ASD estimate fromstationary random vibration along with four harmonically related sine waves. Figure 519.5D-1 provides ageneralized vibration spectrum for gunfire-induced vibration that defines the predicted response of materiel to agunfire environment. It is characterized by four single frequency harmonically related (sine) vibration peakssuperimposed on a broadband random vibration spectrum. The vibration peaks are at frequencies that correspond tothe nominal gunfire rate and the first three harmonics of the gunfiring rate. The specific values for each of theparameters shown on figure 519.5D-1 can be determined from table 519.5D-I, table 519.5D-II, table 519.5D-III, andfigures 519.5-2 through 8. The suggested generalized parametric equation for the three levels of broadband randomvibration, Tj, defining the spectrum on figure 519.5D-1 is given in dB for g2/Hz (reference to 1 g2/Hz) as
10log10 ( Tj ) = 10log10 (N F1 E) + H + M + W + J + Bj - 53 dB j=1,2,3 (D-1)
where the parameters are defined in table 519.5D-I. The suggested generalized parametric equation for the fourlevels of single frequency (sine) vibration defining the spectrum on figure 519.5D-1 is given in dB for g2/Hz(reference to 1 g2/Hz) as
10log10 ( Pi ) = 10log10 ( T3 ) + Ki + 17 dB i=1,2,3,4 (D-2)
where the parameters are defined in table 519.5D-I.
The key geometrical relations used to determine the predicted vibration spectra are the following four geometricalfactors :
a. Vector distance (D). The vector distance from the muzzle of the gun to the mean distance betweenmateriel support points as shown on figure 519.5D-2. For configurations involving multiple guns, theorigin of vector D is determined from the centroidal point of the gun muzzle, as shown on figure 519.5D-3. Figure 519.5D-7 and figure 519.5D-8 provide for spectra reduction factors related to D for therandom spectra and the discrete frequency spectra, respectively.
b. Gun standoff distance (h). The distance normal to the aircraft’s surface as shown on figure 519.5D-4.
c. Depth parameter (Rs). The distance normal to the aircraft's skin to the materiel location inside theaircraft. If Rs is unknown, use Rs = 7.6 cm (see figure 519.5D-2). Figure 519.5D-6 provides spectrareduction factors related to Rs.
d. Gun caliber (c). Table 519.5D-III defines the gun caliber parameter, c, in millimeters and inches.
For this procedure, base the vibration peak bandwidths consistent with windowed Fourier processing on in-servicemeasured materiel response data if available. When such in-service data are not available, the vibration peakbandwidths can be calculated as:
BW3dB = (S F1/2)/4 (D-3)
for
BW3dB = the bandwidth at a level 3dB (factor of 2) below the peak ASD level
F = the fundamental frequency or one of the harmonics F1, F2, F3, or F4
For cases where the gunfiring rate changes during a development program or the gun may be fired at a sweep rate, itis desirable to either (1) perform sinusoidal sweeps within the proposed bandwidth for the fundamental and eachharmonic or (2) apply narrowband random vibration levels provided the sweep frequency bandwidth is not too large.This technique may over-predict those frequencies where the attachment structure or materiel responses becomesignificantly nonlinear. Likewise, for those cases in which the attachment structure or materiel resonances coincidewith the frequencies in the gunfire environment, the materiel vibration response could be under-predicted. Thepractitioner should clearly understand the options available and inherent limitations in the vibration control systemsoftware.
Downloaded from http://www.everyspec.com on 2012-06-04T5:34:26.
MIL-STD-810F1 January 2000ANNEX D
METHOD 519.5519.5D-3
2.3 Duration of Test.
Use a duration for the gunfire vibration test in each of the three axes, equivalent to the expected total time themateriel will experience the environment in in-service use. This duration may be conservatively estimated bymultiplying the expected number of aircraft sorties in which gunfiring will occur by the maximum amount of timethat gunfiring can occur in each sortie. The number of sorties in which gunfire will occur will be associated withplanned aircraft training and combat utilization rates, but will generally be in the vicinity of 200 to 300 sorties. Themaximum time of gunfire per sortie can be determined from table 519.5D-II by dividing total rounds per aircraft bythe firing rate. When a gun has more than one firing rate, perform the test using both firing rates, with test time ateach firing rate based on the expected proportion of time at each firing rate for in-service use. The guns carried byan aircraft are generally fired in short bursts that last a few seconds. Testing to a gunfire environment should reflecta form of in-service use in compliance with the test plan. For example, vibration could be applied for two secondsfollowed by an eight-second rest period during which no vibration is applied. This two-second-on/eight-second-offcycle is repeated until the total vibration time equals that determined for the aircraft type and its in-service use. Thiscycling will prevent the occurrence of unrealistic failure modes due to vibration isolator overheating or buildup ofmateriel response in continuous vibration. Intermittent vibration can be achieved by several means including (1) theinterruption of the exciter input signal, and (2) a waveform replication strategy for transient vibration discussed inAnnex A.
2.4 Spectrum Generation Techniques.
Gunfire materiel response vibration is characterized by broadband random vibration with four vibration peaks thatoccur at the first three harmonics and the fundamental frequency of the firing rate of the onboard guns. Virtually allmodern vibration control system software packages contain a provision for performing a gunfire vibration test basedon this form of predicted sine-on-random spectra. The details of these software packages are in general proprietary,but the practitioner is expected to have a clear understanding of the capabilities and limitations of the software. Onoccasion it has been noted that the dynamic range required to produce and control a specified gunfire spectrum isbeyond the ability of some available vibration controllers. A way of solving this problem is to enter into thevibration controller the desired broadband random spectrum with its strong vibration peaks. At those frequenciesthat have the intense vibration peaks, sine waves may be electronically added to the input of the vibration exciteramplifier. Ensure the amplitude of these sine waves is such that the vibration levels produced at those frequencies isslightly less than the desired spectrum level. The vibration controller can make the final adjustment to achieve theneeded test level. It is important to note that Pi is in terms of g2/Hz and not g’s, (care must be exercised in specifyingthe amplitude of the sine waves in g’s or equivalently input voltage corresponding to a g level). This means ofenvironment replication allows the gunfire vibration test to be done closed loop with commonly available laboratorytest equipment and control system software.
2.5 Reference/Related Documents.
a. MIL-STD-810E Method 519.4, 14 July 1989.
b. Merritt, R. G., “A Note on Prediction of Gunfire Environment Using the Pulse Method”, IEST, 40th
ATM, Ontario, CA, May 1999.
3. RECOMMENDED PROCEDURES.
3.1 Recommended Procedure.
For aircraft vibration for materiel mounted in the aircraft with no available measured data, use this procedure withthe prediction methodology. For cases in which available measured data demonstrate only broadband high levelvibration with no “discrete” components, use this procedure.
Downloaded from http://www.everyspec.com on 2012-06-04T5:34:26.
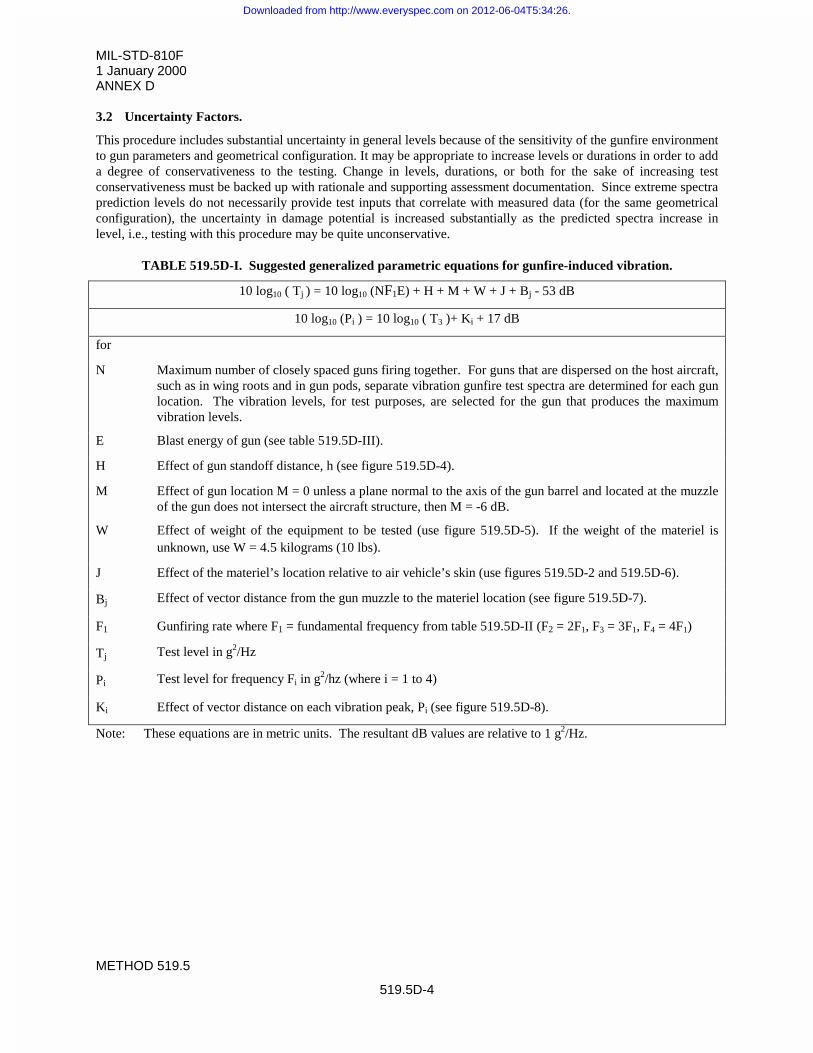
MIL-STD-810F1 January 2000ANNEX D
METHOD 519.5
519.5D-4
3.2 Uncertainty Factors.
This procedure includes substantial uncertainty in general levels because of the sensitivity of the gunfire environmentto gun parameters and geometrical configuration. It may be appropriate to increase levels or durations in order to adda degree of conservativeness to the testing. Change in levels, durations, or both for the sake of increasing testconservativeness must be backed up with rationale and supporting assessment documentation. Since extreme spectraprediction levels do not necessarily provide test inputs that correlate with measured data (for the same geometricalconfiguration), the uncertainty in damage potential is increased substantially as the predicted spectra increase inlevel, i.e., testing with this procedure may be quite unconservative.
TABLE 519.5D-I. Suggested generalized parametric equations for gunfire-induced vibration.
10 log10 ( Tj ) = 10 log10 (NF1E) + H + M + W + J + Bj - 53 dB
10 log10 (Pi ) = 10 log10 ( T3 )+ Ki + 17 dB
for
N Maximum number of closely spaced guns firing together. For guns that are dispersed on the host aircraft,such as in wing roots and in gun pods, separate vibration gunfire test spectra are determined for each gunlocation. The vibration levels, for test purposes, are selected for the gun that produces the maximumvibration levels.
E Blast energy of gun (see table 519.5D-III).
H Effect of gun standoff distance, h (see figure 519.5D-4).
M Effect of gun location M = 0 unless a plane normal to the axis of the gun barrel and located at the muzzleof the gun does not intersect the aircraft structure, then M = -6 dB.
W Effect of weight of the equipment to be tested (use figure 519.5D-5). If the weight of the materiel isunknown, use W = 4.5 kilograms (10 lbs).
J Effect of the materiel’s location relative to air vehicle’s skin (use figures 519.5D-2 and 519.5D-6).
Bj Effect of vector distance from the gun muzzle to the materiel location (see figure 519.5D-7).
F1 Gunfiring rate where F1 = fundamental frequency from table 519.5D-II (F2 = 2F1, F3 = 3F1, F4 = 4F1)
Tj Test level in g2/Hz
Pi Test level for frequency Fi in g2/hz (where i = 1 to 4)
Ki Effect of vector distance on each vibration peak, Pi (see figure 519.5D-8).
Note: These equations are in metric units. The resultant dB values are relative to 1 g2/Hz.
Downloaded from http://www.everyspec.com on 2012-06-04T5:34:26.
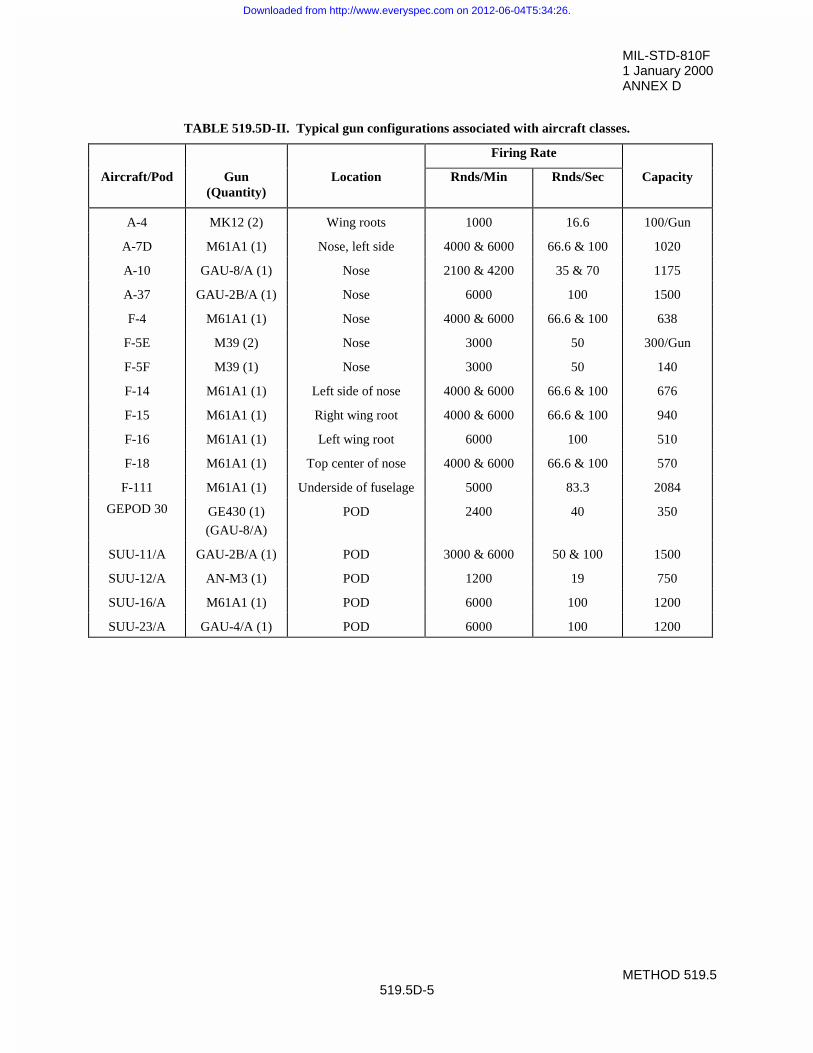
MIL-STD-810F1 January 2000ANNEX D
METHOD 519.5519.5D-5
TABLE 519.5D-II. Typical gun configurations associated with aircraft classes.
Firing Rate
Aircraft/Pod Gun(Quantity)
Location Rnds/Min Rnds/Sec Capacity
A-4 MK12 (2) Wing roots 1000 16.6 100/Gun
A-7D M61A1 (1) Nose, left side 4000 & 6000 66.6 & 100 1020
A-10 GAU-8/A (1) Nose 2100 & 4200 35 & 70 1175
A-37 GAU-2B/A (1) Nose 6000 100 1500
F-4 M61A1 (1) Nose 4000 & 6000 66.6 & 100 638
F-5E M39 (2) Nose 3000 50 300/Gun
F-5F M39 (1) Nose 3000 50 140
F-14 M61A1 (1) Left side of nose 4000 & 6000 66.6 & 100 676
F-15 M61A1 (1) Right wing root 4000 & 6000 66.6 & 100 940
F-16 M61A1 (1) Left wing root 6000 100 510
F-18 M61A1 (1) Top center of nose 4000 & 6000 66.6 & 100 570
F-111 M61A1 (1) Underside of fuselage 5000 83.3 2084
GEPOD 30 GE430 (1)
(GAU-8/A)
POD 2400 40 350
SUU-11/A GAU-2B/A (1) POD 3000 & 6000 50 & 100 1500
SUU-12/A AN-M3 (1) POD 1200 19 750
SUU-16/A M61A1 (1) POD 6000 100 1200
SUU-23/A GAU-4/A (1) POD 6000 100 1200
Downloaded from http://www.everyspec.com on 2012-06-04T5:34:26.
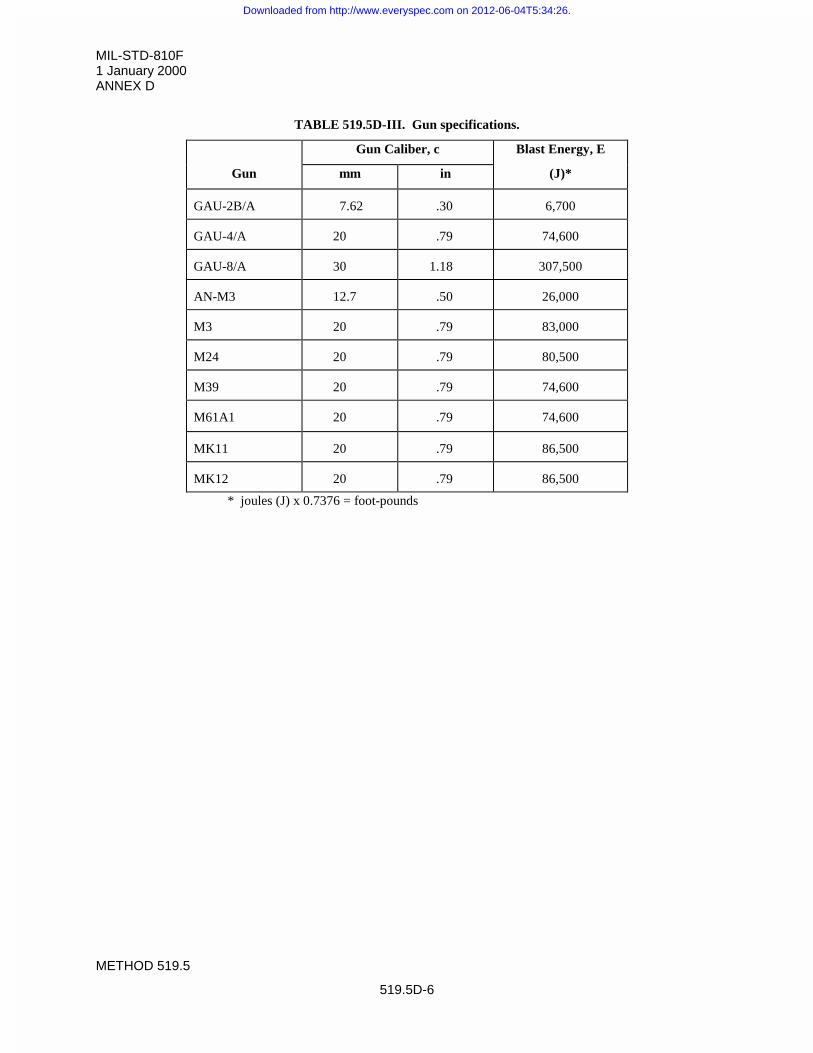
MIL-STD-810F1 January 2000ANNEX D
METHOD 519.5
519.5D-6
TABLE 519.5D-III. Gun specifications.
Gun Caliber, c Blast Energy, E
Gun mm in (J)*
GAU-2B/A 7.62 .30 6,700
GAU-4/A 20 .79 74,600
GAU-8/A 30 1.18 307,500
AN-M3 12.7 .50 26,000
M3 20 .79 83,000
M24 20 .79 80,500
M39 20 .79 74,600
M61A1 20 .79 74,600
MK11 20 .79 86,500
MK12 20 .79 86,500
* joules (J) x 0.7376 = foot-pounds
Downloaded from http://www.everyspec.com on 2012-06-04T5:34:26.
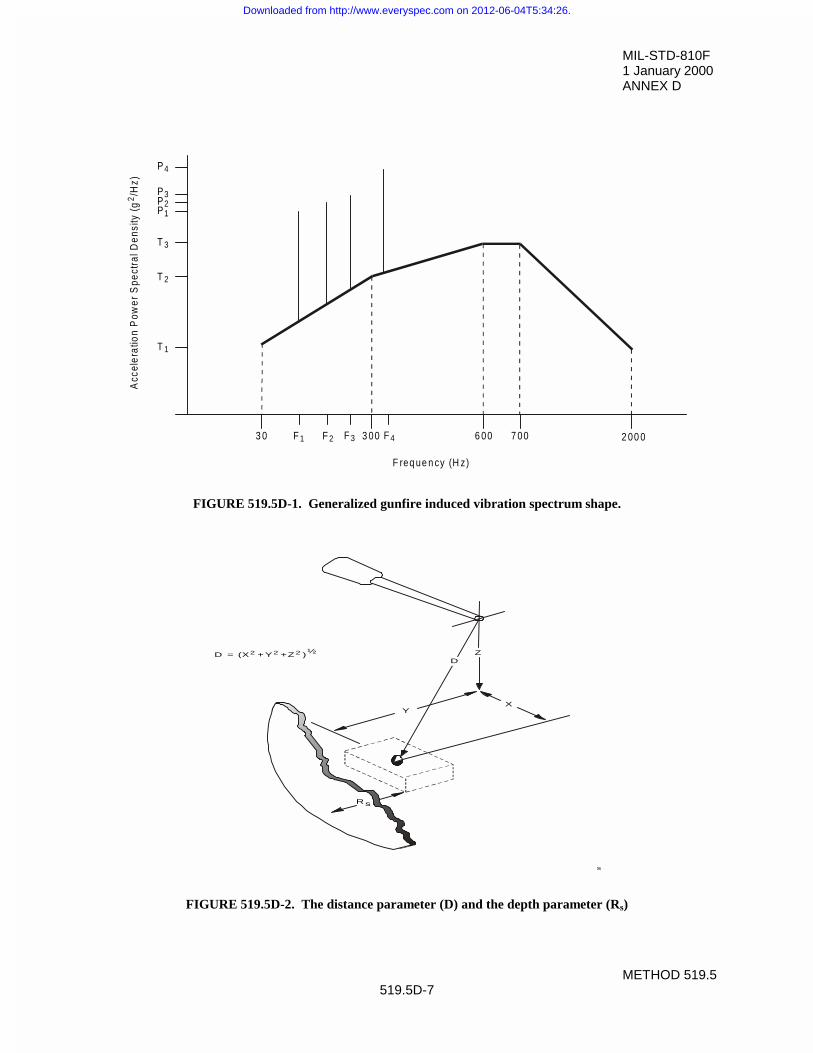
MIL-STD-810F1 January 2000ANNEX D
METHOD 519.5519.5D-7
FIGURE 519.5D-1. Generalized gunfire induced vibration spectrum shape.
FIGURE 519.5D-2. The distance parameter (D) and the depth parameter (Rs)
3 0 3 00 6 00 7 00 2 00 0F 4F 3F 2F 1
T 1
T 2
T 3
P1P2
P4
P3
Acc
eler
atio
n P
ower
Spe
ctra
l Den
sity
(g
/Hz)
2
F req ue n cy (H z)
ZD
YX
Rs
D = (X +Y +Z )2 2 2 ½
s
Downloaded from http://www.everyspec.com on 2012-06-04T5:34:26.
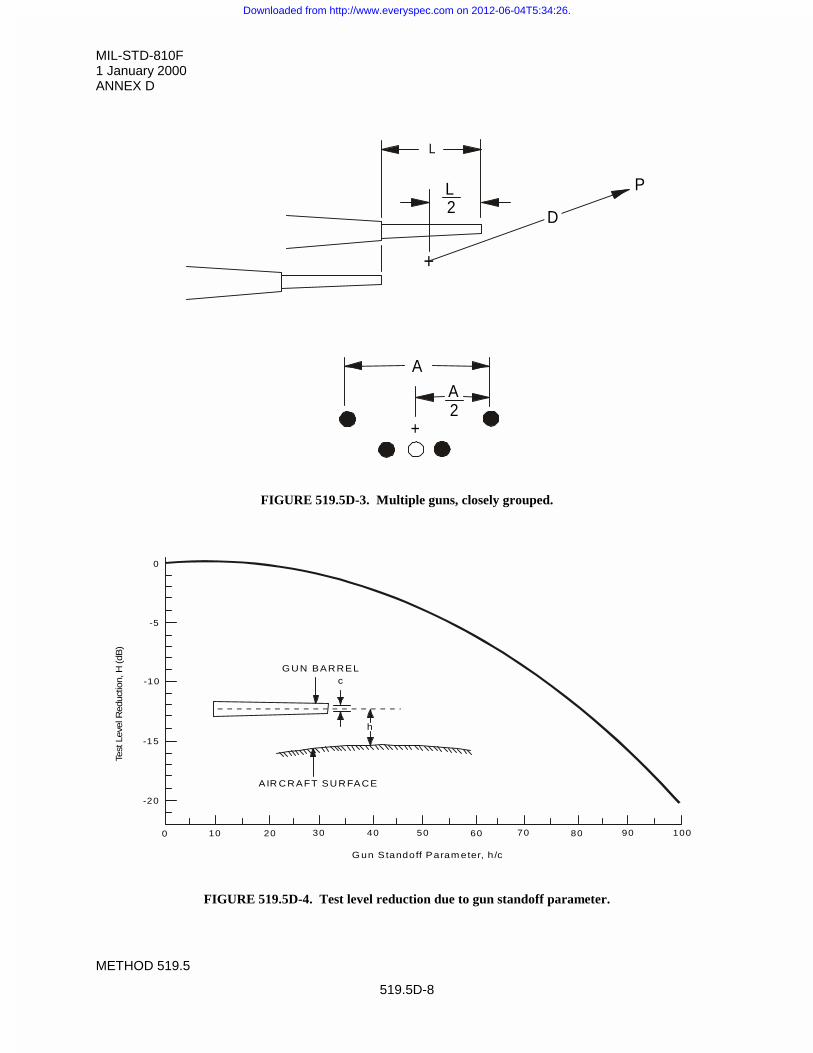
MIL-STD-810F1 January 2000ANNEX D
METHOD 519.5
519.5D-8
FIGURE 519.5D-3. Multiple guns, closely grouped.
FIGURE 519.5D-4. Test level reduction due to gun standoff parameter.
+
D
P
A
A2
L2
+
L
c
h
G UN BARREL
AIR CRAFT SURFACE
0
-5
-10
-15
-20
0 10 20 30 40 50 60 70 80 90 100
G un S tandoff Param eter, h /c
Test
Lev
el R
educ
tion,
H (dB
)
Downloaded from http://www.everyspec.com on 2012-06-04T5:34:26.
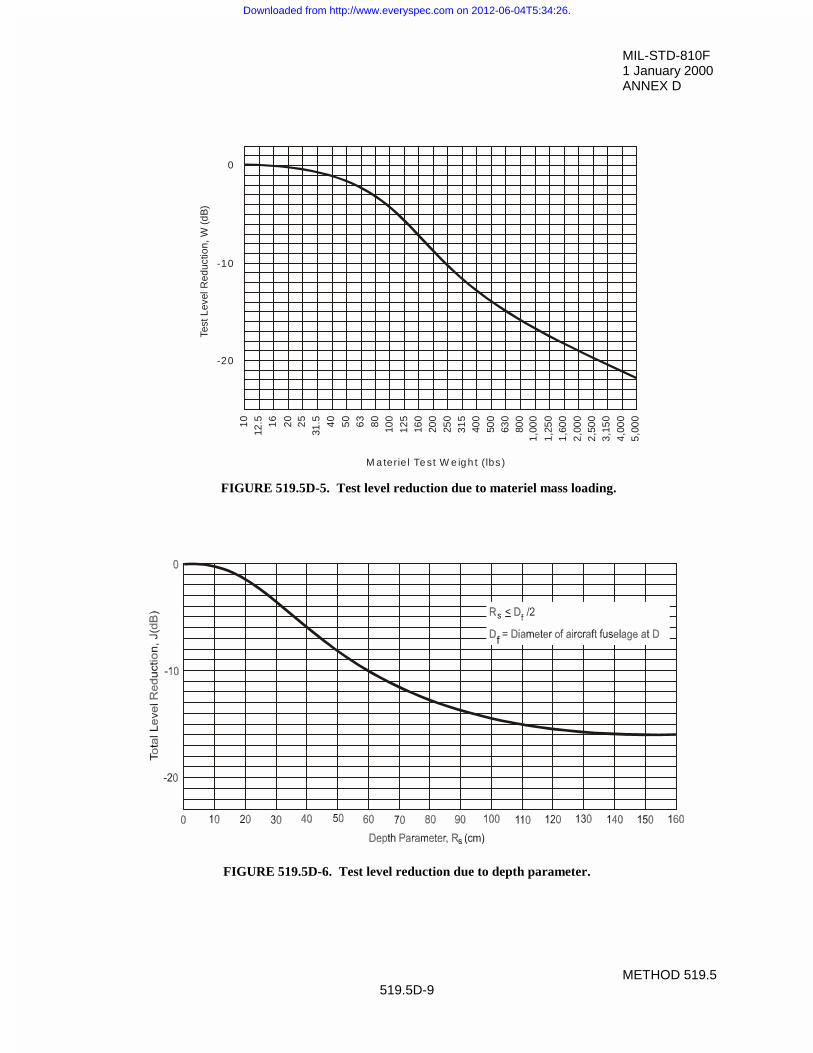
MIL-STD-810F1 January 2000ANNEX D
METHOD 519.5519.5D-9
FIGURE 519.5D-5. Test level reduction due to materiel mass loading.
FIGURE 519.5D-6. Test level reduction due to depth parameter.
0
-10
-20
10
12.5 16
20
25
31.5 40
50
63
80
100
125
160
200
250
315
400
500
630
800
1,0
00
1,2
50
1,6
00
2,0
00
2,5
00
3,1
50
4,0
00
5,0
00
M a terie l Te st W e ig h t (lbs )
Test
Lev
el R
educ
tion,
W (
dB
)
Downloaded from http://www.everyspec.com on 2012-06-04T5:34:26.

MIL-STD-810F1 January 2000ANNEX D
METHOD 519.5
519.5D-10
FIGURE 519.5D-7. Decrease in vibration level with vector distance from gun muzzle.
FIGURE 519.5D-8. Gunfire peak vibration reduction with distance.
D istan ce Ve c to r, D (c m )
K (dB
)
3 5 030 025 020 015 010 0500
0
-5
-1 0
-1 5
-2 0
-2 5
-3 0
Pea
k V
ibra
tion
redu
ctio
n, K
(dB
)
I f f 40 H z , use 40 H z cu rv e<
f = 4 00 H z
f = 3 00 H z
f = 2 40 H z
f = 2 00 H z
f = 1 60 H z
f = 1 20 H z
f = 8 0 H z
f = 4 0 H z
Downloaded from http://www.everyspec.com on 2012-06-04T5:34:26.
MIL-STD-810F1 January 2000
METHOD 520.2520.2-1
METHOD 520.2
TEMPERATURE, HUMIDITY, VIBRATION, AND ALTITUDE
NOTE: Tailoring is essential. Select methods, procedures, and parameter levels based on the tailoring processdescribed in Part One, paragraph 4, and Appendix C. Apply the general guidelines for laboratory test methodsdescribed in Part One, paragraph 5 of this standard.
1. SCOPE.
1.1 Purpose.
The purpose of this test is to help determine the combined effects of temperature, humidity, vibration, and altitude onairborne electronic and electro-mechanical materiel with regard to safety, integrity, and performance during groundand flight operations. Some portions of this test may apply to ground vehicles, as well. In such cases, references toaltitude considerations do not apply.
1.2 Application.
a. Use this method to evaluate materiel likely to be deployed in altitude areas (above ground level) wheretemperature, humidity, and vibration may combine to induce failures.
b. Use this method for engineering development, for support of operational testing, for qualification, andfor other similar purposes. This method is primarily intended for actively powered materiel operated ataltitude, i.e., aircraft, missiles, etc.
c. Use this method to provide an option for use of vibration in combination with the climatic elements, orfor use of the climatic tests in combination with each other. This is often noted throughout the text. Generally, the combined environment test simulates those synergistic environmental effects that occur forthe majority of the deployment life. Environmental stresses may be tested in combination using method520.2, or singly using methods 500.4, 501.4, 502.4, 507.4, and 514.5, appropriately.
1.3 Limitations.
a. Limit use of this method to evaluating the combined effects of altitude, temperature, humidity, andvibration.
b. Some procedures permit testing for the effects of one forcing function at a time and stressing materielitems beyond realistic limits. Doing so may reduce or eliminate synergistic or antagonistic effects ofcombined stresses, or may induce failures that would not occur under realistic conditions.
c. This method does not apply to unpowered materiel transported as cargo in an aircraft.
d. The tailored test cycle should not include short duration vibration events or those that occur infrequentlyin the test cycle. These events include firing of on-board guns, extreme aircraft motion, and shock due tohard landings. Test for these events separately using the appropriate test method.
2. TAILORING GUIDANCE.
2.1 Selecting the Temperature, Humidity, Vibration, and Altitude Method.
After examining requirements documents, apply the tailoring process in Part One of this standard to determine wherethese combined forcing functions of temperature, humidity, vibration and altitude are foreseen in the life cycle of themateriel in the real world. Use the following to aid in selecting this method and placing it in sequence with othermethods.
Downloaded from http://www.everyspec.com on 2012-06-04T5:34:26.
MIL-STD-810F1 January 2000
METHOD 520.2520.2-2
2.1.1 Effects of combined temperature/humidity/vibration/altitude environments.
Temperature, humidity, vibration, and altitude can combine synergistically to produce the following failures. Theexamples are not intended to be comprehensive:
a. Shattering of glass vials and optical materiel. (Temperature/Vibration/Altitude)
b. Binding or loosening of moving parts. (Temperature/Vibration)
c. Separation of constituents. (Temperature/Humidity/Vibration/Altitude)
d. Performance degradation in electronic components due to parameter shifts. (Temperature/Humidity)
e. Electronic optical (fogging) or mechanical failures due to rapid water or frost formation. (Temperature/Humidity)
f. Cracking of solid pellets or grains in explosives. (Temperature/Humidity/Vibration)
g. Differential contraction or expansion of dissimilar materials. (Temperature/Altitude)
h. Deformation or fracture of components. (Temperature/Vibration/Altitude)
i. Cracking of surface coatings. (Temperature/Humidity/ Vibration/Altitude)
j. Leakage of sealed compartments. (Temperature/Vibration//Altitude)
k. Failure due to inadequate heat dissipation. (Temperature/Vibration /Altitude)
2.1.2 Sequence among other methods.
a. General. See Part One, paragraph 5.5.
b. Unique to this method. Procedure I is intended to be used before final materiel designs are fixed. Ifdone separately, perform vibration prior to the remaining environments.
2.2 Selecting Procedures.
This method includes three temperature, humidity, vibration, and altitude test procedures:
a. Procedure I (Engineering Development);
b. Procedure II (Flight or Operation Support), and
c. Procedure III (Qualification).
2.2.1 Procedure selection considerations.
The choice of test procedure is governed by the in-service temperature, humidity, vibration and altitudeenvironments, and the test purpose. In general, the test purpose will drive the selection of test procedure.
2.2.2 Difference among procedures.
While all of the procedures cover the same forcing functions, they differ on the basis of the stage of development ofthe materiel being tested, test severity due to acceleration, and scope of the included test profiles.
2.2.2.1 Procedure I - Engineering Development.
Use Procedure I to help find defects in a new design while it is still in the development stage. This procedure isaccelerated and failure-oriented, such that it is more likely to uncover design defects compared to using a morebenign procedure. A combined environment test is good for this purpose since it does not require the identificationof which of the four elements of this method is most critical, and allows tailoring of the procedure accordingly. Perform single environment tests in this procedure to verify design margins. This procedure may be accelerated byeliminating the more benign conditions or by using higher stress levels than the item is likely to encounter in thefield. Duration of this test should reflect total expected operating life. This test may focus on specific environmental
Downloaded from http://www.everyspec.com on 2012-06-04T5:34:26.
MIL-STD-810F1 January 2000
METHOD 520.2520.2-3
effects as listed in paragraph 2.1.1 and ignore effects of less concern. However, using single parameters andstressing materiel items beyond realistic limits may reduce or eliminate synergistic or antagonistic effects ofcombined stresses, or may induce failures that would not occur under realistic conditions. Given these cautions, useSteps 1, 2, and 4-12 of the Test Development Schedule, paragraph 4.5.1.3.
2.2.2.2 Procedure II - Flight or Operation Support.
This procedure is performed in preparation for, during, and after flight or operational testing. Its purpose is to uselaboratory testing in lieu of flight testing to more quickly evaluate environmental problems discovered in flighttesting. This test is not accelerated; the damage accumulation in the test should be no faster than in operational or in-flight testing. Therefore, development hardware can be interchanged between laboratory and flight or operationaltesting. When unusual problems develop in flight or operational testing, the materiel can be brought into thelaboratory to help identify any environmental contribution to the observed problem. In general, a single cycle isadequate to verify problems. Test duration is sufficient to identify development hardware performance rather thantotal expected hardware life. Perform Steps 1, 2, 5, and 7-12 of the Test Development Schedule, paragraph 4.5.1.3.
2.2.2.3 Procedure III - Qualification.
The qualification test is intended to demonstrate compliance with contract requirements. Often, qualification testingis an accelerated test that emphasizes the most significant environmental stress conditions. Include in thequalification test the maximum amplitude of each stress and any unique combinations of stress types that were foundto be important in the engineering development testing of the materiel. Use a test duration that reflects total expectedhardware life. Perform all steps in the Test Development Schedule, 4.5.1.3.
2.2.3 Selecting combined environments.
Testing can be accomplished either with a single test that combines all the appropriate environmental stresses, orwith a series of separate combined tests. When the use of separate combined tests is adopted, the most commoncombined tests are vibration/temperature, temperature/altitude/humidity, and humidity/temperature withsupplemental cooling. Apply the following guidance:
2.2.3.1 Vibration/temperature.
Use the test conditions and durations recommended in method 514.5 for qualification testing in combination withtemperatures from methods 501.4 and 502.4. Values should be tailored using the information in paragraph 2.3.
2.2.3.2 Temperature/altitude/humidity.
This test is particularly useful for the conditions present in an equipment bay or cockpit. Identify the maximum andminimum temperatures during deployment at which the materiel is expected to operate. If possible, obtain thetemperatures from the analysis outlined in paragraph 2.3.5. Otherwise, use tables 520.2A-II and 520.2A-III.
a. Values in tables 520.2A-II and 520.2A-III are based on measured natural data and do not necessarilyreflect the materiel response temperature.
b. Determine the maximum altitude to be experienced by the materiel. Often the altitude (air pressure)inside a cockpit or equipment bay is different from that outside the aircraft because of cabinpressurization. If an analysis has not been performed, use the maximum flight altitude or, if unknown,use 16km (52,500 ft.).
c. Recommended durations of stress exposure on figure 520.2A-3 are based upon anticipated extreme-caseexposure durations. It is not recommended to force the test item to reach thermal stability. As wouldhappen in actual use, the mass and power load of the test item will determine how close the test item willget to the imposed temperature.
d. The humidity stress is based on reasonable levels that can be experienced in actual use. Unless analysisshows that the equipment bay or cockpit environment is significantly more or less humid, the level shownin table 520.2A-III is recommended.
Downloaded from http://www.everyspec.com on 2012-06-04T5:34:26.
MIL-STD-810F1 January 2000
METHOD 520.2520.2-4
e. Consider altitude simulation for a materiel that:
(1) is not hermetically sealed;
(2) uses pressurized cooling paths to transfer heat;
(3) has components that contain a vacuum;
(4) has voltages of sufficient potential to arc in the presence of rarefied air;
(5) requires case convective or fan cooling or for other appropriate cases. Cooling airflow is requiredfor all materiel that use supplementary airflow as a cooling medium.
2.2.3.3 Supplemental-cooling air humidity, mass flow rate, and temperature.
This test environment is used for supplemental cooling airflow that flows directly through materiel. If possible,determine the temperature, humidity, and mass flow rate from an analysis as outlined in paragraphs 2.3.5 and 2.3.6. Otherwise, the levels in table 520.2A-III, and combined as shown in paragraph 4.5.1.2, are recommended.
2.2.3.4 Electrical stress.
Unless otherwise defined, use the electrical conditions outlined in paragraph 2.3.8.
2.2.3.5 Test item operation.
Operate the test item throughout each test as directed in paragraph 4.5.1.2, except when being exposed to maximumand minimum temperatures that occur in equipment bays or the cockpit. If separate tests are conducted, turn the testitem on and off using the same schedule as if the test environments were all combined.
2.3 Determine Test Levels and Conditions.
Having selected the method (see paragraph 2.2.1), and relevant procedures (see paragraph 2.2.2, and based on thetest item's requirements documents and the tailoring process), complete the tailoring process by identifyingappropriate parameter levels and special test conditions and techniques for these procedures. Base selections on therequirements documents, the Life Cycle Environmental Profile, the Operational Environment Documentation (seePart One, figure 1-1), and information provided with this procedure.
a. Determine the functions to be performed by the materiel in combined temperature, humidity, vibration,and altitude environments. Next, determine the parameter levels of the micro-environments in which themateriel is designed to be employed, such as temperature, humidity, vibration, altitude, cooling airflow,electrical stresses, rates of change, and stress cycles.
b. Use paragraph 4.5.1.3, referenced throughout this section, to develop a test schedule.
2.3.1 Test cycle formulation.
A test cycle is defined as a unit of time where several mission profiles are simulated under different climaticconditions. In general, a test cycle has three separate temperate/humidity segments: cold and dry, warm and moist,and hot and dry. Within each segment of the test cycle, several different mission profiles may be simulated. Amission profile is defined as a performance-environmental condition-time history of a platform. For example, afighter aircraft may predominantly fly three different missions: air superiority, ground support, and interdiction. Therefore, this aircraft has three mission profiles. Each mission profile is divided into flight phases, such as takeoff,cruise, combat, low-level penetration, etc. (figures 520.2A-1 and -2). During a test cycle, appropriately varytemperature, vibration, humidity, altitude, and cooling airflow. A ground vehicle may similarly have missions, suchas fire support/evade or advance to contact. Test cycle formulation is similar to that for aircraft, but without altitude.
Downloaded from http://www.everyspec.com on 2012-06-04T5:34:26.
MIL-STD-810F1 January 2000
METHOD 520.2520.2-5
2.3.2 Mission profile selection.
Select the mission profiles to be used (see figure 520.2A-1). An individual platform is designed to operate within aset of specified operating mission envelopes (Mach number/altitude regime) and profiles (see figure 520.2A-2). Forexample, an aircraft can fly many different missions such as training, air superiority, interdiction, ground support,etc. In addition, aircraft are flown under specialized conditions that simulate a high-threat combat environment. Often, high-threat combat will generate more extreme environments.
a. Routine deployment. Usually, not all the missions need to be included in the test cycle. Identify two orthree of the most highly used or most severe mission profiles that, as a group, reasonably approximate theaggregate effect of all the missions (including low threat combat conditions). This will adequatelysimulate the routine deployment life. To select the mission profiles to be used, recommend the followingapproach.
(1) Identify all platform missions and the percentage of operating life appropriate for each. Obtain thisinformation from the operational commands or the flight manual used by aircraft crews. For systemsunder development, use the expected design envelopes, the design mission profiles, and the designuse rate of each mission when actual flight data are not available.
(2) Determine the missions that comprise a majority (if possible, 80 percent of total flown) of the totalroutine, daily mission utilization. To do this, examine the projected utilization rates for all missionprofiles and rank them in order from highest to lowest. Compile the majority use rates and use themin conjunction with the mission profiles as the basis for combined environment testing. Missionswith similar functions and flight characteristics can be lumped together to minimize the number ofprofiles to be generated. Table 520.2-I shows the distribution of missions using fighter aircraft as anexample.
b. High threat deployment. In order to simulate the high-threat environment, separately identify missionsflown under the wartime skill exercise. Obtain the environmental data from the operational command orprovided by the procuring agency. Once data have been obtained, construct two separate test cyclesaccording to paragraph 2.3.1. Develop one test cycle using the mission profiles in paragraph 2.3.2a tosimulate routine use, and develop another test cycle using wartime skill mission profiles to simulateusage under combat or combat-training conditions. Alternately, this might represent normal versussevere conditions for other platforms. Obtain the altitude and Mach number-versus-time values for eachmission profile selected, as shown on figure 520.2A-2. Use these parameters of the mission profile tocalculate the environmental stresses. Figures 520.2A-4 and -5 are included to aid in calculations.
2.3.3 Environmental stresses.
a. Determine environmental stresses including vibration, temperature, supplemental cooling, humidity,altitude, and electrical stresses.
b. Determine test levels for each stress from mission profile information in the manner described inparagraphs 2.3.4 through 2.3.8. Other information, such as engine rpm or data on the platform's systemenvironmental control system (ECS) may be needed.
Table 520.2-I gives an example for using mission profiles to develop a test cycle. Since the first threemissions, as a group, total 80% of the utilization rate, select these three mission profiles for combinedenvironment testing. If any of the other missions include extreme or sustained environmental conditionsnot encountered in the first three missions, also select those missions containing these extreme orsustained conditions and which add the most diversity to the test cycle. If the first mission selected isutilized twice as much as the other two missions, run the first mission twice as much per cycle.
Downloaded from http://www.everyspec.com on 2012-06-04T5:34:26.
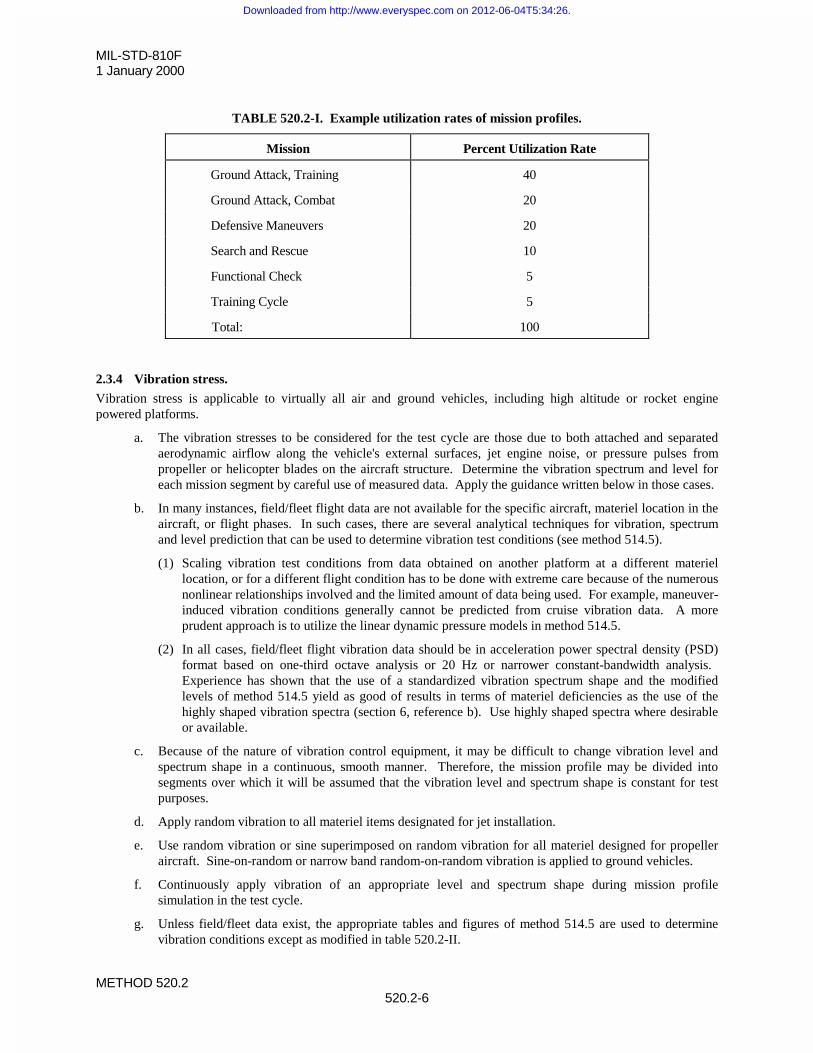
MIL-STD-810F1 January 2000
METHOD 520.2520.2-6
TABLE 520.2-I. Example utilization rates of mission profiles.
Mission Percent Utilization Rate
Ground Attack, Training 40
Ground Attack, Combat 20
Defensive Maneuvers 20
Search and Rescue 10
Functional Check 5
Training Cycle 5
Total: 100
2.3.4 Vibration stress.
Vibration stress is applicable to virtually all air and ground vehicles, including high altitude or rocket enginepowered platforms.
a. The vibration stresses to be considered for the test cycle are those due to both attached and separatedaerodynamic airflow along the vehicle's external surfaces, jet engine noise, or pressure pulses frompropeller or helicopter blades on the aircraft structure. Determine the vibration spectrum and level foreach mission segment by careful use of measured data. Apply the guidance written below in those cases.
b. In many instances, field/fleet flight data are not available for the specific aircraft, materiel location in theaircraft, or flight phases. In such cases, there are several analytical techniques for vibration, spectrumand level prediction that can be used to determine vibration test conditions (see method 514.5).
(1) Scaling vibration test conditions from data obtained on another platform at a different materiellocation, or for a different flight condition has to be done with extreme care because of the numerousnonlinear relationships involved and the limited amount of data being used. For example, maneuver-induced vibration conditions generally cannot be predicted from cruise vibration data. A moreprudent approach is to utilize the linear dynamic pressure models in method 514.5.
(2) In all cases, field/fleet flight vibration data should be in acceleration power spectral density (PSD)format based on one-third octave analysis or 20 Hz or narrower constant-bandwidth analysis. Experience has shown that the use of a standardized vibration spectrum shape and the modifiedlevels of method 514.5 yield as good of results in terms of materiel deficiencies as the use of thehighly shaped vibration spectra (section 6, reference b). Use highly shaped spectra where desirableor available.
c. Because of the nature of vibration control equipment, it may be difficult to change vibration level andspectrum shape in a continuous, smooth manner. Therefore, the mission profile may be divided intosegments over which it will be assumed that the vibration level and spectrum shape is constant for testpurposes.
d. Apply random vibration to all materiel items designated for jet installation.
e. Use random vibration or sine superimposed on random vibration for all materiel designed for propelleraircraft. Sine-on-random or narrow band random-on-random vibration is applied to ground vehicles.
f. Continuously apply vibration of an appropriate level and spectrum shape during mission profilesimulation in the test cycle.
g. Unless field/fleet data exist, the appropriate tables and figures of method 514.5 are used to determinevibration conditions except as modified in table 520.2-II.
Downloaded from http://www.everyspec.com on 2012-06-04T5:34:26.
MIL-STD-810F1 January 2000
METHOD 520.2520.2-7
h. Since there are few synergistic vibration/altitude or vibration/humidity effects, vibration may be appliedcombined with temperature as part of vibration testing (method 514.5), with temperature, altitude, andhumidity environments combined separately.
i. Do not include short duration vibration or shock events and those that occur infrequently in the test cycle.These events include firing of on-board guns, vehicle barrier traversing, and shock due to hard landings. Test for these events separately using the appropriate test method.
TABLE 520.2 - II. Suggested random vibration test criteria for jet aircraft vibration exposure.
See method 514.5, table 514.5C-III. Figures for b are from metric dimensions.
b = 2.70 x 10⁻⁸ for cockpit panel materiel and materiel attached to structure in compartments adjacent to externalsurfaces that are smooth and free from discontinuities
b = 6.11 x 10⁻⁵ for materiel attached to structure in compartments adjacent to or immediately aft of external surfaceshaving discontinuities (cavities, chines, blade antennas, speed brakes, etc.) and materiel in wings, pylons, stabilizers,and fuselage aft of training edge wing root.
For Mach number correction, see method 514.5, table 514.5C-III.
For propeller aircraft and helicopters, use appropriate tables in method 514.5.
j. For those segments with similar vibration spectrum shape, use the following analysis to reduce thenumber of vibration test levels. The discussion is in terms of the suggested spectrum shapes for jet,rotary wing, or propeller aircraft of method 514.5.
(1) Determine the vibration level, Wo (g2/Hz), for each mission segment using the altitude and Mach
number plots for each mission. (Note: For test purposes, the larger Wo due to aerodynamic forcesor Wo due to jet engine noise, etc., is utilized at any point in time in the mission). Identify themaximum Wo value that occurs in each mission.
(2) Consider all segments of the mission that have Wo values within three dB of maximum, as having aconstant Wo value of WoMAX. Consider all segments of the mission that have values between
dB3WoMax � and dB6WoMax
� as having a constant Wo value of oMaxW -4.5dB. This process
of identifying three-dB bands of dynamic vibration values, over which Wo is considered to be aconstant and whose value is determined by using the dynamic vibration value of the band's midpoint,is continued until the calculated Wo value is less than 0.001g2/Hz. For test purposes, segments of themission with calculated values of Wo less than 0.001g2/Hz can be set equal to 0.001. Each segmenthas a respective time in mission associated with it which is added together creating a T(MAX), T(-4.5), etc. Vibration is then applied for their respective times during the test. A single vibration levelmay be created using the test acceleration formula of method 514.5, but the synergistic effects incombination with temperature may be misapplied.
2.3.5 Thermal stress.
The thermal stresses that materiel experiences during a mission is dependent upon the ambient conditions in the keyequipment compartment or bay (where appropriate), flight conditions, power requirements, and the performance ofsupplemental cooling to the materiel (where appropriate).
a. Use the ambient outside air conditions shown in table 520.2A-I for the hot, warm-moist, and cold dayenvironments. The hot and cold ambient environments of table 520.2A-I are based on the 20 percentworldwide climatic extreme envelopes from MIL-HDBK-310. The warm moist environment is based onthe tropical environment shown in MIL-HDBK-310. These temperature values are to be used as theambient conditions for thermodynamic analyses for the development of the mission profile testconditions. The ground soak temperatures in each mission are not necessarily related to measured dataand are generally not synergistic and used for this test. The values shown in table 520.2A-II are extreme
Downloaded from http://www.everyspec.com on 2012-06-04T5:34:26.
MIL-STD-810F1 January 2000
METHOD 520.2520.2-8
conditions that have been used in previous programs to accelerate stresses and reduce time betweentransitions from one mission to another. These values are also suitable for use in the qualification testwhere no other data are present.
b. The specific environmental test conditions for any test item are dependent on the type of cooling for thecompartment in which the materiel is to be located (air-conditioned, ram-air cooled, convective cooled,etc.). Often, avionic and vetronic materiel systems consist of more than one black box in differentenvironments (e.g., when boxes are in different aircraft compartments). For the common case of a twoblack box system where one box is cooled by supplemental air or fluid and the other box is ambientlycooled, both boxes can be tested in one chamber as long as appropriate ambient temperature and altitudesimulation for each box can be achieved. The thermal simulation would be realistic since the ambient-cooled box would respond to the ambient temperature simulation while the box that requiredsupplemental cooling would be primarily responsive to the supplemental cooling air or fluid. Ensure thetest chamber is sized for the appropriate thermal load.
c. For this test, the following type of thermodynamic analysis is adequate. Use a more detailed analysis ifdesired.
(1) Analyze the mission profile time history of altitude and Mach number from paragraph 2.3.2 toidentify each break point at which the slope of either the altitude or Mach number plots change (seefigure 520.2A-2).
(2) Perform a thermodynamic analysis at each break point using steady-state thermodynamicrelationships.
(3) Between each break point, perform linear interpolation on each stress to construct a continuousprofile for each environmental stress.
(4) At each such break point, determine the modified system thermal stress conditions for a test inaccordance with paragraph 2.3.5.1.
2.3.5.1 Bay conditions.
a. Ram-cooled compartments or externally mounted system. Use this section to determine the baytemperature for an avionics or system in a compartment that is ram-cooled or otherwise ambientlycooled. Determine the thermal stress in a ram-air-cooled compartment from the following relationship.
Teff = Tamb[1 + 0.18M2]where
Tamb = ambient air temperature (qK) at altitude being flown (table 520.2A-I)
Teff = Temperature as modified by velocity air cooling effects and used in the test cycle.
M = Mach number being flown
b. Environmental Control System (ECS) conditioned supplemental-air-cooled bay. Use this section todetermine the bay temperature for an avionics or vetronics system located in a bay that receives itscooling from the platform ECS. Determine the mass flow rate and temperature of supplemental air foreach break point in the mission profile. Model the onboard ECS in terms of its primary components suchas pressure regulators, heat exchanger, turbo machines, water separator, etc. If the heat load from thesesystems is significant, include the mass flow rate being injected into the bay and the location of othersystems in the calculation. Calculate the bay temperature stress using the following simplifiedthermodynamic assumptions.
(1) Assume that steady-state thermodynamic relationships are valid.
(2) Assume constant but nominal or typical efficiency constants that can be achieved from good designpractice for turbo machinery and heat exchanger.
Downloaded from http://www.everyspec.com on 2012-06-04T5:34:26.
MIL-STD-810F1 January 2000
METHOD 520.2520.2-9
(3) Neglect secondary effects in components of the ICS (i.e., pressures losses in heat exchanger,temperature losses in ducts).
c. Materiel supplemental cooling thermal stress. Use this section to determine the effect for test items thatrequire supplemental cooling from the platform. This cooling may be air or liquid cooling into themateriel or through a cold plate. The approach to this is identical to the thermal effects produced fromthe materiel bay conditions with one addition: continue the thermodynamic analysis to determine thetemperature and mass flow being injected directly into the materiel.
2.3.6 Humidity stress.
The stress that a system experiences due to humidity is dependent upon the ambient humidity conditions and theperformance of the water separator of the environmental control system. (Some platforms do not cool materiel withECS air, thus the materiel sees only ambient humidity conditions.) For this test, whenever the cold day environmentis being simulated, humidity will be uncontrolled, but less than or equal to the dew point temperature in table520.2A-Ib. For the hot environment, dew point temperatures will be less or equal to values in table 520.2A-Ia. Forthe warm moist day, dew point temperatures will be greater than or equal to the values in table 520.2A-Ic up to 10km altitude. Above 10 km, the dew point temperature is less than or equal to the values in table 520.2A-Ib. If theplatform has an ECS, the design specifications for the warm moist day apply. When the efficiency of the ECS isunknown, use the approximation technique put forth above.
NOTE: The formation of frost or free water on the test items during combined environment testing can be a normalcondition. It will normally occur whenever the temperature of the test item is cooler than the dew point temperatureof the air being delivered by the ECS or from ram airflow. This is normal and a realistic condition. During somemission profiles, free water may refreeze, causing binding of moving parts, degradation of seals, and aggravatingsurface cracks. This may be particularly apparent in vehicle mounted hardware. The use of sprayed water on a coldpart to simulate severe frost or ice accumulation is encouraged, where appropriate.
2.3.7 Altitude stress.
Use altitude simulation when there is reason to believe system performance may be affected by variations in airpressure. Examples of such situations are: hermetically sealed units that use pressurized cooling parts to maintainsufficient heat transfer; non-hermetically sealed units that require connective cooling; vacuum components where theseal is maintained by air pressure, and units where a change in air pressure may cause arcing or change of componentvalues . When altitude effects are to be tested, apply the altitude stress or reduced atmospheric pressure variationsaccording to the mission profiles selected for test. The rate-of-change of pressure should reflect the climb or descentrate of the aircraft while performing the various flight mission phases. Use a maximum pressure that is equivalent tothat of ground elevation at the test site.
2.3.8 Electrical stress.
Electrical stresses are expected deviations of the materiel's electric supply parameters from their nominal values atthe materiel terminals. The test procedure must simulate to the required extent, all electrical stresses occurringduring normal operation in service (mission profile) which contribute synergistically to the environments. Inaddition, appropriately demonstrate operation of the test materiel's functions at each test condition. It is not thepurpose of this test to simulate extremes specified for special situations or to take the place of special electrical stresstests. Simulate special conditions such as emergency operation of certain aircraft materiel within theelectrical/electronic system only on request. Depending upon the requirements and the availability of data, thesimulation may cover the range from the exact reproduction of the specific electric supply conditions within a specialaircraft for a specific mission profile, down to a standardized simplified profile for generalized applications. Consider the following conditions and effects to determine whether they affect the operation and reliability of themateriel to be tested.
a. AC system normal operation stresses.
b. Normal ON/OFF cycling of materiel operation.
c. DC system normal operation stresses.
Downloaded from http://www.everyspec.com on 2012-06-04T5:34:26.
MIL-STD-810F1 January 2000
METHOD 520.2520.2-10
d. Electrical stresses induced by mission-related transients within the electrical system.
2.3.8.1 AC & DC system normal operation stresses.
Voltage variations are quasi-steady changes in voltage from test cycle to test cycle. A suggested input voltageschedule would be to maintain the input voltage at 110 percent of nominal for the first test cycle, at the nominal forthe second test cycle, and at 90 percent for the third test cycle. This cycling procedure would be repeatedcontinuously throughout the test. However, if a failure is suspected, interrupt this sequence for repetition of inputvoltage conditions.
2.3.8.2 Normal ON/OFF cycling of materiel operation.
Turn the materiel on and off in accordance with materiel operating procedures outlined in appropriate technicalmanuals, to simulate normal use.
2.4 Test Item Configuration.
See Part One, paragraph 5.8.
3. INFORMATION REQUIRED.
3.1 Pretest.
The following information is required to perform a temperature, humidity, vibration, altitude test adequately.
a. General. Information in Part One, paragraphs 5.7, 5.9, 5.11 and 5.12, and Part One, Appendix A, Tasks405 and 406 of this standard.
b. Specific to this method.
(1) Purpose of the test, e.g., engineering development, flight or operation support, qualification, etc.
(2) Combination of temperature, humidity, vibration and altitude to be applied simultaneously.
3.2 During Test.
a. General. See Part One, paragraphs 5.10 and 5.12, and information in Part One, Appendix A, Tasks 405and 406 of this standard.
b. Specific to this method.
(1) Complete record of temperature, humidity, vibration and altitude levels of input with sequence.
(2) Complete record of materiel function correlated with input sequence.
3.3 Post-test.
The following post-test information is required.
a. General. Information listed in Part One, paragraph 5.13, and in Part One, Appendix A, Tasks 405 and406 of this standard.
b. Specific to this method. Any anomalies in the input sequence with assessment of the efforts on the testresults.
Downloaded from http://www.everyspec.com on 2012-06-04T5:34:26.
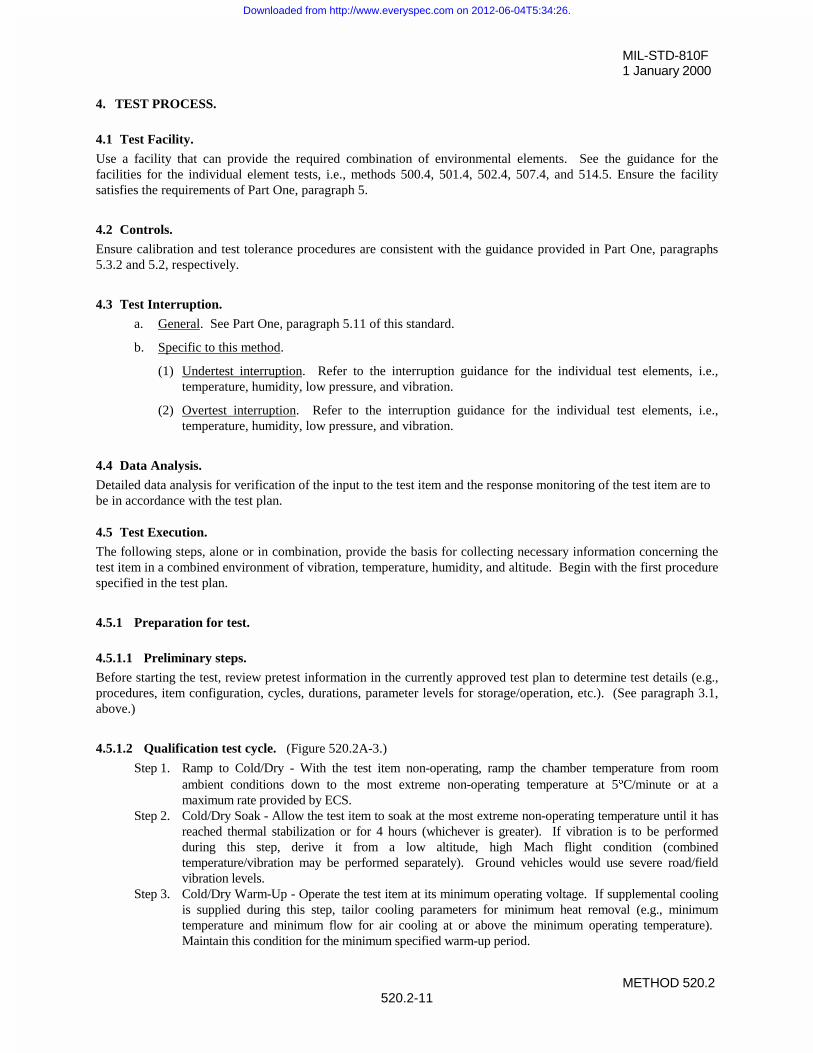
MIL-STD-810F1 January 2000
METHOD 520.2520.2-11
4. TEST PROCESS.
4.1 Test Facility.
Use a facility that can provide the required combination of environmental elements. See the guidance for thefacilities for the individual element tests, i.e., methods 500.4, 501.4, 502.4, 507.4, and 514.5. Ensure the facilitysatisfies the requirements of Part One, paragraph 5.
4.2 Controls.
Ensure calibration and test tolerance procedures are consistent with the guidance provided in Part One, paragraphs5.3.2 and 5.2, respectively.
4.3 Test Interruption.
a. General. See Part One, paragraph 5.11 of this standard.
b. Specific to this method.
(1) Undertest interruption. Refer to the interruption guidance for the individual test elements, i.e.,temperature, humidity, low pressure, and vibration.
(2) Overtest interruption. Refer to the interruption guidance for the individual test elements, i.e.,temperature, humidity, low pressure, and vibration.
4.4 Data Analysis.
Detailed data analysis for verification of the input to the test item and the response monitoring of the test item are tobe in accordance with the test plan.
4.5 Test Execution.
The following steps, alone or in combination, provide the basis for collecting necessary information concerning thetest item in a combined environment of vibration, temperature, humidity, and altitude. Begin with the first procedurespecified in the test plan.
4.5.1 Preparation for test.
4.5.1.1 Preliminary steps.
Before starting the test, review pretest information in the currently approved test plan to determine test details (e.g.,procedures, item configuration, cycles, durations, parameter levels for storage/operation, etc.). (See paragraph 3.1,above.)
4.5.1.2 Qualification test cycle. (Figure 520.2A-3.)
Step 1. Ramp to Cold/Dry - With the test item non-operating, ramp the chamber temperature from roomambient conditions down to the most extreme non-operating temperature at 5qC/minute or at amaximum rate provided by ECS.
Step 2. Cold/Dry Soak - Allow the test item to soak at the most extreme non-operating temperature until it hasreached thermal stabilization or for 4 hours (whichever is greater). If vibration is to be performedduring this step, derive it from a low altitude, high Mach flight condition (combinedtemperature/vibration may be performed separately). Ground vehicles would use severe road/fieldvibration levels.
Step 3. Cold/Dry Warm-Up - Operate the test item at its minimum operating voltage. If supplemental coolingis supplied during this step, tailor cooling parameters for minimum heat removal (e.g., minimumtemperature and minimum flow for air cooling at or above the minimum operating temperature). Maintain this condition for the minimum specified warm-up period.
Downloaded from http://www.everyspec.com on 2012-06-04T5:34:26.

MIL-STD-810F1 January 2000
METHOD 520.2520.2-12
Step 4. Cold/Dry Performance Check - Do a performance check immediately following Step 3 to verify the testitem operates as required.
Step 5. Ramp to Cold/Dry Altitude - With the test item operating, ramp the chamber from the site pressure tothe maximum cruise altitude (use the formulas on figure 520.2A-5 to derive pressure from altitude). Perform the pressure ramp at the maximum facility rate, not to exceed the predicted platform rate. Notapplicable to ground vehicles.
Step 6. Cold/Dry Altitude - Maintain the maximum cruise altitude for 30 minutes. If vibration is to beperformed during this step, derive it from a high altitude, high Mach flight condition. Not applicable toground vehicles.
Step 7. Ramp to Warm/Moist - Ramp the chamber conditions from Step 6 and uncontrolled humidity to 32qC(90qF) and site pressure and 95% relative humidity (RH). Perform this temperature/humidity/altituderamp at the maximum facility rate, not to exceed the predicted platform rate. This step simulates aquick descent from a high altitude and allows an altitude chamber to simulate a high altitude descent toa hot/humid day landing site. Not applicable to ground vehicles.
Step 8. Warm/Moist Dwell - Maintain 32qC, site pressure and 95% relative humidity for 30 minutes. Ifvibration is to be performed during this step, derive it from a low altitude, high Mach flight condition. Ground vehicles use an aggregate vibration schedule based on various road conditions.
Step 9. Ramp to Hot/Dry - Ramp the chamber temperature to the maximum operating temperature and thechamber humidity to less than 30% RH. Operate the test item at its maximum operating voltage. At thesame time, supply supplemental cooling at the worst case thermal conditions (e.g., maximumtemperature and minimum flow for air-cooling). Perform this temperature/humidity ramp at themaximum facility rate, not to exceed the predicted platform rate.
Step 10. Hot/Dry Soak - Allow the test item to soak at the maximum operating temperature until it has reachedthermal stabilization or 2 hours (whichever is greater). If vibration is to be performed during this step,derive the vibration levels from the maximum of take-off/ascent or low altitude/high Mach (ifappropriate). Ground vehicles use aggregate off-road vibration levels.
Step 11. Hot/Dry Performance Check - Operate the test item and record data for comparison with pretest data.Step 12. Ramp to Hot/Dry Altitude - Ramp the chamber from site pressure to the maximum cruise altitude (use
the formulas on figure 520.2A-5 to derive pressure from altitude). Perform this pressure ramp at themaximum facility rate, not to exceed the predicted platform rate. Not applicable to ground vehicles.
Step 13. Hot/Dry Altitude - With the test item operating, maintain the maximum operating temperature andmaximum cruise altitude until the test item has reached thermal stabilization or 4 hours (whichever isgreater). If vibration is to be performed during this step, derive it from a high (or ultra-high ifapplicable) altitude, high Mach flight condition. Not applicable to ground vehicles.
Step 14. Hot/Dry Altitude Performance Check - Do a performance check to verify that the test item operates asrequired.
Step 15. Ramp to Room Ambient - Ramp the chamber from the maximum operating temperature and maximumcruise altitude to room ambient temperature, site pressure and uncontrolled humidity. Perform thistemperature/pressure ramp at the maximum facility rate, not to exceed the predicted platform rate. Return the test item to a non-operating condition and discontinue the supplemental cooling at theconclusion of the ramp.
Step 16. Repeat the cycle (Steps 1-15) as necessary to meet the test plan duration requirements or 10 cycles,whichever is greater.
4.5.1.3 Test development schedule.
Utilized for each Procedure.
Step 1. Identify the platform missions and test materiel location.Step 2. Identify the mission profiles.Step 3. Select the top 80% of potential mission profile. (Table 520.2-I) (Procedure III only.)Step 4. Select most severe potential mission profile. (Exception: short term and transient events, e.g., gunfire,
crash shock, etc.) (Procedures I and III).Step 5. Identify the vibration levels by mission profile.
Downloaded from http://www.everyspec.com on 2012-06-04T5:34:26.
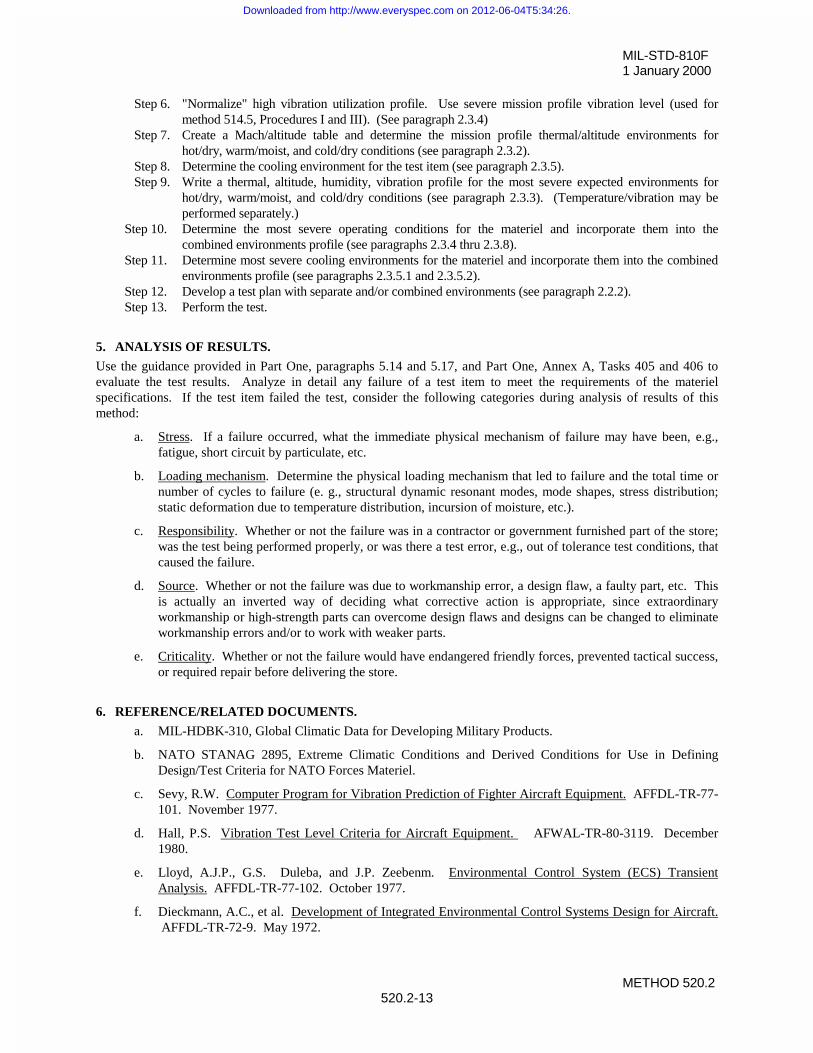
MIL-STD-810F1 January 2000
METHOD 520.2520.2-13
Step 6. "Normalize" high vibration utilization profile. Use severe mission profile vibration level (used formethod 514.5, Procedures I and III). (See paragraph 2.3.4)
Step 7. Create a Mach/altitude table and determine the mission profile thermal/altitude environments forhot/dry, warm/moist, and cold/dry conditions (see paragraph 2.3.2).
Step 8. Determine the cooling environment for the test item (see paragraph 2.3.5).Step 9. Write a thermal, altitude, humidity, vibration profile for the most severe expected environments for
hot/dry, warm/moist, and cold/dry conditions (see paragraph 2.3.3). (Temperature/vibration may beperformed separately.)
Step 10. Determine the most severe operating conditions for the materiel and incorporate them into thecombined environments profile (see paragraphs 2.3.4 thru 2.3.8).
Step 11. Determine most severe cooling environments for the materiel and incorporate them into the combinedenvironments profile (see paragraphs 2.3.5.1 and 2.3.5.2).
Step 12. Develop a test plan with separate and/or combined environments (see paragraph 2.2.2).Step 13. Perform the test.
5. ANALYSIS OF RESULTS.
Use the guidance provided in Part One, paragraphs 5.14 and 5.17, and Part One, Annex A, Tasks 405 and 406 toevaluate the test results. Analyze in detail any failure of a test item to meet the requirements of the materielspecifications. If the test item failed the test, consider the following categories during analysis of results of thismethod:
a. Stress. If a failure occurred, what the immediate physical mechanism of failure may have been, e.g.,fatigue, short circuit by particulate, etc.
b. Loading mechanism. Determine the physical loading mechanism that led to failure and the total time ornumber of cycles to failure (e. g., structural dynamic resonant modes, mode shapes, stress distribution;static deformation due to temperature distribution, incursion of moisture, etc.).
c. Responsibility. Whether or not the failure was in a contractor or government furnished part of the store;was the test being performed properly, or was there a test error, e.g., out of tolerance test conditions, thatcaused the failure.
d. Source. Whether or not the failure was due to workmanship error, a design flaw, a faulty part, etc. Thisis actually an inverted way of deciding what corrective action is appropriate, since extraordinaryworkmanship or high-strength parts can overcome design flaws and designs can be changed to eliminateworkmanship errors and/or to work with weaker parts.
e. Criticality. Whether or not the failure would have endangered friendly forces, prevented tactical success,or required repair before delivering the store.
6. REFERENCE/RELATED DOCUMENTS.
a. MIL-HDBK-310, Global Climatic Data for Developing Military Products.
b. NATO STANAG 2895, Extreme Climatic Conditions and Derived Conditions for Use in DefiningDesign/Test Criteria for NATO Forces Materiel.
c. Sevy, R.W. Computer Program for Vibration Prediction of Fighter Aircraft Equipment. AFFDL-TR-77-101. November 1977.
d. Hall, P.S. Vibration Test Level Criteria for Aircraft Equipment. AFWAL-TR-80-3119. December1980.
e. Lloyd, A.J.P., G.S. Duleba, and J.P. Zeebenm. Environmental Control System (ECS) TransientAnalysis. AFFDL-TR-77-102. October 1977.
f. Dieckmann, A.C., et al. Development of Integrated Environmental Control Systems Design for Aircraft. AFFDL-TR-72-9. May 1972.
Downloaded from http://www.everyspec.com on 2012-06-04T5:34:26.

MIL-STD-810F1 January 2000
METHOD 520.2520.2-14
g. Quartz, I., A.H. Samuels, and A.J. Curtis. A Study of the Cost Benefits of Mission Profile Testing. AFWAL-TR-81-3028. 1981.
h. Burkhard, A.H., et al. CERT Evaluation Program Final Report. AFWAL-TR-82-3085.
i. F-15 AFDT&E High-Temperature Desert Test and Climatic Laboratory Evaluation. AFFTC-TR-75-19. October 1975. DTIC Number AD B011345L.
Downloaded from http://www.everyspec.com on 2012-06-04T5:34:26.
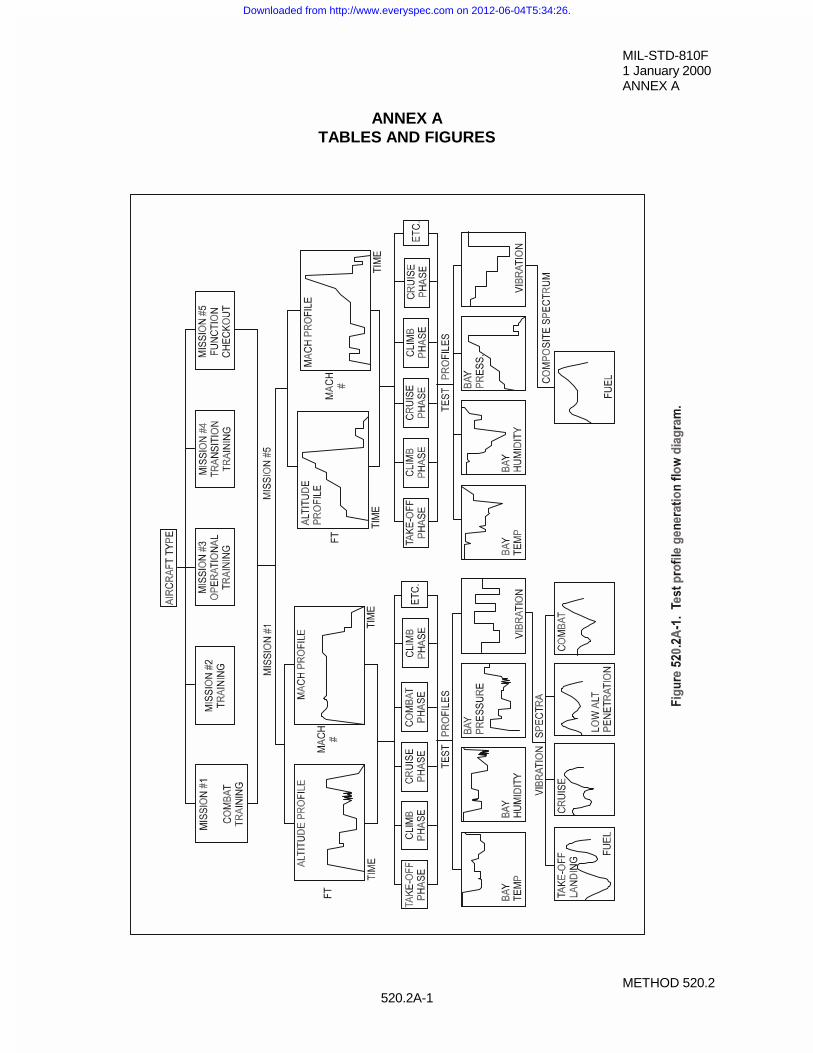
MIL-STD-810F1 January 2000ANNEX A
METHOD 520.2520.2A-1
ANNEX ATABLES AND FIGURES
Downloaded from http://www.everyspec.com on 2012-06-04T5:34:26.
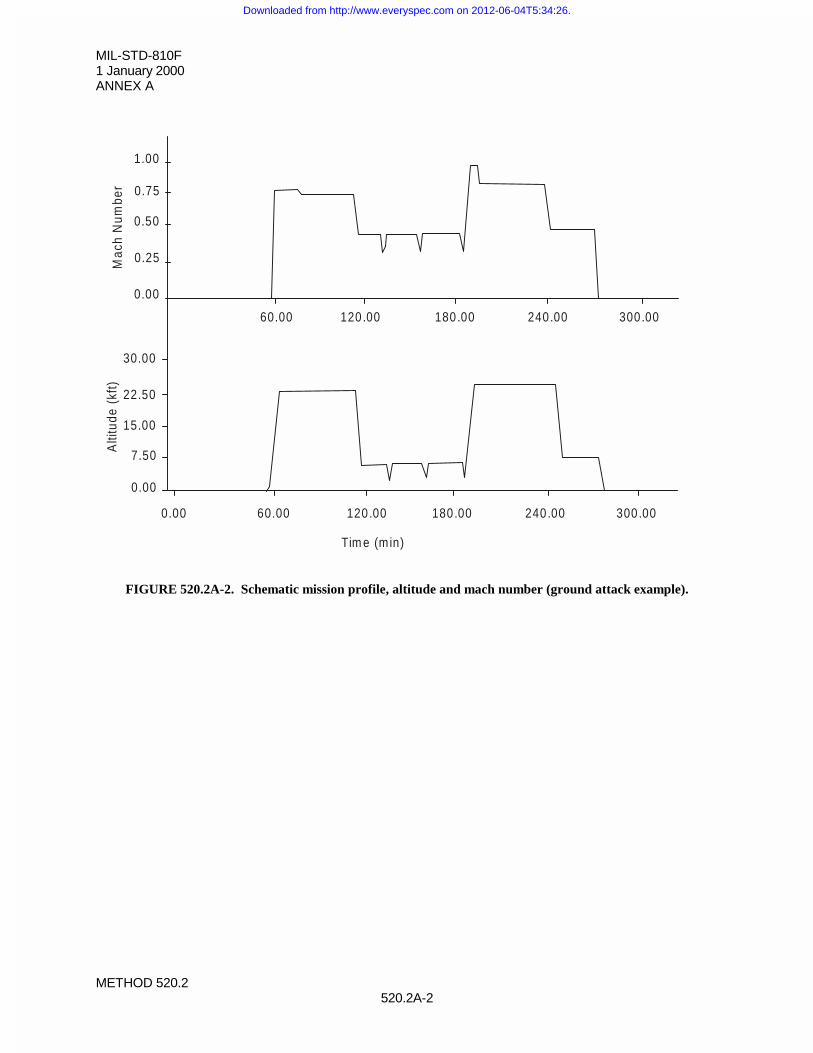
MIL-STD-810F1 January 2000ANNEX A
METHOD 520.2520.2A-2
FIGURE 520.2A-2. Schematic mission profile, altitude and mach number (ground attack example).
Tim e (m in)
300.00240.00180.00
120.00
60.000.00
0.00
7.50
15.00
22.50
30.00
Alti
tude
(kf
t)M
ach
Num
ber
0 .00
0.25
0.50
0.75
1.00
60.00
120.00
180.00 240.00 300.00
Downloaded from http://www.everyspec.com on 2012-06-04T5:34:26.
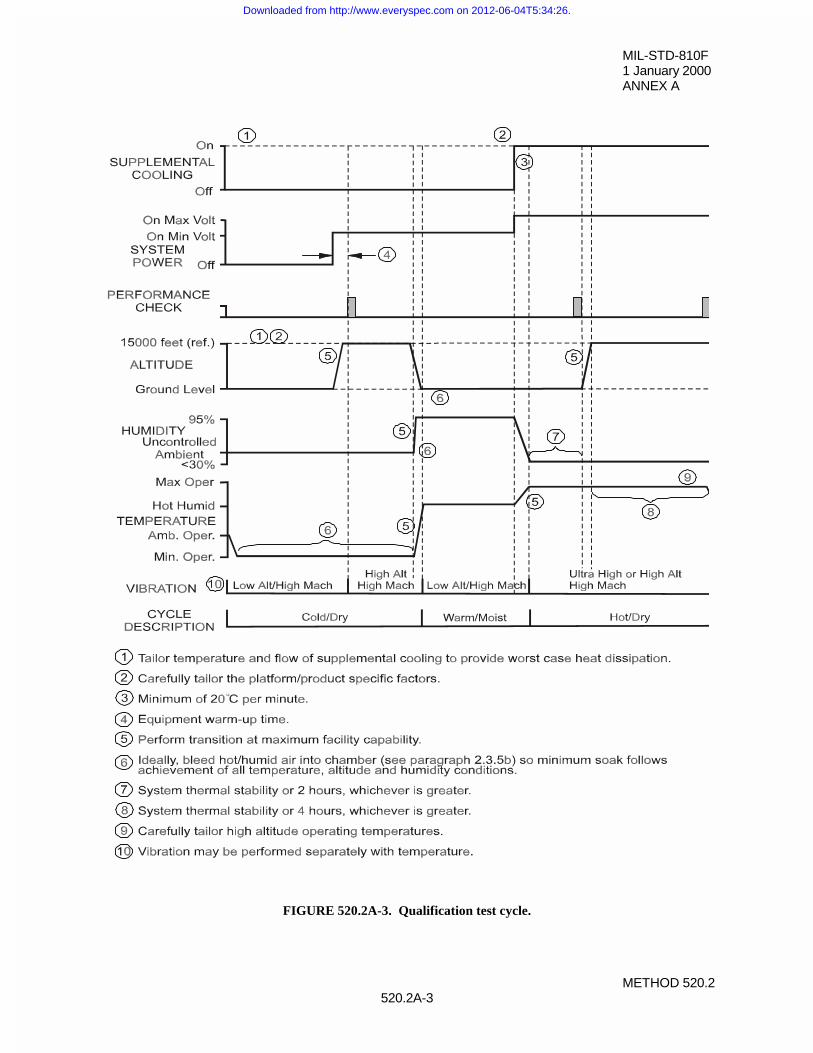
MIL-STD-810F1 January 2000ANNEX A
METHOD 520.2520.2A-3
FIGURE 520.2A-3. Qualification test cycle.
Downloaded from http://www.everyspec.com on 2012-06-04T5:34:26.
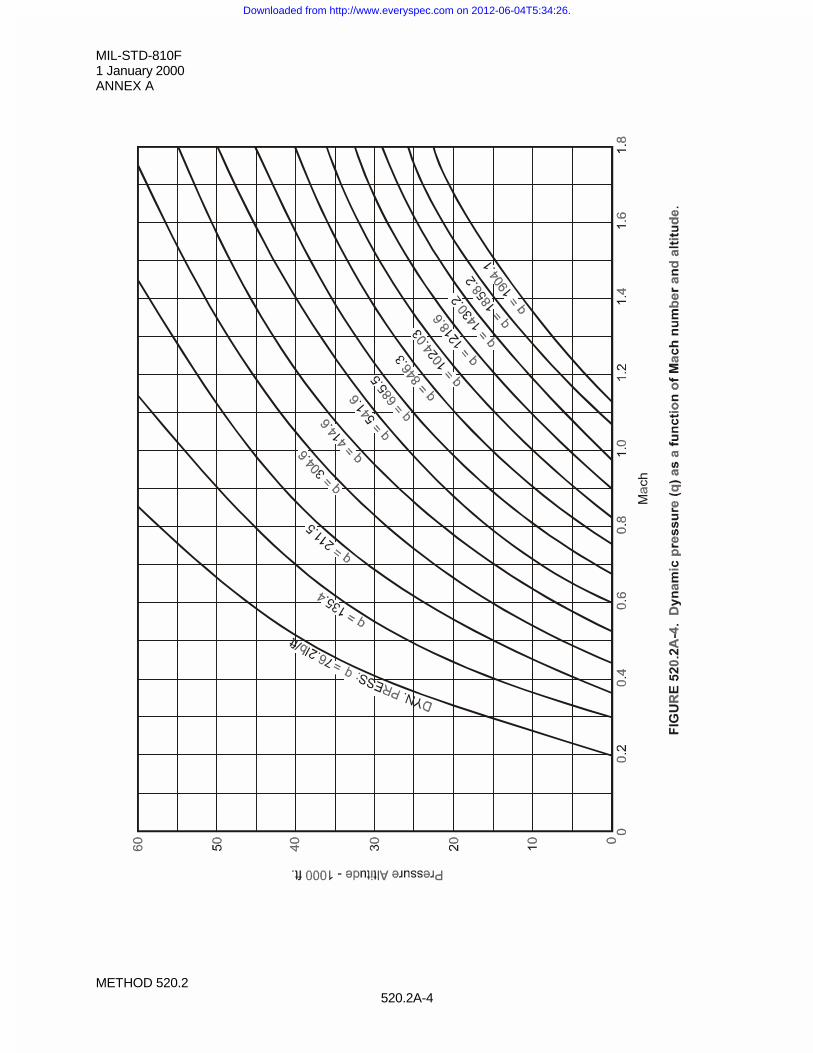
MIL-STD-810F1 January 2000ANNEX A
METHOD 520.2520.2A-4
Downloaded from http://www.everyspec.com on 2012-06-04T5:34:26.
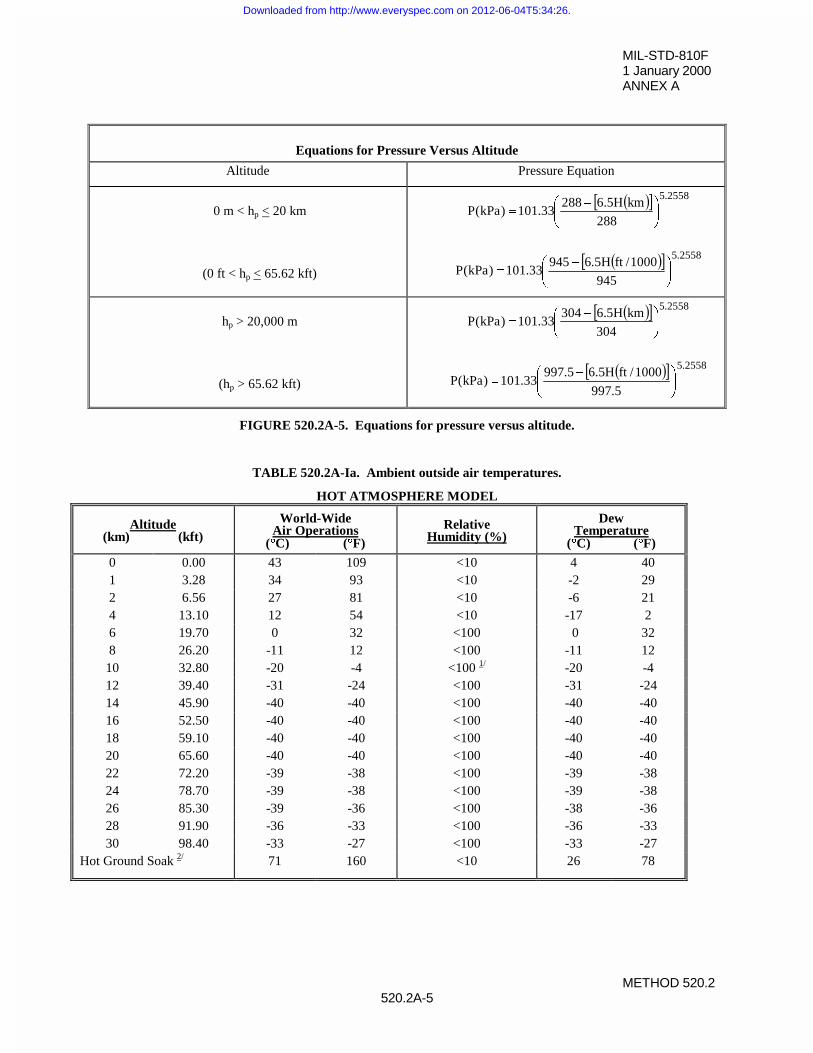
MIL-STD-810F1 January 2000ANNEX A
METHOD 520.2520.2A-5
Equations for Pressure Versus Altitude
Altitude Pressure Equation
0 m < hp < 20 km
(0 ft < hp < 65.62 kft)
� �� � 2558.5
288
kmH5.628833.101)kPa(P ¸
¹
ᬩ
§ �
� �� � 2558.5
945
1000/ftH5.694533.101)kPa(P ¸
¹
ᬩ
§ �
hp > 20,000 m
(hp > 65.62 kft)
� �� � 2558.5
304
kmH5.630433.101)kPa(P ¸
¹
ᬩ
§ �
� �� � 2558.5
5.997
1000/ftH5.65.99733.101)kPa(P ¸
¹
ᬩ
§ �
FIGURE 520.2A-5. Equations for pressure versus altitude.
TABLE 520.2A-Ia. Ambient outside air temperatures.
HOT ATMOSPHERE MODEL
Altitude(km) (kft)
World-WideAir Operations
(qqC) (qqF)Relative
Humidity (%)Dew
Temperature(qqC) (qqF)
0 0.00 43 109 <10 4 401 3.28 34 93 <10 -2 292 6.56 27 81 <10 -6 214 13.10 12 54 <10 -17 26 19.70 0 32 <100 0 328 26.20 -11 12 <100 -11 12
10 32.80 -20 -4 <100 1/ -20 -412 39.40 -31 -24 <100 -31 -2414 45.90 -40 -40 <100 -40 -4016 52.50 -40 -40 <100 -40 -4018 59.10 -40 -40 <100 -40 -4020 65.60 -40 -40 <100 -40 -4022 72.20 -39 -38 <100 -39 -3824 78.70 -39 -38 <100 -39 -3826 85.30 -39 -36 <100 -38 -3628 91.90 -36 -33 <100 -36 -3330 98.40 -33 -27 <100 -33 -27
Hot Ground Soak 2/ 71 160 <10 26 78
Downloaded from http://www.everyspec.com on 2012-06-04T5:34:26.
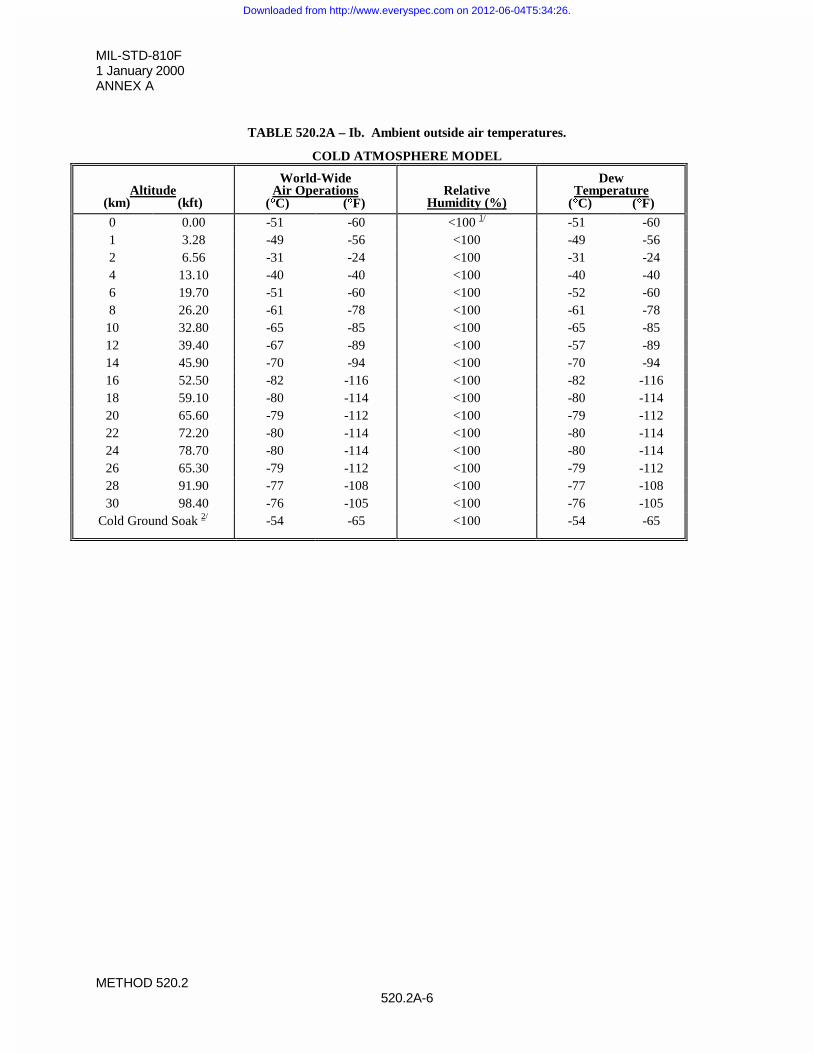
MIL-STD-810F1 January 2000ANNEX A
METHOD 520.2520.2A-6
TABLE 520.2A – Ib. Ambient outside air temperatures.
COLD ATMOSPHERE MODEL
Altitude(km) (kft)
World-WideAir Operations
(qqC) (qqF)Relative
Humidity (%)
DewTemperature
(qqC) (qqF)
0 0.00 -51 -60 <100 1/ -51 -601 3.28 -49 -56 <100 -49 -562 6.56 -31 -24 <100 -31 -244 13.10 -40 -40 <100 -40 -406 19.70 -51 -60 <100 -52 -608 26.20 -61 -78 <100 -61 -78
10 32.80 -65 -85 <100 -65 -8512 39.40 -67 -89 <100 -57 -8914 45.90 -70 -94 <100 -70 -9416 52.50 -82 -116 <100 -82 -11618 59.10 -80 -114 <100 -80 -11420 65.60 -79 -112 <100 -79 -11222 72.20 -80 -114 <100 -80 -11424 78.70 -80 -114 <100 -80 -11426 65.30 -79 -112 <100 -79 -11228 91.90 -77 -108 <100 -77 -10830 98.40 -76 -105 <100 -76 -105
Cold Ground Soak 2/ -54 -65 <100 -54 -65
Downloaded from http://www.everyspec.com on 2012-06-04T5:34:26.
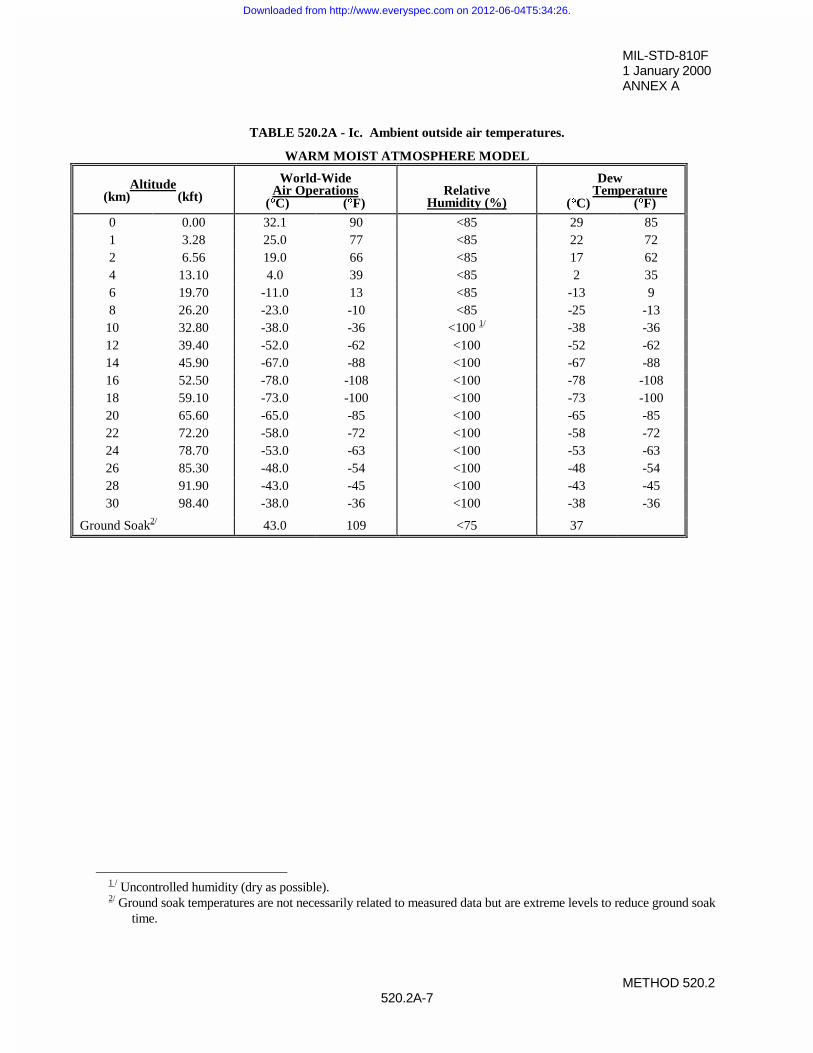
MIL-STD-810F1 January 2000ANNEX A
METHOD 520.2520.2A-7
TABLE 520.2A - Ic. Ambient outside air temperatures.
WARM MOIST ATMOSPHERE MODEL
Altitude(km) (kft)
World-WideAir Operations
(qqC) (qqF)Relative
Humidity (%)
DewTemperature
(qqC) (qqF)
0 0.00 32.1 90 <85 29 851 3.28 25.0 77 <85 22 722 6.56 19.0 66 <85 17 624 13.10 4.0 39 <85 2 356 19.70 -11.0 13 <85 -13 98 26.20 -23.0 -10 <85 -25 -13
10 32.80 -38.0 -36 <100 1/ -38 -3612 39.40 -52.0 -62 <100 -52 -6214 45.90 -67.0 -88 <100 -67 -8816 52.50 -78.0 -108 <100 -78 -10818 59.10 -73.0 -100 <100 -73 -10020 65.60 -65.0 -85 <100 -65 -8522 72.20 -58.0 -72 <100 -58 -7224 78.70 -53.0 -63 <100 -53 -6326 85.30 -48.0 -54 <100 -48 -5428 91.90 -43.0 -45 <100 -43 -4530 98.40 -38.0 -36 <100 -38 -36
Ground Soak2/ 43.0 109 <75 37
1 / Uncontrolled humidity (dry as possible). 2/ Ground soak temperatures are not necessarily related to measured data but are extreme levels to reduce ground soak
time.
Downloaded from http://www.everyspec.com on 2012-06-04T5:34:26.
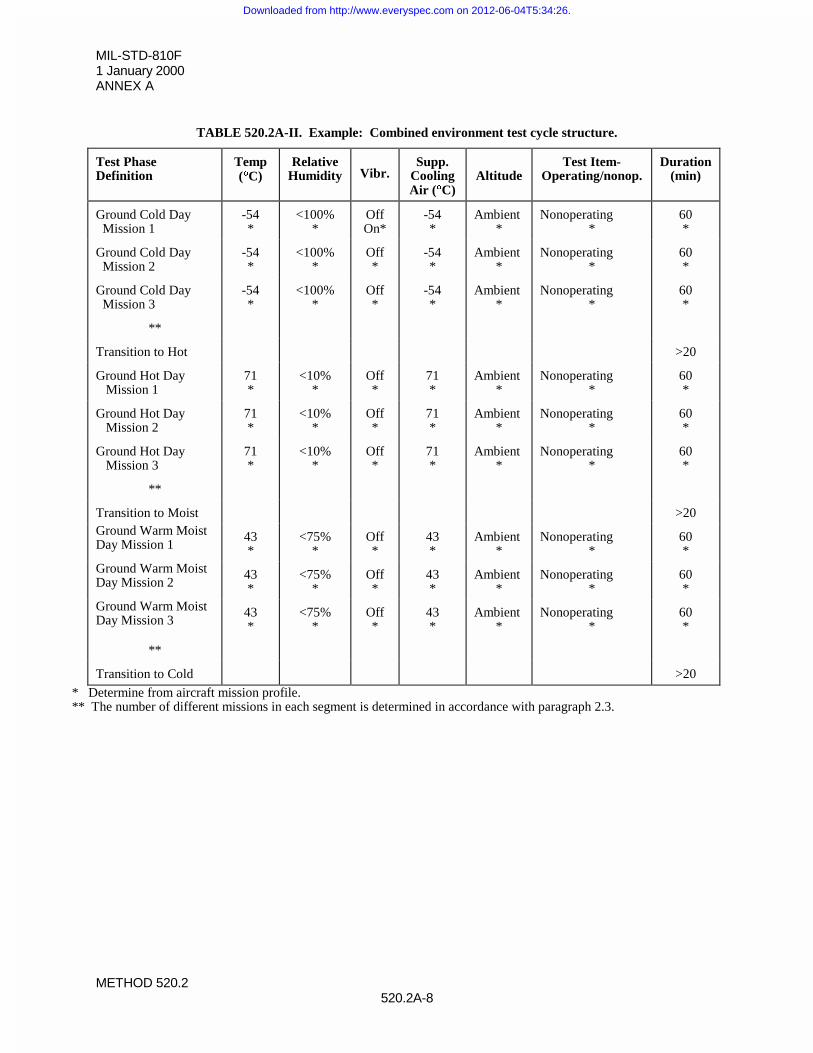
MIL-STD-810F1 January 2000ANNEX A
METHOD 520.2520.2A-8
TABLE 520.2A-II. Example: Combined environment test cycle structure.
Test PhaseDefinition
Temp(qqC)
RelativeHumidity Vibr.
Supp.CoolingAir (qqC)
AltitudeTest Item-
Operating/nonop.Duration
(min)
Ground Cold Day Mission 1
-54*
<100%*
OffOn*
-54*
Ambient*
Nonoperating*
60*
Ground Cold Day Mission 2
-54*
<100%*
Off*
-54*
Ambient*
Nonoperating*
60*
Ground Cold Day Mission 3
-54*
<100%*
Off*
-54*
Ambient*
Nonoperating*
60*
**
Transition to Hot >20
Ground Hot Day Mission 1
71*
<10%*
Off*
71*
Ambient*
Nonoperating*
60*
Ground Hot Day Mission 2
71*
<10%*
Off*
71*
Ambient*
Nonoperating*
60*
Ground Hot Day Mission 3
71*
<10%*
Off*
71*
Ambient*
Nonoperating*
60*
**
Transition to Moist >20Ground Warm MoistDay Mission 1
43*
<75%*
Off*
43*
Ambient*
Nonoperating*
60*
Ground Warm MoistDay Mission 2
43*
<75%*
Off*
43*
Ambient*
Nonoperating*
60*
Ground Warm MoistDay Mission 3
43*
<75%*
Off*
43*
Ambient*
Nonoperating*
60*
**
Transition to Cold >20
* Determine from aircraft mission profile.** The number of different missions in each segment is determined in accordance with paragraph 2.3.
Downloaded from http://www.everyspec.com on 2012-06-04T5:34:26.
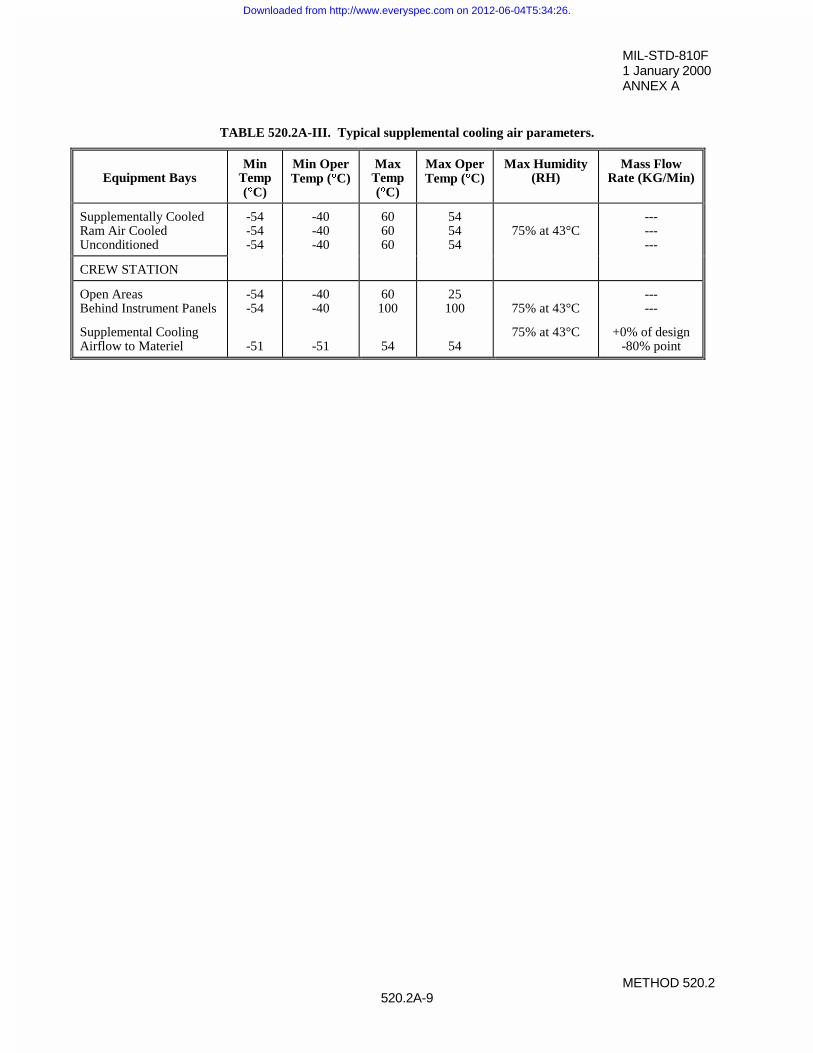
MIL-STD-810F1 January 2000ANNEX A
METHOD 520.2520.2A-9
TABLE 520.2A-III. Typical supplemental cooling air parameters.
Equipment BaysMin
Temp(qqC)
Min OperTemp (qqC)
MaxTemp(qqC)
Max OperTemp (qqC)
Max Humidity(RH)
Mass FlowRate (KG/Min)
Supplementally CooledRam Air CooledUnconditioned
-54-54-54
-40-40-40
606060
545454
75% at 43°C---------
CREW STATION
Open AreasBehind Instrument Panels
-54-54
-40-40
60100
25100 75% at 43°C
------
Supplemental CoolingAirflow to Materiel -51 -51 54 54
75% at 43°C +0% of design-80% point
Downloaded from http://www.everyspec.com on 2012-06-04T5:34:26.
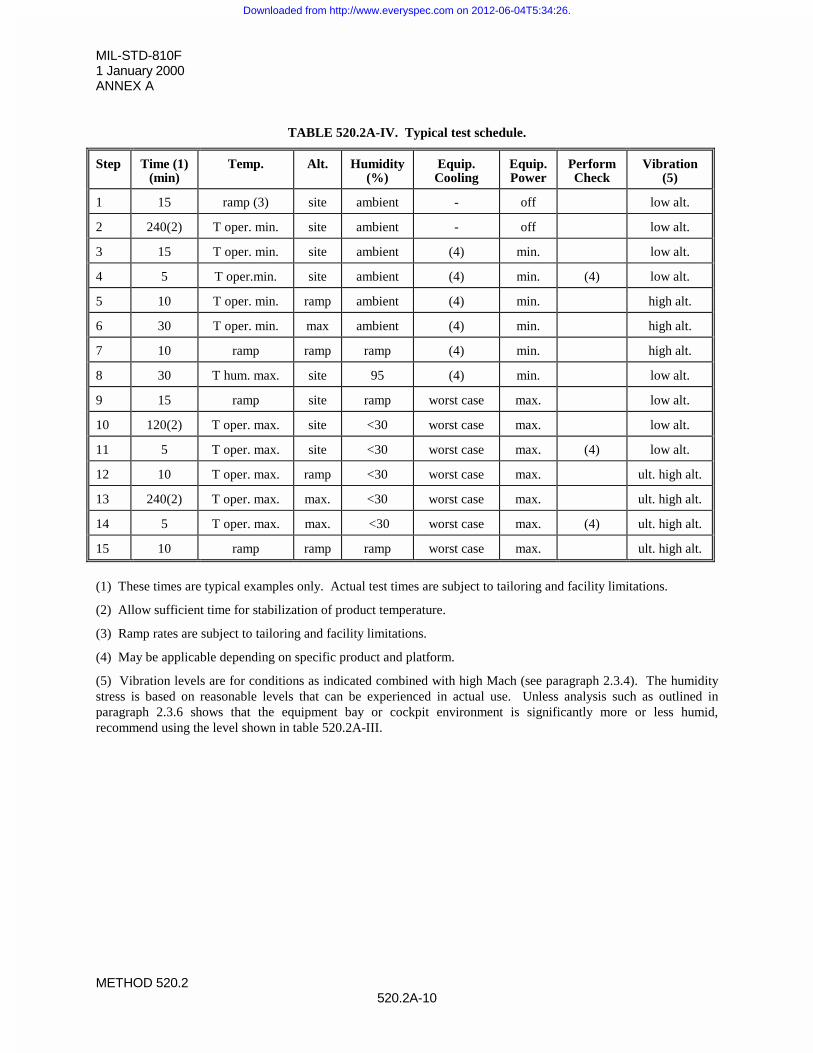
MIL-STD-810F1 January 2000ANNEX A
METHOD 520.2520.2A-10
TABLE 520.2A-IV. Typical test schedule.
Step Time (1)(min)
Temp. Alt. Humidity(%)
Equip.Cooling
Equip.Power
PerformCheck
Vibration(5)
1 15 ramp (3) site ambient - off low alt.
2 240(2) T oper. min. site ambient - off low alt.
3 15 T oper. min. site ambient (4) min. low alt.
4 5 T oper.min. site ambient (4) min. (4) low alt.
5 10 T oper. min. ramp ambient (4) min. high alt.
6 30 T oper. min. max ambient (4) min. high alt.
7 10 ramp ramp ramp (4) min. high alt.
8 30 T hum. max. site 95 (4) min. low alt.
9 15 ramp site ramp worst case max. low alt.
10 120(2) T oper. max. site <30 worst case max. low alt.
11 5 T oper. max. site <30 worst case max. (4) low alt.
12 10 T oper. max. ramp <30 worst case max. ult. high alt.
13 240(2) T oper. max. max. <30 worst case max. ult. high alt.
14 5 T oper. max. max. <30 worst case max. (4) ult. high alt.
15 10 ramp ramp ramp worst case max. ult. high alt.
(1) These times are typical examples only. Actual test times are subject to tailoring and facility limitations.
(2) Allow sufficient time for stabilization of product temperature.
(3) Ramp rates are subject to tailoring and facility limitations.
(4) May be applicable depending on specific product and platform.
(5) Vibration levels are for conditions as indicated combined with high Mach (see paragraph 2.3.4). The humiditystress is based on reasonable levels that can be experienced in actual use. Unless analysis such as outlined inparagraph 2.3.6 shows that the equipment bay or cockpit environment is significantly more or less humid,recommend using the level shown in table 520.2A-III.
Downloaded from http://www.everyspec.com on 2012-06-04T5:34:26.
MIL-STD-810F1 January 2000
METHOD 521.2521.2-1
METHOD 521.2
ICING/FREEZING RAIN
NOTE: Tailoring is essential. Select methods, procedures, and parameter levels based on the tailoring processdescribed in Part One, paragraph 4, and Appendix C. Apply the general guidelines for laboratory test methodsdescribed in Part One, paragraph 5 of this standard.
1. SCOPE.
1.1 Purpose.
The icing test is conducted to evaluate the effect of icing on the operational capability of materiel. This method alsoprovides tests for evaluating the effectiveness of de-icing equipment and techniques, including prescribed means tobe used in the field.
1.2 Application.
a. Use this method to evaluate materiel which may be exposed to icing such as produced by freezing rain orfreezing drizzle. (See paragraph 2.2.1.1 below.)
b. Use this method to develop ice accretion from sea splash or spray but the ice thicknesses may need to bemodified to reflect the lower density of the ice.
1.3 Limitations.
This method does not simulate snow conditions or ice buildup on aircraft flying through supercooled clouds. Although frost occurs naturally, the effects are considered less significant and are not specifically addressed in thismethod. This method may not be suitable for the assessment of aerial/antenna performance, (i.e., rime ice saturatedwith air causes substantial signal reflection). Also not considered are the icing effects from falling, blowing orrecirculating snow and wet snow or slush. These are considered less severe than those in paragraph 2.1.1.
2. TAILORING GUIDANCE.
2.1 Selecting the Icing/Freezing Rain Method.
After examining requirements documents and applying the tailoring process in Part One of this standard to determinewhere icing/freezing rain is anticipated in the life cycle of materiel, use the following to confirm the need for thismethod and to place it in sequence with other methods. This method is designed to determine if materiel can operateafter ice accumulation from rain, drizzle, fog, splash or other sources. Where ice removal is required beforeoperation, use integral deicing equipment or expedients normally available to the user in the field. Evaluate deicingequipment and expedients to assess their effectiveness and the potential for damage that may degrade performance.
2.1.1 Effects of icing/freezing rain.
Ice formation can impede materiel operation and survival and affect the safety of operating personnel. Consider thefollowing typical problems to help determine if this method is appropriate for the materiel being tested. This list isnot intended to be all-inclusive.
a. Binds moving parts together.
b. Adds weight to radar antennas, aerodynamic control surfaces, helicopter rotors, etc.
c. Increases footing hazards for personnel.
Downloaded from http://www.everyspec.com on 2012-06-04T5:34:26.
MIL-STD-810F1 January 2000
METHOD 521.2521.2-2
d. Interferes with clearances between moving parts.
e. Induces structural failures.
f. Reduces airflow efficiency as in cooling systems or filters.
g. Impedes visibility through windshields and optical devices.
h. Affects transmission of electromagnetic radiation.
i. Provides a source of potential damage to materiel from the employment of mechanical, manual, orchemical ice removal measures.
j. Reduces efficiency of aerodynamic lifting and control surfaces.
k. Reduces (aircraft) stall margins.
2.1.2 Sequence among other methods.
a. General. See Part One, paragraph 5.5.
b. Unique to this method.
(1) There are at least two philosophies related to test sequence. One approach is to conserve test itemlife by applying what are perceived to be the least damaging environments first. For this approach,generally apply the icing/freezing rain following rain tests, but prior to salt fog tests, becauseresidual salts could impair the formation of ice. Also, apply this test prior to dynamic tests, whichcould loosen components.
(2) Another approach is to apply environments to maximize the likelihood of disclosing synergeticeffects. For this approach, consider icing tests.
2.2 Selecting Procedure Variations.
This method has one procedure. However, the test procedure may be varied. Before conducting this test, completethe tailoring process by selecting specific procedure variations (special test conditions/techniques for this procedure)based on requirements documents, Life Cycle Environmental Profile, Operational Environment Documentation (seePart One, figure 1-1), and information provided with this procedure. Consider the following in light of theoperational purpose and life cycle of the materiel.
2.2.1 Ice formation.
2.2.1.1 Principal causes.
A buildup of ice occurs in four principal ways:
a. From rain, drizzle, or fog falling on materiel whose temperature is at or below freezing;
b. From sublimation;
c. From freezing rain or freezing drizzle falling on materiel at or near freezing, or
d. From sea spray and splash which coats materiel when the materiel temperature is below freezing.
2.2.1.2 Types of ice. (Reference b.)
Two types of ice are commonly encountered: rime ice (opaque/granular) and glaze ice (clear/smooth). Publishedextremes for ice accretion may be used for calculating design and structural evaluations but are not consideredpractical for establishing test conditions due to the large thicknesses involved unless the test is intended to providepractical confirmation of design calculations.
Downloaded from http://www.everyspec.com on 2012-06-04T5:34:26.
MIL-STD-810F1 January 2000
METHOD 521.2521.2-3
a. Rime ice: A white or milky and opaque granular deposit of ice formed by a rapid freezing ofsupercooled water drops as they impinge upon an exposed object. Rime ice is lighter, softer, and lesstransparent than glaze. Rime is composed essentially of discrete ice granules and has densities rangingfrom 0.2 g/cm3 (soft rime) to almost 0.9 g/cm3 (hard rime). Factors that favor rime formation are smalldrop size, slow accretion, a high degree of supercooling, and rapid dissipation of latent heat of fusion. The opposite effects favor glaze formation.
(1) Hard rime: Opaque, granular masses of rime deposited chiefly on vertical surfaces by dense,supercooled fog. Hard rime is more compact and amorphous than soft rime, and builds out into thewind as glazed cones or feathers. The icing of ships and shoreline structures by supercooled sprayfrom the sea usually has the characteristics of hard rime.
(2) Soft rime: A white, opaque coating of fine rime deposited chiefly on vertical surfaces, especially onpoints and edges of objects, generally in supercooled fog. On the windward side, soft rime maygrow to very thick layers, long feathery cones, or needles pointing into the wind and having astructure similar to that of frost.
b. Glaze ice: A coating of ice, generally clear and smooth but usually containing some air pockets, formedon exposed objects by the freezing of a film of supercooled water vapor. Glaze is denser, harder, andmore transparent than rime. Its density may be as high as 0.9 g/cm3. Factors that favor glaze formationare large drop size, rapid accretion, slight supercooling, and slow dissipation of heat of fusion. Theopposite effects favor rime formation. Glaze occurs when rain or drizzle freezes on objects, and is clearand nearly as dense as pure ice. Since glaze ice is more difficult to remove, it is structurally a moresignificant factor and will be the focus of this test.
2.2.2 Configuration and orientation.
Consider the following factors:
a. Whether or not the test item receives icing on all sides and the top.
b. Whether or not the test item is in its deployment configuration. If required, perform tests in otherconfigurations such as for shipping or outside storage.
2.2.3 Test temperature.
Test temperatures that may be used to produce the required environmental conditions are recommended in the testprocedure. The recommended temperatures of the chamber and water may have to be adjusted for different sizefacilities to prevent premature freezing of the water droplets before they come in contact with the test item. However, do not use an initial test item temperature below 0°C to allow water to penetrate (cracks, seams, etc.) priorto freezing.
2.2.4 Water delivery rate.
The objective is to produce a clear, uniform coating of glaze ice. Any delivery rate that produces a uniform coatingof glaze ice is acceptable. A water delivery rate of 25 mm/h is suggested in the test procedure and is based on datafrom previous testing.
2.2.5 Water delivery method.
Any of the following water delivery systems can be used as long as the water is delivered as a uniform spray:
a. Nozzle arrays directing spray to the top, sides, front, and rear of the test item.
b. Nozzle arrays that direct spray straight down onto the test item. Side-spray coverage is achieved byusing wind or an additional hand-held nozzle. Minimize any wind in order to maintain uniform iceaccretion.
c. A single nozzle directing the spray over the appropriate surfaces of the test item.
Downloaded from http://www.everyspec.com on 2012-06-04T5:34:26.
MIL-STD-810F1 January 2000
METHOD 521.2521.2-4
2.2.6 Droplet size.
The droplet size range may have to be adjusted for different size facilities. A fine spray in the range of 1.0 mm to1.5 mm diameter nominal droplet size has produced satisfactory icing in some facilities.
2.2.7 Ice thickness.
Unless specifically measured data for the anticipated situation are available, the following ice thicknesses arerecommended (reference c):
a. 6mm - represents general conditions, light loading
b. 13mm - represents general conditions, medium loading
c. 37mm - represents heavy ground loading and marine mast loading
d. 75mm - represents extremely heavy ground loading and marine deck loading.
2.3 Operational Considerations.
a. Some materiel covered with ice may be expected to operate immediately without first undergoing de-icing procedures; other materiel would not be expected to operate until some form of de-icing has takenplace (e.g., aircraft ailerons (flaps) prior to flight).
b. Ice removal, if required, may include built-in ice-removal systems, prescribed means which could beexpected to be employed in the field, or a combination of these.
c. The correct operation of anti-ice systems such as pre-heated surfaces.
3. INFORMATION REQUIRED.
3.1 Pretest.
The following information is required to conduct icing/freezing rain tests adequately.
a. General. Information listed in Part One, paragraphs 5.7 and 5.9, and Part One, Appendix A, Task 405 ofthis standard.
b. Specific to this method.
(1) Ice thickness to be applied.
(2) Ice removal method(s) (if employed).
(3) Any variations from recommended test temperatures and droplet sizes.
(4) Surfaces of the test item to which ice is to be applied.
(5) Velocity of any wind used.
3.2 During Test.
Collect the following information during conduct of the test:
a. General. Information listed in Part One, paragraph 5.10, and in Appendix A, Task 406 of this standard.
b. Specific to this method.
(1) Record of chamber temperatures versus time conditions.
(2) Record of the test item temperature-versus-time data for the duration of the test.
Downloaded from http://www.everyspec.com on 2012-06-04T5:34:26.
MIL-STD-810F1 January 2000
METHOD 521.2521.2-5
3.3 Post-test.
a. General. Information listed in Part One, paragraph 5.13.
b. Specific to this method.
(1) Actual ice thicknesses.
(2) Results of required ice removal efforts.
(3) Initial analysis of any failures/problems.
(4) Type of ice developed, i.e., glaze or rime.
4. TEST PROCESS.
4.1 Test Facility.
The required apparatus consists of a chamber or cabinet together with auxiliary instrumentation capable ofestablishing and maintaining the specified test conditions. Use a facility equipped so that test conditions within thechamber can be stabilized soon after the test item is installed. Arrange water delivery equipment to minimize thecollection of puddles/ice in the chamber. Make continuous recordings of chamber temperature measurements and, ifrequired, test item temperatures.
4.2 Controls.
Before each test, verify the critical parameters. Ensure the nozzle spray pattern is wide enough to guarantee uniformimpingement for all test wind velocities. Unless otherwise specified, if any action other than test item operation(such as opening the chamber door) results in a significant change in the test item or chamber temperature (more than2qC), restabilize the test item at the required test temperature before continuing. If the operational check is notcompleted within 15 minutes, reestablish the test item temperature conditions before continuing.
4.3 Test Interruption.
a. General. See Part One, paragraph 5.11 of this standard.
b. Specific to this method.
(1) Undertest interruption. Interruption of an icing/freezing rain test is unlikely to generate any adverseeffects. Normally, continue the test from the point of interruption once the test conditions have beenre-established.
(2) Overtest interruption. Follow any interruption that results in more extreme exposure of the test itemthan required by the requirements document by a complete operational and physical checkout. Ifthere are no problems, restore the test item to its pretest condition and restart the test.
4.4 Test Setup.
a. General. See Part One, paragraph 5.8.
b. Unique to this method.
(1) Clean all outside surfaces of any contamination not present during normal operation. Even thin filmsof oil or grease will prevent ice from adhering to the test item and change the test results.
(2) To facilitate measurement of ice thickness, mount depth gauges such as copper bars or tubes of anappropriate size in places where they will receive the same general waterspray as the test item. Other thickness measurement techniques may be used if they can be shown to indicate the icethickness.
Downloaded from http://www.everyspec.com on 2012-06-04T5:34:26.
MIL-STD-810F1 January 2000
METHOD 521.2521.2-6
NOTE: Since artificially produced freezing accretion rates tend to depend on the distance between the test item andspray device, for structures with large height variations such as antenna masts, place test bars at different heights.
(3) Using chilled water (between 0° and 3°C) in the spraying system will cause a faster ice buildup ratethan unchilled water.
4.5 Test Execution.
The following steps, alone or in combination, provide the basis for collecting necessary information concerning themateriel in an icing/freezing rain environment.
4.5.1 Preparation for test.
4.5.1.1 Preliminary steps.
Before starting the test, review pretest information in the test plan to determine test details (e.g., procedures, itemconfiguration, cycles, durations, parameter levels for storage/operation, ice thickness, etc.).
4.5.1.2 Pretest standard ambient checkout.
All items require a pretest standard ambient checkout to provide baseline data. Conduct the checkout as follows:
Step 1. Install temperature sensors in, on, or around the test item as described in the test plan.Step 2. Install the test item in the chamber (Part One, paragraph 5.8.1) in the required configuration and
orientation, and at standard ambient conditions (Part One, paragraph 5.1).Step 3. Conduct a visual examination of the test item with special attention to stress areas such as corners of
molded cases, and document the results.Step 4. Conduct an operational checkout (Part One, paragraph 5.8.2) as described in the plan to obtain baseline
data, and record the results.Step 5. If the test item operates satisfactorily, proceed to paragraph 4.5.2. If not, resolve the problems and
repeat Step 4 above.
4.5.2 Procedure I - Glaze ice.
Step 1. Stabilize the test item temperature at 0qC (-0/+2°C).Step 2. Deliver a uniform, precooled water spray for 1 hour to allow water penetration into the test item
crevices/openings (although a water temperature of 0 - 3°C is ideal, a water temperature of 5°C and awater delivery rate of 25 mm/h has proven satisfactory).
Step 3. Adjust the chamber air temperature to -10°C or as specified and maintain the waterspray rate until therequired thickness of ice has accumulated on the appropriate surfaces. Wind or a side spray may beused to assist accumulation of ice on the sides of the test item.
NOTE: If it is difficult to produce a satisfactory layer of glaze ice, vary one or more of the parameters as necessary,i.e., water or test item temperature, spray rate, distance between the nozzles and the test item, etc.
NOTE: It may be easier to stop spraying during the temperature reduction to facilitate temperature adjustment andto minimize frosting of test chamber refrigeration coils.
Step 4. Maintain the chamber air temperature for a minimum of 4 hours to allow the ice to harden. Examine forsafety hazards and, if appropriate, attempt to operate the test item. Document the results (withphotographs if necessary).
Step 5. If step 4 has resulted in failure or if the specification allows ice removal, remove the ice. Limit themethod of ice removal to that determined in 3.1b, e.g., built-in ice removal systems, plus expedientmeans which could be expected to be employed in the field. Note the effectiveness of ice removaltechniques used.
Step 6. Examine for safety hazards and, if appropriate (and possible), attempt to operate the test item at thespecified low operating temperature of the materiel.
Step 7. If required, repeat steps 3 through 6 to produce other required thicknesses of ice.Step 8. Stabilize the test item at standard ambient conditions and perform a post-test operational check.
Downloaded from http://www.everyspec.com on 2012-06-04T5:34:26.
MIL-STD-810F1 January 2000
METHOD 521.2521.2-7
Step 9. Document (with photographs if necessary) the results for comparison with pretest data.
5. ANALYSIS OF RESULTS.
In addition to the guidance provided in Part One, paragraphs 5.14 and 5.17, the following information is provided toassist in the evaluation of the test results. Apply any data relative to failure of a test item to the test analysis, andconsider related information such as:
a. For materiel that must operate without ice removal: if the performance of the test item has been degradedbeyond that specified in the requirements document.
b. For materiel that requires ice removal before operation: if the performance of the test item has beendegraded below the specified limits/requirements after normal ice removal efforts have been undertaken.
c. If normal ice removal damages the materiel.
d. If a nonapparent hazardous situation has been created.
6. REFERENCE/RELATED DOCUMENTS.
a. AR 70-38, Research, Development, Test and Evaluation of Materiel for Extreme Climatic Conditions.
b. Glossary of Meteorology, Edited by Ralph E. Huschke, Published by the American MeteorologicalSociety (1959).
c. Letter, Cold Regions Research and Engineering Laboratory, Corps of Engineers (U.S.), CECRL-RG, 22October 1990, SUBJECT: Ice Accretion Rates (Glaze).
d. MIL-HDBK-310, Global Climatic Data for Developing Military Products.
e. Synopsis of Background Material for MIL-STD-210B, Climatic Extremes for Military Equipment.Bedford, MA: Air Force Cambridge Research Laboratories, 24 January 1974. DTIC number AD-780-508.
f. NATO STANAG 4370, Environmental Testing.
g. Allied Environmental Conditions and Test Procedure (AECTP) 300, Climatic Environmental Tests(under STANAG 4370).
Downloaded from http://www.everyspec.com on 2012-06-04T5:34:26.

MIL-STD-810F1 January 2000
METHOD 521.2521.2-8
THIS PAGE INTENTIONALLY BLANK
Downloaded from http://www.everyspec.com on 2012-06-04T5:34:26.
MIL-STD-810F1 January 2000
METHOD 522522-1
METHOD 522
BALLISTIC SHOCK
NOTE: Tailoring is essential. Select methods, procedures, and parameter levels based on the tailoring processdescribed in Part One, paragraph 4, and Appendix C. Apply the general guidelines for laboratory test methodsdescribed in Part One, paragraph 5 of this standard.
1. SCOPE.
1.1 Purpose.
This method includes a set of ballistic shock tests generally involving momentum exchange between two or morebodies or momentum exchange between a liquid or gas and a solid performed to:
a. provide a degree of confidence that materiel can structurally and functionally withstand the infrequentshock effects caused by high levels of momentum exchange on a structural configuration to which themateriel is mounted.
b. experimentally estimate the materiel's fragility level relative to ballistic shock in order that shockmitigation procedures may be employed to protect the materiel’s structural and functional integrity.
1.2 Application.
1.2.1 Ballistic shock definition.
Ballistic shock is a high-level shock that generally results from the impact of projectiles or ordnance on armoredcombat vehicles. Armored combat vehicles must survive the shocks resulting from large caliber non-perforatingprojectile impacts, mine blasts, and overhead artillery attacks, while still retaining their combat mission capabilities.Reference d discusses the relationship between various shock environments (ballistic shock, transportation shock,rail impact shock, etc.) for armored combat vehicles. Actual shock levels vary with the type of vehicle, the specificmunition used, the impact location or proximity, and where on the vehicle the shock is measured. There is no intenthere to define the actual shock environment for specific vehicles. Furthermore, it should be noted that the ballisticshock technology is still rather limited in its ability to define and quantify the actual shock phenomenon. Eventhough considerable progress has been made in the development of measurement techniques, currently usedinstrumentation (especially the shock sensing gages) is still bulky and cumbersome to use. The development ofanalytical (computational) methods to determine shock levels, shock propagation, and mitigation is lagging behindthe measurement technology. The analytical methods under development and in use to date have not evolved to thelevel where their results can be relied upon to the degree that the need for testing is eliminated. That is, theprediction of response to ballistic shock is, in general, not possible except in the simplest configurations. When anarmored vehicle is subjected to a non-perforating large caliber munition impact or blast, the structure locallyexperiences a force loading of very high intensity and of relatively short duration. Though the force loading islocalized, the entire vehicle is subjected to stress waves traveling over the surface and through the structure. Incertain cases, pyrotechnic shocks have been used in ballistic shock simulations. There are several caveats in suchtesting. The characteristics of ballistic shock are outlined in the following paragraph.
1.2.2 Ballistic shock - momentum exchange.
Ballistic shock usually exhibits momentum exchange between two bodies or between a fluid and a solid. Itcommonly results in velocity change in the support materiel. Ballistic shock has a portion of its characterizationbelow 100 Hz, and the magnitude of the ballistic shock response at a given point reasonably far from the ballisticshock source is a function of the size of the momentum exchange. Ballistic shock will contain material wavepropagation characteristics (perhaps substantially nonlinear) but, in general, the material is deformed andaccompanied by structural damping other than damping natural to the material. For ballistic shock, structural
Downloaded from http://www.everyspec.com on 2012-06-04T5:34:26.
MIL-STD-810F1 January 2000
METHOD 522522-2
connections do not necessarily display great attenuation since low frequency structural response is generally easilytransmitted over joints. In processing ballistic shock data, it is important to be able to detect anomalies. With regardto measurement technology, accelerometers, strain gages, and shock sensing gages may be used (see ref. a). Inlaboratory situations, laser velocimeters are useful. Ballistic shock resistance is not, in general, “designed” into themateriel. The occurrence of a ballistic shock and its general nature can only be determined empirically from pastexperience based on well-defined scenarios. Ballistic shock response of materiel in the field is, in general, veryunpredictable and not repeatable among materiel.
1.2.3 Ballistic shock - physical phenomenon.
Ballistic shock is a physical phenomenon characterized by the overall material and mechanical response at astructure point from elastic or inelastic impact. Such impact may produce a very high rate of momentum exchange ata point, over a small finite area or over a large area. The high rate of momentum exchange may be caused bycollision of two elastic bodies or a pressure wave applied over a surface. General characteristics of ballistic shockenvironments are as follows:
a. near-the-source stress waves in the structure caused by high material strain rates (nonlinear materialregion) that propagate into the near field and beyond;
b. combined low and high frequency (10 Hz – 1,000,000 Hz) and very broadband frequency input;
c. high acceleration (300g – 1,000,000g) with comparatively high structural velocity and displacementresponse;
d. short-time duration (<180 msec);
e. high residual structure displacement, velocity, and acceleration response (after the event);
f. caused by (1) an inelastic collision of two elastic bodies, or (2) an extremely high fluid pressure appliedfor a short period of time to an elastic body surface coupled directly into the structure, and with pointsource input, i.e., input is either highly localized as in the case of collision, or area source input, i.e.,widely dispersed as in the case of a pressure wave;
g. comparatively high structural driving point impedance (P/v, where P is the collision force or pressure,and v the structural velocity). At the source, the impedance could be substantially less if the materialparticle velocity is high;
h. measurement response time histories that are very highly random in nature, i.e., little repeatability andvery dependent on the configuration details;
i. shock response at points on the structure is somewhat affected by structural discontinuities;
j. structural response may be accompanied by heat generated by the inelastic impact or the fluid blast wave;
k. the nature of the structural response to ballistic shock does not suggest that the materiel or its componentsmay be easily classified as being in the “near field” or “far field” of the ballistic shock device. Ingeneral, materiel close to the source experiences high accelerations at high frequencies, whereas materielfar from the source will, in general, experience high acceleration at low frequencies as a result of thefiltering of the intervening structural configuration.
1.3 Limitations.
Because of the highly specialized nature of ballistic shock and the substantial sensitivity of ballistic shock to theconfiguration, apply it only after giving careful consideration to information contained in references c and d.
a. This method does not include special provisions for performing ballistic shock tests at high or lowtemperatures. Perform tests at room ambient temperature unless otherwise specified or if there is reasonto believe either operational high temperature or low temperature may enhance the ballistic shockenvironment.
b. This method does not address secondary effects such as blast, EMI, and thermal.
Downloaded from http://www.everyspec.com on 2012-06-04T5:34:26.
MIL-STD-810F1 January 2000
METHOD 522522-3
2. TAILORING GUIDANCE.
2.1 Selecting the Ballistic Shock Method.
After examining requirements documents and applying the tailoring process in Part One of this standard to determinewhere ballistic shock effects are foreseen in the life cycle of the materiel, use the following to confirm the need forthis method and to place it in sequence with other methods.
2.1.1 Effects of ballistic shock.
In general, ballistic shock has the potential for producing adverse effects on all electronic, mechanical, and electro-mechanical materiel. In general, the level of adverse effects increases with the level and duration of the ballisticshock and decreases with the distance from the source (point or points of impact) of the ballistic shock. Durationsfor ballistic shock that produce material stress waves with wavelengths that correspond with the natural frequencywavelengths of micro electronic components within materiel will enhance adverse effects. Durations for ballisticshock that produce structure response movement that correspond with the low frequency resonances of mechanicaland electro-mechanical materiel will enhance the adverse effects. Examples of problems associated with ballisticshock include:
a. materiel failure as a result of destruction of the structural integrity of micro electronic chips includingtheir mounting configuration;
b. materiel failure as a result of relay chatter;
c. materiel failure as a result of circuit card malfunction, circuit card damage, and electronic connectorfailure. On occasion, circuit card contaminants having the potential to cause short circuits may bedislodged under ballistic shock. Circuit card mounts may be subject to damage from substantial velocitychanges and large displacements.
d. materiel failure as a result of cracks and fracture in crystals, ceramics, epoxies or glass envelopes.
e. materiel failure as a result of sudden velocity change of the structural support of the materiel or theinternal structural configuration of the mechanical or electro-mechanical materiel.
2.1.2 Sequence among other methods.
a. General. See Part One, paragraph 5.5.
b. Unique to this method. Unless otherwise identified in the life cycle profile and, since ballistic shock isnormally experienced in combat and potentially near the end of the life cycle, normally schedule ballisticshock tests late in the test sequence. In general, the ballistic shock tests can be considered independentof the other tests because of their unique and specialized nature.
2.2 Selecting a Procedure.
This method includes five ballistic shock test procedures. See paragraph 2.3.4 for the “default” approach to ballisticshock testing when no field data are available.
a. Procedure I – Ballistic Hull and Turret (BH&T), Full Spectrum, Ballistic Shock Qualification.Replication of the shock associated with ballistic impacts on armored vehicles can be accomplished byfiring projectiles at a “Ballistic Hull and Turret” (BH&T) with the materiel mounted inside. Thisprocedure is very expensive and requires that an actual vehicle or prototype be available, as well asappropriate threat munitions. Because of these limitations, a variety of other approaches is oftenpursued. The variety of devices used to simulate ballistic shock is described in reference d.
b. Procedure II – Large Scale Ballistic Shock Simulator (LSBSS). Ballistic shock testing of completecomponents over the entire spectrum (10 Hz to 100 kHz) defined in table 522-I and on figure 522-1 canbe accomplished using devices such as the Large Scale Ballistic Shock Simulator (LSBSS) described inreference d. This approach is used for components weighing up to 500 Kg (1100 lbs), and isconsiderably less expensive than the BH&T approach of Procedure I.
Downloaded from http://www.everyspec.com on 2012-06-04T5:34:26.
MIL-STD-810F1 January 2000
METHOD 522522-4
c. Procedure III - Limited Spectrum, Light Weight Shock Machine (LWSM). Components weighing lessthan 113.6 kg (250 lbs) and shock mounted to eliminate sensitivity to frequencies above 3 kHz can betested over the spectrum from 10 Hz to 3 kHz of table 522-I and figure 522-1 using a MIL-S-901 LightWeight Shock Machine (LWSM) adjusted for 15 mm (0.59 inch) displacement limits. Use of the LWSMis less expensive than full spectrum simulation, and may be appropriate if the specific test item does notrespond to high frequency shock and cannot withstand the excessive low frequency response of the droptable (Procedure V).
d. Procedure IV - Limited Spectrum, Medium Weight Shock Machine (MWSM). Components weighingless than 2273 kg (5000 lbs) and not sensitive to frequencies above 1 kHz can be tested over thespectrum from 10 Hz to 1 kHz of table 522-I and figure 522-1 using a MIL-S-901 Medium WeightShock Machine (MWSM) adjusted for 15 mm (0.59 inch) displacement limits. Use of the MWSW maybe appropriate for heavy components and subsystems that are shock mounted and/or are not sensitive tohigh frequencies.
e. Procedure V - Drop Table. Light weight components (typically less than 18 kg (40 lbs)) which are shockmounted can often be evaluated for ballistic shock sensitivity at frequencies up to 500 Hz using a droptable. This technique often results in overtest at the low frequencies. The vast majority of componentsthat need shock protection on an armored vehicle can be readily shock mounted. The commonlyavailable drop test machine is the least expensive and most accessible test technique. The shock tableproduces a half-sine acceleration pulse that differs significantly from ballistic shock. The response ofmateriel on shock mounts can be enveloped quite well with a half-sine acceleration pulse if an overtest atlow frequencies and an undertest at high frequencies is acceptable. Historically, these shortcomings havebeen acceptable for the majority of ballistic shock qualification testing.
2.2.1 Procedure selection considerations.
Based on the test data requirements, determine which test procedure is applicable. In most cases, the selection of theprocedure will be dictated by the actual materiel configuration, carefully noting any gross structural discontinuitiesthat may serve to mitigate the effects of the ballistic shock on the materiel. In some cases, the selection of theprocedure will be driven by test practicality. Consider all ballistic shock environments anticipated for the materielduring its life cycle, both in its logistic and operational modes. When selecting procedures, consider:
a. The operational purpose of the materiel. From the requirements documents, determine the functions tobe performed by the materiel either during or after exposure to the ballistic shock environment.
b. The natural exposure circumstances for ballistic shock. The natural exposure circumstances for ballisticshock are based on well-selected scenarios from past experience and the chances of the occurrence ofsuch scenarios. For example, if an armored vehicle is subject to a mine blast, a number of assumptionsmust be made in order to select an appropriate test for the ballistic shock procedure. In particular, thesize of the mine, the location of major pressure wave impact, the location of the materiel relative to theimpact “point,” etc. If the armored vehicle is subject to non-penetrating projectile impact, the energyinput configuration will be different from that of the mine, as will be the effects of the ballistic shock onthe materiel within the armored vehicle. In any case, condition each scenario to estimate the materielresponse as a function of amplitude level and frequency content. It will then be necessary to decide towhich scenarios to test and which testing is most critical. Some scenario responses may “envelope”others, which may reduce the need for certain testing such as road, rail, gunfiring, etc. In test planning,do not break up any measured or predicted response to ballistic shock into separate amplitude and/orfrequency ranges utilizing different tests to satisfy one procedure.
c. Required data. The test data required to determine whether the operational purpose of the materiel hasbeen met.
d. Procedure sequence. Refer to paragraph 2.1.2.
Downloaded from http://www.everyspec.com on 2012-06-04T5:34:26.
MIL-STD-810F1 January 2000
METHOD 522522-5
2.2.2 Difference among procedures.
2.2.2.1 Procedure I - BH&T.
Ballistic shock is applied in its natural form using live fire testing. Test items are mounted in the BH&T thatreplicates the full-size vehicle in its “as designed” configuration and location. If required, “upweight” the vehicle toachieve proper dynamic response. Appropriate threats (type, distance, orientation) are successively fired at the hulland/or turret. This procedure is used to evaluate the operation of actual components, or the interaction betweenvarious components during actual ballistic impacts. Also, this procedure is used to determine actual shock levels forone particular engagement, which may be above or below the ‘default’ shock level specified in table 522-I.
2.2.2.2 Procedure II - LSBSS.
LSBSS is a low cost option for producing the spectrum of ballistic shock without the expense of live fire testing.This procedure is used primarily to test large, hard mounted components at the ‘default’ shock level specified intable 522-I. It produces shock over the entire spectrum (10 Hz to over 100,000 Hz), and is useful in evaluatingcomponents of unknown shock sensitivity.
2.2.2.3 Procedure III - LWSM.
Ballistic shock is simulated using a hammer impact. The test item is mounted on an anvil table of the shock machineusing the test item’s tactical mount. The anvil table receives the direct hammer impact, which replicates the lowerfrequencies of general threats to a hull or turret. This procedure is used to test shock mounted components (up to113.6 kg (250 lbs)), which are known to be insensitive to the higher frequency content of ballistic shock. Thisprocedure produces ‘partial spectrum’ testing (up to 3,000 Hz) at the ‘default’ level specified in table 522-I.
2.2.2.4 Procedure IV - MWSM.
Ballistic shock is simulated using a hammer impact. The test item is mounted on the anvil table of the shockmachine using the test item’s tactical mount. The anvil table receives the direct hammer impact, which replicates thelower frequencies of general threats to a hull or turret. This procedure is used to test components up to 2273 Kg(5000 lbs) in weight which are known to be insensitive to the higher frequencies of ballistic shock. This procedureproduces ‘partial spectrum’ testing (up to 1,000 Hz.) at the ‘default’ level specified in table 522-I.
2.2.2.5 Procedure V - Drop table.
Ballistic shock is simulated by the impact resulting from a drop. The test item is mounted on the table of acommercial drop machine using the test item’s tactical mounts. The table and test item are dropped from acalculated height. The table receives the direct blow at the impact surface, which approximates the lowerfrequencies of general threat to a hull or turret. This procedure is used for ‘partial spectrum’ testing of shockmounted components that can withstand an overtest at low frequencies.
2.3 Determine Test Levels and Conditions.
Having selected one of the five ballistic shock procedures (based on the materiel’s requirements documents and thetailoring process), complete the tailoring process by identifying appropriate parameter levels, applicable testconditions and applicable test techniques for that procedure. Exercise extreme care in consideration of the details inthe tailoring process. Base these selections on the requirements documents, the Life Cycle Environmental Profile,the Operational Environment Documentation (see Part One, figure 1-1), and information provided with this method.Consider the following basic information when selecting test levels.
2.3.1 General considerations - Terminology.
In general, response acceleration will be the experimental variable of measurement for ballistic shock. However, thisdoes not preclude other variables of measurement such as velocity, displacement, or strain from being measured andprocessed in an analogous manner, as long as the interpretation, capabilities, and limitations of the measurement
Downloaded from http://www.everyspec.com on 2012-06-04T5:34:26.
MIL-STD-810F1 January 2000
METHOD 522522-6
variable are clear. Pay particular attention to the high frequency environment generated by the ballistic attack, aswell as the capabilities of the measurement system to accurately record the materiel’s responses. For the purpose ofthis method, the terms that follow will be helpful in the discussion relative to analysis of response measurementsfrom ballistic shock testing.
a. Effective transient duration: The "effective transient duration" is the minimum length of time whichcontains all significant amplitude time history magnitudes beginning at the noise floor of theinstrumentation system just prior to the initial pulse, and proceeding to the point that the amplitude timehistory is a combination of measurement noise and substantially decayed structural response. In general,an experienced analyst is required to determine the pertinent measurement duration to define the ballisticshock event. The longer the duration of the ballistic shock, the more low frequency information ispreserved. The amplitude time history magnitude may be decomposed into several “shocks” withdifferent effective transient durations if it appears that the overall time history trace contains severalindependent “shock-like” events in which there is decay to near noise floor of the instrumentation systembetween events. Each event may be considered a separate shock.
b. Shock response spectrum analysis: Reference b defines the equivalent static acceleration maximaxShock Response Spectrum (SRS) and provides examples of SRS computed for classical pulses. The SRSvalue at a given undamped natural oscillator frequency, fn, is defined to be the absolute value of themaximum of the positive and negative acceleration responses of a mass for a given base input to adamped single degree of freedom system. The base input is the measured shock amplitude time historyover a specified duration (the specified duration should be the effective transient duration). To someextent, for processing of ballistic shock response data, the equivalent static acceleration maximax SRShas become the primary analysis descriptor. In this measurement description, the maximax equivalentstatic acceleration values are plotted on the ordinate with the undamped natural frequency of the singledegree of freedom system with base input plotted along the abscissa. Interpret the phrase “equivalentstatic acceleration” literally only for rigid lightweight components on isolation mounts.
2.3.2 Test conditions - Shock spectrum transient duration and scaling.
Derive the SRS and the effective transient duration, T, from measurements of the materiel’s response to a ballisticshock environment or, if available, from dynamically scaled measurements of a similar environment. Because of theinherent very high degree of randomness associated with the response to a ballistic shock, extreme care must beexercised in dynamically scaling a similar environment. For ballistic shock, there are no known scaling laws becauseof the sensitivity of the response to the size of the shock and the general configuration.
2.3.2.1 Measured data available from ballistic shock.
a. If measured data are available, the data may be processed utilizing the SRS. (The use of Fourier Spectra(FS) or the Energy Spectral Density (ESD) is not recommended, but may be of interest in special cases.)For engineering and historical purposes, the SRS has become the standard for measured data processing.In the discussion to follow, it will be assumed that the SRS is the processing tool. In general, themaximax SRS spectrum (equivalent static acceleration) is the main quantity of interest. With thisbackground, determine the shock response spectrum required for the test from analysis of the measuredenvironmental acceleration time history. After carefully qualifying the data, to make certain there are noanomalies in the amplitude time histories, according to the recommendations provided in reference a,compute the SRS. The analyses will be performed for Q = 10 at a sequence of natural frequencies atintervals of at least 1/12th octave spacing to span a frequency range consistent with the objective of theprocedure.
b. Because sufficient field data are rarely available for statistical analysis, an increase over the envelope ofthe available spectral data is sometimes used to establish the required test spectrum to account forvariability of the environment. The degree of increase is based upon engineering judgment and should besupported by rationale for that judgment. In these cases, it is often convenient to envelope the SRS bycomputing the maximax spectra over the sample spectra and proceed to add a +6 dB margin to the SRSmaximax envelope. NOTE: This approach does not apply to the default values in table 522-I.
Downloaded from http://www.everyspec.com on 2012-06-04T5:34:26.
MIL-STD-810F1 January 2000
METHOD 522522-7
2.3.2.2 Measured data not available from ballistic shock.
If a data base is not available for a particular configuration, use (carefully) configuration similarity and anyassociated measured data for prescribing a ballistic shock test. Because of the sensitivity of the ballistic shock to thesystem configuration and the wide variability inherent in ballistic shock measurements, use caution in determininglevels. Table 522-I and figure 522-1 give ‘default’ values for expected ballistic shock levels when no fieldmeasurement results are available.
2.3.3 Ballistic shock qualification - Procedure I.
Ballistic Shock Qualification - Procedure I is different from the other ballistic shock methods in that the shock levelsare unknown until each particular shot (threat munition, attack angle, impact point, armor configuration, etc.) hasbeen fired and measurements have been made. The shock levels are determined by the interaction of the threatmunition and the armor as well as by the structure of the vehicle. Although the levels cannot be specified inadvance, this technique produces the most realistic shock levels.
2.3.4 Ballistic shock qualification - Procedures II-IV.
For Ballistic Shock Procedures II-IV, subject the test item to the appropriate ballistic shock level a minimum of threetimes in the axis of orientation of greatest shock sensitivity (i.e., the worst direction). Perform a functionalverification of the component during/after each test. For frequencies above 1 kHz, many ballistic shock eventsproduce similar shock levels in all three axes. If shock levels are known from previous measurements, the shocktesting can be tailored appropriately. If shock measurements are not available, use steps a-g outlined below.
a. Ensure the test item remains in place and that it continues to function during and following shocks thatare at or below the average shock level specified in table 522-I. The test item must also remain in placeand continue to function following shocks that are at or below the worst case shock level specified intable 522-I. Ensure materiel critical to crew survival (e.g., fire suppression systems) continues tofunction during and following the worst case shock.
b. Mount the transducers used to measure the shock on the structure as near as possible to the structuremount. Take triaxial measurements at this location. If triaxial measurements are not practical, make asmany uniaxial measurements as is practical.
c. Analyze the shock measurements in the time domain, as well as the frequency domain. Calculate theSRS using a damping ratio of 5 percent of critical damping (Q = 10); calculate the SRS using at least 12frequencies per octave, proportionally spaced in the region from 10 Hz to 10 kHz (e.g., 120 frequenciesspaced at approximately 10, 10.59, 11.22, 11.89, 12.59, ….8414, 8913, 9441, 10,000 Hz).
d. For a test shock to be considered an acceptable simulation of the requirement, 90 percent of the points inthe region from 10 Hz to 10 kHz must fall within the bounds listed in table 522-II.
e. If more than 10 percent of the SRS points in the region from 10 Hz to 10 kHz are above the upper bound,an overtest has occurred (code Red). If more than 90 percent of the SRS points lie between the upperand lower bounds, the desired qualification test has occurred (code Yellow). If none of the above occurs,and more than 10 percent of the points are below the lower bound, an undertest has occurred (codeGreen).
f. If the test item or its mount fails during a code Yellow or code Green shock test, redesign the materieland/or its mount to correct the deficiency.
g. Retest the redesigned materiel and/or its mount following the above procedure.
Downloaded from http://www.everyspec.com on 2012-06-04T5:34:26.
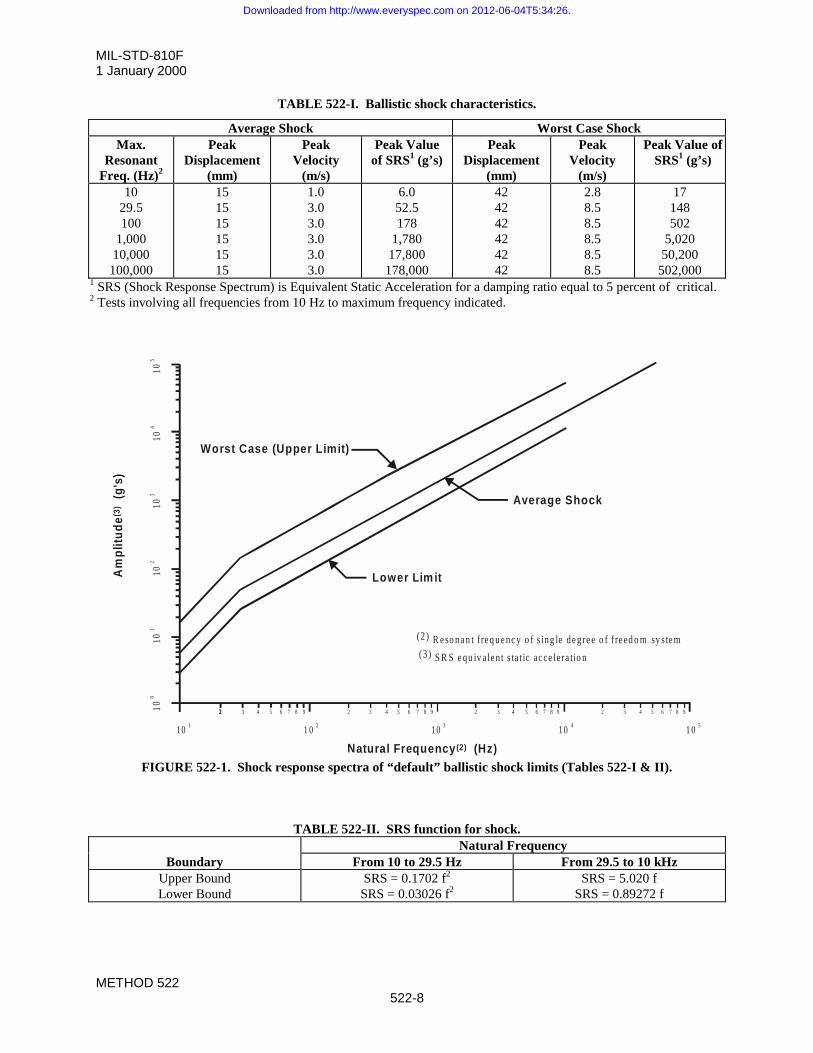
MIL-STD-810F1 January 2000
METHOD 522522-8
TABLE 522-I. Ballistic shock characteristics.
Average Shock Worst Case ShockMax.
ResonantFreq. (Hz)2
PeakDisplacement
(mm)
PeakVelocity
(m/s)
Peak Valueof SRS1 (g’s)
PeakDisplacement
(mm)
PeakVelocity
(m/s)
Peak Value ofSRS1 (g’s)
1029.5100
1,00010,000
100,000
151515151515
1.03.03.03.03.03.0
6.052.5178
1,78017,800
178,000
424242424242
2.88.58.58.58.58.5
17148502
5,02050,200
502,0001 SRS (Shock Response Spectrum) is Equivalent Static Acceleration for a damping ratio equal to 5 percent of critical.2 Tests involving all frequencies from 10 Hz to maximum frequency indicated.
FIGURE 522-1. Shock response spectra of “default” ballistic shock limits (Tables 522-I & II).
TABLE 522-II. SRS function for shock.Natural Frequency
Boundary From 10 to 29.5 Hz From 29.5 to 10 kHzUpper BoundLower Bound
SRS = 0.1702 f2
SRS = 0.03026 f2SRS = 5.020 f
SRS = 0.89272 f
105
104
103
102
101
100
1 01
2 3 4 5 6 7 8 9
1 02
1 03
1 04
1 05
Am
plit
ud
e (
g's)
(3)
Natural Frequency (Hz)(2)
22 2 3 4 5 6 7 8 9 2 3 4 5 6 7 8 9 2 3 4 5 6 7 8 9
Worst Case (Upper Limit)
Average Shock
Lower Lim it
(2 ) R e so na n t f re q ue nc y o f s ing le de gre e o f f re ed o m sy s te m(3) S R S e qu iv ale n t s ta tic ac ce lera tio n
Downloaded from http://www.everyspec.com on 2012-06-04T5:34:26.
MIL-STD-810F1 January 2000
METHOD 522522-9
2.4 Test Item Configuration.
a. General. See Part One, paragraph 5.8.
b. Specific to this method. Configure the test item for ballistic shock as would be anticipated during serviceincluding particular attention to the details of the mounting of the materiel to the platform.
3. INFORMATION REQUIRED.
3.1 Pretest.
The following information is required to conduct a ballistic test adequately.
a. General. Information listed in Part One, paragraphs 5.7 and 5.9, and Appendix A, Task 405 of thisstandard.
b. Specific to this method.
(1) Type of ballistic shock test device.
(2) Means of initiation of the ballistic shock test device.
(3) Duration of the ballistic shock.
(4) General materiel configuration including measurement locations on or near the materiel.
(5) Test system (test item/platform configuration) detailed configuration including:
(a) location of the ballistic shock test device;(b) location of the materiel;(c) the structural path between the ballistic shock device and the materiel, and any general coupling
configuration of the ballistic shock device to the platform and the platform to the materielincluding the identification of structural joints.
3.2 During Test.
a. General. Information listed in Part One, paragraphs 5.10, and in Part One, Appendix A, Tasks 405 and406 of this standard.
b. Specific to this method.
(1) For test validation purposes, record deviations from planned or pre-test procedures or parameterlevels, including any procedural anomalies that may occur. (See Part One, paragraph 5.10.)
(2) Damage to the test device or test fixture that may result in a variation of input test levels andpreclude further testing until replaced or repaired.
3.3 Post-test.
Record the following post-test information.
a. General. Information listed in Part One, paragraph 5.13 and in Appendix A, Tasks 405 and 406 of thisstandard.
b. Specific to this method.
(1) Duration of each exposure as recorded by an instrumented test fixture or test item, and the number ofspecific exposures.
(2) Any data measurement anomalies, e.g., high instrumentation noise levels, loss of sensors or sensormounting as a result of testing, etc.
Downloaded from http://www.everyspec.com on 2012-06-04T5:34:26.
MIL-STD-810F1 January 2000
METHOD 522522-10
4. TEST PROCESS.
4.1 Test Facility.
Reference d describes four useful devices for ballistic shock testing. The most common is perhaps the drop tableshock test machine utilized for shock testing of small items. For larger items that are sensitive to high frequencyshock, higher frequency content and can only tolerate limited displacement, the Light Weight Shock Machine(LWSM) and Medium-Weight Shock Machine (MWSM) specified in MIL-S-901 can be useful tools for ballisticshock simulation. For large items, the Large Scale Ballistic Shock Simulator (LSBSS) utilizes an explosive chargeto drive a plate to which the materiel is mounted.
a. A BH&T device is the armor shell of a vehicle. It must contain the actual, fully functional, vehiclearmor, but may not have an operational engine, suspension, gun, tracks, etc. The number of functionalcomponents and total weight of the BH&T device are adjusted to meet the requirements of eachindividual test effort.
b. The LSBSS is a 22,700 kg (25-ton) structure that uses high explosives and hydraulic pressure to simulatethe shock experienced by armored vehicle components and materiel (up to 500 kg (1100 lbs)) caused bythe impact of enemy projectiles.
c. The MIL-S-901 Light Weight Shock Machine uses a 182 kg (400-lb) hammer to impact an anvil platecontaining the test item. Hammer drops of 1 foot, 3 feet, and 5 feet are used from two directions in threeaxes if the worst case axis is unknown. If the worst case axis is known and agreed, it is only necessary totest in the worst case axis.
d. The MIL-S-901 Medium-Weight Shock Machine uses a 1360 kg (3000-lb) hammer to impact an anviltable containing the test item. Hammer height is a function of the weight on the anvil table (test item andall fixturing), and is specified in table I of MIL-S-901.
e. Drop tables typically have a mounting surface for the test item on an ‘anvil’ that is dropped from aknown height. In some machines, the anvil is accelerated by an elastic rope, hydraulic, or pneumaticpressure to reach the desired impact velocity. The duration and shape (half-sine or saw tooth) of theimpact acceleration pulse are determined by a ‘programmer’ (elastic pad or hydro-pneumatic device),which in turn determines the frequency content of the shock.
4.2 Controls.
a. For shock-mounted components, it is often necessary to determine the transfer function of the shockmounting system. Typically, a ‘dummy weight’ of the appropriate mass and center of gravity is mountedin place of the test item and subjected to full level shocks. The input shock and test item responses aremeasured to verify performance of the shock mounts. Once shock mount performance has been verified,evaluation of an operational test item can begin.
b. Prior to subjecting the test item to the full level shock, a variety of ‘preparation’ shocks are typicallyperformed. For Procedure I (BH&T), a low level ‘instrumentation check’ round is normally fired priorto shooting actual threat ammunition. A typical ‘instrumentation check’ round would be 4 to 16 oz. ofexplosive detonated 1 to 18 inches from the outer armor surface, and would usually produce no morethan 10% of the shock expected from threat munition. For Procedure II (LSBSS), a low-levelinstrumentation check shot is usually fired prior to full level testing. For Procedure III (MIL-S-901LWSM), the 1 foot hammer blow is normally used to check instrumentation, and any measurementproblems are resolved prior to 3-foot and 5-foot hammer drops. For Procedure IV (MIL-S-901 MWSM),use the ‘Group 1’ hammer height for the instrumentation check. A similar approach is used on ProcedureV, whereby a low-level drop is used to check instrumentation before conducting the full level shock.
c. For calibration and test tolerance procedures, review the guidance provided in Part One, paragraphs 5.3.2and 5.2, respectively.
Downloaded from http://www.everyspec.com on 2012-06-04T5:34:26.
MIL-STD-810F1 January 2000
METHOD 522522-11
4.3 Instrumentation.
Acceleration or velocity measurement techniques that have been validated in shock environments containing the highlevel, high frequency shock that characterizes ballistic shock must be used. See reference e for details. In general,ballistic shock measurements require the use of at least two different measurement technologies to cross check eachother for validity. In addition, the frequency spectrum of ballistic shock content is generally so wide (10 Hz to morethan 100,000 Hz) that no single transducer can make valid measurements over the entire spectrum. This broad timefrequency environment provides a challenge to calibration of measurement sensors and any tolerances provided inthe test plan.
4.4 Data Analysis.
Detailed analysis procedures for evaluation of the problems peculiar to ballistic shock measurement have not beenestablished. Many (but not all) of the techniques described in reference a. are appropriate.
4.5 Test Execution.
4.5.1 Preparation for test.
4.5.1.1 Preliminary steps.
Prior to initiating any testing, review pretest information in the test plan to determine test details (e.g., procedures,test item configuration, ballistic shock levels, number of ballistic shocks):
a. Choose the appropriate test procedure.
b. If the ballistic shock is a calibrated test, determine the appropriate ballistic shock levels for the test priorto calibration.
c. Ensure the ballistic shock signal conditioning and recording devices have adequate amplitude range andfrequency bandwidth. It may be difficult to estimate a peak signal and arrange the instrumentationappropriately. In general there is no data recovery from a clipped signal. However, for over-rangedsignal conditioning, it is usually possible to acquire meaningful results for a signal 20 dB above the noisefloor of the measurement system. In some cases, redundant measurements may be appropriate - onemeasurement being over-ranged and one measurement ranged at the best estimate for the peak signal.The frequency bandwidth of most recording devices is usually readily available, but ensure that recordingdevice input filtering does not limit the signal frequency bandwidth.
4.5.1.2 Pretest checkout.
All items require a pretest checkout at standard ambient conditions to provide baseline data. Conduct the checkoutas follows:
Step 1. Conduct a complete visual examination of the test item with special attention to any micro electroniccircuitry areas. Pay particular attention to its platform mounting configuration and potential stresswave transmission paths.
Step 2. Document the results.Step 3. Where applicable, install the test item in its test fixture.Step 4. Conduct an operational checkout in accordance with the approved test plan along with simple tests
for ensuring the measurement system is responding properly.Step 5. Document the results for comparison with test data.Step 6. If the test item operates satisfactorily, proceed to the first test. If not, resolve the problem and restart
at Step 1.Step 7. Remove the test item and proceed with the calibration.
Downloaded from http://www.everyspec.com on 2012-06-04T5:34:26.
MIL-STD-810F1 January 2000
METHOD 522522-12
4.5.2 Procedures.
The following procedures provide the basis for collecting the necessary information concerning the platform and testitem under ballistic shock. Since one of four or more ballistic shock devices may be employed, the instructionsbelow must be consistent with the ballistic shock device selected.
4.5.2.1 Procedure I – BH&T.
Step 1. Select the test conditions and mount the test item in a Ballistic Hull and Turret (BH&T), that mayrequire ‘upweighting’ to achieve the proper dynamic response. (In general, there will be nocalibration when actual hardware is used in this procedure). Select measurement techniques thathave been validated in ballistic shock environments. See reference e for examples.
Step 2. Perform a functional check on the test item.Step 3. Fire threat munitions at the BH&T and verify that the test item functions as required. Typically,
make shock measurements at the mounting location (‘input shock’) and on the test item (‘test itemresponse’).
Step 4. Record necessary data for comparison with pretest data.Step 5. Photograph the test item as necessary to document damage.Step 6. Perform a functional check on the test item. Record performance data.
4.5.2.2 Procedure II - LSBSS.
Step 1. Mount the test item to the LSBSS using the same mounting hardware as would be used in the actualarmored vehicle. Select the orientation of the test item with the intent of producing the largest shockin the ‘worst case’ axis.NOTE: A ‘dummy’ test item is typically mounted until measurements confirm that the properexplosive ‘recipe’ (i.e., combination of explosive weight, stand-off distance, and hydraulicdisplacement) has been determined to obtain the shock levels specified in table 522-I and on figure522-1. Then mount an operational test item to the LSBSS.
Step 2. Fire the LSBSS and verify the test item is functioning as required before, during, and after the shot.Step 3. Record initial data for comparison with post test data.Step 4. Fire three test shots at the shock level specified in table 522-I.Step 5. Inspect the test item; photograph any noted damage, and record data for comparison with pretest
data.
4.5.2.3 Procedure III - LWSM
Step 1. Modify the mounting for the anvil plate to restrict total travel (including dynamic plate deformation)to 15 mm (0.59 inch). Mount the test item to the LWSM using the same mounting hardware aswould be used in an actual armored vehicle. Choose the orientation of the test item with the intent ofproducing the largest shock in the ‘worst case’ axis.
Step 2. Perform a pretest checkout and record data for comparison with post test data.NOTE: Typically, make shock measurements at the ‘input’ location to ensure that the low frequencyshock levels specified in table 522-I and on figure 522-1 have been attained on the 5-foot drop.
Step 3. Perform a 1 foot hammer drop followed by a performance check; record data.Step 4. Perform a 3-foot hammer drop followed by a performance check; record data.Step 5. Perform a 5-foot hammer drop followed by a performance check; record data.Step 6. Repeat Step 5 two more times.Step 7. If the worst case axis is unknown (see paragraph 4.1c), repeat steps 2-6 for each direction of each
axis for a total of 18 five-foot hammer drops.
4.5.2.4 Procedure IV - MWSM
Step 1. Modify the supports for the anvil table (by shimming the 4 table lifts) to restrict table total travel(including dynamic plate deformation) to 15 mm (0.59) inch.
Step 2. Mount the test item to the MWSM using the same mounting hardware as would be used in an actualcombat vehicle. Choose the orientation of the test item with the intent of producing the largest shockin the ‘worst case’ axis (see Step 7 below).
Downloaded from http://www.everyspec.com on 2012-06-04T5:34:26.
MIL-STD-810F1 January 2000
METHOD 522522-13
Step 3. Perform a pretest checkout and record data for comparison with post test data.NOTE: Typically, make shock measurements at the ‘input’ location to ensure that the low-frequencyshock levels specified in table 522-I and on figure 522-1 have been attained on the ‘Group III’ drop(from MIL-S-901).
Step 4. Perform a ‘Group I height’ hammer drop followed by a performance check; record data.Step 5. Perform a ‘Group III height’ hammer drop followed by a performance check; record data.Step 6. Repeat Step 5 two more times.Step 7. If the worst case axis is unknown (see paragraph 4.1c), repeat steps 2-6 for each direction of each
axis for a total of 18 hammer drops at the Group III height.
4.5.2.5 Procedure V - Drop table.
Step 1. Calculate the expected response of a shock mounted test item (or measurements from field tests maybe used) and calculate a shock response spectra (SRS). Choose a half-sine acceleration pulse whoseSRS ‘envelopes’ the expected response of the shock mounted item. Note that this approach typicallyresults in an overtest at the lowest frequencies.
Step 2. Hard mount the test item to the drop table.Step 3. Conduct a performance check and record data for comparison with post test data.Step 4. Test using the appropriate half sine acceleration pulse three times in each direction of all three axes
(18 drops).Step 5. Conduct a performance check and record data for comparison with pretest data.
5. ANALYSIS OF RESULTS.
In addition to the guidance provided in Part One, paragraphs 5.14 and 5.17, and in Part One, Appendix A, Tasks 405and 406, the following information is provided to assist in the evaluation of the test results. Analyze any failure of atest item to meet the requirements of the system specifications, and consider related information. Carefully evaluateany failure in the structural configuration of the test item, e.g., mounts, that may not directly impact failure of thefunctioning of the materiel but that would lead to failure in its service environment conditions.
6. REFERENCE/RELATED DOCUMENTS.
a. Handbook for Dynamic Data Acquisition and Analysis, IES-RP-DTE012.1, Institute of EnvironmentalSciences, 940 East Northwest Highway, Mount Prospect, Illinois 60056
b. Kelly, Ronald D. and George Richman, “Principles and Techniques of Shock Data Analysis,” The Shockand Vibration Information Center, SVM-5, United States Department of Defense.
c. Walton, W. Scott and Joseph Bucci, “The Rationale for Shock Specification and Shock Testing ofArmored Ground Combat Vehicles”, Proceedings of the 65th Shock and Vibration Symposium, VolumeI, October 1994, pp. 285-293.
d. Walton, W. Scott, “Ballistic Shock Simulation Techniques for Testing Armored Vehicle Components”,Proceedings of the 64th, Shock and Vibration Symposium, Volume I, October 1993, pp. 237-246.
e. Walton, W. Scott, “Pyroshock Evaluation of Ballistic Shock Measurement Techniques”, Proceedings ofthe 62nd Shock and Vibration Symposium, Volume 2, pp. 422-431, October 1991.
f. MIL-S-901, “Shock Tests, H.I. (High Impact), Shipboard Machinery, Equipment, and Systems,Requirements for.”
Downloaded from http://www.everyspec.com on 2012-06-04T5:34:26.

MIL-STD-810F1 January 2000
METHOD 522522-14
THIS PAGE INTENTIONALLY BLANK
Downloaded from http://www.everyspec.com on 2012-06-04T5:34:26.
MIL-STD-810F1 January 2000
METHOD 523.2523.2-1
METHOD 523.2
VIBRO-ACOUSTIC/TEMPERATURE
NOTE: Tailoring is essential. Select methods, procedures, and parameter levels based on the tailoring processdescribed in Part One, paragraph 4, and Appendix C. Apply the general guidelines for laboratory test methodsdescribed in Part One, paragraph 5 of this standard.
1. SCOPE.
1.1 Purpose.
The vibro-acoustic/temperature procedure is performed to determine the synergistic effects of vibration, acousticnoise, and temperature on externally carried aircraft stores during captive carry flight. Such determination may beuseful for, but not restricted to the following purposes:
a. To reveal and correct design weaknesses (Test, Analyze and Fix (TAAF) test).
b. To determine whether a design meets a specified reliability requirement (Reliability Demonstration test).
c. To reveal workmanship or component defects before a production unit leaves the place of assembly(Screening test).
d. To estimate the Mean Time Between Failure (MTBF) of a lot of units based upon the test item’s time tofailure of a small sample of the units (Lot Acceptance test).
e. To determine the relative reliability among units based upon the test item’s time to failure of a smallsample of the units (Source Comparison test).
1.2 Application.
For captively carried stores, this method is intended primarily to test electronics and other electro-mechanicalassemblies within the store for functionality in a vibro-acoustic/temperature environment. As an incidental part ofthe testing, thermal variation may induce changes in moisture exposure of the store and the effects of such exposuremust be noted when interpreting the test result data. Typical applications include:
a. development of a more reliable store design prior to production.
b. assessment of the potential for satisfaction of the reliability requirement for a store.
c. manufacturer’s internal testing to assure delivery of reliable units during production.
d. determination of the acceptance of a lot prior to delivery.
e. determination of the relative differences in quality from two sources for establishing production buyproportions.
1.3 Limitations.
This method is not intended to provide for:
a. An environmental design qualification test of a store or any of its individual components forfunctionality. (For such testing see method 500.4, Altitude; method 501.4, High Temperature; method502.4, Low Temperature; method 503.4, Temperature Shock; method 507.4, Humidity; method 513.5,Acceleration; method 514.5, Vibration; method 515.5, Acoustic Noise; method 516.5, Shock; method517, Pyroshock; and method 520.2, Temperature, Humidity, Vibration, Altitude).
b. An environmental design qualification test of a store airframe or other structural components forstructural integrity.
Downloaded from http://www.everyspec.com on 2012-06-04T5:34:26.
MIL-STD-810F1 January 2000
METHOD 523.2523.2-2
c. Any test to satisfy the requirements of the Life Cycle Profile except that for the combined vibration,acoustic, and temperature environments related to reliability testing.
2. TAILORING GUIDANCE.
2.1 Selecting the Vibro-Acoustic/Temperature Method.
After examining requirements documents and applying the tailoring process in Part One of this standard to determinewhere the vibro-acoustic/temperature environments are anticipated in the life cycle of the materiel, use the followingto confirm the need for this method and to place it in sequence with other methods.
2.1.1 Effects of the vibro-acoustic/temperature environment.
Possible effects of a combination of vibration, acoustic noise, and temperature include all effects that these factorscan cause separately (see methods 514.5, 515.5, and 520.2). In addition, increased stress as a result of moisture fromthermal change may produce possible effects seen in methods 501.4, 502.4, 503.4, and 507.4. The combinedvibration, acoustic noise, and temperature environments may interact to produce effects that would not occur in anysingle environment or a lesser combination of environments. Items in the discussion to follow point to significanteffect mechanisms applicable to this method.
2.1.1.1 Relative importance of environmental stresses.
Not all environmental stresses contribute equally to materiel deterioration or failure. Analysis of service-use failurescaused by aircraft environmental stress on the store (reference a) has identified the following four most importantcauses of failure:
a. loading of the store through captive carriage,
b. temperature,
c. vibration, and
d. moisture.
2.1.1.2 Other environmental stresses.
Consider the inclusion of other environmental stresses that may be important for particular materiel. In general, it isnot appropriate to include comparatively rare occurrences of extreme stress levels that are better quantified in singleenvironment methods described elsewhere in this standard. A general guideline for this determination for anindividual stress is that, if a stress has a “fraction of time of occurrence” (FTO) less than 0.1 (10%) of the total timespecified for the store’s MTBF, the condition may be considered too rare to be included in a test described by thismethod. In evaluating FTO, consider all in-service use environments and use the more severe of the two. Note thatthe term FTO is used here in place of the more traditional probability of occurrence. FTO is defined for a level ofstress as the ratio of the time the store is under the stress condition divided by the total time of observation, e.g., thestore’s mean time between failure. Probability of occurrence relates to the chances a stress event will occur and maynot relate directly to a single specific time interval. FTO can be shown to provide an estimate of the probabilitydistribution of the level of stress and is a more precise term. A simple example of this difference is as follows: If thestress condition is the absolute value of the acceleration at a point in the store that is above 5g’s, the FTO is easilyestablished from an auto-spectral density (ASD) estimate over a specified time interval. This implies a stationaryGaussian time history with zero mean and standard deviation as the square root of the area under the ASD estimate. The probability of occurrence relates to the number of times the 5g level is exceeded, but the total time above 5gmay vary from one occurrence to the next, depending on the difference in ASD estimates and on the associatedduration of each of the stationary Gaussian ASD estimates.
2.1.1.3 Operation.
Operating any materiel item produces stress that can cause failure. In the case of external aircraft stores, operationgenerally means providing full electrical power, which produces both thermal, electromagnetic, and electrochemicalstress. Duty cycles (on/off), low and high voltage, power ripple, and voltage spikes may also be significant stresses. Even when the stress of operation is negligible, it is necessary to operate the materiel under test to detect the
Downloaded from http://www.everyspec.com on 2012-06-04T5:34:26.
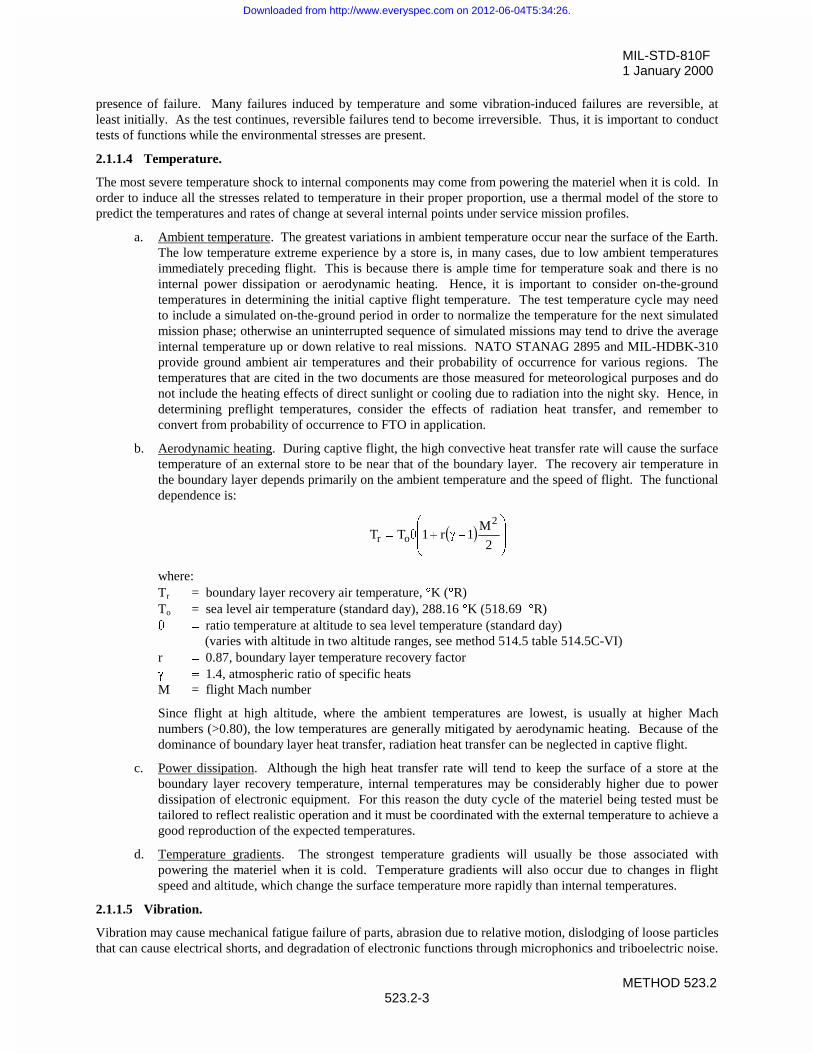
MIL-STD-810F1 January 2000
METHOD 523.2523.2-3
presence of failure. Many failures induced by temperature and some vibration-induced failures are reversible, atleast initially. As the test continues, reversible failures tend to become irreversible. Thus, it is important to conducttests of functions while the environmental stresses are present.
2.1.1.4 Temperature.
The most severe temperature shock to internal components may come from powering the materiel when it is cold. Inorder to induce all the stresses related to temperature in their proper proportion, use a thermal model of the store topredict the temperatures and rates of change at several internal points under service mission profiles.
a. Ambient temperature. The greatest variations in ambient temperature occur near the surface of the Earth.The low temperature extreme experience by a store is, in many cases, due to low ambient temperaturesimmediately preceding flight. This is because there is ample time for temperature soak and there is nointernal power dissipation or aerodynamic heating. Hence, it is important to consider on-the-groundtemperatures in determining the initial captive flight temperature. The test temperature cycle may needto include a simulated on-the-ground period in order to normalize the temperature for the next simulatedmission phase; otherwise an uninterrupted sequence of simulated missions may tend to drive the averageinternal temperature up or down relative to real missions. NATO STANAG 2895 and MIL-HDBK-310provide ground ambient air temperatures and their probability of occurrence for various regions. Thetemperatures that are cited in the two documents are those measured for meteorological purposes and donot include the heating effects of direct sunlight or cooling due to radiation into the night sky. Hence, indetermining preflight temperatures, consider the effects of radiation heat transfer, and remember toconvert from probability of occurrence to FTO in application.
b. Aerodynamic heating. During captive flight, the high convective heat transfer rate will cause the surfacetemperature of an external store to be near that of the boundary layer. The recovery air temperature inthe boundary layer depends primarily on the ambient temperature and the speed of flight. The functionaldependence is:
� �¸¸
¹
·
¨¨
©
§�J�T
2
M1r1TT
2
or
where:Tr = boundary layer recovery air temperature, qK (qR)To = sea level air temperature (standard day), 288.16 qK (518.69 qR)T ratio temperature at altitude to sea level temperature (standard day)
(varies with altitude in two altitude ranges, see method 514.5 table 514.5C-VI)r 0.87, boundary layer temperature recovery factorJ 1.4, atmospheric ratio of specific heatsM = flight Mach number
Since flight at high altitude, where the ambient temperatures are lowest, is usually at higher Machnumbers (>0.80), the low temperatures are generally mitigated by aerodynamic heating. Because of thedominance of boundary layer heat transfer, radiation heat transfer can be neglected in captive flight.
c. Power dissipation. Although the high heat transfer rate will tend to keep the surface of a store at theboundary layer recovery temperature, internal temperatures may be considerably higher due to powerdissipation of electronic equipment. For this reason the duty cycle of the materiel being tested must betailored to reflect realistic operation and it must be coordinated with the external temperature to achieve agood reproduction of the expected temperatures.
d. Temperature gradients. The strongest temperature gradients will usually be those associated withpowering the materiel when it is cold. Temperature gradients will also occur due to changes in flightspeed and altitude, which change the surface temperature more rapidly than internal temperatures.
2.1.1.5 Vibration.
Vibration may cause mechanical fatigue failure of parts, abrasion due to relative motion, dislodging of loose particlesthat can cause electrical shorts, and degradation of electronic functions through microphonics and triboelectric noise.
Downloaded from http://www.everyspec.com on 2012-06-04T5:34:26.
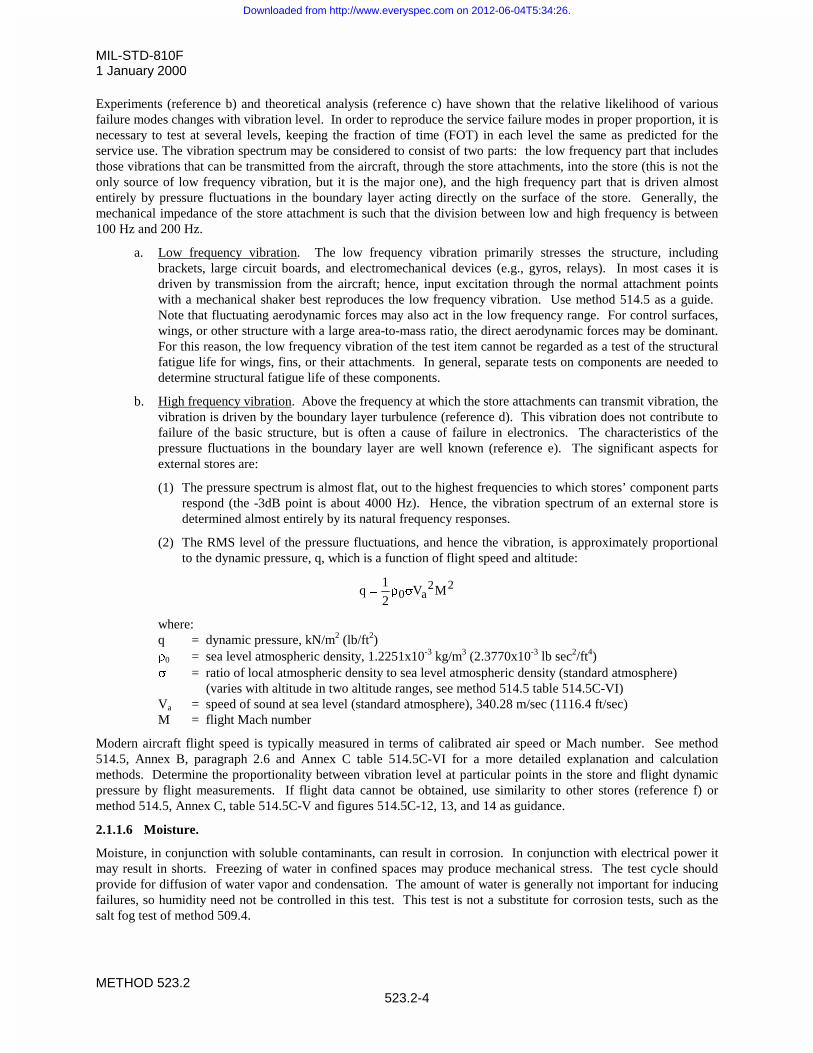
MIL-STD-810F1 January 2000
METHOD 523.2523.2-4
Experiments (reference b) and theoretical analysis (reference c) have shown that the relative likelihood of variousfailure modes changes with vibration level. In order to reproduce the service failure modes in proper proportion, it isnecessary to test at several levels, keeping the fraction of time (FOT) in each level the same as predicted for theservice use. The vibration spectrum may be considered to consist of two parts: the low frequency part that includesthose vibrations that can be transmitted from the aircraft, through the store attachments, into the store (this is not theonly source of low frequency vibration, but it is the major one), and the high frequency part that is driven almostentirely by pressure fluctuations in the boundary layer acting directly on the surface of the store. Generally, themechanical impedance of the store attachment is such that the division between low and high frequency is between100 Hz and 200 Hz.
a. Low frequency vibration. The low frequency vibration primarily stresses the structure, includingbrackets, large circuit boards, and electromechanical devices (e.g., gyros, relays). In most cases it isdriven by transmission from the aircraft; hence, input excitation through the normal attachment pointswith a mechanical shaker best reproduces the low frequency vibration. Use method 514.5 as a guide. Note that fluctuating aerodynamic forces may also act in the low frequency range. For control surfaces,wings, or other structure with a large area-to-mass ratio, the direct aerodynamic forces may be dominant.For this reason, the low frequency vibration of the test item cannot be regarded as a test of the structuralfatigue life for wings, fins, or their attachments. In general, separate tests on components are needed todetermine structural fatigue life of these components.
b. High frequency vibration. Above the frequency at which the store attachments can transmit vibration, thevibration is driven by the boundary layer turbulence (reference d). This vibration does not contribute tofailure of the basic structure, but is often a cause of failure in electronics. The characteristics of thepressure fluctuations in the boundary layer are well known (reference e). The significant aspects forexternal stores are:
(1) The pressure spectrum is almost flat, out to the highest frequencies to which stores’ component partsrespond (the -3dB point is about 4000 Hz). Hence, the vibration spectrum of an external store isdetermined almost entirely by its natural frequency responses.
(2) The RMS level of the pressure fluctuations, and hence the vibration, is approximately proportionalto the dynamic pressure, q, which is a function of flight speed and altitude:
22a0 MV
2
1q VU
where:q = dynamic pressure, kN/m2 (lb/ft2)U0 = sea level atmospheric density, 1.2251x10⁻³ kg/m3 (2.3770x10⁻³ lb sec2/ft4)V = ratio of local atmospheric density to sea level atmospheric density (standard atmosphere)
(varies with altitude in two altitude ranges, see method 514.5 table 514.5C-VI)Va = speed of sound at sea level (standard atmosphere), 340.28 m/sec (1116.4 ft/sec)M = flight Mach number
Modern aircraft flight speed is typically measured in terms of calibrated air speed or Mach number. See method514.5, Annex B, paragraph 2.6 and Annex C table 514.5C-VI for a more detailed explanation and calculationmethods. Determine the proportionality between vibration level at particular points in the store and flight dynamicpressure by flight measurements. If flight data cannot be obtained, use similarity to other stores (reference f) ormethod 514.5, Annex C, table 514.5C-V and figures 514.5C-12, 13, and 14 as guidance.
2.1.1.6 Moisture.
Moisture, in conjunction with soluble contaminants, can result in corrosion. In conjunction with electrical power itmay result in shorts. Freezing of water in confined spaces may produce mechanical stress. The test cycle shouldprovide for diffusion of water vapor and condensation. The amount of water is generally not important for inducingfailures, so humidity need not be controlled in this test. This test is not a substitute for corrosion tests, such as thesalt fog test of method 509.4.
Downloaded from http://www.everyspec.com on 2012-06-04T5:34:26.
MIL-STD-810F1 January 2000
METHOD 523.2523.2-5
2.1.1.7 Shock.
Shock can cause failure through mechanical stress similar to that induced by vibration. Shocks that are more nearlytransient vibrations (many zero crossings), such as aircraft catapult and arrested landing shock, may be included inthis test. Short duration shocks such as pyrotechnic shocks associated with store or sub-munition launch, flightsurface deployment, etc., are generally too difficult to reproduce at the store level. Ensure that these events that arepotentially destructive to electronics are accounted for in other analyses and tests. (See method 517, Pyroshock, andmethod 516.5, Shock.) Analysis may show that the vibration of the test dominates the shock and in that sense theshock may be regarded as covered by the test. (See method 516.5, Shock.)
2.1.1.8 Altitude.
Barometric pressure is generally not a stress for external stores. However, variation in pressure may enhance thepenetration by moisture. Reduced pressure may increase the temperature due to reduced power dissipation and theremay be increased electrical arcing. Test separately for resistance to arcing. Moisture penetration will generally takeplace without pressure variation and, in most cases, the amount of water entrained is not important so long as it isenough to provide internal condensation. Reduced heat transfer may be realized by restricting air circulation ratherthan reducing ambient pressure. In general, altitude simulation is not needed in this test.
2.1.1.9 Other environments.
Although this method is intended primarily to reproduce the environmental stresses associated with the captive flightof external stores, it can be extended to include other phases of a store's life cycle provided the relative duration ofthose phases can be related to captive flight. For example, periods of shock and vibration representing transportationand handling have been included in some tests. Do not use environments in this test that are not expected to producefailures randomly distributed in time. For example, corrosive atmospheres and fungal growth are environments inwhich failures, if any, will occur only after a considerable time lapse. Store ejection shock, sand and dust, and waterimmersion are examples of environments for which failure either occurs or does not; these failures are associatedwith the event rather than being distributed in time. These environments are not appropriate for this method. Care isrequired in deciding which environments to include. For example, consider the case of a store that ejects sub-munitions, flares, chaff, or other items. In this case there will be a series of shock events that may be an importantpart of the continuing operational store environment. This may also result in open cavities in the store’s externalsurface resulting in high intensity cavity noise for long periods.
2.1.2 Sequence among other methods.
a. General. See Part One, paragraph 5.5.
b. Specific to this method. This method applies to environmental stress occurring in the final phases of thestore’s environmental life cycle. When a single test item is subjected to this test and other environmentaltests of this standard, perform this test after the tests representing earlier phases of the life cycle, butbefore tests representing store ejection/launch, free flight, target impact, etc.
2.2 Selecting a Procedure.
This method includes one test procedure that may be tailored to many test requirements.
2.3 Determination of Test Levels and Conditions.
Having selected this method, complete the tailoring process by identifying appropriate parameter levels andapplicable test conditions and techniques for this procedure. Base these selections on the requirements documents,the Life Cycle Environmental Profile, Operational Environment Documentation (see Part One, figure 1-1), andinformation provided with this procedure. Consider the following when selecting test levels. Unlike other methodsin this standard, this method does not contain any default values for test conditions. The combinations of vibration,acoustics, temperature, and duty-cycle environment are too complex and the variety of materiel applications too greatfor such detailed instruction to be given here. Instead, this method provides guidance for writing a test procedurethat will be more or less unique to the materiel and test item. Annex A provides a detailed example of thedevelopment of test levels and conditions. Before attempting to apply the method, study the example in the Annex. In determination of test levels and conditions, identify the following:
Downloaded from http://www.everyspec.com on 2012-06-04T5:34:26.
MIL-STD-810F1 January 2000
METHOD 523.2523.2-6
a. Mission characterization to develop a composite aircraft/store mission profile.
b. Mission analysis to develop:
(1) Mission temperature analysis for development of a mission temperature profile over time;
(2) Mission vibration spectra identification for development of a mission vibration profile over time1;
(3) Mission operational duty cycle for functional performance of the store over time.
2.4 Test Item Configuration.
a. General. See Part One, paragraph 5.8.
b. Specific to this method. The configuration of the test item strongly affects test results. Use theanticipated configuration of the materiel in the life cycle profile. As a minimum consider the storecaptive carry service use environment.
3. INFORMATION REQUIRED.
3.1 Pretest.
The following information is required to conduct a vibro-acoustic/temperature test:
a. General. Information listed in Part One, paragraphs 5.7, 5.8, 5.9, 5.11 and 5.12, and Part One, AppendixA, Tasks 405 and 406, of this standard.
b. Specific to this method.
(1) A written, step-by-step procedure for conduct of the test that implements the test plan. Include therecording and documenting of test events and measurements. It may include other existingprocedures by reference; but explicitly include any procedures related to safety.
(2) Quantity of items to be tested.
(3) Composite mission profile. Include in the detailed environmental test plan (DETP) (either directlyor by reference), information used in designing the composite mission profile. Include thefollowing:
(a) The particular environmental and operational variables to be controlled in the test (a minimumset includes vibration level, vibration spectrum, skin temperature, and duty cycle).
(b) The mission profiles, including aircraft types, store load, and percentage of occurrence ofdifferent missions.
(c) The climatic region of operation and the distribution of ambient temperatures.
(d) Derivation of the composite mission profile; including captive flight vibration measurements,temperature measurements, and thermal models.
(4) Test cycle. The test cycle defines the time history of the controlled and monitored variables and theperformance of functional tests. The environmental test cycle is the product of a composite missioncycle and a climatic offset cycle.
(a) Composite mission cycle. This is a time history of the environmental and operating stresses tobe imposed repeatedly at different offset climatic temperatures. All functional tests and otherevents such as shocks are identified in this time history. The duration, level, and other
1 It is important to note that the specified mission vibration spectra will be spectra to be replicated during vibro-acoustic testing. In replicating the spectra, combined vibration and acoustic excitation will be employed. Thespecification of mission acoustic spectra is of nominal importance since the in-service acoustic environment is notreplicated directly.
Downloaded from http://www.everyspec.com on 2012-06-04T5:34:26.
MIL-STD-810F1 January 2000
METHOD 523.2523.2-7
characteristics of each stress are defined. Include in this cycle, transitional periods to normalizetemperatures between climatic offsets.
(b) Environmental profile charts. Use a chart (either graph or table) for each of the environmentalvariables to be controlled or monitored during the test that shows the intended value for thevariable during the composite mission cycle. These charts will be for the standard-day diurnaltemperature condition.
(c) Climatic offset table. Prepare a table of the temperature offsets in their order of application tosuccessive composite mission cycles. Explain in the DETP the origin of these offsets and theirscope (e.g., 95% worldwide). Also, include any transitional temperature conditioning periodsbetween composite mission cycles.
(d) Test control method. Include in the DETP, the method to be used in controlling environmentalstresses, the location and type of sensors, the use of open-loop or closed-loop control, and thetolerances for variables. Follow the general accuracy and tolerance requirements of Part One;paragraph 5 of this standard, unless otherwise specified.
(5) Test completion criteria. Specific statement of what constitutes a complete test (e.g., number or typeof failures, number of test cycles completed, etc.).
(6) Test log. Use a test log for written information and recording unusual events and anomalies. As aminimum, include the following:
(a) Time that the test item(s) is installed in the test facility and the number of the first compositemission cycle thereafter.
(b) Calibration of instrumentation and apparatus.
3.2 During Test.
Collect the following information while conducting the test:
a. General. Information listed in Part One, paragraphs 5.10 and 5.12, and in Appendix A, Tasks 405 and406, of this standard.
b. Specific to this method.
(1) A chronological record of events. Record all events that effect and all other events, which effect thetest or may effect interpretation of test results.
(2) A continuous record of environmental levels. Running record of all ambient and test environmentalfactors and levels. For example, room temperature and humidity, acoustic horns and shaker levels,skin and component temperatures, buffet events, shaker shock events, etc.
(3) A record of deviations. Chronological record of all deviations from intended levels and/or durationsof test environments.
(4) Failure interpretation/disposition. Procedures for operations after failures occur, including fix,repair, and test restart.
3.3 Post-test.
The following information is required:
a. General. Information listed in Part One, paragraph 5.13, and in Part One, Appendix A, Tasks 405 and406.
b. Specific to this method.
(1) Test chronology. Listing of events, test interruptions, and test failures.
Downloaded from http://www.everyspec.com on 2012-06-04T5:34:26.
MIL-STD-810F1 January 2000
METHOD 523.2523.2-8
(2) Failure interpretation/disposition. Definitions of failures and failure categories. Procedures foroperations after failures occur including fix, repair, and test restart.
(3) Test item disposition. Location, condition, and planned uses of the test item (e.g., returned to themanufacturer, held for further tests, etc.).
4. TEST PROCESS.
Ensure that the apparatus used to conduct the vibro-acoustic/temperature test on a store, hereafter referred to as a“test item,” includes the capability of inducing the required range of temperature and vibration while, at the sametime, operating and monitoring the function of the test item. Include the following considerations.
4.1 Test Facility.
Ensure that the apparatus used to conduct the vibro-acoustic/temperature test includes the following:
4.1.1 General.
The capability to induce the required range of temperature and vibration while, at the same time, operating andmonitoring the function of the test item.
4.1.2 Acoustic chamber.
Combined application of mechanical vibration and acoustic noise is generally required to reproduce the specifiedvibration response of test items at the monitoring points. The mechanical input through a vibration shaker systemgenerally supplies the energy at lower frequencies (below about 100 Hz). Acoustic pressures cannot be practicallycontrolled at frequencies below 100 Hz where transmission of vibration energy by mechanical means is practical. Acoustic energy providing vibrational energy at monitoring points becomes the major source of such vibrationalenergy at higher frequencies (above roughly 300 Hz) where mechanical vibration transmission through complexmechanical connections becomes impractical. The range between these frequencies is driven by a mixture ofvibration and acoustics. See methods 514.5 and 515.5 for further guidance.
4.1.2.1 Acoustic chamber and acoustic source.
Ensure the chamber shape and dimensions provide for a uniform distribution of the acoustic field at frequenciesabove 150 Hz (reference j). The facility must be capable of producing the required levels of acoustic energy over therange 150 to 2500 Hz. While an acoustic level of 155 dB will sometimes suffice, much higher levels (up to 165 dB)are sometimes needed. This level must be attainable with the test item and other required equipment in the chamber.Because acoustic levels of these magnitudes are difficult to produce, careful planning is required to ensure that thechamber is capable of producing the required environment. Typical apparatus consists of electrically driven airmodulators coupled to the chamber by exponential horns.
4.1.2.2 Vibration equipment.
To induce the lower frequency part of the vibration and to simulate exceptional dynamic events, the test item may bedriven by one or more electrodynamic or electrohydraulic exciters. Ensure attachment to the exciters does notinterfere with the acoustic field or significantly change the natural frequencies of the test item. With large, complexshaped, or unbalanced test items (cruise missiles, electronic countermeasures stores, munition dispensers, etc.), thisis likely to require multiple exciters driving a softly suspended store through rod-and-collar drive links. For small,slender test items (air-to-air missiles, etc.) this may sometimes be accomplished by driving the test item through itsusual interface with an aircraft, e.g., launcher. However, even for such small, slender test items, a softly suspendedtest item driven through a rod-and-collar arrangement may be needed. Typically, electrodynamic exciters are used. In cases where there are high levels of vibration required at low frequency (e.g., buffet vibration), electrodynamicexciters may not be capable of producing the required amplitudes (particularly the high velocity and displacementamplitudes). In these cases electrohydraulic exciters may be the better choice. Electrohydraulic exciters are notcapable of producing the high frequencies required in typical avionics vibration tests.
Downloaded from http://www.everyspec.com on 2012-06-04T5:34:26.
MIL-STD-810F1 January 2000
METHOD 523.2523.2-9
4.1.3 Temperature equipment.
Ensure the range of temperatures and rate of change of the test item’s skin temperature is adequate to achieve the testprofile. A typical range is -40qC to +85qC; the rate of change may be as high as 4qC/min. Temperature conditioningof the test item must be compatible with the acoustic field. In order to isolate the test item from the air in theacoustic chamber and the chamber walls, the test item may be enclosed in a thin, flexible shroud through whichtemperature conditioned air is ducted. This increases the thermal efficiency and permits high rates of temperaturechange. The shrouds must be transparent to the acoustic field. Making the shroud close fitting so as to raise the airspeed around the test item enhances the heat transfer rate. Rip-stop nylon cloth has proven to be a suitable shroudmaterial. Injection of liquid nitrogen is useful for achieving high rates of cooling. Air temperatures more extremethan the desired skin temperatures may be used to increase the heat transfer rate, but care must be taken to avoidcreating excessive gradients along the surface.
4.1.4 Electrical stress.
The operation duty cycle and the functional testing of the test item will provide the basic electrical stress. Cycle thetest item on and off as dictated by the mission simulation. Correlate voltage variation or other electrical parameterswith temperature. Reproduce additional electrical stresses such as voltage spikes, dropouts, and ripples if they areknown to occur in service.
4.2 Instrumentation.
To meet the test environment specification, acceleration, acoustic pressure, and temperature will be the measurementvariables, with acceleration the primary response monitoring variable. On occasion other environment measurementvariables may be employed, e.g., to measure moisture or humidity. In these cases special consideration will need tobe given to the equipment specification to satisfy the calibration, measurement, and analysis requirements. Allmeasurement instrumentation must be calibrated to traceable national calibration standards (see Part One, paragraph5.3.2). In addition, instrumentation to measure test item function may be required. In this case, obtain and adhere tosuitable calibration standards.
a. Accelerometer:
(1) Transverse sensitivity of less than or equal to 5%.
(2) An amplitude linearity within 10% from 5% to 100% of the peak acceleration amplitude required fortesting.
(3) A flat frequency response within r10% across the frequency range 2 – 2000 Hz for piezoelectricaccelerometers or DC-2000 Hz for piezoresistive accelerometers.
(4) Accelerometer and its mounting compatible with the requirements and guidelines in reference m.
b. Microphone:
(1) An amplitude linearity within 10% from 5% to 100% of the peak pressure amplitude required fortesting.
(2) A flat frequency response within r10% across the frequency range 10 – 10000 Hz.
(3) Microphone and its mounting compatible with the requirements and guidelines in reference m.
c. Temperature gage:
(1) An amplitude linearity within 10% from 5% to 100% of the peak temperature amplitude required fortesting.
(2) A flat frequency response capable of detecting temperature rates at 50qC/min.
(3) Temperature gage and its mounting compatible with the requirements and guidelines in reference m.
d. Other Measurement Devices. Consistent with the requirements of the test.
Downloaded from http://www.everyspec.com on 2012-06-04T5:34:26.
MIL-STD-810F1 January 2000
METHOD 523.2523.2-10
e. Signal conditioning. Use only signal conditioning that is compatible with the instrumentationrequirements on the test, and that is compatible with the requirements and guidelines provided inreference m. In particular, filtering of the analog voltage signals will be consistent with the time historyresponse requirements (in general, demonstrable sharp filter rolloff at the bandpass filter cutofffrequencies for acceleration and acoustic pressure, linear phase from DC to the filter cutoff fortemperature gage), and filtering will be so configured that anomalous data caused by amplifier clippingwill not be misinterpreted as response data, i.e., input to the amplifier will be filtered, but not theamplifier output. For acceleration related to shock data, filtering will require a linear phase filter fromDC to the filter cutoff.
f. Special monitoring instrumentation concerns. To control the test it is desirable to apply information fromall active instrumentation in a feedback loop. Specifically, any information that indicates an out-of-tolerance test stress (e.g., temperature too high) or an out-of-tolerance test item response (e.g., excessivecurrent draw) is cause to stop the test and initiate an investigation to determine the cause. Paragraphs4.3.2-4.3.6 provide guidance for functional, vibrational (acoustic plus mechanical), temperature,humidity and power monitoring/control to ensure the test requirements are met.
(1) Functional monitoring.
(2) Vibration monitoring/control.
(a) Air modulators.
(b) Mechanical stimulus.
(3) Temperature monitoring/control.
(4) Humidity monitoring.
(5) Power monitoring.
4.3 Controls.
a. Calibration. Ensure all environment measurement devices, e.g., accelerometers, microphones, thermalgages, have calibrations traceable as noted in Part One, paragraph 5.3.2. Verify calibration of the systemwith a calibration device before beginning the test procedure. If not available, provide a suitable methodfor verification of the appropriate response. After processing the measured response data from thecalibration device and verifying that measurements are in conformance with the specifications, removethe calibration device and perform the test on the designated test item. Calibrate equipment to record thefunction of the test item according to the test item performance specification.
b. Tolerances. For test validation and control of the test, use the environment measurement tolerancesspecified under the test procedure, and guidance provided in Part One, paragraph 5.2. In cases in whichthese tolerances cannot be met, establish and document achievable tolerances and ensure they are agreedto by the cognizant engineering authority and the customer prior to initiation of the test. In any case,establish tolerances within the limitations of the specified measurement calibration, instrumentation,signal conditioning and data analysis procedures. Establish tolerances on equipment to record thefunctional performance of the test item according to the test item performance specification.
4.3.1 Test interruption.
When monitoring or control indicates a condition unfavorable to continuation of the test while meeting the objectivesof the test specification, then test interruption is appropriate.
a. General. See Part One, paragraph 5.11 of this standard.
b. Specific to this method.
(1) Undertest interruption. If an unscheduled interruption occurs that causes the test conditions to fallbelow allowable limits, note the immediate conditions of the test item (temperature, etc.) and thepoint in the composite mission cycle, and stop the test. Determine the root cause of the undertestcondition (e.g., the store is not achieving the proper skin temperature because of a Temperature
Downloaded from http://www.everyspec.com on 2012-06-04T5:34:26.
MIL-STD-810F1 January 2000
METHOD 523.2523.2-11
Conditioning Unit (TCU) failure, or the desired vibration response levels are not being met becausean acoustic modulator valve assembly has failed). Take corrective action to get all test equipment inproper working condition. Return the test item to the required conditions prior to the interruption,and continue the test from that point.
(2) Overtest interruption. If the test item is exposed to test conditions that exceed allowable limits, givethe test item an appropriate physical examination and operational check (when practical) beforeresuming the test. This is especially true where a safety condition may exist such as with munitions.If a safety problem is discovered, the preferable course of action is to terminate the test and reinitiateit with a new test item. (If this safety problem is not so resolved and test item failure occurs duringthe remainder of the test, the test results may be considered invalid.) If no problem is identified,reestablish pre-interruption conditions and continue from the point where the test tolerances wereexceeded.
4.3.2 Functional monitoring.
Monitor test item functions continuously during the test. This may consist of a simplified measurement of overallperformance. If so, perform a full functional evaluation at least once per environmental cycle. Full functionalevaluations are recommended at both the high and low temperatures and at maximum vibration. Failures may beintermittent, irreversible, or reversible with changes in the environment. Ensure procedures for dealing withindicated failures are clearly defined. Verify functions that cannot be verified in the environmental test chamber byremoving and testing the store at short intervals as compared to its expected MTBF. Note that any statisticalassessment of the store reliability must take into account the test interval (reference k). Statistical test plans such asthose in MIL-HDBK-781 usually assume continuous monitoring.
4.3.3 Vibration monitoring and control.
Vibration is induced both by the acoustic field and by mechanical shakers. Experimentally determine the vibrationand acoustic inputs required to provide the required store response as in paragraphs a. and b. below. Once therequired vibration input has been established, input control the vibration exciter(s) to this measured signal by closedloop automatic control system(s). This will provide greater test consistency than trying to control vibration exciterswith feedback from response measurements. Monitor the response and when significant differences betweenmeasure and required responses are detected, stop the test and determine the cause. Looseness or wear in thevibration input train, problems with monitoring transducer mounting or wiring, and differences in response ofnominally identical stores may significantly effect response (reference l). In particular, instrumented stores whichhave experienced many hours of severe captive flight conditions and which are used to calibrate vibration tests maybe considerably less responsive than a new test store.
a. Air modulators. The acoustic field may be generated by air modulators supplied with low-pressure 239kPa to 446 kPa (20 to 50 psig) air. These modulators are coupled to the reverberant chamber throughexponential horns. Considerable acoustic power is required, so several modulators may be needed forone chamber. Horns having a lower cutoff frequency of approximately 200 Hz may be used. The drivesignal to the modulators is shaped random noise; it may be supplied from a noise generator signal that isshaped by filtering or from a pre-recorded signal. The shape of the acoustic spectrum is determined byadjusting it to produce (approximately) the same vibration response in an instrumented store as thevibration response measured in captive carry of that store. Microphones monitor the acoustic level andspectrum. Refer to method 515.5 for microphone placement, test level tolerances, and further guidance.
b. Mechanical stimulus. The drive signal to the electrodynamic and electrohydraulic shakers is shapedrandom noise; it may be supplied from a noise generator signal that is shaped by filtering or from aprerecorded signal. Determine the shape of the vibration spectrum by adjusting it to produce the samevibration response in an instrumented store as the vibration response measured in the captive carryenvironment of that store. Adjust the acoustic input first and maintain it during compensation of theshaker drive signal. After the shaker drive signal has been compensated so as to reproduce the desiredresponse vibration, record the vibration spectra and levels at the shaker attachments to the store assecondary standards to be used during the test. During the test, monitor vibration level and spectra withaccelerometers at these points along with the store response control points. Monitor these signalsthroughout the test. For closed loop control of the shakers use the vibration as measured at the
Downloaded from http://www.everyspec.com on 2012-06-04T5:34:26.
MIL-STD-810F1 January 2000
METHOD 523.2523.2-12
shaker/drive system interface. When the shakers are used only to provide the low frequency portion ofthe vibration spectrum, closed loop control may not be necessary. Refer to method 514.5 for test leveltolerances and further guidance.
4.3.4 Temperature monitoring and control.
The temperature that defines the temperature test cycle is the store skin temperature that is measured and used forfeedback control during the test. The air temperature may be driven to more extreme values (as much as 20qCbeyond the store range) in order to increase the rate of transfer. Monitor the air temperature separately in order toavoid values outside this range. In developing the temperature cycle, measure the store skin temperature at severalpoints to ensure even distribution of the temperature.
4.3.5 Humidity monitoring.
Although humidity is not a controlled variable for Procedure I, the ducted airstream may be monitored for moisturecontent, either by dewpoint or relative humidity sensing. Moisture can collect on a store’s surface when it hasreached and holds a cold temperature that is below the dewpoint of warmer air following in the mission cycle. Thisis a normal and expected condition.
4.3.6 Power monitoring.
Continuously monitor all electrical and other power inputs (e.g., hydraulic, compressed air) whether or not they aremodified to simulated mission conditions. This monitoring provides an immediate indication of many types offailures and, with automatic controls, may serve to limit secondary failures.
4.4 Data Analysis.
a. Use an analog anti-alias filter configuration on all digitized signals that will:
(1) not alias more than a five percent measurement error into the frequency band of interest.
(2) have linear phase-shift characteristics for the temperature gage and acceleration shock from DC tothe upper band edge.
(3) have a uniform passband to within one dB across the frequency band of interest (see paragraph 4.2).
b. In subsequent processing of the data, use any additional digital filtering that is compatible with the anti-alias analog filtering. In particular, additional digital filtering must maintain phase linearity forprocessing temperature gage data and any acceleration shock data.
c. Analysis procedures will be in accordance with those requirements and guidelines provided in referencem. If anomalies are detected, discard the potentially invalid measured response time history data.
4.5 Test Execution.
4.5.1 Preparation for test.
a. General. See Part One, paragraph 5.8.
b. Unique to this method. Verify that environmental monitoring and measurement sensors are of anappropriate type and properly located to obtain the required test data.
4.5.2 Pretest checkout.
The following steps describe in detail the pretest set-up and cycle check procedure. The purpose of the pretest set-upis to provide a level of confidence that the test specification can be met on a test item. In general, this pretestcheckout will require adjustment of the vibration sources to provide the best reproduction of the in-service vibration.Vibration response is subject to the following three sources of error: spatial, spectral, and amplitude. Since it maynot be possible to minimize all of these errors simultaneously, compromises between the three kinds of error must bebased on technical analysis and judgement. To better define and understand the cause behind the source of errors,each error will be described briefly along with potential corrective measures to reduce the error. It is important to
Downloaded from http://www.everyspec.com on 2012-06-04T5:34:26.
MIL-STD-810F1 January 2000
METHOD 523.2523.2-13
note that both the in-service measured and laboratory replicated vibro-acoustic fields are spatially non-homogeneousand highly random.
a. Relative spatial acceleration amplitude. Because the in-service acoustic and vibration environment resultfrom many sources that cannot be replicated in the laboratory, relative vibration levels at differentlocations within the test item may not correspond with measured relative vibration levels of the store atthe same locations in service. Reduction of this error may require relocation of attachment shakers, useof multiple shakers, a reorientation with respect to the acoustic field (from directional horns), or selectiveapplication of acoustic damping material. In addition, the effectiveness of the acoustic field in inducingvibration may vary with the air temperature within the shrouds surrounding the test item. In general, thetest set-up provides fewer degrees of freedom for exciting the test item than the degrees of freedomavailable for the store in service. It is important to note that cross spectra are not usually specified fromin-service measured data, nor are they considered a control parameter for the test. To some extent, theinput excitation from various sources is assumed to be uncorrelated.
b. Spectral shape error. Because the in-service acoustic and vibration environment comes from manysources that cannot be replicated in the laboratory, the spectral shape at different locations within the testitem may not correspond with the spectral shape of the test item at the same locations in service. Thismay be corrected by changing the spectrum of the acoustic and/or shaker drive signals or it may requirechanging the method of supporting the test item. Since cross spectra are not usually specified from in-service-measured data and are not considered a control parameter for the test, only limited correctionmay be possible.
c. Amplitude error. For stationary random data, generally the amplitude distribution is assumed to beGaussian. However, for in-service measured data, the distribution may be non-Gaussian – particularlyfor high-level maneuver events. The test setup should check the test item amplitude distribution to assurethat it matches the in-service measured amplitude distribution. This means that particular care must begiven to inherent shaker control system amplitude limiting, e.g., three sigma clipping. For replication ofa given autospectral density estimate with Gaussian amplitude distribution, ensure the shaker controlsystem truncation is at a value greater than three times the RMS level (because of the long test durationsit is important to have accelerations that exceed three times the RMS level). In general, to replicate anautospectral density estimate with a non-Gaussian amplitude distribution, specialized shaker controlsystem software is required.
4.5.3 Test setup and cycle check procedure.
Step 1. Using an instrumented test item (not necessarily operable), assemble the test item and environmentalapparatus into the planned configuration. If the planned test is based on in-service measured values,it is important that the sensors and their locations be identical to those used in these measurements. It is highly desirable that the identical test item used in the in-service measurements, with itsinstrumentation intact, be used in the test setup.
Step 2. Install and calibrate all sensors. Concurrently, test the function of any automatic alarm or abortmechanisms.
Step 3. Apply and adjust the acoustic stimulus to the minimum level. Verify the levels and spectral shape. Apply higher levels in steps until the required maximum is reached. Adjust the spectral shape asrequired at each level.
Step 4. Apply the adjusted acoustic stimulus at the lowest required level. Apply an arbitrary, low-levelvibration stimulus. Measure vibration response and iteratively adjust the vibration drive signal toachieve the required responses.
Step 5. Adjust both the acoustic and vibration stimuli to their maximum levels. Adjust the vibration drivesignal and, if necessary, the acoustic drive signal until the highest required levels of vibrationresponse are achieved.
Step 6. Adjust acoustic and vibration stimuli to each of the required intermediate levels and measure theresponses. If the responses at each level are reasonably close (engineering judgement required) tothe required levels, maintain the calibrations for the highest response level and iterate to the otherlevels by changing the overall levels of the drive signals (accuracy of the simulation is more
Downloaded from http://www.everyspec.com on 2012-06-04T5:34:26.
MIL-STD-810F1 January 2000
METHOD 523.2523.2-14
important at the higher levels). If response variation is strongly non-linear with the stimulus level,establish calibrations for each level.
Step 7. Apply the maximum temperature stimulus to the store. Adjust the temperature controller and ductingto achieve the desired skin temperatures and rates of change. Ensure that the distribution oftemperature values over the skin is within tolerances as determined from the thermal model. Ensurethat required temperature rates-of-change can be achieved.
Step 8. Conduct a composite mission profile cycle, including power on/off and functional tests. Measureskin temperatures and correct any problems. Ensure that temperature rate-of-change requirementscan be met. Repeat as necessary.
Step 9. Run a composite mission temperature cycle and duty cycle at the highest offset and another at thelowest offset. Measure the skin temperatures and correct any problems. Repeat as necessary.
Step 10. Place an operable test item into the test setup. Repeat steps 1 and 2 if this is a test item notpreviously subjected to those steps.
Step 11. Provide power to the test item as required and conduct a test of its function. Step 12. Repeat step 11 with vibration applied, under high temperature and then under low temperature.
4.5.4 Procedure.
The following general procedure will vary depending on the test type conducted as shown in table 523.2-I
Step 1. Prepare the test item in its test configuration as described in paragraph 4.5.3.Step 2. Verify the functional status of the test item.Step 3. Start the test using conditions specified in the test plan developed from test tailoring guidelines.Step 4. Conduct the test and monitor the functional status of the test item per paragraph 4.5.3.Step 5. If a test item failure occurs, analyze and document test results in according with paragraph 5.Step 6. If a test interruption occurs, proceed according to the procedure called out in paragraph 4.3.1.Step 7. Continue the test until termination criteria are met according to the procedure called out in paragraph
3.1.b(5). Document the results for comparison with pretest data.
5. ANALYSIS OF RESULTS.
In addition to the guidance provided in Part One, paragraphs 5.14 and 5.17, and Part One, Appendix A, Tasks 405and 406, the following information is provided to assist in the evaluation of the test results. If the test item failed thetest, consider the following categories during analysis of results of this method:
a. Stress. If a failure occurred, what the immediate physical mechanism of failure may have been, e.g.,fatigue, short circuit by particulate, etc.
b. Loading mechanism. Determine the physical loading mechanism that led to failure and the total time ornumber of cycles to failure (e. g., structural dynamic resonant modes, mode shapes, stress distribution,static deformation due to temperature distribution, incursion of moisture, etc.).
c. Responsibility. Whether or not the failure was in a contractor or government furnished part of the store;was the test being performed properly, or was there a test error, e.g., out of tolerance test conditions,which caused the failure.
d. Source. Whether or not the failure was due to workmanship error, a design flaw, a faulty part, etc. Thisis actually an inverted way of deciding what corrective action is appropriate, since extraordinaryworkmanship or high-strength parts can overcome design flaws and designs can be changed to eliminateworkmanship errors and/or to work with weaker parts.
e. Criticality. Whether or not the failure would have endangered friendly forces, prevented tactical success,or required repair before delivering the store.
6. REFERENCE/RELATED DOCUMENTS
a. A. Dantowitz, G. Hirshberger, and D. Pravidlo, "Analysis of Aeronautical Equipment EnvironmentalFailures", Air Force Flight Dynamics Laboratory, TR-71-32, May 1971.
Downloaded from http://www.everyspec.com on 2012-06-04T5:34:26.
MIL-STD-810F1 January 2000
METHOD 523.2523.2-15
b. D. B. Meeker and Allan G. Piersol, "Accelerated Reliability Testing Under VibroacousticEnvironments", in Reliability Design for Vibroacoustic Environments, American Society of MechanicalEngineers AMD Vol-9, New York, NY, 1974.
c. R.G. Lambert, "Accelerated Fatigue Test Rationale", General Electric Co., NY, March 1980.
d. David Alan Bies, "A Review of Flight and Wind Tunnel Measurements of Boundary Layer PressureFluctuations and Induced Structural Response", NASA CR-626, Bolt Beranek and Newman Inc., forNASA Langley Research Center, Oct 1966.
e. Jack M. Graham, "Summary of Missile Vibration Levels During Straight and Level Flight on VariousAircraft", Pacific Missile Test Center, Point Mugu, CA, EM-1030-008, August 1984.
f. Michael G. Hatcher and James R. Bautch, "PRAT Thermal and Vibration Profile Development",Sverdrup Technology Inc. for Aeronautical Systems Division, Eglin AFB, January 1992.
g. U.S. Standard Atmosphere, 1976.
h. D. F. Rex ed. "World Survey of Climatology", Elsevier, NY, 1969.
i. Sharon A. Ogden, "A Mathematical Method for Determining Laboratory Simulation of the Captive FlightVibration Environment", Proceedings of the 48th Shock and Vibration Symposium, Huntsville, AL,1977.
j. Terry Elliott, "Design Parameters of Reverberant Acoustic Chambers for Testing Air-Carried Missiles",TM-81-15, Pacific Missile Test Center, Point Mugu, CA, March 1981.
k. Terry Elliott, "Impact of Periodic Functional Testing on Sequential Test Plans", TP-82-25, PacificMissile Test Center, Point Mugu, CA, May 1982.
l. Michael T. Bunij, "SIDEWINDER Manufacturer Dependent Vibration Response Investigation", PacificMissile Test Center, Point Mugu, CA, June 1989.
m. Handbook for Dynamic Data Acquisition and Analysis, IES-RP-DTE012.1, Institute of EnvironmentalSciences and Technology, 940 East Northwest Highway, Mount Prospect, Illinois 60056.
n. MIL-HDBK-310, Global Climatic Data for Developing Military Products. 23 June 1997.
o. NATO STANAG 2895, Extreme Climatic Conditions and Derived Conditions for Use in DefiningDesign/Test Criteria for NATO Forces Materiel.
p. MIL-HDBK-781, Reliability Test Methods, Plans, and Environments for Engineering, Development,Qualification, and Production, Handbook for, 1 April 1996.
q. Mission Environmental Requirements Integration Technology (MERIT), Final Report (draft), 15September 1996, McDonald Douglas Aerospace
Downloaded from http://www.everyspec.com on 2012-06-04T5:34:26.
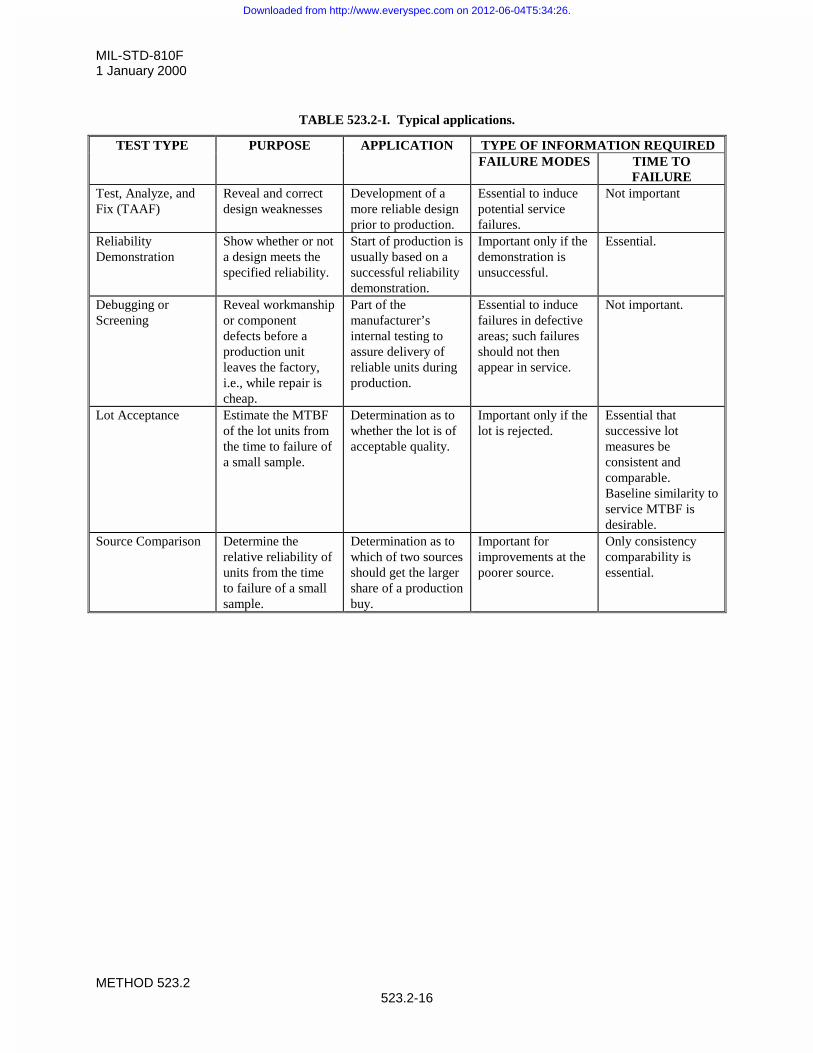
MIL-STD-810F1 January 2000
METHOD 523.2523.2-16
TABLE 523.2-I. Typical applications.
TEST TYPE PURPOSE APPLICATION TYPE OF INFORMATION REQUIREDFAILURE MODES TIME TO
FAILURETest, Analyze, andFix (TAAF)
Reveal and correctdesign weaknesses
Development of amore reliable designprior to production.
Essential to inducepotential servicefailures.
Not important
ReliabilityDemonstration
Show whether or nota design meets thespecified reliability.
Start of production isusually based on asuccessful reliabilitydemonstration.
Important only if thedemonstration isunsuccessful.
Essential.
Debugging orScreening
Reveal workmanshipor componentdefects before aproduction unitleaves the factory,i.e., while repair ischeap.
Part of themanufacturer’sinternal testing toassure delivery ofreliable units duringproduction.
Essential to inducefailures in defectiveareas; such failuresshould not thenappear in service.
Not important.
Lot Acceptance Estimate the MTBFof the lot units fromthe time to failure ofa small sample.
Determination as towhether the lot is ofacceptable quality.
Important only if thelot is rejected.
Essential thatsuccessive lotmeasures beconsistent andcomparable. Baseline similarity toservice MTBF isdesirable.
Source Comparison Determine therelative reliability ofunits from the timeto failure of a smallsample.
Determination as towhich of two sourcesshould get the largershare of a productionbuy.
Important forimprovements at thepoorer source.
Only consistencycomparability isessential.
Downloaded from http://www.everyspec.com on 2012-06-04T5:34:26.
MIL-STD-810F1 January 2000ANNEX A
METHOD 523.2523.2A-1
ANNEX A
PHILOSOPHY OF TESTING,VIBRO-ACOUSTIC/TEMPERATURE TEST PROFILE DEVELOPMENT
1. SCOPE.
1.1 Purpose.
This annex provides an example of the development of a Vibro-Acoustic/Temperature test profile.
1.2 Application.
Information in this annex is designed to provide some, but not necessarily all, of the details that must be consideredin developing a Vibro-Acoustic/Temperature test profile. Information included here should allow the practitioner todevelop the test profile for any of the possible test types provided in table 523.2-I.
2. DEVELOPMENT.
2.1 Background.
In order to ensure that the failures occurring in a test are typical of in-service use, it is important to reproduce theservice stress distribution. The service stress distribution is the set of stresses in the combinations, levels, andduration imposed by the in-service missions. The procedure reproduces the levels, durations, and combinations oftemperature, vibration, and acoustic noise in the same relative proportions as the in-service missions.
2.2 General.
Military aircraft service use may be described by a set of missions and the relative frequency of occurrence of eachmission as illustrated in table 523.2A-I. Each mission is defined by the type of stores carried and a mission flightprofile. The mission flight profile is an idealized mission history that describes altitude, speed, and various events(e.g., air combat, gunfire, refueling) as functions of time. From the mission profiles and climatic data, derivecorresponding mission environmental profiles. Use data from instrumented flights in this derivation, if available. Once the mission environmental profiles are derived, they can be combined into a composite mission profile. Thecomposite mission profile is a sequence of environments in which the various stresses and combinations of stressesoccur in (approximately) the same proportion as in all of the mission environmental profiles weighted according totheir relative frequency of occurrence. The composite mission profile also includes the effects of climatictemperatures according to their relative frequency. However, the composite mission profile must be short enough tobe repeated many times (at least five times is recommended) within the expected time-to-failure of the store beingtested. This may require that extreme environments (particularly extreme temperatures) not be included, sincekeeping them in proper proportion might result in too long a composite mission. Typically, the range of stressesincluded is between the 5th and 95th percentile.
2.3 Mission Characterization.
The first step in developing the composite mission profile is to determine the types of aircraft and mission flightprofiles that will employ the store. The mission flight profiles may be described in terms of altitude and Machnumber with annotation of events. A tabulated mission phase analysis or mission profile description is shown intable 523.2A-II. A corresponding graphical representation of this mission is shown on figure 523.2A-1. The relativefrequency of occurrence of the various missions must also be determined. This may be tabulated as shown in table523.2A-I. In determining the relative frequency with which the store will be carried on various missions, it may benecessary to consider some state of hostility. Experience has shown that weapons that would be expended on theirfirst flight in conflict may be subjected to many flights during a time of high international tension in which there is nocombat. Choose the most stressful, yet realistic, mix of missions for simulation. Generally, it is not desirable to
Downloaded from http://www.everyspec.com on 2012-06-04T5:34:26.
MIL-STD-810F1 January 2000ANNEX A
METHOD 523.2523.2A-2
average together relatively benign missions with relatively stressful ones if a store will experience only one or theother during its service life. For each aircraft type and mission, determine the carriage location of the store to betested, as well as the location of other stores that may affect it. Stores located ahead of or adjacent to a given storewill cause an increase in the turbulence-induced vibration of that store. Ejection of nearby stores may also inducedynamic loads. Also, note any geographic or other conditions that would influence the mission (e.g., a store carriedonly by carrier-based aircraft will not experience as wide a range of preflight temperatures as one carried by land-based aircraft).
2.4 Mission Analysis.
Rather than deriving store environments such as vibration directly from the mission profiles, first recast the missionprofiles in terms of the variables which directly affect the store, but which do not depend on the store’s response. These variables are initial temperature, recovery air temperature, and dynamic pressure. It is assumed that the store’stemperature and vibration are a function of these primary variables.
2.4.1 Mission temperatures.
Standard-day recovery air temperatures may be calculated from the equation in paragraph 2.1.1.4 and method 514.5,Annex C, table 514.5C-VI, given the flight speed and pressure altitude (h) (standard atmosphere). Table 514.5C-VIcan also be used to convert various measures of air speed to Mach number. The temperature profile for a singlemission type is provided on figure 523.2A-2. For a composite mission, figure 523.2A-4 displays the skintemperature versus the elapsed mission time.
2.4.2 Mission vibration.
a. Both the frequency spectrum shape and spatial distribution of store vibration in captive flight are almostindependent of the flight condition. Exceptions are increased low frequency vibration during buffetingmaneuvers and, in some cases, increased high frequency vibration in supersonic flight. In general,boundary layer fluctuating pressures are proportional to the dynamic pressure (q) of the flight condition.The store vibration is the dynamic response of the store to these pressures and is also proportional to q. The vibration spectrum rms level (grms) is proportional to q, and the acceleration spectral density (G) atany frequency is proportional to q2. If vibration levels (grmsref, Gref) are defined for a single flightcondition (qref), this proportionality can be used to approximate vibration levels throughout the flightenvelope as follows:
refref q
q
grms
grms� and
2
refref q
q
G
G���
����
��
where:q = dynamic pressure, kN/m2 (lb/ft2)grms = spectrum rms vibration level, gG = acceleration spectral density, g2/HzThe area under the G(f) curve is the square of the grms level
b. Usually the reference condition is taken to be subsonic carriage on the least stressful aircraft station(wing pylon with no adjacent stores). Using this reference, determine the q versus time profile for eachmission and construct a histogram representing the proportion of time the store is at a q level. Thissummarizes the expected vibration experience of the store. For stores for which measured vibration dataare not available, the levels can be estimated by considering similar stores, with tailoring criteriaprovided in method 514.5 and/or Mission Environmental Requirements Integration Technology(MERIT). MERIT is an Air Force developed software package for defining aircraft external storeenvironmental life cycles from manufacture through expenditure. It includes a very extensive database ofboth climatic and induced environments. Reference e is a summary for various air-launched missiles.
c. For the missions where the store is carried on stations other than the least stressful station, adjustmentfactors may be needed. These factors typically account for cases where stores are carried side by side,
Downloaded from http://www.everyspec.com on 2012-06-04T5:34:26.
MIL-STD-810F1 January 2000ANNEX A
METHOD 523.2523.2A-3
behind other stores or in other special configurations. Measured data are the best source for thesefactors. Method 514.5 and MERIT also provide guidance.
d. Vibration of a store is the dynamic response of the store to the fluctuating pressure and aircrafttransmitted environments. This is broken down into definitions of the motions of key structural points ofthe store. The vibration environments of materiel located in the store are the local store vibrationresponses. The test consists of exciting the store with arbitrary levels of vibration and acoustics, andtailoring these inputs to achieve the defined store responses.
e. For the exceptional cases (aircraft buffet, catapult launch, arrested landing, gunfire, etc.), determinevibration/shock level, spectrum, and other characteristics. Quantify the occurrences of the exceptionalvibration/shock conditions in terms of duration and mission time, so they can be reproduced in the properproportions and at the proper times in the test cycle. Measured data are even more important here, butmethod 514.5 and MERIT do contain guidance both for interpreting measured data and estimating levelswhen necessary. Method 519.5 contains guidance on estimating gunfire-induced vibration.
2.4.3 Test temperature profile.
The test temperature profile will be the product of two parts: one that simulates the range and variation oftemperature due to the missions, and another that simulates the climatic effects:
a. To determine the mission simulation part, begin with a sequence of skin temperatures corresponding to afew of the most common mission(s) strung together. Use a sequence that is no longer than one fortieth(1/40) of the store MTBF. It is usually convenient to make it a factor of 24 hours (e.g., 6 hrs or 8 hrs)since the test will be run around-the-clock. Use this skin temperature as an input to the store thermalmodel and determine the histograms of the internal temperature. These must be the responses after manycycles (the "steady state" responses). Compare these to the histograms for all the missions. Adjust thetest sequence to achieve approximate agreement between the temperature histograms, both on the skinand internally. In this adjustment, keep the number and rate of temperature changes roughly the same asin the actual missions. It will usually be necessary to introduce a period of simulated on-the-ground timeinto the cycle in order that each simulated flight period start with the store at the appropriate uniformtemperature. The temperature during the simulated on-the-ground time may be elevated or reduced inorder to speed up the stabilization of internal temperatures. This initial temperature will be shifted eachcycle to simulate the effect of climatic temperature variation.
b. Climatic effects are included by repeating the simulated flight cycle with temperatures shifted up or downby offset values which are constant over one cycle, but which differ from cycle to cycle (see table523.2A-III). Successive cycles have the temperature raised or lowered by an amount that represents acolder or hotter than standard day. Ensure the number of different offsets is at least eight. The upperbound on the number of offsets is determined by the requirement that the overall cycle must be shorterthan one fifth of the MTBF. The value of the N offsets is chosen to be the midpoints of the N equi-probable intervals of the climatic temperature distribution as shown on figure 523.2A-3. For worldwide,day and night operations, the climatic variation below 10 km is well approximated by a Gaussiandistribution; at ground level; the mean is 12qC and the standard deviation is 15qC (reference f). (Thisincludes variation of location as well as season.) At altitude, the mean temperature is lower, but thestandard deviation is about the same (references f and g) over most of the globe. Near the poles and theequator, the variation at altitude is considerably less (reference h). For eight offsets, the temperatureswould be as shown in table 523.2A-III. Stair-step the sequence of offsets in the test cycle up and downas indicated by the step number. Figure 523.2A-5 displays a climatic set plan where test item skintemperature is a function of elapsed test time. This reduces the duration required between offsets tonormalize the store temperature for the next offset. It is desirable to minimize this duration since it doesnot count in measuring the store MTBF and hence decreases the test efficiency.
2.4.4 Test vibration profile.
Ensure the test vibration profile produces the same histogram of store response levels as that derived from themission analysis. Analyses assuming power function fatigue damage indicate that three to five different vibrationlevels are usually enough (reference i). Use the same mission sequence used for the initial temperature cycle to
Downloaded from http://www.everyspec.com on 2012-06-04T5:34:26.
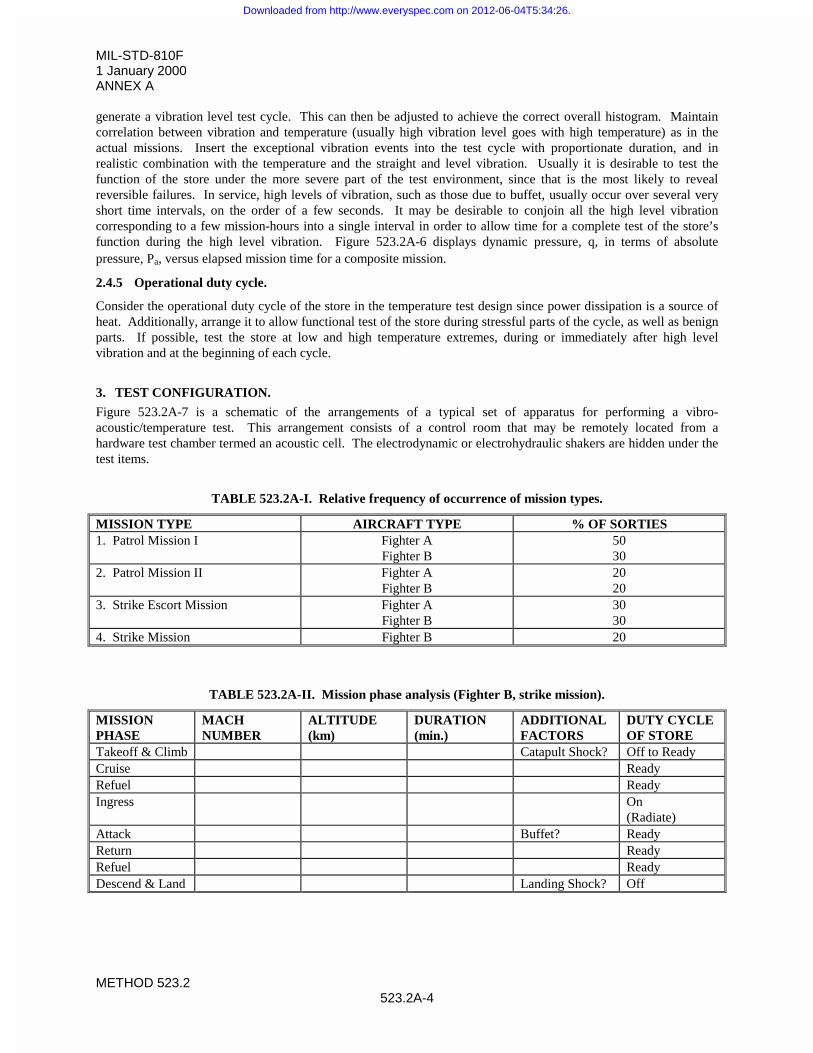
MIL-STD-810F1 January 2000ANNEX A
METHOD 523.2523.2A-4
generate a vibration level test cycle. This can then be adjusted to achieve the correct overall histogram. Maintaincorrelation between vibration and temperature (usually high vibration level goes with high temperature) as in theactual missions. Insert the exceptional vibration events into the test cycle with proportionate duration, and inrealistic combination with the temperature and the straight and level vibration. Usually it is desirable to test thefunction of the store under the more severe part of the test environment, since that is the most likely to revealreversible failures. In service, high levels of vibration, such as those due to buffet, usually occur over several veryshort time intervals, on the order of a few seconds. It may be desirable to conjoin all the high level vibrationcorresponding to a few mission-hours into a single interval in order to allow time for a complete test of the store’sfunction during the high level vibration. Figure 523.2A-6 displays dynamic pressure, q, in terms of absolutepressure, Pa, versus elapsed mission time for a composite mission.
2.4.5 Operational duty cycle.
Consider the operational duty cycle of the store in the temperature test design since power dissipation is a source ofheat. Additionally, arrange it to allow functional test of the store during stressful parts of the cycle, as well as benignparts. If possible, test the store at low and high temperature extremes, during or immediately after high levelvibration and at the beginning of each cycle.
3. TEST CONFIGURATION.
Figure 523.2A-7 is a schematic of the arrangements of a typical set of apparatus for performing a vibro-acoustic/temperature test. This arrangement consists of a control room that may be remotely located from ahardware test chamber termed an acoustic cell. The electrodynamic or electrohydraulic shakers are hidden under thetest items.
TABLE 523.2A-I. Relative frequency of occurrence of mission types.
MISSION TYPE AIRCRAFT TYPE % OF SORTIES1. Patrol Mission I Fighter A
Fighter B5030
2. Patrol Mission II Fighter AFighter B
2020
3. Strike Escort Mission Fighter AFighter B
3030
4. Strike Mission Fighter B 20
TABLE 523.2A-II. Mission phase analysis (Fighter B, strike mission).
MISSIONPHASE
MACHNUMBER
ALTITUDE(km)
DURATION(min.)
ADDITIONALFACTORS
DUTY CYCLEOF STORE
Takeoff & Climb Catapult Shock? Off to ReadyCruise ReadyRefuel ReadyIngress On
(Radiate)Attack Buffet? ReadyReturn ReadyRefuel ReadyDescend & Land Landing Shock? Off
Downloaded from http://www.everyspec.com on 2012-06-04T5:34:26.
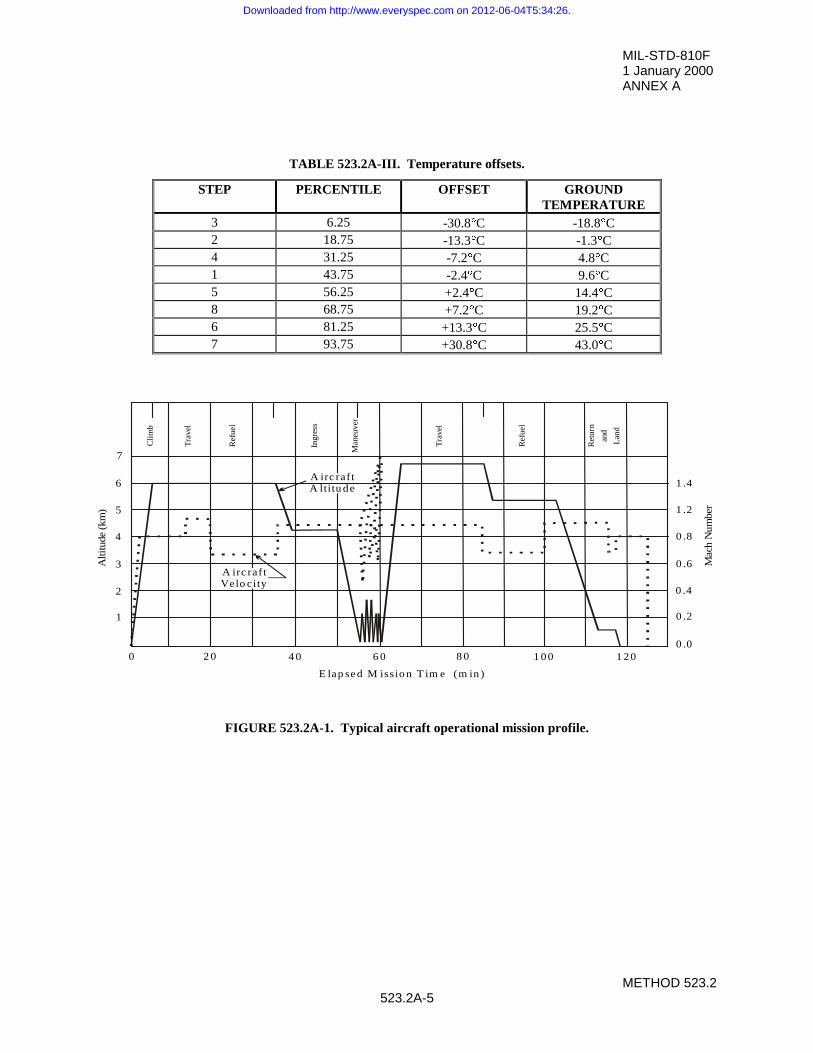
MIL-STD-810F1 January 2000ANNEX A
METHOD 523.2523.2A-5
TABLE 523.2A-III. Temperature offsets.
STEP PERCENTILE OFFSET GROUNDTEMPERATURE
3 6.25 -30.8qC -18.8qC2 18.75 -13.3qC -1.3qC4 31.25 -7.2qC 4.8qC1 43.75 -2.4qC 9.6qC5 56.25 +2.4qC 14.4qC8 68.75 +7.2qC 19.2qC6 81.25 +13.3qC 25.5qC7 93.75 +30.8qC 43.0qC
A irc raftVelo city
A irc raftA ltitu de
Alti
tude
(km
)
1
2
3
4
5
6
7
0 2 0 4 0 6 0 8 0 1 0 0 1 2 00 .0
0 .2
0 .4
0 .6
0 .8
1 .2
1 .4
Mac
h N
umbe
r
Cli
mb
Tra
vel
Ref
uel
Ingr
ess
Man
euve
r
Tra
vel
Ref
uel
Ret
urn
and
Lan
d
E lap se d M issio n T im e (m in )
FIGURE 523.2A-1. Typical aircraft operational mission profile.
Downloaded from http://www.everyspec.com on 2012-06-04T5:34:26.
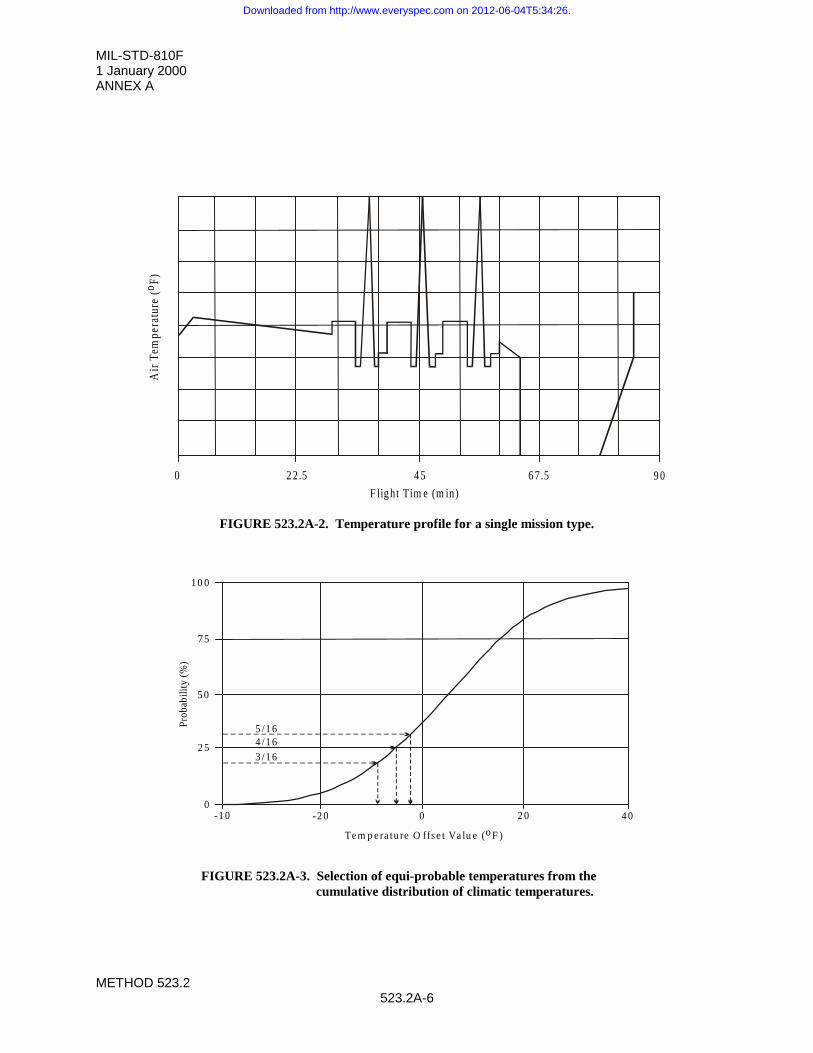
MIL-STD-810F1 January 2000ANNEX A
METHOD 523.2523.2A-6
FIGURE 523.2A-2. Temperature profile for a single mission type.
FIGURE 523.2A-3. Selection of equi-probable temperatures from thecumulative distribution of climatic temperatures.
Air
Tem
pera
ture
(o F)
F lig ht Tim e (m in)
0 9 02 2.5 4 5 6 7.5
5 /1 64 /1 6
3 /1 6
0
2 5
5 0
7 5
1 0 0
-1 0 -2 0 0 2 0 4 0
Te m p e ra tu re O ffse t Va lu e (o F )
Prob
abili
ty (
%)
Downloaded from http://www.everyspec.com on 2012-06-04T5:34:26.
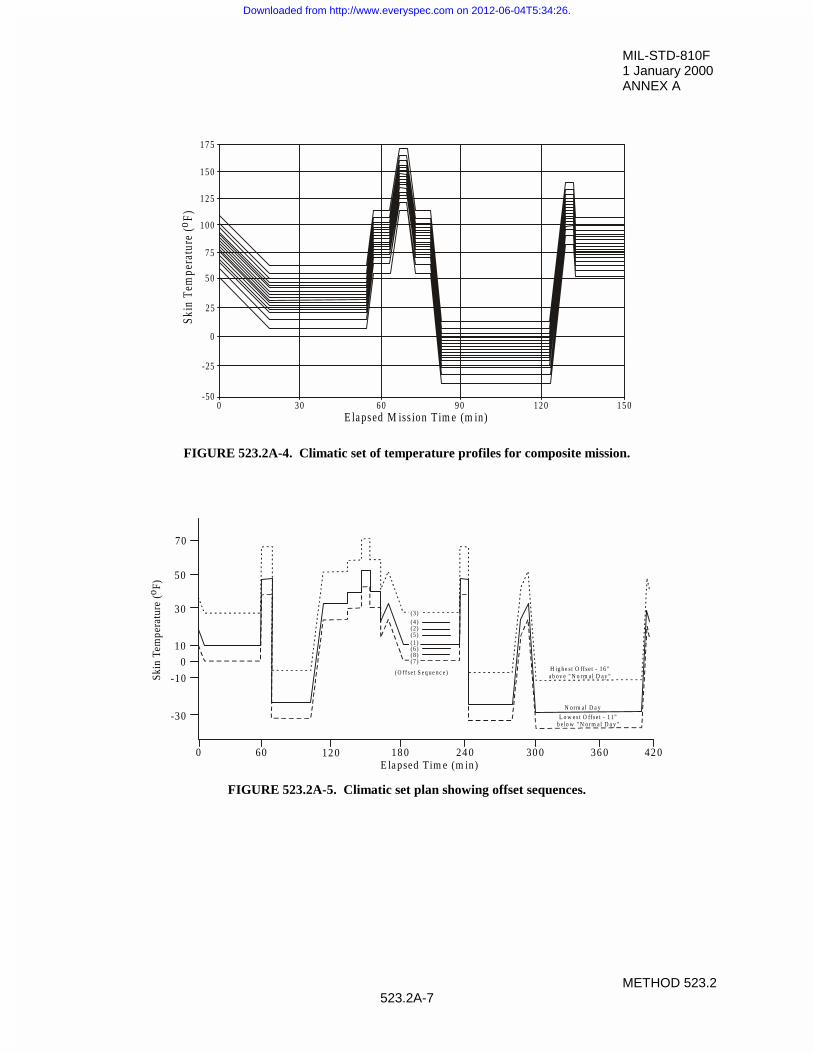
MIL-STD-810F1 January 2000ANNEX A
METHOD 523.2523.2A-7
FIGURE 523.2A-4. Climatic set of temperature profiles for composite mission.
FIGURE 523.2A-5. Climatic set plan showing offset sequences.
1 5 01 2 09 06 03 00-50
-25
0
2 5
5 0
7 5
1 0 0
1 2 5
1 5 0
1 7 5
E la psed M iss ion T im e (m in)
Skin
Tem
pera
ture
(o F)
( 3 )( 4 )( 2 )( 5 )( 1 )( 6 )( 8 )( 7 )
( O f f s e t S e q u e n c e )H ig h e s t O ff s e t - 1 6 "a b o v e " N o rm a l D a y "
N o rm a l D a y
L o w e s t O ff s e t - 1 1 "b e lo w " N o r m a l D a y "
E la psed Tim e (m in)0 60 12 0 18 0 24 0 30 0 36 0 42 0
-30
-10
0
10
30
50
70
Skin
Tem
pera
ture
(o F)
Downloaded from http://www.everyspec.com on 2012-06-04T5:34:26.
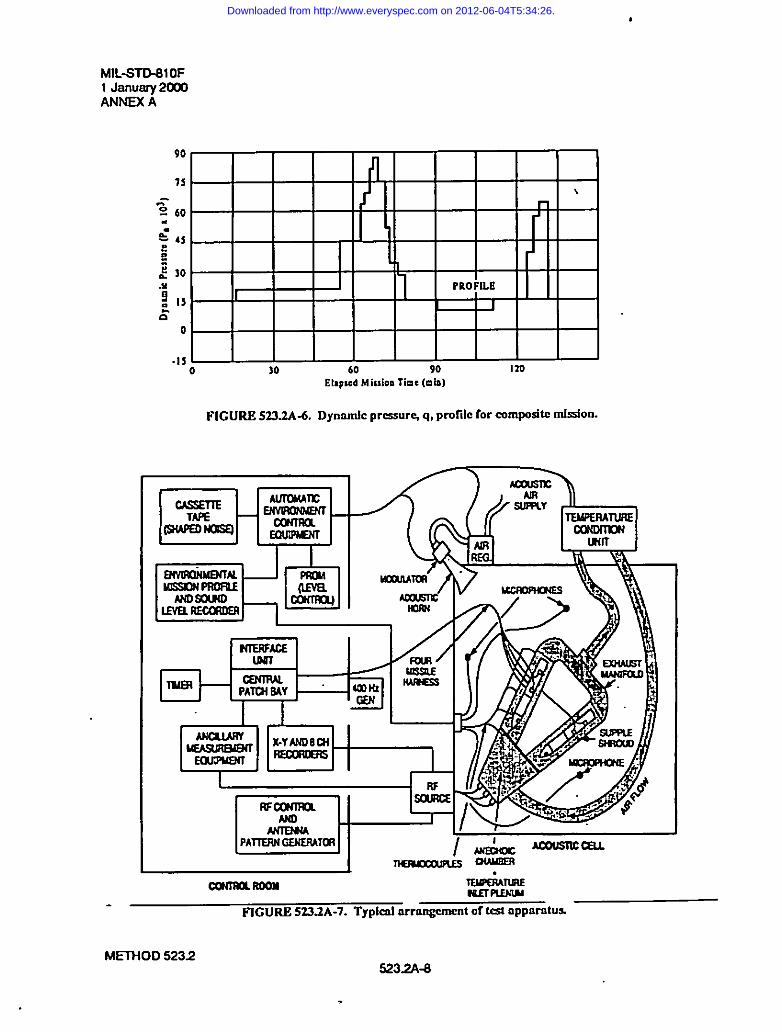
..
MIL-SID-81OF1 January 20WANNEX A
90
o
-13
II/’1 \
r
r
1 , r’
I1 PROFL8
J
o 30 60 90 I10ElapsedM iuio. lime (mid
FIGURE 523-2A-6.Dynnmlc prcsmre, q, pmfilc for cmnpositc mkslon.
.—
*
ComRol ROOM WfiAnmmlT-—
FIG~ 523.2A-7. Typkd or rongemcnt of M oppnrntu%
METHOO 52325232A4
Downloaded from http://www.everyspec.com on 2012-06-04T5:34:26.

STANDARDIZATION DOCUMENT IMPROVEMENT PROPOSAL
INSTRUCTIONS 1. The preparing activity must complete blocks 1, 2, 3, and 8. In block 1, both the document number and revision letter should be
given. 2. The submitter of this form must complete blocks 4, 5, 6, and 7, and send to preparing activity. 3. The preparing activity must provide a reply within 30 days from receipt of the form. NOTE: This form may not be used to request copies of documents, nor to request waivers, or clarification of requirements on current contracts. Comments submitted on this form do not constitute or imply authorization to waive any portion of the referenced document(s) or to amend contractual requirements.
I RECOMMEND A CHANGE: 1. DOCUMENT NUMBER MIL-STD-810
2. DOCUMENT DATE (YYYYMMDD) 20000101
3. DOCUMENT TITLE ENVIRONMENTAL ENGINEERING CONSIDERATIONS AND LABORATORY TESTS
4. NATURE OF CHANGE (Identify paragraph number and include proposed rewrite, if possible. Attach extra sheets as needed.)
5. REASON FOR RECOMMENDATION
6. SUBMITTER
a. NAME (Last, First, Middle Initial) b. ORGANIZATION
c. ADDRESS (Include Zip Code) d. TELEPHONE (Include Area Code) (1) Commercial
(2) AUTOVON (if applicable)
7.DATE SUBMITTED (YYYYMMDD)
8. PREPARING ACTIVITY a. NAME ASC/EN0I (AF-11) b. TELEPHONE Include Area Code)
(1) Commercial (513) 255-6281 (2) AUTOVON 785-6281
c. ADDRESS (Include Zip Code) ASC/EN0I, BLDG. 560, 2530 LOOP ROAD W., WRIGHT-PATTERSON AFB OH 45433-7101
IF YOU DO NOT RECEIVE A REPLY WITHIN 45 DAYS, CONTACT: Defense Standardization Program Office (DLSC-LM) 8725 John J. Kingman road, Suite 2533, Ft. Belvoir, VA 22060-2533 Telephone (703) 767-6888 AUTOVON 427-6888
DD Form 1426, FEB 1999 (EG) PREVIOUS EDITION IS OBSOLETE WHS/DIOR, Feb 99
Downloaded from http://www.everyspec.com on 2012-06-04T5:34:26.