Embed Size (px)
Citation preview

MIL-STD-471ANOTICE 110 January 1975
MILITARY STANDARD
MAINTAINABILITY VERIFICAION/DEMONSTRATION/EVALUATION
TO ALL HOLDERS OF MIL-STD-471A
1. The following are new and revised pages of this standard. Therevised pages supersede the original. pages:
NEW PAGE DATE
iiiiv192021222526
28
26a2727a
293030a313233a34
27 March 197327 March 197327 March 197327 March 197327 March 1973
27 March 1973
27 March 1973
27 March 1973
27 March 197327 March 1973
27 March 197327 March 1973
27 March 1973
27 March 197327 March 197327 March 1973
3536
4142434455-77
27101010101027101010102727101010102710102710271010102710
DATE SUPERSEDED PAGE
March 1973 (Reprinted without change)January 1975 ivJanuary 1975 19January 1975 20January 1975 21January 1975 22March 1973 (Reprinted without change)January 1975 26January 1975 New PageJanuary 1975 27January 1975 New PageMarch 1973 (Reprinted without change)March 1973 (Reprinted without change)January 1975 30January 1975 New PageJanuary 1975 31January 1975 32March 1973 (Reprinted without change)January 1975 34January 1975 35March 1973 (Reprinted without change)January 1975 37March 1973 (Reprinted without change)January 1975January 1975 42January 1975 43March 1973 (Reprinted without change)January 1975 New Pages
41
2. RETAIN THIS NOTICE PAGE AND INSERT BEFORE THE TABLE OF CONTENTS.
FSC - MISC

MIL-STD-471ANOTICE 1
3. Holders of MIL-STD-471A will verify that page changes and additionsindicated above have been entered. The notice page will be retained asa check sheet. This insurance, together with appended pages, is a separatepublication. Each notice is to be retained by stocking points until theMilitary Standard is completely revised or cancelled.
Custodians: Preparing Activity:Army - EL Air Force - 17Navy - AsAir Force - 17 Project MISC-0953
Review Activities:Army - MI, SC, TE
Air Force - 10, 11, 13, 15, 22, 26Navy - EC
User Activities:Army -Navy -Air Force - 19, 71, 80
2
MIL-STD-471A27 March 1973
TABLE OF CONTENTS
Paragraph
1.1.11.22.3.4.4.1Fig. 14.1.14.1.24.1.34.2
4.34.3.14.3.24.3.34.44.54.64.74.8
5.
APPENDIX A
A.10A.10.1A.10.2A.10.3A.10.4A.10,5Table ITable II
ScopePurposeApplicationApplicable DocumentsDefinitionsRequirementsGeneralTime Phased ChartPhase IPhase IIPhase IIIMaintainability Verification/Demonstration/Evaluation PlanTest ProceduresMaintenance Task GenerationTurnaround TasksTest MethodAdministrationGFE/GFAE ItemsData CollectionMaintainability Parameter CalculationsMaintainability Verification/Demonstration/Evaluation ReportsOrdering Data
ScopePurposeApplicationSample StratificationStratification ProcedureFailure Mode SelectionStratification ProcedureFailure Mode Selection
Page
111113345688
111112121215161717
18
1919191919232425
iii

MIL-STD-471A10 January 1975
TABLE OF CONTENTS (Cont'd)
Paragraph
APPENDIX B
B.10B.10.1B.10.2B.10.3B.10.4B.10.5Fig. B-1B.10.6B.10.7B.10.8B.20B.30
B.40
B.50B.60
B.70B.80
B.90
B.100
B.110
B.120
scopePurposeApplicationSample SizeTask SelectionTest SelectionTest Method MatrixReferencesList of Symbols (Test Methods 1 - 3)List Of Symbols (Test Methods 4, 8 - 11)Test Method 1 - Test on the MeanTest Method 2 - Test on CriticalPercentileTest Method 3 - Test on CriticalMaintenance Time or ManhoursTest Method 4 - Test on the MedianTest Method 5 - Test on ChargeableMaintenance Downtime Per FlightTest Method 6 - Test on Manhour RateTest Method 7 - Test on Manhour Rate(Using Simulated Faults)Test Method 8 - Test on a CombinedMean/Percentile RequirementTest Method 9 - Test For Mean MaintenanceTim ( Corrective Preventative Combinationof Corrective and Preventative) and MTest Method 10 - Tests For Percentiles andMaintenance Tim (Corrective preventativeMaintenance)Test Method 11 - Test For PreventativeMaintenance Times
Page
262626262626a272828303134
37
4144
5253
55
70
74
76
max
Supersedes page iv of 27 March 1973
iv
MIL-STD-471A10 Jan 1975
APPENDIX A
MAINTENANCE TASK SAMPLING FOR USE WITH FAILURE SIMULATION
A.10 Scope.
A.10.1 Purpose. This appendix outlines a procedure for thea sample of corrective maintenance tasks for maintainabilitywhen the tasks result from failure simulation.
selection ofdemonstration
A.10.2 Application. The procedure described herein is applicable onlywhen failure simulation is to be used to generate maintenance tasks. Theprocedure is applicable to the equipment level and it is assumed thatsystem level maintainability requirements have been allocated to theequipment level for demonstration. The mean estimates for equipment maybe employed to determine achievement of system maintainability requirements.If sampling of preventive maintenance tasks or servicing is permitted, aprocedure and tables similar to that illustrated in this appendix forcorrective maintenance must be developed for each type of task (i.e., preven-tive maintenance, servicing).
A.10.3 Sample Stratification. The major objectives of stratification inthis standard are to: (a) allow for the selection of maintenance tasks in sucha manner that the selection simulates the failure frequency of the test unit inactual operation, (units with low MTBF's will be selected more frequentlythan units with higher MTBF's), (b) insure that a proportionately representativesample of task types/times are selected. Proportional stratified samplingmay be used for selection of maintenance tasks to be demonstrated using thefixed sample size test methods described in Appendix B, Sequential test methodshall employ simple random sampling.
A.10.4 Stratification Procedure. The following example illustrates theprocedure for tasks which would be classified as corrective maintenance.Preventive maintenance or servicing tasks should not be combined withcorrective maintenance tasks for the purpose of task stratification. Forsystem level demonstration of maintainability requirements, the procedureshould be applied to each contract end item equipment and through appropriatetechniques, the achievement of system maintainability requirements may bedemonstrated. Maintenance tasks may be performed concurrently or seriallyprovided that provision has been made to record the expended maintenancetime for each maintenance task. The requirement to be demonstrated shalldetermine the manner in which the data shall be analyzed. The following,Table I, illustrates theconsisting of: Antenna,Control, and Drift Angle
Supersedes page 19 of 27 March 1973
application of this procedure to a radar equipmentReceiver/Transmitter, Frequency Tracker, Radar SetIndicator:

MIL-STD-471A10 Jan 1975
a. column 1 -
b. column 2 -maintenance for the
Identify the major units which comprise the equipment.- .
Subdivide each unit to the functional level at whichdemonstration is to be performed in accordance with
the approved maintenance plan. This level may be an assembly, module,printed circuit card or piece part.
c. columns 3 & 4 - For each functional level of maintenance identifiedin Column 2, identify in Column 3 the type of maintenance task or tasksto be performed and in Column 4 the estimated mean maintenance time for thetask. The maintenance task time shall include the time to perform eachelement of maintenance time as defined in MIL-STD-721B. The maintenancetasks and estimated maintenance time would be derived from a maintenanceengineering analysis, a maintainability prediction effort, or from historicaldata. The same maintenance task, such as "remove and replace" of a modulemay result from different faults within the module. Column 3 would identifythe maintenance task and not the fault or failure which results in theoccurrence of the task.
d. column 5 - Determine the failure rate (F/106 hr.) for each module,printed circuit card, etc., for which the maintenance task was identifiedin Column 3. The failure rates used shall be the latest available from theassociated reliability program. If there is no reliability program, thefailure rates may be selected or extrapolated from sources approved by theprocuring activity.
e. Column 6 - Determine the quantity of items in each major unitassociated with each task in Column 3.
f. column 7 - Determine the duty cycle for each item associatedwith each task in Column 3 (e.g., operating time of a receiver to theoperating time of the radar; engine operating hours to aircraft flighthours ).
g. Column 8 - Group together the maintenance tasks identified inColumn 3 which have both:
(1) Similar maintenance actions. NOTE: A maintenance actionis an element of a maintenance task. Although the estimated mainteneincetime for different maintenance tasks may be similar, the actions may bedifferent, that is, one task may involve significant diagnostics andanother involve minimum diagnostics but significant access time.
(2) Similar estimated maintenance times. The maintenance timesin each group shall be within a range that shall not exceed the smallestvalue in the group by more than 50 percent.
Supersedes page 20 of March 1973
20

MIL-STD-471A10 Jan 1975
Task grouping shall be limited to within major units identified incolumn 1.
h. column 9 - Determine the total failure rate for each taskgrouping identified in Column 8. The total failure rate is equalto the sum of the products of Columns 5 x 6 x 7 for all tasks withinthe group.
i. column 10 - Determine the relative frequency of occurrencefor each task grouping by dividing the sum of the total failure rate(sum of Column 9) into the individual total failure rate for each group.
j. column 11 - Fixed Sample - A sample of maintenance tasksequal to at least four times the sample size specified for theselected test method (Appendix B) or as specified by the procuring activity,shall be allocated among the task groups in accordance with the relativefrequency of occurrence of the task group. Example: Assume the test methodto be employed requires that a sample of 50 maintenance tasks be demonstrated,a sample of 200 tasks (4 x 50) shall be allocated among the task groups asfollows:
Group 1 - .177 X 200 = 35 tasks;
Group 2 - .178 X 200 = 36 tasks;
Group 3 - .016 X 200 = 3 tasks;
Group 7 - .013 x 200 = 3 tasks,This allocation is shown in Column 11. The maintenance tasks allocatedto each group shall be randomly selected and identified from the populationof maintenance tasks applicable to that group. The total number of maintenancetasks which must be identified for the equipment must be equal to or greaterthan four tires the demonstration sample size (i.e., greater than 4 x 50 = 200for this example) in order that the number of tasks identified with each groupis sufficient such that the allocation of tasks to each group (i.e., 35 tasksfor Group 1; 36 tasks for Group 2, etc.) maybe randomly selected from thepopulation of tasks identified as applicable to that group. The maintenancetasks which have been randomly selected shall not be returned to the samplepool, When a task group consists of more than one module or assembly, etc.,such as group 2 of Table 1, the maintenance tasks assigned to the group(Column 11, 36 tasks for this example) shall be allocated to the modules,assemblies, etc., within the group in accordance with the relative frequencyof occurance of maintenance for each module, etc., within the group. Theprocedure would be the same as that used to determine the relative frequencyof occurrence of the task groups (Column 10) but would be applied to the
Supersedes page 21 of 27 March 1973
21

MIL-STD-471A10 Jan 1975
modules, etc., within the group. This is illustrated below with the allocationshown included in Table I, Column 11, Group 2.
DemonstrationTotal Relative PopulationFailure Rate Freq. of Occ. AllocationGroup 2
A-IF-A 23 .217 7.8 ≈ 8 (.217 x 36 = 7.8)
B-IF-B 21 .198 7.4 ≈ 7
C-Amplifier 21 .198 7.1 ≈ 7
D-Modulator 18 .170 6.0 ≈ 6
E-Power Supply 23 .217106
7.8 » 81.000 36
k. Column 12 - The maintenance tasks to be demonstrated (50 tasksfor this example) shall be allocated among the task groups in accordancewith the relative frequency of occurrence of maintenance for the group.
Example:
Group 1: .177 x 50 = 8.85 ≈ 9 tasks;
Group 2: .178 X 50 = 8.90 ≈ 9 tasks;
Group 3: .016 x 50 = .80 ≈ 1 task,
Group 7: .013 X 50 = .65 » 1 task
If a task group consists of more than one module, assembly, etc., such asgroup 2, Table I, the maintenance tasks to be demonstrated from the group (column 12,9 tasks for this example) shall be allocated to the modules, assemblies, etc.,within the Group in accordance with the relative frequency of occurrence ofmaintenance for each module, etc., within the grow. This is illustrated belowwith the sample allocation shown included in Table I, column 12.
Relative Freq. DemonstrationGroup 2 of Occurrence Sample Size
IF-A .217 1.95 ≈ 2 (.217 X 9 = 1.95)IF-B .198 1.78 ≈ 2Amplifier .198 1.78 ≈ 2Modulator .170 1.53 ≈ 1Power Supply .217 1.95 ≈ 2
9 totalSupersedes page 22 of 27 March 1973
22

MIL-STD-471A27 March 1973
2 5

MIL-STD-471A10 Jan 1975 APPENDIX B
TEST METHODS AND DATA ANALYSIS
B.10 Scope.
B.10.1 Purpose - This appendix contains test methods and criteria fordemonstrating the achievement of specified quantitative maintainabilityrequirements: Some of the test methods included are identical to testmethods contained in previous versions of this Standard. Table IA indicatesthe correspondence of the test methods included in this Standard to thoseincluded in past versions.
B.10.2 Application - The following matrix (Fig. B-1) summarizes the majorcharacteristics of each test method as well as the quantitative requirementswhich must be specified for each test method. The data analysis methodincluded with each test method provides the decision criteria for acceptanceor rejection of the item being demonstrated.
B.10.3 Sample Size - Each of the test plans contained in this appendix includesan equation or other directions for determining a minimum sample size of mainte-nance tasks. Any departure from the minimum sample size requirement can affectthe statistical validity of the test procedures. Some of the test plans inthe appendix require a prior estimate of the variance of the distribution ofinterest for the calculation of sample size. Such prior estimates, subject togovernment approval, can be obtained from data on similar equipment providedsimilarities in maintainability design, skill levels of maintenance personnel,test equipment, manuals and the maintenance environment are considered in theestimation process. Equations for predicting the variance when prior estimatesare not available are presented in DDC document AD-869396, MaintainabilityPrediction and Demonstration Techniques, Vol. II, cited in para. B.10.6, whichcan be used, provided the information needed for the prediction is available.The 85th - 95th upper confidence bound on the predicted or estimated varianceshall be used to insure preservation of the desired risk values. Average observedvalues of the variance have ranged from
B.10.4 Task Selection - Selection of tasks to be sampled when employing faultsimulation will be made in accordance with Appendix A of this standard. TheProcuring Activity shall have the option of surveillance over and/or participat-ing in the random selection of tasks comprising the demonstration population(Column 11 of Table I) down to and including the specific faults to be simulated.This shall occur at a specific conference at a time established by the contractor,consistent with the Maintainability Program Plan schedule. In the event thattasks so chosen can result in events detrimental to safety of personnel orproperty, appropriate redesign action must take place; in the event that secondaryfailures result, they will be documented and their impact on item maintainabilityassessed. A report of such findings shall be made to-the procuring activity.Care must be exercised in selecting and sampling tasks to insure that a truesimple random sample is obtained when sequential tests are employed. Departuresfrom simple random sampling, such as proportionate stratified sampling, caneffect the validity of the test procedures presented herein, however, this effectis considered minimal forare not sequential tests.tests.Supersedes page 26 of 27
26
the sample sizes required by the testSimple random sampling shall be used
March 1973
procedures whichfor sequential

MIL-STD-471A10 Jan 1975
B.10.5 Test Selection - In general, the test index to be demonstratedis the primary consideration in selecting a test procedure. Considerablesavings in sample size can be obtained by use of sequential test proceduresin preference to fixed sample tests. As a general rule, however, thesequential test should be used only when prior knowledge (e.g., from theprediction) indicates that the equipment may be much better (or worse)than the specified values.
B.10.5.1 A cross-reference of the test methods in MIL-STD-471A to thosewhich were numbered differently in the original issues, MIL-STD-471(and Notice 1) are listed in Table IA.
TABLE IA, TEST METHOD CROSS-REFERENCE LIST
MIL-STD-471A
Test Method 8
Test Method 9
Test Method 4
Test Method 10
Test Method 11
MIL-STD-471
Test Method 1
Test Method 2
Test Method 3
Test Method 4
Test Method 6
26a


MIL-STD-471A10 Jan 1975
Supersedes page 27 of 27 March 1973 2 7

MIL-STD-471A10 Jan 1975
27a
MIL-STD-471A27 March 1973
The justification for use of the log-normal assumption for correctivemaintenance times is based on extensive analysis of field data which haveshown that the log-normal distribution provides a good fit to the data.However, in those cases where it is suspected that the log-normal assump-tion does not hold (e.g., equipments with a high degree of built-indiagnostics) then a distribution-free method should be employed to in-sure preservation of specified risks.
B.10.6 References - Details and additional references for the test plans(1, 2, 3) presented in this appendix can be found in RADC Technical Report69-356 (AD 869 396), Volume II, entitled: “Maintainability Predictionand Demonstration Techniques.” Copies of this document may be obtainedfrom the Defense Documentation Center, Cameron Station, Alexandria, VA22314.
B.10.7 List of Symbols - The following symbols and notations are commonthe test methods 1 - 3 contained in this appendix:
X = the random variable which denotes the maintence characteristicsof interest (e.g., X can denote corrective maintenance time, preventivemaintenance time, fault location time, manhours per maintenance task,etc.).
= the ith observation or value of the random variable X.
= the sample size
= the sample mean (i.e.,
= E = the true variance of 1nX
= E(X) = the true mean of X.
= Var(X) = the true variance of X.
= the sample variance of X (i.e.,
= the prior estimate of the varianceof the maintenance time
= the (1-p)th percentile of X (i.e.,X.05 = 95th percentilw of X)
= X = the median of X.50
= 1n X = the naturallogarithm of X.
= the sample mean of Y
= E(1n X) = the true mean of 1n X.
= the prior estimate of the variance of the logarithm of main-tenance times
28


MIL-STD-471A27 March 1973
the sample variance of in X.
the standardized normal deviate exceeded with probability p(i. e.,
= standardized normal deviate exceeded withprobabilities and (1- β ) respectively.
the producer’s risk, the probability that the equipment willbe rejected when it has a true value equal to the desiredvalue
the consumer’s risk; the probability that the equipment will beaccepted when it has a true value equal to the maximum tolerablevalue
the desired value specified in the contract or specificationand is expressed as a mean, critical percentile, criticalmaintenance time.
the maximum tolerable value. Note:
When X is a log-normally distributed random variable:
If Y = in X, the probability density of Y is normal with meanvariance
Properties of the log-normal distribution:
mean =
variance =
median =
mode =
(1-p)th percentile =
29

MIL-STD-471A10 Jan 1975
Table of standardized normal deviates:
.01 2.33
.05 1.65
.10 1.28
.15 1.04
.20 .84
.30 .52
B.10.8 List of Symblos. The following symbols are common to the test methods4, 8 - 11 contained in this Appendix:
task).
task).
=Maintentenance downtime per corrective maintenance task (of the
= Maintenance downtimeper preventive maintenance task (of the
= Number of corrective maintenance tasks sampled.
= Number of preventive maintenance tasks occurring
= Consumer’s risk.
= That value, corresponding to risk, which is obtained froma table of normal distribution for a one-tail test.
= Number of expected corrective maintenance tasks occurringduring a representative operating time (T).
= Number of expected preventive maintenance tasks occurringduring a representative operating time (T).
= Item representative operating time period.
= Total maintenance downtime in the representative operatingtime (T).
= Mean downtimes of sample. (Corrective, Preventive, and combinedCorrective/Preventive Maintemnce Times.)
= Sample calculated maximum corrective maintenance downtime.
= Specified mean corrective maintenance time.
= Specified mean preventive maintenance time.Supersedes page 30 of 27 March 1973
30

MIL-STD-471A10 Jan 1975
= Specified mean maintenance time. (Taking both correctiveand preventive maintenance time into account. )
= A requirement levied in terms of a maximum value of apercentile of task times (i.e., 95% of all correctivetask times must be less than 60 minutes) usually takenas the 90th or 95th percentile.
= Specified of corrective maintenance downtimes.
= Specified of preventive maintenance downtimes.
= Expected value of the logarithms of correctivemaintenance tasks.
= Log to the base 10 of
= Natural logs of
= Median value of corrective maintenance tasks.
= Median value of preventive maintenance tasks.
30a


MIL-STD-471A10 Jan 1975
TEST METHOD 1
B.20 General - This test provides for the demonstration of maintainabilitywhen the requirement is stated in terms of both a required mean value (µ1)and a design goal value (µo) (or when the requirement is stated in terms ofa required mean value (µl) and a design goal value (µO) is chosen by thecontractor). The test plan is subdivided into two basic procedures, identifiedherein as Test Plan A and Test Plan B. Test A makes use of the lognormalassumption for determining the sample size, whereas Test B does not. Bothtests are fixed sample tests, (minimum sample size of 30), which employ theCentral Limit Theorem and the asymptotic normality of the sample mean fortheir development.
B.20.1 Assumptions - Test A - Maintenance times can be adequately describedby a lognormal distribution The variance, σ 2 , of the logarithms of themaintenance times is known from prior information or reasonably preciseestimates can be obtained. Test B - No specific assumption concerning thedistribution of maintenance are necessary. The variance d2 of themaintenance times is known from prior information or reasonably preciseestimates can be obtained.
B.20.2
B.20.3risk β,
Hypotheses - H0: Mean = µ0 (1-1)
H1 : Mean = µ1, (µ1>µ0) (l-2)
Illustration: H0: µ0 = 30 min.
H1: µ1 = 45 min.
Sample Size - For a test with producer’s risk α and consumer’sthe sample size for Test A is given by:
where is a prior estimate of the variance of the logarithms of maintenance
(1-3)
where is a prior estimate of the variance of the logarithms of maintenancetimes. The sample size for Test B is given by:
(1-4)
are standardized normal deviates.
B.20.4 Decision Procedure. Obbtain a random sample of n maintenance times,X1, X2, . . . , X n, and compute the sample mean,
Supersedes page 31 of 27 March 197331
(l-5)
MIL-STD-471A10 Jan 1975
and the sample variance
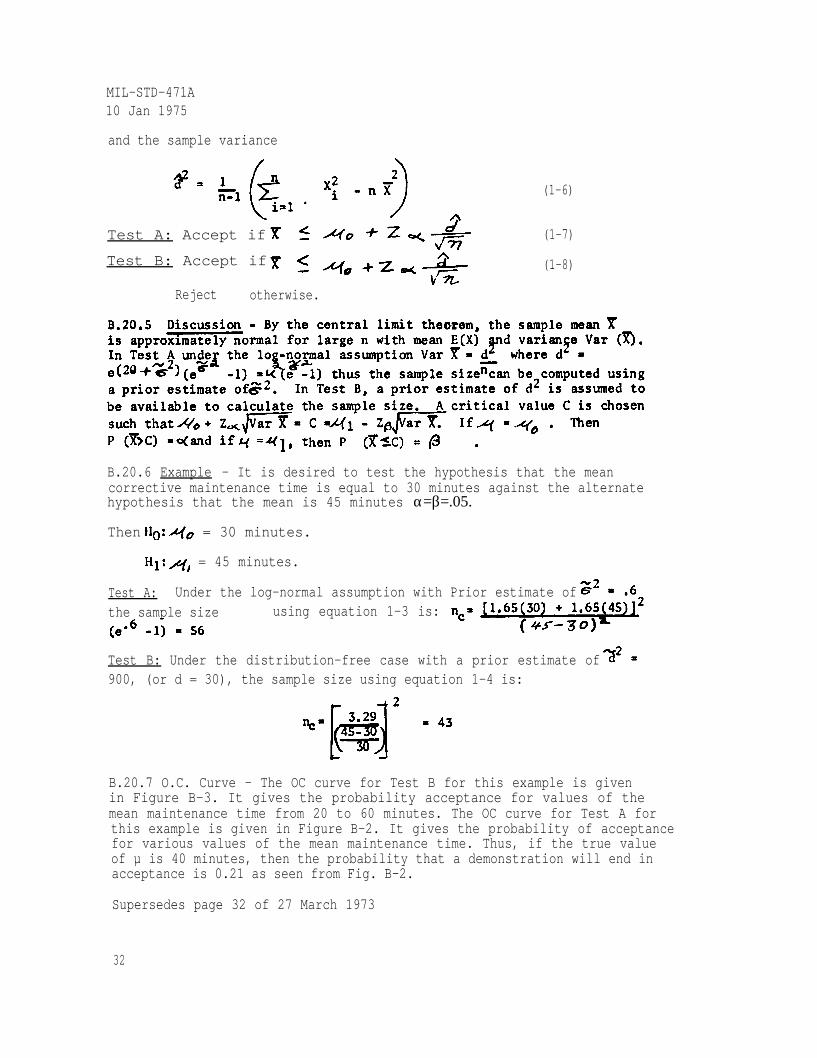
Test A: Accept if
(1-6)
(1-7)
(1-8)Test B: Accept if
Reject otherwise.
B.20.6 Example - It is desired to test the hypothesis that the meancorrective maintenance time is equal to 30 minutes against the alternatehypothesis that the mean is 45 minutes α=β=.05.
Then = 30 minutes.
= 45 minutes.
Test A: Under the log-normal assumption with Prior estimate ofthe sample size using equation 1-3 is:
Test B: Under the distribution-free case with a prior estimate of900, (or d = 30), the sample size using equation 1-4 is:
B.20.7 O.C. Curve - The OC curve for Test B for this example is givenin Figure B-3. It gives the probability acceptance for values of themean maintenance time from 20 to 60 minutes. The OC curve for Test A forthis example is given in Figure B-2. It gives the probability of acceptancefor various values of the mean maintenance time. Thus, if the true valueof µ is 40 minutes, then the probability that a demonstration will end inacceptance is 0.21 as seen from Fig. B-2.
Supersedes page 32 of 27 March 1973
32

MIL-STD-471A27 March 1973
33A

MIL-STD-471A10 Jan 1975
TEST METHOD 2
TEST ON CRITICAL PERCENTILE
B.30 General - This test provides for the demonstration of mainabilitywhen the requirement is stated in terms of both a required criticalpercentile value (T1) and a design goal value (T0) [or when the requirementis stated in terns of a required percentile value (T0) and a design goalvalue (T0) is chosen by the contractor]. If the critical percentile is setat 50 percent, then this test method is a test of the median. The test is afixed sample size test. The dexision criterion is baed upon the asymptoticnormality of the maximum likelihood estimate of the percentile value.
B.30.2 Hypotheses - (2-1)
(2.2)
Illustration:
B.30.3 Sample Size - To meet specified a and b risks, the sample sizeto be used is given by the formula
(Round up to next integer)(2-3)
whereis a prior estimate of , the variance of the logarithms of the
maintenance times.
Zp is the standatised normal deviate corresponding to the (1 - p) nomal deviatepercentile.
B.30.4 Decision Procedure - Compute
(2-4)
(2-5)
Supersedes page 34 of 27 March 197334

MIL-STD-471A10 Jan 1975
Accept if
(2-6)
(2-7)
Reject otherwise.
B.30.6 Example - The following hypotheses are to be tested at α=β= .10
H0: 95th percentile = X.05 = 1.5 hours = T0; 1nT0 = .4055
H1; 95th percentile = X.05 = 2.0 hours = T1; 1nT1 = .6932
A prior estimate of is equal to 1.0 using equation 2-3.
or
nc= 187
The critical value “ is given by equation 2-5
or
X* =.4055 + 0.1437S
B.30.7 OC Curve - The OC curve for Test Method 2 for this exampleis given in Figure B-4. It gives the probability of acceptance forvarious values of the 95th percentile of the maintenance time distribu-tion. If the true value of X0.05 is 1.7 hours, then the probabilitythat a demonstration will end in acceptance is 0.57 as seen fromFigure B-4.
35Supersedes page 35 of 27 March 1973

MIL-STD-471A27 March 1973
3 6

MIL-STD-471A10 Jan 1975
TEST METHOD 3
TEST ON CRITICAL MAINTENANCE TIME OR MANHOURS
B.40 General - This test provides for the demonstration of maintainabilitywhen the requirement is specified in terms of both a required criticalmaintenance time (or critical manhours) and a design goal value
(or when the requirement is stated in terms of a required critical maintenancetime and a design goal value is chosen by the contractor). The
test is distribution-free and is applicable when it is desired to establishcontrols on a critical upper value on the time or manhours to perform specificmaintenance tasks. In this test both the null and alternate hypothesis referto a fixed time and the percentile varies. It is different from Test Method 2where the percentile value remains fixed and the time varies.
B.40.1 Assumptions - No specific assunmption is necessary concerning thedistribution of maintenance time or manhours.
B.40.2 Hypothesis -
For specified α and β:
Illustration - H0: 30 min. = X0.05 = 50th
H1: 30 min. = X0.05 = 25th
B.40.3 Sample Size, n, and Acceptance Number, c - The normal approximationto the binomial distribution is employed to find n and c when p0 is not asmall value. Otherwise, the Poisson approximationequations for n and c are as follows:
percentile
percentile
(3-1)
(3-2)
(median)
(Use next higherinteger value.)
(3-3)
(Use next lowerinteger value.)
(3-4)
For this case n and c can be found from the following two equations:
Supersedes page of 27 March 1973 37

MIL-STD-471A27 March 1973
(3-5)
(3-6)
Table B-I provides sampling plans for various a and b risks andratios p1/p0 when p0<0.20.
B.40.4 Decision Procedure. Random samples of maintenance times aretaken, yielding n observations X1, X2, . . . . X . The number of suchobservations exceeding the specified time T is counted. This numbercalled r.
is
Accept H0 if r ≤ c. (3-7)
Reject H0 if r > c. (3-8)
B.40.5 Discussion. In the development of the decision criteria andsample size, equations for this test,the normal or Poisson approxima-tion to the binomial distribution is used.
. -
B.40.6 Example. A median value of 30 minutes is considered acceptablewhereas if 30 minutes is the 25th percentile then this is consideredunacceptable. The following hypotheses result: (a=b= .10)
H0: 30 minutes = X0.05= 50th percentile median
H1: 30 minutes = X0.75 = 25th percentile
Then Z α = Z β = 1.28, p0 = .50, p1 = .75 using equations 3-3 & 3-4.
and,
B.40.7 OC Curve - The OC curve for Test Method 3 for this example isgiven in Figure B-5. It gives the probability of acceptance for valuesof probability p, varying from 0.3 to 1.0. Here Xp is (1-p) th percentile.Thus, if the true value of the given critical maintenance time is 40thpercentile, i.e., if the value of p is 0.6, then the probability that ademonstration will end in acceptance is 0.61 as seen from Fig. B-5.
38
MIL-STD-471A10 Jan 1975
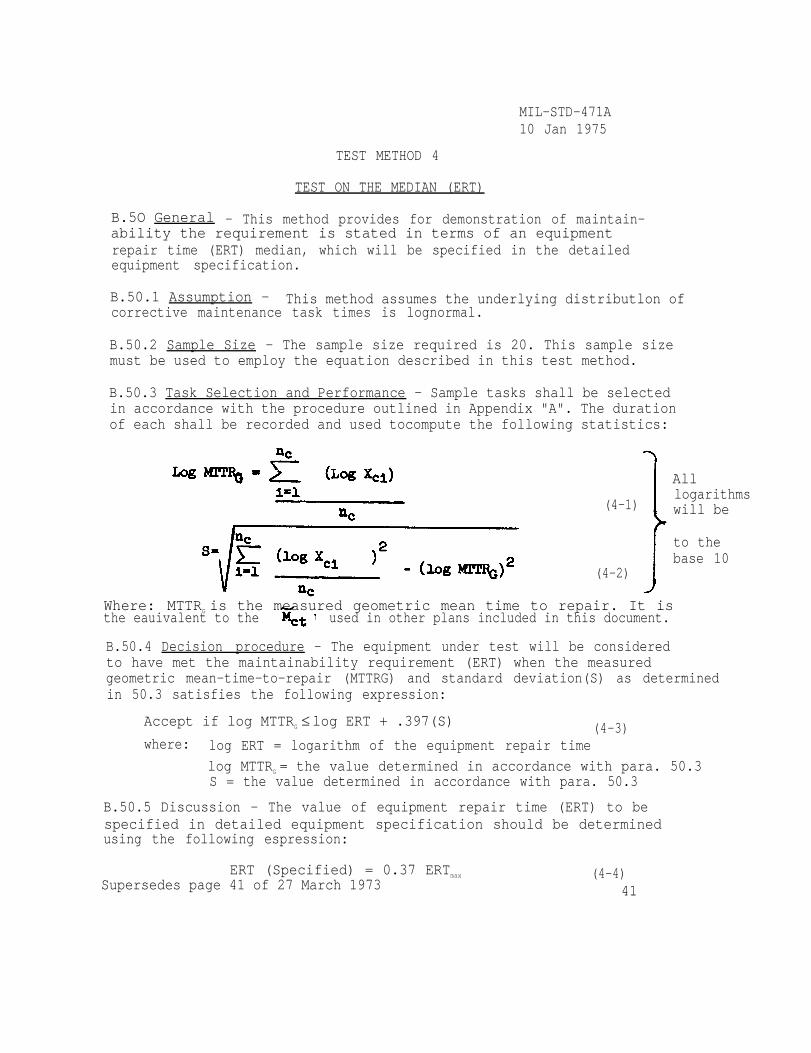
TEST METHOD 4
TEST ON THE MEDIAN (ERT)
B.5O General - This method provides for demonstration of maintain-ability the requirement is stated in terms of an equipmentrepair time (ERT) median, which will be specified in the detailedequipment specification.
B.50.1 Assumption - This method assumes the underlying distributlon ofcorrective maintenance task times is lognormal.
B.50.2 Sample Size - The sample size required is 20. This sample sizemust be used to employ the equation described in this test method.
B.50.3 Task Selection and Performance - Sample tasks shall be selectedin accordance with the procedure outlined in Appendix "A". The durationof each shall be recorded and used tocompute the following statistics:
All
(4-1)logarithmswill be
to thebase 10
(4-2)
Where: MTTRG is the measured geometric mean time to repair. It isthe eauivalent to the used in other plans included in this document.
B.50.4 Decision procedure - The equipment under test will be consideredto have met the maintainability requirement (ERT) when the measuredgeometric mean-time-to-repair (MTTRG) and standard deviation(S) as determinedin 50.3 satisfies the following expression:
Accept if log MTTRG ≤ log ERT + .397(S) (4-3)where: log ERT = logarithm of the equipment repair time
log MTTRG = the value determined in accordance with para. 50.3S = the value determined in accordance with para. 50.3
B.50.5 Discussion - The value of equipment repair time (ERT) to bespecified in detailed equipment specification should be determinedusing the following espression:
ERT (Specified) = 0.37 ERTmax
Supersedes page 41 of 27 March 1973(4-4)
41

MIL-STD-471A10 Jan 1975where:
0.37 =
the maximum value of ERT that should be accepted nomore than 10 percent of the time.
a value resulting from application of “student's t“operating characteristics that assures a 95 percentprobability that an equipment having an acceptableERT will not be rejected as a result of the maintain-ability test when the sample size is 20, and assuminga population standard deviation (σ) of 0.55.
B.50.5.1 Derivation of Criteria - The following are brief explana-tions of the derivations of various criteria specified herein, andare intended for information purposes only. The acceptance
assures a probability ofcriterion, log .95 of accepting an equipment or system as a result of one testwhen the true geometric mean-time-to-repair is equal to the specifiedequipment repair time (that is, a probability of 0.05 of rejecting anequipment or systems having a true MTTRG equal to the specified ERT).This was derived by using conventional methods for establishingacceptance criteria. The conventional methods for determiningacceptance based on the measured mean of a small sample (that is,sample size less than 30), and when the true standard deviation (σ)of the population can only be estimated, is to compare the measuredmean with the desired mean using the expression:
where:
or the standard deviation of the sample;
= the sample or measured mean
= the specified or desired mean
= the sample size
= the value of one measurement of the sample
The decision to accept the product will be made when the test resultsgive a value of t, as calculated from the above expression numericallyless than or equal to a value of t obtained from "student's t"
42Supersedes page 42 of 27 March 1973

MIL-STD-471A10 Jan 1975
distribution tables at the established level (that is, 0.99, 0.95,0.90, and so forth) of acceptance and the appropriate sample size.The "student's t" distribution tables (for a single tailed area)give a value of t = 1.729 at the 0.95 acceptance level when thesample size is 20 (that is, 19 degrees of freedom). The table forsingle tailed area is used since only values of MTTRG greater thanthe specified ERT are critical. An equipment with any value ofMTTRG lower than the specified ERT is acceptable. To_ apply theexpression for "t" to the maintainability test, let X0 = log ERT(specified), log MTTRG (measured), S = the measured standarddeviation of the logarithms of the sample of measured repair time,and = the sample size of 20. The measured MTTRG is then comparedwith the desired ERT by calculating the value of t using the expres-sion below:
The equipment under test can be acceptable if the value of t calculatedfrom the expression above is equal to or less than 1.729 (the valueof t from the "student's t" distribution tables at an acceptable levelof .95 when the sample size is 20). Therefore, the equipment shouldbe accepted when:
Upon rearranging and simplifying this expression, the acceptancecriterion is obtained as shown below:
(NOTE: Reference - "Introduction to Mathematical Statistics,"P. Heel, J. Wiley and Sons, Inc., 2nd Edition, 1954, Pp. 222-229)
Supersedes page 43 of 27 March 1973 43

MIL-STD-471A27 March 1973
TEST METHOD 5
TEST ON CHARGEABLE MAINTENANCE DOWNTIME PER FLIGHT
B.60 General - Because of the relatively small size of thedemonstration fleet of aircraft and administrative and operationaldifferences between it and fully operational units, operationalready rate or availability cannot be demonstrated directly.However, a contractual requirement for chargeable downtime perflight can be derived analytically from an operational requirementof operational ready rate or availability. This chargeable downtimeper flight can be thought of as the allowable time (hours) forperforming maintenance given that the aircraft has levied on it acertain availability or operational readiness requirement. Therequirement for chargeable downtime per flight will be establishedusing the procedure in B.60.3. Chargeable downtime per flightcan then be demonstrated using the procedures in B.60.5.
B.60.1 Definitions - The following definitions apply to this testmethod:
A = Availability - A measure of the degree [expressed as aprobability) to which an aircraft is in the operable and committablestate at the start of the mission, when the mission is called for atan unknown (random) point in time. In this standard, availabilityis considered synonymous with operational readiness. The aircraft isnot considered to be in an operable and committable state when it isbeing serviced and is undergoing maintenance (see MIL-STD-721B).
TOT = Total Active Time in Hours.
Active Time = That time during which an aircraft is assigned toan organization for the purpose of performing the organizationalmission. It is time during which:
1. The aircraft is flying or ready to fly.
2. Maintenance is being performed.
3. Maintenance is delayed for supply or administrative reasons.
DUR =
AFL =
NOF =
44
Daily Utilization Rate - The number of flying hours per day.
Average Flight Length - Flying hours per flight.
Number of Flights per Day.
MIL-STD-471ATEST METHOD 8 10 Jan 1975
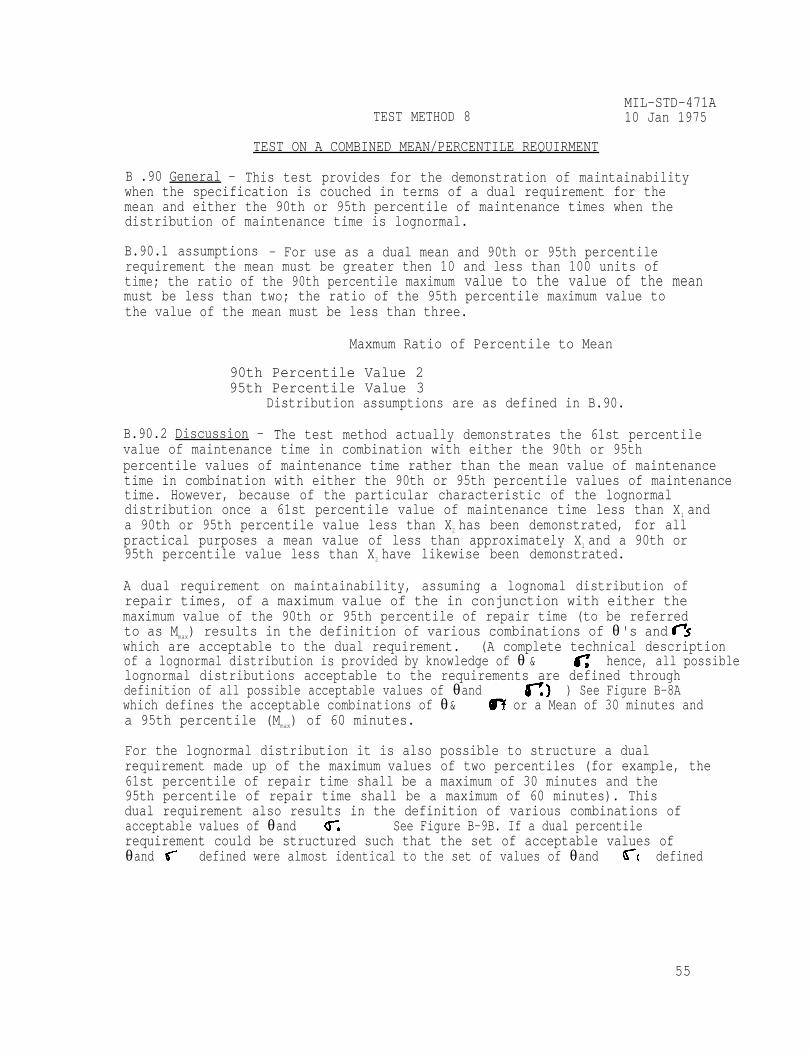
TEST ON A COMBINED MEAN/PERCENTILE REQUIRMENT
B .90 General - This test provides for the demonstration of maintainabilitywhen the specification is couched in terms of a dual requirement for themean and either the 90th or 95th percentile of maintenance times when thedistribution of maintenance time is lognormal.
B.90.1 assumptions - For use as a dual mean and 90th or 95th percentilerequirement the mean must be greater then 10 and less than 100 units oftime; the ratio of the 90th percentile maximum value to the value of the meanmust be less than two; the ratio of the 95th percentile maXimum value tothe value of the mean must be less than three.
Maxmum Ratio of Percentile to Mean
90th Percentile Value 295th Percentile Value 3
Distribution assumptions are as defined in B.90.
B.90.2 Discussion - The test method actually demonstrates the 61st percentilevalue of maintenance time in combination with either the 90th or 95thpercentile values of maintenance time rather than the mean value of maintenancetime in combination with either the 90th or 95th percentile values of maintenancetime. However, because of the particular characteristic of the lognormaldistribution once a 61st percentile value of maintenance time less than X1 anda 90th or 95th percentile value less than X2 has been demonstrated, for allpractical purposes a mean value of less than approximately X1 and a 90th or95th percentile value less than X2 have likewise been demonstrated.
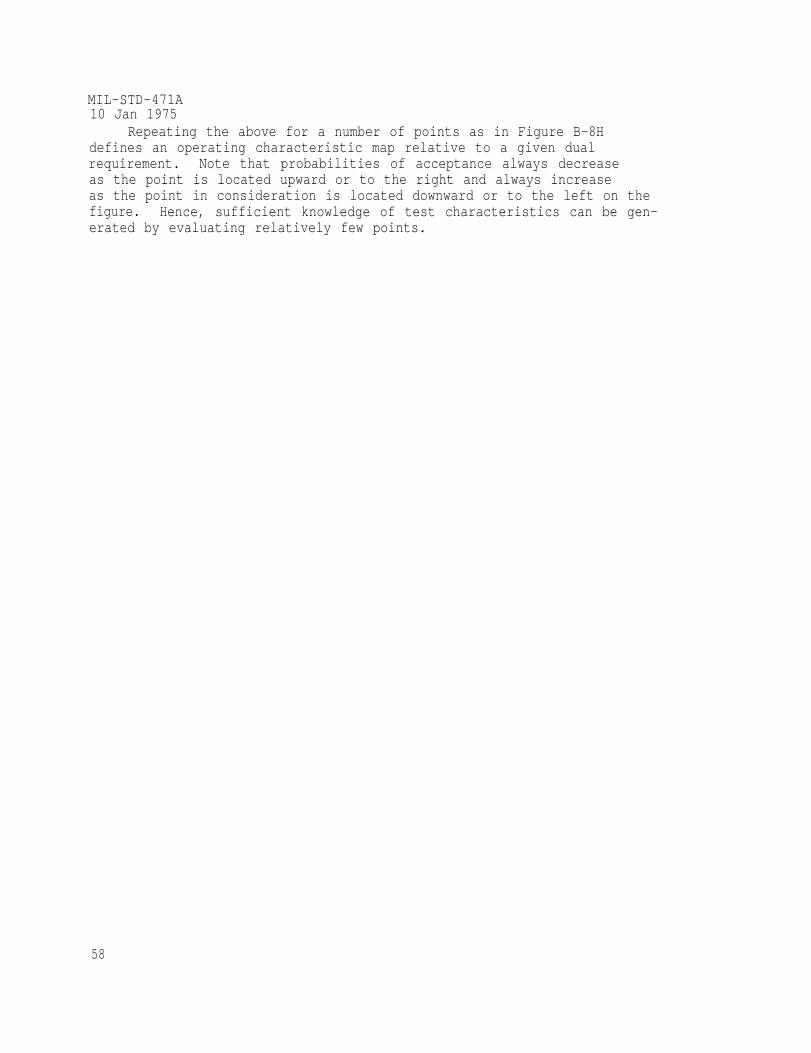
A dual requirement on maintainability, assuming a lognomal distribution ofrepair times, of a maximum value of the in conjunction with either themaximum value of the 90th or 95th percentile of repair time (to be referredto as Mmax) results in the definition of various combinations of θ 's andwhich are acceptable to the dual requirement. (A complete technical descriptionof a lognormal distribution is provided by knowledge of θ & hence, all possiblelognormal distributions acceptable to the requirements are defined throughdefinition of all possible acceptable values of θ and ) See Figure B-8Awhich defines the acceptable combinations of θ & or a Mean of 30 minutes anda 95th percentile (Mmax) of 60 minutes.
For the lognormal distribution it is also possible to structure a dualrequirement made up of the maximum values of two percentiles (for example, the61st percentile of repair time shall be a maximum of 30 minutes and the95th percentile of repair time shall be a maximum of 60 minutes). Thisdual requirement also results in the definition of various combinations ofacceptable values of θ and See Figure B-9B. If a dual percentilerequirement could be structured such that the set of acceptable values ofθ and defined were almost identical to the set of values of θ and defined
55

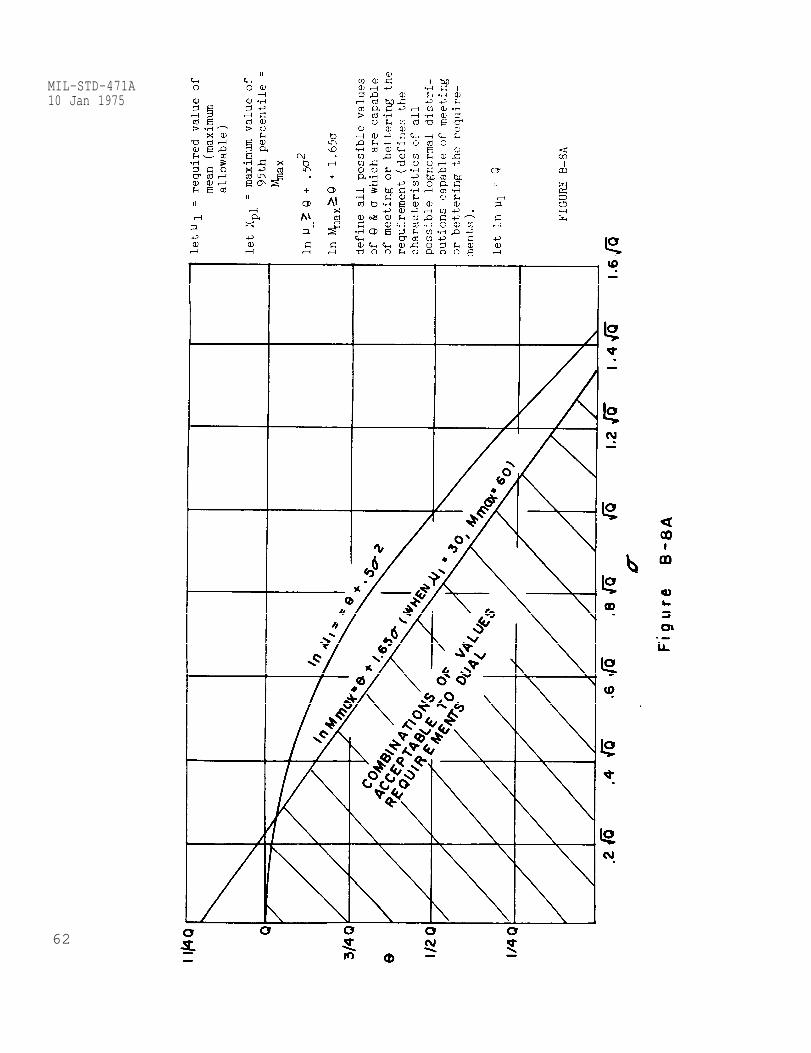
MIL-STD-471A10 Jan 1975for a given dual Mean and percentile requirement then a demonstrationof that dual percentile requirement would in reality also demonstratethe attainment of the dual Mean and Mmax requirement. For thisparticular instance it has been found that under the assumptions listedabove, almost identical acceptable values of θ and are provided for acombined Mean and Mmax requirement and a combined 61st percentile (where
the value of the 61st percentile is taken equal to the specified value of theMean) and Mmax requirement. See Figure B-8B which defines the values ofθ and acceptable to a dual 61st percentile (where the value of the 61stpercentile is taken equal to a specified mean of 30 minutes) and 95thpercentile (where the maximum value of the 95th percentile, Mmax,is givenas 60 minutes) and Figure B-8C which is the superimposition of Figure B-8Aon Figure B-8B.
Therefore, tests performed to demonstrate the attainment of both thepercentiles in question actually demonstrates the attainment of values ofθ & which are almost identically acceptable to a dual requirement of theMean and Mmax. It follows then that an accept decision relative to bothpercentiles would also approximately signify an accept decision for a dualMean and Mmax requirement.
Since both percentiles can be considered independent for practicalpurposes, the same samples can be used for demonstrating both percentiles,therefore, if desired the tests may be run simultaneously.
B.90.3 Procedure - Sample tasks shall be selected with respect to theprocedure defined for variable sample/sequential tests. The same sampletasks may be used simultaneously in the demonstration of both the Meanand Mmax requirements. Table 1*, Table 2*, Table 3* (which are based uponthe sequential probability ratio test of proportion) define the accept/reject criteria for the values of the required mean, Mmax (when definedas the maximum 90th percentile value), Mmax (when defined as the maximum 95thpercentile value), respectively. The number of observations greater thanand less than the required values of the Mean and Mmax shall be cumulatedseparately and compared to the decision values shown in the tables applicableto the two requirements. When one plan provides an accept decision, attentionto that plan shall be discontinued. The second plan shall continue untila decision is reached. The equipment shall be rejected when a decisionto reject on either plan has occurred regardless of the status of the otherplan. The equipment shall be accepted only when an accept decision has beenreached on both plans. If no accept or reject decision has been made after100 observations, the following rule shall apply:
NOTE : *Tables 1, 2 & 3 are appropriate to Test Plans A1, B1 and B2,respectively.
56
MIL-STD-471A10 Jan 1975
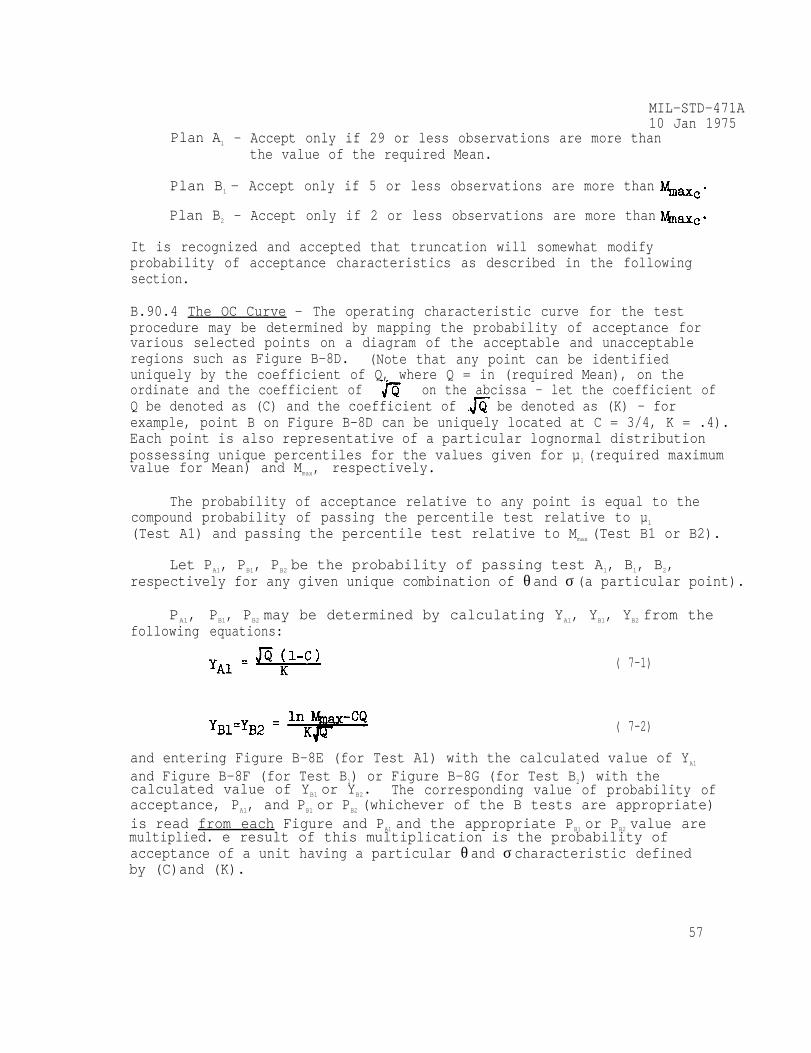
Plan A1 - Accept only if 29 or less observations are more thanthe value of the required Mean.
Plan B1 - Accept only if 5 or less observations are more than
Plan B2 - Accept only if 2 or less observations are more than
It is recognized and accepted that truncation will somewhat modifyprobability of acceptance characteristics as described in the followingsection.
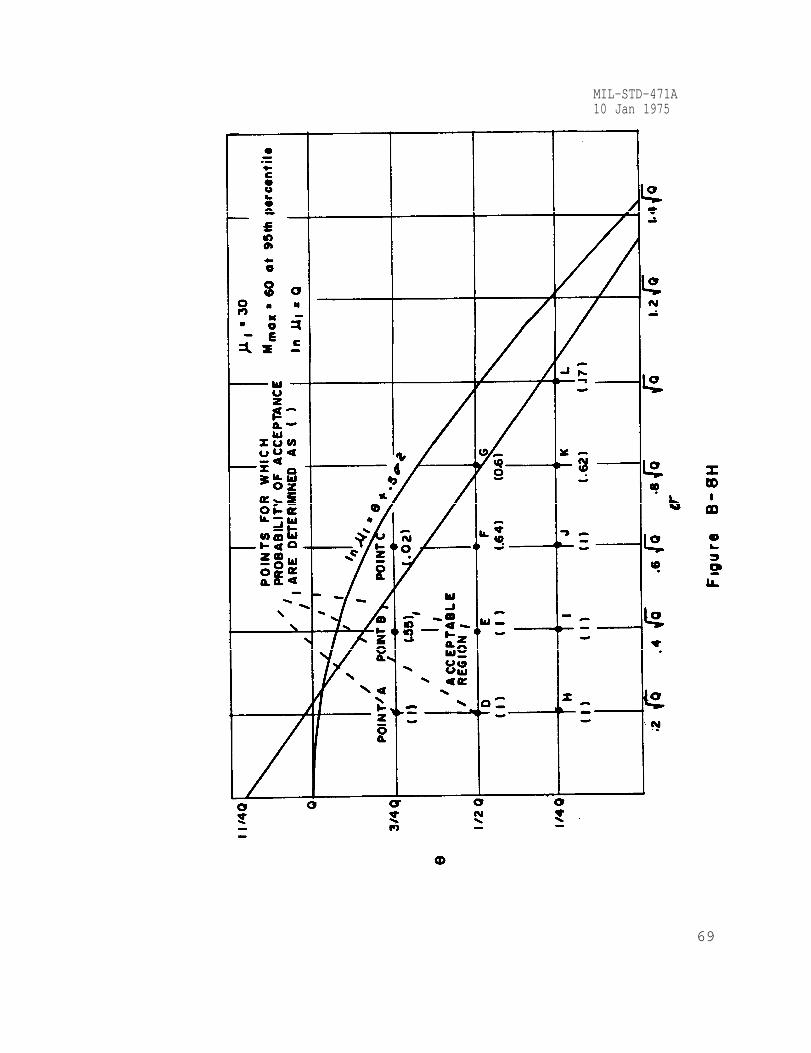
B.90.4 The OC Curve - The operating characteristic curve for the testprocedure may be determined by mapping the probability of acceptance forvarious selected points on a diagram of the acceptable and unacceptableregions such as Figure B-8D. (Note that any point can be identifieduniquely by the coefficient of Q, where Q = in (required Mean), on theordinate and the coefficient of on the abcissa - let the coefficient ofQ be denoted as (C) and the coefficient of be denoted as (K) - forexample, point B on Figure B-8D can be uniquely located at C = 3/4, K = .4).Each point is also representative of a particular lognormal distributionpossessing unique percentiles for the values given for µ1 (required maximumvalue for Mean) and Mmax, respectively.
The probability of acceptance relative to any point is equal to thecompound probability of passing the percentile test relative to µ1
(Test A1) and passing the percentile test relative to Mmax (Test B1 or B2).
Let PA1, PB1, PB2 be the probability of passing test A1, B1, B2,respectively for any given unique combination of θ and σ (a particular point).
PA1,following
PB1, PB2 may be determined by calculating YA1, YB1, YB2 from theequations:
( 7-1)
( 7-2)
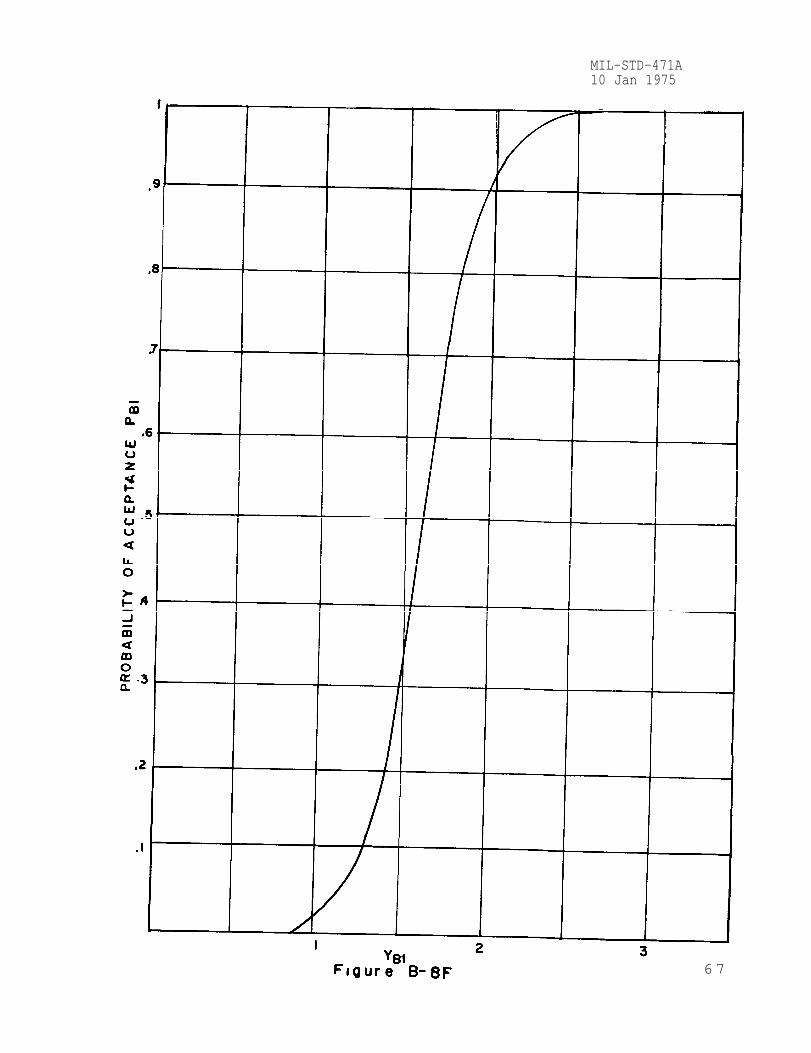
and entering Figure B-8E (for Test A1) with the calculated value of YA1
and Figure B-8F (for Test B1) or Figure B-8G (for Test B2) with thecalculated value of YB1 or YB2. The corresponding value of probability ofacceptance, PA1, and PB1 or PB2 (whichever of the B tests are appropriate)is read from each Figure and PA1 and the appropriate PB1 or PB2 value aremultiplied. e result of this multiplication is the probability ofacceptance of a unit having a particular θ and σ characteristic definedby (C)and (K).
57
MIL-STD-471A10 Jan 1975
Repeating the above for a number of points as in Figure B-8Hdefines an operating characteristic map relative to a given dualrequirement. Note that probabilities of acceptance always decreaseas the point is located upward or to the right and always increaseas the point in consideration is located downward or to the left on thefigure. Hence, sufficient knowledge of test characteristics can be gen-erated by evaluating relatively few points.
58

MIL-STD-471A10jan 1975
59

MIL-STD-471A10 Jan 1975
60

MIL-STD-471A10 Jan 1975
61
MIL-STD-471A10 Jan 1975
62
MIL-STD-471A10 Jan 1975
63

MIL-STD-471A10 Jan 1975
64

MIL-STD-471A10 Jan 1975
6 5

MIL-STD-471A10 Jan 1975
66
MIL-STD-471A10 Jan 1975
6 7
MIL-STD-471A10 Jan 1975
PROBAILITY OF ACCEPTANCE PB2
68
MIL-STD-471A10 Jan 1975
69

MIL-STD-471A Test Method 910 Jan 1975
TEST FOR MEAN MAINTENANCE TIME (CORRECTIVEPREVENTATIVE COMBINATION OF CORRECTIVE AND PREVENTATIVE) AND MMAX
B100. General - This method is applicable to demonstration of thefollowing indices of maintainability: Mean Corrective MaintenanceTime (µC), Mean Preventive Maintenance Time (µpm), Mean Maintenance Time(includes preventive and corrective maintenance actions) (µp/c), and
Mmax (percentile of repair time).
B100.1 Conditions of Use - The procedures of this method for demonstra-tion of µc, are based on the Central Limit Theorem. No informationrelative to the variance (d2) of maintenance times is required. It maytherefore be applied whatever the form of the underlying distribution,provided the sample size is adequate. The minimum sample size is setat 30. The actual sample size (if greater than 30 are required) shallbe determined for each equipment to be demonstrated, and shall beapproved by the procuring activity.
The procedure of this method for demonstrating Mmax is valid forthose cases where the underlying distribution of corrective maintenancetask times is lognormal.
B100.2 Quantitative Requirements - Application of this plan requiresidentification of the index or indices of interest and specification ofquantitative requirements for each. When demonstration involves µc or µpm,or a combination of both, consumer’s risks will be specified. Whendemonstration involves , the percentile point which defines thespecified value of will be specified. A minimum sample size of 30
corrective maintenance tasks is required for demonstration of correctivemaintenance indices. A minimum sample of 30 preventive maintenance tasksis required where demonstration of preventive maintenance indices bysampling is permitted and is to be accomplished by this method.
B100.3 Task Selection and Performance - Sample tasks shall be selectedin accordance with the procedure outlined in Appendix "A." The durationof each shall be recorded and used to compute the following statistics:
70
MIL-STD-471A10 Jan 1975
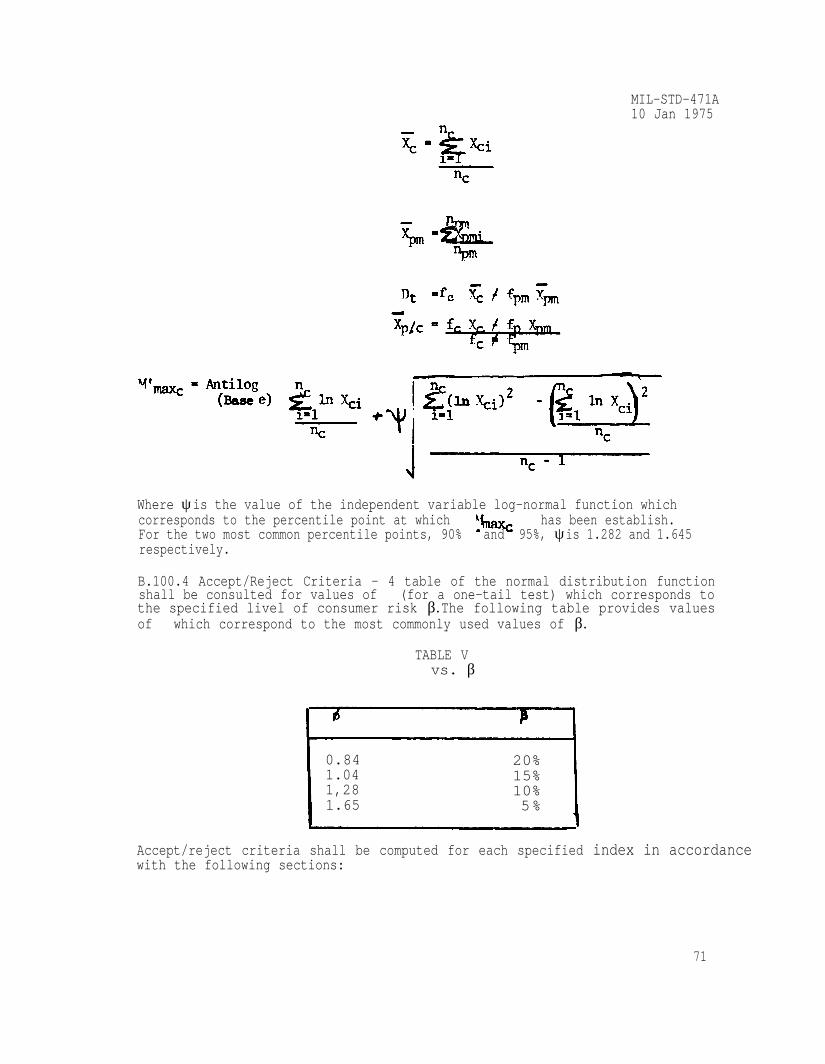
Where ψ is the value of the independent variable log-normal function whichcorresponds to the percentile point at which has been establish.For the two most common percentile points, 90% and 95%, ψ is 1.282 and 1.645respectively.
B.100.4 Accept/Reject Criteria - 4 table of the normal distribution functionshall be consulted for values of ∅ (for a one-tail test) which corresponds tothe specified livel of consumer risk β. The following table provides valuesof ∅ which correspond to the most commonly used values of β.
TABLE V∅ vs. β
0.84 20%1.04 15%1,28 10%1.65 5%
Accept/reject criteria shall be computed for each specified index in accordancewith the following sections:
71
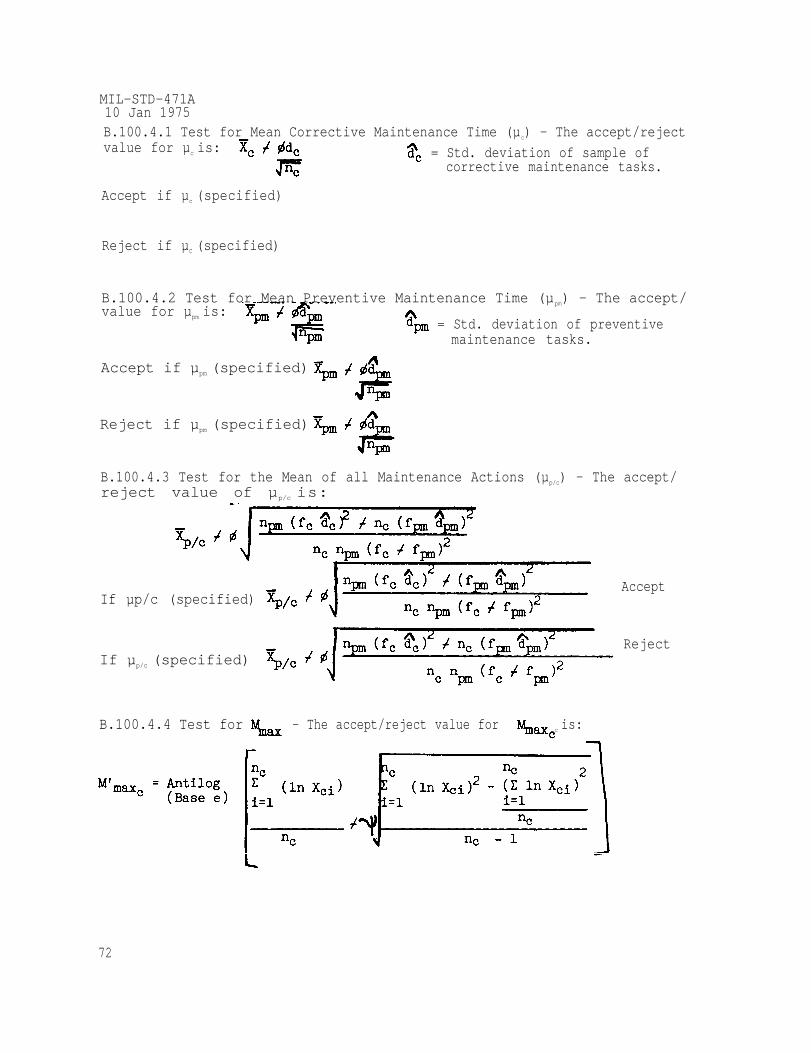
MIL-STD-471A10 Jan 1975B.100.4.1 Test for Mean Corrective Maintenance Time (µc) - The accept/rejectvalue for µc is: = Std. deviation of sample of
corrective maintenance tasks.
Accept if µc (specified)
Reject if µC (specified)
B.100.4.2 Test for Mean Preventive Maintenance Time (µpm) - The accept/value for µpm is:
= Std. deviation of preventivemaintenance tasks.
Accept if µpm (specified)
Reject if µpm (specified)
B.100.4.3 Test for the Mean of all Maintenance Actions (µp/c) - The accept/reject value of µp/c is:
If µp/c (specified)Accept
RejectIf µp/c (specified)
B.100.4.4 Test for - The accept/reject value for c is:
72
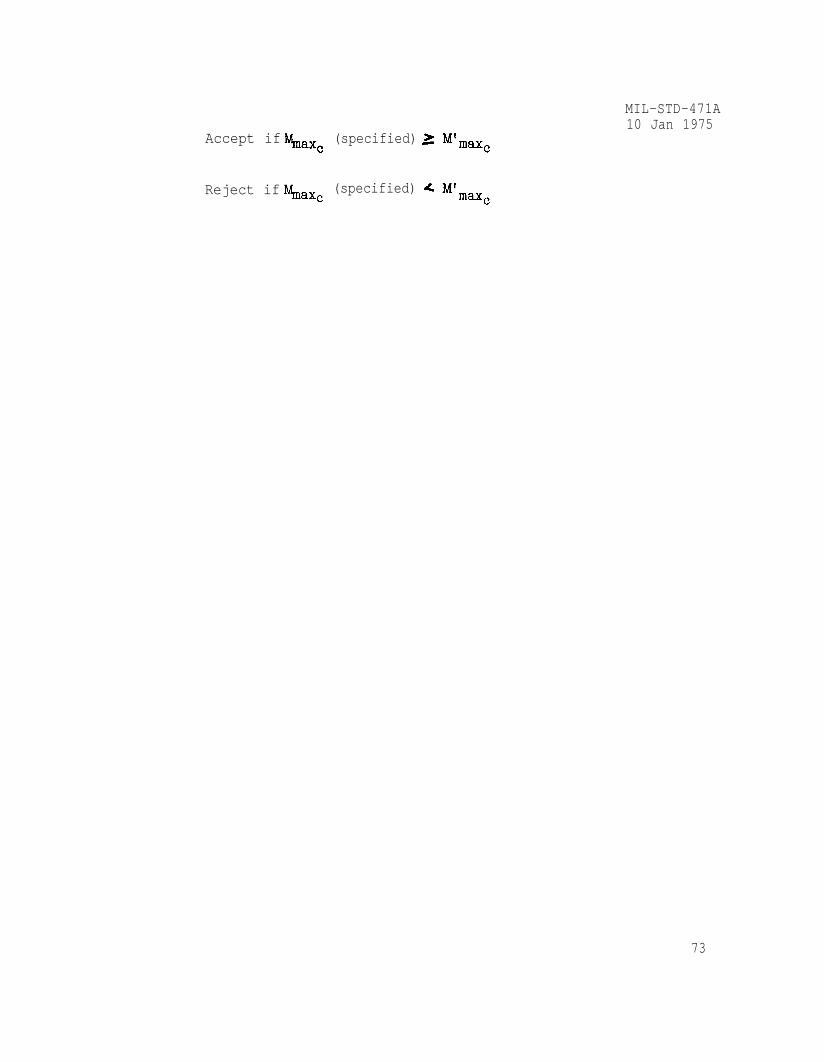
Accept if (specified)
Reject if (specified)
MIL-STD-471A10 Jan 1975
73

MIL-STD-471A Test Method 1010 Jan 1975 TESTS FOR PERCENTILES AND MAINTENANCE
TIME (CORRECTIVE PREVENTATIVE MAINTENANCE)
B110. General - This method employs a test of proportion to demonstrateachievement of when the distribution of
corrective and preventive maintenance repair times is unknown.
B110.1 Conditions of Use - This method is intended for use in caseswhere no information is available on the underlying distribution ofmaintenance task times. The plan holds the confidence level at 75% or90% as may be desired and requires a minimum sample size (N) of50 tasks.
B110.2 Quantitative Requirements - Application of this method requiredspecification of (95th percentile) or (95th
percentile) and selection of 75% or 90% confidence level.
B110.3 Task Selection and Performance - Sample tasks shall be selectedin accordance with the proceudres of Appendix “A.” The duration of eachtask will be compared to the required value(s) of the specified indexor indices and and recorded as greaterthan or lesser than each index.
B110.4 Accept/Reject Criteria - The item under test shall be acceptedwhen the number of observed task times which exceed the required valueof each specified index is less than or equal to that shown in theTable (B-10A or B-10B) corresponding to each index for the specifiedconfidence level.
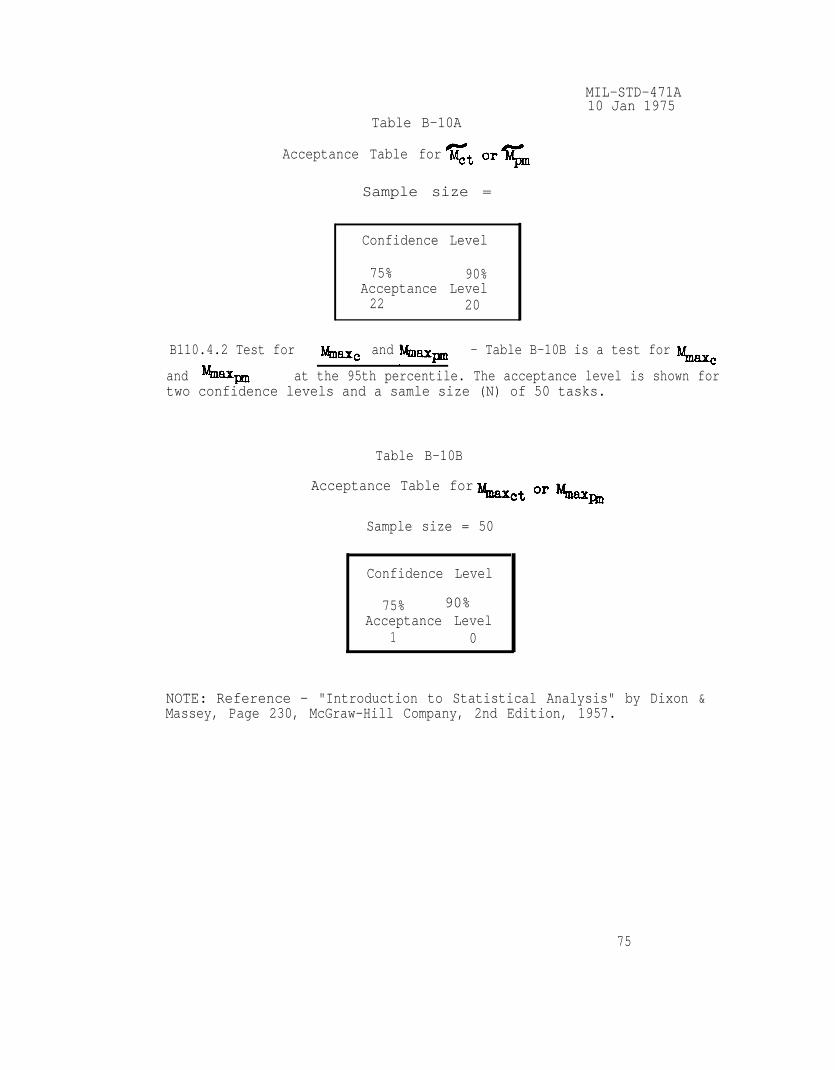
B110.4.1 Test for the Median - Table B-10A below is a test of the medianfor corrective and preventive maintenance tasks. The acceptance levelis shown for two confidence levels and a sample size (N) of 50 tasks.
74
MIL-STD-471A10 Jan 1975
Table B-10A
Acceptance Table for
Sample size =
Confidence Level
75% 90%Acceptance Level22 20
B110.4.2 Test for and - Table B-10B is a test for
and at the 95th percentile. The acceptance level is shown fortwo confidence levels and a samle size (N) of 50 tasks.
Table B-10B
Acceptance Table for
Sample size = 50
Confidence Level
75%Acceptance Level
1 0
90%
NOTE: Reference - "Introduction to Statistical Analysis" by Dixon &Massey, Page 230, McGraw-Hill Company, 2nd Edition, 1957.
75

MIL-STD-471A Test Method 11
10 Jan 1975 TEST FOR PREVENTATIVE MAINTENANCE TIMES
B.120 General - This method provides for maintainability demonstra-tion when the specified index involves µpm and/or and when allpossible preventive maintenance tasks are to be performed.
B.120.1 Conditions of use - All possible tasks are to be performed andno allowance need be made for underlying distribution.
B.120.2 Quantitative requirements - Application of this plan requiresquantitative specification of the index or indices of interest. Inaddition, the percentile point defining must be stipulatedwhen is of interest.
B.120.3 Task selection and performance - All preventive maintenancetasks will be perfomed. The total population of PM tasks will bedefined by properly weighing each task in accordance with relativefrequency of occurrence as follows: Select the particular task forwhich the equipment operating time to task performance is greatestand establish that time as the reference period. Determine the fre-quency of occurrence of all other tasks during the reference period.Where the frequency of occurrence of a given task is a fractional num-ber, the frequency shall be set at the nearest integer. The totalpopulation of tasks consists of all tasks with each repeated in accord-ance with its frequency of occurrence during the reference period.
B.120.4 Accept/reject criteria -
B.120.4.1 Test for the mean shall be computed as follows:
(Actual) =
Where: is the frequency of occurrence of the task in the refer-ence period.
k is the number of different PM tasks.
is the total number of PM tasks in the population.
Accept if:
Reject if:
76

MIL-STD-471A10 Jan 1975
B.120.4.2 Test for
(lowest to highest value). The equipment shall be accepted if themagnitude of the task time at the percentile of interest is equalto or less than the required value of
- The PM tasks shall be ranked by magnitude
77


![MILITARY STANDARD MAINTAINABILITY VERIFICATION ...1].pdf · MIL-STD-471A 27 March 1973 FOREWORD Maintainability, a characteristic of design and installation and affected by various](https://img.dokumen.tips/doc/110x75/5e86202ca61aad02236f3d42/military-standard-maintainability-verification-1pdf-mil-std-471a-27-march.jpg)