Embed Size (px)
Citation preview
Midterm Review
What to do:
Read lectures 1-6, chapters 1-9 and 12-15
from the textbook
Do the assigned exercises from the textbook
Go over the quiz questions
Use sample tests to practice
Use extra TAs' office hours
Topics to review:
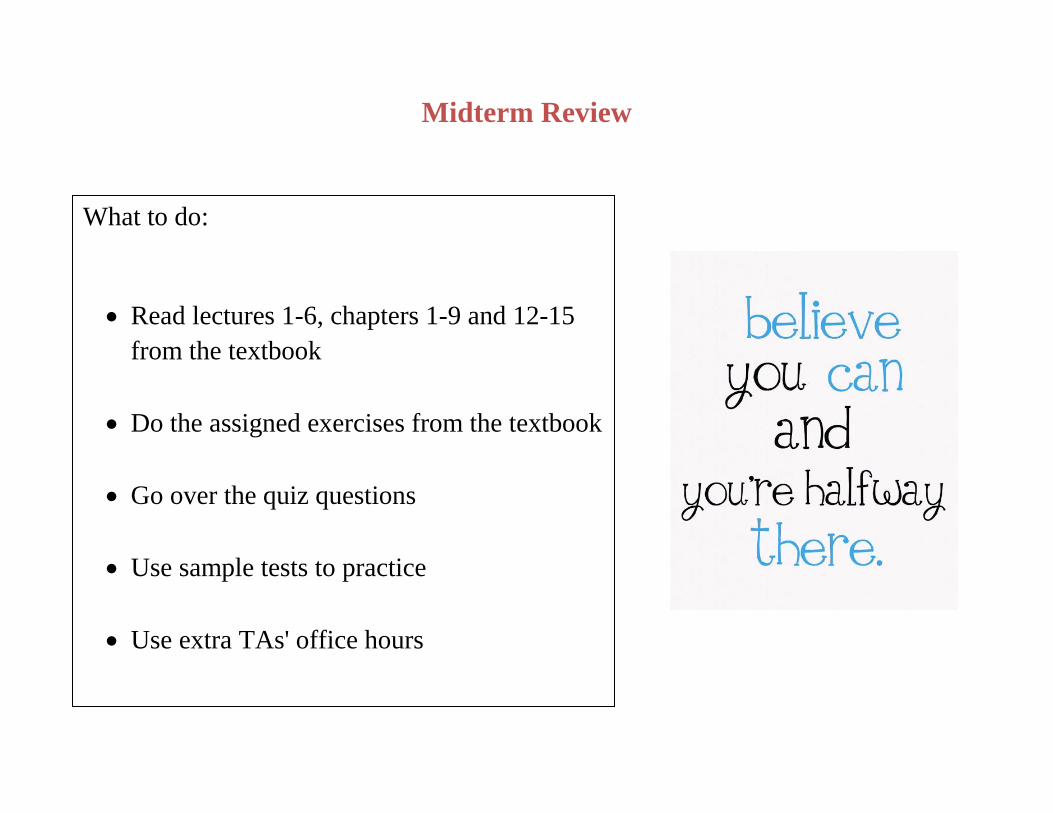
Types of variables
o Categorical
Bar char
Pie chart
Two-way table
Joint distribution
Marginal distribution
Conditional distribution
Independence
o Quantitative
Dot plot
Stemplot
Histogram
Distribution
Shape: symmetric, skewed,
unimodal, etc
Center: mean, median, mode
Spread: range, standard
deviation, percentiles, IQR
Five-number summary
Boxplots
Outliers: 1.5×IQR rule
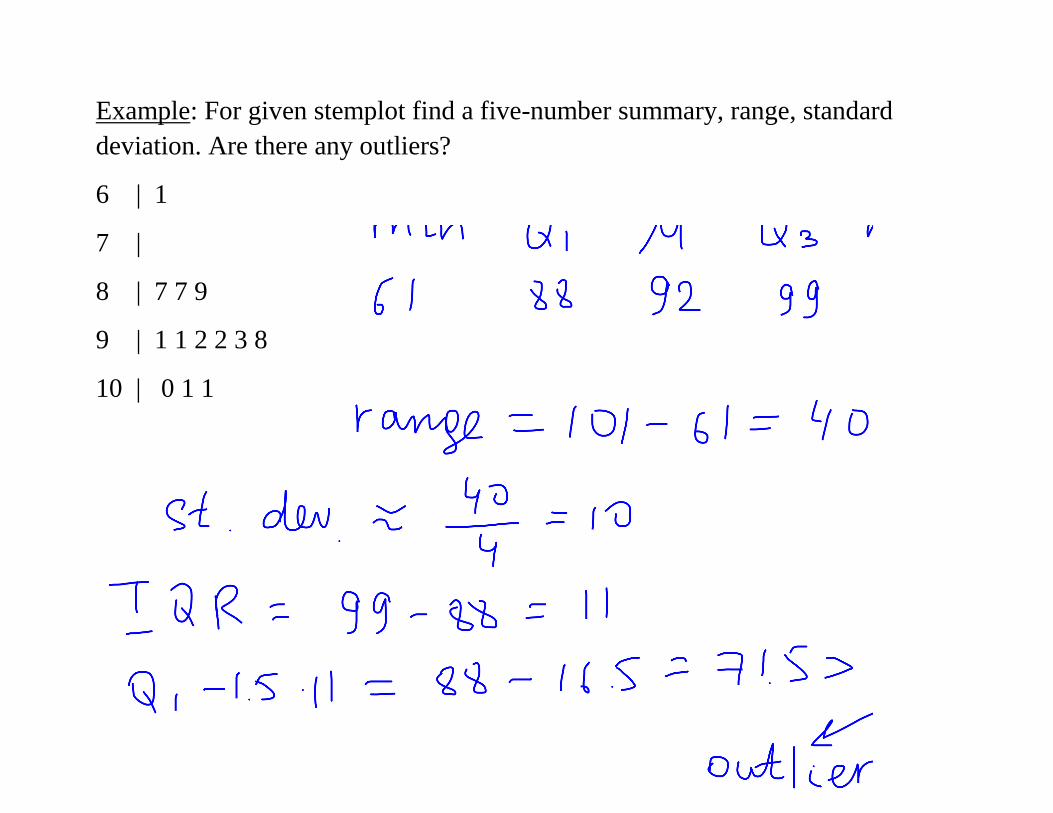
Example: For given stemplot find a five-number summary, range, standard
deviation. Are there any outliers?
6 | 1
7 |
8 | 7 7 9
9 | 1 1 2 2 3 8
10 | 0 1 1
Density Curve
o Normal distribution
Shape: symmetric, unimodal, bell-shaped
Parameters: mean μ and standard deviation
68-95-99.7 Rule
Z-scores
N(0,1)
Z-Table
Inverse Normal calculations
Normal quantile plots
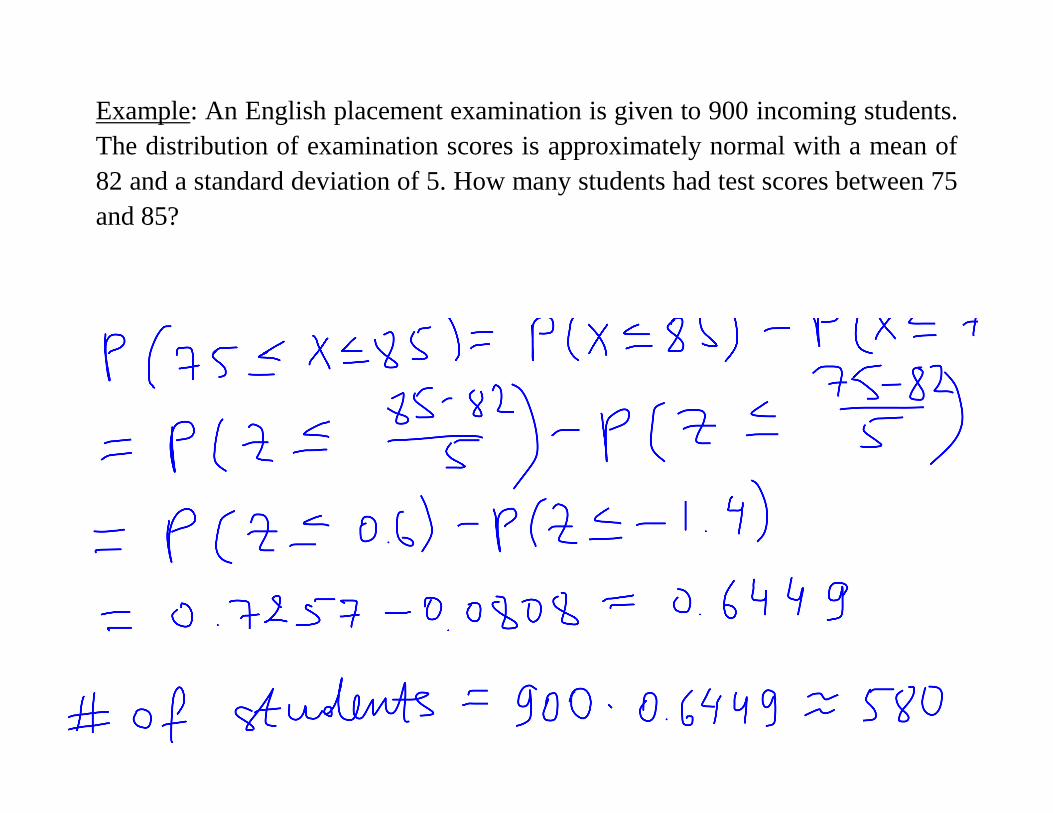
Example: An English placement examination is given to 900 incoming students.
The distribution of examination scores is approximately normal with a mean of
82 and a standard deviation of 5. How many students had test scores between 75
and 85?
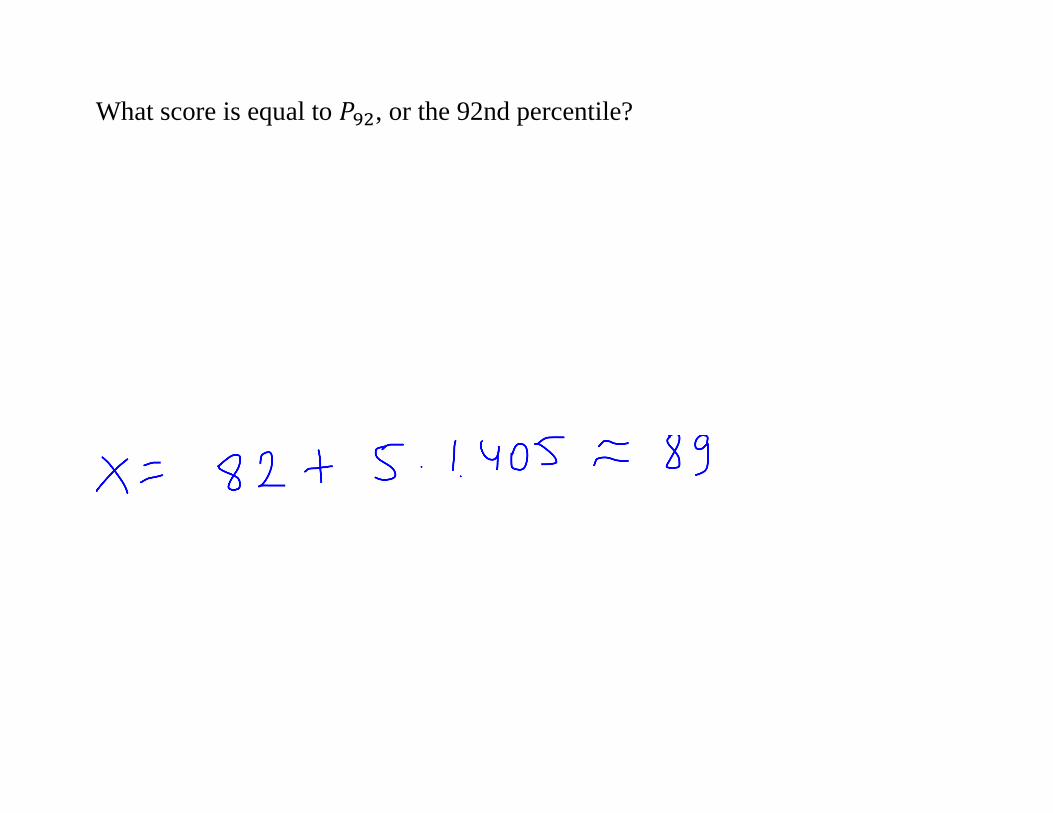
What score is equal to , or the 92nd percentile?
Linear regression
o Scatterplot: overall pattern (form, direction, and strength of the
relationship), outliers, clusters
o Association
Variables: explanatory or response?
Positively or negatively associated?
o Correlation
o Regression line: . How to interpret slope , intercept ?
o How to use regression line for prediction?
o Extrapolation
o Coefficient of determination
o Residuals/residual plots
o Ourliers vs influential observations
o Transformations
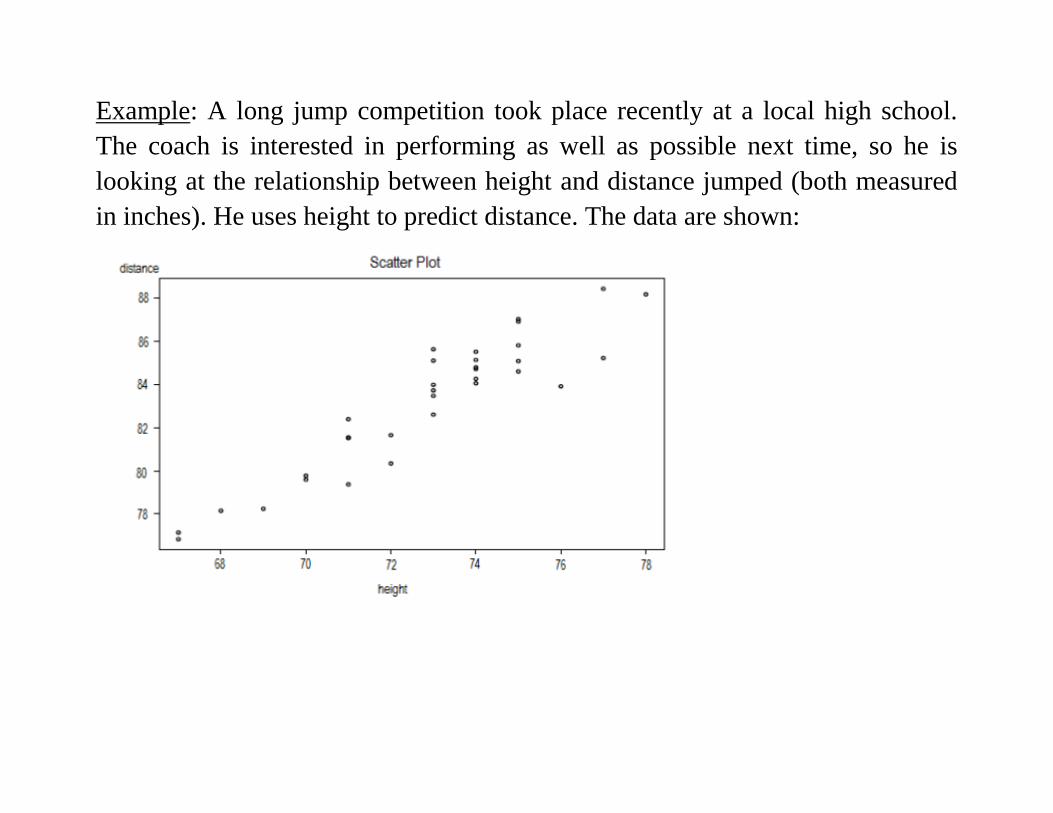
Example: A long jump competition took place recently at a local high school.
The coach is interested in performing as well as possible next time, so he is
looking at the relationship between height and distance jumped (both measured
in inches). He uses height to predict distance. The data are shown:

Which statement is correct about the scatter plot?
(A) There is negative linear relationship between the two variables.
(B) There is no apparent relationship between height and distance.
(C) There is positive linear relationship between the two variables.
(D) As height increases distance increases.
(E) There is a negative quadratic relationship between height and distance.
Which of the following is true?
(A) Both height and distance are explanatory variables.
(B) Height is the explanatory variable.
(C) Height is the response variable.
(D) Distance is the explanatory variable.
(E) Distance is the explanatory variable and height is the response variable.
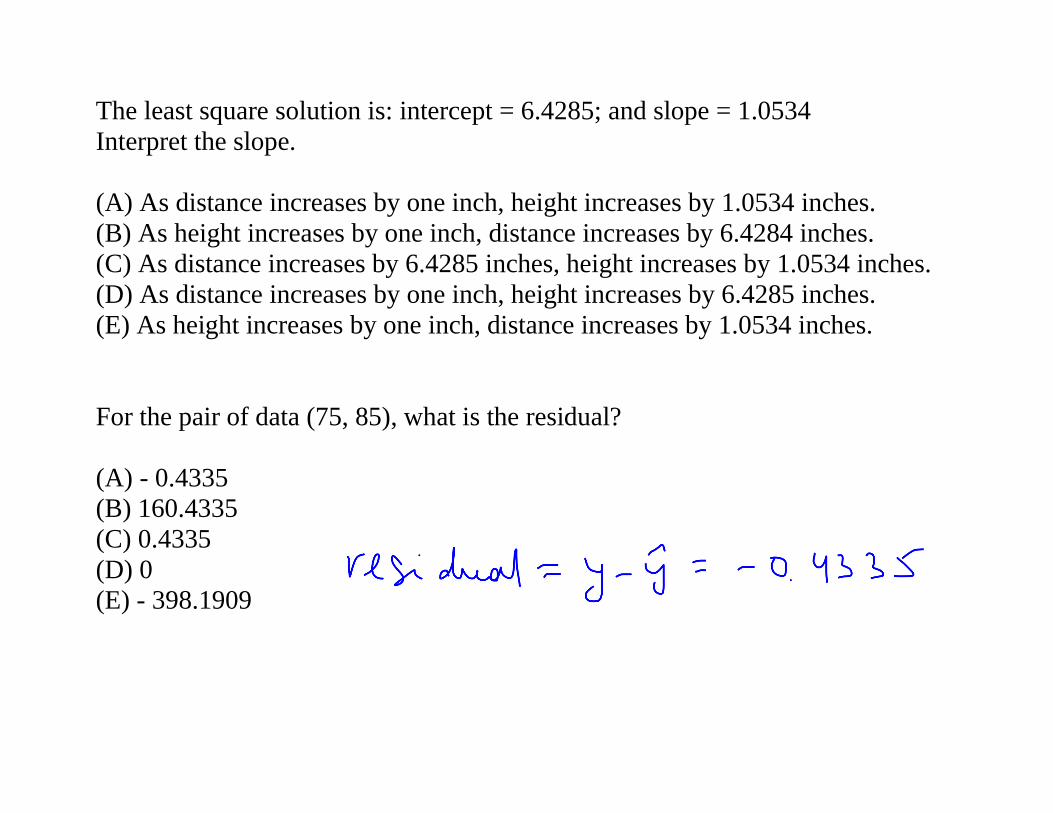
The least square solution is: intercept = 6.4285; and slope = 1.0534
Interpret the slope.
(A) As distance increases by one inch, height increases by 1.0534 inches.
(B) As height increases by one inch, distance increases by 6.4284 inches.
(C) As distance increases by 6.4285 inches, height increases by 1.0534 inches.
(D) As distance increases by one inch, height increases by 6.4285 inches.
(E) As height increases by one inch, distance increases by 1.0534 inches.
For the pair of data (75, 85), what is the residual?
(A) - 0.4335
(B) 160.4335
(C) 0.4335
(D) 0
(E) - 398.1909
Data collection
o Observational study: retrospective or prospective
o Experiment: randomized, comparative, single- or double-blind,
placebo-controlled
o Design of Experiment: subjects, factors, treatments; matched pairs,
blocking
o Randomization (use of random digits)
o Sampling design
Population vs sample (parameter vs statistic)
SRS
Stratified random sample
Cluster sampling
Multistage sampling
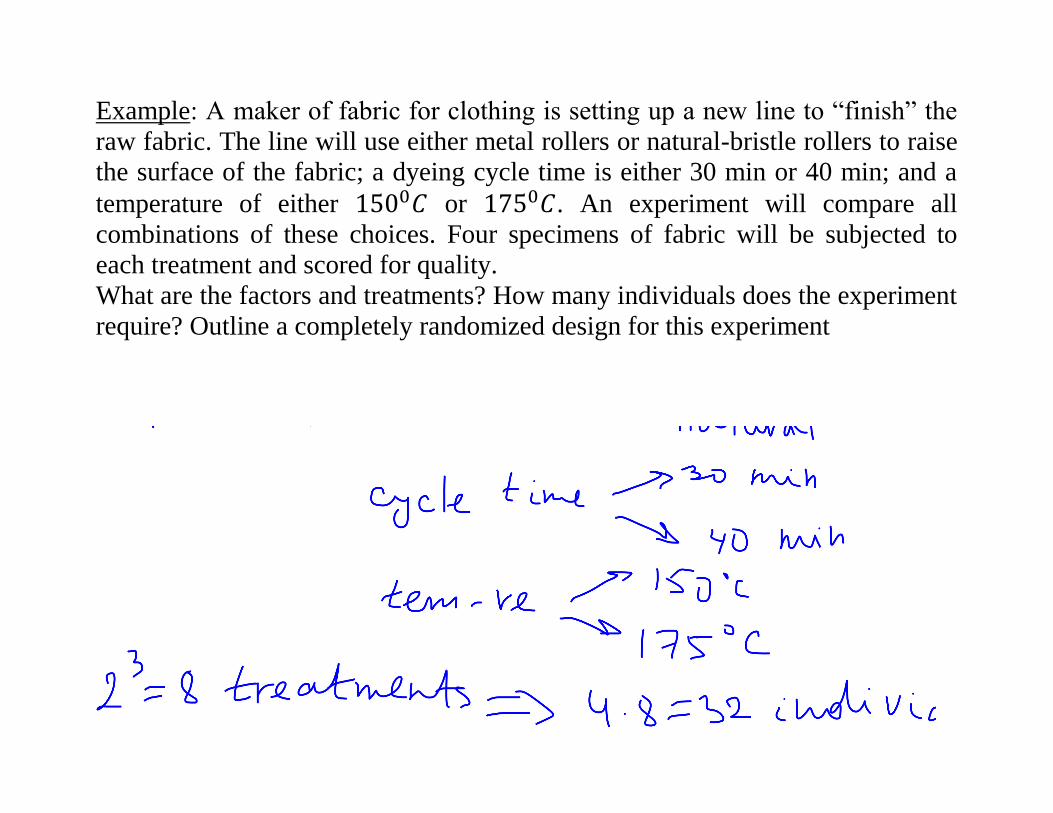
Example: A maker of fabric for clothing is setting up a new line to “finish” the
raw fabric. The line will use either metal rollers or natural-bristle rollers to raise
the surface of the fabric; a dyeing cycle time is either 30 min or 40 min; and a
temperature of either or . An experiment will compare all
combinations of these choices. Four specimens of fabric will be subjected to
each treatment and scored for quality.
What are the factors and treatments? How many individuals does the experiment
require? Outline a completely randomized design for this experiment
Probability
o Probability model
o Sample space
o Event, probability of event
o Probability rules
o Venn diagrams
o Independent events
o Conditional probability
o Tree diagrams
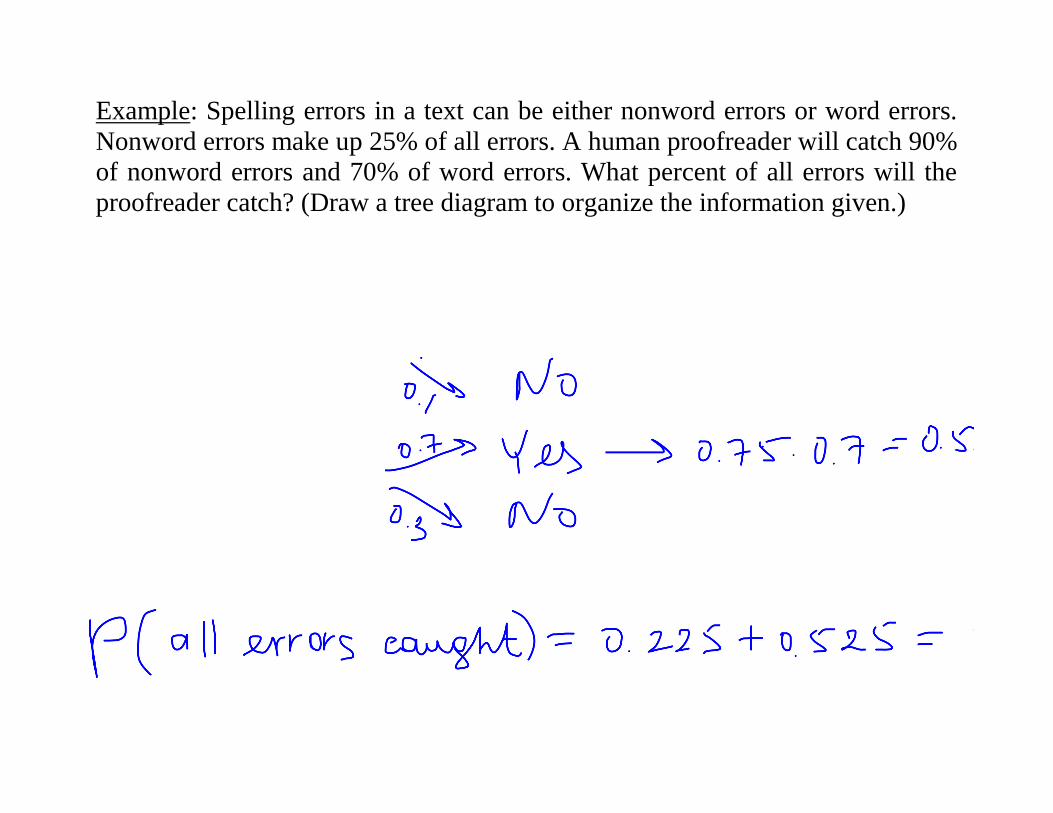
Example: Spelling errors in a text can be either nonword errors or word errors.
Nonword errors make up 25% of all errors. A human proofreader will catch 90%
of nonword errors and 70% of word errors. What percent of all errors will the
proofreader catch? (Draw a tree diagram to organize the information given.)
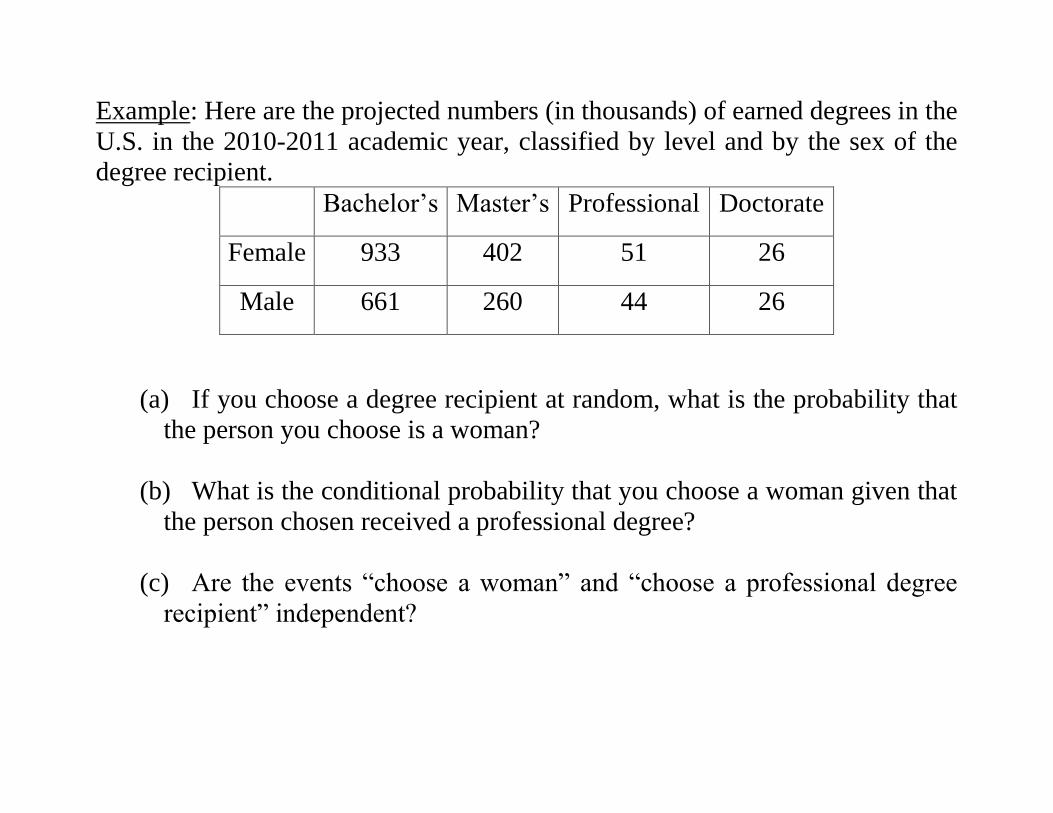
Example: Here are the projected numbers (in thousands) of earned degrees in the
U.S. in the 2010-2011 academic year, classified by level and by the sex of the
degree recipient.
Bachelor’s Master’s Professional Doctorate
Female 933 402 51 26
Male 661 260 44 26
(a) If you choose a degree recipient at random, what is the probability that
the person you choose is a woman?
(b) What is the conditional probability that you choose a woman given that
the person chosen received a professional degree?
(c) Are the events “choose a woman” and “choose a professional degree
recipient” independent?
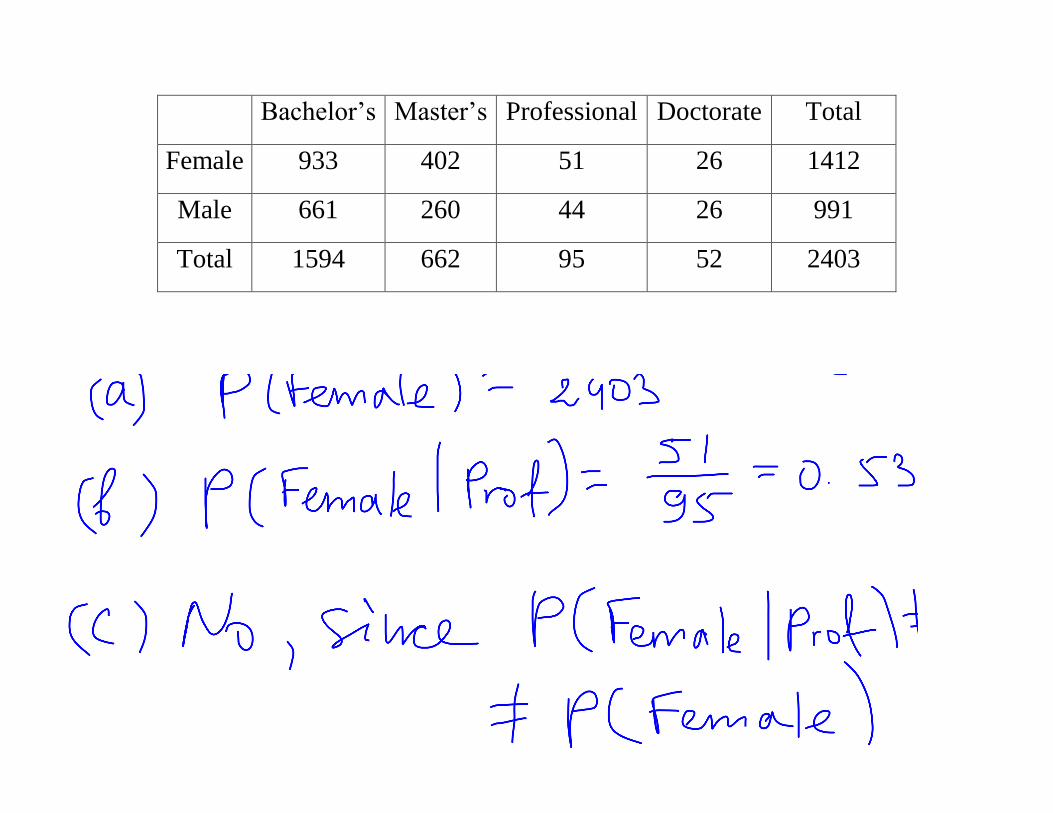
Bachelor’s Master’s Professional Doctorate Total
Female 933 402 51 26 1412
Male 661 260 44 26 991
Total 1594 662 95 52 2403
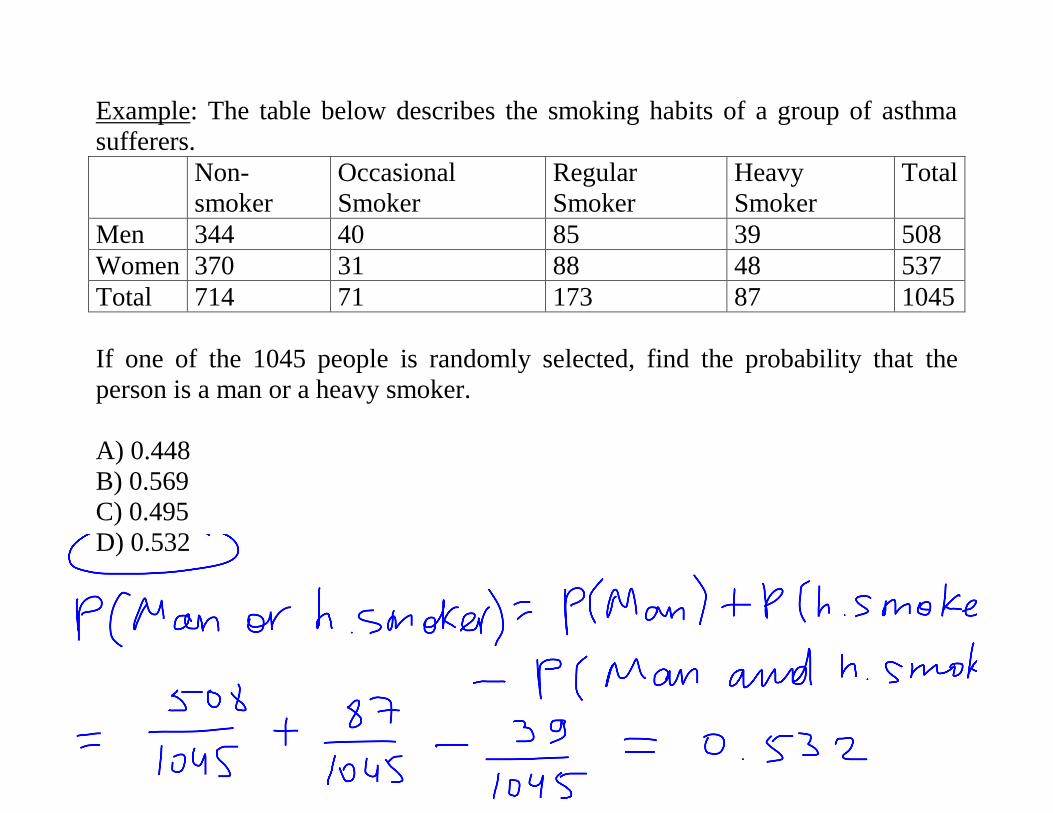
Example: The table below describes the smoking habits of a group of asthma
sufferers.
Non-
smoker
Occasional
Smoker
Regular
Smoker
Heavy
Smoker
Total
Men 344 40 85 39 508
Women 370 31 88 48 537
Total 714 71 173 87 1045
If one of the 1045 people is randomly selected, find the probability that the
person is a man or a heavy smoker.
A) 0.448
B) 0.569
C) 0.495
D) 0.532