Embed Size (px)
Citation preview
Appetite 60 (2013) 168–174
Contents lists available at SciVerse ScienceDirect
Appetite
journal homepage: www.elsevier .com/locate /appet
Research report
Midbrain response to milkshake correlates with ad libitum milkshake intakein the absence of hunger q
Sarah Nolan-Poupart a, Maria G. Veldhuizen a,b, Paul Geha a,b, Dana M. Small a,b,c,d,⇑a Affective Sensory Neuroscience Laboratory, The John B. Pierce Laboratory, 290 Congress Avenue, New Haven, CT 06519, United Statesb Department of Psychiatry, Yale University School of Medicine, New Haven, CT 06510, United Statesc Interdepartmental Neuroscience, Yale University School of Medicine, New Haven, CT 06510, United Statesd Department of Psychology, Yale University, New Haven, CT 06520, United States
a r t i c l e i n f o a b s t r a c t
Article history:Received 23 May 2012Received in revised form 23 September 2012Accepted 30 September 2012Available online 12 October 2012
Keywords:NeuroimagingFeedingFlavorObesityMidbrainPeriaqueductal gray, PAGDecision makingDopamineInsulaCannabinoidOpiodPain
0195-6663/$ - see front matter � 2012 Elsevier Ltd. Ahttp://dx.doi.org/10.1016/j.appet.2012.09.032
q Acknowledgment: This work was supported by NIH⇑ Corresponding author.
E-mail address: [email protected] (D.M. Small).
There is now widespread agreement that individual variation in the neural circuits representing the rein-forcing properties of foods may be associated with risk for overeating and obesity. What is currentlyunknown is how and whether brain response to a food is related to immediate subsequent intake of thatfood. Here we used functional magnetic resonance imaging (fMRI) to test whether response to a palatablemilkshake is associated with subsequent ad libitum milkshake consumption. We predicted that enhancedresponses in key reward regions (insula, striatum, midbrain, medial orbitofrontal cortex) and decreasedresponses in regions implicated in self-control (lateral prefrontal and lateral orbitofrontal cortex) wouldbe associated with greater intake. We found a significant positive association between response to milk-shake in the periaqueductal gray region of the midbrain and ad libitum milkshake intake. Although strongbilateral insular responses were observed during consumption of the milkshake this response did not cor-relate with subsequent intake. The associations observed in the midbrain and orbitofrontal cortex wereuninfluenced by ratings of hunger, which were near neutral. We conclude that midbrain response to apalatable food is related to eating in the absence of hunger.
� 2012 Elsevier Ltd. All rights reserved.
Introduction
The hedonic properties of food can drive the motivation to eatbeyond homeostatic energy needs (Kenney, 2011; Zheng, Lenard,Shin, & Berthoud, 2009). In an early neuroimaging study offeeding we showed that response to chocolate consumption inthe insula/operculum, midbrain, striatum, and medial orbitofron-tal cortex decreased as motivation to consume the chocolatedecreased, whereas response in the lateral orbitofrontal cortexand lateral prefrontal cortex increased (Small, Zatorre, Dagher,Evans, & Jones-Gotman, 2001). We suggested that these twocircuits governed meal initiation and meal termination,respectively.
Since this time functional neuroimaging studies have elucidatedbrain response to food pictures, odors and flavors across differinginternal states (Cornier, Von Kaenel, Bessesen, & Tregellas, 2007;Frank et al., 2010; Führer, Zysset, & Stumvoll, 2008; Goldstone
ll rights reserved.
Grant RO1K085579.
et al., 2009; La Bar et al., 2001; Malik, McGlone, Bedrossian, &Dagher, 2008; O’Doherty et al., 2000; Siep et al., 2009), bodyweights (Rothemund et al., 2007; Stice, Spoor, Bohon, & Small,2008; Stice, Spoor, Bohon, Veldhuizen, & Small, 2008; Stoeckelet al., 2008), eating phenotypes (e.g. restraint, food addiction)(Beaver et al., 2006; Demos, Kelley, & Heatherton, 2011; Lowe,Van Steenburgh, Ochner, & Coletta, 2009) and as a function ofprospective weight gain (Stice, Yokum, Bohon, Marti, & Smolen,2010; Stice, Spoor, Bohon, & Small, 2008; Stice, Spoor, Bohon,Veldhuizen, et al., 2008) or loss (Cornier, Melanson, Salzberg, Bech-tell, & Tregellas, 2012). Enhanced responses in regions thought torepresent the reinforcing properties of foods, such as the insula/operculum, midbrain, medial orbitofrontal cortex, striatum andinsula are associated with higher body mass index (BMI)(Rothemund et al., 2007; Stice, Spoor, Bohon, & Small, 2008; Stice,Spoor, Bohon, Veldhuizen, et al., 2008; Stice et al., 2010; Stoeckelet al., 2008). In contrast, reduced responses in regions critical forinhibitory behavior and self-control, such as the lateral orbitofron-tal cortex and lateral prefrontal cortex (Hare, Malmaud, & Rangel,2011; Hollmann et al., 2012) are often associated with higher BMI(Batterink, Yokum, & Stice, 2010; Volkow et al., 2009). There is also
S. Nolan-Poupart et al. / Appetite 60 (2013) 168–174 169
evidence for reduced gray matter density in lateral prefrontalcortex in obesity (Pannacciulli et al., 2006). Consequently, animportant theme to emerge is that heightened reward responses,coupled with decreased inhibitory control, increase risk forovereating and weight gain (Del Parigi, Chen, Salbe, Reiman, &Tataranni, 2003; Small, 2009; Volkow & Wise, 2005). What is lessunderstood is how brain response to a food relates to subsequentintake of that food. Batterham and colleagues showed that theneural activity recorded during an fMRI scan could predict subjects’subsequent caloric intake (Batterham et al., 2007). However thescanning paradigm was unrelated to the test meal as no food orfood-related cues were presented during scanning. This is animportant issue because the relationship between brain responseto a food and its subsequent intake is presumably an importantmediator of the relationship between brain response to food andbody weight.
The aim of the current fMRI study was to address this gap in theliterature by identifying regions in which response to a palatableand energy-dense milkshake is associated with the immediate sub-sequent intake of that milkshake in non-deprived individuals whoself-report being neither hungry nor full. We reasoned that therewould be automatic engagement of circuits coding the appetitiveaspects of the stimulus as well as circuits representing inhibitorycontrol in the face of consuming a palatable food. An overarchingprediction was that greater responses in brain regions representingthe reinforcing properties of foods would be positively associatedwith intake while reduced responses in regions representing re-sponse inhibition and self-control would be negatively associatedwith intake.
Methods
Subjects
Twenty-three right-handed nonsmokers, taking no daily medica-tion and having no known history of loss of consciousness, chemo-sensory impairment, neurological, or psychiatric disorders, gavewritten informed consent to participate in our study that was ap-proved by Yale University School of Medicine Human InvestigationCommittee. Two subjects were excluded because of excessive move-ment during scanning, which was defined as greater than 2 mmmovement in any direction. An additional subject was excluded be-cause assessment of ad libitum milkshake consumption indicatedthat this person drank 1028 g of milkshake, which corresponds to3.07 standard deviations more than the mean of other subjects.We therefore excluded the data point, but note that including thesubject in the group analyses does not influence the results reportedbelow. The results of the study are therefore based on the remaining20 subjects (10 women, 10 men, mean age 27.0 ± 6.2 years, meanBMI 25.8 ± 4.0 (range = 20.8–35.7), with an Edinburgh HandednessInventory score (1) ranging between 55 and 100).
Stimuli and delivery
Stimuli included Nestlé’s chocolate milkshake and a tastelessbaseline solution. The tasteless solution consisted of 12.5 mM KCland 1.25 mM NaHCO3 in distilled water. Four different concentra-tions were presented (25%, 50%, 75%, and 100% of the original con-centration) and subjects were instructed to select the dilution thattasted most like nothing. The chosen concentration was used as thetasteless stimulus. Seventeen subjects chose the 25% solution, twochose the 50% solution, and one chose the 75% solution. Liquidswere delivered as 1 mL of solution over 4 s using a gustometer sys-tem described previously (22). In brief, this system consists ofcomputer controlled syringe pumps connected to an fMRI-compat-
ible custom designed gustatory manifold via 25-ft lengths of bev-erage tubing (Saint-Gobain Performance Plastics). The manifold ismounted on the headcoil and liquids dripped from the manifoldstylus onto the tongue.
Experimental design
Subjects participated in one fMRI training session and one fMRIscanning session conducted on separate days. Subjects were in-structed to arrive feeling neither hungry nor full and to abstainfrom eating or drinking anything (except water) for 1 h before bothsessions. No other dietary instructions were provided. However,subjects rated their hunger upon arrival and these ratings were in-tended to exclude subjects reporting subjective hunger or fullnesswithin 20 points of neutral. No subjects were excluded based uponthis criterion. All scans were performed between 11 am and 3 pm.For the 10 women, the average days since the first day of theirmenstrual cycle was 14.6 but the range was large (2–24 days).
Training session
Upon arrival to the training session, subjects first selected theirtasteless solution. Next, after being inserted into the mock scannerbore, subjects provided a series of ratings using a mouse to move acurser to a desired location along a line on a computer screen. Sub-jects started by rating feelings of hunger and fullness using 20 mmvisual analog scales (VAS) with the following labels: at the left an-chor (�100), ‘‘I am not hungry at all’’ or ‘‘I am not full at all’’; at themidpoint (0), ‘‘neutral’’; and at the right anchor (+100), ‘‘I havenever been more hungry’’ or ‘‘I have never been more full’’. Stimu-lus intensity was measured using the general Labeled MagnitudeScale (gLMS; Green et al., 1996), a 100 mm vertical line scale an-chored by the labels ‘‘no sensation’’ at the bottom and the label‘‘strongest imaginable sensation’’ at the top. In between these an-chors the following words were quasi-logarithmically spaced inascending order: ‘‘barely detectable’’, ‘‘weak’’, ‘‘moderate’’,‘‘strong’’, and ‘‘very strong’’. Subjects rated pleasantness using a100 mm Labeled Hedonic Scale (Lim, Wood, & Green, 2009) an-chored by ‘‘most disliked imaginable’’ at the bottom anchor point(�100), ‘‘neutral’’ in the center (0), and ‘‘most liked imaginable’’at the top anchor point (100). Importantly, this scale, which pro-duces ratio-like data and minimizes ceiling effects was createdby placing descriptors at locations corresponding to direct estima-tion of perceptual and psychological magnitude made by the sub-jects. Therefore perceptual units are not equal. For example 44corresponds to ‘‘like very much’’. Another important feature ofthe scale is that it assesses liking across all possible sensations.For reference, in the original paper French fries received a likingrating of 26. Ratings of wanting to eat were measured using aVAS scale labeled as follows: at the left anchor, ‘‘I would neverwant to eat this’’; at the middle point, ‘‘neutral’’; and at the rightanchor, ‘‘I would want to eat this more than anything’’.
After completing the ratings, subjects underwent a single mockrun, which served to familiarize them with the procedure. Duringthe mock and real runs, stimuli were delivered according to a longevent-related design (Small et al., 2003, 2004). Either a milkshakeor a tasteless solution was presented to the subject for 4 s. After a3–10 s wait, the milkshake was followed by a 4 s tasteless rinse. Be-fore the onset of the next trial, there was a 3–10 s wait. Subjectswere instructed to hold the solution in their mouths until theyhad received the full amount of the liquid and then to swallow dur-ing the wait. A single mock run, with a duration of 5 min 54 s andconsistent of 11 presentation of each stimulus, was performed. Afterthe mock run, subjects were asked to provide a second set of ratings.
After the mock scan, height and weight were measured using aDetecto 439 Mechanical Scale (footwear and coats removed) and

170 S. Nolan-Poupart et al. / Appetite 60 (2013) 168–174
BMI was calculated [BMI = weight (kg)/height (m)2]. Eating stylewas then measured with the Three Factor Eating Questionnaire(TFEQ) (Stunkard & Messick, 1985) and the Power of Food Scale(Lowe, Butryn, et al., 2009).
fMRI session
Before and after the fMRI scan, subjects provided their internalstate and stimulus ratings. Once inside the fMRI scanner, subjectsperformed one anatomical run and two functional runs (22 repeatsof each stimulus). After undergoing the fMRI scan subjects were re-moved from the scanner bore and brought to a separate roomwhere they were offered a full bottle of chocolate milkshake(1656.12 mL) to drink while the experimenters broke down thedelivery equipment. When the experimenters returned (10 min)they debriefed the subject and measured the amount of milkshakeconsumed.
fMRI data acquisition
The images were acquired on a Siemens 3 T Trio magnetomscanner at Yale University Magnetic Resonance Research Center,using parameters similar to previous studies. Susceptibility-weighted single-shot echoplanar imaging was used to measurethe blood oxygenation-level dependent (BOLD) signal as an indica-tion of cerebral brain activation with TR, 2000 ms; TE, 20 ms; flipangle, 80�; FOV, 220 mm; matrix, 64 � 64; slice thickness, 3 mm;and acquisition of 40 contiguous slices. Slices were acquired inan interleaved mode. The MR signal was allowed to equilibrate atthe beginning of each functional run over six scans for a total of12 s, which were then excluded from analysis. A high-resolutionT1-weighted three-dimensional anatomical scan was acquiredwith the following parameters: TR/TE, 2530/3.66 ms; flip angle,20�; matrix, 256 � 256; 1 mm thick slices; FOV, 256; 176 slices.
Analysis of behavioral and BMI data
We performed Pearson’s correlations in SPSS 16.0.0 for Win-dows in order to evaluate whether any of the multiple measuresthat were recorded (BMI, hunger, fullness, intensity, pleasantness,wanting to eat) were associated with ad libitum milkshake intake.
Analysis of FMRI data
Data were analyzed using SPM5 software (Statistical ParametricMapping; Wellcome Department of Imaging Neuroscience, Lon-don, UK). Functional images were time-acquisition corrected tothe slice obtained at 50% of the TR and realigned to the mean im-age. Anatomical and functional images were normalized and seg-mented using the VBM toolbox in SPM5. Functional time-seriesdata was detrended, a method that eliminates at each voxel anylinear component matching the global signal (Macey, Macey,Kumar, & Harper, 2004). Functional images were smoothed usinga 6 mm full-width at half maximum isotropic Gaussian kernel.Sessions in which head movement during scanning exceeded apredetermined limit of 1 mm in any direction were excluded.
A design matrix was created at the individual subject level,which identified the onset and duration of each event. Events ofinterest were defined as mini-blocks with a duration of 4 s afteronset (when solution entered the subject’s mouth). Milkshakeand tasteless presentations were modeled as events of interest.According to SPM5 convention, a 128 high-pass filter was appliedto the time-series data with the aim to remove low-frequencynoise and slow signal drifts. General linear model was used toestimate, at each voxel, condition-specific effects. A canonical
hemodynamic response function, including a temporal derivative,was used to model neural response to events.
To assess group effects, the parameter estimate images for theconditions for each subject were entered into an ANOVA contrast-ing Milkshake – Tasteless. T-map threshold was set at p uncor-rected <0.001 and a 3-voxel cluster size. Unpredicted responseswere considered significant at p < 0.05 false discovery ratio (FDR)corrected across the entire brain for multiple comparisons. Forpredicted responses the WFU Pick Atlas tool in SPM5 was used toperform region of interest (ROI) analyses to test for chemosensoryactivations (e.g. insula, orbitofrontal cortex) to Milkshake – Taste-less and peaks were considered significant at p < 0.05 FDRcorrected across the total number of voxels across all ROIs (Maldj-ian, Laurienti, Kraft, & Burdette, 2003). Small-volume searches withROIs defined using peaks from Small et al., 2001 to create 15 mmdiameter spheres were performed to test whether response inthe midbrain, insula, striatum and medial and lateral OFC wererelated to intake.
Next, we regressed ad libitum milkshake intake, BMI, hunger,and pleasantness ratings against BOLD response to Milkshake –Tasteless across all of the subjects in a whole-brain regressionanalysis in SPM5. This analysis was used to test whether and wherewe observe significant correlations in neural response to milkshakeand any of these variables. The parameter estimate images fromthe Milkshake – Tasteless contrast were entered into a regressiondesign along with a vector of the variable of interest (milkshakeintake, BMI, hunger, or pleasantness rating).
Three additional regression analyses were performed in whichad libitum milkshake intake was treated as a regressor of interest,whereas BMI, hunger, or pleasantness respectively were includedas nuisance variables. The resulting correlation maps specificallyshow regions that show a response with ad libitum milkshakeintake that is independent of BMI, hunger, or pleasantness.
Results
Behavioral results
Average hunger and fullness ratings were near neutral beforeand after scanning ((mean ± SEM) hunger before scan:8.92 ± 6.83; hunger after scan: 12.24 ± 7.21; fullness before scan:�14.95 ± 7.98; fullness after scan: �19.20 ± 7.14) and did not differas a function of time (hunger, F(1,19) = 0.345, p = 0.564; fullness,F(1,19) = 0.231, p = 0.636). Before and after scanning, the milk-shake was rated as pleasant (before scan: 26.34 ± 3.04; after scan:25.19 ± 3.05 – note that a score of 17 corresponds to ‘‘like moder-ately’’ and a score of 44 to ‘‘like very much’’ with reference to allhedonic sensations imaginable), moderately intense (before scan:20.95 ± 2.30; after scan: 20.05 ± 2.02), and wanted (before scan:29.68 ± 4.83; after scan: 20.32 ± 6.03). There was no significant ef-fect of time on pleasantness (F(1,19) = 3.754, p = 0.068) or intensityratings (F(1,19) = 0.803, p = 0.382) but wanting ratings decreasedpre to post scan (F(1,19) = 7.445, p = 0.013). The tasteless solutionwas rated as neutral in pleasantness (before scan: �0.47 ± 1.93;after scan: 0.66 ± 2.23), barely detectable in intensity (before scan:3.40 ± 0.63; after scan: 3.34 ± 0.70), and moderately unwanted (be-fore scan: �15.26 ± 7.72; after scan: �15.82 ± 7.24), with no signif-icant effects of time (pleasantness, F(1,19) = 0.298, p = 0.592;intensity, F(1,19) = 0.015, p = 0.903; wanting, F(1,19) = 0.015,p = 0.904). The milkshake was rated as significantly more pleasant(F(1,18) = 54.38, p < 0.001), more intense (F(1,19) = 83.823,p < 0.001), and more wanted (F(1,17) = 31.12, p < 0.001) than thetasteless solution.
Following the scan subjects consumed on average216.91 ± 187.8 milliliters of milkshake, equivalent to 166.51
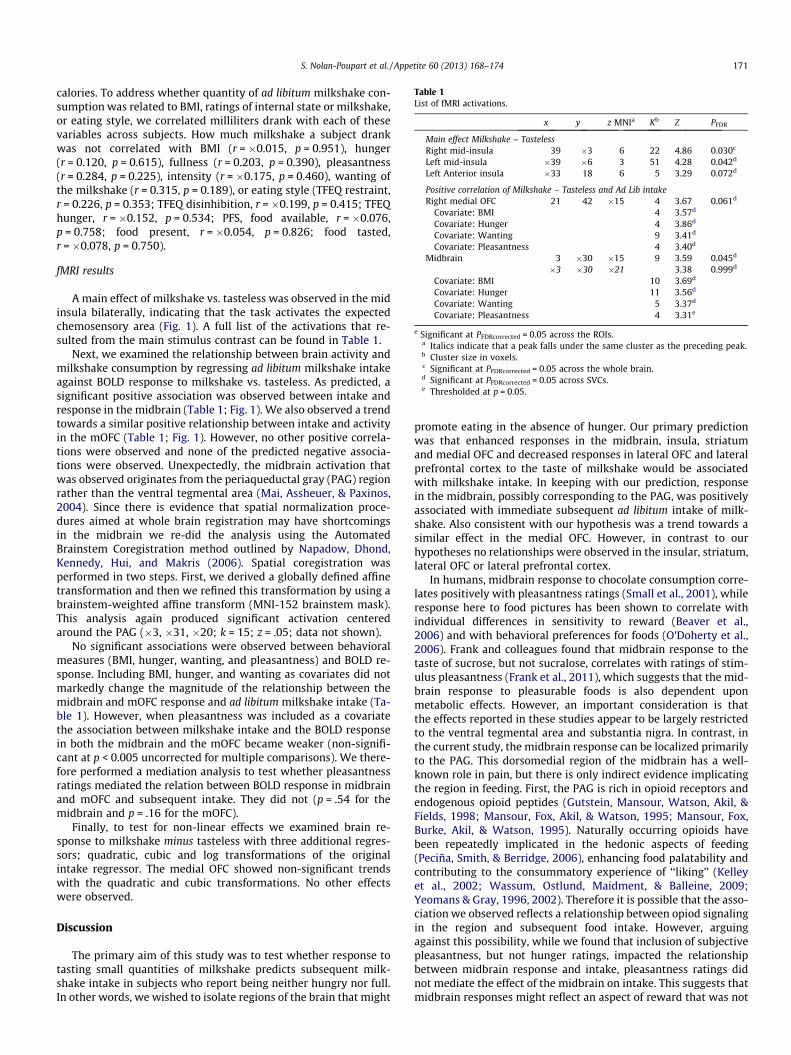
Table 1List of fMRI activations.
x y z MNIa Kb Z PFDR
Main effect Milkshake – TastelessRight mid-insula 39 �3 6 22 4.86 0.030c
Left mid-insula �39 �6 3 51 4.28 0.042d
Left Anterior insula �33 18 6 5 3.29 0.072d
Positive correlation of Milkshake – Tasteless and Ad Lib intakeRight medial OFC 21 42 �15 4 3.67 0.061d
Covariate: BMI 4 3.57d
Covariate: Hunger 4 3.86d
Covariate: Wanting 9 3.41d
Covariate: Pleasantness 4 3.40d
Midbrain 3 �30 �15 9 3.59 0.045d
�3 �30 �21 3.38 0.999d
Covariate: BMI 10 3.69d
Covariate: Hunger 11 3.56d
Covariate: Wanting 5 3.37d
Covariate: Pleasantness 4 3.31e
e Significant at PFDRcorrected = 0.05 across the ROIs.a Italics indicate that a peak falls under the same cluster as the preceding peak.b Cluster size in voxels.c Significant at PFDRcorrected = 0.05 across the whole brain.d Significant at PFDRcorrected = 0.05 across SVCs.e Thresholded at p = 0.05.
S. Nolan-Poupart et al. / Appetite 60 (2013) 168–174 171
calories. To address whether quantity of ad libitum milkshake con-sumption was related to BMI, ratings of internal state or milkshake,or eating style, we correlated milliliters drank with each of thesevariables across subjects. How much milkshake a subject drankwas not correlated with BMI (r = �0.015, p = 0.951), hunger(r = 0.120, p = 0.615), fullness (r = 0.203, p = 0.390), pleasantness(r = 0.284, p = 0.225), intensity (r = �0.175, p = 0.460), wanting ofthe milkshake (r = 0.315, p = 0.189), or eating style (TFEQ restraint,r = 0.226, p = 0.353; TFEQ disinhibition, r = �0.199, p = 0.415; TFEQhunger, r = �0.152, p = 0.534; PFS, food available, r = �0.076,p = 0.758; food present, r = �0.054, p = 0.826; food tasted,r = �0.078, p = 0.750).
fMRI results
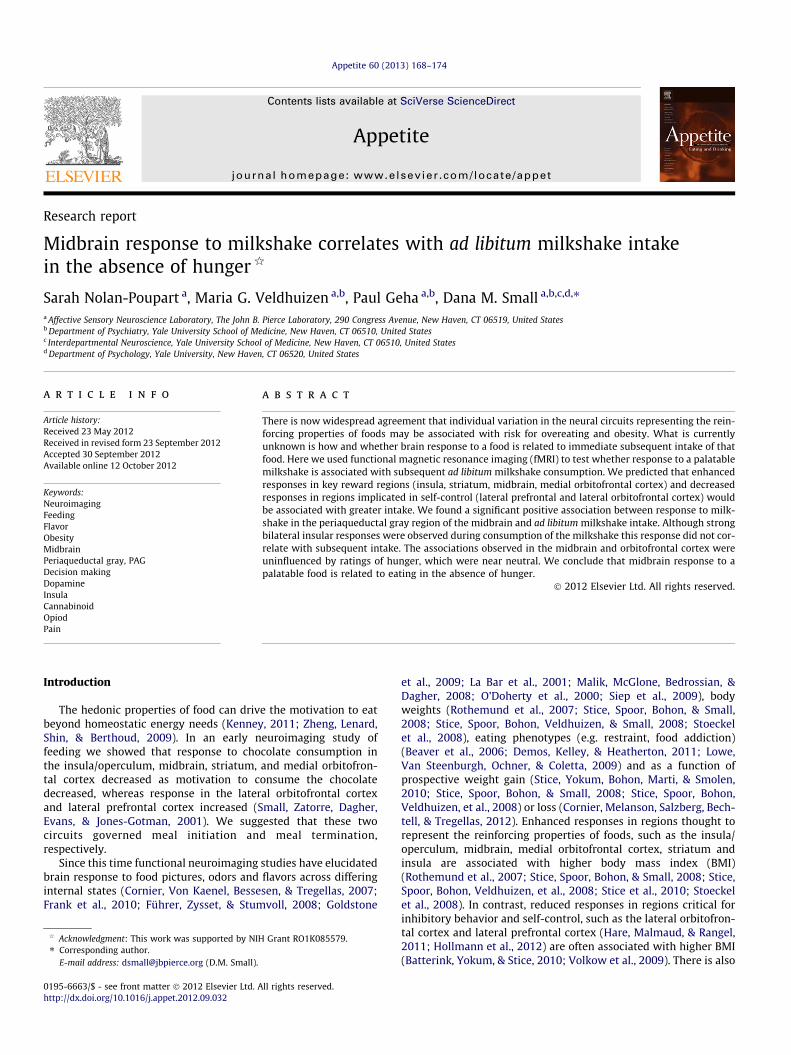
A main effect of milkshake vs. tasteless was observed in the midinsula bilaterally, indicating that the task activates the expectedchemosensory area (Fig. 1). A full list of the activations that re-sulted from the main stimulus contrast can be found in Table 1.
Next, we examined the relationship between brain activity andmilkshake consumption by regressing ad libitum milkshake intakeagainst BOLD response to milkshake vs. tasteless. As predicted, asignificant positive association was observed between intake andresponse in the midbrain (Table 1; Fig. 1). We also observed a trendtowards a similar positive relationship between intake and activityin the mOFC (Table 1; Fig. 1). However, no other positive correla-tions were observed and none of the predicted negative associa-tions were observed. Unexpectedly, the midbrain activation thatwas observed originates from the periaqueductal gray (PAG) regionrather than the ventral tegmental area (Mai, Assheuer, & Paxinos,2004). Since there is evidence that spatial normalization proce-dures aimed at whole brain registration may have shortcomingsin the midbrain we re-did the analysis using the AutomatedBrainstem Coregistration method outlined by Napadow, Dhond,Kennedy, Hui, and Makris (2006). Spatial coregistration wasperformed in two steps. First, we derived a globally defined affinetransformation and then we refined this transformation by using abrainstem-weighted affine transform (MNI-152 brainstem mask).This analysis again produced significant activation centeredaround the PAG (�3, �31, �20; k = 15; z = .05; data not shown).
No significant associations were observed between behavioralmeasures (BMI, hunger, wanting, and pleasantness) and BOLD re-sponse. Including BMI, hunger, and wanting as covariates did notmarkedly change the magnitude of the relationship between themidbrain and mOFC response and ad libitum milkshake intake (Ta-ble 1). However, when pleasantness was included as a covariatethe association between milkshake intake and the BOLD responsein both the midbrain and the mOFC became weaker (non-signifi-cant at p < 0.005 uncorrected for multiple comparisons). We there-fore performed a mediation analysis to test whether pleasantnessratings mediated the relation between BOLD response in midbrainand mOFC and subsequent intake. They did not (p = .54 for themidbrain and p = .16 for the mOFC).
Finally, to test for non-linear effects we examined brain re-sponse to milkshake minus tasteless with three additional regres-sors; quadratic, cubic and log transformations of the originalintake regressor. The medial OFC showed non-significant trendswith the quadratic and cubic transformations. No other effectswere observed.
Discussion
The primary aim of this study was to test whether response totasting small quantities of milkshake predicts subsequent milk-shake intake in subjects who report being neither hungry nor full.In other words, we wished to isolate regions of the brain that might
promote eating in the absence of hunger. Our primary predictionwas that enhanced responses in the midbrain, insula, striatumand medial OFC and decreased responses in lateral OFC and lateralprefrontal cortex to the taste of milkshake would be associatedwith milkshake intake. In keeping with our prediction, responsein the midbrain, possibly corresponding to the PAG, was positivelyassociated with immediate subsequent ad libitum intake of milk-shake. Also consistent with our hypothesis was a trend towards asimilar effect in the medial OFC. However, in contrast to ourhypotheses no relationships were observed in the insular, striatum,lateral OFC or lateral prefrontal cortex.
In humans, midbrain response to chocolate consumption corre-lates positively with pleasantness ratings (Small et al., 2001), whileresponse here to food pictures has been shown to correlate withindividual differences in sensitivity to reward (Beaver et al.,2006) and with behavioral preferences for foods (O’Doherty et al.,2006). Frank and colleagues found that midbrain response to thetaste of sucrose, but not sucralose, correlates with ratings of stim-ulus pleasantness (Frank et al., 2011), which suggests that the mid-brain response to pleasurable foods is also dependent uponmetabolic effects. However, an important consideration is thatthe effects reported in these studies appear to be largely restrictedto the ventral tegmental area and substantia nigra. In contrast, inthe current study, the midbrain response can be localized primarilyto the PAG. This dorsomedial region of the midbrain has a well-known role in pain, but there is only indirect evidence implicatingthe region in feeding. First, the PAG is rich in opioid receptors andendogenous opioid peptides (Gutstein, Mansour, Watson, Akil, &Fields, 1998; Mansour, Fox, Akil, & Watson, 1995; Mansour, Fox,Burke, Akil, & Watson, 1995). Naturally occurring opioids havebeen repeatedly implicated in the hedonic aspects of feeding(Peciña, Smith, & Berridge, 2006), enhancing food palatability andcontributing to the consummatory experience of ‘‘liking’’ (Kelleyet al., 2002; Wassum, Ostlund, Maidment, & Balleine, 2009;Yeomans & Gray, 1996, 2002). Therefore it is possible that the asso-ciation we observed reflects a relationship between opiod signalingin the region and subsequent food intake. However, arguingagainst this possibility, while we found that inclusion of subjectivepleasantness, but not hunger ratings, impacted the relationshipbetween midbrain response and intake, pleasantness ratings didnot mediate the effect of the midbrain on intake. This suggests thatmidbrain responses might reflect an aspect of reward that was not
Fig. 1. fMRI results. Images displayed at p < 0.005. Color bar depicts T-values. (A) Significant response in the left and right mid-insula to Milkshake – Tasteless. Bar graphs fortasteless solution (blue) and milkshake (red) (from the peak voxel). Time courses for tasteless solution (blue) and milkshake (red) (from the peak voxel). (B) Positivecorrelation between BOLD response and ad libitum intake. Response in the midbrain is positively related to intake. The scatter plots illustrate the correlation between adlibitum milkshake intake (x-axis), and parameter estimate (PE) (y-axis).
172 S. Nolan-Poupart et al. / Appetite 60 (2013) 168–174
assessed in the current study, such as incentive motivation or thereinforcement value of the food. Consistent with this possibility,medial prefrontal cortex projections to the PAG (Mota-Ortiz,Sukikara, Felicio, & Canteras, 2009) are thought to be criticallyinvolved in opiod activation of the PAG to promote food foragingbehavior in rats (Miranda-Paiva, Ribeiro-Barbosa, Canteras, &Felicio, 2003).
Another possibility is that the BOLD signal reflects cannabinoidsignaling. Intravenous injection of the synthetic cannabinoid ago-nist HU210 modulates BOLD responses in the mouse PAG (Shah,Prior, Dixon, Morris, & Marsden, 2004), which is intriguing sincecannabinoid agonists produce clear hyperphagia (Abel, 1971; Koch,2001; Williams, Rogers, & Kirkham, 1998; Higgs, Williams, & Kirk-ham, 2003).
Finally, there are dopamine neurons in the PAG, also known asthe A10 dorsocaudal group (Hasue & Shammah-Lagnado, 2002;Hokfelt, Martensoon, Bjorklund, Kleinau, & Goldstein, 1984).Although the role for these cells in reward has not been well
studied, they have been implicated in mediating the rewardingand sensitizing properties of heroin (Flores, Galan-Rodriguez, Ram-iro-Fuentes, & Fernandez-Espejo, 2006). Whether PAG dopamineneurons, like the ventral tegmental dopamine neurons (Abizaid,Gao, & Horvath, 2006; Berthoud, 2002) are directly modulated byhormones to promote eating is unknown. However, it is neverthe-less possible that the association between PAG response to milk-shake and intake reflects dopaminergic activity in this region.
One potentially fruitful avenue for future research will be to in-clude the PAG in region of interest analyses that have been used toevaluate the influence of dopamine, cannabinoid, and opiod antag-onism on brain response to food (e.g. Dodds et al., 2012; Rabineret al., 2011). Additionally, it would be interesting to test whethercommon polymorphisms that are related to food intake and dopa-mine or opiod signaling may influence the association betweenPAG response and intake. For example, Davis and colleagues re-ported that obese individuals are more likely to possess the G alleleof the A118G polymorphism of the mu-opiod receptor gene (Davis

S. Nolan-Poupart et al. / Appetite 60 (2013) 168–174 173
et al., 2009) if they carry a diagnosis of binge eating disorder. Test-ing whether the association between PAG response to palatablefood and intake is modulated by this genotype might provide in-sight into the neurochemistry behind BOLD responses observedhere.
Like the midbrain and medial OFC, response in the insula is pos-itively associated with reported pleasure during chocolate con-sumption (Small et al., 2001). The insula has also been implicatedin compulsive eating (Woolley et al., 2007) and in weight gain inyouth at risk for obesity by virtue of parental obesity (Stice, Yokum,Burger, Epstein, & Small, 2011). Response here remains elevated inpost-obese individuals (Del Parigi et al., 2004) and it was recentlyreported that weight loss is associated with a reduction in insularresponses (Cornier et al., 2012). These data strongly suggest thatvariation in insular response may be associated with susceptibilityfor weight gain. However, in the current study, although we ob-served strong insular responses to Milkshake – Tasteless in the in-sula, this response was unrelated to subsequent intake. Thissuggests that the role the insular cortex plays in regulating (or dys-regulating) feeding is more likely related to variations in homeo-static or internal state controls rather than in the influence of thehedonic aspects of food to influence consumption. This possibilityis consistent with the fact that the insula is sensitive to hungerstates (Tataranni et al., 1999) and that response to food cues is mod-ulated by endocrine factors such as ghrelin (Malik et al., 2008). An-other possibility is that insular responses reflect an interactionbetween internal state and the appetitive characteristics of foodsto influence intake. In this case we would have failed to observean association because our subjects were not hungry.
We also failed to observe associations between lateral OFC orlateral prefrontal cortex and intake. These regions have beenshown to play an important role in inhibiting hedonic eating (Hare,O’Doherty, Camerer, Schultz, & Rangel, 2008; Hare et al., 2011) andin consciously regulating desire for food upon exposure to foodimages (Hollmann et al., 2012; Wang et al., 2009). Both areas arealso less responsive to food cues in individuals with high vs. lowBMI (Batterink et al., 2010; Del Parigi et al., 2003; Volkow et al.,2009). There are a variety of possible reasons for this lack of asso-ciation. Most notably, our paradigm did not measure choice or ex-plicit attempts to exercise self-control, nor did we examine intakeof foods other than the milkshake. Therefore it is critical to inter-pret this negative finding with caution. Our group of subjects alsoall scored low on self-reported disinhibition towards foods, with allbut one subject scoring between a 2 and an 8 on this subscale ofthe Three Factor Eating Questionnaire. Finally, women werescanned in various phases of the menstrual cycle, which mighthave contributed to increased variance in response. It will beimportant for future studies to consider these and other factorsto have a more comprehensive understanding of brain responsesthat predict ad libitum intake.
In summary, our findings show that response in the PAG to thetaste of milkshake positively predicts immediate subsequent adlibitum intake of that milkshake, thus linking brain response in thisregion with feeding behavior. We suggest that this result providessupport for the possibility that PAG response to palatable food isrelated to the motivational drive behind food consumption in theabsence of hunger.
References
Abel, E. L. (1971). Effects of marihuana on solution of anagrams, memory andappetite. Nature, 231, 260–262.
Abizaid, A., Gao, Q., & Horvath, T. L. (2006). Thoughts for food. Brain mechanismsand peripheral energy balance. Neuron, 51, 691–702.
Batterham, R. L., Ffytche, D. H., Rosenthal, J. M., Zelaya, F. O., Barker, G. J., Withers, D.J., et al. (2007). PYY modulation of cortical and hypothalamic brain areaspredicts feeding behavior in humans. Nature, 450, 106–109.
Batterink, L., Yokum, S., & Stice, E. (2010). Body mass correlates inversely withinhibitory control in response to food among adolescent girls. An fMRI study.NeuroImage, 52(4), 1696–1703.
Beaver, J. D., Lawrence, A. D., van Ditzhuijzen, J., Davis, M. H., Woods, A., & Calder, A.J. (2006). Individual differences in reward drive predict neural responses toimages of food. The Journal of Neuroscience, 26(19), 5160–5166.
Berthoud, H. R. (2002). Multiple neural systems controlling food intake and bodyweight. Neuroscience and Biobehavioral Reviews, 26(4), 393–428.
Cornier, M. A., Melanson, E. L., Salzberg, A. K., Bechtell, J. L., & Tregellas, J. R. (2012).The effects of exercise on the neuronal responses to food cues. Physiology &Behavior, 105(4), 1028–1034.
Cornier, M. A., Von Kaenel, S. S., Bessesen, D. H., & Tregellas, J. R. (2007). Effects ofoverfeeding on the neuronal responses to visual food cues. American Journal ofClinical Nutrition, 86(4), 965–971.
Davis, C. A., Levitan, R. D., Reid, C., Carter, J. C., Kaplan, A. S., Patte, K. A., et al. (2009).Dopamine for ‘‘wanting’’ and opiods for ‘‘liking’’. A comparison of obese adultswith and without binge eating. Obesity, 17(6), 1220–1225.
Del Parigi, A., Chen, K., Salbe, A. D., Hill, J. O., Wing, R. R., Reiman, M., et al. (2004).Persistence of abnormal neural responses to a meal in postobese individuals.International Journal of Obesity, 28(3), 370–377.
Del Parigi, A., Chen, K., Salbe, A. D., Reiman, E. M., & Tataranni, P. A. (2003). Are weaddicted to food? Obesity, 11, 493–495.
Demos, K. E., Kelley, W. M., & Heatherton, T. F. (2011). Dietary restraint violationsinfluence reward responses in nucleus accumbens and amygdala. Journal ofCognitive Neuroscience, 23(8), 1952–1963.
Dodds, C. M., O’Neil, B., Beaver, J., Makwana, A., Bani, M., Merlo-Pich, E., et al. (2012).Effect of the dopamine D2 receptor antagonist GSK5988909 on brain responsesto rewarding food images in overweight and obese binge eaters. Appetite, 59(1),27–33.
Flores, J. A., Galan-Rodriguez, B., Ramiro-Fuentes, S., & Fernandez-Espejo, E. (2006).Role for dopamine neurons of the rostral linear nucleus and periaqueductal grayin the rewarding and sensitizing properties of heroin.Neuropsychopharmacology, 31(7), 1475–1488.
Frank, S., Heni, M., Moss, A., von Schnurbein, J., Fritsche, A., Haring, H. U., et al.(2011). Leptin therapy in a congenital leptin-deficient patient leads to acute andlong-term changes in homeostatic, reward, and food-related brain areas. Journalof Clinical Endocrinology and Metabolism, 96(8), E1283–E1287.
Frank, S., Laharnar, N., Kullmann, S., Veit, R., Canova, C., Hegner, Y. L., et al. (2010).Processing of food pictures. Influence of hunger, gender and calorie content.Brain Research, 1350, 159–166.
Führer, D., Zysset, S., & Stumvoll, M. (2008). Brain activity in hunger and satiety. Anexploratory visually stimulated fMRI study. Obesity, 16(5), 945–950.
Goldstone, A. P., Prechtl de Hernandez, C. G., Beaver, J. D., Muhammed, K., Croese, C.,Bell, G., et al. (2009). Fasting biases brain reward systems towards high-caloriefoods. European Journal of Neuroscience, 30(8), 1625–1635.
Green, B. G., Dalton, P., Cowart, B., Shaffer, G., Rankin, K., & Higgins, J. (1996).Evaluating the ‘Labeled Magnitude Scale’ for measuring sensations of taste andsmell. Chemical Senses, 21(3), 323–334.
Gutstein, H. B., Mansour, A., Watson, S. J., Akil, H., & Fields, H. L. (1998). Mu andkappa opioid receptors in periaqueductal gray and rostral ventromedialmedulla. NeuroReport, 9(8), 1777–1781.
Hare, T. A., Malmaud, J., & Rangel, A. (2011). Focusing attention on the healthaspects of foods changes value signals in vmPFC and improves dietary choices.The Journal of Neuroscience, 31(30), 11077–11087.
Hare, T. A., O’Doherty, J., Camerer, C. F., Schultz, W., & Rangel, A. (2008). Dissociatingthe role of the orbitofrontal cortex and the striatum in the computation of goalvalues and prediction errors. The Journal of Neuroscience, 28, 5623–5630.
Hasue, R. H., & Shammah-Lagnado, S. J. (2002). Origin of the dopaminergicinnervation of the central extended amygdala and accumbens shell. Acombined retrograde tracing and immunohistochemical study in the rat.Journal of Comparative Neurology, 454, 15–33.
Higgs, S., Williams, C. M., & Kirkham, T. C. (2003). Cannabinoid influences onpalatability. Microstructural analysis of sucrose drinking after [DELTA]9-THC,anandamide, 2-AG and SR141716. Psychopharmacology, 165, 370–377.
Hokfelt, T., Martensoon, R., Bjorklund, A., Kleinau, S., & Goldstein, M. (1984).Distributional maps of tyrosine-hydroxylase-immuno-reactive neurons in thebrain. In A. Bjiorklund & T. Hokfelt (Eds.). Classical transmitters in the CNS. Serieshandbook of chemical neuroanatomy (Vol. 2, pp. 277–379). Amsterdam: Elsevier.
Hollmann, M., Hellrung, B., Schlogl, H., Kabisch, S., Stumvoll, M., Villringer, A., et al.(2012). Neural correlates of the volitional regulation of the desire for food.International Journal of Obesity, 36, 648–655.
Kelley, A. E., Bakshi, V. P., Haber, S. N., Steininger, T. L., Will, M. J., & Zhang, M. (2002).Opioid modulation of taste hedonics within the ventral striatum. Physiology &Behavior, 76(3), 365–377.
Kenney, P. J. (2011). Reward mechanisms in obesity. New insights and futuredirections. Neuron, 69(4), 664–679.
Koch, J. E. (2001). [DELTA]9-THC stimulates food intake in Lewis rats. Effects onchow, high-fat and sweet high-fat diets. Nutritional Neuroscience, 4, 179–187.
La Bar, K. S., Gitelman, D. R., Parrish, T. B., Kim, Y. H., Nobre, A. C., & Mesulam, M. M.(2001). Hunger selectively modulates corticolimbic activation to food stimuli inhumans. Behavioral Neuroscience, 115(2), 493–500.
Lim, J., Wood, A., & Green, B. G. (2009). Derivation and evaluation of a labeledhedonic scale. Chemical Senses, 34(9), 739–751.
Lowe, M. R., Butryn, M. L., Didie, E. R., Annunziato, R. A., Thomas, J. R., Crerand, C. E.,et al. (2009). The power of food scale. A new measure of the psychologicalinfluence of the food environment. Appetite, 53(1), 114–118.
174 S. Nolan-Poupart et al. / Appetite 60 (2013) 168–174
Lowe, M. R., Van Steenburgh, J., Ochner, C., & Coletta, M. (2009). Neural correlates ofindividual differences related to appetite. Physiology & Behavior, 97(5), 561–571.
Macey, P. M., Macey, K. E., Kumar, R., & Harper, R. M. (2004). A method for removalof global effects from fMRI time series. NeuroImage, 22(1), 360–366.
Mai, J. K., Assheuer, J., & Paxinos, G. (2004). Atlas of the human brain. San Diego, CA:Elsevier Academic Press.
Maldjian, J. A., Laurienti, P. J., Kraft, R. A., & Burdette, J. H. (2003). An automatedmethod for neuroanatomic and cytoarchitectonic atlas-based interrogation offMRI data sets. NeuroImage, 19(3), 1233–1239.
Malik, S., McGlone, F., Bedrossian, D., & Dagher, A. (2008). Ghrelin modulates brainactivity in areas that control appetitive behavior. Cell Metabolism, 7(5),400–409.
Mansour, A., Fox, C. A., Akil, H., & Watson, S. J. (1995). Opioid-receptor mRNAexpression in the rat CNS. Anatomical and functional implications. Trends inNeuroscience, 18(1), 22–29.
Mansour, A., Fox, C. A., Burke, S., Akil, H., & Watson, S. J. (1995).Immunohistochemical localization of the cloned mu opioid receptor in the ratCNS. Journal of Chemical Neuroanatomy, 8(4), 283–305.
Miranda-Paiva, C. M., Ribeiro-Barbosa, E. R., Canteras, N. S., & Felicio, L. F. (2003). Arole for the periaqueductal grey in opiodergic inhibition of maternal behavior.European Journal of Neuroscience, 18(3), 667–674.
Mota-Ortiz, S., Sukikara, M. H., Felicio, L. F., & Canteras, N. S. (2009). Afferentconnections to the rostrolateral part of the periaqueductal gray. A critical regioninfluencing the motivation drive to hunt and forage. Neural Plasticity, 2009.http://dx.doi.org/10.1155/2009/612698.
Napadow, V., Dhond, R., Kennedy, D., Hui, K. S., & Makris, N. (2006). Automatedbrainstem co-registration (ABC) for MRI. NeuroImage, 32(3), 1113–1119.
O’Doherty, J., Buchanan, T. W., Seymour, B., Dolan, R. J. (2006). Predictive neuralcoding of reward preference involves dissociable response in human ventralmidbrain and ventral striatum.
O’Doherty, J., Rolls, E. T., Francis, S., Bowtell, R., McGlone, F., Kobal, G., et al. (2000).Sensory-specific satiety-related olfactory activation of the human orbitofrontalcortex. NeuroReport, 11(4), 893–897.
Pannacciulli, N., Del Parigi, A., Chen, K., Le, D. S. N. T., Reiman, E. M., & Tataranni, P. A.(2006). Brain abnormalities in human obesity. A voxel-based morphometricstudy. NeuroImage, 31(4), 1419–1425.
Peciña, S., Smith, K. S., & Berridge, K. C. (2006). Hedonic hot spots in the brain. TheNeuroscientist, 12(6), 500–511.
Rabiner, E. A., Beaver, J., Makwana, A., Searle, G., Long, C., Nathan, P. J., et al. (2011).Pharmacological differentiation of opiod receptor antagonists by molecular andfunctional imaging of target occupancy and food reward-related brainactivation in humans. Molecular Psychiatry, 16, 826–835.
Rothemund, Y., Preuschhof, C., Bohner, G., Bauknecht, H. C., Klingebiel, R., Flor, H.,et al. (2007). Differential activation of the dorsal striatum by high-calorie visualfood stimuli in obese individuals. NeuroImage, 37(2), 410–421.
Shah, Y. B., Prior, M. J. W., Dixon, A. L., Morris, P. G., & Marsden, C. A. (2004).Detection of cannabinoid agonist evoked increase in BOLD contrast in rats usingfunctional magnetic resonance imaging. Neuropharmacology, 46, 379–387.
Siep, N., Roefs, A., Roebroeck, A., Havermans, R., Bonte, M. L., & Jansen, A. (2009).Hunger is the best spice. An fMRI study of the effects of attention, hunger andcalorie content on food reward processing in the amygdala and orbitofrontalcortex. Behavioural Brain Research, 198(1), 149–158.
Small, D. M. (2009). Individual differences in the neurophysiology of reward and theobesity epidemic. International Journal of Obesity, 33, S44–S48.
Small, D. M., Gregory, M. D., Mak, Y. E., Gitelman, D., Mesulam, M. M., & Parrish, T.(2003). Dissociation of neural representation of intensity and affectivevaluation in human gustation. Neuron, 39(4), 701–711.
Small, D. M., Voss, J., Mak, Y. E., Simmons, K. B., Parrish, T., & Gitelman, D. (2004).Experience dependent neural integration of taste and smell in the human brain.Journal of Neurophysiology, 92(3), 1892–1903.
Small, D. M., Zatorre, R. J., Dagher, A., Evans, A. C., & Jones-Gotman, M. (2001).Changes in brain activity related to eating chocolate. From pleasure to aversion.Brain, 124(9), 1720–1733.
Stice, E., Spoor, S., Bohon, C., & Small, D. M. (2008). Relation between obesity andblunted striatal response to food is moderated by TaqlA A1 allele. Science,332(5900), 449–452.
Stice, E., Spoor, S., Bohon, C., Veldhuizen, M. G., & Small, D. M. (2008). Relation of rewardfrom food intake and anticipated food intake to obesity. A functional magneticresonance imaging study. Journal of Abnormal Psychology, 117(4), 924–935.
Stice, E., Yokum, S., Bohon, C., Marti, N., & Smolen, A. (2010). Reward circuitryresponsivity to food predicts increases in body mass. Moderating effects ofDRD2 and DRD4. NeuroImage, 50(4), 1618–1625.
Stice, E., Yokum, S., Burger, K. S., Epstein, L. H., & Small, D. M. (2011). Youth at riskfor obesity show greater activation of striatal and somatosensory regions tofood. The Journal of Neuroscience, 31(12), 4360–4366.
Stoeckel, L. E., Weller, R. E., Cook, E. W., III, Twieg, D. B., Knowlton, R. C., & Cox, J. E.(2008). Widespread reward-system activation in obese women in response topictures of high calorie foods. NeuroImage, 41(2), 636–647.
Stunkard, A. J., & Messick, S. (1985). The three-factor eating questionnaire tomeasure dietary restraint, disinhibition and hunger. Journal of PsychosomaticResearch, 29(1), 71–83.
Tataranni, P. A., Gautier, J. F., Chen, K., Ueker, A., Bandy, D., Salbe, A. D., et al. (1999).Neuroanatomical correlates of hunger and satiation in humans using positronemission tomography. Proceedings of the National Academy of Sciences, 96(8),4569–4574.
Volkow, N. D., Wang, G. J., Telang, F., Fowler, J. S., Goldstein, R. Z., Alia-Klein, N., et al.(2009). Inverse association between BMI and prefrontal metabolic activity inhealthy adults. Obesity, 17(1), 60–65.
Volkow, N. D., & Wise, R. A. (2005). How can drug addiction help us understandobesity? Nature Neuroscience, 8, 555–560.
Wang, G. J., Volkow, N. D., Telang, F., Jayne, M., May, Y., Zhu, W., et al. (2009). Evidenceof gender differences in the ability to inhibit brain activation elicited by foodstimulation. Proceedings of the National Academy of Sciences, 106(4), 1249–1254.
Wassum, K. M., Ostlund, S. B., Maidment, N. T., & Balleine, B. W. (2009). Distinctopioid circuits determine the palatability and the desirability of rewardingevents. Proceedings of the National Academy of Sciences, 106(30), 12512–12517.
Williams, C. M., Rogers, P. J., & Kirkham, T. C. (1998). Hyperphagia in pre-fed ratsfollowing oral [DELTA]9-THC. Physiology & Behavior, 65, 343–346.
Woolley, J. D., Gorno-Tempini, M. L., Seeley, W. W., Rankin, K., Lee, S. S., Matthews,B. R., et al. (2007). Binge eating is associated with right orbitofrontal-insular-striatal atrophy in frontotemporal dementia. Neurology, 69(14), 1424–1433.
Yeomans, M. R., & Gray, R. W. (1996). Selective effects of naltrexone on foodpleasantness and intake. Physiology & Behavior, 60(2), 439–446.
Yeomans, M. R., & Gray, R. W. (2002). Opiod peptides and the control of humaningestive behavior. Neuroscience Biobehavioral Reviews, 26, 713–728.
Zheng, H., Lenard, N. R., Shin, A. C., & Berthoud, H. R. (2009). Appetite control andenergy balance regulation in the modern world. Reward-driven brain overridesrepletion signals. International Journal of Obesity, 33, S8–S13.