Embed Size (px)
Citation preview
MID-COLUMBIA RIVER FEASIBILITY STUDY:
PHYSICAL AND CHEMICAL ANALYSES
OF HANFORD REACH SEDIMENTS
byDavid M. Damkaer
andDouglas B. Dey
Final Report of ResearchFinanced by
U.S. Army Corps of Engineers(Contract E86-86-3300)
and
Coastal Zone and Estuarine StudiesNorthwest and Alaska Fisheries Center
National Marine Fisheries ServiceNational Oceanic and Atmospheric Administration
2725 Montlake Boulevard EastSeattle, Washington 98112
March 1987
CONTENTS
Page
BACKGROUND................................................................ 1
METHODS................................................................... 2
RESULTS AND DISCUSSION.................................................... 5
Water: Turbidity/Fluoride...............................................5
Sediments............................................................... 5
Particle Size Distribution and % Carbon ................................5
Heavy Metals.......................................................... 8
Organic Pollutants....................................................11
Radioactivity........................................................ 16
CONCLUSIONS.............................................................. 18
LITERATURE CITED......................................................... 20
BACKGROUND
The National Marine Fisheries Service has long been involved in research
on the fisheries and habitat priority issues of: (1) dams and hydroelectric
power generation; (2) point and non-point source industrial waste discharge;
and (3) waterway development (including dredging, filling, and dredge
disposal). Because sedimentation and siltation are occurring to some extent
in the forebays and reservoirs of Columbia River dams, it may eventually be
necessary to dredge in some of these areas. Information on the nature,
origin, and extent of industrially-discharged materials which may have
accumulated at sites subject to future excavation will contribute to salmonid
and habitat management in the Columbia River Basin by state and federal
fishery and environmental agencies, Indian tribes, and power entities.
The entire United States mainstem Columbia River is impounded behind a
succession of dams except for a 52-mile section which extends from Richland,
Washington, at River Mile (RM) 345 upriver to Priest Rapids Dam (RM 397).
Commonly termed the Hanford Reach, this section remains the only free-flowing
segment of the Columbia River above Bonneville Dam (RM 145); it provides a
large mainstem spawning area for a valuable population of fall chinook
salmon. It has been proposed by the COE that a shallow-draft navigation
channel be established through the Hanford Reach to accommodate river barge
transportation upstream to the Wenatchee, Washington, area (RM 470). As the
excavation of the channel may result in the resuspension and release of any
contaminants associated with the sediments, a determination of potentially
hazardous materials in the sediments is of primary concern.
2
The specific objectives of the present study were to: (1) provide
appropriate physical and chemical analyses of representative samples of
sediment likely to be dredged from the Hanford Reach and (2) provide an
evaluation of the potential for the introduction of contaminants into the
water column.
METHODS
The four sites sampled in August 1986 are relatively shallow and would
require excavation for the proposed Hanford Reach navigation channel (Fig.
1). Location 1, well upriver from Hanford, was selected as a reference
station presumably not influenced by activities at Hanford. Locations 2 and 3
are adjacent to the center of the Hanford riverside operations, and Location 4
is downriver from most of the Hanford complex.
Initially, the sampling plan included a transect of six sediment core
samples at each of the four locations. The six samples from each location
were to be combined, yielding four composite samples. However, repeated
attempts at each of the locations to obtain sediment in mid-river were
unsuccessful since the bottom throughout much of this free-flowing segment of
the Columbia River consists primarily of rocks, cobbles, and boulders. In
addition to various efforts with a gravity-corer and a Ponar grab-sampler,
many attempts to obtain sediment were made at each location using a 6 1/2-in
OD by 6-in long cast-iron pipe with a cleaned cloth bag clamped over one
end. This sampler was dragged along the bottom for short periods of time,
usually less than 15 sec. These endeavors produced quite a few walnut- to
fist-sized rocks but no fine sediment. Finally, sediment was obtained by hand
along the shore on each side of the river at all four locations. At each

Figure 1.--Sampling locations for Hanford Reach sediment study, Columbia River.
4
sampling site, rocks and gravel were cleared away with a stainless-steel
spoon; sediment from at or just below the fluctuating waterline was scooped
into a large stainless-steel bucket, mixed thoroughly, and distributed into
separate sample bottles for the various analyses. Sample bottles for organic
chemical analyses were pre-rinsed with dichloromethane (CH 2C12 ). All samples
were immediately frozen with dry ice and eventually stored at -18° C. Samples
from each side of the river were combined, by location, providing four
composite samples for each analysis.
In October 1986, a Ponar grab-sampler was used to collect sediment at
four sites in the forebay of McNary Dam. Preparation of sample bottles and
treatment of samples after collection were the same as with the Hanford
samples.
Analyses for sediment physical structure and total heavy metal content
(using strong-acid extract technique) were conducted by Northwest Testing
Laboratories, Inc., Portland, Oregon (ASTM 1984a, 1984b; USEPA 1982). All
organic chemical analyses were done by the National Analytical Facility,
Northwest and Alaska Fisheries Center. Analytical methods and instrumentation
for organic analyses are discussed in MacLeod et al. (1985). Estimates of
01/alpha and beta radioactivity were determined with a Ludlum Geiger counter-- ,
Model 14C with Model 44-7 end-window GM. Gamma radioactivity was measured
with a Micromedic Systems@ 4/200 automatic gamma counter. Surface water,
collected at each of the four sampling locations, was analyzed for turbidity
(using an HF Instruments®, Model DRT-15 turbidimeter) and fluoride (using a
HACH Co.@ fluoride meter with ion selective electrode).
1/ Reference to trade names does not imply endorsement by the National MarineFisheries Service, NOAA.
5
RESULTS AND DISCUSSION
Water: Turbidity/Fluoride
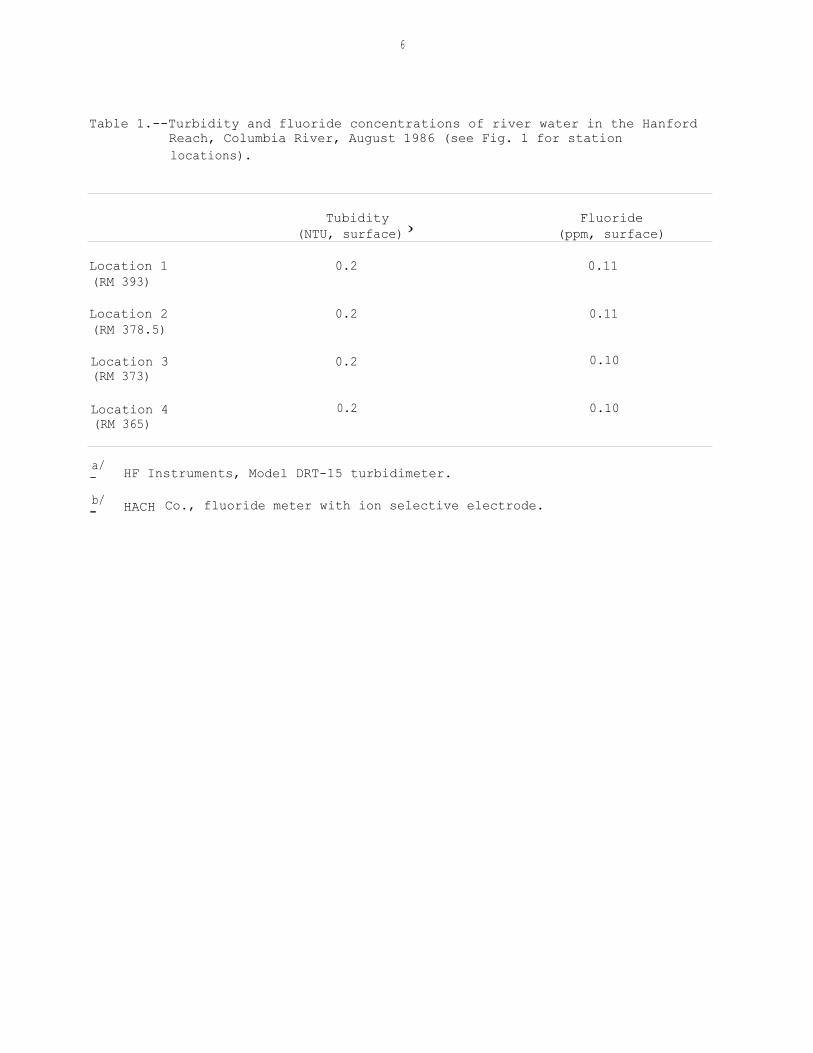
Turbidity measurements taken in August from surface samples at each of
the four locations indicate uniformly low turbidity throughout the study area
(Table 1). Fluoride concentrations, determined as a possible index to
aluminum-production activity upriver, were also uniformly low (Table 1).
These low fluoride concentrations, which are near "background " levels for the
Columbia River, may reflect improved wastewater-discharge techniques only
recently employed by upriver industry. For example, an aluminum plant built
in 1952 near Wenatchee, Washington (RM 455), discharged 10 - 15 million gal of
wastewater per day directly into the Columbia River until 1977 when it first
began to pond and treat its wastes before discharge. In 1985, the Wenatchee
aluminum plant converted air-emission control systems from wet- to dry-
scrubbing and thereby eliminated a large water and fluoride discharge from
those systems. Consequently, fluoride concentrations may be lower in the
Columbia River below Wenatchee than they have been in over 30 years (Damkaer
and Dey 1986b).
Sediments
Particle Size Distribution and %-Carbon
Results of particle size distribution and 7.-carbon analyses show very
little inter-location difference (Table 2). It should be reiterated that in
almost all cases these analyses were performed on material collected by hand
after a variable layer of rocks had been removed. Only the sample collected
from the eastern shore at Location 4 was taken without removing covering
material. While Location 4 sediments contained a greater proportion of fine
materials than the other three locations, the sediment from all four locations
6
Table 1.--Turbidity and fluoride concentrations of river water in the HanfordReach, Columbia River, August 1986 (see Fig. 1 for stationlocations).
Tubidity(NTU, surface))
Fluoride(ppm, surface)
Location 1 0.2 0.11(RM 393)
Location 2 0.2 0.11(RM 378.5)
Location 3 0.2 0.10(RM 373)
Location 4 0.2 0.10(RM 365)
a/- HF Instruments, Model DRT-15 turbidimeter.
b/- HACH Co., fluoride meter with ion selective electrode.

7
Table 2.--Particle size distribution and % carbon for sediment collected inthe Hanford Reach, Columbia River, August 1986 (see Fig. 1 forstation locations).
Location 1(RM 393)
Location 2(RM 378.5)
Location 3(RM 373)
Location 4(RM 365)
Gravel 37 30 31 30(19.1 - 1.0 mm)
Sand 58 66 59 50(1.0 - 0.074 mm)
Silt 3 2 7 6(0.074 - 0.005 mm)
Clay 2 2 3 14(<0.005 mm)
Carbon 0.33 0.20 0.14 0.27
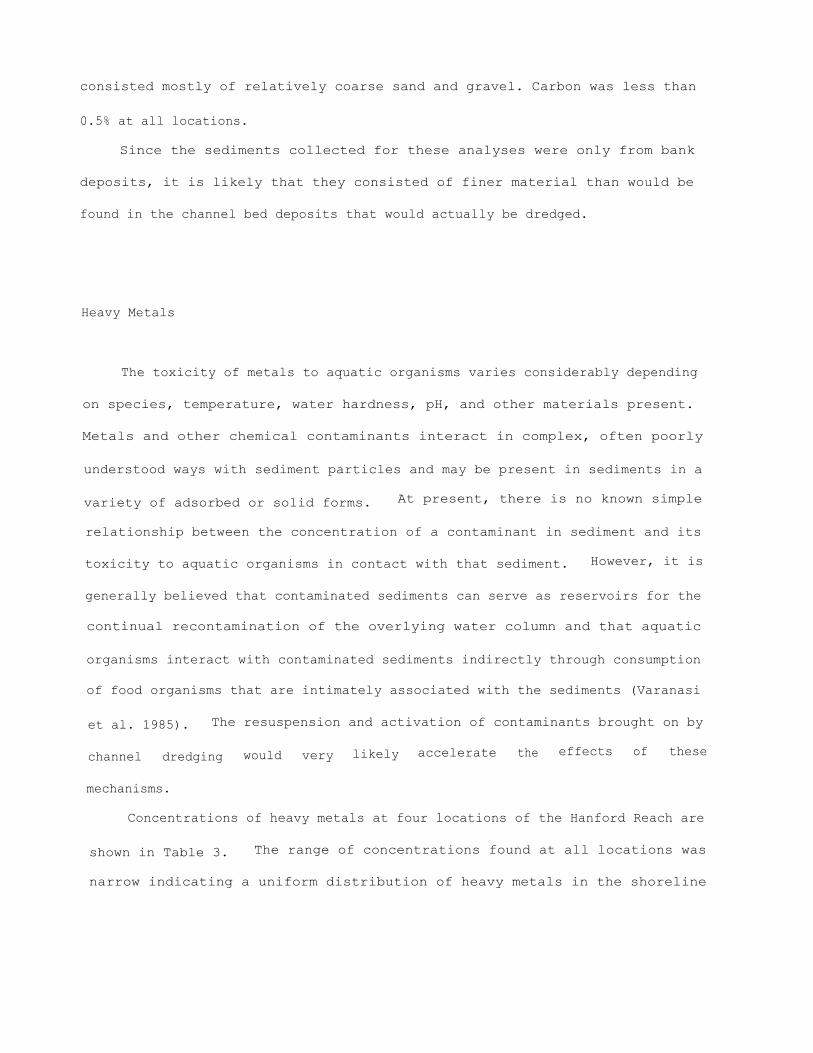
consisted mostly of relatively coarse sand and gravel. Carbon was less than
0.5% at all locations.
Since the sediments collected for these analyses were only from bank
deposits, it is likely that they consisted of finer material than would be
found in the channel bed deposits that would actually be dredged.
Heavy Metals
The toxicity of metals to aquatic organisms varies considerably depending
on species, temperature, water hardness, pH, and other materials present.
Metals and other chemical contaminants interact in complex, often poorly
understood ways with sediment particles and may be present in sediments in a
variety of adsorbed or solid forms. At present, there is no known simple
relationship between the concentration of a contaminant in sediment and its
toxicity to aquatic organisms in contact with that sediment. However, it is
generally believed that contaminated sediments can serve as reservoirs for the
continual recontamination of the overlying water column and that aquatic
organisms interact with contaminated sediments indirectly through consumption
of food organisms that are intimately associated with the sediments (Varanasi
et al. 1985). The resuspension and activation of contaminants brought on by
channel dredging would very likely accelerate the effects of these
mechanisms.
Concentrations of heavy metals at four locations of the Hanford Reach are
shown in Table 3. The range of concentrations found at all locations was
narrow indicating a uniform distribution of heavy metals in the shoreline
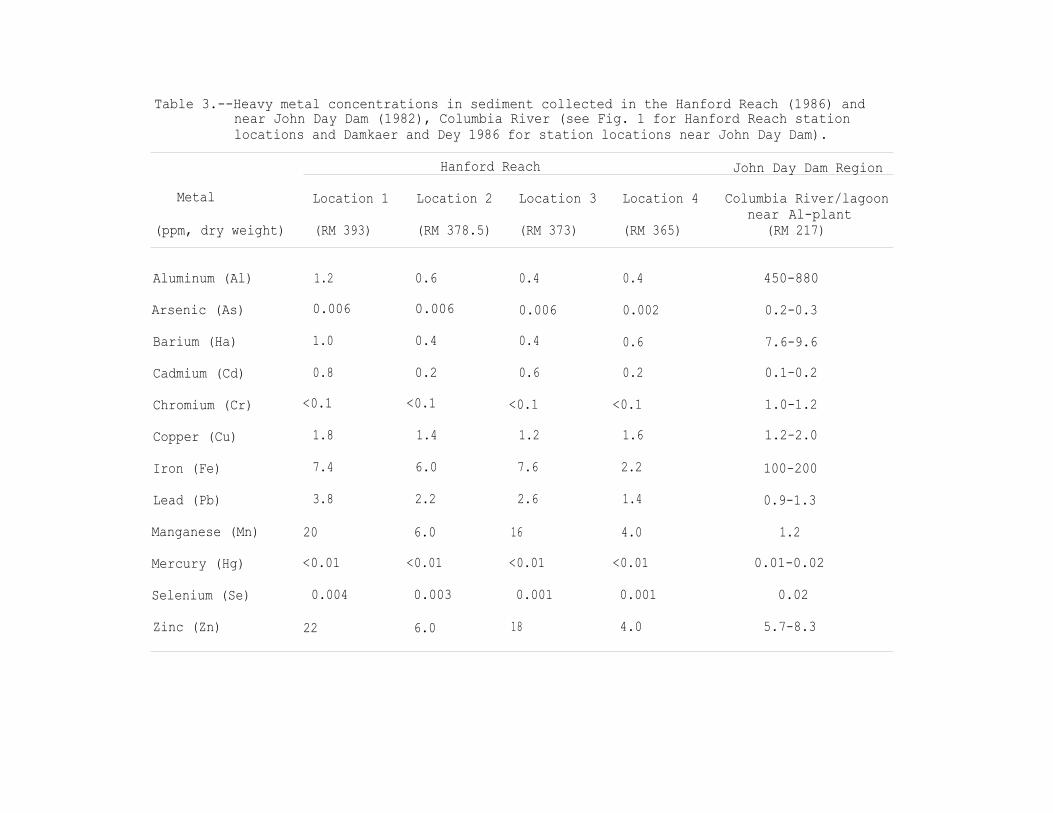
Table 3.--Heavy metal concentrations in sediment collected in the Hanford Reach (1986) andnear John Day Dam (1982), Columbia River (see Fig. 1 for Hanford Reach stationlocations and Damkaer and Dey 1986 for station locations near John Day Dam).
Hanford Reach John Day Dam Region
Metal Location 1 Location 2 Location 3 Location 4 Columbia River/lagoonnear Al-plant
(ppm, dry weight) (RM 393) (RM 378.5) (RM 373) (RM 365) (RM 217)
1.2 0.6 0.4 0.4 450-880
0.006 0.006 0.006 0.002 0.2-0.3
1.0 0.4 0.4 0.6 7.6-9.6
0.8 0.2 0.6 0.2 0.1-0.2
<0.1 <0.1 <0.1 <0.1 1.0-1.2
1.8 1.4 1.2 1.6 1.2-2.0
7.4 6.0 7.6 2.2 100-200
3.8 2.2 2.6 1.4 0.9-1.3
20 6.0 16 4.0 1.2
<0.01 <0.01 <0.01 <0.01 0.01-0.02
0.004 0.003 0.001 0.001 0.02
Aluminum (Al)
Arsenic (As)
Barium (Ha)
Cadmium (Cd)
Chromium (Cr)
Copper (Cu)
Iron (Fe)
Lead (Pb)
Manganese (Mn)
Mercury (Hg)
Selenium (Se)
Zinc (Zn) 22 6.0 18 4.0 5.7-8.3
10
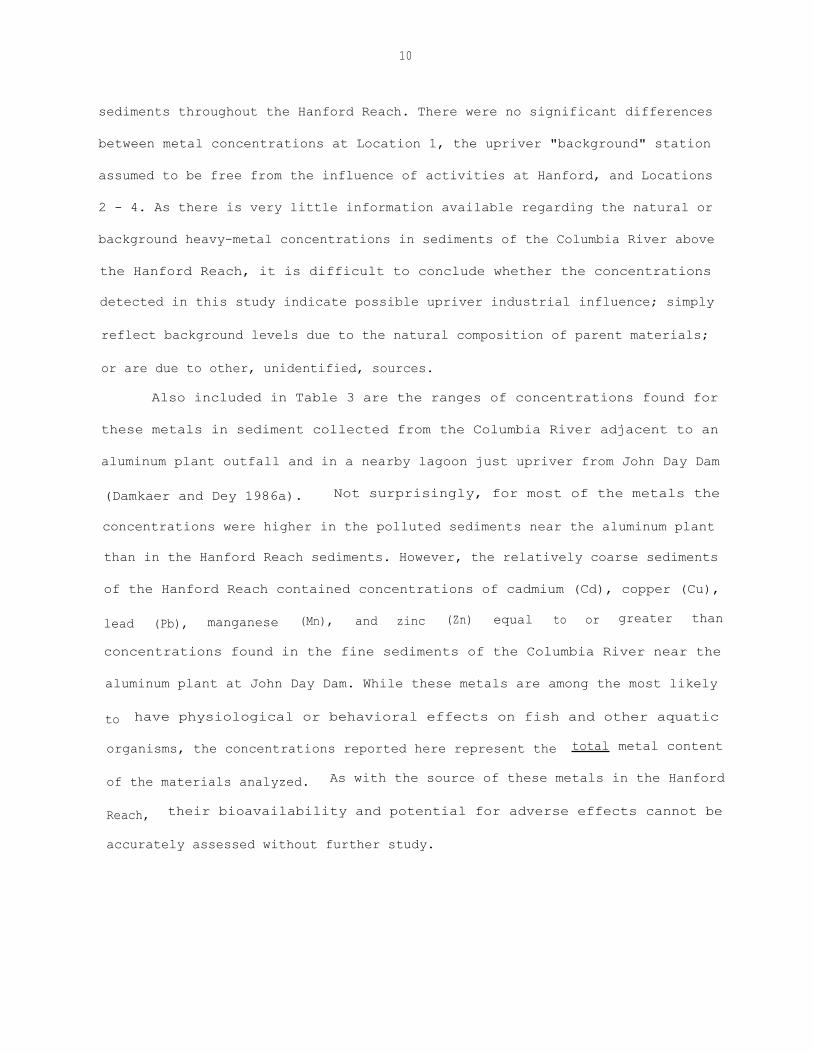
sediments throughout the Hanford Reach. There were no significant differences
between metal concentrations at Location 1, the upriver "background" station
assumed to be free from the influence of activities at Hanford, and Locations
2 - 4. As there is very little information available regarding the natural or
background heavy-metal concentrations in sediments of the Columbia River above
the Hanford Reach, it is difficult to conclude whether the concentrations
detected in this study indicate possible upriver industrial influence; simply
reflect background levels due to the natural composition of parent materials;
or are due to other, unidentified, sources.
Also included in Table 3 are the ranges of concentrations found for
these metals in sediment collected from the Columbia River adjacent to an
aluminum plant outfall and in a nearby lagoon just upriver from John Day Dam
(Damkaer and Dey 1986a). Not surprisingly, for most of the metals the
concentrations were higher in the polluted sediments near the aluminum plant
than in the Hanford Reach sediments. However, the relatively coarse sediments
of the Hanford Reach contained concentrations of cadmium (Cd), copper (Cu),
lead (Pb), manganese (Mn), and zinc (Zn) equal to or greater than
concentrations found in the fine sediments of the Columbia River near the
aluminum plant at John Day Dam. While these metals are among the most likely
to have physiological or behavioral effects on fish and other aquatic
organisms, the concentrations reported here represent the total metal content
of the materials analyzed. As with the source of these metals in the Hanford
Reach, their bioavailability and potential for adverse effects cannot be
accurately assessed without further study.
11
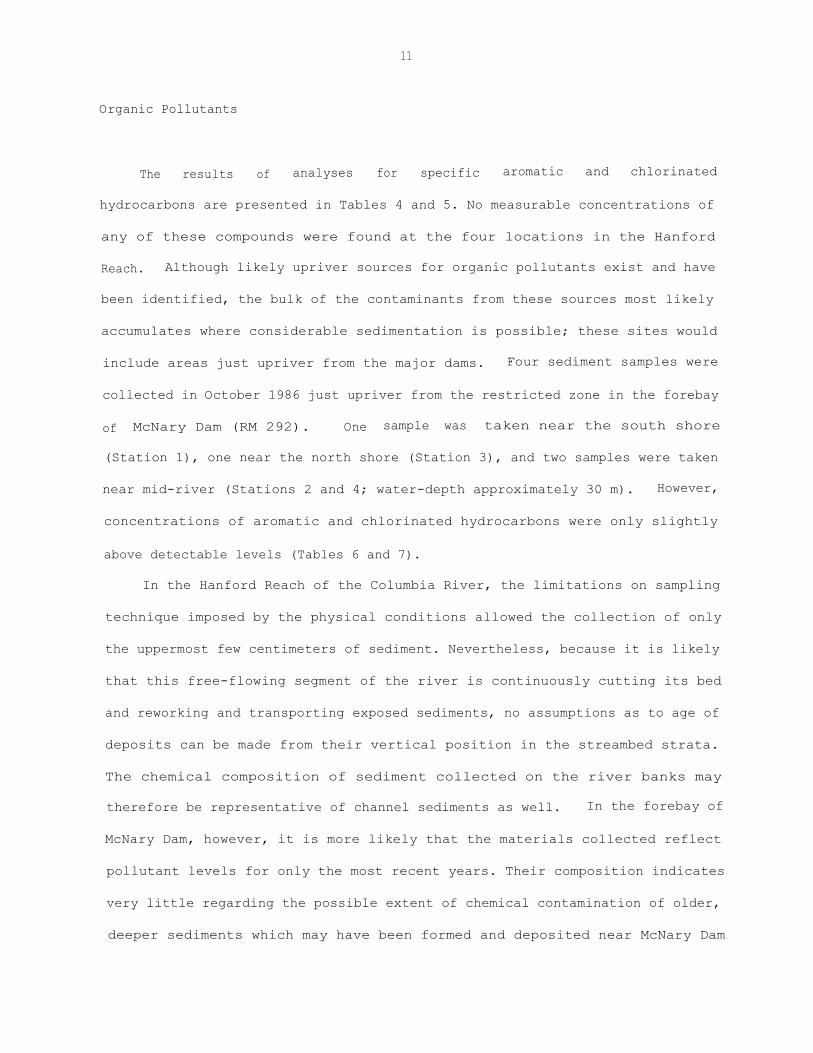
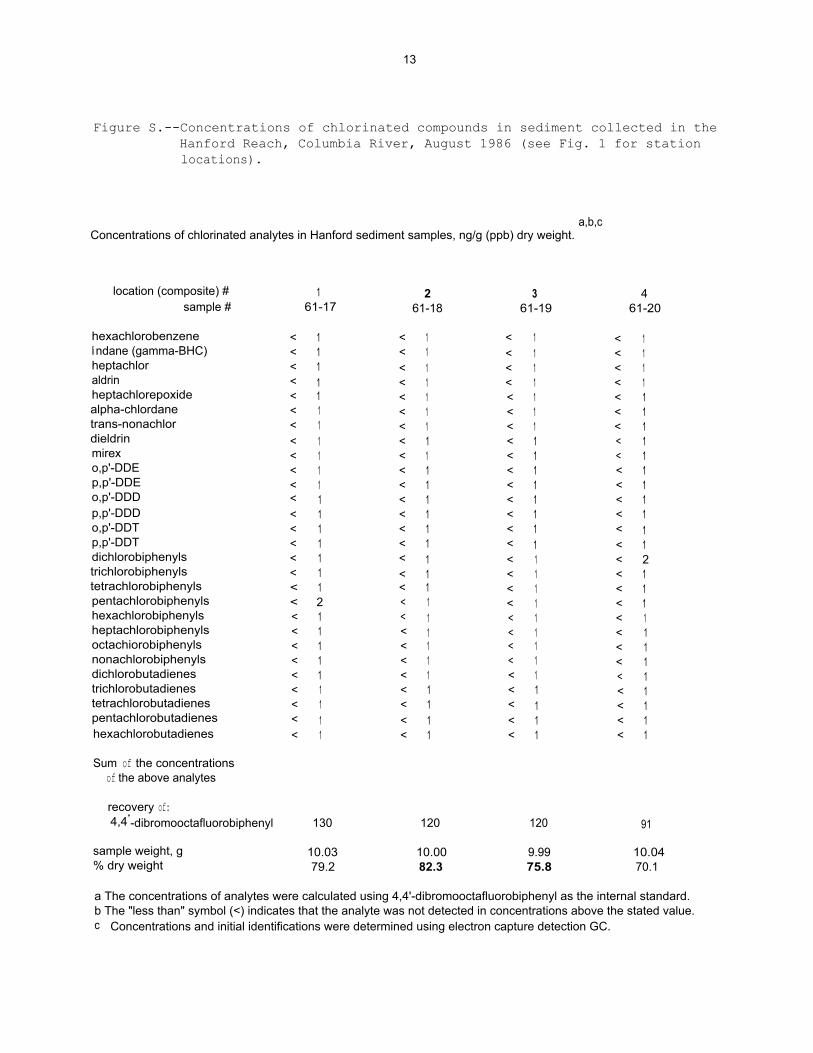
Organic Pollutants
The results of analyses for specific aromatic and chlorinated
hydrocarbons are presented in Tables 4 and 5. No measurable concentrations of
any of these compounds were found at the four locations in the Hanford
Reach. Although likely upriver sources for organic pollutants exist and have
been identified, the bulk of the contaminants from these sources most likely
accumulates where considerable sedimentation is possible; these sites would
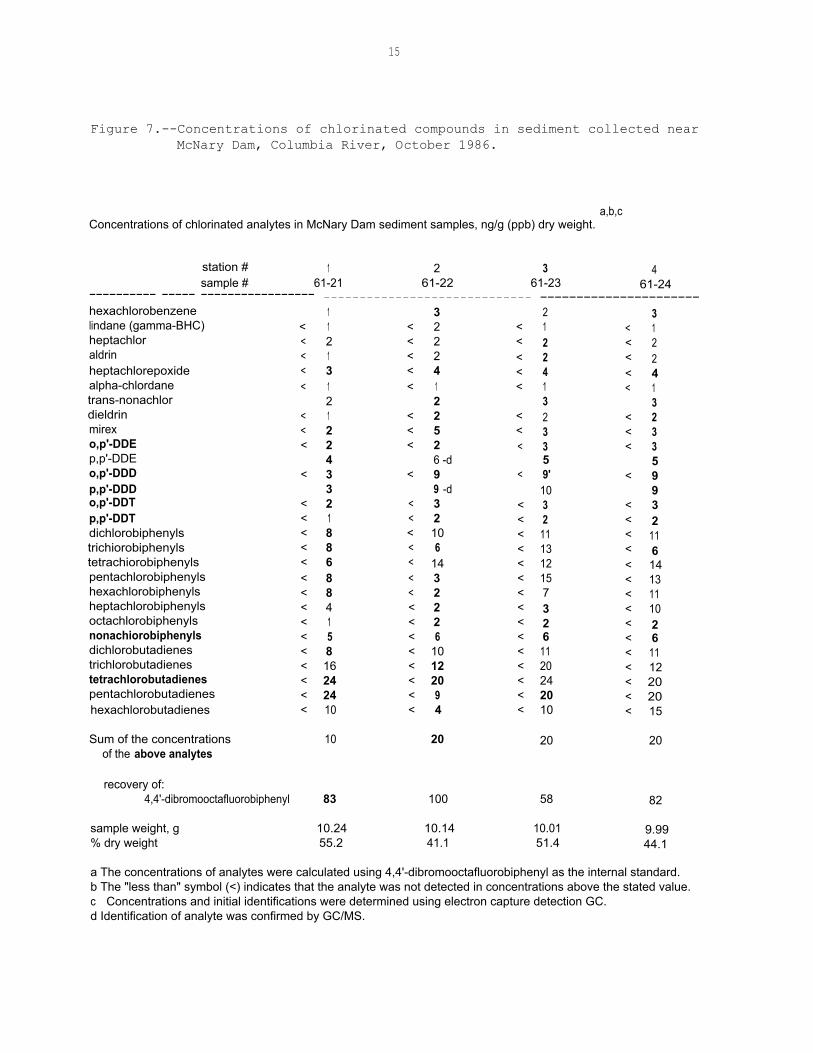
include areas just upriver from the major dams. Four sediment samples were
collected in October 1986 just upriver from the restricted zone in the forebay
of McNary Dam (RM 292). One sample was taken near the south shore
(Station 1), one near the north shore (Station 3), and two samples were taken
near mid-river (Stations 2 and 4; water-depth approximately 30 m). However,
concentrations of aromatic and chlorinated hydrocarbons were only slightly
above detectable levels (Tables 6 and 7).
In the Hanford Reach of the Columbia River, the limitations on sampling
technique imposed by the physical conditions allowed the collection of only
the uppermost few centimeters of sediment. Nevertheless, because it is likely
that this free-flowing segment of the river is continuously cutting its bed
and reworking and transporting exposed sediments, no assumptions as to age of
deposits can be made from their vertical position in the streambed strata.
The chemical composition of sediment collected on the river banks may
therefore be representative of channel sediments as well. In the forebay of
McNary Dam, however, it is more likely that the materials collected reflect
pollutant levels for only the most recent years. Their composition indicates
very little regarding the possible extent of chemical contamination of older,
deeper sediments which may have been formed and deposited near McNary Dam

12
Table 4.--Concentrations of aromatic hydrocarbons in sediment collected in the1anford Reach, Columbia River, August 1986 (see Fig. 1 for stationlocations).
a,b,cConcentrations of aromatic hydrocarbons in Hanford sediment samples, ng/g (ppb) dry weight.
location (composite) #sample #
161-17
261-18
361-19
461-20
< 7 < 6 < 7 < 7< 7 < 7 < 7 < 8< 7 < 7 < 7 < 8< 7 < 6 < 7 < 7< 7 < 6 < 7 < 7< 7 < 7 < 7 < 8< 6 < 6 < 7 < 7< 6 < 6 < 6 < 7< 6 < 6 < 6
< 7< 6 < 6 < 6
< 7< 6 < 6 < 6 < 7< 6 < 6 < 6 < 7< 9 < 9 < 8 < 11< 10 < 9 < 8 < 13< 11 < 11 < 10 < 15< 12 < 12 < 11 < 16< 13 < 13 < 11 < 17
naphthalene2-methylnaphthalene 1-methylnaphthalene biphenyl2,6-dimethylnaphthalene acenaphthene fluorene phenanthrene anthracene1-methylphenanthrene fluoranthenepyrenebenz[a]anthracene chrysenebenzo[e]pyrene benzo[a]pyrene perylenedibenz[a,h]anthracene < 16 < 16 < 14 < 21
Sum of the concentrationsof the above analytes
% recovery of:naphthalene-d8 89 93 86 88acenaphthene-d10 91 96 92 92perylene-d12 77 80 90 65
sample weight, g 10.03 10.00 9.99 10.04% dry weight 79.2 82.3 75.8 70.1
a The concentrations of analytes from napthalene through 1-methylnaphthalene were calculated usingnaphthalene-d8 as the internal standard; analytes from biphenyl through pyrene were calculated using acenaphthene-dl 0;analytes from benz[a]anthracene through dibenz[a,h]anthracene were calculated using perylene-d12.
b The less than" symbol (<) indicates that the analyte was not detected in concentrations above the stated value. c Concentrations and initial identifications were determined using flame ionization detection GC.
13
Figure S.--Concentrations of chlorinated compounds in sediment collected in theHanford Reach, Columbia River, August 1986 (see Fig. 1 for stationlocations).
a,b,cConcentrations of chlorinated analytes in Hanford sediment samples, ng/g (ppb) dry weight.
location (composite) #sample #
161-17
261-18
361-19
461-20
hexachlorobenzene < 1 < 1 < 1 < 1li ndane (gamma-BHC) < 1 < 1 < 1 < 1heptachlor < 1 < 1 < 1 < 1aldrin < 1 < 1 < 1 < 1heptachlorepoxide < 1 < 1 < 1 < 1alpha-chlordane < 1 < 1 < 1 < 1trans-nonachlor < 1 < 1 < 1 < 1dieldrin < 1 < 1 < 1 < 1mirex < 1 < 1 < 1 < 1o,p'-DDE < 1 < 1 < 1 < 1p,p'-DDE < 1 < 1 < 1 < 1o,p'-DDD < 1 < 1 < 1 < 1p,p'-DDD < 1 < 1 < 1 < 1o,p'-DDT < 1 < 1 < 1 < 1p,p'-DDT < 1 < 1 < 1 < 1dichlorobiphenyls < 1 < 1 < 1
< 2trichlorobiphenyls < 1 < 1 < 1
< 1tetrachlorobiphenyls < 1 < 1 < 1
< 1pentachlorobiphenyls < 2 < 1 < 1
< 1hexachlorobiphenyls < 1 < 1 < 1 < 1heptachlorobiphenyls < 1 < 1 < 1 < 1octachiorobiphenyls < 1 < 1 < 1
< 1nonachlorobiphenyls < 1 < 1 < 1
< 1dichlorobutadienes < 1 < 1 < 1 < 1trichlorobutadienes < 1 < 1 < 1 < 1tetrachlorobutadienes < 1 < 1 < 1 < 1pentachlorobutadienes < 1 < 1 < 1 < 1hexachlorobutadienes < 1 < 1 < 1 < 1
Sum of the concentrationsof the above analytes
recovery of:4,4'-dibromooctafluorobiphenyl 130 120 120 91
sample weight, g 10.03 10.00 9.99 10.04% dry weight 79.2 82.3 75.8 70.1
a The concentrations of analytes were calculated using 4,4'-dibromooctafluorobiphenyl as the internal standard. b The "less than" symbol (<) indicates that the analyte was not detected in concentrations above the stated value. c Concentrations and initial identifications were determined using electron capture detection GC.

14
Figure 6.--Concentrations of aromatic hydrocarbons in sediment collected nearMcNary Dam, Columbia River, October 1986.
a,b,cConcentrations of aromatic hydrocarbons in McNary Dam sediment samples, ng/g (ppb) dry weight.
station #sample #
161-21
2 361-22 61-23
461-24
-------- -------- ------ -------------------- ---------------- -------------naphthalene < 16 < 10 < 32 < 322-methylnaphthalene < 4 < 11 < 11 < 91-methylnaphthalene < 26 < 5 < 24 < 23biphenyl < 6 < 5 < 5 < 52,6-dimethylnaphthalene < 13 < 5 < 5 < 5acenaphthene < 4 < 5 < 5 < 5fluorene < 3 22 < 5 7phenanthrene < 3 15 < 4 < 4anthracene < 3 6 < 4 < 41-methylphenanthrene < 3 < 3 < 4 < 4fluoranthene < 4 7 < 5 11pyrene < 4 < 3 < 5 9benz[a]anthracene < 2 < 3 < 4 < 3chrysene < 4 < 3 < 4 < 4benzo[e]pyrene < 4 < 5 < 6 < 5benzo[a]pyrene < 2 < 3 < 4 < 3perylene 11 7 < 4 7dibenz[a,h]anthracene < 4 8 < 6 18
Sum of the concentrationsof the above analytes
recovery of:
11 65 52
naphthalene-d8 63 79 57 72acenaphthene-d10 66 81 57 74perylene-d12 65 87 55 76
sample weight, g 10.24 10.14 10.01 9.99% dry weight 55.2 41.1 51.4 44.1
a The concentrations of analytes from napthalene through 1-methylnaphthalene were calculated usingnaphthalene-d8 as the internal standard; analytes from biphenyl through pyrene were calculated using acenaphthene-d10;analytes from benz[a]anthracene through dibenz[a,h]anthracene were calculated using perylene-dl 2.
b The "less than" symbol (<) indicates that the analyte was not detected in concentrations above the stated value.c Concentrations and initial identifications were determined using flame ionization detection GC.
15
Figure 7.--Concentrations of chlorinated compounds in sediment collected nearMcNary Dam, Columbia River, October 1986.
a,b,cConcentrations of chlorinated analytes in McNary Dam sediment samples, ng/g (ppb) dry weight.
station # 1 261-22
361-23
461-24sample # 61-21
---------- ----- ----------------- ----------------------------- ----------------------hexachlorobenzene 1 3 2 3lindane (gamma-BHC) < 1 < 2 < 1 < 1heptachlor < 2 < 2 < 2 < 2aldrin < 1 < 2 < 2 < 2heptachlorepoxide < 3 < 4 < 4 < 4alpha-chlordane < 1 < 1 < 1 < 1trans-nonachlor 2 2 3 3dieldrin < 1 < 2 < 2 < 2mirex < 2 < 5 < 3 < 3o,p'-DDE < 2 < 2 < 3 < 3p,p'-DDE 4 6 -d 5 5o,p'-DDD < 3 < 9 < 9' < 9p,p'-DDD 3 9 -d 10 9o,p'-DDT < 2 < 3 < 3 < 3p,p'-DDT < 1 < 2 < 2 < 2dichlorobiphenyls < 8 < 10 < 11 < 11trichiorobiphenyls < 8 < 6 < 13 < 6tetrachiorobiphenyls < 6 < 14 < 12 < 14pentachlorobiphenyls < 8 < 3 < 15 < 13hexachlorobiphenyls < 8 < 2 < 7 < 11heptachlorobiphenyls < 4 < 2 < 3 < 10octachlorobiphenyls < 1 < 2 < 2 < 2nonachiorobiphenyls < 5 < 6 < 6 < 6dichlorobutadienes < 8 < 10 < 11 < 11trichlorobutadienes < 16 < 12 < 20 < 12tetrachlorobutadienes < 24 < 20 < 24 < 20pentachlorobutadienes < 24 < 9 < 20 < 20hexachlorobutadienes < 10 < 4 < 10 < 15
Sum of the concentrationsof the above analytes
recovery of:
10 20 20 20
83 100 58 82
10.24 10.14 10.01 9.99
4,4'-dibromooctafluorobiphenyl
sample weight, g% dry weight 55.2 41.1 51.4 44.1
a The concentrations of analytes were calculated using 4,4'-dibromooctafluorobiphenyl as the internal standard.b The "less than" symbol (<) indicates that the analyte was not detected in concentrations above the stated value.c Concentrations and initial identifications were determined using electron capture detection GC.d Identification of analyte was confirmed by GC/MS.
16
during the many years of relatively little or no regulation of industrial
discharge.
Radioactivity
Since January 1971 when the last of nine plutonium production reactors
using direct discharge of once-through cooling waters into the Columbia River
was closed, the biota and sediments of the Hanford Reach have been exposed to
much lower ambient levels of radionuclides (Cushing et al. 1981). In the
river-reservoir complex extending below Hanford to McNary Dam, fission-
produced radionuclides decreased to extremely low or unmeasurable levels
within 2 years. In the free-flowing Hanford Reach, the decrease was probably
even more rapid, despite the continued presence of the N Reactor and its
seepage effluents.
Relative levels of total alpha, beta, and gamma radioactivity of sediment
samples collected in the Hanford Reach in August of 1986 are shown in
Table 8. While no alpha activity was detected, a slight increase in beta
activity was measured moving downriver from Location 1 (above Hanford) to
Location 4 (below Hanford). Gamma activity at Locations 2-4 was not
significantly different from the level at Location 1. As with other
contaminants, it is presumed that . the reservoirs behind the major dams, most
notably McNary Dam, are important deposition areas for radionuclides which
have entered the river at Hanford. Because of the continuous, dynamic
reworking of the riverbed throughout the Hanford Reach, and the relatively low
influx of new material due to upriver dams, it is not likely that an
undetected and dangerous buildup of long-lived radionuclides has occurred in
the channel sediments adjacent to the locations sampled.

17
Table 8.--Total alpha, beta, and gamma radioactivity of sediment collectedin the Hanford Reach, Columbia River, August 1986 (see Fig. 1 forstation locations).
Al cpm)a/ Beta (cpm) a/ Gamma (cpm) II ( Cix10-5 )
Location 1 <20 50 49 4.3(RM 393)
Location 2 <20 50 53 4.6(RM 378.5)
Location 3 <20 60 50 4.4(RM 373)
Location 4 <20 80 52 4.5(RM 365)
Laboratorybackground
<20 25 49 4.3
a/- Ludlum Geiger Counter, Model 14C with Model 44-7 end window GM.
b/- Micromedic Systems - 4/200 Automatic Gamma Counter.
18
CONCLUSIONS
Because of the difficulties of employing conventional sediment sampling
techniques in the Hanford Reach, it was only possible to, literally, " scratch
the surface." However, because of the dynamic physical processess constantly
cutting, reworking, and transporting the riverbed sediments throughout this
section of the Columbia River, surface sediments collected from shore may be
representative of general sediment quality in this area. On the other hand,
the deposition of some of the sediment that would be dredged for a navigation
channel through the Hanford Reach certainly occurred during earlier times of
unregulated industrial discharge to the river and the full operation of all
the reactors at Hanford. Therefore, important questions remain regarding the
composition of the deeper channel sediments which would be subject to
dredging.
Nevertheless, the surface sediments of the Hanford Reach can be
characterized as being extremely coarse (rocks, supported by gravel and sand)
and consisting of less than 0.5% carbon; 'measurable (but not necessarily
biologically significant) levels of total heavy metals (most notably Cd, Cu,
Pb, Mn, and Zn); undetectable levels of aromatic and chlorinated hydrocarbons;
and near-background levels of total alpha, beta, and gamma radioactivity.
From the available data, it cannot be concluded that a strong potential
exists for the introduction into the water column, through dredging, of
harmful concentrations of contaminants. In the case of heavy metals, further
study is required to establish the relative upriver background concentrations
(above Wenatchee) and the bioavailability of these metals in the sediments of
the Hanford Reach. The levels determined in this study for organic pollutants
and radionuclides present no apparent problems.
19
It is presumed that (1) the sediments collected in this study reflect the
general sediment quality of the Hanford Reach and (2) the relatively fine
material collected near shore would be more likely to be associated with
pollutants than the course sediments in the channel. However, only when the
surface and subsurface channel sediments themselves are directly examined will
these presumptions be affirmed.
20
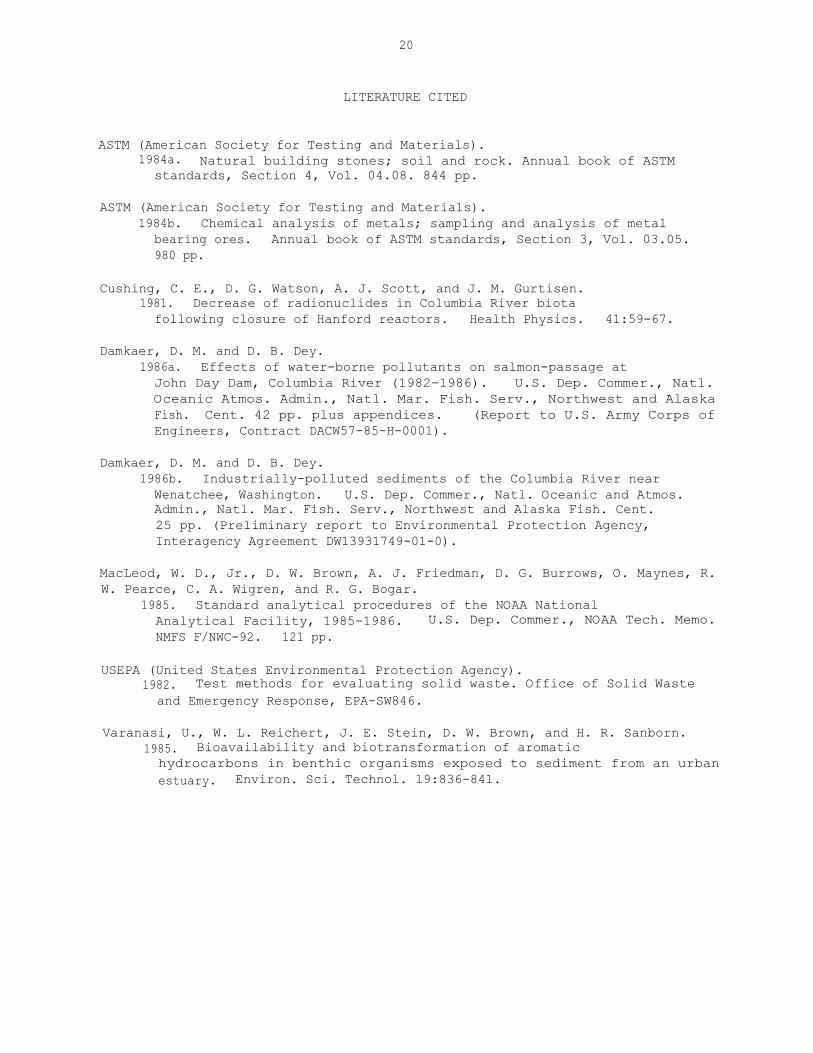
LITERATURE CITED
ASTM (American Society for Testing and Materials).1984a. Natural building stones; soil and rock. Annual book of ASTM
standards, Section 4, Vol. 04.08. 844 pp.
ASTM (American Society for Testing and Materials).1984b. Chemical analysis of metals; sampling and analysis of metal
bearing ores. Annual book of ASTM standards, Section 3, Vol. 03.05.980 pp.
Cushing, C. E., D. G. Watson, A. J. Scott, and J. M. Gurtisen.1981. Decrease of radionuclides in Columbia River biotafollowing closure of Hanford reactors. Health Physics. 41:59-67.
Damkaer, D. M. and D. B. Dey.1986a. Effects of water-borne pollutants on salmon-passage atJohn Day Dam, Columbia River (1982-1986). U.S. Dep. Commer., Natl.Oceanic Atmos. Admin., Natl. Mar. Fish. Serv., Northwest and AlaskaFish. Cent. 42 pp. plus appendices. (Report to U.S. Army Corps ofEngineers, Contract DACW57-85-H-0001).
Damkaer, D. M. and D. B. Dey.1986b. Industrially-polluted sediments of the Columbia River nearWenatchee, Washington. U.S. Dep. Commer., Natl. Oceanic and Atmos.Admin., Natl. Mar. Fish. Serv., Northwest and Alaska Fish. Cent.25 pp. (Preliminary report to Environmental Protection Agency,Interagency Agreement DW13931749-01-0).
MacLeod, W. D., Jr., D. W. Brown, A. J. Friedman, D. G. Burrows, O. Maynes, R.W. Pearce, C. A. Wigren, and R. G. Bogar.
1985. Standard analytical procedures of the NOAA NationalAnalytical Facility, 1985-1986. U.S. Dep. Commer., NOAA Tech. Memo.NMFS F/NWC-92. 121 pp.
USEPA (United States Environmental Protection Agency).1982. Test methods for evaluating solid waste. Office of Solid Wasteand Emergency Response, EPA-SW846.
Varanasi, U., W. L. Reichert, J. E. Stein, D. W. Brown, and H. R. Sanborn.1985. Bioavailability and biotransformation of aromatichydrocarbons in benthic organisms exposed to sediment from an urbanestuary. Environ. Sci. Technol. 19:836-841.