Embed Size (px)
Citation preview

Great Salt Lake Wetlands 2012 LiDAR Mapping Project
Box Elder, Weber, Davis, Salt Lake and Tooele Counties, Utah
COMPLETION REPORT

2
Utah AGRC2011 Lidar Acquisition
Table of ContentsTable of Contents...............................................................................................................1
SUMMARY OVERVIEW....................................................................................................2Executive Summary.......................................................................................................2
Contractor.......................................................................................................................2Scope Overview.............................................................................................................2
Specifications for Deliverables.......................................................................................3LiDAR Deliverables.....................................................................................................3
Grid Model Deliverables.............................................................................................3Miscellaneous Deliverables........................................................................................3
Project Area Extents and Project Tile Index...................................................................3LiDAR DATA REPORT......................................................................................................4
Pre-Flight Planning.........................................................................................................4Control............................................................................................................................4
Final Planning – Procedures and Activities....................................................................5Planning......................................................................................................................5
Summary of Supporting Documents...........................................................................5Data Processing Procedures Report..............................................................................6
Data Storage...............................................................................................................6Navigation System......................................................................................................6
LiDAR System............................................................................................................6LiDAR QUALITY CONTROL REPORT.............................................................................9
Methodology...................................................................................................................9Relative Accuracy.......................................................................................................9
Within Swath Overlap Accuracy.................................................................................9Fundamental Vertical Accuracy................................................................................10
Conclusions..................................................................................................................11FLIGHT REPORT............................................................................................................12
GROUND CONTROL REPORT......................................................................................13Introduction...................................................................................................................13
Ground Control Survey................................................................................................13Data Collection.............................................................................................................13
Data Processing and Analysis.....................................................................................13APPENDIX A – Index Maps and Area Boundaries..........................................................16
APPENDIX B – Flight Plan Maps....................................................................................21APPENDIX C – Raw Data File Listing.............................................................................22

3
Utah AGRC2011 Lidar Acquisition
SUMMARY OVERVIEW
Executive SummaryThis project encompasses five areas in five Utah counties and encompasses about 1147 square miles shown below. Data was collected on September and October, 2011.
Study Area County Size (mi²)Great Salt Lake Wetlands in three flight blocks labeled “North”, “Middle”, and “South
Salt Lake, Davis, Weber, Box Elder 834
Tooele Tooele 251Lower Bear River Box Elder 62Total 1147
ContractorThis project was completed under contract UGS110817 between Utah Automated Geographic Reference Center (Utah AGRC) and Utah State University (USU) LASSI Service Center.
Primary technical point of contact information:Robert T. Pack, Ph.D., [email protected] State UniversityLASSI Service Center4110 Old Main HillLogan, UT 84322-4110PH 1-435-797-7049
Scope OverviewOur responsibilities included:
Flight planning; Identification of ground control to be applied as airborne GNSS base stations and
for DEM processing; Aerial data acquisition; Collection of GNSS base station data during flight; Collection of GNSS RTK ground data for application in DEM accuracy testing; Processing, calibration and classification of LiDAR returns; Output of data deliverables including metadata; Compilation of Project Completion Report, including Flight, Data Processing and
LiDAR DEM Accuracy reporting in compliance with National Standards for Spatial Data Accuracy (NSSDA) guidelines.

4
Utah AGRC2011 Lidar Acquisition
Specifications for DeliverablesThe required accuracy and file formats for each delivery was as follows:
LiDAR Deliverables Grid Projection: UTM Zone 12NHorizontal Datum: NAD83(CORS96)Vertical Datum: NAVD88 using GEOID09Tile Size: 2000 m X 2000 MAverage Post Spacing: 0.85 mAverage Data Density: 1.37 sh/m2File Formats: *.las (v. 1.2)Classified Datasets: ASPRS/LAS Default Classes
Grid Model Deliverables File Format: IMG (.img)Grid Projection: UTM Zone 12NHorizontal Datum: NAV83(CORS96)Vertical Datum: NAVD88 using GEOID09Tile Size: 2000 m X 2000 mCell Size: 1.00m
Miscellaneous Deliverables Breakpoint Files: LAS 1.2 (.las) on specific codeMetadata Files: FGDC compliant XML file. (.xml)Project Tile Index: Portable Document Format (.pdf)Completion Report: Portable Document Format (.pdf)
LiDAR data acquisition was performed using a Riegl LMS Q560 airborne laser sensor system capable of up to a maximum 200 kHz pulse repetition rate and collection of full waveform returns.
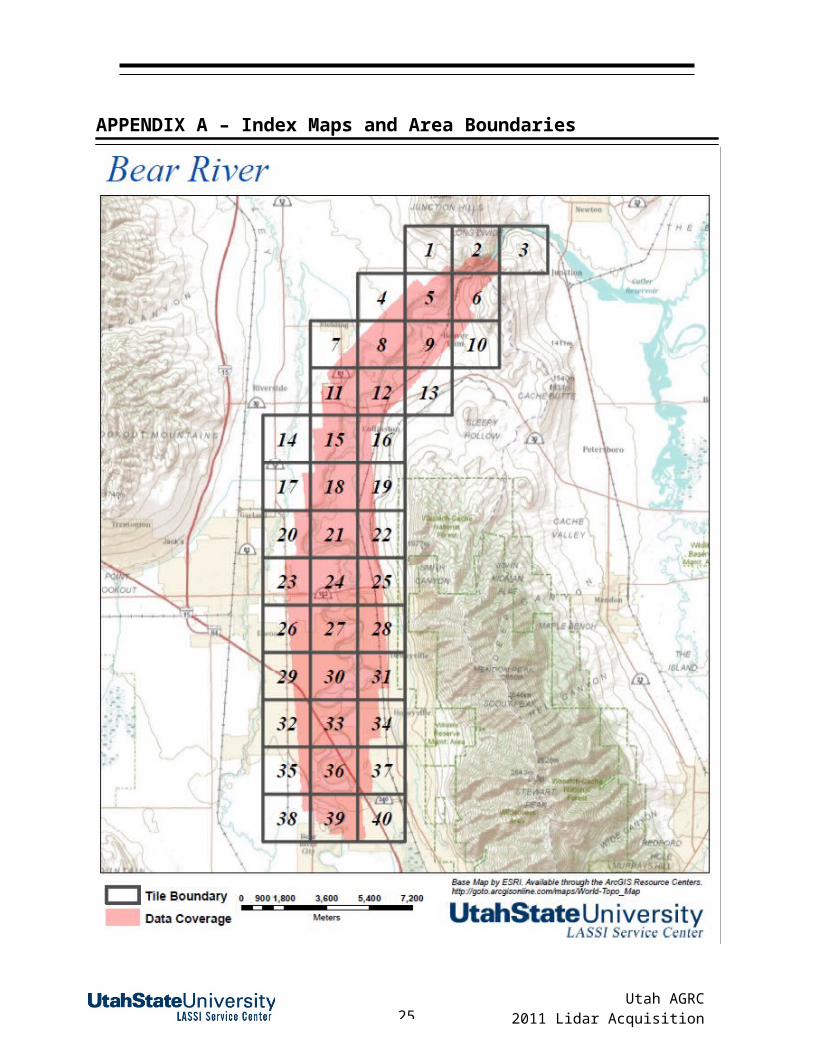
Project Area Extents and Project Tile IndexThe tile layout and project extents for the five areas surveyed are provided in Appendix A. The number of tiles is summarized in Table 1.
Table 1. Project areas.Area Number of TilesBear River 40Great Salt Lake (GSL) North 463Great Salt Lake (GSL) Middle 83Great Salt Lake (GSL) South 250Tooele 98
Tiles were designed on a 2000 m by 2000 m grid and were automatically generated.

5
Utah AGRC2011 Lidar Acquisition
LiDAR DATA REPORT
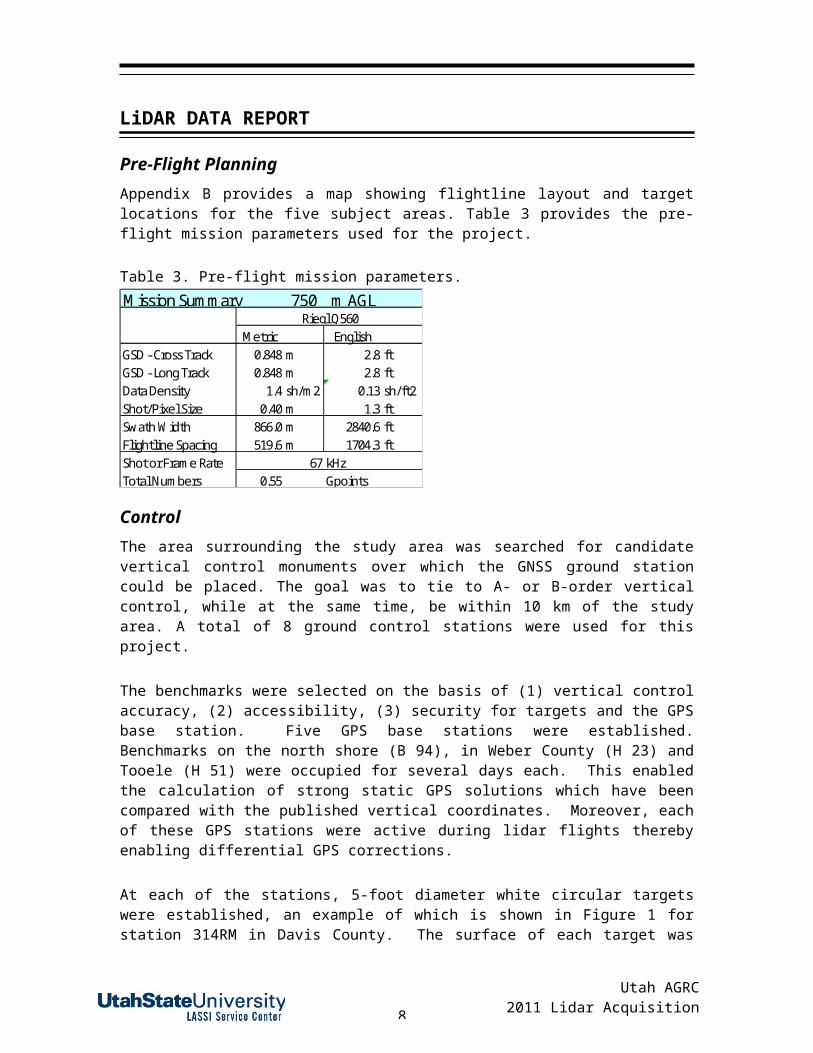
Pre-Flight PlanningAppendix B provides a map showing flightline layout and target locations for the five subject areas. Table 3 provides the pre-flight mission parameters used for the project.
Table 3. Pre-flight mission parameters.Mission Summary 750 m AGL
Metric EnglishGSD - Cross Track 0.848 m 2.8 ftGSD - Long Track 0.848 m 2.8 ftData Density 1.4 sh/m2 0.13 sh/ft2Shot/Pixel Size 0.40 m 1.3 ftSwath Width 866.0 m 2840.6 ftFlightline Spacing 519.6 m 1704.3 ftShot or Frame Rate 67 kHzTotal Numbers 0.55 Gpoints
Riegl Q560
ControlThe area surrounding the study area was searched for candidate vertical control monuments over which the GNSS ground station could be placed. The goal was to tie to A- or B-order vertical control, while at the same time, be within 10 km of the study area. A total of 8 ground control stations were used for this project.
The benchmarks were selected on the basis of (1) vertical control accuracy, (2) accessibility, (3) security for targets and the GPS base station. Five GPS base stations were established. Benchmarks on the north shore (B 94), in Weber County (H 23) and Tooele (H 51) were occupied for several days each. This enabled the calculation of strong static GPS solutions which have been compared with the published vertical coordinates. Moreover, each of these GPS stations were active during lidar flights thereby enabling differential GPS corrections.
At each of the stations, 5-foot diameter white circular targets were established, an example of which is shown in Figure 1 for station 314RM in Davis County. The surface of each target was leveled using a five foot long construction level. The target height was then determined using an automatic level. This was done using a back-sight to the monument and a fore-sight to the table surface (see Figure 1). The accuracy of the target height relative to the monument was consistently within about 1 cm. All eight targets were scanned by the lidar in at least one flightline.
The GPS base stations were set up directly over the given monument and the height to the antenna measured within 1 mm. This was used to compare calculated coordinates with published coordinates. In order to make proper comparisons, the heights measured at previous dates needed to be adjusted according to observed HTDP point velocities published by NGS for nearby CORS stations. These points were thereby brought up to date.

6
Utah AGRC2011 Lidar Acquisition
Figure 1. Example of lidar target along with equipment used to level its height relative to a nearby benchmark. This is benchmark 314RM in Davis County.
Final Planning – Procedures and Activities
Planning
Weather forecasts and project schedule identified an aerial acquisition window during the months of September and October 2011. Prior to each acquisition campaign, the following was completed:
Brief flight crew and ground support personnel on project requirements Investigate PDOP forecast for location (Flights to be conducted with PDOP below
3.0) Decision to mobilize Bob Pack to site to set up targets and GNSS base stations. Complete a reconnaissance of the project area was conducted to report on ground
conditions.It was planned such that each time the aircraft was mobilized out of Logan, Utah each of the five areas could be completed during a contiguous block of days.
Summary of Supporting Documents
CV NGS DATASHEETS.htm– NGS Data Sheets NGS benchmarks used PDOP Plots subdirectory – contains PDOP forecasts for periods of data
acquisition.
(The above listed documentation is provided in softcopy format only.)

7
Utah AGRC2011 Lidar Acquisition
Data Processing Procedures Report
Data Storage After each flight, all raw navigation data, raw LiDAR data, raw image data, coverage data, and flight logs were off-loaded to a computer and an additional backup storage copy created.
Navigation System The airborne GNSS data were processed from the five base station locations using GrafNet software from NovAtel. Data was also collected from nearby International GPS Service for Geodynamics (IGS) stations for the periods of the flight. Airborne GNSS data was processed based on the ITRF05 Ellipsoid model.
The computed trajectories and the base station coordinates were used in the processing of the IMU data using Inertial Explorer from Waypoint. A smoothed trajectory was produced with error estimates based on the separation between trajectories processed forward and backward in time. The trajectory files were then transformed to the NAD83(CORS96) and NAVD88(GEOID09) project datum and the UTM Zone 12N projection for use in the LiDAR processing.
LiDAR System LiDAR waveform files were analyzed using RiAnalyze software to discriminate data points. These points are output in the internal coordinate system of the LiDAR scanner. Each data point is assigned an echo value so it can be used in point classification work. RiProcess then uses the trajectory files created from the raw navigation data to generate XYZ points in a world coordinate system. A boresight calibration and strip (single scan line) adjustment was performed in RiProcess to improve data accuracy. This project’s data were processed in strip form, meaning each flight line was processed independently. Processing the lines individually provides the data analyst with the ability to quality control (QC) the overlap between lines. To assess trajectory integrity, individual flight strips were then checked against adjacent strips to ensure good matching in the dataset.
The low gradient terrain within the study area results in highly visible manifestations of errors within overlap regions. For example, on some of the shoreline slopes a gradual 10 cm drop in elevation can occur over a distance of 1000 m. Hence a 1 cm contour interval would be 100 m wide and a 2 cm vertical error would result in a 200 m shift in a contour location. It was therefore necessary to develop custom strip overlap adjustment methods that would not only optimize the lidar system calibration but also correct GPS/IMU navigation errors manifested within individual strips.
A method has been implemented that corrects for aircraft roll and aircraft altitude error detected by analyzing elevation differences in all overlapping strips simultaneously. Figure 2 shows an example color-coded map of overlapping regions where blue equals a -10 cm difference, cyan a -5 cm difference, green 0 cm, yellow +5 cm, and red +10 cm. Figure 3 shows the same series of strips after adjustment. Because the center of the overlap zone is where adjacent strips are mosaicked via a mosaic line, it is important that these lines are consistently green. As shown in Figure 3 this is the case for all strips
8
Utah AGRC2011 Lidar Acquisition
which results in smooth contouring across the entire project. This wouldn’t have been the case using traditional methods that ignore within-strip errors associated with the GPS/IMU system.
Figure 2. Overlap data prior to within-strip correction, colored by elevation difference (blue = -10 cm, cyan = -5 cm, green = 0 cm, yellow = +5cm, red = +10 cm).
Figure 3. Overlap data after the within-strip correction, colored by elevation difference (blue = -10 cm, cyan = -5 cm, green = 0 cm, yellow = +5cm, red = +10 cm).
Each flightline (strip) was then brought into TerraScan (by Terrasolid) in the project datum and coordinate system. These flightlines were then combined and several classification routines, customized for the given terrain and vegetation, were then run to classify the points into standard ASPRS/LAS default classifications.
Mosaic Lines

9
Utah AGRC2011 Lidar Acquisition
Significant effort was given to the creation of automated routines that would detect the dozens of river banks and hundreds of lake shorelines within the subject areas. The routine then automatically creates polylines that then serve as breaklines for hydro-flattening. For this work, custom tools were developed using LAS-tools, a set of routines developed by Martin Isenburg (out of Germany), and custom Matlab scripts developed in-house. These breaklines, consisting of a series of closely spaced points were then added to the point cloud LAS files with a unique classification code. When combined in a LAS file with original lidar points, the quality of the hydro-flattening can immediately be exploited as a triangulated irregular network (TIN) in any LAS viewer or GIS system (such as ArcGIS).
Using the point classifications and breakline points, digital elevation models (DEMs) of the bare earth and digital surface models (DSMs) of all points were generated for each tile and carefully checked for data quality assurance.

10
Utah AGRC2011 Lidar Acquisition
LiDAR QUALITY CONTROL REPORT
Methodology
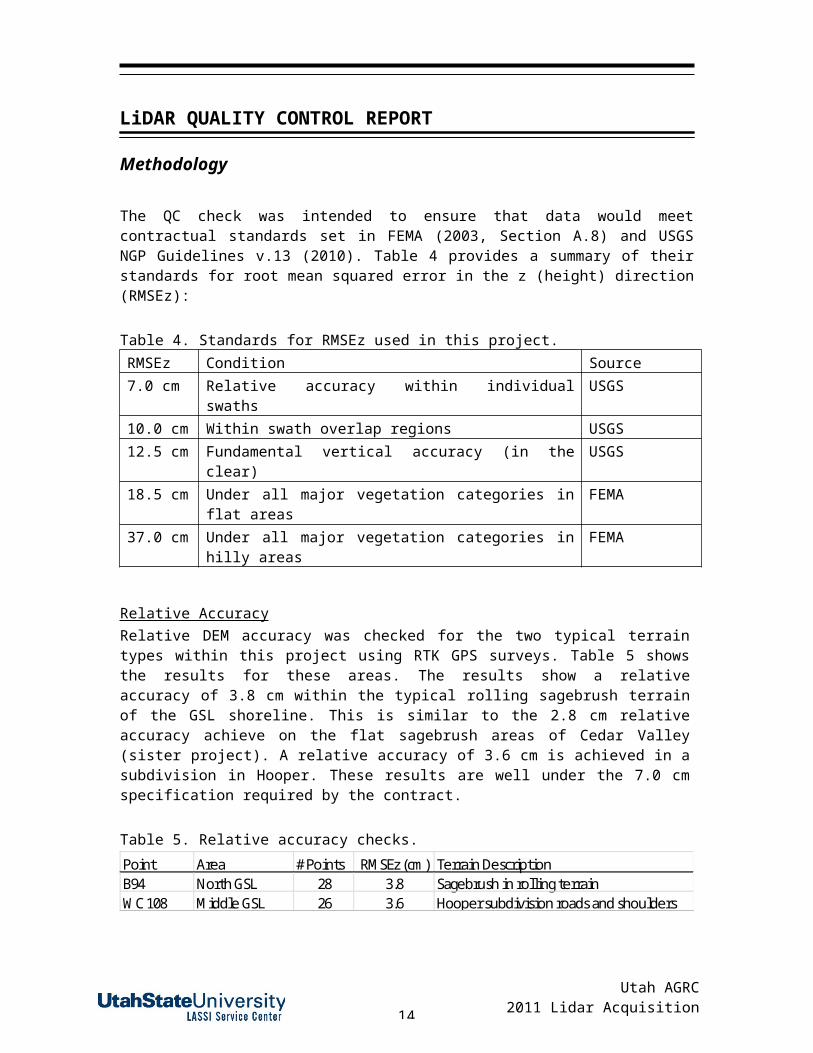
The QC check was intended to ensure that data would meet contractual standards set in FEMA (2003, Section A.8) and USGS NGP Guidelines v.13 (2010). Table 4 provides a summary of their standards for root mean squared error in the z (height) direction (RMSEz):
Table 4. Standards for RMSEz used in this project.RMSEz Condition Source7.0 cm Relative accuracy within individual swaths USGS10.0 cm Within swath overlap regions USGS12.5 cm Fundamental vertical accuracy (in the clear) USGS18.5 cm Under all major vegetation categories in flat areas FEMA37.0 cm Under all major vegetation categories in hilly areas FEMA
Relative Accuracy Relative DEM accuracy was checked for the two typical terrain types within this project using RTK GPS surveys. Table 5 shows the results for these areas. The results show a relative accuracy of 3.8 cm within the typical rolling sagebrush terrain of the GSL shoreline. This is similar to the 2.8 cm relative accuracy achieve on the flat sagebrush areas of Cedar Valley (sister project). A relative accuracy of 3.6 cm is achieved in a subdivision in Hooper. These results are well under the 7.0 cm specification required by the contract.
Table 5. Relative accuracy checks.Point Area # Points RMSEz (cm) Terrain DescriptionB94 North GSL 28 3.8 Sagebrush in rolling terrainWC 108 Middle GSL 26 3.6 Hooper subdivision roads and shoulders
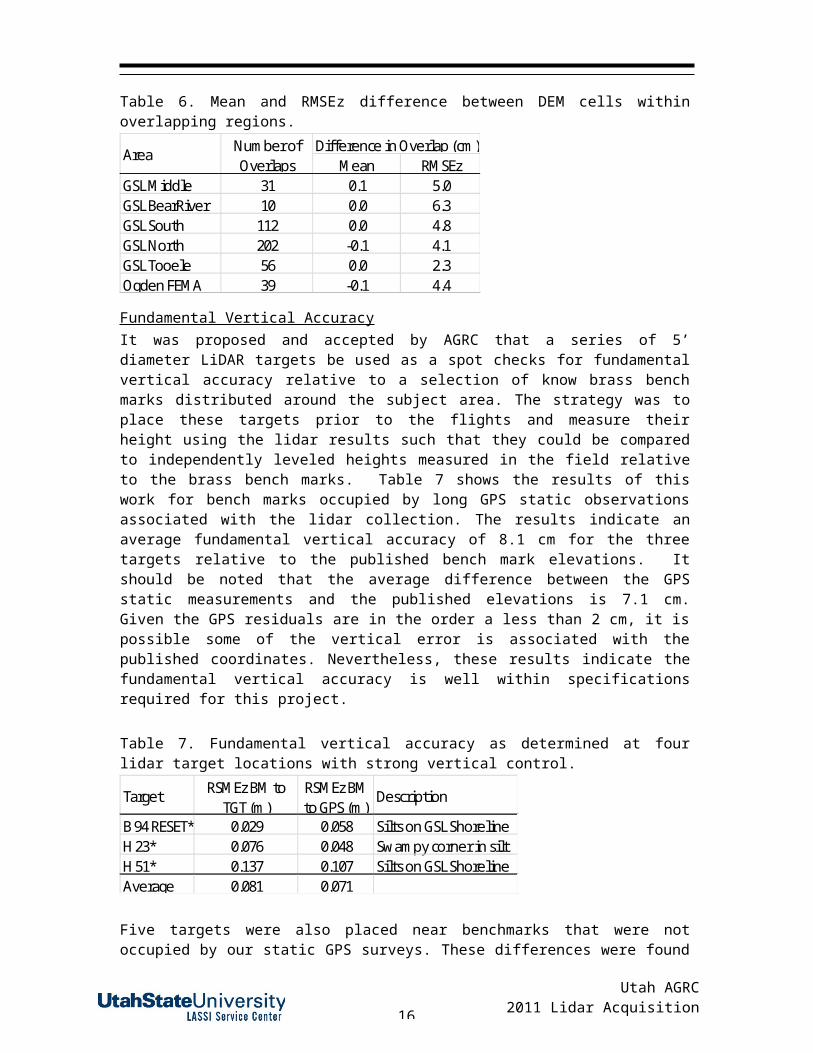
Within Swath Overlap Accuracy Table 6 shows the mean and RMSEz difference between all DEM cells within overlapping regions. These statistics were calculated by custom Matlab scripts in USU’s custom adjustment software. Table 6 shows that systematic shifts within a given overlap region are less than 1 cm. The RMSEz between overlapping surfaces is consistently between 2.3 and 6.3 cm These results are within the required 10 cm specification.

11
Utah AGRC2011 Lidar Acquisition
Table 6. Mean and RMSEz difference between DEM cells within overlapping regions.
Mean RMSEzGSL Middle 31 0.1 5.0GSL BearRiver 10 0.0 6.3GSL South 112 0.0 4.8GSL North 202 -0.1 4.1GSL Tooele 56 0.0 2.3Ogden FEMA 39 -0.1 4.4
Difference in Overlap (cm)Number of Overlaps
Area
Fundamental Vertical Accuracy It was proposed and accepted by AGRC that a series of 5’ diameter LiDAR targets be used as a spot checks for fundamental vertical accuracy relative to a selection of know brass bench marks distributed around the subject area. The strategy was to place these targets prior to the flights and measure their height using the lidar results such that they could be compared to independently leveled heights measured in the field relative to the brass bench marks. Table 7 shows the results of this work for bench marks occupied by long GPS static observations associated with the lidar collection. The results indicate an average fundamental vertical accuracy of 8.1 cm for the three targets relative to the published bench mark elevations. It should be noted that the average difference between the GPS static measurements and the published elevations is 7.1 cm. Given the GPS residuals are in the order a less than 2 cm, it is possible some of the vertical error is associated with the published coordinates. Nevertheless, these results indicate the fundamental vertical accuracy is well within specifications required for this project.
Table 7. Fundamental vertical accuracy as determined at four lidar target locations with strong vertical control.
Target RSMEz BM to TGT (m)
RSMEz BM to GPS (m)
Description
B 94 RESET* 0.029 0.058 Silts on GSL ShorelineH 23* 0.076 0.048 Swampy corner in siltH 51* 0.137 0.107 Silts on GSL ShorelineAverage 0.081 0.071
Five targets were also placed near benchmarks that were not occupied by our static GPS surveys. These differences were found to average 17.8 cm as shown in Table 8. The largest differences are associated with RTK surveyed benchmarks maintained by Salt Lake and Weber Counties. These county surveys focused on horizontal control and did not have clearly stated vertical accuracies. A 14.7 cm discrepancy was discovered with an old 1953 benchmark given a Class II vertical accuracy by NGS. However, only a 7.4 cm difference was found with a NGS Class I vertical benchmark found in the Bear River area. Given the 8 cm accuracy results in the previous table that are cross-checked with multi-day static GPS work, it is deemed unlikely that the main source of error is associated with the lidar survey. It is also possible that since their dates of publication, some of these points may have been subject to movement associated with settlement of the silts or construction disturbances. The investigation of the vertical accuracy of these published coordinates is beyond the scope of this contract. Nevertheless, these result suggest that adjustments of the lidar data by up to 26 cm (10

12
Utah AGRC2011 Lidar Acquisition
inches) may be necessary in order to match local datums based on weak vertical control.
Table 8. Vertical accuracy as determined relative to benchmarks with various vertical accuracies.
TargetRSMEz BM to TGT (m)
SourcePublished
Vertical Accuracy
Lidar Tile Description
U 170 0.074 NGS 1967 Class I BR Tile 31 Gravel adjacent to canalZ 92 0.147 NGS 1953 Class II GN Tile 262 Old BM on railway abutment64-FMK 0.214 Weber Co +/- 10 cm GN Tile 434 Silts on GSL ShorelineWC-108 0.193 Weber Co RTK ? GM Tile 53 Silts on GSL Shoreline1S3W029A 0.263 Salt Lk Co RTK ? GS Tile 238 Silts on GSL ShorelineAverage 0.178
Horizontal positional accuracy was not formally tested in this project and was not a specification of this contract.
ConclusionsGiven results given above, the following can be concluded:
There is a tested < 4 cm RMSEz relative accuracy, There is a tested < 7 cm RMSEz overlap accuracy, and There is a tested < 8 cm RMSEz fundamental vertical accuracy.

13
Utah AGRC2011 Lidar Acquisition
FLIGHT REPORT
USU’s Cessna 208B Skywagon remote sensing aircraft, N4630F, based out of Logan, Utah was utilized on this project. This aircraft was mobilized out of Logan Municipal Airport, Utah. The actual local flight times and duration of flights were controlled by weather, fuel consumption of the aircraft on the commute from Logan, Utah, and safety of flight operations around Hill Air Force Base and the Salt Lake International Airport. This limited our flexibility in planning for times when the GNSS constellation was most favorable thereby producing the highest number of satellites visible in the best geometric configuration relative to the GNSS receivers onboard the aircraft as well as at the base station on the ground.
Ordinarily two flights were performed per day, weather permitting. Flights originated from Logan, Utah each morning with a refueling stop at a local field at mid-day. Flight durations varied between 3 and 4 hours. At the beginning or end of most days, a calibration flight pattern was flown over the USU campus. This enabled the improvement of IMU to Lidar alignment which has a tendency to drift in virtually every lidar system.Because of limitations associated with flying around Salt Lake International Airport, the GSL South block was flown at night. This involved two flights between midnight and 6:00am on October 13 & 14, 2011 and a flight between 2:00am and 6:00am on October 18, 2011. During these periods, virtually no interference with air traffic was encountered.The flight dates are summarized by Table 9.
Table 9. Summary of flight dates.Block DatesBear River 28 September 2011GSL North 27, 29, 30 September & 3, 4, 10 October 2011GSL Middle 10-12 October 2011GSL South 13, 14, 18 October 2011Tooele 18 October 2011
Navigation File(s): A listing GPS base station files and raw flightline (LiDAR) files is given in Appendix C.
14
Utah AGRC2011 Lidar Acquisition
GROUND CONTROL REPORT
IntroductionA LiDAR survey was conducted for the purposes of developing a high-accuracy digital terrain model (DTM) of the Great Salt Lake Wetlands project area. In support of this work, ground control was established near the project area. This report summarizes the results.
Ground Control SurveyTable 10 provides a list of coordinates for each of the 9 bench marks used in this study. The benchmarks listed with a bold font were used as static GPS stations and were occupied during the lidar flights. Stations identified with an asterisk were used as base stations for RTK surveys subsequent to the flights.
Table 10. List of benchmarks used in the five subject areas.STATION PID EPOCH LATITUDE LONGITUDE NAVD88Bear RiverU 170 MS0027 1991 41 40 52. (N) 112 05 36. (W) 1312.73GSL NorthB 94 RESET* MS0074 1991 41 35 56. (N) 112 17 58. (W) 1291.41Z 92 MS0121 1991 41 25 16. (N) 112 03 00. (W) 1297.60H 23* Weber Co 2002 41 14 40. (N) 112 10 32. (W) 1286.3764-FMK Weber Co 2004 41 15 00. (N) 112 12 42. (W) 1285.46GSL MiddleWC-108 Weber Co 2000 41 09 50.1 (N) 112 08 33.3 (W) 1292.07GSL South314RM Davis Co 2010 40 57 55.4 (N) 111 55 47.0 (W) 1284.241S3W029A SLC 2008 40 46 08.7 (N) 112 09 17.1 (W) 1286.68TooeleH 51* LP0025 1991 40 39 56.10422(N) 112 27 29.72341(W) 1287.52
Data CollectionUsing physical descriptions of benchmark locations, each of the 9 stations were occupied, some used for static GPS observations, some used for RTK data collections and all of which were used for lidar target analysis. The static observations were made with a NovAtel dual-frequency GPS receiver. RTK measurements were made with a Topcon GR-5 GNSS (including GLONASS) base/rover pair.
Data Processing and Analysis
Processing steps performed at each benchmark include ellipsoid to orthometric height conversion, horizontal time-dependent processing of point velocities for epoch adjustment, and target leveling relative to the benchmarks. Static GPS solutions are disclosed for those points occupied and lidar shot elevations have been compiled for

15
Utah AGRC2011 Lidar Acquisition
each of the targets. A summary of these processing results is given in Tables 11 and 12.
Table 11. Ground control computations.
Lat LongBEAR RIVERU 170 MS0027 1991 41 40 52. (N) 112 05 36. (W) 1312.732 1297.002" " 2011 " " 1312.706 1296.976TGT U 170 2011 1313.306 1297.576TGT Lidar Solutions - BR Tile 31 Shot 1 1313.38 0.074 RSMEz 1313.38 0.0739GSL NORTHB 94 RESET* MS0074 1991 41 35 56. (N) 112 17 58. (W) 1291.407 1275.367B 94 RESET Adj 2011 " " 1259.301 1275.341TGT B 94 2011 1292.018 1275.978USU B 94 GPS Solution 2011 41 35 55.90473(N)112 17 57.80501(W) 1275.312 -0.029TGT Lidar Solutions - GN Tile 63 & 81 - Shot 1 1292.040 -0.022 -0.051 - Shot 2 1292.050 -0.032 -0.061 - Shot 3 1292.050 -0.032 -0.061 RSMEz 1292.047 0.0295 0.0583
Z 92 MS0121 1991 41 25 16. (N) 112 03 00. (W) 1297.596 1281.246" " 2011 " " 1297.570 1281.220TGT Z 92 2011 1298.379 1282.029TGT Lidar Solutions - GN Tile 262 - Shot 1 1298.540 -0.161 - Shot 2 1298.510 -0.131 RSMEz 1298.525 0.1468
H 23* Weber Co 2002 41 14 40. (N) 112 10 32. (W) 1286.369 1269.54H 23 Adj 2011 " " 1286.357 1269.528TGT H 23 2011 1287.146 1270.317USU H 23 GPS Solution 2011 41 14 40.82494(N)112 10 32.45055(W) 1269.499 -0.029TGT Lidar Solutions - GN Tile 435 - Shot 1 1287.08 0.066 0.037 - Shot 2 1287.07 0.076 0.047 - Shot 3 1287.06 0.086 0.057 RSMEz 1287.07 0.076 0.048
64-FMK Weber Co 2004 41 15 00. (N) 112 12 42. (W) 1285.463 1268.7" 2011 " " 1285.454 1268.69TGT 64-FMK 2011 1286.111 1269.35TGT Lidar Solutions - GN Tile 434 - Shot 1 1286.32 -0.209 - Shot 2 1286.33 -0.219 - Shot 3 1286.31 -0.199 - Shot 4 1286.33 -0.219 - Shot 5 1286.33 -0.219 RSMEz 1286.324 0.2136
Station NGS PIDEpoch Date
NAD83(HARN/1994) NAVD88 (m)
Ellip.HT (m)
Δ BM (m)
Δ GPS (m)
16
Utah AGRC2011 Lidar Acquisition
Table 12. Ground control computations (continued).
Lat LongGSL MIDDLEWC-108 Weber Co 2000 41 09 50.1 (N) 112 08 33.3 (W) 1292.073 1275.083" 2011 " " 1292.059 1275.069TGT WC-108 2011 1292.010 1275.020TGT Lidar Solutions - GM 53 - Shot 1 1291.81 0.200 - Shot 2 1291.82 0.190 - Shot 3 1291.82 0.190 RSMEz 1291.82 0.1929GSL SOUTH314RM Davis Co 2010 40 57 55.4 (N) 111 55 47.0 (W) 1284.239" 2011 " " 1284.238TGT 314RM 2011 1286.002TGT Lidar Solutions - GS Tile 100 - Shot 1 1285.23 0.772 - Shot 2 1285.19 0.812 - Shot 3 1285.18 0.822 RSMEz 1285.20 0.8027
1S3W029A SLC 2008 40 46 08.7 (N) 112 09 17.1 (W) 1286.680 1269.431" 2011 " " 1286.676 1269.427TGT 1S3W029A 2011 1285.802 1268.553TGT Lidar Solutions - GS 238 - Shot 1 1286.06 -0.258 - Shot 2 1286.07 -0.268 RSMEz 1286.065 0.263TooeleH 51* LP0025 1991 40 39 56.10422(N)112 27 29.72341(W) 1287.517 1269.872" " 2011 " " 1287.491 1269.846TGT H 51 2011 1288.539 1270.894USU H 51 GPS Solution 2011 40 39 56.10408(N)112 27 29.72834(W) 1287.521 1269.876 0.03TGT Lidar Solutions - T 49 - Shot 1 1288.66 -0.121 -0.091 - Shot 2 1288.69 -0.151 -0.121 RSMEz 1288.675 0.137 0.107
Station NGS PIDEpoch Date
NAD83(HARN/1994) NAVD88 (m)
Ellip.HT (m)
Δ BM (m)
Δ GPS (m)

17Utah AGRC
2011 Lidar Acquisition
APPENDIX A – Index Maps and Area Boundaries

18Utah AGRC
2011 Lidar Acquisition

19Utah AGRC
2011 Lidar Acquisition

20Utah AGRC
2011 Lidar Acquisition

21Utah AGRC
2011 Lidar Acquisition

22Utah AGRC
2011 Lidar Acquisition
APPENDIX B – Flight Plan MapsFlight line layout and target locations for the Great Salt Lake Wetlands
N

23Utah AGRC
2011 Lidar Acquisition

24Utah AGRC
2011 Lidar Acquisition
APPENDIX C – Raw Data File ListingBEAR RIVER BLOCK: Flown 09/28/2011Navigation File(s): Remote_20110928_01.logRemote_20110928_02.logBase Station File(s): BaseStation_20110928.pdcRaw Flightline (LIDAR) Files:110928_163228.sdf110928_163543.sdf110928_163943.sdf110928_164406.sdf110928_164903.sdf110928_165319.sdf110928_165852.sdf110928_170513.sdf110928_171216.sdf110928_171959.sdf110928_172621.sdf110928_173252.sdf
GSL NORTH BLOCK: Flown 09/27 - 09/30, 10/03 – 10/04, 10/10Navigation File(s): Remote_GSL_20110927.logRemote_GSL_20110927_02.logRemote_GSL_20110928_02.logRemote_GSL_20110929_01.logRemote_GSL_20110929_02.logRemote_GSL_20110930_01.logRemote_GSL_20110930_02.logRemote_20111003_01.logRemote_20111003_02.logRemote_20111004.logRemote_20111010_01.logBase Station File(s):BaseStation_20110927and28.pdcBase_GSL_20110929_01.pdc
Base_GSL_20110929_02.pdcBase_GSL_20110930_01.pdcBase_GSL_20110930_02.pdcBase_GSL_20111004_01.pdcBase_GSL_20111004_02.pdcBase_GSL_20111010_01.pdcRaw Flightline (LIDAR) Files:110927_163856.sdf110927_164125.sdf110927_164408.sdf110927_164523.sdf110927_164952.sdf110927_165538.sdf110927_170112.sdf110927_170658.sdf110927_171233.sdf110927_171834.sdf110927_172420.sdf110927_173029.sdf110927_173600.sdf110927_174158.sdf110927_174740.sdf110927_175426.sdf110927_180008.sdf110927_180606.sdf110927_181136.sdf110927_181729.sdf110927_182248.sdf110927_182843.sdf110927_183423.sdf110927_184027.sdf110927_184610.sdf110927_185208.sdf110927_185751.sdf110927_190414.sdf110927_190947.sdf110927_191608.sdf110927_192210.sdf110927_192851.sdf110927_193445.sdf110927_194137.sdf
110927_194748.sdf110927_195455.sdf110927_200127.sdf110927_214153.sdf110927_214420.sdf110927_215123.sdf110927_215849.sdf110927_220623.sdf110927_221350.sdf110927_222115.sdf110927_222837.sdf110927_223629.sdf110927_224428.sdf110927_225210.sdf110927_230001.sdf110927_230909.sdf110927_231159.sdf110928_174124.sdf110928_174458.sdf110928_175008.sdf110928_175737.sdf110928_195133.sdf110928_195906.sdf110928_200630.sdf110928_201335.sdf110928_202103.sdf110928_202828.sdf110928_203525.sdf110928_204222.sdf110928_204918.sdf110928_205553.sdf110928_210222.sdf110928_210830.sdf110928_211417.sdf110928_212010.sdf110928_212528.sdf110928_213052.sdf110928_213601.sdf110928_214057.sdf110928_214538.sdf110928_215016.sdf110928_215446.sdf110928_215846.sdf110928_220244.sdf110928_220628.sdf110928_221117.sdf110928_221807.sdf
25Utah AGRC
2011 Lidar Acquisition
110928_222502.sdf110928_223142.sdf110928_223835.sdf110928_224531.sdf110929_161016.sdf (calibration)110929_161248.sdf (calibration)110929_161639.sdf (calibration)110929_162747.sdf110929_163444.sdf110929_164129.sdf110929_164826.sdf110929_165515.sdf110929_170207.sdf110929_170912.sdf110929_171624.sdf110929_172306.sdf110929_173019.sdf110929_173719.sdf110929_174415.sdf110929_175114.sdf110929_175812.sdf110929_180503.sdf110929_181153.sdf110929_181853.sdf110929_182542.sdf110929_183252.sdf110929_183939.sdf110929_184632.sdf110929_185345.sdf110929_204033.sdf110929_204750.sdf110929_205439.sdf110929_210119.sdf110929_210833.sdf110929_211533.sdf110929_212224.sdf110929_212921.sdf110929_213614.sdf110929_214319.sdf110929_215013.sdf110929_215714.sdf110929_220409.sdf110929_221119.sdf110929_221812.sdf110929_222517.sdf110929_223217.sdf
110929_223915.sdf110929_224602.sdf110929_225325.sdf110929_225958.sdf110929_230658.sdf110929_230904.sdf110930_160418.sdf (calibration)110930_160612.sdf (calibration)110930_160837.sdf (calibration)110930_162123.sdf110930_162627.sdf110930_163335.sdf110930_164031.sdf110930_164804.sdf110930_165518.sdf110930_170237.sdf110930_170940.sdf110930_171655.sdf110930_172347.sdf110930_173109.sdf110930_173806.sdf110930_174535.sdf110930_175238.sdf110930_175944.sdf110930_180640.sdf110930_181359.sdf110930_182136.sdf110930_182830.sdf110930_202633.sdf110930_202856.sdf110930_203144.sdf110930_203429.sdf110930_203747.sdf110930_204121.sdf110930_204520.sdf110930_204907.sdf110930_205316.sdf110930_205724.sdf110930_210207.sdf110930_210653.sdf110930_211142.sdf110930_211648.sdf110930_212206.sdf110930_212749.sdf111003_171841.sdf111003_172110.sdf
111003_172503.sdf111003_173133.sdf111003_173910.sdf111003_174606.sdf111003_175325.sdf111003_180006.sdf111003_180703.sdf111003_181345.sdf111003_182008.sdf111003_182648.sdf111003_183340.sdf111003_184017.sdf111003_184706.sdf111003_185332.sdf111003_185948.sdf111003_190634.sdf111003_191313.sdf111003_191959.sdf111003_192550.sdf111003_193154.sdf111003_193759.sdf111003_194437.sdf111003_195141.sdf111003_195842.sdf111003_215102.sdf111003_215807.sdf111003_220521.sdf111003_221130.sdf111003_221734.sdf111003_222350.sdf111003_223102.sdf111003_223301.sdf111003_223950.sdf111003_224710.sdf111003_225348.sdf111003_230025.sdf111003_230653.sdf111003_231433.sdf111003_232158.sdf111003_233007.sdf111003_233635.sdf111003_234305.sdf111004_192336.sdf111004_192540.sdf111004_195605.sdf111010_181334.sdf (calibration)111010_181543.sdf (calibration)

26Utah AGRC
2011 Lidar Acquisition
111010_181805.sdf (calibration)111010_183812.sdf111010_184606.sdf111010_185324.sdf111010_190032.sdf111010_190749.sdf111010_191503.sdf111010_192253.sdf111010_193027.sdf111010_193803.sdf111010_194535.sdf111010_195257.sdf111010_195950.sdf111010_200659.sdf111010_201346.sdf111010_202017.sdf
GSL MIDDLE BLOCK: Flown 10/10 – 10/12Navigation File:Remote_20111010_02.logRemote_20111012_01.logBase Station File: Base_GSL_20111010_02.pdc Base_GSL_20111011_01.pdc Base_GSL_20111012.pdcRaw Flightline (LIDAR) Files:111010_220413.sdf111010_220620.sdf111010_220841.sdf111010_221137.sdf111010_221453.sdf111010_221756.sdf111010_222108.sdf111010_222454.sdf111010_222840.sdf111010_223233.sdf111010_223718.sdf111010_224213.sdf111010_224759.sdf111010_225356.sdf111010_225938.sdf111010_230539.sdf111010_231139.sdf111010_231802.sdf
111012_172203.sdf (Calibration)111012_172341.sdf (Calibration)111012_172616.sdf (Calibration)111012_174454.sdf111012_175144.sdf111012_175827.sdf111012_180533.sdf111012_181223.sdf111012_181921.sdf111012_182607.sdf111012_183317.sdf111012_184011.sdf111012_184718.sdf111012_185356.sdf111012_190101.sdf111012_190734.sdf111012_191434.sdf111012_192104.sdf111012_192800.sdf111012_193434.sdf111012_194129.sdf111012_195100.sdf
GSL SOUTH BLOCK: Flown 10/13 – 10/14, 10/18Navigation File: Remote_20111013_01.logRemote_20111013_02.logRemote_20111014_01.logRemore_20111014_02.logRemote_GSL_South_20111018_01Base Station File: 00052851.pdc00052861.pdc00052871.pdc00052881.pdc00052901.pdcRaw Flightline (LIDAR) Files:111013_060816.sdf111013_061515.sdf111013_061730.sdf111013_062014.sdf111013_062304.sdf111013_062617.sdf
111013_063405.sdf111013_064138.sdf111013_064924.sdf111013_065718.sdf111013_070508.sdf111013_071243.sdf111013_072024.sdf111013_072800.sdf111013_073543.sdf111013_074301.sdf111013_075030.sdf111013_075747.sdf111013_080523.sdf111013_081245.sdf111013_082023.sdf111013_082745.sdf111013_083518.sdf111013_084246.sdf111013_100810.sdf111013_101529.sdf111013_102237.sdf111013_102936.sdf111013_103659.sdf111013_104416.sdf111013_105138.sdf111013_105844.sdf111013_110531.sdf111013_111304.sdf111013_111936.sdf111013_112608.sdf111013_113227.sdf111013_113846.sdf111013_114455.sdf111013_115108.sdf111013_115649.sdf111013_120217.sdf111013_120800.sdf111014_054202.sdf (calibration)111014_054344.sdf (calibration)111014_054550.sdf (calibration)111014_061040.sdf111014_061554.sdf111014_062050.sdf111014_062607.sdf111014_063122.sdf111014_063623.sdf

27Utah AGRC
2011 Lidar Acquisition
111014_064121.sdf111014_064608.sdf111014_065118.sdf111014_065550.sdf111014_070039.sdf111014_070516.sdf111014_071022.sdf111014_071753.sdf111014_072107.sdf111014_072426.sdf111014_072804.sdf111014_073207.sdf111014_073628.sdf111014_074103.sdf111014_074608.sdf111014_075138.sdf111014_075708.sdf111014_080254.sdf111014_080849.sdf111014_081449.sdf111014_082027.sdf111014_082624.sdf111014_083227.sdf111014_094357.sdf111014_095004.sdf111014_095643.sdf111014_100332.sdf111014_101035.sdf111014_101702.sdf111014_102404.sdf111014_103105.sdf111014_103757.sdf111014_104443.sdf111014_105158.sdf111014_105902.sdf111014_110603.sdf111014_111310.sdf111014_112009.sdf111014_112652.sdf111014_113332.sdf111014_114032.sdf111014_114727.sdf111014_115429.sdf111014_120202.sdf111018_083123.sdf (calibration)111018_083301.sdf (calibration)111018_083511.sdf
(calibration)111018_090012.sdf111018_090707.sdf111018_091402.sdf111018_092053.sdf111018_092813.sdf111018_093514.sdf111018_094229.sdf111018_094925.sdf111018_095610.sdf111018_100309.sdf111018_101015.sdf111018_101739.sdf111018_102509.sdf111018_103159.sdf111018_103912.sdf111018_104444.sdf111018_105001.sdf111018_105409.sdf111018_105711.sdf111018_110028.sdf
GSL TOOLE BLOCK: Flown 10/18 Navigation File: Remote_GSL_20111018_02.logRemote_GSL_20111018_03.logBase Station File: 00052901.pdcRaw Flightline (LIDAR) Files:111018_162607.sdf111018_162924.sdf111018_163515.sdf111018_164153.sdf111018_164648.sdf111018_165105.sdf111018_165606.sdf111018_170029.sdf111018_170524.sdf111018_171002.sdf111018_171442.sdf111018_171824.sdf111018_172207.sdf111018_172553.sdf111018_173007.sdf111018_173352.sdf
111018_173800.sdf111018_174142.sdf111018_174408.sdf111018_174806.sdf111018_175213.sdf111018_175646.sdf111018_180113.sdf111018_180526.sdf111018_181012.sdf111018_181440.sdf111018_181914.sdf111018_182357.sdf111018_182845.sdf111018_183313.sdf111018_183750.sdf111018_184220.sdf111018_184719.sdf111018_185208.sdf111018_185644.sdf111018_190130.sdf111018_204911.sdf111018_205408.sdf111018_205901.sdf111018_210355.sdf111018_210851.sdf111018_211342.sdf111018_211813.sdf111018_212307.sdf111018_212723.sdf111018_213138.sdf111018_213549.sdf111018_213955.sdf111018_214343.sdf111018_214713.sdf111018_215029.sdf111018_215345.sdf111018_215658.sdf111018_220149.sdf111018_220347.sdf111018_220702.sdf111018_221104.sdf111018_221529.sdf111018_221930.sdf111018_222314.sdf111018_222636.sdf