Embed Size (px)
Citation preview
Estuarine, Coastal and Shelf Science 73 (2007) 651e666www.elsevier.com/locate/ecss
Microscale gradients of planktonic microbial communitiesabove the sediment surface in a mangrove estuary
J.R. Seymour a,b,*, L. Seuront a,c, J.G. Mitchell a
a Flinders University of South Australia, School of Biological Sciences, PO Box 2100, Adelaide, SA 5001, Australiab Massachusetts Institute of Technology, Department of Civil and Environmental Engineering, 77 Massachusetts Ave, Cambridge, MA 02139, USA
c Ecosystem Complexity Research Group, Station Marine de Wimereux, CNRS-UMR 8013 ELICO, Universite des Sciences et Technologies de Lille,
28 avenue Foch, 62930 Wimereux, France
Received 8 September 2006; accepted 1 March 2007
Available online 23 April 2007
Abstract
The microscale (1 and 4 cm sampling resolution) distributions of chemical (O2, NH3, NO3�, NO2
�, PO43�) and biological (Chl a, phytoplank-
ton, bacterioplankton, viruses) parameters were measured in the 16 cm of water immediately overlaying the sediment-water interface (SWI)within a temperate mangrove estuary in South Australia during December 2003 and March 2004. Shear velocities (u�) during the time of sam-pling were very low (<0.1 cm s�1), and we consequently predict that resuspension of organisms and materials was negligible. In December2003, profiles were often characterised by strong gradients in nutrients and organisms, with the highest concentrations often observed within0.5 cm of the SWI. Microscale patterns in O2, NH3, NO3
� and NO2� indicated that a variety of anaerobic and aerobic transformation processes
probably occurred at the SWI and within profiles. Strong gradients in PO43� were indicative of nutrient flux across the SWI as a consequence of
degradation processes in the sediments. Pico- and nanophytoplankton concentrations were strongly correlated ( p < 0.01) to PO43�, and exhibited
12- and 68-fold changes in abundance, respectively, with highest concentrations observed nearest to the SWI. Several bacterial subpopulationswere discriminated using flow cytometry and significant shifts in the ‘cytometric structure’ of the bacterial community were observed withinmicroscale profiles. Two populations of viruses were correlated to the phytoplankton and low DNA (LDNA) bacteria, and each exhibited ele-vated concentrations within 0.5 cm of the SWI. In March 2004, microscale distributions of O2 and nutrients were more homogenous than inDecember 2003, and dissimilar microbial community structure and patterns were observed above the SWI. The patterns observed here supportthe prediction that benthic processes can strongly influence the ecology of planktonic communities in the overlaying water, and provide furtherevidence for the existence of microscale variability amongst communities of aquatic microorganisms.� 2007 Elsevier Ltd. All rights reserved.
Keywords: sediment; estuary; bacteria; virus; phytoplankton; gradient
Regional terms: Australia; South Australia; St Kilda
1. Introduction
Mangrove estuaries represent important habitats for numer-ous coastal and pelagic species. The high levels of productivity
* Corresponding author. Present address: Massachusetts Institute of Technol-
ogy, Department of Civil and Environmental Engineering, 77 Massachusetts
Ave, Cambridge, MA 02139, USA.
E-mail address: [email protected] (J.R. Seymour).
0272-7714/$ - see front matter � 2007 Elsevier Ltd. All rights reserved.
doi:10.1016/j.ecss.2007.03.004
that are characteristic of most mangrove estuaries are stronglycoupled to the activity of the rich and diverse microbial com-munities inhabiting them (Holguin et al., 2001). Unlike theoceanic realm, where the bulk of organic matter cycling occursin the water column, in shallow-water estuaries substantialamounts of organic matter settles to the bottom and is subse-quently incorporated into the benthos, where it is degraded andmodified by dense microbial communities (Koster et al.,2000). Benthic microbial communities are characterised by

652 J.R. Seymour et al. / Estuarine, Coastal and Shelf Science 73 (2007) 651e666
diverse consortia of microorganisms that are often highly strat-ified as a consequence of steep chemical gradients (Mackinand Swider, 1989; Barbara and Mitchell, 1996; Paerl andPinckney, 1996; Holguin et al., 2001). These communitiesconduct a complex suite of aerobic and anaerobic transforma-tions that ultimately control the concentrations of organic andinorganic nutrients within and above the sediments (Kosteret al., 2000; Rieling et al., 2000).
Benthic biogeochemical transformation processes can havea considerable influence on the ecology of the planktonicorganisms in the overlying water column (Jørgensen, 1983;Hopkinson et al., 1998; Middelboe et al., 1998). Microbialdegradation processes occurring within the sediments leadto the liberation and diffusion of remineralisation productsacross the sedimentewater interface (SWI), potentially pro-viding an important proportion of nutrient requirements forphytoplankton in the overlying water column (Boynton et al.,1980; Hopkinson, 1987; Vidal et al., 1997; Asmus et al.,2000; Rieling et al., 2000; Baric et al., 2002; Qu et al.,2003). Similarly, concentration gradients generated by thelarge quantities of deposited organic matter in the sediments(Burdige et al., 1992; Burdige and Homstead, 1994), and therelease of biodegradable dissolved organic carbon (DOC)from benthic microalgae (Middelboe et al., 1998) can leadto the flux of DOC from the sediments into the water column.Consequently, heterotrophic bacterioplankton may gain accessto increased DOC concentrations, enhancing bacterial growthand productivity in the overlying water column (Middelboeet al., 1998). Hopkinson et al. (1998) demonstrated that bacter-ioplankton growth is indeed stimulated by the DOC in estua-rine sediments, and suggested that benthic systems representsites of both inorganic nutrient remineralisation, importantfor phytoplankton production, and DOC generation, importantfor bacterioplankton production in the overlaying watercolumn.
Tide- or wind-induced resuspension of particulate materialfrom the sediments into the water column is also likely to influ-ence communities of planktonic microorganisms in estuarinehabitats (Wainright and Hopkinson, 1987). Resuspension of par-ticulate material from the sediments stimulates bacterial pro-duction and increases biomass in the overlaying water column(Wainright, 1987; Ritzrau and Graf, 1992) and may supply phy-toplankton with increased dissolved nutrients (Fanning et al.,1982). Periodic resuspension of benthic microbial communities(Wainright, 1990) will also influence microbial foodweb struc-ture and nutrient cycling rates in the water column (Demerset al., 1987).
As a consequence of diffusion and resuspension processesoccurring at the SWI, coherent gradients in organic and inor-ganic nutrients are likely to provide both heterotrophic andautotrophic planktonic organisms with a unique microhabitatwhere levels of growth and productivity may be enhanced.Chemical gradients (e.g. O2, H2S) at and above the SWImay also influence the composition and activity of these com-munities. While several studies have demonstrated the exis-tence of microscale variability of nutrients and microbialcommunities within the interstitial sediments (Hewson et al.,
2001; Middelboe et al., 2003) and on the surface of the ben-thos (Franklin et al., 2002; Seuront and Spilmont, 2002) withinestuarine systems, the microscale distributions of the plank-tonic community in the waters immediately overlaying thesediments remains poorly studied. Fluxes and interactionsbetween the benthos and water column will have profound im-plications for nutrient cycling processes, and the structure ofmicrobial and higher order foodwebs within estuarine systems.In the current study we have investigated the influence of thebenthos on the ecology of estuarine planktonic microbial com-munities by studying the microscale dynamics of phytoplank-ton, bacterioplankton and virus populations within the columnof water (<20 cm) immediately overlaying the sedimentwithin a temperate mangrove system.
2. Materials and methods
2.1. Sample site description and characterisation ofenvironment
Samples were collected from a shallow (40 cm) lagoonwithin a temperate mangrove estuary at St Kilda (34�440S,138�330E) South Australia, on two occasions correspondingto the beginning (9/12/03: from here on Dec. 2003) and end(1/3/04: from here on March 2004) of the austral summer of2003e2004. The St Kilda site is characterised by a mangroveforest, incorporating a system of shallow lagoons and streams,many of which are isolated from significant tidal flushing,leading to hyper-salinisation and stagnation of the water col-umn (Barbara and Mitchell, 1996). The site hosts a complexmicrobial community including populations of sulphur-oxidisingbacteria and dense microbial mats (Barbara and Mitchell, 1996).All sampling during this study was conducted from a timberboard-walk that runs through the St Kilda mangrove systemat a height of approximately 50 cm above the water surface.
Bulk physical conditions (temperature, salinity) were mea-sured during each sampling date using a Hydrolab Data-Sonde� 4a. A Sontek acoustic Doppler velocimeter (ADV)was employed to characterise the hydrodynamic conditionsat the site, and velocity fields in three dimensions (ux, uy, uz)were computed using WinADV software (Tony Wahl, USBureau of Reclamation). These values were subsequentlyemployed to calculate the three-dimensional root-mean-squareturbulent velocity wrms (m s�1) as (Tennekes and Lumley,1972):
w2rms ¼
1
3
�u2
x þ u2y þ u2
z
�ð1Þ
We then estimated the average turbulent kinetic energy dissi-pation rate 3 (m2 s�3) in the water column for each samplingdate as (Taylor, 1938):
3¼ k
�w3
rms
L
�ð2Þ
where k is a constant (k ¼ 1, Wolk et al., 2001) and L theintegral length scale of turbulence, i.e. a characteristic length
653J.R. Seymour et al. / Estuarine, Coastal and Shelf Science 73 (2007) 651e666
scale representing the largest turbulent vortexes. Here L wasassigned as 0.4 m, which is the approximate size of the largestpossible eddies in the sampling system, which in this case isthe depth of the lagoon.
Flow velocities obtained with the ADV were also applied tocalculate the shear velocity (u�) above the sediment surface, toallow for an estimation of the extent of resuspension of bottomsediments as a consequence of tidal or wind-induced watermovement (Wainright, 1990). ADV measurements, asdescribed above, were made at three depths, corresponding todistances of 10, 20, 30 cm above the sediment surface. Theshear velocity u� was subsequently calculated as (Dyer, 1986):
u� ¼ku
logð30d=kbÞð3Þ
where k is the von Karman constant (0.41), u is the meanstreamwise velocity calculated for a distance d from the bot-tom and kb is the average diameter of the grains of sediment.Here kb was assigned as 75 mm, from previous measurementsmade in the St Kilda site (Environmental Protection Authorityof South Australia Report, 2000).
From the shear velocity u� it was possible to estimate thediffusive sublayer dd and viscous sublayer dv thickness as(Jumars, 1993):
dv ¼11:6m
ru�ð4Þ
dd ¼2m
ru�ð5Þ
where m is the dynamic viscosity (approx. 0.97� 10�3 kg m�1 s�1
in seawater at 25 �C) and r is the density of seawater (approx.1.024 � 103 kg m�3 at 25 �C).
2.2. Microscale profiles of chemical and biologicalparameters
We measured microscale vertical patterns in dissolved O2,inorganic nutrients (NH3, NO3
�, NO2�, PO4
3�), chlorophylla and suspended particulate material in the 16 cm of waterimmediately overlaying the sedimentewater interface. Dis-solved O2 vertical profiles were obtained at a spatial resolutionof 4 cm using a CellOx 325-3 oxygen electrode (Wissenschaft-lich-Technische Werkstatten).
Vertical profiles for inorganic nutrients, chlorophyll a and sus-pended particulate material were obtained using a pneumaticallyoperated syringe sampler, consisting of a linear array of 50 ml sy-ringes, each separated by a distance of 4 cm and connected alonga hollow copper pipe (Waters et al., 2003). This device was em-ployed to obtain vertical depth profiles from a distance of0.5 cm to 16.5 cm above the surface of the muddy sediment.
Samples for inorganic nutrient analysis (20 ml) were putinto sterile 50 ml centrifuge tubes and frozen prior to analysis.All nutrient analysis for ammonia (NH3), nitrite (NO2
�), nitrate(NO3
�) and filterable reactive phosphorous (PO43�) was con-
ducted using an Alpkem segmented autoanalyser at the
Australian Centre for Tropical Freshwater Research, JamesCook University. Chlorophyll a levels were determined in pro-file samples by filtering 20 ml samples onto 0.45 mm HA(Millipore) filters. Chlorophyll was later extracted in 90% ac-etone and assayed using a Turner 10AU fluorometer.
Concentrations of suspended particulate material weredetermined by filtering 45 ml samples through pre-weighed0.45 mm HA (Millipore) filters. Filters were rinsed with Mill-liQ water, dried at 60 �C for 24 h, and reweighed to determinethe mass of suspended solids (>0.45 mm) retained on the filter(Hewson et al., 2001).
2.3. Microscale profiles of phytoplankton,bacterioplankton and viruses
Prior to the analysis of nutrient, chlorophyll a and sus-pended solid profiles, 1 ml aliquots were taken from eachsub-sample to allow for the enumeration of planktonic micro-organisms within the samples. Aliquots were added to sterile2 ml cryovials and fixed with paraformaldehyde (1% finalconcentration) for 20 min before being quick frozen in liquidnitrogen and stored at �80 �C.
During the sampling conducted in March 2004, anotherspecifically designed microsampler, closely based on the de-sign of the syringe sampler described above, but capable ofobtaining sub-samples at a spatial resolution of 1 cm, wasalso employed to investigate the microscale distributions ofthe planktonic microbial community. This pneumatically oper-ated device consisted of a linear array of 1 ml syringes, allow-ing for the collection of 600 ml sub-samples, and was used toobtain five microscale vertical profiles from a depth of 0.5 to15.5 cm above the sediment surface. Samples collected withthis device were fixed and frozen as described above.
2.4. Sediment samples
Virus and bacterial abundance within the compact muddysediments was measured in triplicate benthic samples obtainedusing cut-off 50 ml sterile syringe sediment corers. Cores weretaken from the sediment surface to a depth of 2 cm and placedinto sterile 50 ml centrifuge tubes containing 35 ml of 0.02 mmfiltered TE buffer (10 mM Tris, 1 mM EDTA pH 7.5). Sampleswere agitated on a flask shaker for 15 min before being centri-fuged at 1000 � g for 10 min (Hewson et al., 2001), and 1 mlaliquots were then taken from the supernatant and fixed andfrozen as described above.
2.5. Flow cytometry
All flow cytometric analysis was conducted using a BectonDickinson FACScan flow cytometer, equipped with an air-cooled argon laser (15 mW, 488 nm), and phosphate bufferedsaline (PBS) solution employed as a sheath fluid. Prior to anal-ysis, frozen samples were quick thawed, and divided into sep-arate aliquots for enumeration of autotrophic phytoplankton,and heterotrophic bacteria and viruses. Samples for bacteriaand virus enumeration were diluted 50-fold in TE buffer
654 J.R. Seymour et al. / Estuarine, Coastal and Shelf Science 73 (2007) 651e666
(10 mM Tris, 1 mM EDTA pH 7.5) before being stained withSYBR-I Green solution (5:100,000 dilution; MolecularProbes, Eugene, OR), and incubated in the dark for 15 min(Marie et al., 1999a,b). We tested the virus abundance in sam-ples of different dilution factors (1:5, 1:10, 1:50, 1:100) andfound good correspondence between the calculated abun-dances in each instance. However, we found that the popula-tions were easiest to differentiate, while also keeping theflow cytometry event rate below 800 (to avoid coincidenceof particle counts, Marie et al 1999), using the 1:50 dilution.Fluorescent beads of 1 mm diameter (Molecular Probes, Eu-gene, OR), were added to all samples in a final concentrationof approximately 105 beads ml�1 (Gasol and del Giorgio,2000), and all measured cytometry parameters were normal-ised to bead concentration and fluorescence.
For each sample, forward scatter (FSC), side scatter (SSC),green (SYBR-I) fluorescence, red fluorescence, and orangefluorescence were acquired, and instrumentation set-up andmethodology closely followed the protocols described byMarie et al. (1999b). For phytoplankton analysis, sample ac-quisition was run until at least 100e200 ml of unstained sam-ple was analysed at a rate of approximately 40 ml min�1.Populations of autotrophic nano- and picophytoplanktonwere discriminated according to differences in red (chloro-phyll) fluorescence, orange (phycoerythrin) fluorescence andside scatter (Marie et al., 1999b) (Fig. 1E,F). For enumerationof bacteria and viruses, sample acquisition was run until atleast 50e100 ml of sample was analysed at an event rate of<800 s�1. Individual virus and bacterial populations were sep-arated according to variations in SYBR-green fluorescence andlight side scatter (Marie et al., 1997, 1999a,b) (Fig. 1C). Datafor individual sub-samples was collected in list-mode files, andpopulations were identified and enumerated using Win Midi2.8 (� Joseph Trotter) flow cytometry analysis software.
2.6. Statistical analysis
All data was tested for normality using the KolmogoroveSmirnov test for normality, and in the cases where normalitycould not be assumed, data was log transformed to allow forthe use of parametric analysis. Distributions of variableswithin microscale profiles were compared by calculating thePearson correlation coefficient. All data analysis wasperformed using SPPSS version 11.0 statistical software.
3. Results
3.1. Environmental parameters
Environmental conditions at the St Kilda mangrove estuarydiffered slightly between the two sampling dates. Mean temper-ature and salinity levels were relatively high during both sam-pling periods, although other parameters including bulkconcentrations of suspended particulate material and inorganicnutrients varied significantly between the two sampling dates(Table 1). A sharp O2 gradient above the sedimentewater inter-face was observed in Dec. 2003 (Fig. 2A) but was not apparent in
March 2004. While turbulent kinetic energy levels were rela-tively low on both sampling dates, levels were slightly higherin Dec. 2003 (Table 1). Shear velocity rates (u�) were alsoslightly higher in Dec. 2003 (Table 1). By applying the shear ve-locities calculated here, we estimated the thickness of the diffu-sive (dd) and viscous (dv) sublayers in the St Kilda site during thesampling periods to be 2.2 mm and 1.3 cm respectively in Dec.2003, and 1.1 cm and 6.1 cm in March 2000.
Field observations at the sampling site also indicated dis-similarities in the characteristics of the sediment surface be-tween the two sampling occasions. In Dec. 2003 thesediment was characterised by a dark muddy surface with noalgal cover evident. In March 2004 however, the sedimentwas partially covered in a fine layer of micro- and macroalgae.On both occasions, white and purple plumes indicative ofsulphur bacteria (Bernard and Fenchel, 1995) were also inter-mittently present on the sediment surface.
3.2. Differentiation of microbial sub-populations
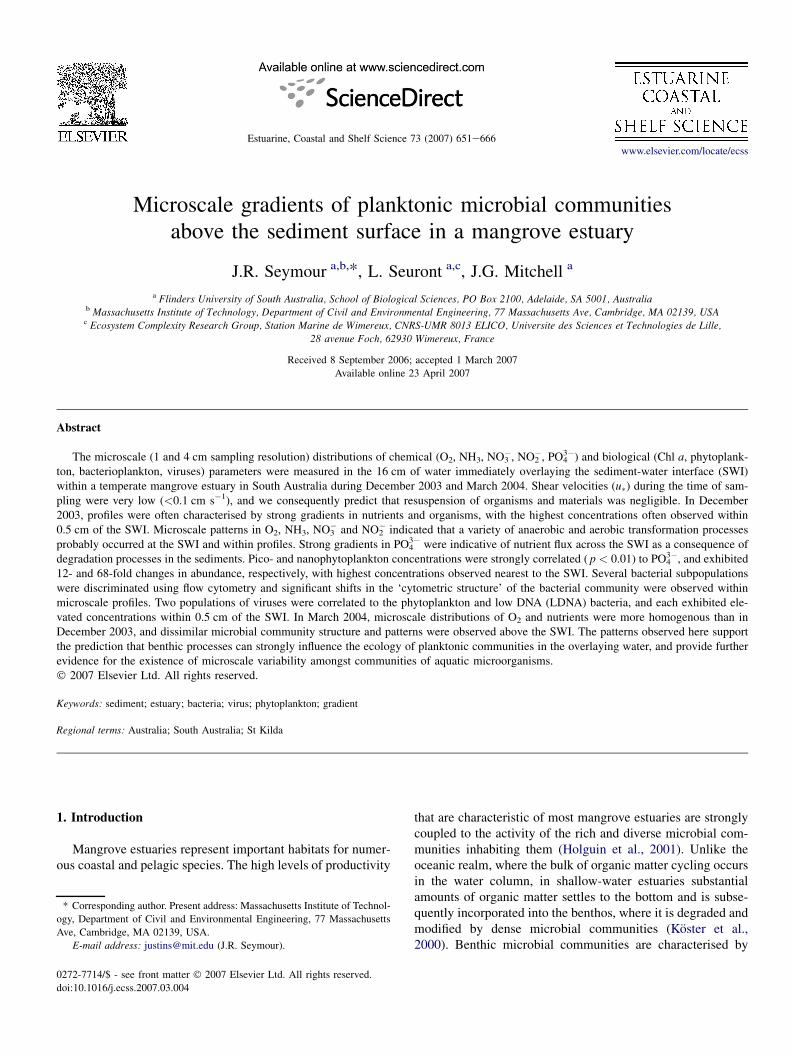
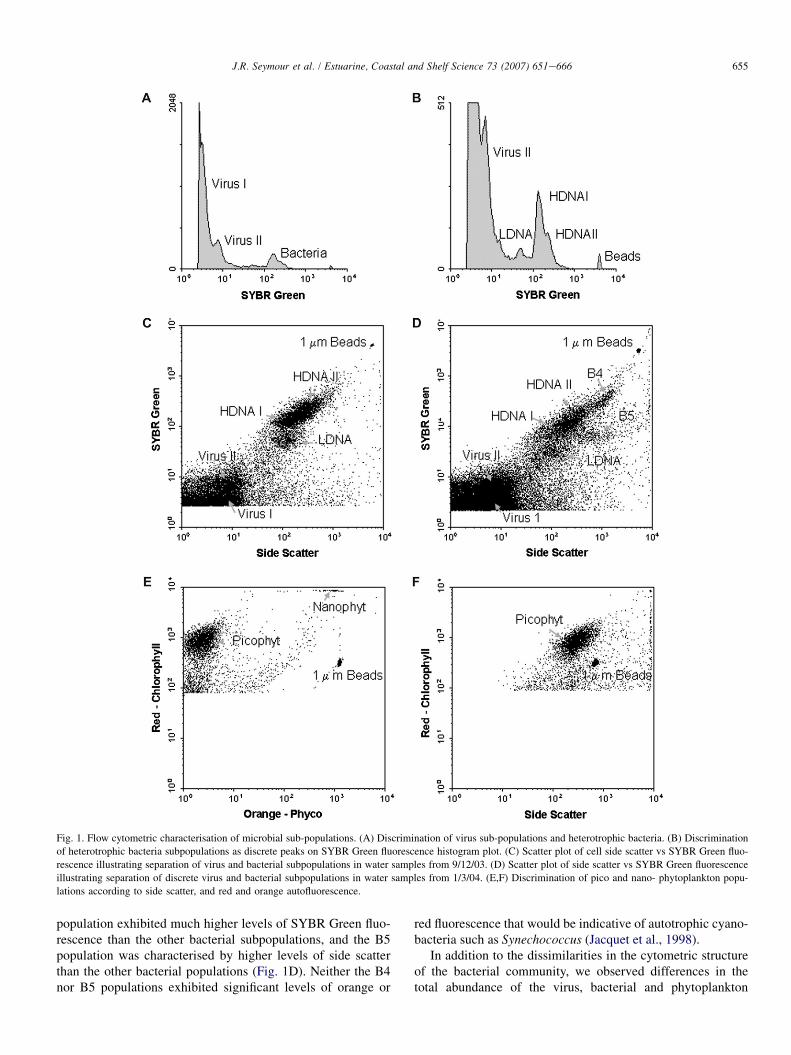
Using flow cytometry, multiple populations of microorgan-isms were identified within water samples. Within unstainedsamples, two discrete populations of phytoplankton were dis-criminated, which according to relative size and autofluorescenceparameters were defined here as a group of picoeukaryotic phyto-plankton and a group of small nanophytoplankton (Fig. 1E,F). Al-though populations of Synechococcus-type cyanobacteria canreadily be identified using flow cytometry, according to orangephycoerythrin fluorescence (Olson et al., 1990), and have beenfound in coastal and estuarine habitats previously (Moreira-Turcqet al., 2001), there was no evidence of a population of cells high inorange fluorescence, indicative of Synechococcus, in the St Kildamangrove estuary during the sampling conducted here.
When samples were stained with the nucleic acid stainSYBR Green, it was possible to discriminate several popula-tions of heterotrophic bacteria and virus-like particles. Twopopulations of virus-like particles, defined here as V1 andV2, and corresponding to populations observed previously inseawater samples (Marie et al., 1999), were identified as dis-crete peaks on histogram plots of SYBR Green fluorescence(Fig. 1A) and clusters in biparametric cytograms (Fig. 1B).
The bacterioplankton community could also be divided intoseparate subpopulations according to differences in SYBRGreen fluorescence (DNA content) and cell side scatter. In theDec. 2003 samples, the bacterial community could be dividedinto three discrete groups, differing on the basis of increasingSYBR Green fluorescence. The low DNA (LDNA) and highDNA (HDNA) populations generally evident in most aquaticsystems (Gasol et al., 1999) were clearly present in all samples(Fig. 1C). The HDNA population also exhibited two well-defined peaks on histogram plots of SYBR Green fluorescenceand could subsequently be divided further into HDNA I andHDNA II categories (Fig. 1B). In March 2004 however, thebacterial community was characterised by a substantially differ-ent ‘cytometric structure’. While the LDNA, HDNA I andHDNA II populations were all still present, at least two moresubpopulations were evident within all samples. The B4
655J.R. Seymour et al. / Estuarine, Coastal and Shelf Science 73 (2007) 651e666
Fig. 1. Flow cytometric characterisation of microbial sub-populations. (A) Discrimination of virus sub-populations and heterotrophic bacteria. (B) Discrimination
of heterotrophic bacteria subpopulations as discrete peaks on SYBR Green fluorescence histogram plot. (C) Scatter plot of cell side scatter vs SYBR Green fluo-
rescence illustrating separation of virus and bacterial subpopulations in water samples from 9/12/03. (D) Scatter plot of side scatter vs SYBR Green fluorescence
illustrating separation of discrete virus and bacterial subpopulations in water samples from 1/3/04. (E,F) Discrimination of pico and nano- phytoplankton popu-
lations according to side scatter, and red and orange autofluorescence.
population exhibited much higher levels of SYBR Green fluo-rescence than the other bacterial subpopulations, and the B5population was characterised by higher levels of side scatterthan the other bacterial populations (Fig. 1D). Neither the B4nor B5 populations exhibited significant levels of orange or
red fluorescence that would be indicative of autotrophic cyano-bacteria such as Synechococcus (Jacquet et al., 1998).
In addition to the dissimilarities in the cytometric structureof the bacterial community, we observed differences in thetotal abundance of the virus, bacterial and phytoplankton

656 J.R. Seymour et al. / Estuarine, Coastal and Shelf Science 73 (2007) 651e666
Table 1
Bulk physical characteristics of the St Kilda mangrove estuary sampling site on 9/12/03 and 1/3/04
Sample
date
Temperature
(�C)
Salinity
(&)
Dissolved
O2 (mg l�1)
Chl a
(mg l�1)
SPMa
(mg l�1)
NH3
(mg N l�1)
NO3�
(mg N l�1)
NO2�
(mg N l�1)
PO43�
(mg P l�1)
3
(cm2 s�3)
u�(cm s�1)
9/12/03 25.0 43.0 1.9 n/a 20.4 24.4 13.8 3.1 205.8 1.3 � 10�3 0.086
1/3/04 25.1 49.2 4.1 16.3 99.2 1.6 8.8 2.0 69.8 2.4 � 10�4 0.018
a SPM, suspended particulate material.
populations between the two sampling dates (Table 2). Withinsediment samples assessed for microbial abundance, it wasoften not possible to clearly identify the specific sub-popula-tions that were evident in the water samples. Therefore only
total bacterial and viral abundance could be enumerated inthese samples. Concentrations of total viruses and bacteria inthe sediments during the March 2004 sampling were 1.9 �109 cm�3 and 4.2 � 108 cm�3 respectively.
0
2
4
6
8
10
12
14
16
18
0 1 2 3 4 5O
2 (mg l
-1)
Distan
ce fro
m S
ed
im
en
t (cm
)
0
2
4
6
8
10
12
14
16
18
0 10 20 30 40Suspended Particulate Matter (mg l
-1)
0
2
4
6
8
10
12
14
16
18
0 2 4 6NO
2
- ( g N l
-1)
NO2
- ( g N l
-1)
Distan
ce fro
m S
ed
im
en
t (cm
)
0
2
4
6
8
10
12
14
16
18
0 100 200 300 400PO
4
3- ( g P l
-1)
0
2
4
6
8
10
12
14
16
18
0 10 20 300
2
4
6
8
10
12
14
16
18
0 10 20 30 40 50 60NH
3 ( g N l
-1)
Distan
ce fro
m S
ed
im
en
t (cm
)
Distan
ce fro
m S
ed
im
en
t (cm
)D
istan
ce fro
m S
ed
im
en
t (cm
)D
istan
ce fro
m S
ed
im
en
t (cm
)
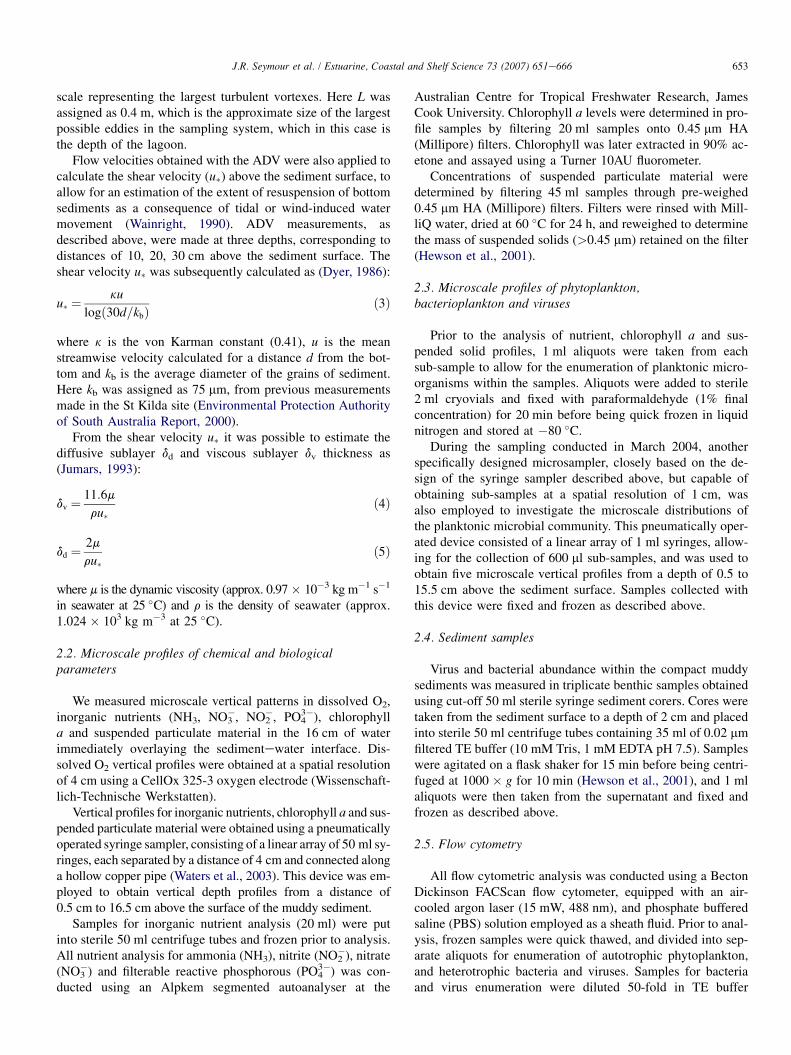
Fig. 2. Microscale vertical profiles of physical parameters immediately above the sedimentewater interface within the St Kilda mangrove estuary on 9/12/03.
(A) Dissolved oxygen, (B) suspended particulate material, (C) nitrite, (D) filterable reactive phosphorous, (E) ammonia, (F) nitrate.

657J.R. Seymour et al. / Estuarine, Coastal and Shelf Science 73 (2007) 651e666
Table 2
Microbial community characteristics at the St Kilda mangrove estuary sampling site on 9/12/03 and 1/3/04
Sample date Total bacteria
(�107 ml�1)
%HDNA Total viruses
(�108 ml�1)
VBR Picophytoplankton
(�104 ml�1)
Nanophytoplankton
(�103 ml�1)
9/12/03 9.5 75.6 3.4 4.7 6.9 1.5
1/3/04 6.9 70.9 5.5 8.2 1.9 1.0
3.3. Microscale profiles
On each of the sampling dates, concentration gradientswere observed in the microscale distributions of physicaland biological variables within the 16.5 cm immediately abovethe sedimentewater interface. As the nature of these micro-scale patterns and the community characteristics sometimesdiffered significantly between the two sampling dates, the pat-terns observed will be described separately.
3.3.1. December 2003Microscale vertical profiles of suspended particulate matter,
NO2� and PO4
3� all exhibited increasing trends towards the sed-iment, with maximum concentrations observed within the5 mm closest to the sediment surface (Fig. 2). Alternatively,concentrations of NO3
� were highest 16.5 cm from the sedi-ment surface (Fig. 2E), while NH3 exhibited discrete concen-tration peaks at 0.5 cm and 12.5 cm above the sedimentsurface (Fig. 2F). Dissolved O2 exhibited a decreasing trendtoward the sediment with concentrations within the 5 mmclosest to the sediment surface over 30 times lower than inthe overlaying water column (Fig. 2A).
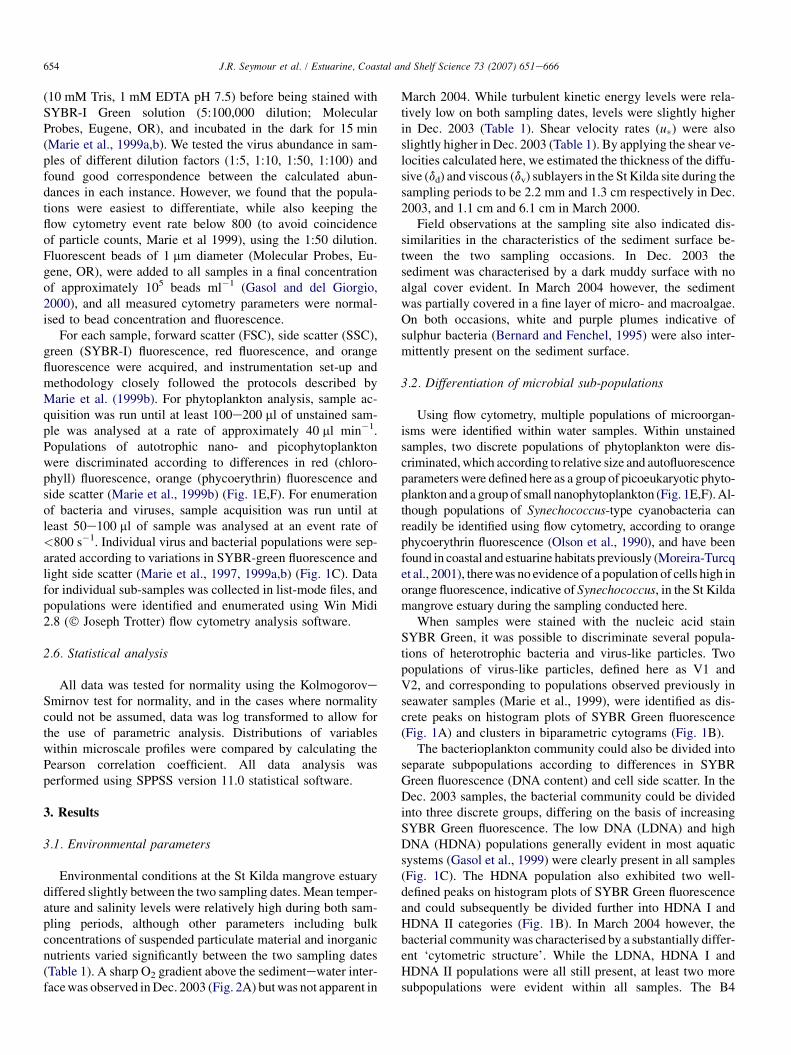
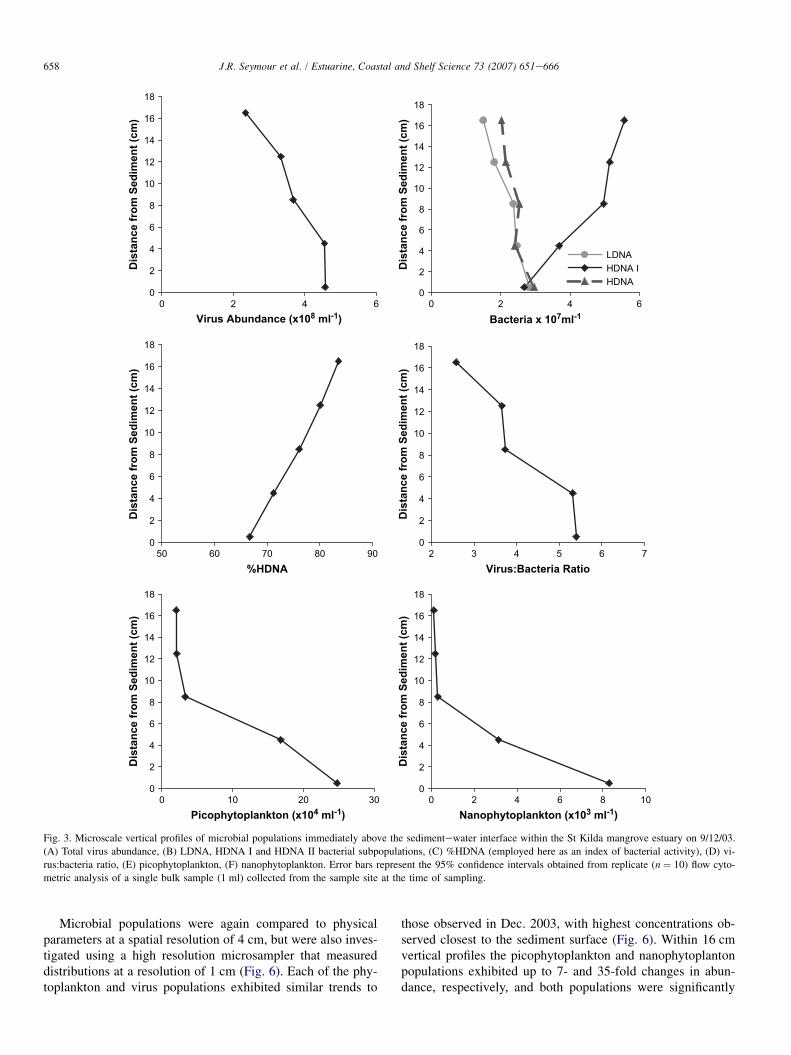
The picophytoplankton and nanophytoplankton populationsalso exhibited marked gradients in abundance across the16 cm profile, with up to 12- and 68-fold changes in abun-dance observed respectively (Fig. 3E,F). Highest concentra-tions were observed within the 0.5 cm closest to thesediment surface, although profiles were characterised by co-herent gradients in abundance across 8e12 cm. The picophy-toplankton and nanophytoplankton populations were stronglycorrelated to each other (r > 0.963, p < 0.01) and to the con-centration of PO4
3� (r > 0.925, p < 0.01).In contrast to the phytoplankton populations, total hetero-
trophic bacterial abundance exhibited slight decreasing trendstowards the sediment surface, with lowest concentrations al-ways observed within the 5 mm closest to the sediment sur-face. Total bacterial abundance was not significantlycorrelated ( p > 0.05) to any other measured parameter inany profiles. The three bacterioplankton subpopulations gener-ally exhibited dissimilar microscale patterns to one another(Fig. 3B). In all profiles the HDNA I population exhibited adecreasing trend towards the sediment surface, with lowestconcentrations observed within the 5 mm closest to the sedi-ment surface. Conversely, the LDNA and HDNA II popula-tions were significantly (r > 0.883, p < 0.05) correlated toone another, and both exhibited a slight increasing trend to-wards the sediment surface, with highest concentrations ob-served within the 5 mm closest to the sediment surface(Fig. 3B). These patterns generated microscale shifts in the
dominant population within the bacterial community. Withinmost sub-samples the HDNA I population represented the nu-merically dominant group, but within the samples closest tothe sediment surface both the LDNA and HDNA II popula-tions generally occurred in higher concentrations. These mi-croscale changes in the bacterial community structure werealso apparent when histogram plots of SYBR Green fluores-cence were compared between depth intervals, with markedshifts in the relative size and shape of the three peaks corre-sponding to the different bacterial subpopulations (Fig. 4).Both the LDNA and HDNA II populations were significantlycorrelated (r > 0.891, p < 0.05) to the phytoplankton popula-tions and to PO4
3� concentrations, while the HDNA I popula-tion was not significantly correlated ( p > 0.05) to any othermeasured parameter. Microscale shifts in the relative propor-tions of the LDNA and HDNA populations generated decreas-ing trends in the proportion of HDNA cells with proximity tothe sediment surface (Fig. 3C).
The virus populations exhibited slight increasing trends to-wards the sediment surface (Fig. 3A), with the highest concen-trations of both the V1 and V2 populations observed within the5 mm closest to the sediment. Unlike the bacterial subpopula-tions, the virus subpopulations exhibited very similar micro-scale dynamics, with strong correlations between the V1 andV2 populations observed (r > 0.994, p < 0.01), and the rela-tive proportions of V1 and V2 virus populations remained sta-ble within and between profiles. Both the V1 and V2populations were correlated (r > 0.888, p < 0.01) to the nano-phytoplankton, picophytoplankton and LDNA populations,and the V2 population was correlated (r > 0.936, p < 0.05)to the HDNA II population. The total virus population andboth the V1 and V2 populations were also correlated(r > 0.932, p < 0.05) to the concentration of suspended partic-ulate material. The mean virus:bacteria ratio (VBR) was 4.7and exhibited an increasing trend with proximity to the sedi-ment surface in all profiles (Fig. 3D).
3.3.2. March 2004Strong vertical gradients in suspended particulate matter
and chlorophyll a were apparent in vertical profiles, with high-est concentrations observed within the 5 mm closest to thesediment surface (Fig. 5B,C). However, with the exceptionof a slight gradient in the concentration of PO4
3� (Fig. 5D),the concentrations of inorganic nutrients remained homoge-nous in vertical profiles (data not shown). In comparison tothe strong gradient observed in Dec. 2003, only a slight shiftin dissolved O2 levels was observed, although concentrationsclose to the sediment surface were again lowest (Fig. 5A).
658 J.R. Seymour et al. / Estuarine, Coastal and Shelf Science 73 (2007) 651e666
0
2
4
6
8
10
12
14
16
18
2 3 4 5 6 7Virus:Bacteria Ratio
0
2
4
6
8
10
12
14
16
18
0 2 4 6 8 10Nanophytoplankton (x10
3 ml
-1)
0
2
4
6
8
10
12
14
16
18
0 10 20 30Picophytoplankton (x10
4 ml
-1)
0
2
4
6
8
10
12
14
16
18
Bacteria x 107ml
-1
LDNAHDNA IHDNA
0
2
4
6
8
10
12
14
16
18
50 60 70 80 90%HDNA
0
2
4
6
8
10
12
14
16
18
0 2 4 60 2 4 6Virus Abundance (x10
8 ml
-1)
Distan
ce fro
m S
ed
im
en
t (cm
)
Distan
ce fro
m S
ed
im
en
t (cm
)
Distan
ce fro
m S
ed
im
en
t (cm
)
Distan
ce fro
m S
ed
im
en
t (cm
)
Distan
ce fro
m S
ed
im
en
t (cm
)
Distan
ce fro
m S
ed
im
en
t (cm
)
Fig. 3. Microscale vertical profiles of microbial populations immediately above the sedimentewater interface within the St Kilda mangrove estuary on 9/12/03.
(A) Total virus abundance, (B) LDNA, HDNA I and HDNA II bacterial subpopulations, (C) %HDNA (employed here as an index of bacterial activity), (D) vi-
rus:bacteria ratio, (E) picophytoplankton, (F) nanophytoplankton. Error bars represent the 95% confidence intervals obtained from replicate (n ¼ 10) flow cyto-
metric analysis of a single bulk sample (1 ml) collected from the sample site at the time of sampling.
Microbial populations were again compared to physicalparameters at a spatial resolution of 4 cm, but were also inves-tigated using a high resolution microsampler that measureddistributions at a resolution of 1 cm (Fig. 6). Each of the phy-toplankton and virus populations exhibited similar trends to
those observed in Dec. 2003, with highest concentrations ob-served closest to the sediment surface (Fig. 6). Within 16 cmvertical profiles the picophytoplankton and nanophytoplantonpopulations exhibited up to 7- and 35-fold changes in abun-dance, respectively, and both populations were significantly

659J.R. Seymour et al. / Estuarine, Coastal and Shelf Science 73 (2007) 651e666
Fig. 4. Shifts in the flow cytometric population structure of the bacterioplank-
ton community in a microscale vertical profile within the St Kilda mangrove
estuary on 9/12/04.
correlated to each other (r > 0.791, p < 0.01), chlorophylla (r > 0.990, p < 0.01), NH3 (r > 0.883, p < 0.05) andPO4
3� (r > 0.885, p < 0.05).Virus concentrations varied only slightly within microscale
profiles, with less than two-fold changes in abundance ob-served in most instances. However, highest concentrations oftotal viruses (Fig. 6A) and V1 and V2 populations again oc-curred within the 5 mm closest to the sediment surface, andcorrelations (r > 0.733, p < 0.01) between the V1 and V2populations were again observed in all samples. However, un-like the Dec. 2003 samples, neither of the virus populationswere significantly correlated ( p > 0.05) to the concentrationof suspended particulate matter. Both virus populations werecorrelated to the nanophytoplankton in all samples(r > 0.567, p < 0.05), but to the picophytoplankton in only 1profile (r > 0.768, p < 0.01). In 3 out of 5 profiles both theV1 and V2 populations were significantly correlated(r > 0.537, p < 0.05) to all of the bacterial subpopulations.While the VBR varied within microscale profiles, no coherenttrends or gradients, like those observed in Dec. 2003, were ap-parent in any of the profiles (Fig. 6D).
The bacterioplankton community exhibited marked differ-ences to the patterns observed in Dec. 2003, although the pat-terns observed also varied between individual microscaledepth profiles. In two out of five vertical profiles the highest con-centrations of bacteria were observed closest to the sedimentsurface, with gradients in abundance apparent over a distanceof 2e4 cm (e.g. Fig. 6B). In the other three profiles, the bacterialcommunity remained comparatively homogenous, not exhibit-ing any clear trend in abundance, with no evidence for the de-creases in abundance and %HDNA near to the sedimentsurface that was apparent in Dec. 2003. In each of the high res-olution microscale profiles, each bacterial sub-population ex-hibited very similar distributions, and all populations weresignificantly correlated (r > 0.590, p < 0.05) to one another.There was no evidence for the shifts in bacterial communitystructure in histogram plots of SYBR Green fluorescencebetween depth intervals that were observed in the Dec. 2003samples, and no clear trends in the %HDNA were observed inany of the profiles (Fig. 6C). None of the bacterial subpopula-tions nor the %HDNA were significantly correlated ( p > 0.05)to chlorophyll a, suspended particulate material or inorganicnutrients.
4. Discussion
4.1. Environmental variability above the sedimentewaterinterface
Planktonic communities inhabiting the few centimetresimmediately overlaying the SWI are likely to experiencea number of biotic and abiotic forces unique to that specificmicroenvironment. Our results suggest that physical andchemical parameters within the 10e20 cm above the sedimentsurface are highly heterogeneous, with marked gradients in theconcentrations of dissolved and particulate material.

660 J.R. Seymour et al. / Estuarine, Coastal and Shelf Science 73 (2007) 651e666
Fig. 5. Microscale vertical profiles of physical parameters immediately above the sedimentewater interface within the St Kilda mangrove estuary on 1/3/04.
(A) Dissolved oxygen, (B) chlorophyll a, (C) suspended particulate material, (D) filterable reactive phosphorous.
Gradients in the concentrations of dissolved oxygen and in-organic nutrients above the SWI, like those observed here,have been observed over equivalent spatial scales previously(Jørgensen, 1980; Yamamuro and Koike, 1994). The gradientin O2 concentrations observed in Dec. 2003, characterisedby very low O2 levels (<1 mg l�1) in the 4e8 cm immediatelyabove the sediment surface, presumably occurred as a conse-quence of microbial respiration of organic matter within thesediments and relatively stagnant conditions in the overlayingwater. The remineralisation of organic matter in the sedimentsand subsequent flux of inorganic nutrients across the SWI isprobably also responsible for the strong gradient in the con-centration of PO4
3� observed above the sediment surface (Hop-kinson, 1987; Koster et al., 2000; Baric et al., 2002).
We also observed significant variability and complex pat-terns in the microscale vertical distributions of the nitrogenspecies measured. Small-scale oxygen gradients, like thoseobserved here, form redox gradients, which can subsequentlygenerate microscale variability in the types and rates of nitro-gen cycling in and above the sediments (Rysgaard et al.,
1994; Paerl and Pinckney, 1996; Kemp and Dodds, 2001).The NO2
� maximum, and low concentrations of NO3�,
observed immediately above the SWI here are indicative ofdenitrification occurring at the sediment surface, where lowO2 concentrations and large amounts of organic matter facil-itated the respiration of NO3
� by denitrifying bacteria (Randalland Ingraham, 1981; Seitzinger, 1988, 1990). The increases inNO3� 12e16 cm away from the SWI are alternatively indica-
tive of increased nitrification rates occurring when O2 levelswere higher (Henriksen and Kemp, 1988; Kemp and Dodds,2001). A peak in NH3 at the sediment surface (Fig. 2F),where anoxic conditions prevailed, is likely to have resultedfrom release during denitrification processes (Paerl andPinckney, 1996). The second increase in NH3 levels,12.5 cm from the sediment surface (Fig. 2F), probablyoccurred as a consequence of heterotrophic remineralisationoccurring at higher rates as oxygen levels increased, and asoxygen levels increased further, NH3 decreased slightly, prob-ably as a consequence of increased rates of nitrification(Libes, 1992).

661J.R. Seymour et al. / Estuarine, Coastal and Shelf Science 73 (2007) 651e666
Fig. 6. Microscale vertical profiles of microbial populations, at a sampling resolution of 1 cm, within the 15.5 cm immediately above the sedimentewater interface
within the St Kilda mangrove estuary on 1/3/04. (A) Total virus abundance, (B) Total bacterial abundance, (C) %HDNA (employed here as a measure of bacterial
activity), (D) virus:bacteria ratio, (E) Small nanophytoplankton, (F) picophytoplankton. Error bars represent the 95% confidence intervals obtained from replicate
(n ¼ 10) flow cytometric analysis of a single bulk sample (1 ml) collected from the sample site at the time of sampling.
In March 2004 the microscale patterns in nutrients were notas complex as in Dec. 2003. While a slight gradient in PO4
3�
was again observed, all other inorganic nutrients remainedrelatively homogenous. This pattern is likely to be a directconsequence of the relatively uniform O2 concentrations andthe absence of a strong anoxic zone. The reason for the ho-mogenous and higher concentrations of O2 may be decreasedlevels of deposited organic matter and subsequently reducedmicrobial respiratory activity at the sediment surface. The
lower abundance and activity levels (%HDNA) of the bacterialcommunity observed in March 2003 are consistent with thishypothesis. Alternatively, the higher concentrations of O2 ob-served near the sediment surface may have been associatedwith the communities of macro and microalgae present onthe sediment surface in March 2004 (Qu et al., 2003). The as-similation of inorganic nutrients by these communities mayalso explain the lower nutrient concentrations observed duringthis period (Kuwae et al., 1998; Cabrita and Brotas, 2000; Qu
662 J.R. Seymour et al. / Estuarine, Coastal and Shelf Science 73 (2007) 651e666
et al., 2003). These dissimilar patterns indicate that, as well asbeing highly variable across small spatial scales, the processesinfluencing the chemical environment above the SWI can alsovary markedly with time.
Physical mixing processes, generated by tidal movement orwind influence, can also alter the physical and biological statusof the water overlaying the SWI, by resuspending organismsand nutrients (Fanning et al., 1982; Demers et al., 1987; Wain-right, 1987, 1990). Several studies have illustrated high levelsof resuspension of microbial communities from the benthos,and the critical shear velocities (u�c) required to resuspend mi-croorganisms and detritus have been calculated for differentenvironments (Wainright, 1990; Blanchard et al., 1997; Beau-lieu, 2003). In the present study we calculated shear velocity(u�) rates of approximately 0.09 and 0.02 cm s�1 during theDec. 2003 and March 2004 sampling dates respectively. Thesevalues are relatively low in comparison to previously pub-lished critical shear velocities (e.g. 0.95e1.35 cm s�1 for bac-teria (Wainright, 1990), and 0.4e1 cm s�1 for phytoplankton(Blanchard et al., 1997; Beaulieu, 2003), and we subsequentlypredict that the influence of resuspension and mixing pro-cesses at the St Kilda site, at least during the time of sampling,would be low.
Using the shear velocity rates calculated here it was possi-ble to estimate the thickness of the viscous (dv) and diffusive(dd) sublayers above the sediment surface in the St Kilda site.The viscous sublayer corresponds to the region above the SWIwhere surface friction retards flow and viscous forces dampout turbulent mixing. Viscous sublayers are most prominentin muddy bottomed, low-energy environments and are gener-ally w1 cm thick (Crawford and Sanford, 2001). The diffusivesublayer represents the thin layer of water immediately adja-cent to the sediment surface where molecular diffusion be-comes the dominant form of mass transfer. The size of thediffusive sublayer controls the extent of exchange of nutrientsand gases across the SWI, and depending upon the environ-ment is generally a few millimetres thick (Jørgensen and Re-vsbech, 1985; Jørgensen and Des Marais, 1990; Dade, 1993;Crawford and Sanford, 2001). As a consequence of the verylow shear velocities occurring at the St Kilda site, the viscousand diffusive sublayers observed here were relatively thick. Bycontrolling mass transfer and limiting mixing, thick diffusiveand viscous sublayers will maintain larger and more persistentgradients of substrates above the SWI, and this probably ex-plains the strong O2 and nutrient gradients observed here. Asa consequence, the planktonic community inhabiting the waterimmediately above the SWI within this specific environment islikely to experience a highly stratified microhabitat.
4.2. Microscale shifts amongst planktonic microbialcommunities
Both of the phytoplankton populations identified hereexhibited high levels of centimetre-scale spatial variability,with highest concentrations always occurring within 0.5 cmof the SWI. Resuspension of phytoplankton cells from the sed-iment into the overlaying water column has been predicted to
significantly increase phytoplankton biomass and primary pro-duction levels in the overlaying water column (Fanning et al.,1982). However, as is discussed above, due to the low u� levelsobserved here, we predict that rates of resuspension of phyto-plankton cells from the sediment surface would be low to neg-ligible, particularly due to the small cell size (<10 mm) of thepopulations investigated here.
Both populations studied here were strongly correlated toPO4
3� gradients in all samples, and phytoplankton abundancepeaks also corresponded with peaks in NH3 concentrationnear to the SWI. A number of studies have previously dis-cussed the potential importance of benthic nutrient flux forphytoplankton communities in the overlaying water column(Rowe et al., 1975; Boynton et al., 1980; Hopkinson, 1987;Rieling et al., 2000), and the relevance of small-scale nutrientgradients in the ecology of phytoplankton has also been theor-ised for decades (Goldman et al., 1979; Lehman and Scavia,1982). The patterns observed here imply that the microscaledistributions of the phytoplankton community above theSWI are closely coupled to gradients in nutrient concentration.The observation that changes in phytoplankton abundancewere almost twice as great in Dec. 2003, when nutrient gradi-ents were also most pronounced, adds further support to thisprediction. As a consequence of the patterns observed here,primary production levels in the few centimetres above theSWI may be significantly higher than in the overlaying watercolumn.
Total changes in bacterial abundance were less intense thanthose observed for the phytoplankton populations, but the bac-terial community generally exhibited more complex patternsand trends within the waters overlaying the SWI. Using flowcytometry, multiple sub-populations of bacteria were discrim-inated, and as has recently been observed in open water andlake samples (Seymour et al., 2004; Andreatta et al., 2004),these populations sometimes exhibited dissimilar microscalepatterns to one another. The subpopulations discriminated inDec. 2003 appear to closely correspond to the low-DNA(LDNA) and high-HDNA (HDNA) groups previouslyobserved in seawater samples (Li et al., 1995; Jellett et al.,1996; Gasol et al., 1999). The LDNA and HDNA groups arewidely expected to represent dormant and active cells respec-tively (Gasol et al., 1999; Lebaron et al., 2001, 2002), and theproportion of HDNA cells (%HDNA) has therefore been ap-plied as an indicator of bacterial activity (Gasol et al., 1999;Vaque et al., 2001; Gasol et al., 2002; Seymour et al., 2004).Due to the significantly higher side scatter and green fluores-cence of the HDNA II population identified here, this popula-tion is predicted to represent the most active cells in thecommunity (Lebaron et al., 2002).
Centimetre-scale shifts, characterised by changes in the‘‘cytometric structure’’ of the bacterial community (Fig. 4) po-tentially occurred as a consequence of heterogeneity in thechemical and physical microenvironment above the SWI.We observed lower bacterial activity (%HDNA) and totalabundance near to the SWI in Dec. 2003, despite the elevatedconcentrations of organic and inorganic nutrients expected tooccur within this region (Hopkinson et al., 1998). However,

663J.R. Seymour et al. / Estuarine, Coastal and Shelf Science 73 (2007) 651e666
it is pertinent to note that the decreases in cell numbers and%HDNA near to the SWI were primarily driven by decreasesin the HDNA I population. As the decreases in HDNA I didnot correspond to equal magnitude increases in the LDNAand HDNA II populations, changes in %HDNA were appar-ently not associated with cells simply shifting between differ-ent activity levels. This indicates that either the HDNA Ibacteria were actively removed from the environment nearto the SWI, or that growth of this population was inhibitedwithin this region. A possible explanation for the reductionin HDNA I growth and numbers is sensitivity to the anoxicconditions above the SWI. This is supported by the observa-tions that increases in HDNA I numbers corresponded to anincrease in O2 concentration in the Dec. 2003 profiles, andthat in March 2004, when O2 concentrations did not decreasebelow 3 mg l�1, the HDNA I population did not exhibit a sig-nificant decrease near to the SWI. Other alternative mecha-nisms include preferential grazing or infection of thispopulation. Indeed, the HDNA I population corresponds tothe bacterial subpopulation previously shown to be most sus-ceptible to grazing pressure (Bouvy et al., 2004), and concen-trations of heterotrophic nanoflagellates are often elevated inthe few centimetres immediately above the SWI (Shimetaand Sisson, 1999). Numbers of viruses and the VBR werealso higher near to the SWI, indicating that the potential forvirus infection within this region may also be greater. In-creased grazing or infection rates within the few centimetresimmediately above the SWI may also explain the concomitantincreases in numbers of LDNA bacteria, which have in somecases been predicted to represent dead cells (Gasol et al., 1999).
Alternatively, rather than being indicative of changes inbacterial metabolic state, changes in the relative abundancesof the bacterial subpopulations may be a manifestation ofmicroscale shifts in the composition of the bacterial commu-nity. Considering the heterogeneous nature of the environmentstudied here, we predict that the bacterial community will behighly diverse and perhaps characterised by microscale shiftsin community composition, probably between communitiesdominated by aerobic and anaerobic populations (Kosteret al., 2000). Microscale shifts in bacterioplankton speciesrichness have been observed previously (Long and Azam,2001), and Zubkov et al. (2001) demonstrated that differentflow cytometric subpopulations of bacteria can representdiscrete phylogenetic groups. However, other authors have al-ternatively shown that cytometric subpopulations can be com-prised of multiple phylogenetic groups (Fuchs et al., 2000) andthat cells from a single species of bacteria can co-occur in dif-ferent flow cytometric populations (Servais et al., 2003). With-out molecular analysis of sorted flow cytometric groups it isnot possible to determine how the shifts in cytometric popula-tion structure observed here relate to taxonomic (Zubkov et al.,2001) or physiological (Gasol et al., 1999) variability. Never-theless, our results indicate that shifts in the structure ofbacterioplankton communities can occur over spatial salesof centimetres apparently in response to microscale heteroge-neity in the physical and/or chemical environment immedi-ately above the SWI.
In March 2004, both the bacterial community structure andmicroscale dynamics above the SWI were dissimilar to thepatterns observed in Dec. 2003. Two additional populationsof bacteria (B4 and B5), characterised by high side scatterand fluorescence levels were apparent in March 2004. It isnot clear why these populations were present in March 2004and not Dec 2003. However, the B4 and B5 populationswere always correlated to the other bacterial subpopulations,and did not exhibit patterns, such as association with oxygengradients, that would be suggestive of specialised populationsof bacteria such as sulphur-oxidising bacteria. Indeed, all bac-terial subpopulations were generally correlated to one anotherin March 2004. As shifts in abundance remained consistent be-tween bacterial subpopulations, there was little change in%HDNA observed, indicating that bacterial activity was ap-parently homogenous within profiles in March 2004. Further-more, the changes in the ‘cytometric structure’ of the bacterialpopulation that were evident in Dec. 2003 did not occur inMarch 2004. This may be a consequence of the greater homo-geneity in conditions (e.g. O2 and nutrients) observed in thewater overlaying the SWI in March 2004.
Unlike Dec. 2003, when all profiles were characterised byidentical spatial patterns and trends, in March 2004 the distri-butions observed sometimes differed from one profile to an-other. In three profiles all of the bacterial populationsexhibited homogenous trends and low levels of variabilityover the 16 cm profile. In two profiles however, each of thepopulations exhibited maximum bacterial abundance withinthe 1e3 cm immediately above the SWI. The source of thevariability between the profiles is itself an expression of themicroscale heterogeneity observed within this environment.Vertical gradients above the sediment surface are ultimatelya corollary of processes occurring within or on the sediment.If for instance we consider a dense patch of benthic microal-gae covering only a few centimetres of the sediment surface(Seuront and Spilmont, 2002), then the flux of DOC fromthis patch (Middelboe et al., 1998) will be higher than in thesurrounding area, and gradients in bacterial abundance and ac-tivity may be more pronounced here than above other pointson the sediment surface. As profiles were not all taken fromabove exactly the same point on the sediment surface, thesecircumstances may explain the different patterns observed be-tween profiles.
Viruses represent abundant and dynamic populations withinthe water column and sediments of estuarine systems(Almeida et al., 2001; Hewson et al., 2001; Middelboeet al., 2003; Weinbauer et al., 2003), but to our knowledgefew studies have investigated the distributions of virioplanktonimmediately above the SWI. Like the bacterial populations,we observed dissimilarities in the microscale dynamics ofthe virus populations between the two sampling dates. InDec. 2003 both virus populations were significantly correlatedto the suspended particulate material in all profiles. Correla-tions between virioplankton abundance and suspended partic-ulate matter have been observed previously within estuarinesystems and may be indicative of viral adsorption to particles(Hewson et al., 2001) or resuspension processes. Within
664 J.R. Seymour et al. / Estuarine, Coastal and Shelf Science 73 (2007) 651e666
a variety of marine environments virus abundance is correlatedto total bacterial abundance (Cochlan et al., 1993; Boehmeet al., 1993; Drake et al., 1998; Middelboe et al., 2003;Seymour et al., 2005), but no such coupling between total viraland bacterial abundance was observed here. However, bothvirus populations were correlated to the LDNA bacteria sub-population, and the V2 population was correlated with theHDNA II population, indicating a more complex associationbetween the bacterial and viral communities than is indicatedby comparisons of total viral and bacterial abundance. Micro-scale changes in the VBR observed within profiles indicatea possible de-coupling of bacterial and viral communitiesand shifts in virus production and loss rates above the SWI.In all profiles the highest VBR was observed close to theSWI, implying that within this microenvironment bacterial ex-posure to viral infection may be increased. The temporal het-erogeneity in viral abundance and dynamics observed heresuggests that the virus community represents a dynamic ele-ment within the St Kilda mangrove habitat, which alongwith environmental factors, may play a large role in structur-ing the population and trophic dynamics of the microbial pop-ulations inhabiting the water column within the fewcentimetres above the SWI.
4.3. Conclusion
Previously, we have observed centimetre scale spatial het-erogeneity in the abundance and activity of microbial commu-nities in open water samples (Seymour et al., 2004; Waterset al., 2003) and associated with the surfaces of coral colonies(Seymour et al., 2005). The patterns observed here indicatefurther that microscale heterogeneity amongst aquatic micro-bial communities is probably a ubiquitous feature of the ma-rine environment and is likely to occur in response toa variety of generating mechanisms.
Our results also support the prediction that communities ofplanktonic microorganisms within shallow estuarine habitatscan be strongly influenced by benthic processes, such as resus-pension of materials and organisms, and diffusion of nutrientsacross the SWI. The gradients and patterns evident in micro-scale profiles here suggest that, at least in this specific environ-ment, the physical, chemical and biological nature of the watercolumn immediately above the benthicewater interface can bemarkedly stratified at scales of centimetres or less. We subse-quently argue that estuarine and coastal habitats will often becharacterised by a more complex setting than a simple dichot-omy of benthic and pelagic realms. Instead, a continuum ofmicro-niches, influenced by benthic and pelagic processes todifferent degrees, and characterised by discrete microbial con-sortia, is likely to exist at and above the SWI. Shifts in thelevels of primary and secondary production and trophic inter-actions within the few centimetres immediately above the SWImay ultimately modify the productivity and function of pro-tected estuarine systems. Consequently, the dynamics and dis-tributions of the communities inhabiting this specificmicroenvironment warrant further focussed consideration.
Acknowledgements
We thank the National Parks and Wildlife rangers at theSt Kilda mangrove trail for allowing access to the samplingsite, and S. Bailey of the Flow Cytometry Unit of the FlindersMedical Centre for technical assistance with flow cytometry.Funding for this research was provided by the Australian Re-search Council.
References
Almeida, M.A., Cunha, M.A., Alcantara, F., 2001. Loss of estuarine bacteria
by viral infection and predation in microcosm conditions. Microb. Ecol.
42, 562e571.
Andreatta, S., Wallinger, M.M., Piera, J., Catalan, J., Psenner, R., Hofer, J.S.,
Sommaruga, R., 2004. Tools for discrimination and analysis of lake bacter-
ioplankton subgroups measured by flow cytometry in a high-resolution
depth profile. Aquat. Microb. Ecol. 36, 107e115.
Asmus, R.M., Sprung, M., Asmus, H., 2000. Nutrient fluxes in intertidal com-
munities of a South European lagoon (Ria Formosa) e similarities and dif-
ferences with a northern Wadden Sea bay (Sylt-Rømø Bay). Hydrobiology
436, 217e235.
Barbara, G.M., Mitchell, J.G., 1996. Formation of 30- to 40-micrometer-thick
laminations by speed marine bacteria in microbial mats. Appl. Environ.
Microbiol. 62, 3985e3990.
Baric, A., Kuspilic, G., Matijevic, S., 2002. Nutrient (N, P, Si) fluxes between
marine sediments and water column in coastal and open Adriatic. Hydro-
biology 475/476, 151e159.
Beaulieu, S.E., 2003. Resuspension of phytodetritus from the sea floor: a lab-
oratory flume study. Limnol. Oceanogr. 48, 1235e1244.
Bernard, C., Fenchel, T., 1995. Mats of colourless sulphur bacteria II. Struc-
ture, composition of biota and successional patterns. Mar. Ecol. Prog.
Ser. 128, 171e179.
Blanchard, G.F., Sauriau, P.-G., Cariou-Le Gall, V., Gouleau, D., Garet, M.-J.,
Olivier, F., 1997. Kinetics of tidal resuspension of microbiota: testing the
effects of sediment cohesiveness and bioturbation using flume experi-
ments. Mar. Ecol. Prog. Ser. 151, 17e25.
Boehme, J., Frischer, M.E., Jiang, S.C., Kellogg, C.A., Pichard, S., Rose, J.B.,
Steinway, C., Paul, J.H., 1993. Viruses, bacterioplankton and phytoplank-
ton in the southeastern Gulf of Mexico: distribution and contribution to
oceanic DNA pools. Mar. Ecol. Prog. Ser. 97, 1e10.
Bouvy, M., Troussellier, M., Got, P., Arfi, R., 2004. Bacterioplankton re-
sponses to bottom-up and top-down controls in a West African reservoir
(Selingue, Mali). Aquat. Microb. Ecol. 34, 301e307.
Boynton, W.R., Kemp, W.M., Osborne, C.G., 1980. Nutrient fluxes across the
sediment-water interface in the turbid zone of a coastal plain estuary. In:
Kennedy, V.S. (Ed.), Estuarine Perspectives. Academic Press, New York,
pp. 93e109.
Burdige, D.J., Alperin, M.J., Homstead, J., Martens, C.S., 1992. The role of
benthic fluxes of dissolved organic carbon in oceanic and sedimentary car-
bon cycling. Geophys. Res. Lett. 19, 1851e1854.
Burdige, D.J., Homstead, J., 1994. Fluxes of dissolved organic carbon from
Chesapeake Bay sediments. Geochim. Cosmochim. Acta 58, 3407e3424.
Cabrita, M.T., Brotas, V., 2000. Seasonal variation in denitrification and dis-
solved nitrogen fluxes in intertidal sediments of the Tagus estuary, Portu-
gal. Mar. Ecol. Prog. Ser. 202, 51e65.
Cochlan, W.P., Wikner, J., Steward, G.F., Smith, D.C., Azam, F., 1993. Spatial
distribution of viruses, bacteria and chlorophyll a in neritic, oceanic and
estuarine environments. Mar. Ecol. Prog. Ser. 92, 77e87.
Crawford, S.M., Sanford, L.P., 2001. Boundary shear velocities and fluxes in
the MEERC experimental ecosystems. Mar. Ecol. Prog. Ser. 210, 1e12.
Dade, W.B., 1993. Near-bed turbulence and hydrodynamic control of diffu-
sional mass transfer at the sea floor. Limnol. Oceanogr. 38, 52e69.
Demers, S., Therriault, J.C., Bourget, E., Bah, A., 1987. Resuspension in the
shallow sublittoral zone of a macrotidal estuarine environment: wind influ-
ence. Limnol. Oceanogr. 32, 327e339.

665J.R. Seymour et al. / Estuarine, Coastal and Shelf Science 73 (2007) 651e666
Drake, L.A., Choi, K.-H., Haskell, A.G.E., Dobbs, F.C., 1998. Vertical profiles
of virus-like particles and bacteria in the water column and sediments of
Chesapeake Bay, USA. Aquat. Microb. Ecol. 16, 17e25.
Dyer, K.R., 1986. Coastal and Estuarine Sediment Dynamics. Wiley & Sons,
New York.
Environmental Protection Authority of South Australia, 2000. Monitoring re-
port: special survey of the Port River. Heavy metals and PCB’s in dolphins,
sediments and fish.
Fanning, K.A., Carder, K.L., Betzer, P.R., 1982. Sediment resuspension by
coastal waters: a potential mechanism for nutrient re-cycling on the oceans
margins. Deep Sea Res. 29, 953e965.
Franklin, R.B., Blum, L.K., McComb, A.C., Mills, A.L., 2002. A geostatistical
analysis of small-scale spatial variability in bacterial abundance and com-
munity structure in salt marsh creek bank sediments. FEMS Microbiol.
Ecol. 42, 71e80.
Fuchs, B.M., Zubkov, M.V., Sam, K., Burkhill, P.H., Amann, R., 2000.
Changes in community composition during dilution cultures of marine
bacterioplankton as assessed by flow cytometry and molecular biological
techniques. Environ. Microbiol. 2, 191e201.
Gasol, J.M., Zweifel, U.L., Peters, F., Fuhrman, J.A., Hagstrom, A., 1999. Sig-
nificance of size and nucleic acid content heterogeneity as measured by
flow cytometry in natural planktonic bacteria. Appl. Environ. Microbiol.
65, 4475e4483.
Gasol, J.M., del Giorgio, P.A., 2000. Using flow cytometry for counting natu-
ral planktonic bacteria and understanding the structure of planktonic bac-
terial communities. Sci. Mar. 64 (2), 197e224.
Gasol, J.M., Comerma, M., Garcıa, J.C., Armengol, J., Casamayor, E.O.,
Kojecka, P., Simek, K., 2002. A transplant experiment to identify the
factors controlling bacterial abundance, activity, production, and community
composition in a eutrophic canyon-shaped reservoir. Limnol. Oceanogr.
47, 62e77.
Goldman, J.C., McCarthy, J.J., Peavey, D.G., 1979. Growth rate influence on
the chemical composition of phytoplankton in oceanic waters. Nature 279,
210e215.
Henriksen, K., Kemp, W.M., 1988. Nitrification in estuarine and coastal ma-
rine sediments. In: Blackburn, T.H., Sørensen, J. (Eds.), Nitrogen Cycling
in Coastal Marine Environments. Wiley & Sons, SCOPE, pp. 207e249.
Hewson, I., O’Neil, J.M., Fuhrman, J.A., Dennison, W.C., 2001. Virus-like
particle distribution and abundance in sediments and overlaying waters
along eutrophication gradients in two subtropical estuaries. Limnol. Oce-
anogr. 46, 1734e1746.
Holguin, G., Vazquez, P., Bashan, Y., 2001. The role of sediment microorgan-
isms in the productivity, conservation and rehabilitation of mangrove eco-
systems: an overview. Biol. Fertil Soils 33, 265e278.
Hopkinson, C.S., 1987. Nutrient regeneration in shallow-water sediments of
the estuarine plume region of the nearshore Georgia Bight, USA. Mar.
Biol. 94, 127e142.
Hopkinson, C.S., Giblin, A.E., Garritt, R.H., Tucker, J., Hullar, M.A.J., 1998.
Influence of the benthos on growth of planktonic bacteria. Aquat. Microb.
Ecol. 16, 109e118.
Jacquet, S., Lennon, J.-F., Marie, D., Vaulot, D., 1998. Picoplankton popula-
tion dynamics in coastal waters of the northwestern Mediterranean Sea.
Limnol. Oceanogr. 43, 1916e1931.
Jellett, J.F., Li, W.K.W., Dickie, P.M., Boraie, A., Kepkay, P.E., 1996. Meta-
bolic activity of bacterioplankton communities assessed by flow cytometry
and single carbon substrate utilisation. Mar. Ecol. Prog. Ser. 136, 213e225.
Jørgensen, B.B., 1980. Seasonal oxygen depletion in the bottom waters of
a Danish fjord and its effect on the benthic community. Oikos 34, 68e76.
Jørgensen, B.B., 1983. Processes at the sediment-water interface. In: Bolin, B.,
Cook, R.B. (Eds.), The Major Geochemical Cycles and their Interactions.
John Wiley & Sons, Chichester, pp. 477e515.
Jørgensen, B.B., Revsbech, N.P., 1985. Diffusive boundary layers and the
oxygen uptake of sediments and detritus. Limnol. Oceanogr. 31, 111e122.
Jørgensen, B.B., Des Marais, D.J., 1990. The diffusive boundary layer of sed-
iments: oxygen microgradients over a microbial mat. Limnol. Oceanogr.
35, 1343e1355.
Jumars, P.A., 1993. Concepts in Biological Oceanography. An Interdisciplin-
ary Primer. Oxford University Press Inc., New York.
Kemp, M.J., Dodds, W.K., 2001. Centimeter-scale patterns in dissolved oxy-
gen and nitrification rates in a prairie stream. J.N. Am. Benthol. Soc. 20,
347e357.
Koster, M., Babenzien, H.D., Black, H.J., Dahlke, S., Gerbersdorf, S.,
Meyercordt, J., Meyer-Reil, L.A., Rieling, T., Stodian, I., Voigt, A., 2000.
Significance of aerobic and anaerobic mineralization processes of organic
carbon in sediments of a shallow coastal inlet in the southern Baltic Sea.
In: Flemming, B.W., Delafontaine, M.T., Liebezeit, G. (Eds.), Muddy Coast
Dynamics and Resource Management. Elsevier Science, pp. 185e194.
Kuwae, T., Hosokawa, Y., Eguchi, N., 1998. Dissolved inorganic nitrogen cy-
cling in Banzu intertidal sand-flat. Japan. Mang. Salt Marsh. 2, 167e175.
Lebaron, P., Servais, P., Agogue, H., Courties, C., Joux, F., 2001. Does the high
nucleic acid content of individual bacterial cells allow us to discriminate
between active cells and inactive cells in aquatic systems? Appl. Environ.
Microb. 67 (4), 1775e1782.
Lebaron, P., Servais, P., Baudox, A.C., Bourrain, M., Courties, C.,
Parthuisot, N., 2002. Variations of bacterial specific activity with cell
size and nucleic acid content assessed by flow cytometry. Aquat. Microb.
Ecol. 28, 131e140.
Lehman, J.T., Scavia, D., 1982. Microscale patchiness of nutrients in plankton
communities. Science 216, 729e730.
Li, W.K.W., Jellet, J.F., Dickie, P.M., 1995. DNA distributions in planktonic
bacteria stained with TOTO or TO-PRO. Limnol. Oceanogr. 40, 1485e1495.
Libes, S.M., 1992. An Introduction to Marine Biogeochemistry. John Wiley &
Sons, New York.
Long, R.A., Azam, F., 2001. Microscale patchiness of bacterioplankton assem-
blage richness in seawater. Aquat. Microb. Ecol. 26, 103e113.
Mackin, J.E., Swider, K.T., 1989. Organic matter decomposition pathways and
oxygen consumption in coastal marine sediments. J. Mar. Res. 47, 681e716.
Marie, D., Partensky, F., Jacquet, S., Vaulot, D., 1997. Enumeration and cell
cycle analysis of natural populations of marine picoplankton by flow cy-
tometry using a novel nucleic acid dye. Appl. Environ. Microbiol. 63,
186e193.
Marie, D., Brussard, C.P.D., Thyraug, R., Bratbak, G., Vaulot, D., 1999a. Enu-
meration of marine viruses in culture and natural samples by flow cytom-
etry. Appl. Environ. Microbiol. 65, 45e52.
Marie, D., Partensky, F., Vaulot, D., Brussard, C., 1999b. Enumeration of phy-
toplankton, bacteria and viruses in marine samples. In: Robinson, J.P.
(Ed.). John Wiley & Sons, Current Protocols in Cytometry, pp. 11.11.1e
11.11.15.
Middelboe, M., Glud, R.N., Finster, K., 2003. Distribution of viruses and bac-
teria in relation to diagenetic activity in an estuarine sediment. Limnol.
Oceanogr. 48, 1447e1456.
Middelboe, M., Kroer, N., Jørgensen, N.O.G., Pakulski, D., 1998. Influence of
sediment on pelagic carbon and nitrogen turnover in a shallow Danish
estuary. Aquat. Microb. Ecol. 14, 81e90.
Moreira-Turcq, P.F., Cauwet, G., Martin, J.M., 2001. Contribution of flow cy-
tometry to estimate picoplankton biomass in estuarine systems. Hydrobiol-
ogy 462, 157e168.
Olson, R.J., Chisholm, S.W., Zettler, E.R., Armbrust, E.V., 1990. Pigment, size
and distribution of Synechococcus in the North Atlantic and Pacific Ocean.
Limnol. Oceanogr. 35, 45e48.
Paerl, H.W., Pinckney, J.L., 1996. A mini-review of microbial consortia: their
roles in aquatic production and biogeochemical cycling. Microb. Ecol. 31,
225e247.
Qu, W., Morrison, R.J., West, R.J., 2003. Inorganic nutrient and oxygen fluxes
across the sediment-water interface in the inshore microphyte areas
of a shallow estuary (Lake Illawarra, Australia). Hydrobiology 492,
119e127.
Randall, M.J., Ingraham, J.L., 1981. The denitrifying prokaryotes. In:
Staar, M.P. (Ed.), The Prokaryotes, a Handbook on Habitats, Isolation
and Identification of Bacteria. Springer, pp. 913e925.
Rieling, T., Gerbersdorf, S., Stodian, I., Black, H.J., Dahlke, S., Koster, M.,
Meyercordt, J., Meyer-Reil, L.A., 2000. Benthic microbial decomposition
of organic matter and nutrient fluxes at the sediment-water interface in
a shallow coastal inlet of the southern Baltic Sea (Nordrugensche Bodden).
In: Flemming, B.W., Delafontaine, M.T., Liebezeit, G. (Eds.), Muddy Coast
Dynamics and Resource Management. Elsevier Science, pp. 175e184.

666 J.R. Seymour et al. / Estuarine, Coastal and Shelf Science 73 (2007) 651e666
Ritzrau, W., Graf, G., 1992. Increase of microbial biomass in the benthic tur-
bidity zone of Kiel Bight after resuspension by a storm event. Limnol.
Oceanogr. 37, 1081e1086.
Rowe, G.T., Hovey Clifford, C., Smith, K.L., 1975. Benthic nutrient regener-
ation and its coupling to primary productivity in coastal waters. Nature
255, 215e217.
Rysgaard, S., Risgaard-Petersen, N., Sloth, N.P., Jensen, K., Nielsen, L.P.,
1994. Oxygen regulation of nitirification and denitrification in sediments.
Limnol. Oceanogr. 39, 1643e1652.
Seitzinger, S.P., 1988. Denitrification in freshwater and coastal marine ecosystems:
ecological and geochemical significance. Limnol. Oceanogr. 33, 702e724.
Seitzinger, S.P., 1990. Denitrification in aquatic sediments. In: Revsbech, N.P.,
Sørensen, J. (Eds.), Denitrification in Soils and Sediments. Plenum Press,
New York, pp. 301e322.
Servais, P., Casamayor, E.O., Courties, C., Catala, P., Parthuisot, N.,
Lebaron, P., 2003. Activity and diversity of bacterial cells with high and
low nucleic acid content. Aquat. Microb. Ecol. 33, 41e51.
Seuront, L., Spilmont, N., 2002. Self-organized criticality in intertidal micro-
phytobenthos patch patterns. Physica A. 313, 513e539.
Seymour, J.R., Mitchell, J.G., Seuront, L., 2004. Microscale heterogeneity in
the activity of coastal bacterioplankton communities. Aquat. Microb.
Ecol. 35, 1e16.
Seymour, J.R., Patten, N., Bourne, D.G., Mitchell, J.G., 2005. Spatial dynam-
ics of virus-like particles and heterotrophic bacteria within a shallow coral
reef. Mar. Ecol. Prog. Ser. 288, 1e8.
Shimeta, J., Sisson, J.D., 1999. Taxon-specific tidal resuspension of protists
into the subtidal benthic boundary layer of a coastal embayment. Mar.
Ecol. Prog. Ser. 177, 51e62.
Taylor, G.I., 1938. The spectrum of turbulence. Proc. R. Soc. Lond. Ser. A. 20,
1167e1170.
Tennekes, H., Lumley, J.L., 1972. A First Course in Turbulence. MIT Press,
Cambridge, MA.
Vaque, D., Casamayor, E.O., Gasol, J.P., 2001. Dynamics of whole community
bacterial production and grazing losses in seawater incubations as related
to the changes in the proportions of bacteria with different DNA content.
Aquat. Microb. Ecol. 25, 163e177.
Vidal, M., Morgui, J.A., Latasa, M., Romero, J., Camp, J., 1997. Factors con-
trolling seasonal variability of benthic ammonium release and oxygen up-
take in Alfacs Bay (Ebro Delta, NW Mediterranean). Hydrobiology 350,
169e178.
Wainright, S.C., 1987. Stimulation of heterotrophic microplankton production
by resuspended marine sediments. Science 238, 1710e1711.
Wainright, S.C., 1990. Sediment-to-water fluxes of particulate material and
microbes by resuspension and their contribution to the planktonic food
web. Mar. Ecol. Prog. Ser. 62, 271e281.
Waters, R.L., Mitchell, J.G., Seymour, J.R., 2003. Geostatistical characterisa-
tion of centimetre-scale spatial structure of in vivo fluorescence. Mar. Ecol.
Prog. Ser. 251, 49e58.
Weinbauer, M.G., Brettar, I., Hofle, M.G., 2003. Lysogeny and virus-induced
mortality of bacterioplankton in surface, deep, and anoxic marine waters.
Limnol. Oceanogr. 48, 1457e1465.
Wolk, F., Seuront, L., Yamazaki, H., 2001. Spatial resolution of a new micro-
optical probe for chlorophyll and turbidity. J Tokyo Univ. Fish. 87, 13.
Yamamuro, M., Koike, I., 1994. Diel changes of nitrogen species in surface
and overlaying water of an estuarine lake in summer: evidence for
benthic-pelagic coupling. Limnol. Oceanogr. 39, 1726e1733.
Zubkov, M.V., Fuchs, B.M., Burkill, P.H., Amann, R., 2001. Comparison of
cellular and biomass specific activities of dominant bacterioplankton
groups in stratified waters of the. Celtic Sea. Appl. Environ. Microbiol.
67, 5210e5218.