Embed Size (px)
Citation preview
Indian Journal of Fertilisers, December 2014
94
Micronutrients Deficiencies vis-a-visFood and Nutritional Security of India
Arvind K. Shukla, Pankaj K. Tiwariand
Chandra Prakash AICRP on Micronutrients, Indian Institute of Soil Science
Nabibagh, Berasia Road, Bhopal - 462 038, Madhya Pradesh
Role of micronutrients in food production is well recognized and documented but its importance in nutritional securityand human health is increasing in current era. Most of the nutrients that are required for human health come from thesoil through either plants or animal products consumed by humans. Micronutrient deficiencies are rampant in thecountry and on average 43.0, 12.1, 5.4, 5.6 and 18.3% soils are deficient in Zn, Fe, Cu, Mn and B, respectively. Thedeficiency of two elements, particularly Zn+B in acid soils and Zn+Fe in semi-arid soils is coming up in manycropping systems as an alarm for future. Soil micronutrients maps developed, covering large areas to improve ourunderstanding regarding micronutrients problems would be helpful in taking policy decisions regarding distributionof micronutrient carrying fertiliser materials to the location deficient in respective micronutrients. Besides this, thedelineation results will be of immense use in developing location specific recommendations to enhance micronutrientscontent in food crops. Micronutrients availability in soil is reflected in their concentration in soil seed/ fodder and whichin turn decides its bioavailability and bioassimilation in human and livestock. The seeds grown on micronutrientsdeficient soils contain micronutrients 2 to 3 times lower than those grown on micronutrients adequate soils. Abioassimilation study suggested that consumption of micronutrients dense food is expected to have a huge impactin combating micronutrients malnutrition. Strategies developed to unlock the native Zn and Fe from the soil andexternal application through foliar feeding could enhance sizeable amount of bioavailability micronutrients in plantfood. This article highlights current scenario of micronutrients status in Indian soils, its contribution to total food grainproduction and its relation to food and nutritional security of the country.
Indian J. Fert., Vol. 10 (12), pp.94-112 (19 pages)
INTRODUCTION
It is estimated that by the year2050, world human population willclimb to 9.7 billion, and India’spopulation is projected to overtakethat of China, will rise to 1.6billion, from its current level of 1.2billion (45). Skewed use of majorfertiliser nutrients withoutmicronutrients is a major concernfor achieving the agriculturalintensification required to feed thegrowing world populationnutritious food. A challenge forAgricultural scientists is to feedthe world population withnourishing food. On the otherhand, expectations for highergrain productivity in the past,caused decreased content ofmicronutrients in grains (7, 38, 39,55). The issue of micronutrientsdeficiency is related with food andnutritional security (22, 15, 54).Micronutrients are majorlimitation across the world andcontrols crop productivity as wellas produce quality (especiallymicronutrients concentration).Micronutrients deficiencies aredifficult to diagnose and
consequently the problem istermed ‘hidden hunger ’ (46).Pressure on a fixed land base toproduce more food has driven ashift in production toward cereals.Cereals are generally low inmicronutrients compared to manyother food crops and growingthem on micronutrients deficientsoils further reduces theirconcentration in these crops.Indian diets are mainly consist ofcereals like, rice and wheat, whichare inherently low inmicronutrients, and thus it raisedconcern for animal and humanhealth.
Research efforts that relatemicronutrient deficiency in soilswith human health and itsremediation are only at infancy inIndia. Zinc deficiency in humandiet was reported as early as1961 and expressed its syndromeas hypogonadism, dwarfism,hepatosplenomegaly, anaemia andgeophagia (41). The research workon micronutrients in soil andhuman health is very scantlydespite the obvious connectionbetween soil micronutrients
status and human health areknown since time immemorial.Today, most agricultural systemsin the developing world do notprovide enough nutrients. Manyfall short of supplying enoughmicronutrients (14 trace elementsand 13 vitamins) to meet humanneeds, even though the productionof energy and protein via cerealcrops appears to be adequate tofeed the world.
In order to understand therelationship between micro-nutrient supply and human healththere is immense need tounderstand level ofmicronutrients deficiencies insoils. Micronutrients distributionsin soils are often not completelyindependent of each other. Someelements are related to parentmaterials, and these relationsmay persist in soils. Availabilitycan be defined as the quantity of asoil nutrient that is accessible toplant roots over some usefulperiod such as a growing season(48). Because plant rootsaccumulate micronutrientsdirectly from the soil solution, the
Indian Journal of Fertilisers, December 2014
95
total pool of soil micronutrients isnot directly available. Thedistribution of availablemicronutrients is governed byexchange phase, chelated with orcontained in organic matter,adsorbed or fixed on clays,adsorbed or occluded in or onoxide minerals or carbonates, or beconstituents of residual primaryminerals. Distribution of availablemicronutrients including multiplemicronutrients deficiencies isimmensely needed to establishedlink between soil and availablemicronutrients and human health.As the case with plants and soils,Fe and Zn deficiencies are also themost widespread micronutrientdeficiencies in humans.
Georeferenced MicronutrientsDeficiency in Indian Soils
Information on status of micro- andsecondary nutrients for differentsoil types, districts, regions as wellas for the country is highlyessential to determine the natureand extent of their deficiencies/toxicities and to formulatestrategies for their correction aswell as industries. To study thechanges in micronutrients status ofsoils and crops through itscooperating centres, the IndianCouncil of Agricultural Research-All India Coordinated ResearchProject on Micro- and SecondaryNutrients and Pollutant Elementsin Soils and Plants (ICAR-AICRP-MSPE) initiated the work ondelineation of soils in various agro-climatic zones since its inceptionin 1967. Through the intensiveeffort of delineation programme,ICAR-AICRP-MSPE has beencontinuously reporting the statusof micronutrients in soil-plantsystem.
The Global Positioning System(GPS), a space-based satellitenavigation system that provideslocation and time information in allweather conditions, anywhere onor near the earth where there is anunobstructed line of sight to fouror more GPS satellites has helpedenormously to the delineationprogramme taken under AICRP-MSPE. With the advent of GPS
technology, its use in delineationprogrammes has been introducedto collect samples from differentsites under the project since 2009and so far 97,464 soil samples withGPS point-wise data have beencollected from 210 districts of the16 states of the country. The GPSbased soil sampling helps inpreparation of the micronutrientfertility maps which are useful forplanners and policy makers andother stake holders. Besides this,the GPS based technologiesrenders help in revisiting the sitesfor reassessment after an intervalof time.
A soil is considered deficient in agiven nutrient when addition ofthat nutrient as fertiliser producesincreased growth, even though thequantity of nutrient added may besmall compared with the totalamount in the soil (50). Thedeficiency of any nutrient in soil-plant system is quantitativelygoverned by its critical limits.Critical limit of any nutrient in soilsrefers to a level below which thecrops will readily respond to itsapplication. The deficiency andsufficiency level of micronutrientsaccording to the critical limits hasbeen identified by the respectivecentres of ICAR-AICRP-MSPE. Thislevel varies with nutrient, crops,soil, and the extractants used.Critical limits of micronutrientsidentified in a particular soil typemay not be applicable in other soiltypes. For instance, critical limit forZn had been established as 0.60 mgkg-1 soil in almost all the statesexcept in Gujarat (0.50 mg kg-1 soil)and Tamil Nadu (1.20 mg kg-1 soil).Similarly critical limit for Fe variesfrom 3.50 to 7.00 mg kg-1 soil andsame for Cu is established as 0.20mg kg-1 soil except in Bihar andTamil Nadu where in a criticalvalue of 0.60 mg kg-1 soil isconsidered. Likewise the criticalvalue of Mn and Cu in soil alsovaries according to the variation insoil type and agro-climaticsituations.
The availability of cationicmicronutrients (Zn, Fe, Cu and Mn)in soils is assessed throughDiethylene Triamine Pentaacetic
Acid (DTPA) extraction. Thedeficiency of DTPA- micronutrientsvaries widely among soil types,agro climatic conditions, types ofcrops grown and other agronomicpractices. The plant available zincin Indian soils, extracted withDTPA constitutes a very smallportion (<1%) of total zinc. TheDTPA-extractable Zn in Indiansoils ranges from 0.01 to 52.93 mgkg-1 soil. Overall, 43.0% of 97,464samples collected across thecountry were deficient in availableZn. As evident from Table 1deficiency of Zn in different statesvaried among states with aminimum of 1.4% in HimachalPradesh and 9.6% in Uttarakhandto as high as 65.5% in Tamil Nadu.Besides Tamil Nadu, Zn deficiencyin states like Madhya Pradesh(61.7), Maharashtra (54.0) andBihar (41.4), was reported morethan 40%. Almost one third of thesoils of Uttar Pradesh were foundto be deficient in available Zn whileabout every fourth sample waslow in available Zn content instates like Assam, Gujarat, Odisha,Andhra Pradesh and Telangana.Owing to the variations in soiltexture, pH and organic mattercontent of the soils, wide variationsin the proportion of Zn-deficientsoils have been observed indifferent districts within states.
The Fe is another cationicmicronutrient, which limits thegrowth and development of cropswhen not available in sufficientquantity. Since Fe is found in twoforms in the soils viz. Fe2+ and Fe3+,its availability to plant varies fromcropping system and soilcharacteristics. Iron is present insoil in different forms like the poolof immediately available Fe, theavailable Fe, Fe available ondecomposition and potentialmedium to long-term sources ofavailable Fe (19). Though Indiansoils are comparatively rich inplant available Fe, its availabilityin some states like Gujarat,Haryana, Maharashtra, Telanganaand Andhra Pradesh is posingthreat to the crop production. Insoils of different states of thecountry, Fe availability (DTPA-extractable Fe) varies from 0.01 to
Indian Journal of Fertilisers, December 2014
96
1461.70 mg kg-1 soil. Thoughanalysis results of 97,464georeferenced soils samplesindicated that overall Fe deficiencyin India stayed close to 13%, but insome of the states like Gujarat(23.9%), Haryana (21.6%),Maharashtra (21.5%), newlycreated Telangana (17.0) andAndhra Pradesh (16.8%) itsdeficiency is increasing rapidly(Table 1).
The DTPA-extractable Cu contentin soils of different Indian statesranges from 0.02 to 378.70 mg kg-1
soil. While, overall Cu deficiency isless than 6 percent (5.4% to beprecise) however, it is a cause ofconcern in the states like TamilNadu and Uttar Pradesh where13.0 and 6.3%, samples were founddeficient in Cu, respectively.Intensively cultivated states ofnorthern India like Haryana andPunjab are also experiencing Cudeficiency in certain pockets.
Due to its increasing deficiency innorth Indian states like Punjaband Haryana as well as TamilNadu, southern states of thecountry, Mn nutrition has drewattention of stakeholders in
recent years. Available Mn (DTPA-extractable) content in Indian soilswhich varies with croppingpattern and agro-climaticsituations, ranges from 0.01 to444.90 mg kg-1 soil with a meanvalue of 21.78 mg kg-1 soil. Its overalldeficiency in the country has beenanalysed to be 5.5% but itsdeficiency is alarming in Punjab,Tamil Nadu, Haryana andHimachal Pradesh (Table 1).
Boron is another importantmicronutrient limiting productionof many crops in the country.Boron content in soils, which isextracted from soil with hot watervaries from 0.01 to 237.50 mg kg-1
soil with an average of 1.24 mg kg-
1 soil. Owing to B deficiency insoils, yield of almost all the cropsgrown in states like Odisha, WestBengal, Gujarat, Bihar,Maharashtra, Assam and TamilNadu is generally low despiteapplication of recommended doseof N, P, K and Zn fertilisers. Fromthe results of 73,630 samplesanalyzed for hot water available B,deficiency of B in highly calcareoussoils of Bihar and Gujarat and acidsoils of West Bengal, Odisha andJharkhand are more common
(Table 1). Little more than half ofthe samples analyzed from Odishastate fell in the category of low Bavailability.
The major reason of greater Bdeficiency reported in earlier yearswas that researchers have targetedknown problem areas forsampling. Contrasting to that nowmore and more samples arebrought under B analysisirrespective of the problems ofdeficiency reported in plants, thedeficiency percentage has declined.
Multi-micronutrients Deficiency
In recent years, multi-micronutrients containingfertilisers have been availableaplenty in market and are alsobeing used. Above and beyondindividual nutrients deficiency,deficiencies of multiplemicronutrients in crops in Indiansoils due to depletion in fertilityare an emerging issue inagriculture. Though the deficiencyof a single micronutrient prevailscompared to two, three and formicronutrients deficiencies, thetwo micronutrients deficiency incertain states of the country are
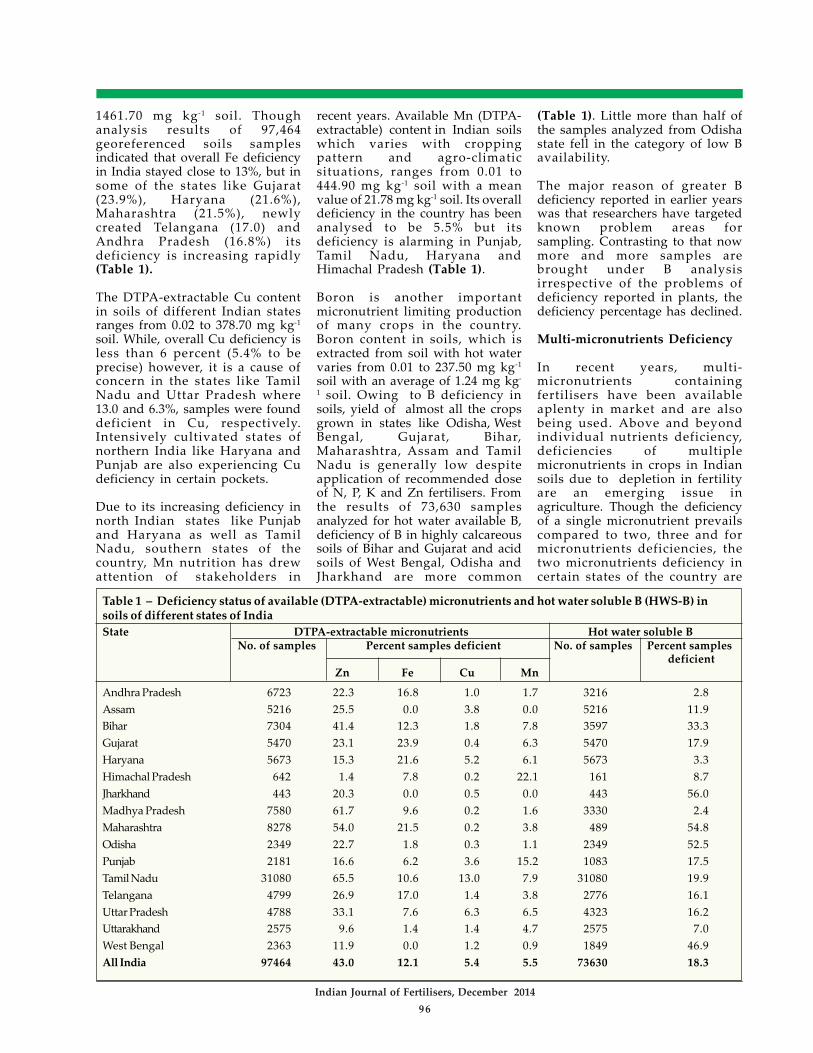
Table 1 – Deficiency status of available (DTPA-extractable) micronutrients and hot water soluble B (HWS-B) insoils of different states of IndiaState DTPA-extractable micronutrients Hot water soluble B No. of samples Percent samples deficient No. of samples Percent samples
deficient Zn Fe Cu Mn
Andhra Pradesh 6723 22.3 16.8 1.0 1.7 3216 2.8Assam 5216 25.5 0.0 3.8 0.0 5216 11.9Bihar 7304 41.4 12.3 1.8 7.8 3597 33.3Gujarat 5470 23.1 23.9 0.4 6.3 5470 17.9Haryana 5673 15.3 21.6 5.2 6.1 5673 3.3Himachal Pradesh 642 1.4 7.8 0.2 22.1 161 8.7Jharkhand 443 20.3 0.0 0.5 0.0 443 56.0Madhya Pradesh 7580 61.7 9.6 0.2 1.6 3330 2.4Maharashtra 8278 54.0 21.5 0.2 3.8 489 54.8Odisha 2349 22.7 1.8 0.3 1.1 2349 52.5Punjab 2181 16.6 6.2 3.6 15.2 1083 17.5Tamil Nadu 31080 65.5 10.6 13.0 7.9 31080 19.9Telangana 4799 26.9 17.0 1.4 3.8 2776 16.1Uttar Pradesh 4788 33.1 7.6 6.3 6.5 4323 16.2Uttarakhand 2575 9.6 1.4 1.4 4.7 2575 7.0West Bengal 2363 11.9 0.0 1.2 0.9 1849 46.9All India 97464 43.0 12.1 5.4 5.5 73630 18.3
Indian Journal of Fertilisers, December 2014
97
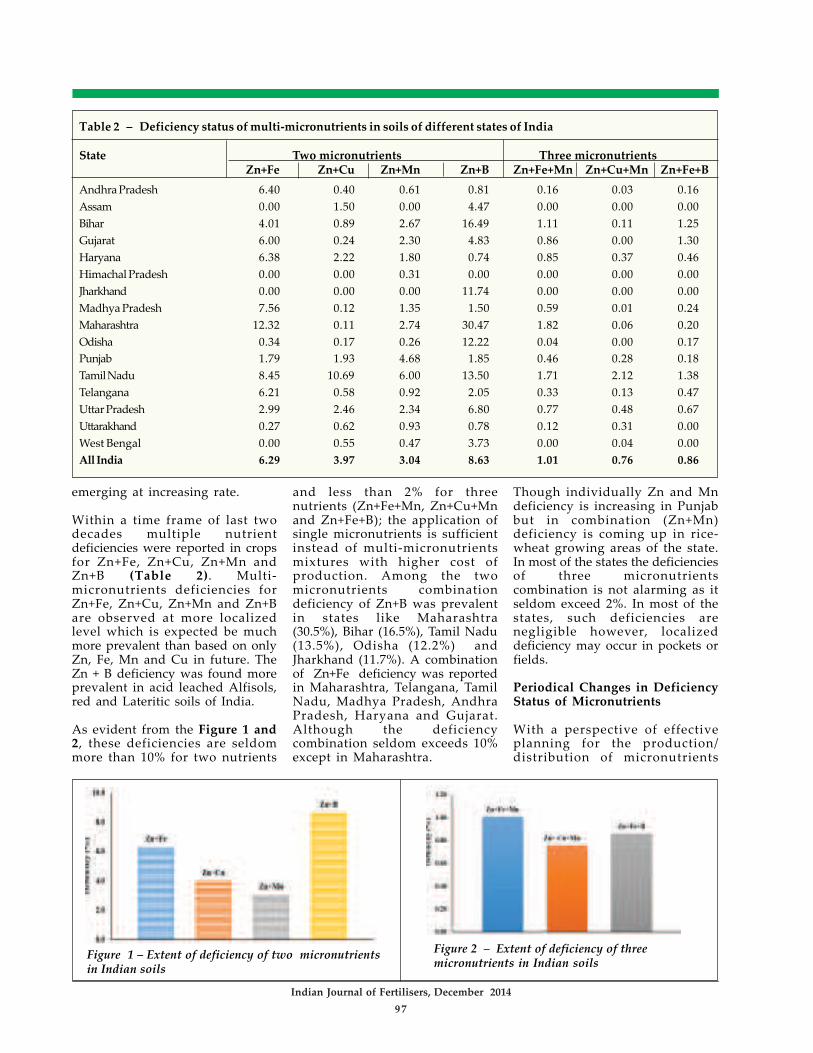
emerging at increasing rate.
Within a time frame of last twodecades multiple nutrientdeficiencies were reported in cropsfor Zn+Fe, Zn+Cu, Zn+Mn andZn+B (Table 2). Multi-micronutrients deficiencies forZn+Fe, Zn+Cu, Zn+Mn and Zn+Bare observed at more localizedlevel which is expected be muchmore prevalent than based on onlyZn, Fe, Mn and Cu in future. TheZn + B deficiency was found moreprevalent in acid leached Alfisols,red and Lateritic soils of India.
As evident from the Figure 1 and2, these deficiencies are seldommore than 10% for two nutrients
and less than 2% for threenutrients (Zn+Fe+Mn, Zn+Cu+Mnand Zn+Fe+B); the application ofsingle micronutrients is sufficientinstead of multi-micronutrientsmixtures with higher cost ofproduction. Among the twomicronutrients combinationdeficiency of Zn+B was prevalentin states like Maharashtra(30.5%), Bihar (16.5%), Tamil Nadu(13.5%), Odisha (12.2%) andJharkhand (11.7%). A combinationof Zn+Fe deficiency was reportedin Maharashtra, Telangana, TamilNadu, Madhya Pradesh, AndhraPradesh, Haryana and Gujarat.Although the deficiencycombination seldom exceeds 10%except in Maharashtra.
Though individually Zn and Mndeficiency is increasing in Punjabbut in combination (Zn+Mn)deficiency is coming up in rice-wheat growing areas of the state.In most of the states the deficienciesof three micronutrientscombination is not alarming as itseldom exceed 2%. In most of thestates, such deficiencies arenegligible however, localizeddeficiency may occur in pockets orfields.
Periodical Changes in DeficiencyStatus of Micronutrients
With a perspective of effectiveplanning for the production/distribution of micronutrients
Table 2 – Deficiency status of multi-micronutrients in soils of different states of India
State Two micronutrients Three micronutrientsZn+Fe Zn+Cu Zn+Mn Zn+B Zn+Fe+Mn Zn+Cu+Mn Zn+Fe+B
Andhra Pradesh 6.40 0.40 0.61 0.81 0.16 0.03 0.16Assam 0.00 1.50 0.00 4.47 0.00 0.00 0.00Bihar 4.01 0.89 2.67 16.49 1.11 0.11 1.25Gujarat 6.00 0.24 2.30 4.83 0.86 0.00 1.30Haryana 6.38 2.22 1.80 0.74 0.85 0.37 0.46Himachal Pradesh 0.00 0.00 0.31 0.00 0.00 0.00 0.00Jharkhand 0.00 0.00 0.00 11.74 0.00 0.00 0.00Madhya Pradesh 7.56 0.12 1.35 1.50 0.59 0.01 0.24Maharashtra 12.32 0.11 2.74 30.47 1.82 0.06 0.20Odisha 0.34 0.17 0.26 12.22 0.04 0.00 0.17Punjab 1.79 1.93 4.68 1.85 0.46 0.28 0.18Tamil Nadu 8.45 10.69 6.00 13.50 1.71 2.12 1.38Telangana 6.21 0.58 0.92 2.05 0.33 0.13 0.47Uttar Pradesh 2.99 2.46 2.34 6.80 0.77 0.48 0.67Uttarakhand 0.27 0.62 0.93 0.78 0.12 0.31 0.00West Bengal 0.00 0.55 0.47 3.73 0.00 0.04 0.00All India 6.29 3.97 3.04 8.63 1.01 0.76 0.86
Figure 1 – Extent of deficiency of two micronutrientsin Indian soils
Figure 2 – Extent of deficiency of threemicronutrients in Indian soils

Indian Journal of Fertilisers, December 2014
98
carrying fertilisers in the areaswhere it is really required, thezone-wise deficiency of themicronutrients have been workedout from the above data andcompared with the earlier data(Table 3). The deficiency of Zn indifferent zones has changed by asignificant margin, for example theZn deficiency has gone downconsiderably in northern andeastern parts of the country whileit has increased in western stateslike Gujarat, Maharashtra andparts of Madhya Pradesh. Thechanges in Zn status in soils ofsouthern states has not been in theline of other parts like north Indian.Since Fe deficiency is linked withsoil moisture regime, as theirrigation facilities has increased innorthern and southern part of thecontrary. Consequently, in recentyears, increase in Fe deficiency inwestern and eastern states(especially Bihar) has beenobserved while decline in othertwo zones has been noticed. Onaverage, not much change in Custatus was observed but regionalchanges has been seen clearly. TheCu deficiency has declined inwestern parts due to use ofmicronutrients mixtures and Cucontaining pesticides. Increase ofCu deficiency in southern zonemay be explained due to adoptionof higher critical limit in TamilNadu. The increasing Mndeficiency in northern state likePunjab, Haryana and HimachalPradesh has necessitated itsapplication in crops like wheat andrice.
Micronutrients Mapping
Soil micronutrient maps coveringlarge areas improve our
understanding of the nature andextent of micronutrient problems,and aid in determining theirrelationships with climate, soilproperties, and soil geneticcharacteristics. Micronutrientavailability to plants can bemeasured in direct uptakeexperiments, or estimated withtechniques that correlate quantitiesof micronutrients extractedchemically from soils to plantuptake and response tomicronutrient fertilization.Rational management ofmicronutrient fertility and toxicityrequires an understanding of howtotal and plant-available soilmicronutrients vary across theland. Based on large experimentalevidences it has been concludedthat the total content ofmicronutrients per se is a poorpredictor of their supplying powerto the plants and the availablemicronutrient pool that representsthe native level of plant usableforms is more often the basis todecide on the occurrence ofdeficiency or sufficiency status (20,40, 36).
A variety of approaches have beenused to survey and map thegeographic distribution of soilmicronutrients contents andavailability at scales ranging fromglobal to sites within singleproduction fields. These maps canbe useful in delineating specificareas where deficiencies ortoxicities are likely for agriculture,and in determining localized needof specific micronutrient fertiliserand to establish relationshipsbetween soil micronutrientcontent and some human andlivestock health problems.Advances including the global
positioning system (GPS),geographic information systems(GIS), inductively coupled plasma(ICP) spectrometry, andgeostatistics, facilitate soilmicronutrients mapping andprovide quantitative support fordecision and policy making toimprove agricultural approachesto balanced micronutrientnutrition and precisionagriculture. In this paper we haveused information gathered fromdifferent AICRP (MSPE) reports forthe period of 2004 to 2014 and someinformation downloaded fromwebsite [email protected]. We haveprepared micronutrients (Zn, Fe,Cu, Mn and B) deficiency statusmaps for farmers, planners, policymakers and other stake holders,especially fertiliser manufacturer/supplier so that proper use ofmicronutrient should be ensuredfor maximum economic gain andquality produce (micronutrientsenriched food).
Mapping Zn Deficiency Status
Maps of Zn deficiency has beenprepared based on the currentstatus of Zn availability in soils ofthe different districts. Map 1depicted Zn deficiency status insoils examined from 379 districtsof the country revealed that 84districts, particularly in acid soilsof states like Himachal Pradesh,West Bengal, Odisha, Kerala,Uttarakhand and Karnataka fall inthe category where Zn deficiencyis reported to be less than 10%.Some districts of Haryana andPunjab also fall in this range dueto regular use of Zn fertiliser inthese states. Fifty three districts fallin the range where Zn deficiencystatus varied from 10-20%, 44
Table 3 – Periodical changes in deficiency status of available (DTPA-extractable) micronutrients insoils of different zones of India
Zones No. of samples 1980- 2008* No. of samples 2009-2014 Zn Fe Cu Mn Zn Fe Cu Mn
East 54061 47.3 0.4 1.4 4.9 17675 29.8 5.3 2.1 3.5North 64906 51.2 12.8 1.3 3.1 15859 19.3 11.4 4.5 7.9South 68863 59.9 21.6 5.1 9.6 42602 54.3 12.3 9.8 6.5West 63717 34.7 7.6 19.4 2.4 21328 48.8 17.9 0.2 3.6All India 251547 48.6 11.2 7.0 5.1 97464 43.0 12.1 7.0 5.5*Source: AICRP-MSPE database.

Map 1 – Spatial variation in available Zn deficiency status in soils ofdifferent districts of India
districts in 20-30%, 38 districts in30-40% and 40 districts in thecategory of 40-50%. Even afterregular use of Zn fertiliser in manyparts of the country Zn deficiencyin 120 districts is more than 50%,indicating about one third soils ofthe country. Most of the districtsfall in states like Tamil Nadu,Madhya Pradesh, Maharashtra,Bihar, some part in Uttar Pradesh,Gujarat and Rajasthan.Surprisingly, six districts in Punjab(Ferozpur, Kapurthala, Mansa,Muktsar, Roopnagar and Sangrur)are shown with more than 50%deficiency, however, the average Zndeficiency of the states has declinedfrom 49 to 17%. Although Zndeficiency is reported less in acidsoils but three districts (Angul,
Bhadrak and Boudh) of Odisha alsofall in this category.
Data depicted in maps of Zndeficient soil areas in Indiaindicated that about one-third ofthe country’s vast area was acutedeficient in Zn. Earlier theincidence of zinc deficiency wereobserved more in cereal belts of thecountry, particular rice and wheatgrowing areas (21) now thedistribution of Zn deficiency haschanged and has extended to coarsecereals and pulse growing areastoo. On average, Zn deficiency hasdeclined in northern parts of thecountry and increased in westernand Sothern parts of the country.Increased Zn deficiencies in areaswhere low deficiency was reported
earlier, developing over time due tointensification of agriculturalsystems inducing imbalance use ofmacronutrient, increasing Zndemand of new cultivars, alteringZn availability, and hasteningdepletion of readily-available soilZn pools. Soil mining of Zn byagricultural crops should not be aconcern except in those rare casesof extremely low total soil Zncontent.
Mapping Fe Deficiency Status
Indian soils are high in total andavailable iron content rangingfrom 4000-273000 mg kg-1 and thatof available iron 0.36-174 mg kg-1
soil. Availability of Fe is low inalkaline soils, which make upapproximately 30% of the earths.Many alkaline soils also have highbicarbonate concentration, whichcan inhibit Fe uptake. Generallyacid and lateritic soils have highavailable iron content, sometimeits level become toxic to manycrops. Usually Fe deficiency isrelated to water stress condition inIndia. Results of the soil samplesanalysed from 371 districts of thecountry indicated that more thanhalf of the districts are having Fedeficiency less than 5% (Map 2).Only 12-15% districts come underhigh Fe deficiency status in stateslike, Maharashtra, Gujarat,Rajasthan, Haryana, Punjab,Madhya Pradesh and Tamil Nadu.Some pockets of Uttar Pradesh(Bareilly, Hamirpur, Banda, andShahjahanpur), Bihar (Begusarai,Samastipur and Vaishali) andAndhra Pradesh (Anantapur,Kurnool and Prakasham) also haveas high as 20-30% Fe deficiency. Feavailability is poor in soils of aridand semiarid regions,consequently its content is also lowin forage and grains grown in theseareas as compared to those grownin soils of humid and sub humidregions.
Though there is no strong relationexisting between Fe availability insoil and occurrence of iron anaemiain human (particularly, adolescentgirls and pregnant ladies) invarious parts of the country.Prevalence of anaemia was
Indian Journal of Fertilisers, December 2014
99

reported in 84.9% women in 16districts in 11 states of Indiathough the soils of these districtsare not so poor in plant availableiron (24). Prevalence of irondeficiency anaemia (IDA) is stillreported wide spread in womanand children, as a majormicronutrient disorder problem inseveral parts of the country (33).Severe iron anaemia was found in34% in adolescent girls of Bikaner,Rajasthan and Gujarat (33). Theindications are not so strong thatareas having acidic and lateriticsoils are less prone to irondeficiency disorder because amajor part of iron absorbed by therice plants remained in the leaf andis not translocated to the seed andfurther to human system.
Prevalence of anaemia in womenwas noticed in 60-70% in Mandi,Dehradun, Kohima districtswhereas 70-80% anaemic womenin Lakhimpur Kheri, Badaun andBishnupur (41).
Mapping Mn deficiency status
Indian soils are adequate in Mn andits concentration varied from 37 to11500 mg kg-1 and available status0.6-164 mg kg-1 to support optimumcrop growth (42). Of the soilsamples analysed from 373districts more than 75% are shownwith less than 5 % Mn deficiency.Some districts in Punjab, Haryana,Tamil Nadu, Rajasthan and UttarPradesh shown with Mn deficiencymore than 25% (Map 3). Manganese
availability issue is predominantover soil Mn content for better cropyield, particularly on calcareoussoils (48). Reduction of Mn4+ form(plant unavailable form) to Mn2+
(plant available form) is eitherbiological or chemical in nature.Manganese deficiency is difficult toovercome by fertilisers as theadded Mn is quickly converted tounavailable oxidized form (12). TheMn deficiency can be overcome byfoliar application of 0.5-1% (w/v)MnSO4.H2O solution, but it has tobe applied repeatedly (3-4 times)and it may also prove less efficientunder severe Mn deficiencyconditions. In Punjab state of India,rice-wheat cropping system hasexhausted most of themicronutrient reserves. Leachinglosses of manganese (Mn) after ricecultivation is the primary factor ofupcoming Mn deficiency in wheatthat has imposed a threat on yield.Mn deficiency in soils ranges fromnegligible to as high as 67% inBhatinda, Punjab. Prevalence ofMn deficiency in wheat grown insandy soils of Punjab, Haryana andUttar Pradesh is increasing due toleaching of soluble Mn to lowerlayers during submergence of ricein rice-wheat system (41, 24). Theaverage Mn deficiency in thisregion has been reported to be 22%.Wheat grown in more than 3 lakhha of coarse textured soils of Punjabshowed high responses to Mnfertilization ranging from 200-2960kg ha-1. Foliar sprays of 0.5-1.0%manganese sulphate solution 2-3times are found more efficient forameliorating its deficiency inwheat than its broadcasting to soil(24). Jaisalmer and Churu inRajasthan, Villupuram, Dindigul inTamil Nadu, Ranga Reddy inTelangana, Badaun, Bijnor andShahjahanpur in Uttar Pradesh,Rudra Prayag in Uttarakhand andJagatsinghpur in Odisha are majorMn deficient districts, Mndeficiency varied from 25 to 67%.Sometimes, Mn toxicity is reportedin crops grown on acid and lateriticsoils (42).
In human, Manganese deficiencyleads to glucose intolerance, blooddotting, skin problems, loweredcholesterol levels, skeleton
Map 2 – Spatial variation in available Fe deficiency status in soils ofdifferent districts of India
Indian Journal of Fertilisers, December 2014
100

Map 3 – Spatial variation in available Mn deficiency status in soils ofdifferent districts of India
disorders, birth defects, changes ofhair color and other neurologicalsymptoms. Crops like wheatgrown in Mn deficient soils orhidden hunger of Mn are not onlyproduce low yields but lead toinfertility in cattle due to low Mncontent in fodders and grain. Theevidence increased infertility wererecorded in cattle fed with low Mnfodder grown in low Mn highlycalcareous soils (free CaCO3 20-48%) around Pusa, Bihar (41). Theproductivity of these animals werelow and their blood serum Mnconcentration was also lower ascompared to cattle fed on foddersgrown in Mn adequate soils.Though least information isavailable regarding Mn deficiency
in human however, suchrelationship need to be establishedso that consequences of emergingMn deficiency on human could beaddressed duly in time.
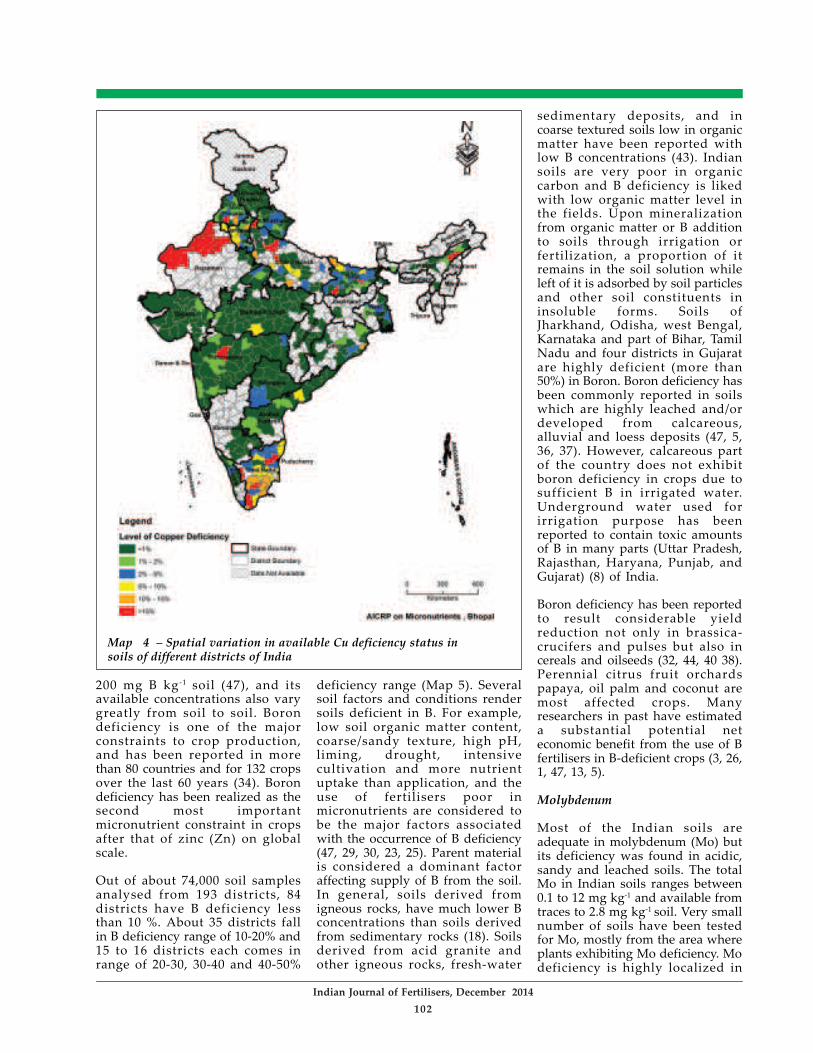
Mapping Cu Deficiency Status
Total copper content in soil rangedfrom 1.8-960 mg kg-1 and that ofavailable content 0. 10 to 378 mgkg-1 (38). Copper deficiency is not asevere problem in India, and onlyabout 5-6 percent soils were founddeficient in 97,000 georeferencedsoil samples tested during 2009-14.Out of 379 districts, 246 districtshave Cu deficiency less than 1%.Thus most of the soils do notrespond to copper fertilization
except peat and Mollisols soilshaving high organic mattercontents. Crop managementfactors do affect copperconcentration in the edible parts ofplants. Copper toxicity is reportedin copper mining areas and someacid soils. Continuous applicationof Cu based fertiliser and pesticidesmay accumulate excess Cu inplants. In some districts of Haryana(Karnal-10.80%, Mohindergarh-13.0%), Tamil Nadu (Kanyakumari-13.3%, Pudukkottai-11.7%,R a m a n a t h a p u r a m - 1 1 . 6 % ,Sivagangai-13.7%, Theni-14.9%,Dindigul-12.2% and Tuticorin-14.10%), Uttar Pradesh (Kannauj-10.5%, Banda-11.0% and Mathura-13.0%) and one districts of Punjab(Sangrur-12%) Cu deficiency isincreasing and it ranged from 10-15% (Map 4).
The Cu deficiency was recordedhighest in Tamil Nadu due toadoption of higher critical limit(0.60-1.20). Though the Cu contentis usually higher in acid and lateritesoils, however, one district each inBihar (West Champaran-11.50%),Odisha (Kendrapara-12%) and twodistricts in Assam ( Jorhat-18.5%and Sibsagar- 23.2%) werereported to have Cu deficiency ofabout 10-20%. Some districts likeArwal, Aurangabad and Khagariain Bihar, Bikaner, Churu, Jaisalmerand Sri Ganganagar in Rajasthan;Coimbatore, Madurai,Thirunelveli, Villupuram in TamilNadu and Farrukhabad,Lakhimpur, Badaun,Shahjahanpur and Bareli in UttarPradesh showed Cu deficiencymore than 25%. Hence, there isneed to apply Cu fertilisers inthese districts. In human,neutropenia and leucopoenia,skeletal defects and degradationof nervous system (28), defectivemelanin synthesis whichmanifests as depigmentation orhypopigmentation (lack of colour)of hair and skin, keratinization ofhair, steely hair are sign of copperdeficiency (11).
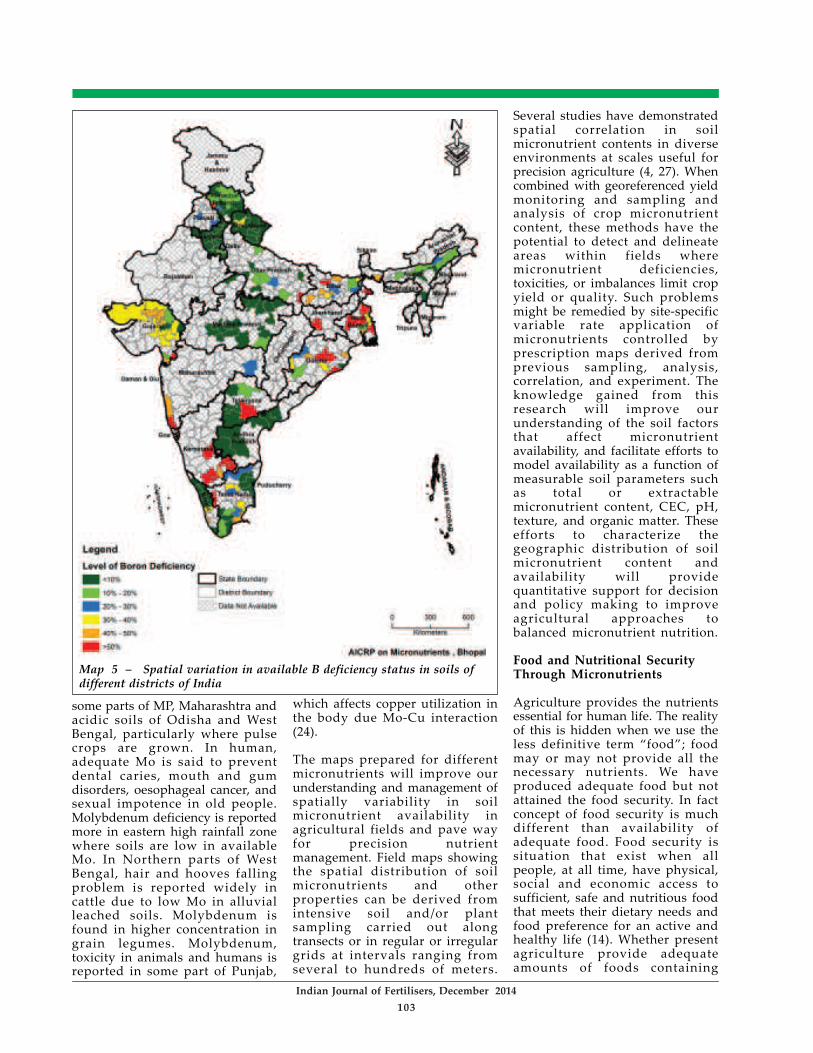
Mapping B Deficiency Status
In soils, concentration of total B isreported to be in the range of 20 to
Indian Journal of Fertilisers, December 2014
101
200 mg B kg -1 soil (47), and itsavailable concentrations also varygreatly from soil to soil. Borondeficiency is one of the majorconstraints to crop production,and has been reported in morethan 80 countries and for 132 cropsover the last 60 years (34). Borondeficiency has been realized as thesecond most importantmicronutrient constraint in cropsafter that of zinc (Zn) on globalscale.
Out of about 74,000 soil samplesanalysed from 193 districts, 84districts have B deficiency lessthan 10 %. About 35 districts fallin B deficiency range of 10-20% and15 to 16 districts each comes inrange of 20-30, 30-40 and 40-50%
deficiency range (Map 5). Severalsoil factors and conditions rendersoils deficient in B. For example,low soil organic matter content,coarse/sandy texture, high pH,liming, drought, intensivecultivation and more nutrientuptake than application, and theuse of fertilisers poor inmicronutrients are considered tobe the major factors associatedwith the occurrence of B deficiency(47, 29, 30, 23, 25). Parent materialis considered a dominant factoraffecting supply of B from the soil.In general, soils derived fromigneous rocks, have much lower Bconcentrations than soils derivedfrom sedimentary rocks (18). Soilsderived from acid granite andother igneous rocks, fresh-water
sedimentary deposits, and incoarse textured soils low in organicmatter have been reported withlow B concentrations (43). Indiansoils are very poor in organiccarbon and B deficiency is likedwith low organic matter level inthe fields. Upon mineralizationfrom organic matter or B additionto soils through irrigation orfertilization, a proportion of itremains in the soil solution whileleft of it is adsorbed by soil particlesand other soil constituents ininsoluble forms. Soils ofJharkhand, Odisha, west Bengal,Karnataka and part of Bihar, TamilNadu and four districts in Gujaratare highly deficient (more than50%) in Boron. Boron deficiency hasbeen commonly reported in soilswhich are highly leached and/ordeveloped from calcareous,alluvial and loess deposits (47, 5,36, 37). However, calcareous partof the country does not exhibitboron deficiency in crops due tosufficient B in irrigated water.Underground water used forirrigation purpose has beenreported to contain toxic amountsof B in many parts (Uttar Pradesh,Rajasthan, Haryana, Punjab, andGujarat) (8) of India.
Boron deficiency has been reportedto result considerable yieldreduction not only in brassica-crucifers and pulses but also incereals and oilseeds (32, 44, 40 38).Perennial citrus fruit orchardspapaya, oil palm and coconut aremost affected crops. Manyresearchers in past have estimateda substantial potential neteconomic benefit from the use of Bfertilisers in B-deficient crops (3, 26,1, 47, 13, 5).
Molybdenum
Most of the Indian soils areadequate in molybdenum (Mo) butits deficiency was found in acidic,sandy and leached soils. The totalMo in Indian soils ranges between0.1 to 12 mg kg-1 and available fromtraces to 2.8 mg kg-1 soil. Very smallnumber of soils have been testedfor Mo, mostly from the area whereplants exhibiting Mo deficiency. Modeficiency is highly localized in
Map 4 – Spatial variation in available Cu deficiency status insoils of different districts of India
Indian Journal of Fertilisers, December 2014
102
some parts of MP, Maharashtra andacidic soils of Odisha and WestBengal, particularly where pulsecrops are grown. In human,adequate Mo is said to preventdental caries, mouth and gumdisorders, oesophageal cancer, andsexual impotence in old people.Molybdenum deficiency is reportedmore in eastern high rainfall zonewhere soils are low in availableMo. In Northern parts of WestBengal, hair and hooves fallingproblem is reported widely incattle due to low Mo in alluvialleached soils. Molybdenum isfound in higher concentration ingrain legumes. Molybdenum,toxicity in animals and humans isreported in some part of Punjab,
which affects copper utilization inthe body due Mo-Cu interaction(24).
The maps prepared for differentmicronutrients will improve ourunderstanding and management ofspatially variability in soilmicronutrient availability inagricultural fields and pave wayfor precision nutrientmanagement. Field maps showingthe spatial distribution of soilmicronutrients and otherproperties can be derived fromintensive soil and/or plantsampling carried out alongtransects or in regular or irregulargrids at intervals ranging fromseveral to hundreds of meters.
Several studies have demonstratedspatial correlation in soilmicronutrient contents in diverseenvironments at scales useful forprecision agriculture (4, 27). Whencombined with georeferenced yieldmonitoring and sampling andanalysis of crop micronutrientcontent, these methods have thepotential to detect and delineateareas within fields wheremicronutrient deficiencies,toxicities, or imbalances limit cropyield or quality. Such problemsmight be remedied by site-specificvariable rate application ofmicronutrients controlled byprescription maps derived fromprevious sampling, analysis,correlation, and experiment. Theknowledge gained from thisresearch will improve ourunderstanding of the soil factorsthat affect micronutrientavailability, and facilitate efforts tomodel availability as a function ofmeasurable soil parameters suchas total or extractablemicronutrient content, CEC, pH,texture, and organic matter. Theseefforts to characterize thegeographic distribution of soilmicronutrient content andavailability will providequantitative support for decisionand policy making to improveagricultural approaches tobalanced micronutrient nutrition.
Food and Nutritional SecurityThrough Micronutrients
Agriculture provides the nutrientsessential for human life. The realityof this is hidden when we use theless definitive term “food”; foodmay or may not provide all thenecessary nutrients. We haveproduced adequate food but notattained the food security. In factconcept of food security is muchdifferent than availability ofadequate food. Food security issituation that exist when allpeople, at all time, have physical,social and economic access tosufficient, safe and nutritious foodthat meets their dietary needs andfood preference for an active andhealthy life (14). Whether presentagriculture provide adequateamounts of foods containing
Map 5 – Spatial variation in available B deficiency status in soils ofdifferent districts of India
Indian Journal of Fertilisers, December 2014
103

enough nutrients in balance tomeet human needs is a questionmark. Thus, providing enough fooddoes not necessarily mean that thefood produced will supply enoughof all the nutrients needed tosupport good health. This appearsto be the case for the agriculturalsystems fostered during the ‘greenrevolution’. Indian population ismostly fed upon rice and wheatcereals. While whole cereal grainsprovide enough carbohydrates(calorie) and protein to stave offfamine, they do not provide enoughof all the utilizable micronutrientsneeded to sustain life, being verylow in bioavailable amount ofmicronutrients (especially Zn andFe) compared to other staple foodcrops, like pulse. Healthperspective has rarely beenstudied for many of the elementsthat are required for human healthcome from the soil through eitherplant or animal product elementsmay also be required directlythrough the consumption of soils.Micronutrients deficiencies is agrowing concern in the India,resulting in low productivity andpoor nutritional quality of produce,which in turn causing diversehealth problems in human being,such as stunted growth in children,
mental retardations, impairmentsof the immune system, rickets,osteoporosis, muscular dystrophyand overall poor health. Tacklingmicronutrient malnutrition inhumans is the priority. To aquestion “If you had 75 billiondollars to improve the world, howwould you best spend it?” a panelof ten distinguished economists ofthe world, who had met to ponderover urgent global challengesfacing the world, raised atCopenhagen Consensus, 2008unanimously answered, “Reducemicronutrient malnutrition”.Problem of micronutrientmalnutrition was categoricallyemphasized because more thanhalf of the humanity - mostly thepoor in developing countries -suffers from the devastatingconsequences of micronutrientmalnutrition. No other problem ofthis magnitude is afflicting such ahuge portion of the worldpopulation. According to WHO(2002), deficiencies of zinc and ironoccupy 5th and 6th place,respectively among top ten leadingcauses of illness and diseases in lowincome countries (53).
Essential nutrients that end up inthe human diet are supplied
through food from either plantsthat took the elements up from thesoil during growth or animalproducts often the animal obtainedthose essential elements fromplants. Because plants depend onthe soil for their nutritional needs,and all higher animals includinghuman depend directly orindirectly on plants for theirnutrition, plants from the bare ofthe food chain and, consequently, amajor portion of the nutrientsneeded for human health originatewith the soil. Emphasis in thearticle has been on linking thesetwo elements to human nutritionwhile soil health has been dealt forall the micronutrients.
Contribution of Zn to Food CropProduction
The proper Zn managementcontribute to major food graincrops is estimated 18.44 milliontonnes (economic value of Rs. 21,1619 million), which may furtherenhance to 24.85 million tonnes riceequivalent yield (economic value ofRs. 23, 2119 million) whensugarcane, cotton and potato arealso provided with Zn fertilization(Table 4) . In recent years, Znenrichment in food grains has also
Table 4 – Contribution of Zn towards production of major crops in India
Sl. No. Crops Average Area under Percentage are Contribution of Economic gain response to crop(M ha) a receiving Zn Zn to crop due to Zn Zn application production*(MT) fertilisation** (t ha-1) (Rs. in million)
1. Rice 0.54 43.91 50 11.86 12,80,882. Wheat 0.42 28.04 30 3.53 39,5363. Maize 0.47 8.12 35 1.33 13,0344. Sorghum 0.36 7.76 10 0.28 2,7445. Pearl millet 0.19 9.57 02 0.19 1,8626. Gram 0.36 7.54 05 0.13 2,7307. Green gram 0.26 3.10 05 0.04 1,4008. Black gram 0.24 2.97 05 0.03 9909. Pigeon pea 0.26 3.51 05 0.04 1,28010. Groundnut 0.32 6.29 15 0.30 8,10011. Soybean 0.36 8.88 20 0.64 10,56012. Mustard 0.27 5.40 05 0.07 1,295Major crops 18.44 21,16,1913. Cotton 0.22 9.41 10 0.20 5,60014. Sugarcane 3.77 5.05 20 3.81 5,30015 Potato 2.96 1.80 45 2.40 9,600Total 24.85 23,21,19* Contribution of Zn to crop production was obtained by multiplying average response with area under crop and percentage areareceiving Zn. Average response of each crop was calculated by averaging the responses obtained in thousands of experiments.**Economic gain due to Zn fertilisation was estimated by multiplying contribution of Zn to crop production with minimum supportprice for each commodity for the year 2011. Wholesale price of Rs. 4.00/- per kilogram was considered for calculation in caseof potato. Source : (36)
Indian Journal of Fertilisers, December 2014
104

been realized a better option formaintaining animal and humanhealth in addition to soils andplants.
Economic Well-being andMicronutrients Access
Though the economic theorypredicts that with increasedincome, individuals should be ableto purchase more food anddiversify their diets, especiallywith animal products, therebyimproving their micronutrientstatus. But this does not appear tobe the case. For example, in Asia theavailability of iron in food hasdeclined even though income (2)and the availability and intake offoods containing high amounts ofenergy (i.e., cereals) have risensignificantly. At the same time, irondeficiency in women, infants, andchildren in resource-poor familieshas risen dramatically. Indeed, inSouth East Asia, iron deficiencynow afflicts 98.2 % (over 1.4 billion)of the people in that region. Withinthe developing world, seriousvitamin and trace elementdeficiencies persist and are notnecessarily corrected by increasedincome within an acceptableperiod of time (2). Study conductedin India revealed that widespreaddeficiencies of Zn in Indian soilsand crops, low Zn concentrationswere found particularly in thediabetic and diabetic-ulcerpatients than normal surgicalpatients without metabolicdiseases, however, most of thediabetic patients were richer thannormal population (33). Similarly,prevalence of anaemia particularlyin women was reported across thecountry; although there is nostrong relationship between ironavailability in soil, economic statusof people and occurrence of ironanaemia in some cases (41). The Zndeficiency in human population iswidespread in India (7) however,economic well-being has improvedin last decade. Thoughmicronutrients are needed in smallquantities (i.e., micrograms tomilligrams per day), they haveincredible impact on human healthand well-being. Insufficientdietary intakes of these nutrients
impair the functions of the brain,the immune and reproductivesystems and energy metabolism.These deficiencies result in learningdisabilities, reduced workcapacity, serious illnesses, anddeath. Micronutrient malnutritionis a serious global affliction thatlimits the work capacity of peopleand seriously hinders economicdevelopment (2). Dysfunction ofthe food system from lowmicronutrient output is affectingmore people every day, forexamples global trends in irondeficiency anaemia, (9).Agricultural systems mustincrease micronutrient outputs asa primary tool to eliminatemicronutrient malnutrition (10,50). Finding sustainable solutionsto this developing globalnutrition crisis will not be possiblewithout the cooperation ofagriculture.
Linking Soil Micronutrients andHuman health
The foundation of human health islaid on the quality of food we eat,which relies ultimately on thevitality of the soil on which it israised. Soils seriously deficient inminerals cannot produce plantlife competent to maintain ourneeds and with the continuouscropping and shipping away ofthose concentrates the conditionbecome worse. Nobel Prizewinner, Dr. Alexis Carrel statedthat minerals in the soil controlthe metabolism of plants, animalsand man. Accordingly, life will beeither healthy or unhealthydepending upon plant availablenutrients in the soil. Soils withoutmineral nutrients cannot produceplants with minerals. Due torampant deficiency ofmicronutrients in agriculturalsoils, food grown in these soils lackin the amount of nutrients neededto maintain human health. Thefood we consume has lost thenutrients we need for good healthvalues in food over the past severaldecades. Most vegetables and fruitshave lost substantial vitamin andmineral content during the lastforty years. Our food system israpidly losing its ability to
produce food with nutrient levelssuf-ficient to maintain health.Zinc deficiency is a well-recognized micronutrientdeficiency problem both inhuman populations and in cropproduction globally (7). It isestimated that nearly half of thesoils on which food crops aregrown, are deficient in plantavailable Zn (41, 36), leading toreductions in crop production andalso nutritional quality of theharvested grains (35, 37). Sincecereal grains/seeds containinherently very low amount of Zn,growing them on potentially Zn-deficient soils further decreasesgrain Zn concentrations. Sincecereal-based foods Rice and wheatare the major source of dailycalorie intake hence widespreadoccurrence of Zn deficiencyreported in human populations inIndia. Studies conducted under AllIndia Micronutrient Project inNalgonda and Ranga Reddydistricts in Andhra Pradeshindicated that soils having lowzinc status produced plant, grainswith lower zinc content. Peoplefeeding on such grains and othervegetation showed lower zinccontent in their blood plasmacompared to areas which had highavailable zinc status and lowerzinc deficiency in soil (41). Severeiron anaemia was found in 34% inadolescent girls of Bikaner,Rajasthan and Gujarat (33). Theconcentration of Zn, Cu, Fe and Mnin drinking water and soil iscorrelated with dental caries in1516 children (7 to 17 years age) in10 rural areas in the district ofLudhiana (17). There is an urgentneed to replenish the nutrient in topsoil and increase the nutritionalvalues of harvested food to sustainhuman health. Crops requireminerals and organic materials totransform nutrients into formsthat plants can use for growth.Without minerals and soil organicmatter it is impossible to sustain ahealthy crop which is the basis forthe nutrition values of animals andhuman. Unless growers replenishnutrients, the mineral content ofharvested food will continue todecrease. The decline in nutritionalquality of food has been linked to
Indian Journal of Fertilisers, December 2014
105
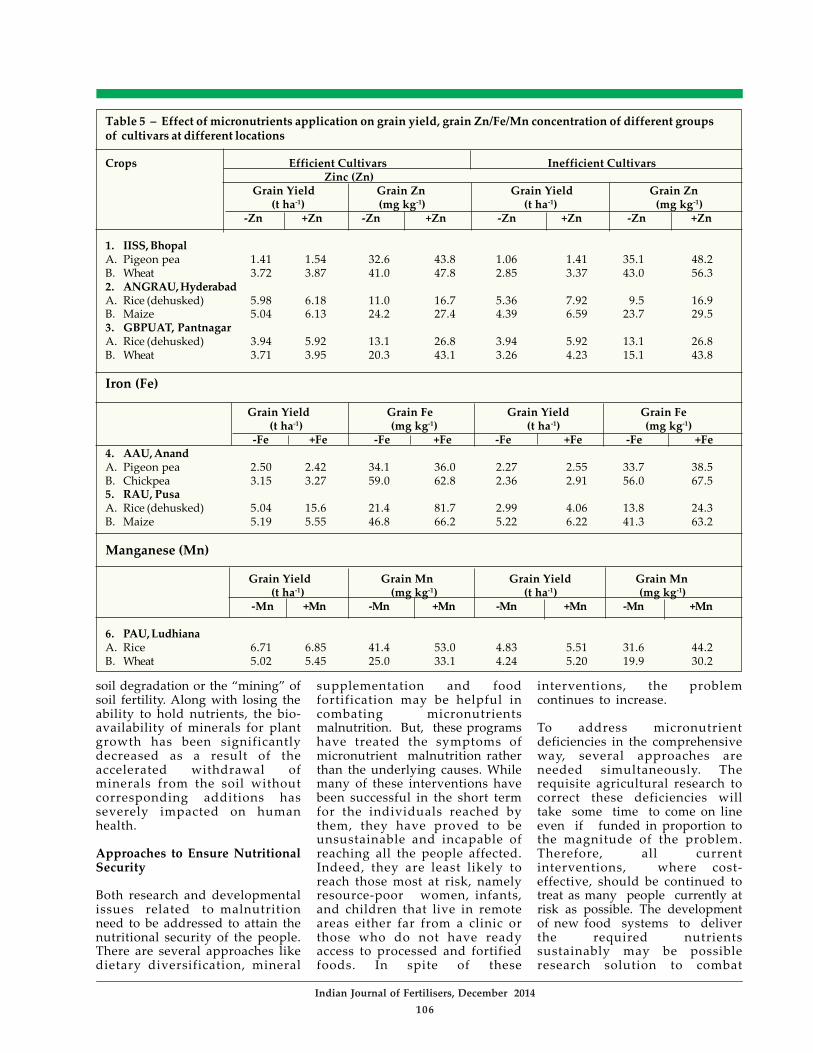
Table 5 – Effect of micronutrients application on grain yield, grain Zn/Fe/Mn concentration of different groupsof cultivars at different locations
Crops Efficient Cultivars Inefficient Cultivars Zinc (Zn) Grain Yield Grain Zn Grain Yield Grain Zn (t ha-1) (mg kg-1) (t ha-1) (mg kg-1) -Zn +Zn -Zn +Zn -Zn +Zn -Zn +Zn
1. IISS, BhopalA. Pigeon pea 1.41 1.54 32.6 43.8 1.06 1.41 35.1 48.2B. Wheat 3.72 3.87 41.0 47.8 2.85 3.37 43.0 56.32. ANGRAU, HyderabadA. Rice (dehusked) 5.98 6.18 11.0 16.7 5.36 7.92 9.5 16.9B. Maize 5.04 6.13 24.2 27.4 4.39 6.59 23.7 29.53. GBPUAT, PantnagarA. Rice (dehusked) 3.94 5.92 13.1 26.8 3.94 5.92 13.1 26.8B. Wheat 3.71 3.95 20.3 43.1 3.26 4.23 15.1 43.8
Iron (Fe)
Grain Yield Grain Fe Grain Yield Grain Fe (t ha-1) (mg kg-1) (t ha-1) (mg kg-1)
-Fe +Fe -Fe +Fe -Fe +Fe -Fe +Fe4. AAU, AnandA. Pigeon pea 2.50 2.42 34.1 36.0 2.27 2.55 33.7 38.5B. Chickpea 3.15 3.27 59.0 62.8 2.36 2.91 56.0 67.55. RAU, PusaA. Rice (dehusked) 5.04 15.6 21.4 81.7 2.99 4.06 13.8 24.3B. Maize 5.19 5.55 46.8 66.2 5.22 6.22 41.3 63.2
Manganese (Mn)
Grain Yield Grain Mn Grain Yield Grain Mn (t ha-1) (mg kg-1) (t ha-1) (mg kg-1)
-Mn +Mn -Mn +Mn -Mn +Mn -Mn +Mn
6. PAU, LudhianaA. Rice 6.71 6.85 41.4 53.0 4.83 5.51 31.6 44.2B. Wheat 5.02 5.45 25.0 33.1 4.24 5.20 19.9 30.2
soil degradation or the “mining” ofsoil fertility. Along with losing theability to hold nutrients, the bio-availability of minerals for plantgrowth has been significantlydecreased as a result of theaccelerated withdrawal ofminerals from the soil withoutcorresponding additions hasseverely impacted on humanhealth.
Approaches to Ensure NutritionalSecurity
Both research and developmentalissues related to malnutritionneed to be addressed to attain thenutritional security of the people.There are several approaches likedietary diversification, mineral
supplementation and foodfortification may be helpful incombating micronutrientsmalnutrition. But, these programshave treated the symptoms ofmicronutrient malnutrition ratherthan the underlying causes. Whilemany of these interventions havebeen successful in the short termfor the individuals reached bythem, they have proved to beunsustainable and incapable ofreaching all the people affected.Indeed, they are least likely toreach those most at risk, namelyresource-poor women, infants,and children that live in remoteareas either far from a clinic orthose who do not have readyaccess to processed and fortifiedfoods. In spite of these
interventions, the problemcontinues to increase.
To address micronutrientdeficiencies in the comprehensiveway, several approaches areneeded simultaneously. Therequisite agricultural research tocorrect these deficiencies willtake some time to come on lineeven if funded in proportion tothe magnitude of the problem.Therefore, all currentinterventions, where cost-effective, should be continued totreat as many people currently atrisk as possible. The developmentof new food systems to deliverthe required nutrientssustainably may be possibleresearch solution to combat
Indian Journal of Fertilisers, December 2014
106
micronutrients deficiency inhuman by enriching the cropsproduce with micronutrientsthrough biofortification (6).Therefore, even when socio-economic factors make it difficultto change the diet, the nutrientbalance of cropping systems wherecereals figure prominently can beimproved. Our paper addressesthis last question, as we consider itthe most promising of thesustainable agricultural optionsthat might be delivered in theshortest time.
Strategies to Enhance Nutritional(Zn and Fe) Quality of Edible PlantParts: Biofortification
Enrichment of crops withmicronutrients is the best optionfor elevating micronutrientsconcentration in food crops,especially in cereals. This can beachieved either by breeding cropcultivars that absorb and transmitmore micronutrients to grains orby fertilising crops withmicronutrients. Breeding cropcultivars for micronutrientenriched genotype is time takingprocess whereas fertilising cropswith micronutrient is easy andconvenient and it takes less time.Although the total concentrationsof Fe, Zn and Cu in most soils aresufficient to support mineral-densecrops, the accumulation of thesemineral elements is often limitedby their phyto-availability andacquisition by plant roots. Theconcentrations of mineral elementsin edible crops can be increased bythe judicious application ofmineral fertilisers and/or bycultivating genotypes with higherconcentrations. The bioavailabilityof mineral elements can also beincreased through crop husbandry,breeding or genetic manipulation(52). Biofortification focuses onenhanc-ing the mineral nutritionalqualities of crops at source, whichencompasses processes thatincrease both mineral levels andtheir bioavailability in the ediblepart of staple crops. The former canbe achieved by agronomicintervention, plant breeding orgenetic engineering, whereas onlyplant breeding and genetic
engineering can influence mineralbioavailability.
Genetic Biofortification
Although Genetic biofortificationis a powerful and sustainablestrategy but it is long-term processrequiring series of breedingactivities and huge resources (16).Moreover, it is difficult to ascertainthat cultivar developed after longtime will be sustainable in soilsfurther mined by that time. Mostimportantly, newly developedgenotypes should be able to extractsufficiently large amounts of Zn/Fefrom potentially deficient soils andaccumulate it in whole grain atsufficient levels for humannutrition. The soils widespread inmajor cereal-growing regions haveseveral adverse soil chemicalfactors that could potentiallydiminish the expression of highgrain Zn/Fe trait and limit thecapacity of newly developed(biofortified) cultivars to absorbadequate amount of Zn/Fe fromsoils to contribute to daily Zn/Ferequirement of human beings.
Agronomic Manipulation
Agronomic manipulation is aninexpensive and simple approachwhich can be utilized to enrichgenetically inefficient cultivars byapplication of micronutrientfertilisers at different rates,methods and at different cropgrowth stages (38, 7). Fertiliserstrategy could be a rapid solutionto the problem and can beconsidered an importantcomplementary approach to theon-going breeding programs.Fertiliser studies focusing specif-ically on increasing Znconcentration of grain (or otheredible parts) are, however, veryrare, although a large number ofstudies are available on the role ofsoil and foliar applied Zn fertilisersin correction of Zn deficiency andincreasing plant growth and yield(31).
In India, through NAIP fundedproject on micronutrientsenrichments, efforts have beenmade to identify genetically
efficient cultivars of cereals andpulses for Zn and Fe to developoptions for micronutrientsbiofortification. Geneticallyefficient and inefficient cultivarswere identified based on YieldEfficiency and Uptake EfficiencyIndex. Interestingly, the geneticallyinefficient cultivars wereagronomically highly efficient.Thus, the efficient cultivars couldbe utilized by breeders for QTLidentification and developing highyielding micronutrient enrichedcultivars (genetic biofortification)while the inefficient cultivars werefor agronomic biofortification todense the grains of highlyresponsive cultivars withmicronutrients.
Application of micronutrienteither through soil, foliar or bothcould increase yield as well asconcentration (Table 5). However,the variation in yield andconcentration were driven by typeof crop and genetic makeup of thecultivars (35). In case of efficientcultivars the application ofmicronutrient had little effect onyield but increase in Zn and Feconcentration was registered in allthe crops. At Bhopal the Znconcentration in efficient cultivarsof pigeon pea increased by 34%while it was 16.6% in case of wheat.Experiment conducted for Znenrichment in rice and maize atHyderabad showed that Znapplication could increase 51.8%Zn concentration in rice grain and13% in Maize. While at Pantnagar,increase in Zn concentration in ricegrain and wheat grain was almostdoubled in efficient cultivars. Incase of inefficient cultivars bothgrain yield as well asmicronutrient (Zn and Fe)concentration increased with theapplication of micronutrient.
This happens because thegenetically inefficient cultivars areagronomically highly efficient andthus responded to externalapplication of Zn. At Bhopal,application of Zn in inefficientcultivars enhanced the grain yieldof pigeon pea by 33% while that ofwheat by 18%. The increment in Znconcentration was more in case of
Indian Journal of Fertilisers, December 2014
107
pigeon pea (37.2%) than that ofwheat (30.9%). Inefficient cultivarsof rice grown at Hyderabadshowed 47.8% increase in yield and77.8% increase in Zn concentration.In case of maize, the increase in Znconcentration was less than therice while grain yield enhanced byone and a half fold. The inefficientcultivars of rice grown atPantnagar recorded 50% increasein yield and double increase in Znconcentration while in case ofwheat, yield increased only upto29.8% but concentration increasedapproximately three times.
Effect of Fe application on grainyield and Fe concentration in grainwas studied in pigeon pea andgram at Anand, Gujarat and in riceand maize at PUSA, Bihar. Similarto Zn application, Fe could hardlyinfluence the yield of efficientcultivars but it had significanteffect on Fe concentration in grain.In efficient cultivars of pigeon peaand chickpea grown at Anandexhibited 10% and 6% increase inFe concentration, respectivelywhile in case of Fe inefficientcultivars, pigeon pea and chickpeayield had increased by 14% and20%, respectively, and the densityof Fe concentration in both thecrops enhanced by 20%. At PUSA,seed loading with Fe enhanced by37% and 46% in efficient cultivarsof rice and maize, respectively. Incase of inefficient cultivars,increase in grain yield of rice andmaize were recorded 35.7% and
19% and concentration by 76% and53%, respectively. The efficiencyof micronutrients depends onright method, right rate and righttime of application. There aredifferent approaches to improvethe micronutrient content of theedible part. One is to increase theefficiency of uptake and transportinto edible tissue and second is toincrease the amount ofbioavailable micronutrientaccumulation in the plant. Mnconcentration enhanced by 28%and 39.8% in efficient andinefficient rice cultivars,respectively while in wheat thisincrease was recorded by 32 and52 percent.
Strategies for micronutrients (Zn,Fe and Mn) enrichment indifferent crops were developedusing several permutation andcombinations of nutrientmanagement options. Thecultivars of different cropsidentified as efficient may be grownin soils low in specificmicronutrients. Of the severalstrategies used, soil +3 foliarfeeding has been identified as bestoption for grain enrichment withZn, in soils having low Zn status.In adequate Zn soils, 2-3 foliarsprays are sufficient to increasegrain Zn concentration in rice,wheat and pigeon pea. Foliar sprayof K along with Zn was also aneffective strategy for enhancinggrain Zn concentration pigeonpea.
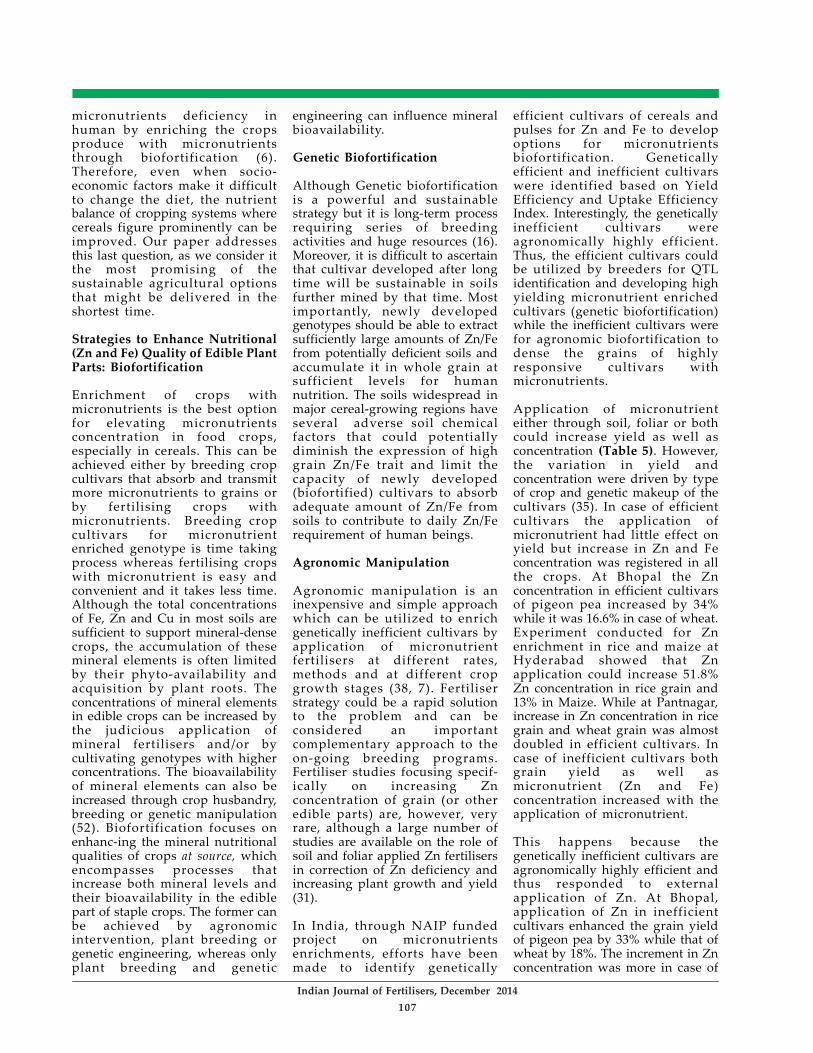
Among the Zn managementstrategies, soil plus foliar feedingwas superior over foliar or soilapplication alone. Zn applied toprevious crop also contributedsignificantly to grain yield and itwas at par with treatmentreceiving soil Zn application inprevious crop. In efficient group ofcultivars the grain yield remainsunaffected due to either of Znmanagement strategies. Grain Znaccumulation mechanism variedwith efficiency of cultivars, itsability to translocate Zn from soilas well as from shoot to grain. Themechanism for increased rootuptake in wheat may be related toproliferation of crown rootgrowth, exudation of organic acidsor phytosiderophores and increasetolerance to Zn deficiency. In lowZn soil, Zn application to soil isinevitable in order to mitigate Zndeficiency at early growth stage,while in excess Zn soil, foliarfeeding is effective option inenhancing grain Zn concentrationin Wheat (Figure 3). Across thedifferent Zn management optionsthe highest grain yield was notedin cultivar UP2628 followed by UP2382 and UP 262.
Physiological Manipulation
The physiological basis formicronutrient efficiency in cropplants plays a major role incontrolling the accumulation ofmicronutrients in edible portionsof seeds. There are several barriers
Figure 3 – Response of different mode of Zn application on Zn concentration (mg kg-1) of efficient and inefficientcultivars of wheat
Indian Journal of Fertilisers, December 2014
108
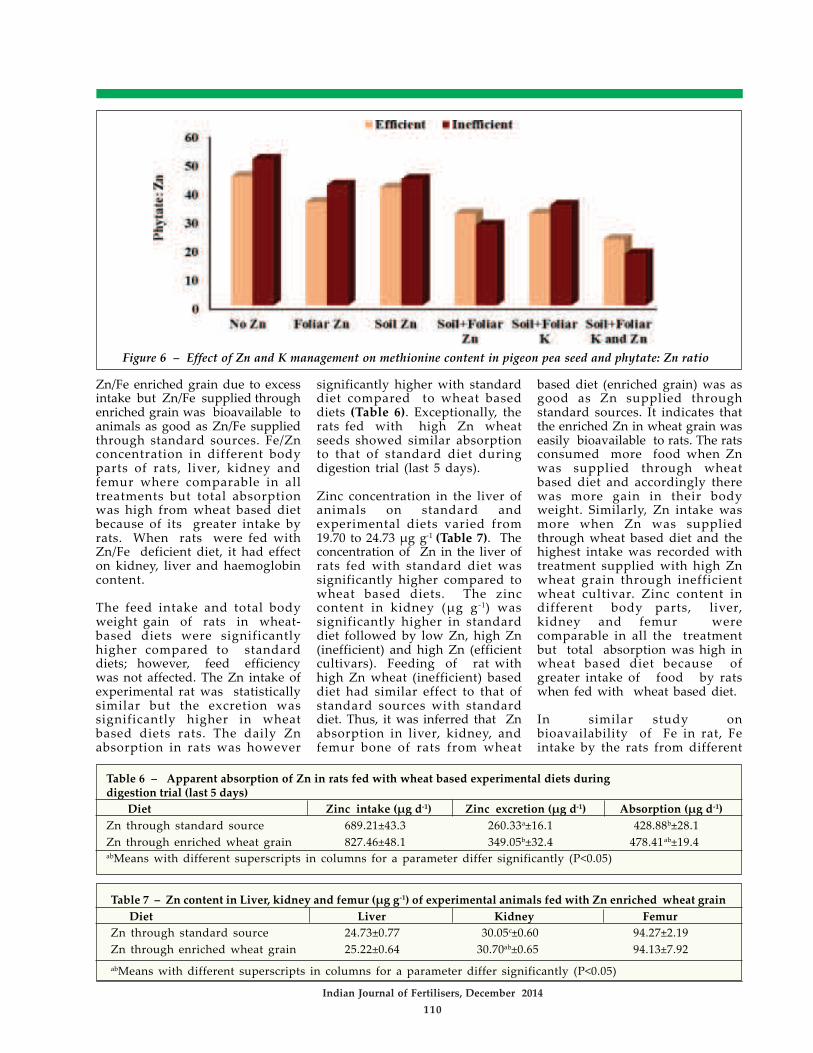
methionine. Since Zn supply tocrop improved the proteinconcentration in cereals, hence,methionine concentration alsoincreased with Zn management.Zinc application has increasedmethionine level more in inefficientcultivars than that efficientcultivars. Although, phytateconcentration and antinutrientsalso increased with application ofmicronutrients, however, phytate:Zn ratio decreased significantlydue to excess Zn absorption incrops supplied with external Znthrough soil and/ or foliar feeding.The phytic acid content in differentwheat genotypes decreased withincreasing levels of Zn with thelowest values obtained whennourished with 20 kg Zn SO4 ha +foliar spray. The greater P uptakeunder reduced Zn supply orreduced P uptake with increasedZn nutrition may be absorbedbetween both the elements for thesame site of absorption in roots.Due to enhanced grain Zn contentwith Zn application the phytate toZn molar ratio exhibited aprogressive reduction withincreasing levels of zinc. The foliarfeeding along with soil applicationis the best Zn management optionto get lowest phytate: Zn ratio.Potassium fertilization along withZn further enhanced Znaccumulation and thereby reducedphytate: Zn ratio in seed. Similarto wheat, methionine content inpigeon pea increased withincreasing levels of Zn. The Kfertilization along with Zn furtherenhanced the methionine contentin grain. Due to sizableaccumulation of Zn in grains, thephytate Zn ratio also reduced(Figure 6).
Bioassimilation of EnrichedCereal and Pulse Grains
Once the grains are enrichedwith micronutrients (Zn/Fe)bioavailability was assessedusing rat models. The resultsrevealed that Zn intake was morefrom pigeon pea, wheat baseddiet and the from seeds ofinefficient cultivars that containhigh Zn. The excretion of Zn/Fewas also higher in rats fed with
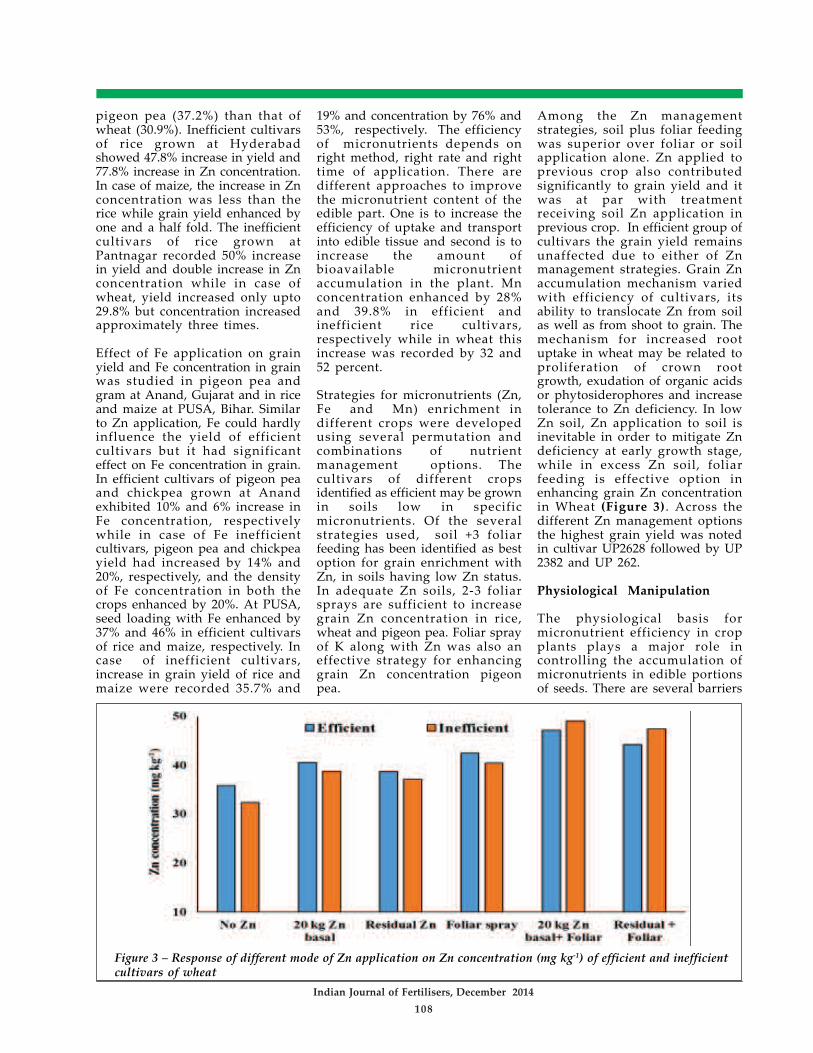
to overcome in geneticallymodifying plants to accumulatemore micronutrient metals (e.g. Feand Zn) in edible tissues (49). It hasalso been recorded that nippingpractice enhanced Fe concentrationboth in efficient and inefficientcultivars of chickpea and pigeonpea grown at Anand, Gujarat(Figures 4 and 5). In chickpea,nipping of apical buds at grandgrowth stage but before floweringresulted in 11% increase in Feconcentration in grain of efficientcultivars (GG1 and GAG 735 )while in inefficient cultivars(ICCC4 and GJG 305) this increasein grain Fe was only 5 per cent.Defoliation (25% of leaves) at pre-flowering stages could enhance theFe concentration in grain by 7 and4% respectively in efficient and
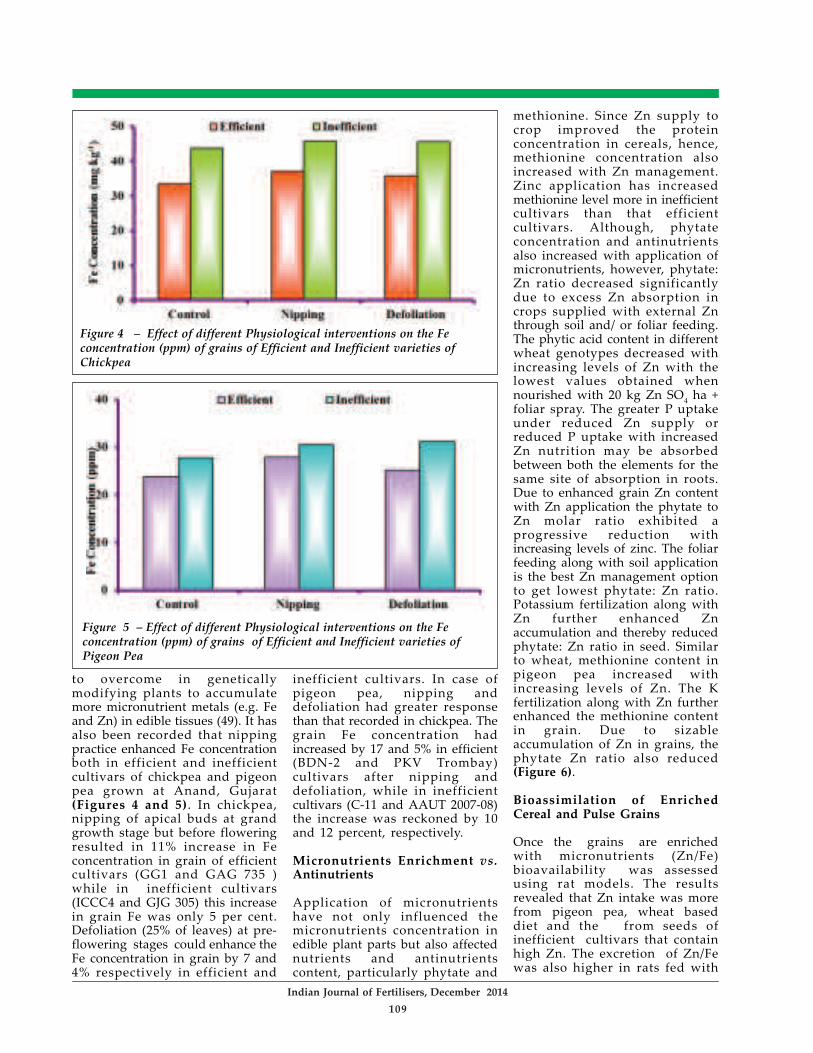
inefficient cultivars. In case ofpigeon pea, nipping anddefoliation had greater responsethan that recorded in chickpea. Thegrain Fe concentration hadincreased by 17 and 5% in efficient(BDN-2 and PKV Trombay)cultivars after nipping anddefoliation, while in inefficientcultivars (C-11 and AAUT 2007-08)the increase was reckoned by 10and 12 percent, respectively.
Micronutrients Enrichment vs.Antinutrients
Application of micronutrientshave not only influenced themicronutrients concentration inedible plant parts but also affectednutrients and antinutrientscontent, particularly phytate and
Figure 4 – Effect of different Physiological interventions on the Feconcentration (ppm) of grains of Efficient and Inefficient varieties ofChickpea
Figure 5 – Effect of different Physiological interventions on the Feconcentration (ppm) of grains of Efficient and Inefficient varieties ofPigeon Pea
Indian Journal of Fertilisers, December 2014
109
Zn/Fe enriched grain due to excessintake but Zn/Fe supplied throughenriched grain was bioavailable toanimals as good as Zn/Fe suppliedthrough standard sources. Fe/Znconcentration in different bodyparts of rats, liver, kidney andfemur where comparable in alltreatments but total absorptionwas high from wheat based dietbecause of its greater intake byrats. When rats were fed withZn/Fe deficient diet, it had effecton kidney, liver and haemoglobincontent.
The feed intake and total bodyweight gain of rats in wheat-based diets were significantlyhigher compared to standarddiets; however, feed efficiencywas not affected. The Zn intake ofexperimental rat was statisticallysimilar but the excretion wassignificantly higher in wheatbased diets rats. The daily Znabsorption in rats was however
significantly higher with standarddiet compared to wheat baseddiets (Table 6). Exceptionally, therats fed with high Zn wheatseeds showed similar absorptionto that of standard diet duringdigestion trial (last 5 days).
Zinc concentration in the liver ofanimals on standard andexperimental diets varied from19.70 to 24.73 µg g-1 (Table 7). Theconcentration of Zn in the liver ofrats fed with standard diet wassignificantly higher compared towheat based diets. The zinccontent in kidney (µg g -1) wassignificantly higher in standarddiet followed by low Zn, high Zn(inefficient) and high Zn (efficientcultivars). Feeding of rat withhigh Zn wheat (inefficient) baseddiet had similar effect to that ofstandard sources with standarddiet. Thus, it was inferred that Znabsorption in liver, kidney, andfemur bone of rats from wheat
based diet (enriched grain) was asgood as Zn supplied throughstandard sources. It indicates thatthe enriched Zn in wheat grain waseasily bioavailable to rats. The ratsconsumed more food when Znwas supplied through wheatbased diet and accordingly therewas more gain in their bodyweight. Similarly, Zn intake wasmore when Zn was suppliedthrough wheat based diet and thehighest intake was recorded withtreatment supplied with high Znwheat grain through inefficientwheat cultivar. Zinc content indifferent body parts, liver,kidney and femur werecomparable in all the treatmentbut total absorption was high inwheat based diet because ofgreater intake of food by ratswhen fed with wheat based diet.
In similar study onbioavailability of Fe in rat, Feintake by the rats from different
Figure 6 – Effect of Zn and K management on methionine content in pigeon pea seed and phytate: Zn ratio
Table 7 – Zn content in Liver, kidney and femur (µg g-1) of experimental animals fed with Zn enriched wheat grain Diet Liver Kidney FemurZn through standard source 24.73±0.77 30.05c±0.60 94.27±2.19Zn through enriched wheat grain 25.22±0.64 30.70ab±0.65 94.13±7.92
abMeans with different superscripts in columns for a parameter differ significantly (P<0.05)
Table 6 – Apparent absorption of Zn in rats fed with wheat based experimental diets duringdigestion trial (last 5 days) Diet Zinc intake (µg d-1) Zinc excretion (µg d-1) Absorption (µg d-1)Zn through standard source 689.21±43.3 260.33a±16.1 428.88b±28.1Zn through enriched wheat grain 827.46±48.1 349.05b±32.4 478.41ab±19.4abMeans with different superscripts in columns for a parameter differ significantly (P<0.05)
Indian Journal of Fertilisers, December 2014
110
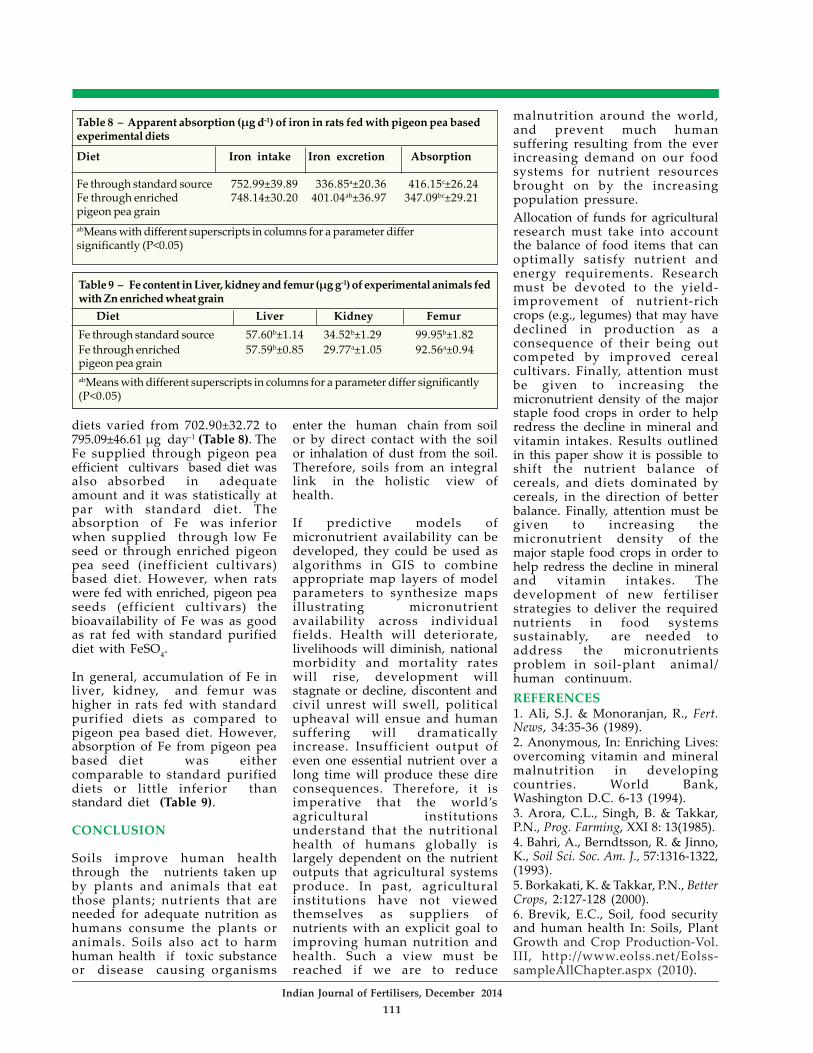
diets varied from 702.90±32.72 to795.09±46.61 µg day-1 (Table 8). TheFe supplied through pigeon peaefficient cultivars based diet wasalso absorbed in adequateamount and it was statistically atpar with standard diet. Theabsorption of Fe was inferiorwhen supplied through low Feseed or through enriched pigeonpea seed (inefficient cultivars)based diet. However, when ratswere fed with enriched, pigeon peaseeds (efficient cultivars) thebioavailability of Fe was as goodas rat fed with standard purifieddiet with FeSO4.
In general, accumulation of Fe inliver, kidney, and femur washigher in rats fed with standardpurified diets as compared topigeon pea based diet. However,absorption of Fe from pigeon peabased diet was eithercomparable to standard purifieddiets or little inferior thanstandard diet (Table 9).
CONCLUSION
Soils improve human healththrough the nutrients taken upby plants and animals that eatthose plants; nutrients that areneeded for adequate nutrition ashumans consume the plants oranimals. Soils also act to harmhuman health if toxic substanceor disease causing organisms
enter the human chain from soilor by direct contact with the soilor inhalation of dust from the soil.Therefore, soils from an integrallink in the holistic view ofhealth.
If predictive models ofmicronutrient availability can bedeveloped, they could be used asalgorithms in GIS to combineappropriate map layers of modelparameters to synthesize mapsillustrating micronutrientavailability across individualfields. Health will deteriorate,livelihoods will diminish, nationalmorbidity and mortality rateswill rise, development willstagnate or decline, discontent andcivil unrest will swell, politicalupheaval will ensue and humansuffering will dramaticallyincrease. Insufficient output ofeven one essential nutrient over along time will produce these direconsequences. Therefore, it isimperative that the world’sagricultural institutionsunderstand that the nutritionalhealth of humans globally islargely dependent on the nutrientoutputs that agricultural systemsproduce. In past, agriculturalinstitutions have not viewedthemselves as suppliers ofnutrients with an explicit goal toimproving human nutrition andhealth. Such a view must bereached if we are to reduce
malnutrition around the world,and prevent much humansuffering resulting from the everincreasing demand on our foodsystems for nutrient resourcesbrought on by the increasingpopulation pressure.Allocation of funds for agriculturalresearch must take into accountthe balance of food items that canoptimally satisfy nutrient andenergy requirements. Researchmust be devoted to the yield-improvement of nutrient-richcrops (e.g., legumes) that may havedeclined in production as aconsequence of their being outcompeted by improved cerealcultivars. Finally, attention mustbe given to increasing themicronutrient density of the majorstaple food crops in order to helpredress the decline in mineral andvitamin intakes. Results outlinedin this paper show it is possible toshift the nutrient balance ofcereals, and diets dominated bycereals, in the direction of betterbalance. Finally, attention must begiven to increasing themicronutrient density of themajor staple food crops in order tohelp redress the decline in mineraland vitamin intakes. Thedevelopment of new fertiliserstrategies to deliver the requirednutrients in food systemssustainably, are needed toaddress the micronutrientsproblem in soil-plant animal/human continuum.
REFERENCES1. Ali, S.J. & Monoranjan, R., Fert.News, 34:35-36 (1989).2. Anonymous, In: Enriching Lives:overcoming vitamin and mineralmalnutrition in developingcountries. World Bank,Washington D.C. 6-13 (1994).3. Arora, C.L., Singh, B. & Takkar,P.N., Prog. Farming, XXI 8: 13(1985).4. Bahri, A., Berndtsson, R. & Jinno,K., Soil Sci. Soc. Am. J., 57:1316-1322,(1993).5. Borkakati, K. & Takkar, P.N., BetterCrops, 2:127-128 (2000).6. Brevik, E.C., Soil, food securityand human health In: Soils, PlantGrowth and Crop Production-Vol.III, http://www.eolss.net/Eolss-sampleAllChapter.aspx (2010).
Table 9 – Fe content in Liver, kidney and femur (µg g-1) of experimental animals fedwith Zn enriched wheat grain
Diet Liver Kidney Femur
Fe through standard source 57.60b±1.14 34.52b±1.29 99.95b±1.82Fe through enriched 57.59b±0.85 29.77a±1.05 92.56a±0.94pigeon pea grainabMeans with different superscripts in columns for a parameter differ significantly(P<0.05)
Table 8 – Apparent absorption (µg d-1) of iron in rats fed with pigeon pea basedexperimental diets
Diet Iron intake Iron excretion Absorption
Fe through standard source 752.99±39.89 336.85a±20.36 416.15c±26.24Fe through enriched 748.14±30.20 401.04ab±36.97 347.09bc±29.21pigeon pea grainabMeans with different superscripts in columns for a parameter differsignificantly (P<0.05)
Indian Journal of Fertilisers, December 2014
111
7. Cakmak, I., Better Crops, 96(2):17-19 (2012).8. Chauhan, R.P.S. & Asthana, A.K.,J. Agric. Sci., 97: 75-78 (1981).9. Combs, G.F. Jr., Welch, R.M. &Duxbury, J.M., Euro. J. Clin. Nutr.,51:S32-S33 (1997).10. Combs, G.F., Welch, R.M.,Duxbury, J.M., Uphoff, N.T. &Nashaeim, M.C., “Food basedapproaches to preventmicronutrient malnutrition: AnInternational Research Agenda.”Cornell international institute forFood, Agriculture, andDevelopment, Cornell University,Ithaca, NY (1996).11. Davis, O.K. & Mertz ,W., In:Trace Elements in human andAnimal Nutrition (Ed. W. Mertz).Vol. 1. 5th ed. Academic Press,London. 301-306 (1987).12. Reuter, D.J., Heard, T.G. &Alston, A.M., Aust. J. Exp. Agric. Anim.Husb., 13(63): 434 -439 (1973).13. Dwivedi, G.K., Dwivedi, M. &Pal, S.S., J. Ind. Soc. Soil Sci., 38: 458-463(1990).14. FAO. Combating MicronutrientDeficiencies: Food-basedApproaches Eds: Brian Thompsonand Leslie Amoroso, Food andAgriculture Organization of theUnited Nations (2011).15. Ghaly, A.E. & Alkoaik, F.N., Am.J. Applied Sci., 7: 331-342 (2010).16. Graham, R.D., Welch, R.M. &Bouis, H.E., Advances Agron, 70:77-142 (2001).17. Guaba, K., Master’s thesis. PostGraduate Institute of Medicine,Education and Research,Chandigarh (1983).18. Ho, S.B., Department ofAgricultural Chemistry, National684 Taiwan University, Taipei 106,Taiwan (2000).19. Katyal, J.C. & Deb, D.L., In:Review of soil research in India,Part I. New Delhi: Indian Society ofSoil Science. 146–59 (1982).20. Katyal, J.C., Fert. News, 30: 67-80(1985).21. Katyal, J.C. & Vlek, P.L.G., Fert.Res., 7: 69-94 (1985).22. Meenakshi, J.V., Johnson, N.L.,Manyong, V.M., DeGroote, H. &Javelosa, J., World Dev., 38: 64-75(2010).23. Mengel, K. & Kirkby, E. A., In:Principles of plant nutrition. 621-
638, Kluwer Academic Publishers(5th Ed.) Dordrecht/ Boston/ London,Netherlands (2001).24. Nayyar, V.K., Takkar, P.N.,Bansal, R.L., Singh, Kaur, S.P., &Sadana, U.S., Res. Bulletin.Micronutrients In soils and cropsof Punjab. Dept. of Soils, PAU,Ludhiana. pp. 148 (1990).25. Niaz, A., Ranjha, A.M.,Rahmatullah, Hannan, A. & Waqas,M., Pak. J. Agric. Sci., 44: 428-435(2007).26. Patil, G.D., Patil, M.D., Patil,N.D. & Adsule, R.N., J. MaharashtraAgric. University, 12: 168-170 (1987).27. Paz, A., Taboada, M.T., &Gomez, M.J., Comm. Soil Sci. PlantAnal., 27(3/4): 479-503 (1996).28. Prasad, A.S., Trace Elements inHuman Metabolism. (Ed. A.S.Prasad). John Wiley & Sons.Chichester (1978).29. Rashid, A., Muhammad, S. &Rafique, E., Soil Environ., 24: 98-102(2005).30. Rashid, A., Rafique, E. & Bughio,N., Comm. Soil Sci. Plant Anal., 28:444-454 (1997).31. Rengel, Z, Batten, G.D. andCrowley, D.E., Field crops Research, 60:27-40 (1999).32. Sakal, R, Singh, A.P., Sinha, R.B.& Bhogal, N.S., Annual progressreports. ICAR All IndiaCoordinated Scheme of Micro-andSecondary Nutrients in Soils andcrops of Bihar, Res. Bull,Department of Soil Science, RAU,Samastipur, Bihar, India (1988).33. Seshadari, S., In: Communitytrials of effectiveness of daily vsweekly supplementation. MSUniversity, Vadodara, Gujarat(1998).34. Shorrocks, V.M., Plant and Soil,193: 121-148(1997).35. Shukla, A.K., Behera, S.K.,Shivay, Y.S., Singh, P. & Singh, A.K.,Indian J. Agron. S57: 124-131 (2012).36. Shukla, A.K. & Behera, S.K.,Indian J. Fert. 7(10): 14-33 (2011).37. Shukla, A.K. & Behera, S.K.,Indian J. Fert. 8(4): 100-117 (2012).38. Shukla, A.K. & Tiwari, P.K.,Progress report of AICRP on Micro-and Secondary Nutrients andPollutant Elements in Soils andPlants, IISS, Bhopal (2014).39. Shukla, A.K., Understandingthe mechanism of variation in
status of a few nutritionallyimportant micronutrients in someimportant food crops and themechanism of micronutrientenrichment in plant parts, NAIPFunded Research Project. AICRPon Micronutrients, IISS, Nabibagh,Berasia Road, Bhopal (2014).40. Singh, M.V., In: Micronutrientdeficiencies in global cropproduction. Alloway, BJ (Ed.).Springer, Dordrecht, pp. 93-125(2008).41. Singh, M.V., Indian J. Fert., 5:11-26 (2009).42. Singh, M.V. and Subbarao, A.,In; Micronutrient Research andAgricultural Production. Ed. HLSTandon, FDCO, New Delhi pp. 83-114, (1995).43. Singh, M.V., Micro andSecondary Nutrient Research inIndia. Indian Institute of SoilScience, Bhopal. Vol. 23, 148, (2005).44. Sinha, R.B., Sakal, R., Singh, A.P.,Bhogal, N.S., J. Indian Soc Soil Sci. 39:342-345 (1991).45. Sreeja, V.N. http://w w w . i b t i m e s . c o m / w o r l d -population-increase-97b-2050-india-will-overtake-china-most-p o p u l o u s - n a t i o n - n e w - s t u d y -1413620 (2014)46. Stein, A.J., Meenakshi, J.V., Qaim,M., Nestel, P. and Sachdev, H.P.S. etal., Soc. Sci. Med., 66: 1797-1808 DOI:1 0 . 1 0 1 6 / j . s o c s c i m e d .2008.01.0062008 (2008).47. Takkar, P.N., Chhibba, I.M. &Mehta, S.K., Bull. 314. IndianInstitute of Soil Science, Bhopal,India. (1989).48. Welch, R.M. et al., Soil Sci. Soc.America, 229-296 (1991).49. Welch, R.M., Crit. Rev. Plant Sci.,14: 49-82(1995).50. Welch, R.M., Combs, G.F. Jr. &Duxbury, J.M., Issues Sci. Technol, 14:50-58 (1997).51. White, J.G. & Zasoski, R.J., FieldCrops Research 60:11-26 (1999).52. White, P.J. & Broadley, M.R., NewPhytol., 182: 49-84 (2009).53. WHO, World HealthOrganisation, Geneva, pp 72–104(2002).54. Zadeh, S.S. & Begum, K., Am.Med. J., 2: 104-110 (2011).Zhao, F.J. & Shewry, P.R., Food Policy,36: S94-1. S101 (2011).
Indian Journal of Fertilisers, December 2014
112