Embed Size (px)
Citation preview
MICROMACHINING USING AN EXCIMER (248 nm) LASER
By
CHOO, KOK LEONG
Bachelor of Science in Mechanical Engineering
Oklahoma State University
Stillwater, OK
1999
Submitted to the Faculty of the Graduate College of the
Oklahoma State University in partial fulfillments of
the requirement of the Degree of
MASTER OF SCIENCE May, 2004
ii
MICROMACHINING USING AN EXCIMER (248 nm) LASER
Thesis Approved:
________________________________________________
Thesis Adviser
________________________________________________
________________________________________________
________________________________________________
Dean of Graduate College
iii
ACKNOWLEDGEMENT
First, I would like to thank my adviser, Dr. Ranga Komanduri, for his guidance, input,
and advice and for allowing me to perform research in the field of advanced
manufacturing processes and nanotechnology. This project is funded by a grant from the
National Science Foundation (EPS-9977830) through a subcontract from University of
Arkansas. The principal investigator at the University of Arkansas on this project is Dr.
Ajay Malshe. I would also like to thank Dr. H. B. Lu and Dr. L. M. Raff for serving as
my committee. Thnks are due to Mr. Matt Lee, Mr. Sony Varghese, Mr. Yasufumi
Ogawa and Mr. K. Ganesh for their ideas, advice, help and assistance in performing some
of the experiments.
Special thanks go to my other half, Chan, Siu Mei, who is always encouraging and
supporting me in everyway possible.
I am indebted to my parents, Mr. Choo Si Pei and Mrs. Ng Yoke Lan; my brother, Kok
Keng, my sisters, Lai Kuan, Lai Yee and Lai Yen, who are always encouraging me in
times of need, and without whose ever present support and sacrifices I would not have
been able to study abroad.
Finally, I would like to thank one and all for helping me in completing this work.
iv
TABLE OF CONTENTS
Chapter Page
1. INTRODUCTION TO LASER
1.1 Introduction…………………………………………………………...……….1
1.2 History of Lasers………………………………………..……………………..1
1.3 Types of Laser…………………………………………………………………3
1.4 Excimer Laser…………….…………………………………………………...3
1.4.1 Physical Fundamental……………………………….………………5
1.4.2 Structure of Excimer Laser………………………………………….7
1.4.3 Practical Excimer Laser……………………………………………..8
1.5 Laser's Properties……………………………………………………………...9
1.5.1 Wavelength………………………………………………………...10
1.5.2 Output Energy……………………………………...………………11
1.5.3 Duration of Emission………………………………………………12
1.5.4 Beam Divergence and Size...………………………………………13
1.5.5 Coherence...………………………………………………………..13
1.5.6 Efficiency and Power Requirement………………………………..14
1.6 Laser Safety………………………………………………………………….15
2. FUNDAMENTAL FEATURES OF LASER-MATTER INTERACTION
2.1 Introduction…………………………………………………………………..17
2.2 Reflectivity, Absorptivity and Transmisivity………………………………..18
2.3 Heat Conduction……………………………………………………………..21
2.4 Melting of Surface…………………………………………………………...22
2.5 Convection…………………………………………………………………...23
v
Chapter Page
2.6 Vaporization……………………………………………………………….…24
2.7 Plasma Shielding……………………………………………………………..24
3. LITERATURE REVIEW
3.1 Introduction………………………………………………………………….27
3.2 Polymer………………………………………………………………………28
3.3 Silicone………………………………………………………………………35
3.4 Borosilicate Glass……………………………………………………………43
4. PROBLEM STATEMENT………………………………………………………….47
5. DISCRIPTION OF EXCIMER LASER MICROMACHINING SYSTEM
AND OPERATION PROCEDURE
5.1 Introduction…………………………………………………………………..49
5.2 Excimer Laser Generator System……………………………………………49
5.3 Stages and Motion Control System…………………………………………..55
5.4 Optic Delivery System……………………………………………………….57
5.5 Alignment of the Excimer Laser Optical System……………………………61
5.6 System Operation Instruction ...………………………………………...…...61
6. METHODOLOGY
6.1 Introduction…………………………………………………………………..62
6.2 Sample Preparation…………………………………………………………..62
6.3 Determination of Pulsed Laser Fluence.……………………………………..63
6.4 Determination of Focus Point ……………………………………………….63
6.5 Pulsed Laser Micro Drilling………………………………………………….64
6.6 Pulsed Laser Micro Machining………………………………………………64
vi
Chapter Page
6.7 Pulsed Laser Machining in Medium…………………………………………64
6.8 Optical Microscope Observation…………………………………………….64
6.9 Interferometric Surface Profile (MicroXAM) Observation………………….65
6.10 SEM Observation…………………………………………………………...65
7. INFLUENCE OF LASER FOCUS POINT
7.1 Introduction…………………………………………………………………..66
7.2 Properties of PMMA………………………………………………………....66
7.3 Experiment…………………………………………………………………...69
7.4 Results and Discussion………………………………………………………69
7.4.1 Diameter………………………………………………………………..69
7.4.2 Ablation Depth………………………………………………………....71
7.4.3 Taper Effect……………………………………………………………73
7.4.4 Droplet Formation……………………………………………….……..75
8. PULSED LASER MICRODRILLING ON SILICON WAFER
8.1 Introduction…………………………………………………………………..77
8.2 Experiment………………………………………………………………...…78
8.3 Result and Discussion………………………………………………………..79
8.4 Alternate Method to Trap the Debris Generated in Laser Ablation………….99
9. PULSED LASER MICRODRILLING ON BOROSILICATE GLASS
9.1 Introduction…………………………………………………………….…...101
9.2 Analysis……………………………………………………………………..101
9.2.1 Behavior of Glass……………………………………………………..101
9.2.2 Mechanism of Bump Formation……………………………………...104
9.3 Experiment………………………………………………………………….104
9.4 Results and Discussion…………..…………………………………………105
9.5 Alternate Method to Trap the Debris Generated in Laser Ablation………...120
vii
Chapter Page
10. PULSE LASER MICROMACHINING
10.1 Introduction………………………………………………………….…….122
10.2 Experiment………………………………………………………………...122
10.3 Results and Discussion……………………………………………………123
10.3.1 Effect of Eenrgy…………………………………………………...124
10.3.2 Effect of Feedrate………………………………………………….126
10.3.3 Effect of Medium………………………………………………….130
10.4 Samples of 3-D Structures...………………………………………………132
11. SUMMARY AND CONCLUSION
11.1 PMMA…………………………………………………………………….134
11.2 Microdrilling………………………………………………………………135
11.3 3-D Structuring……………………………………………………………141
11.4 The Main Effects Limiting Quality of Laser Machining………………….141
11.4.1 Main Reasons for Liquid Phase Increase……….…………………142
12. FUTURE WORK………………………………………………………………….143
REFERENCES………………………………………………………………………..144
APPENDIX
Appendix A: System Operation Instruction..…………………………………..154
viii
LIST OF TABLES
Table Page
1.1 Major Excimer Lasers………………………………..………………………...….4
1.2 Important Laser Types and Their Wavelengths [5]……………………………...10
3.1 Bonding Energy for Different Type of Covalent Bond………………………….28
5.1 Specification of Lambda Physik COMPex 205i Excimer Laser…..……..……...52
5.2 Specification of Gases Used to Generate 248 nm Excimer Laser for
COMPex 205i……………………………………………………………………53
5.3 Specification of Aerotech’s Positioning Stages………………………………….57
5.4 Doublet Specification……………...………………………………………….….61
7.1 Physical, Thermal, Optical and Processing Properties of PMMA.……..……..…67
9.1 Properties for Borosilicate Glass (Corning 0211 Glass)………………………..105
ix
LIST OF FIGURES
Figure Page
1.1 Seven major families of laser………………………………………...……………3
1.2 Internal energy of a rare gas halide molecule in excited and ground
states [3]......………………………………………………………………….……5
1.3 Calculating the size of a laser spot from the beam divergence…………………..13
1.4 Coherent and incoherent light…………..………………………………………..14
2.1 Interaction of laser beam with workpiece………...……………………………...17
2.2 Reflection, absorption and transmission by a slab [11]….………………………18
2.3 Reflectivity of silver, copper and nickel at different wavelength [11].……...…..19
2.4 General features of convection in molten pool…………………………………..23
2.5 Schematic illustration of the principal features of a laser-supported
absorption wave in ambient air…………………………………………………..25
5.1 Schematic diagram of COMPex 205i……………………………………………50
5.2 Photograph of the experiment setup for excimer laser micromachining………...51
5.3 Control terminal of the COMPex 205i excimer laser…………………..………..54
5.4 UNIDEX 500 system diagram………………………………………………..….55
5.5 Cutaway view for Aerotech’s ATS100-200 stage………….……………………56
5.6 Schematic of optical delivery system for 248nm excimer laser.………………...57
5.7 Operation principle of the homogenizer (only one axis shown)…………………58
7.1 Chemical structure of PMMA……………………………………………...….…66
7.2 Absorption coefficient (α), ablation threshold fluence (ET) and energy per
unit volume at ADP threshold (ETα) of PMMA with different wavelength….…68
7.3 Variation of rate constant (kr) for thermal degradation of PMMA
with temperature……………...………………………………………………….68
7.4 Varation of the diameter of holes vs, the number of pulses at different
focal point…………………………………………………………………..……70
x
Figure Page
7.5 Optical micrographs of hole on PMMA irradiated with 200 pulses of
excimer laser at different focal points……………………………………...……70
7.6 Cross section profiles for holes that exposed to 200 pulses at different focal
point relative to the surface of the substrate…………………………….……….71
7.7 Cross section profile for hole showing incubation region……………………….71
7.8 Graph of ablation depths vs. number of pulses at different focal point…….……72
7.9 Cross sectional view for holes ablated from 1 to 1000 pulses (left to right) at
different focal points, f……………………………..…………………….…..73-75
7.10 Optical micrograph showing significant splash droplets surrounding an
ablated hole……………………………………………………………………....75
8.1 Schematic of the setup used for laser ablated micromachining of silicon
under water…………………………………………………………………….…79
8.2 Optical micrographs of the top views of silicon workpieces ablated at a
pulse energy of 0.8mJ and at different number of pulses from 10 to 5000
(a) in air and (b) under water, respectively…………………………………...80-82
8.3 Optical Micrographs of the top views of silicon workpieces machined
showing details at higher magnification……………………………………...83-85
8.4 MicroXAM 3D mapping of the ablated surfaces in silicon at pulse energy
of 0.8mJ and at various number of pulses (a) in air and (b) under water,
respectively…………………………………………………………………...86-88
8.5 Cross sectional profiles obtained using MicrXAM laser interference
microscope……………………………………………………………………91-92
8.6 SEM macrographs at various magnifications for silicon workpieces
ablated with 1000 pulses at energy of 0.8mJ (a) in air and (b) under water,
respectively…………………………………………………………………...93-96
8.7 Variation of ablation depth with laser fluence for different number of
pulses (a) in air and (b) under water, respectively.............................................…97
8.8 Variation of ablation depth with number of pulses fro different laser
fluence (a) in air and (b) under water, respectively……………………………...98
xi
Figure Page
8.9 Macrographs of holes before and after peeling off of the tape from the silicon
workmaterial……………………………………………………………………..99
8.10 Micrographs of the same area in Figure 8.9 at higher magnification…………....99
8.11 Optical macrographs of the debris on the tape peeled-off from the silicon
surface showing redeposited molten and resolidified material from laser
ablation………………………………………………………………………….100
9.1 Volume changes associated with heating and cooling in systems susceptible
to glass formation……………………………………………………………….103
9.2 Variation of ablation depth with number of pulses at various laser fluences
for machining borosilicate glass (a) in air and (b) underwater, respectively…...106
9.3 Variation of ablation depth with number of pulses at various laser fluences
for machining borosilicate glass (a) in air and (b) under water, respectively…..108
9.4 Variation of ablation depth with laser fluence for different number of pulses
(a) in air and (b) under water, respectively……………………………………..109
9.5 Cross sectional profiles of borosilicate glass exposed to 5 laser pulses in air
from 1.07 J/cm2 to 2.4 J/cm2 obtained using MicroXAM surface mapping
microscope……………………………………………………………………...111
9.6 Optical micrographs of the top view of borosilicate glass workpieces
ablated at 1.30 J/cm2 for 1000 pulses under water……………………………...112
9.7 Optical micrographs of the top view of borosilicate glass workpieces
ablated at pulse energy of 2.55 J/cm2 and at different number of pulses
from 10 to 5000 pulses (a) in air and (b) under water, respectively.………113-115
9.8 SEM micrographs of borosilicate glass irradiated with a fluence of 0.28 J/cm2
in air and under water respectively. Note: the scale in air is 50 µm and
under water is 25 µm.……………………………………………………...116-117
9.9 Optical micrographs of the top view of borosilicate glass workpiece ablated at
2.42 J/cm2 for 1000 pulses in air………………………………………….…….117
9.10 SEM micrograph of the surface topology of various sections for borosilicate
glass irradiated with an excimer laser at a fluence of 0.28 J/cm2.……………...119
xii
Figure Page
9.11 SEM micrographs showing ejection of molten material at 100 and 1000
pulses irradiated with fluence of 0.28 J/cm2 in air…………………..…..….…..119
9.12 Optical micrograph of holes without and with (after peeling-off) a
polymeric adhesive tape from the borosilicate glass workmaterial………..120-121
9.13 Optical micrograph of the debris on the tape peeled off from the borosilicate
glass surface showing redeposied molten material and resolidifed material
from laser ablation……………………………………………………………...121
10.1 MicroXAM 3D micrograph of borosilicate glass irradiated with 5 laser
pulses at fluence of 1.88 J/cm2………………………………………………….123
10.2 Mechanism of line machining…………………………………………………..123
10.3 MicroXAM micrographs of borosilicate glass machined with various
energies ………………………………………………………...………….124-125
10.4 MiroXAM micrographs for a borosilicate glass machined with a laser beam
(diameter ~ 70 µm) at various feedrates…...………………………………126-130
10.5 Optical micrographs of a borosilicate glass machined with 1.38 J/cm2 with
various passes (a) in air and (b) under water, respectively……………………..131
10.6 MicroXAM 3D view of microcircuit machined on a borosilicate glass…....…..132
10.7 MicroXAM 3D view of a microgear machined with an excimer laser on
PMMA with (a) single loop and, (b) 3 loops of machining steps………………133
10.8 Optical micrographs of a microgear machined with an excimer laser on
polyurethane ……………………………………………………………………133
11.1 Flow charts of phenomena for excimer laser machining in air…………………136
1
CHAPTER 1
INTRODUCTION TO LASER
1.1 Introduction
Before undertaking a study on the laser machining process, it is necessary to
understand the fundamentals of the laser system. In this chapter, we will briefly review
the history, types of lasers, properties of laser, and laser safety.
1.2 History of Lasers
The word LASER is an acronym for the most significant feature of laser action,
namely, Light Amplification by Stimulated Emission of Radiation. There are many
different kinds of lasers, but they share a crucial element, namely, material capable of
amplifying radiation. This material is called the gain medium, because radiation gains
energy passing through it.
Stimulated Emission
The physical principle responsible for the amplification is called simulated emission.
This concept was originated from Albert Einstein’s 1916 paper [1] or the sources of
quantum mechanics. If an electron is in an excited state, when a photon previously
emitted, and having the proper energy collides, the electron would drop to a lower energy
2
state, and emit another proton of the same energy that would move in the same direction,
resulting in two identical photons traveling together in the same direction and in phase.
Maser
However, the concept of stimulated emission remained primarily of academic interest
until 1950s, when Charles H. Townes together with a postdoctoral assistant and a
graduate student built the first MASER, which is an acronym for Microwave
Amplification by the Stimulated Emission of Radiation [2].
The Birth of Laser Theory
Townes and Schawlow were the first to publish a detailed account on the
construction of an “optical maser.” Their famous paper “Infrared and Optical Maser,”
was published in the December, 1958 issue of the Physical Review [2]. This paper along
with the US Patent No. 2,929,922 had a profound impact on American laser research.
The Great Laser Race
Publication of the Schawlow-Townes paper stimulated many researches to build
optical masers. Meanwhile, Theodore Maiman at Hughes Research Laboratories in
Malibu, California was attempting to apply his knowledge of ruby masers to fabricate a
laser. Despite warning from Schawlow and others that ruby is unsuitable for laser, on
May 16, 1960, Maiman succeeded in making the ruby laser work for the first time [3].
3
The First Commercial Lasers
It didn’t take long for laboratories around the world to duplicate Maiman’s ruby laser,
but not all laboratories wanted to build their own. The first commercial lasers began
appearing about 1961 – large ruby type designed to deliver high-power pulses. One of the
firsts in the market was TRION in Michigan.
1.3 Types of Laser
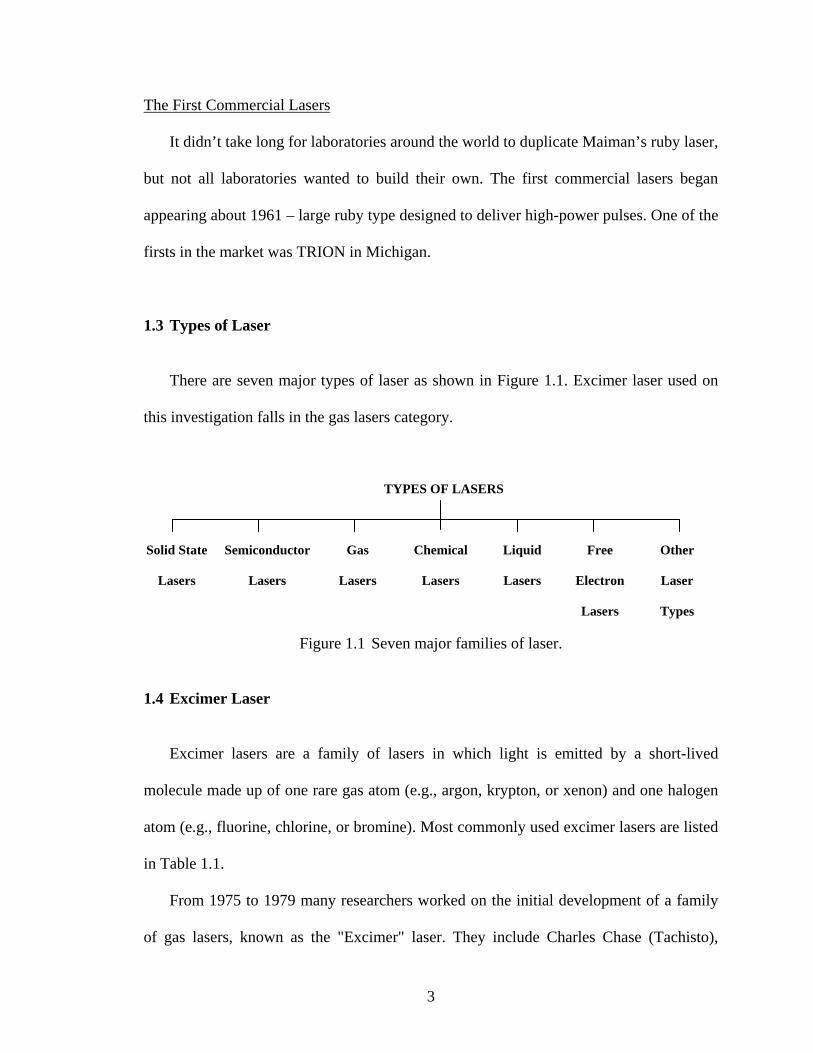
There are seven major types of laser as shown in Figure 1.1. Excimer laser used on
this investigation falls in the gas lasers category.
TYPES OF LASERS
Solid State
Lasers
Semiconductor
Lasers
Gas
Lasers
Chemical
Lasers
Liquid
Lasers
Free
Electron
Lasers
Other
Laser
Types
Figure 1.1 Seven major families of laser.
1.4 Excimer Laser
Excimer lasers are a family of lasers in which light is emitted by a short-lived
molecule made up of one rare gas atom (e.g., argon, krypton, or xenon) and one halogen
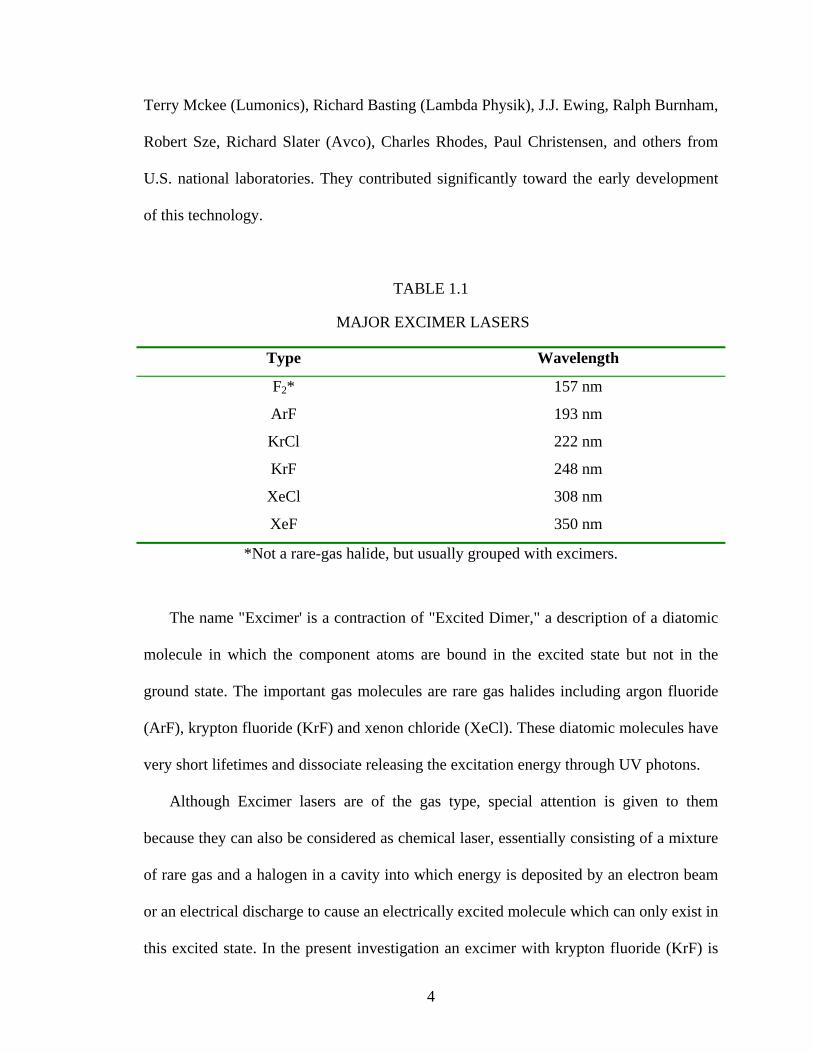
atom (e.g., fluorine, chlorine, or bromine). Most commonly used excimer lasers are listed
in Table 1.1.
From 1975 to 1979 many researchers worked on the initial development of a family
of gas lasers, known as the "Excimer" laser. They include Charles Chase (Tachisto),
4
Terry Mckee (Lumonics), Richard Basting (Lambda Physik), J.J. Ewing, Ralph Burnham,
Robert Sze, Richard Slater (Avco), Charles Rhodes, Paul Christensen, and others from
U.S. national laboratories. They contributed significantly toward the early development
of this technology.
TABLE 1.1
MAJOR EXCIMER LASERS
Type Wavelength
F2* 157 nm
ArF 193 nm
KrCl 222 nm
KrF 248 nm
XeCl 308 nm
XeF 350 nm
*Not a rare-gas halide, but usually grouped with excimers.
The name "Excimer' is a contraction of "Excited Dimer," a description of a diatomic
molecule in which the component atoms are bound in the excited state but not in the
ground state. The important gas molecules are rare gas halides including argon fluoride
(ArF), krypton fluoride (KrF) and xenon chloride (XeCl). These diatomic molecules have
very short lifetimes and dissociate releasing the excitation energy through UV photons.
Although Excimer lasers are of the gas type, special attention is given to them
because they can also be considered as chemical laser, essentially consisting of a mixture
of rare gas and a halogen in a cavity into which energy is deposited by an electron beam
or an electrical discharge to cause an electrically excited molecule which can only exist in
this excited state. In the present investigation an excimer with krypton fluoride (KrF) is
5
used. This gas under lasing conditions returns to its constituent atoms emitting photons
(either spontaneously or by simulated emission) to produce a laser beam at 248 nm in the
ultraviolet region (namely in the 100 – 400 nm) of the spectrum.
Since excimer lasers are gas and chemical type and the wavelength is shorter than the
other popular types like CO2 or Nd:YAG lasers, it is of interest for many applications.
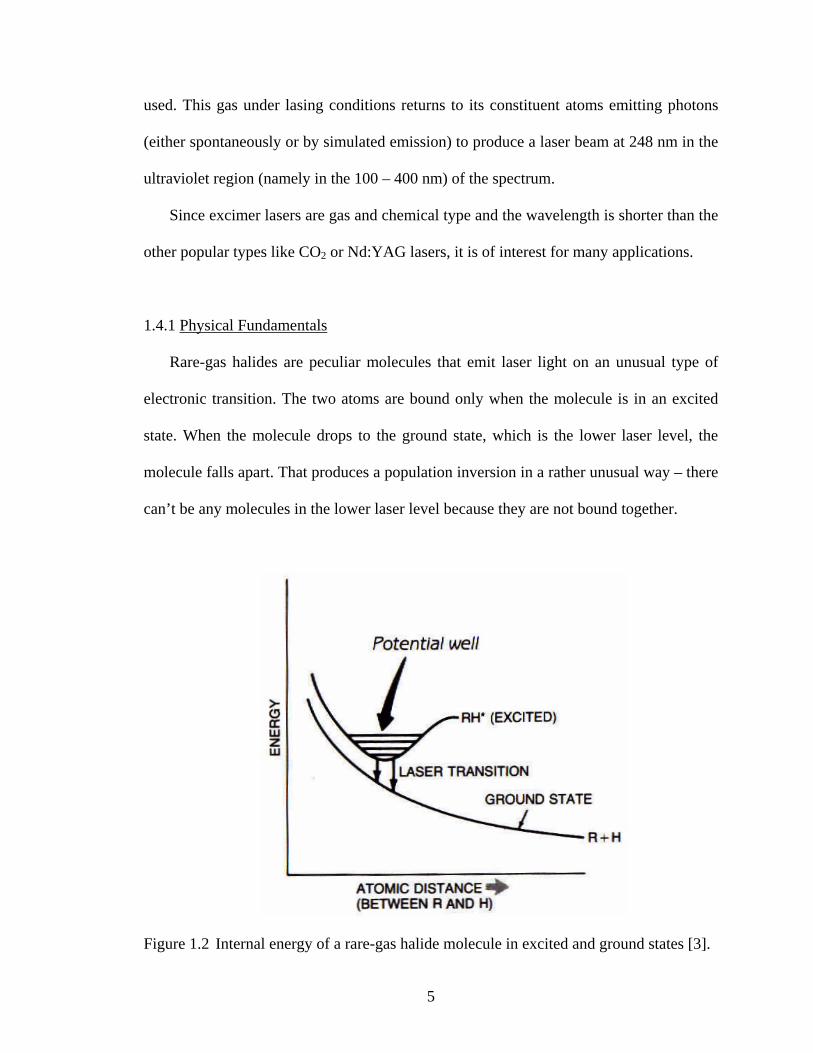
1.4.1 Physical Fundamentals
Rare-gas halides are peculiar molecules that emit laser light on an unusual type of
electronic transition. The two atoms are bound only when the molecule is in an excited
state. When the molecule drops to the ground state, which is the lower laser level, the
molecule falls apart. That produces a population inversion in a rather unusual way – there
can’t be any molecules in the lower laser level because they are not bound together.
Figure 1.2 Internal energy of a rare-gas halide molecule in excited and ground states [3].
6
Figure 1.2 shows the energy levels of a typical rare-gas halide as a function of the
spacing between the two atoms in the molecule. R represents the rare gas and H the
halide. The dip in the excited-state curve shows where the molecules are metastable. The
absence of a dip in the ground-state curve indicates that the molecules fall apart. When
the molecule is excited, the energy is at a minimum when the two atoms are at a certain
distance apart, trapped in a potential well. When they are in that potential well, they can
occupy several vibration levels as well (shown as horizontal lines in the potential well).
However, in the “ground-state,” with the lowest possible energy, there is no bonding
energy to hold the two atoms together and the molecule fall apart, as shown in the lower
curve. This reflects something we know from elementary chemistry, namely, rare gases
do not like to form compounds, even with elements as highly reactive as halogens.
Excimer lasers are excited by passing a short, intense electrical pulse through a
mixture of gases containing the desired rare gas and halogen. Normally, 90% or more of
the mixture is a buffer rare gas (typical helium or neon) that does not take part in the
reaction. The mixture also contains a small percentage of the rare gas (argon, krypton, or
xenon) that becomes part of the excimer molecule, and a smaller fraction of the
molecules that supply the needed halogen atoms. The halogen atoms may come from
halogen molecules, such as F2, Cl2, or Br2, or from molecules that contain halogens, such
as nitrogen trifluoride (NF3). The advantage of avoiding pure halogens is that they are
very reactive. Fluorine, in particular, is so treacherous to handle that the developers of
one high-energy laser that used fluorine spoke of “the fire of the week.”
Electrons in the discharge transfer energy to the laser gas, breaking up halogen
molecules and causing formation of electronically excited molecules like xenon fluoride
7
(XeF*, the * means excited). The reactions involved are very complex and depend on the
type of gases. The molecules remain excited for about 10 nanoseconds, then drop to the
ground state and dissociate. The molecular kinetics (as well as the duration of the driving
electrical pulses) limit the laser operation to pulses lasting tens or hundreds of
nanoseconds. The energies involved are large, and the output is at ultraviolet
wavelengths.
Excimer-laser repetition rates are more dependent on the power supply than on the
gas. The principal limitation is the speed of high-voltage switches. The highest repetition
rates are around 1000 Hz, but more typical values are tens to few hundreds of hertz. Pulse
energies range from about 10 mJ to a few joules, and differ somewhat among gases, with
KrF and XeCl is generally being more energetic. Average power – the product of the
pulse energy times the repetition rate – can reach a couple of hundred watts, although
lower values are more common. Note that in general the pulse energy tends to decrease
with repetition rate.
1.4.2 Structure of Excimer Laser
Excimer lasers have such high gain that they almost don’t need cavity mirrors. In
practice, excimer lasers have fully reflective rear mirrors and uncoated output windows
that reflect a few percent of the beam back into the cavity and transmit the rest.
As in other high-gain pulsed lasers, the discharge in an excimer laser is perpendicular
to the length of the tube. The excimer laser tubes must resist attack by the highly
corrosive halogens in the laser gas. Excimer laser tubes are filled with the laser gas
mixture then sealed and operates for a certain number of shots until the gas needed to be
8
replaced. The tube’s total volume is much larger (typically 100 to 1000 times) than the
volume where the discharge excites laser action. Often, the gas is passed through a
recycling system that helps regenerate the proper gas mixture and extend the life of the
gas fill. The laser’s pulse energy drops with time, until the spent gas must be pumped out
of the chamber and replaced. The number of shots depend on the gas, and can be many
millions of shots for gases, such as xenon chloride.
Although that number of shots may sound impressive, a little multiplication will
show that at high repetition rates it doesn’t amount to very much time. A 200-hertz laser
generates 720,000 pulses an hour. Thus, gas supply is part and parcel of any excimer
laser set-up.
1.4.3 Practical Excimer Lasers
Excimer lasers are the best available pulsed ultraviolet lasers with wall-plug
efficiency of only a couple of percent. Most of the lasers are used in research, but they
are finding increasing applications in medicine and high technology industrial systems,
including refractive surgery on the eye and in the manufacture of semiconductor
electronic devices. These commercial applications have pushed manufacturers to make
more reliable excimer lasers, although the use of halogens still remains a concern.
Laboratory excimer lasers have long been designed to handle several gas mixtures.
This reflects the need for a research laboratory, which one-day may be working with the
308-nm xenon-chloride line, and the next day 193-nm argon-fluoride wavelength.
However, the researchers have to pump out the old gas mixture, passivate the tube to
remove contaminants, then pump out the mixture and replace it with a new laser gas
9
mixture. This is acomplex, time consuming operation. Industrial excimer lasers are
typically made for a specific gas mixture.
Excimer lasers remain complex systems and expensive. The initial investment for a
50 to 250 W laser is from $100,000 to $250,000. Complete turnkey multi-axis machine
tools with the laser integrated can be procured for $500,000 to $1 million per machine,
depending on the machine volume and laser choice. An estimate for a complete laser
drilling machine is approximately $150,000 per machine axis. Several vendors offer
lower-cost systems that may not be sufficiently robust for two- or three-shift operation.
Filters, oil traps and de-ionizing cartridges are relative low-cost items which required
periodic replacement is part of maintenance. Providing the planned downtime, one half to
one day each month or quarter, for maintenance is a primary stumbling block in industry.
Lenses can cost from around $100 to $1,000 each. A high quality lens is generally
preferred, utilizing a high quality antireflection multicoating. Flash lamps are typically
replaced every few million pulses with the replacement rate highly dependent on the laser
parameters. Lamps may be replaced as frequently as once a month and cost $100 to $300
per a pair.
1.5 Laser’s Properties
Lasers take many different shapes. Other characteristics, such as output wavelength
and power level, also differ among lasers. Different types of lasers also share some
common properties, such as the concentration of their output energy into a narrow beam.
Some of the characteristics are interrelated. Major laser properties that influence
10
materials processing are wavelength, output power, duration of emission (pulse or
continuous), beam divergence and size, coherence, efficiency, and power requirements.
1.5.1 Wavelength
Wavelength is the fundamental characteristic of visible light and other forms of
electromagnetic radiation. Each type of laser emits a characteristic wavelength or range
of wavelengths. The wavelengths depend on the type of material that emits the laser light,
the laser’s optical system, and the way the laser is energized. Laser action can produce
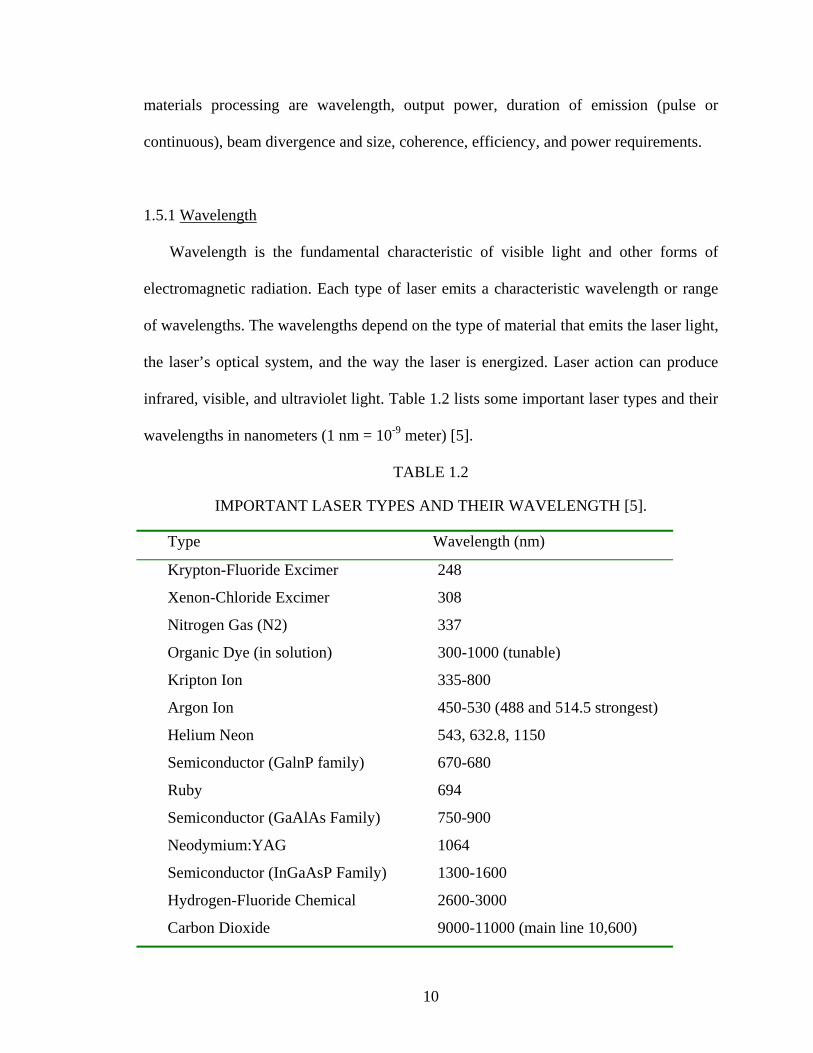
infrared, visible, and ultraviolet light. Table 1.2 lists some important laser types and their
wavelengths in nanometers (1 nm = 10-9 meter) [5].
TABLE 1.2
IMPORTANT LASER TYPES AND THEIR WAVELENGTH [5].
Type Wavelength (nm)
Krypton-Fluoride Excimer 248
Xenon-Chloride Excimer 308
Nitrogen Gas (N2) 337
Organic Dye (in solution) 300-1000 (tunable)
Kripton Ion 335-800
Argon Ion 450-530 (488 and 514.5 strongest)
Helium Neon 543, 632.8, 1150
Semiconductor (GalnP family) 670-680
Ruby 694
Semiconductor (GaAlAs Family) 750-900
Neodymium:YAG 1064
Semiconductor (InGaAsP Family) 1300-1600
Hydrogen-Fluoride Chemical 2600-3000
Carbon Dioxide 9000-11000 (main line 10,600)
11
Most lasers are ‘monochromatic’, which means they emit only one wavelength.
Actually, they emit a range of wavelengths, but the range is so narrow that for most
practical purposes it can be taken as a single wavelength. Some of these lasers emit light
at different wavelengths under different conditions. For example, the helium-neon laser is
best known for its red output at 632.8 nm. However, the same gas mixture can be used
with different optics to emit green light at 543 nm, or to emit infrared. Some lasers can
emit two or more wavelengths simultaneous. This is called multi-line operation. In some
cases, the wavelengths are close together.
1.5.2 Output Power
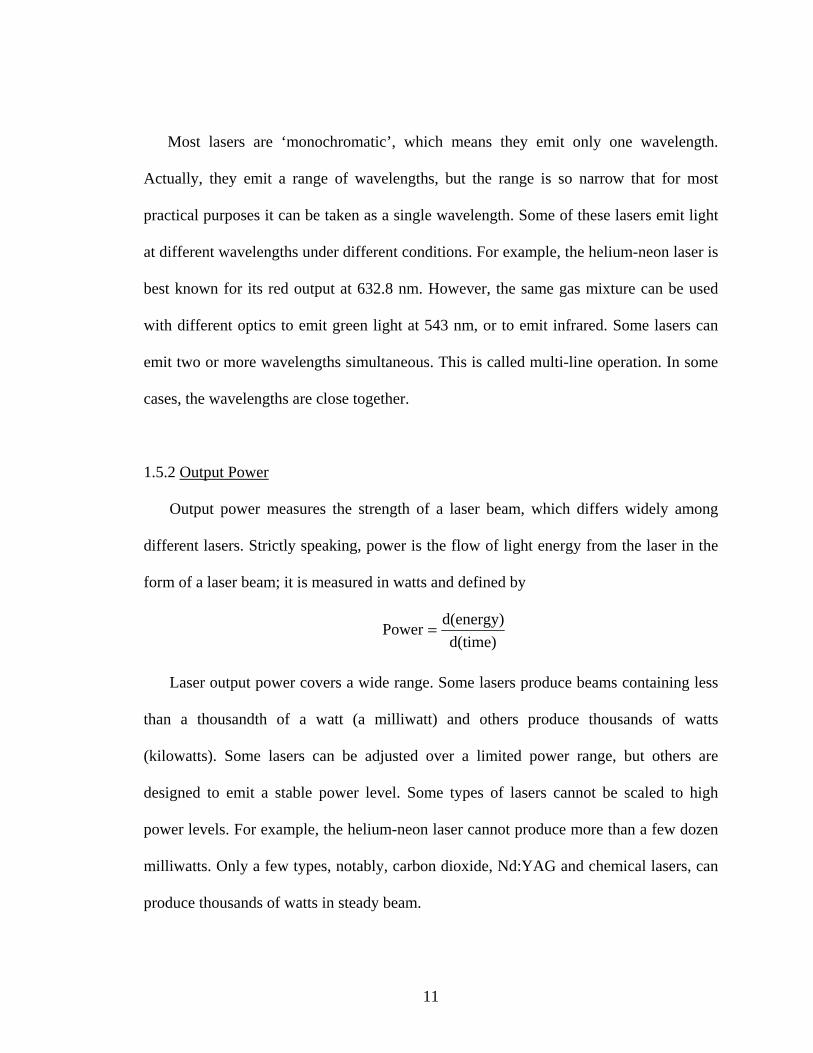
Output power measures the strength of a laser beam, which differs widely among
different lasers. Strictly speaking, power is the flow of light energy from the laser in the
form of a laser beam; it is measured in watts and defined by
d(time)d(energy)Power =
Laser output power covers a wide range. Some lasers produce beams containing less
than a thousandth of a watt (a milliwatt) and others produce thousands of watts
(kilowatts). Some lasers can be adjusted over a limited power range, but others are
designed to emit a stable power level. Some types of lasers cannot be scaled to high
power levels. For example, the helium-neon laser cannot produce more than a few dozen
milliwatts. Only a few types, notably, carbon dioxide, Nd:YAG and chemical lasers, can
produce thousands of watts in steady beam.
12
1.5.3 Duration of Emission
Laser emission duration can be divided into pulses and continuous. Pulses come in
various durations and repetition rates. The length or duration of a pulse can range from
millisecond (10-3s) to femtoseconds (10-15s). The pulses may be repeated once a minute,
or may appear thousands or even millions of times in a second.
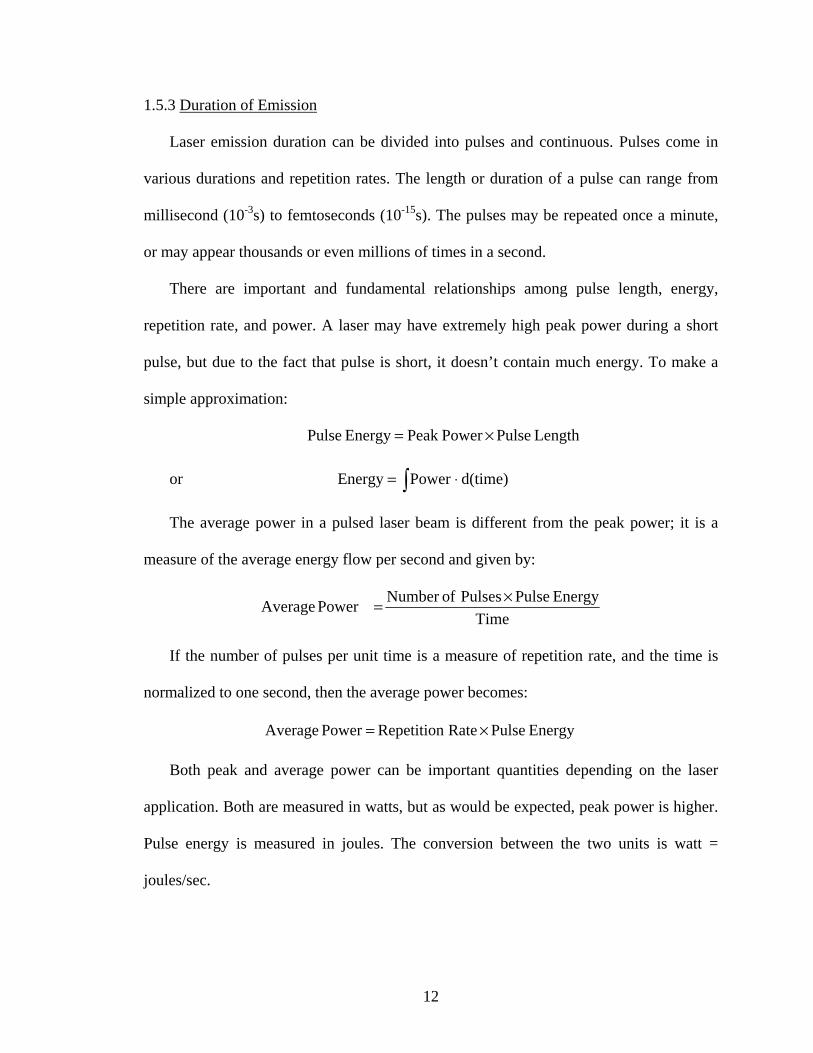
There are important and fundamental relationships among pulse length, energy,
repetition rate, and power. A laser may have extremely high peak power during a short
pulse, but due to the fact that pulse is short, it doesn’t contain much energy. To make a
simple approximation:
Length PulsePowerPeak Energy Pulse ×=
or d(time)PowerEnergy ⋅= ∫
The average power in a pulsed laser beam is different from the peak power; it is a
measure of the average energy flow per second and given by:
TimeEnergy Pulse Pulses ofNumber Power Average ×=
If the number of pulses per unit time is a measure of repetition rate, and the time is
normalized to one second, then the average power becomes:
Energy Pulse Rate Repetition Power Average ×=
Both peak and average power can be important quantities depending on the laser
application. Both are measured in watts, but as would be expected, peak power is higher.
Pulse energy is measured in joules. The conversion between the two units is watt =
joules/sec.
13
1.5.4 Beam Divergence and Size
If a laser beam can be seen shining through dusty air, it looks like a thin string.
However, if you look carefully, it has a certain diameter, the farther the beam travels the
larger is the diameter. This spreading is called divergence. The divergence of a laser
beam allows it to propagate over significant distance without changing significantly in
diameter. This factor also allows it to be collected and focused easily.
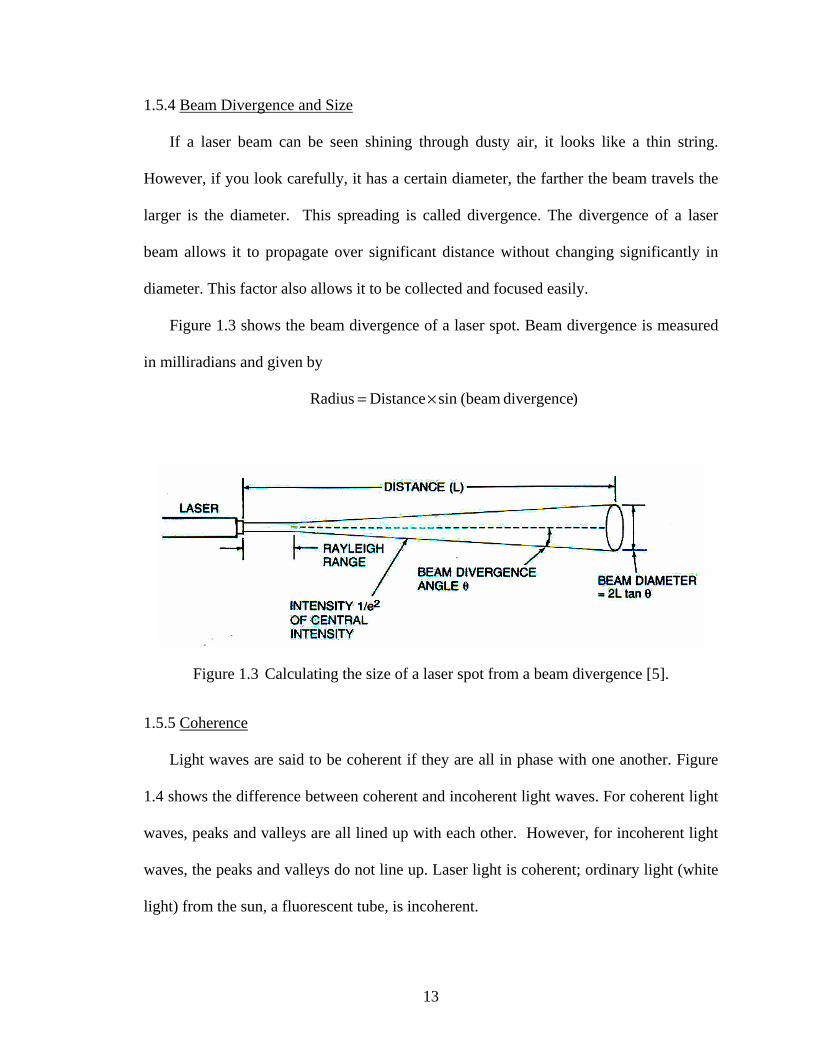
Figure 1.3 shows the beam divergence of a laser spot. Beam divergence is measured
in milliradians and given by
)divergence (beamsin Distance Radius ×=
Figure 1.3 Calculating the size of a laser spot from a beam divergence [5].
1.5.5 Coherence
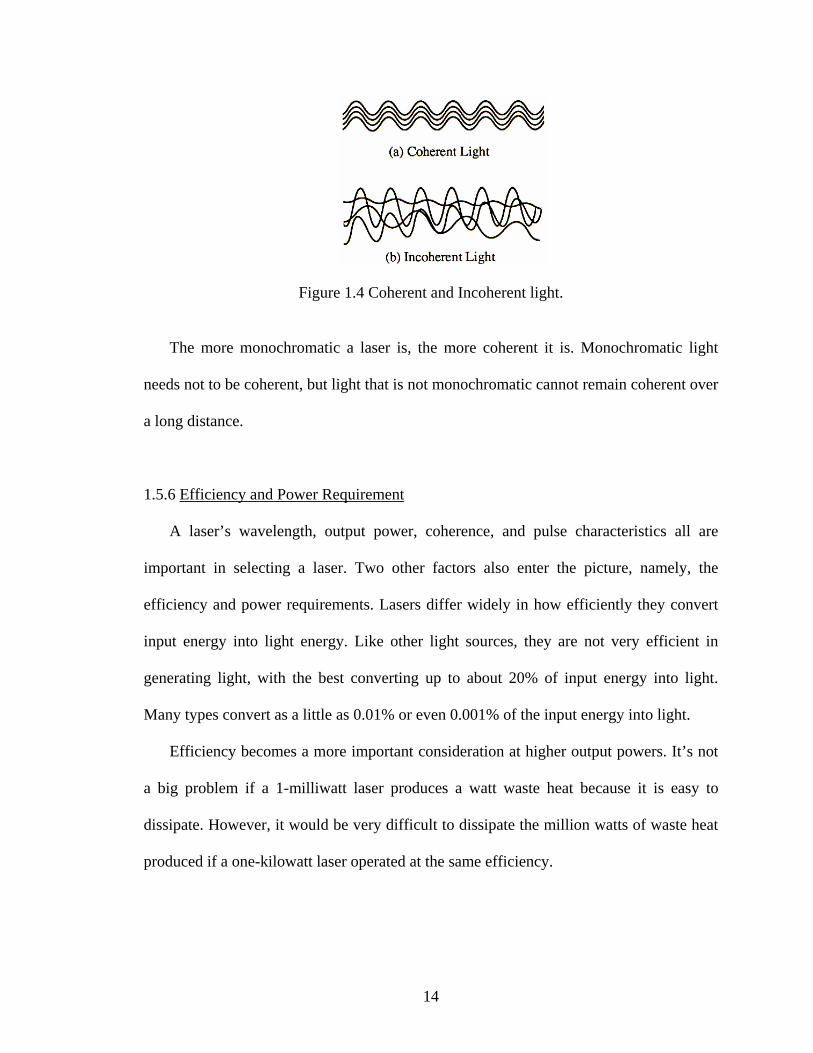
Light waves are said to be coherent if they are all in phase with one another. Figure
1.4 shows the difference between coherent and incoherent light waves. For coherent light
waves, peaks and valleys are all lined up with each other. However, for incoherent light
waves, the peaks and valleys do not line up. Laser light is coherent; ordinary light (white
light) from the sun, a fluorescent tube, is incoherent.
14
Figure 1.4 Coherent and Incoherent light.
The more monochromatic a laser is, the more coherent it is. Monochromatic light
needs not to be coherent, but light that is not monochromatic cannot remain coherent over
a long distance.
1.5.6 Efficiency and Power Requirement
A laser’s wavelength, output power, coherence, and pulse characteristics all are
important in selecting a laser. Two other factors also enter the picture, namely, the
efficiency and power requirements. Lasers differ widely in how efficiently they convert
input energy into light energy. Like other light sources, they are not very efficient in
generating light, with the best converting up to about 20% of input energy into light.
Many types convert as a little as 0.01% or even 0.001% of the input energy into light.
Efficiency becomes a more important consideration at higher output powers. It’s not
a big problem if a 1-milliwatt laser produces a watt waste heat because it is easy to
dissipate. However, it would be very difficult to dissipate the million watts of waste heat
produced if a one-kilowatt laser operated at the same efficiency.
15
1.6 Laser Safety
There are two main potential hazards associated with lasers, namely, the laser beam
and the power supply. Even low-power laser beams can pose some dangers to the eye
while high-power laser beams can burn the skin. The power supply, like any source of
high voltage – or even wall current – can kill.
A laser beam is made up of parallel light rays. The concentration of parallel light rays
in a small beam makes laser power as low as a milliwatt range to be a potential hazard to
eyes. The reason is that the eye focuses those rays, concentrating their optical power in a
small enough area that they can burn the retina. The hazard of a few milliwatts visible
laser beam is comparable to that from looking directly at the sun. An accidental glance
past sun may dazzle your eyes, but staring directly at the sun can cause permanent eye
damage. This is same for laser. The first safest rule is never look directly into any laser
beam.
Higher laser powers pose more serious eye hazards. As continuous-wave power
levels increase, it takes less time for the light to do lasting damage to the eye. If the
power is concentrated in short high-power pulses, even a single shot can do lasting
damage. It can leave a blind spot that impairs vision.
Both visible and invisible laser light poses hazards to your eyes. Invisible (near
infrared and near ultraviolet) light can enter your eye, and near infrared light can reach
your retina without you ever realizing it. Hazards become less at the wavelengths longer
than about 1.55 µm because the light cannot reach your retina, but you nonetheless
should exercise care when working with any laser. Some near infrared laser can be very
16
deceptive because they seem to be emitting extremely weak red beams, but are actually
emitting significant powers at wavelengths which your eyes sense very inefficiently.
Laser safety goggles are made to block the wavelengths emitted by specific lasers
and transmit other light. Good goggles should block light from reaching your eye via any
side paths, such as accidental reflections from the side. Remember that it is vital to use
goggles made for the type of laser you are using, for example goggles made for red
helium-neon wavelength do not block light from an argon laser.
In the history of laser industry, nobody has been killed by a laser beam. However,
several people have been killed when they touched high-voltage source within the laser.
Beware, even when the power is off, components such as capacitors in high-voltage
power supplies can retain a lethal dose of electricity for a long time.
17
CHAPTER 2
FUNDAMENTALS OF LASER –MATERIAL INTERACTIONS
2.1 Introduction
This chapter briefly describes the physical processes that occur during the interaction
of laser radiation with materials. Knowledge of these processes is important for
understanding the capabilities and limitations of laser-based materials processing. These
interactions are the basis for laser applications in material processing.
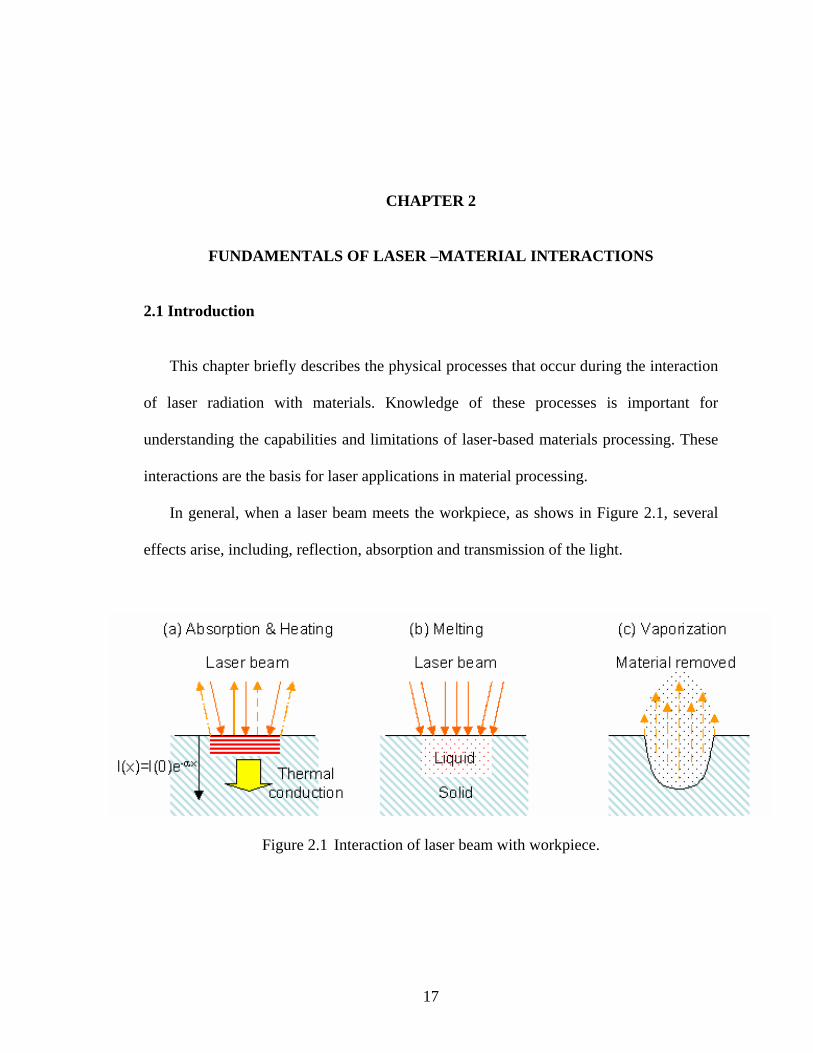
In general, when a laser beam meets the workpiece, as shows in Figure 2.1, several
effects arise, including, reflection, absorption and transmission of the light.
Figure 2.1 Interaction of laser beam with workpiece.
18
2.2 Reflectivity, Absorptivity and Transmisivity
When a laser impinges on the surface of a workpiece, a fraction of the energy is
reflected at the surface, and a part penetrates into the workpiece. A surface cannot absorb
or emit photon. Attenuation takes place inside the solid, as does the emission of
irradiative energy. In practical systems, the thickness of the surface layer over which
absorption of irradiation from a laser beam occurs is very small compared to the overall
dimensions of the workpiece.
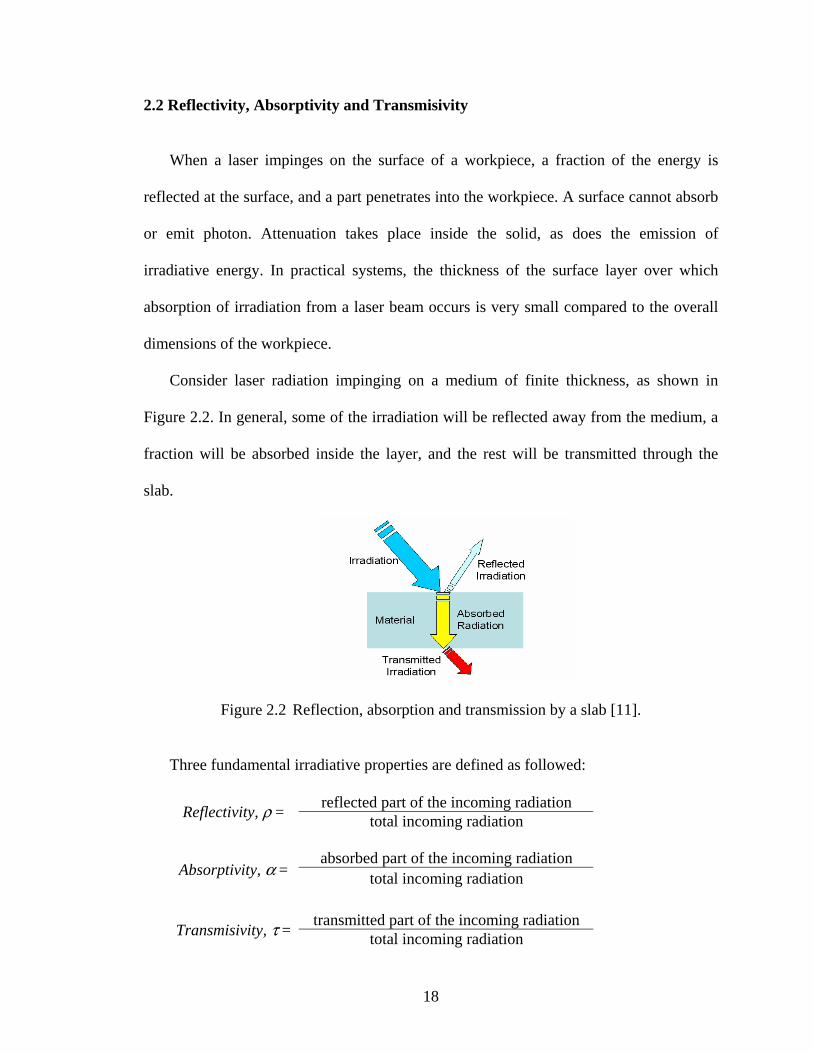
Consider laser radiation impinging on a medium of finite thickness, as shown in
Figure 2.2. In general, some of the irradiation will be reflected away from the medium, a
fraction will be absorbed inside the layer, and the rest will be transmitted through the
slab.
Figure 2.2 Reflection, absorption and transmission by a slab [11].
Three fundamental irradiative properties are defined as followed:
reflected part of the incoming radiation Reflectivity, ρ = total incoming radiation
absorbed part of the incoming radiation Absorptivity, α = total incoming radiation
transmitted part of the incoming radiation Transmisivity, τ = total incoming radiation
19
Since all radiation must be either reflected, absorbed, or transmitted, it follows that
α + β + τ = 1 (2.1)
For opaque medium, then τ = 0, then
α + β = 1 (2.2)
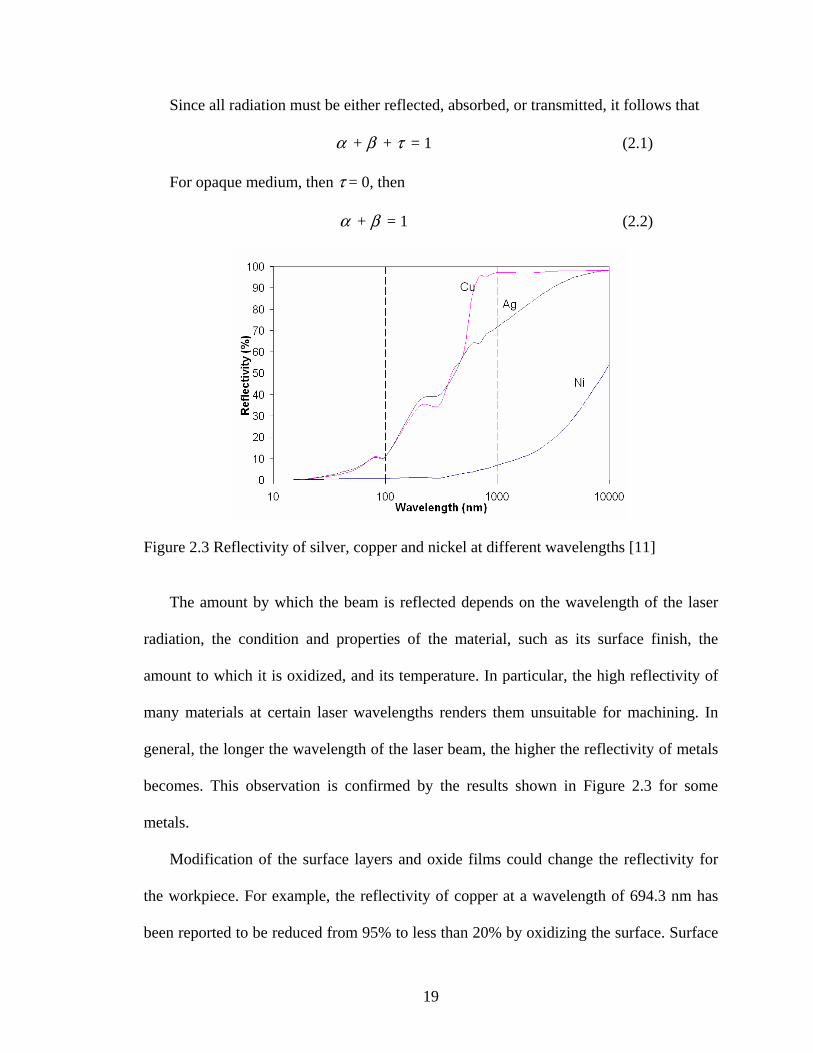
Figure 2.3 Reflectivity of silver, copper and nickel at different wavelengths [11]
The amount by which the beam is reflected depends on the wavelength of the laser
radiation, the condition and properties of the material, such as its surface finish, the
amount to which it is oxidized, and its temperature. In particular, the high reflectivity of
many materials at certain laser wavelengths renders them unsuitable for machining. In
general, the longer the wavelength of the laser beam, the higher the reflectivity of metals
becomes. This observation is confirmed by the results shown in Figure 2.3 for some
metals.
Modification of the surface layers and oxide films could change the reflectivity for
the workpiece. For example, the reflectivity of copper at a wavelength of 694.3 nm has
been reported to be reduced from 95% to less than 20% by oxidizing the surface. Surface
20
roughness also influences the reflectivity of the workpiece. Through geometric optical
explanation, for rough surfaces, laser beam hitting the surface may undergo two or more
reflections off the local peaks and valleys (resulting in increased absorption), after which
it leaves the surface into an off-specular direction.
Nonetheless a reduction in reflectivity leads to an increase in absorption of the laser
energy by the surface, with subsequent increase in the material removal. This absorption
is examined in the following.
The absorption of light in metals takes place by an internal photoelectric effect which
raises the electrons to higher energy states in the conduction band of the metal. Now the
mean free time between collisions for electrons in a conductor is on the order of 10-14 to
10-13 s. Thus in 1 nanosecond, the electrons will have made 1014 to 1015 collisions among
themselves. Since this is a very short period compared to even the shortest laser pulse, the
energy absorbed by the electrons from the laser beam is rapidly passed to the lattice.
The depth over which the absorption takes place may be approximated from the mean
free path of the valence electrons, according to the relation
xeIxI α−⋅= )0()( (2.3)
where
I(x) is the light intensity, W, at depth x of the penetration into the material
I(0) is the incident intensity
α is an absorption coefficient, m-1
For a non-scattering material (without defects, inclusions, bubbles) the absorption
coefficient, α is related to the absorptive index k by
λπα k4= (2.4)
21
Most of the energy is found to be absorbed in a ‘skin depth’ S given by
1−= αS (2.5)
Typically, the energy is absorbed to a depth of about 0.1 µm (for visible and infrared
wavelength). For most organic compounds, absorption is found to take place in less than
1 µm (for CO2 and infrared radiation).
In summary, the laser energy may be regarded as a surface effect, with the energy
penetrating further into the material by thermal conduction.
2.3 Heat Conduction
Conduction is the dominant heat transport mode at low laser power density
application. The conduction of heat from the laser into the workpiece material is an
extremely complex effect. As a result, no satisfactory theory of heat conduction has yet
been applied to laser machining. Nonetheless, useful information relevant to laser
machining can be derived from a simple approach.
Firstly, since the workpiece is assumed to be composed of an isotropic material, the
heat flow through it can be described by the diffusion equation
TtT 2∇=
∂∂ κ (2.6)
where
T is absolute temperature, K
t is time, s
κ is diffusivity , m2s-1
And, the diffusivity is given by
22
ck⋅
=ρ
κ (2.7)
where
k is coefficient of thermal conductivity, Wm-1K-1
ρ is density, kgm-3
c is specific heat, Jkg-1K-1
Useful information about the way heat from the laser is spread through the workpiece
can be deduced from the solution to the diffusion equation (2.6) on the assumptions that
the distribution of the temperature occurs is one-dimensional and that the workpiece is
considered as semi-infinite.
For conditions of zero initial temperature throughout the material, and with the
surface x = 0 maintained at T0 for time t, where t > 0, the solution from Carslaw and
Jaeger [10] is givenly
)2
(),( 0 txerfcTtxT
⋅⋅=
κ (2.8)
where the error function ‘erfc’ is given by
ξπ
ξ de
zerfzerfc
∫ ⋅⋅=
−≡
−∞ 2
0
2)(1)(
∫ ⋅⋅= − ξπ
ξ dezerfx 2
0
2)( (2.9)
2.4 Melting of Surface
On sufficient heating by the laser the workpiece begins to melt. Again the results
from Carslaw and Jaeger [10] are useful. The temperature rise due to a heat flux incident

23
upon the surface (x = 0) of the workpiece, still assumed to be a semi-infinite medium, can
be calculated as
21
00
2|),( ⎟
⎠⎞
⎜⎝⎛ ⋅⋅⎥⎦
⎤⎢⎣⎡== π
κ tkFtxT x (2.10)
where
F0 is constant heat flux, Js-1cm-2
2.5 Convection
1. Stagnation Flow Region 2. Free Surface Boundary Layer Region 3. Cooled Corner Region 4. Solid-Liquid Interface Boundary Layer Region 5. Isothermal Inviscid Core
Figure 2.4 General features of convection in a molten pool [11].
Convection becomes the dominant heat transport mechanism when a molten pool is
created. Surface tension variations arise due to temperature gradients along the interface,
and shear stresses acting on the interface induce fluid motion. Convection in molten pool
affects a large number of laser processes, such as melt quenching, alloying, and welding.
24
Convection is primarily responsible for mixing in the melt pool and therefore
controls the composition during surface alloying. Figure 2.4 shows the general features of
convection in a molten pool [11].
2.6 Vaporization
Very rapidly after melting by the laser, vaporization of the workpiece surface
commences. The rate of vaporization may be related to the incident flux, F, of the laser
by the expression
CdtdxF ⋅= (2.7)
where
(dx/dt) is the rate of recession of the workpiece surface
C is the energy needed to vaporize unit volume of workpiece.
2.7 Plasma Shielding
Plasma shielding normally refers to the fact that once the laser beam breaks down the
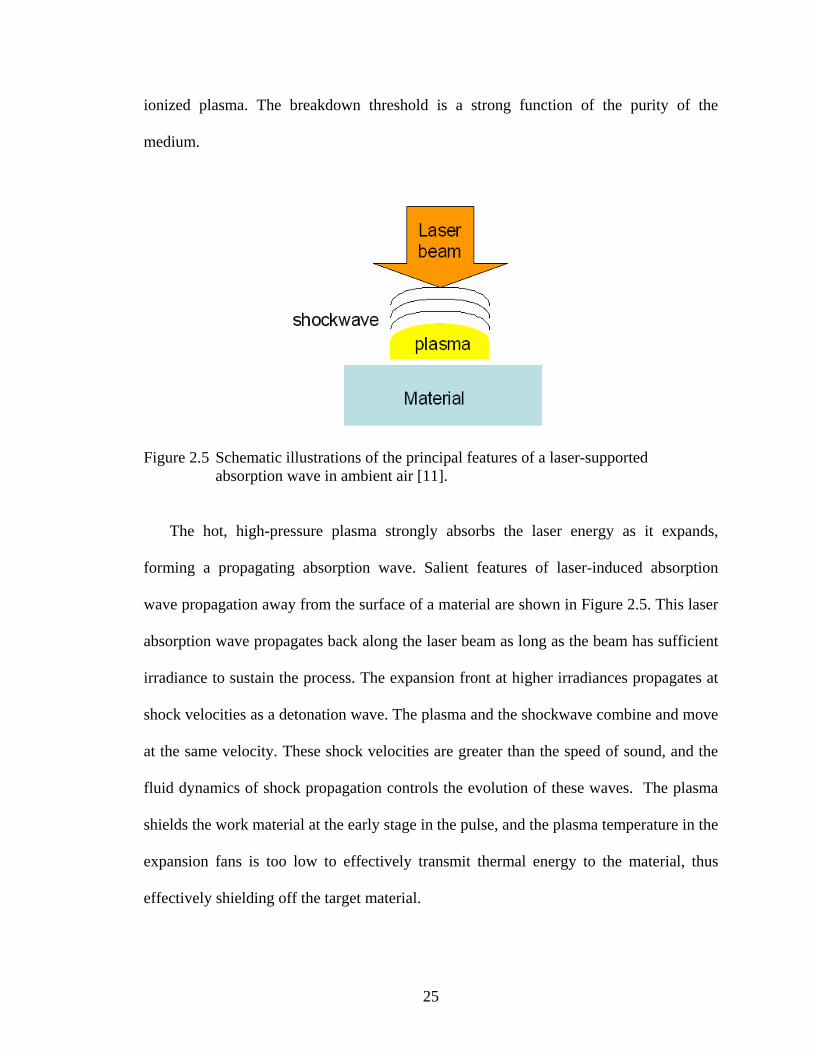
atmosphere, the light is absorbed in the ensuing plasma, and does not reach the work
piece or other intended target of the beam. This absorption of laser energy not only
shields the workpiece from the laser beam, but also produces some effects, such as shock
wave.
When a laser beam with sufficient energy is brought to a tight focus in matter (solid,
liquid, or gas), it will cause the breakdown of the medium and the evaluation of highly
25
ionized plasma. The breakdown threshold is a strong function of the purity of the
medium.
Figure 2.5 Schematic illustrations of the principal features of a laser-supported absorption wave in ambient air [11].
The hot, high-pressure plasma strongly absorbs the laser energy as it expands,
forming a propagating absorption wave. Salient features of laser-induced absorption
wave propagation away from the surface of a material are shown in Figure 2.5. This laser
absorption wave propagates back along the laser beam as long as the beam has sufficient
irradiance to sustain the process. The expansion front at higher irradiances propagates at
shock velocities as a detonation wave. The plasma and the shockwave combine and move
at the same velocity. These shock velocities are greater than the speed of sound, and the
fluid dynamics of shock propagation controls the evolution of these waves. The plasma
shields the work material at the early stage in the pulse, and the plasma temperature in the
expansion fans is too low to effectively transmit thermal energy to the material, thus
effectively shielding off the target material.

26
The presence of the plasma created by the laser beam has significant consequences
for the application of lasers. Plasma at low irradiances can result in higher thermal
coupling to a workpiece than optical absorption, whereas at higher irradiances the plasma
prevents thermal coupling. The pressures in the plasma can produce a mechanical effect
on the workpiece, particularly at higher irradiance. In general, the propagation of the
absorption waves increases, the laser energy carried by the beam away from the intended
point of application, and reduces the desired effect of the beam on the workpiece.
27
CHAPTER 3
LITERATURE REVIEW
3.1 Introduction
Excimer laser ablation � the direct etching of material with a pulsed UV light � has
been the subject of sustained research activity since the early 1980s, when the technique
was first demonstrated by Srinivasan and Mayne-Banton [16]. They named the process
�ablative photodecomposition� (APD). The ablation process is characterized by pulse-by-
pulse removal of small amounts of material, typically in the range of a few hundred Å to
a few µm, with minimal damage to the surrounding area.
Considerable research effort has been devoted towards an understanding of the
fundamental physical and chemical processes involved in laser ablation. Most of the laser
energy is absorbed by a thin layer, typically in the range of 0.1 to 0.5 µm. Numerous
models have been proposed to explain the observed etching behavior of various
polymeric materials. These models invariably assume the ablation process to be either (1)
photochemical, with the absorbed photons leading directly to bond breaking in the
material, or (2) photothermal, with the deposited energy being converted to heat, and
subsequently leading to thermal decomposition [17]. It is generally accepted that in
reality ablation proceeds by some combination of these two routes. Experimental work by
Srinivasan and Garison [17] shows that photochemistry plays less of a role for
28
wavelengths greater than 193 nm. The main mechanism for ablation seems to be thermal
in origin with some photochemical bond-breaking.
3.2 Polymer
A photon of short-wavelength laser has energy ranging from 4 to 10 eV, which
covers the bond energy of most polymeric materials. A photon of a 248 nm KrF excimer
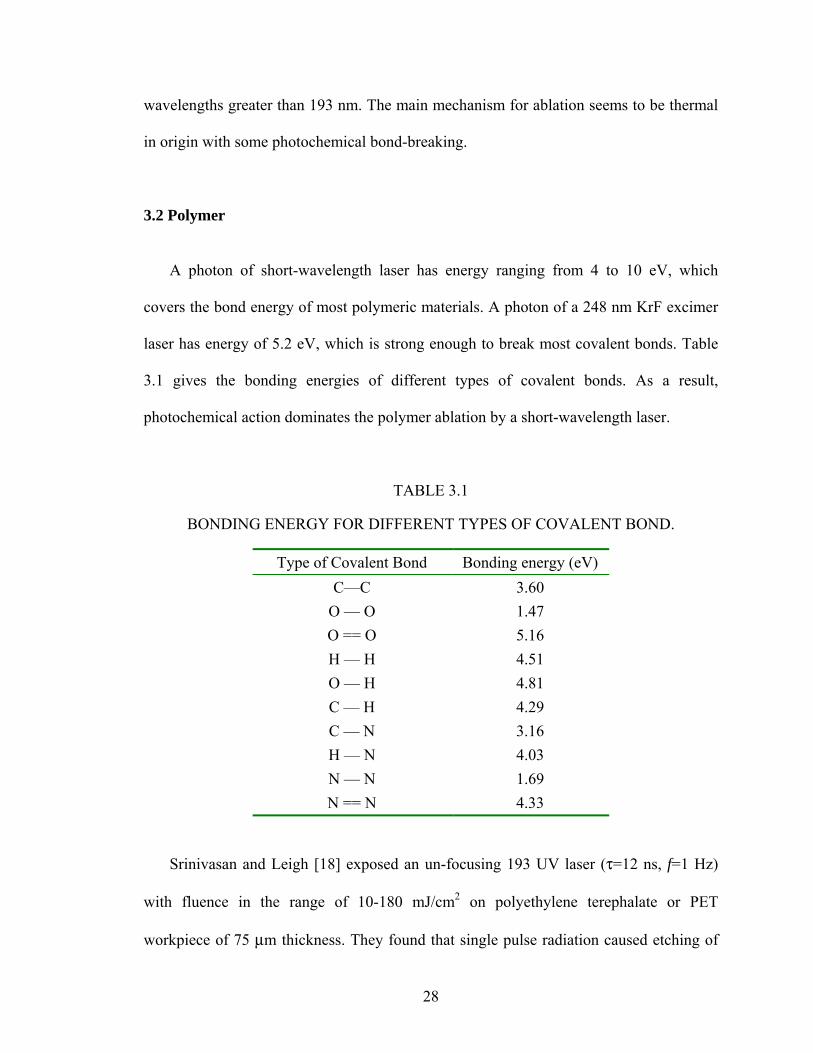
laser has energy of 5.2 eV, which is strong enough to break most covalent bonds. Table
3.1 gives the bonding energies of different types of covalent bonds. As a result,
photochemical action dominates the polymer ablation by a short-wavelength laser.
TABLE 3.1
BONDING ENERGY FOR DIFFERENT TYPES OF COVALENT BOND.
Type of Covalent Bond Bonding energy (eV) C�C 3.60
O � O 1.47 O == O 5.16 H � H 4.51 O � H 4.81 C � H 4.29 C � N 3.16 H � N 4.03 N � N 1.69 N == N 4.33
Srinivasan and Leigh [18] exposed an un-focusing 193 UV laser (τ=12 ns, f=1 Hz)
with fluence in the range of 10-180 mJ/cm2 on polyethylene terephalate or PET
workpiece of 75 µm thickness. They found that single pulse radiation caused etching of
29
the surface of PET and resulted in numerous gaseous products, such as CO, CO2 and
hydrogen. They considered 30 compounds which ranged from C2 to C12, benzene,
toluene, benzaldehyde and ethylbenzene. They also pointed out the possibility of the
excess energy of the photon pulses to be carried away by those fragment and cause no
significant rise in the temperature on the photo-etched film. They named this process as
�ablation�.
Srinivasan et al. [19] also showed photographs of ablation and etching of the surface
of PMMA by 248 nm laser radiation. They reported that modification of the surface
structure of the PMMA to be visible initially at 12ns and completed in about 60 ns.
Emerging solid material, preceded by shock wave first became visible at 60 ns, reaching
a maximum in intensity at 6 µs and continued until 20 µs. Solid materials or debris from
the ablated zone did not leave the surface until the UV pulse is over ~1 ms.
Morphological changes and chemical modifications of materials treated with an
excimer laser have been report by Lauren and coworkers [20]. They performed surface
treatment on polyether-etherketone (PEEK) with ArF (λ=193 nm, τ=20 ns, f=20 Hz) and
KrF (λ=248 nm, τ=30 ns, f=20 Hz) and their results indicate that laser wavelength
strongly affects the nature and properties of the treated materials. At 193 nm, bonds
breaking (ether) induced under photon irradiation led to the formation of polar oxidized
groups (carboxyls and hydroxyls) that gives hydrophilic and acidic properties to the
surface. These new surface properties are responsible for an increase in the adhesion
properties until massive oxidation degrades the mechanical properties of the surface and
decreases the bonding properties. For 248 nm, surface degradation does not allow a
significant improvement of the adhesive properties despite the formation of polar groups
30
and assume that this could be related to either thermal effect or photon induced chain
scissions (degradation).
Feng et al. [21] presented results of ablation of polypropylene (PP) using a 248 nm
KrF excimer laser (τ=30 ns, f =10 Hz) with a fluence in the range of 0.4�2 J/cm2. They
showed both experimentally and theoretically that thermal and photochemical
mechanisms are to be operative simultaneously during the irradiation process. They also
showed existence of thermal affected zone (TAZ) together with ablative zone (AZ) and
unaffected zone (UAZ) in the ablated crater. Increase in both fluence and the number of
pulses led to more striking thermal effect as demonstrated by the spatial expansion of the
rim for polypropylene.
Chen et al. [22] performed multi-pulse drilling on polyimide (0.050 mm in thickness)
and PETP using 248 nm excimer laser. Increase in etch rate with increase in fluence was
reported. Clean and smooth edges were reported at fluence below 2.7 J/cm2, while high
fluences led to the formation of some structures (or debris) at the top surfaces of the
edges. At high fluence, the process no longer remained purely photochemical in nature
and significant thermal degradation was reported. They also pointed out that wall angle
decreases with an increase of energy fluence (taper of the holes) due to diffraction effects
at the edge of the mask that produces lower fluences and lower etch rates in the region.
Optimal energy densities for polyimide and PETP ablation were reported to be 1.7 J/cm2
and 0.36 J/cm2, respectively.
Dyer and Karnakis [23] reported incubation of UV absorbing chromophores by
photoinduced modification appears to play a major role in controlling abaltion of low
density polyethylene (LDPE) under irradiation of ArF (193 nm). They also found that
31
long term, low fluence permits high quality etching compared to higher fluence which
give poorer quality involving high density of small blow-holes suggestive of the release
of gaseous products. At low fluence, little or no redepositted debris appeared. They also
pointed out a small increase in laser energy transmission for LDPE during the first few
pulses and steady decrease as the number of pulses increase. They assumed that the first
few pulses would remove the contaminants on the surface.
Braun et al. [24] spin coated polyimide (Pyralin PI 2560, DuPont, thickness 12 µm)
and ablated it with KrF (τ= 20 ns) in atmosphere from 25ûC to 200ûC. They showed the
ablation rates to drop with increase in temperature for laser fluences between 60 and 2750
mJ/cm2. By using Beer�s Law of absorption, they fitted an empirical linear correction
term, which decreases with increase in substrate and ambient temperatures. Only small
differences in index of refraction (1.75 @ 25ûC and 1.78 @ 220ûC) have been observed
and that can not explain the decreasing ablation rate vs. increasing substrate temperature.
As to date, no satisfactory physical nor chemical explanation could be found for this
behavior.
Srinivasan et al. [25] etched PMMA with 248 nm which has a FWHM of 40-100 ns.
They found the etch depth to depend on the pulse width. They also found that solid
products that are generated from the leading edge of the laser pulse shielding off the latter
portion of the incoming pulse in polyimide.
Dijkkamp et al. [26] reported results of experiments designed to study the role of
thermal processes in pulse laser induced ablation of polymers. They observed rapid
decomposition caused by the thermal processes.
32
Dyer et al. [27] measured the thermal coupling and etch rate for Polyethylene
terephthalate (PET) and polyimide films irradiated with 193, 248 and 308 nm. They
reported thermal energy balance up to threshold fluence and remains constant there after,
the excess energy being carried away by the ablated material and limit surface
temperature rise. The temperature of ablated material was calculated to be >103K.
Gorodetsky et al. [28] reported calorimetric and acoustic studies of the ablation
process in KaptonTM using 193, 248 and 308 nm. Above threshold fluence as much as 80-
90 % of the laser energy was used to break chemical bonds. Absorption energy density is
independent on the wavelength. Ablation energy is used for bond breaking and ejection
of the fragments. They concluded that both photochemical and photothermal effect are
important to the ablation process.
Danielzik et al. [29] found that 193 nm will directly scission the chemical bonds of
PMMA into MMA monomer. Infrared temperature measurements of MMA monomer
which has been ejected was conducted and found that temperature increased with
increase in fluence.
Srinivasan et al. [30] using high fluence (>1 J/cm2) of 193 and 248 nm ablated
Polyimide, PMMA and TNS2 (an IBM proprietary material) photoresist. From their
model, they predicted high fluence has a substantial thermal contribution in the fluence
range of 2-18 J/cm2 per pulse.
Brannon et al. [31] used infrared spectroscopy and coupled gas chromatography/mass
spectroscopy to identify several gases evolved during etching polyimide with 248, 308
and 351 nm in air and vacuum. CO2, CO and H2O, gases such as HCN, traces of benzene,
and perhaps other high-molecular weight hydrocarbon are formed during the ablation.
33
Small amounts of brownish, incompletely combusted, condensed material remained near
the etch site. O2 was shown to take no direct role in the etch rate.
Brandon et al. [31] and Srinivasan et al. [32] reported the formation of black solid
�soot� when polyimide was ablated. This black solid was made up of elemental carbon.
Dyer et al. [33] reported stress waves generated by ablation and sub-threshold
thermoelastic mechanism in irradiated polymer. At high fluence, ablation was reported to
commence within 4-6 ns of the start of the laser pulse and generate short acoustic
impulses (~20 ns) with a peak stress of >107 Pa.
Dyer et al. [34] reported incubated absorption and ablation in polypropylene
irradiated with 193 nm. Ablation occurs after a significant number of pulses as a result of
photoinduced modification of the polymer which induces new chromophores, raising the
absorption coefficient. The quality of the ablated surface is reported to be superior under
this condition as any thermal loading is lower and radiation penetration is confined to a
much shallower level.
Dyer et al. [35] reported that the scale of the embryonic surface non-uniformity plays
an important role to determining the final features produced. They also showed that re-
deposition of ablated material extends to a distance of 0.5 mm at the edges of the ablation
site.
Changes in the surface of a film of polyethylene terepthalate (PET) and polyimide
(KaptonTM) with 248 nm (FWHM 20 ns) in air have been measured by Srinivasan and et
al. [36] by probing the surfaces with visible laser pulses of <1 ns at delay times of 10-
10000 ns. They reported an intense and rapid darkening of the surface at <60 ns which
may be due to scattering of the beam by gas bubbles. In 100-1000 ns, a large blast wave
34
was reported to be visible. At the end, the polymer surface was not darkened but an etch
pit was apparent.
Sutcliffe et al. [37] defined the term �incubation pulses� as pulses of ultraviolet laser
irradiation which are directed initially at a polymer surface and which etch less depth per
pulse than subsequent pulses which remove identical depths of material at each pulse. A
model based on a time-dependent treatment of the ablation of organic polymer surfaces
by UV laser radiation was proposed.
Srinivasan et al. [38] reported incubation phenomena in PMMA at 193 and 248 nm
(<1 ns). They observed elevation of surface of PMMA the first 3 pulses before ablation
took place. The elevated material is soluble and can be washed away by solvent resulting
in a net hole. This build up was reported by Kuper and Stuke [39] as the formation of
photoproducts such as methyl formate.
Davis et al. [40] studied the transmission of PMMA during laser ablative
photodecomposition. When threshold fluence is used, a discrete change of the
transmittance after the first pulse was observed due to a combination of the deposited
debris. When several times of the threshold fluence was used, a rapid decrease in
transmission occurred during the first pulse due to scattering and absorption of the laser
light by the ejecting material during the initial part of the pulse. The increased scattering
by the plume, during the first pulse, caused the intensity transmitted to the resist to drop
and the rate of removal of material to fall.
Srinivasan et al. [41] found that with 193 nm, 18 % of the ablated PMMA wais
MMA, whereas at 248 nm less than 1 % appeared as MMA. Their results suggest that
ablative photodecomposition involve both a one-photon process, which gives rise to
35
MMA and low molecular weight polymeric fragments and a multi-photon process, which
gives rise to products such as C2 with high translation energy. At longer wavelengths, a
high temperature rise within the ablated volume may be necessary to increase the
quantum yield for breaking. Estler and et al. [42] also performed similar experiment with
266 nm, the major products were dominated by CO2, CO and methymethacrylate
(MMA).
Dyer et al. [43] studied the ablation process on Uniplex polyimide (PI) and low
density polyethylene (LDPE) at 193nm using high speed shadow photography (HSSP),
probe beam deflection (PBD) and time resolved interferometry (TRI). They found the
ablation products to travel at supersonic velocities and form shock front with HSSP.
�Mushroom cloud� of large fragment products was captured by HSSP. Threshold fluence
for the PI and LDPE was found to be 20 and 200 mJ/cm2, respectively. They also found
that the laser �incubation� pulses for the LDPE was 60 pulses.
3.2 Silicon
The literature on laser ablation of materials, in general, is quite extensive. An attempt
will be made to include representative works that closely cover the subject area under
investigation, namely, short pulse laser ablation of silicon with a 248 nm excimer laser in
air and under water. This way the scope can be limited and consequently, the material to
be covered under the literature review. Kruusing [46, 47] recently published an extensive
review of both underwater and water-assisted laser processing of materials in two parts.
Each part covers some 120 references and should be consulted for more details on
research work conducted by other researchers.
36
Kruusing [46] considered the presence of water in laser ablation in the following
three categories: (1) the presence of water in the form of moisture or humidity in air, (2)
water as a working environment in some underwater processing applications, and (3)
addition of water for special purposes, such as to avoid redeposition of the debris
generated on to the finished surface, or to cool the workmaterial, or act as a chemical
agent, or to increase plasma pressure, or to conduct light. All water-assisted laser
processing techniques rely on the basic physical phenomena involving transmission (or
absorption) of light by water; water vaporization; plasma formation, expansion, and
quenching; bubble formation, growth, and collapse; and finally shock wave formation
and propagation.
Some of the advantages of water-assisted laser processing include the following: light
transmission, development of higher plasma pressure due to confinement, water carrying
away the debris, more effective cooling, useful chemical reactions, reduced pollution by
waste gases and aerosols, reduced noise level, higher optical breakdown threshold than in
air, and smaller focal spot size.
Some of the disadvantages of laser ablation under water include the following: some
light is absorbed by water; light may be scattered by the water surface, suspensions, and
bubbles; power loss due to water cooling; water photolysis; water vapor hazardous to
electronics; and possible corrosion of materials.
Krussing [47] reported the laser ablation rate under water to be higher than in air for
some materials (or experimental conditions), while for other materials, it is just the
opposite. For example, the etching rate of silicon was reported to be two times higher in
37
water than in air at laser fluences of up to 5 J/cm2. In contrast, in the case of various
metals, Krussing [47] reported that the etching rate is about half of that in air.
Davis et al. [48] showed high resolution direct etching of GaAs (thickness of 420 µm)
using excimer laser with wavelength of 193 nm (ArF), 248 nm (KrF) and 351 nm (XeF).
They pointed out that threshold fluence (23, 33, 80 J/cm2 respectively) for etching in air
increases at longer excimer wavelengths. The morphology of the etched region depends
on the wavelength. They also found that when irradiating the GaAs at all wavelengths
with low incident fluences (≤ 180 mJ/cm2) in either vacuum (10-2 Torr) or N2 (1 atm)
environments, the etch depth per pulse is less than a quarter of that observed when
exposure takes place in air. Some etching of GaAs occurs as a result of photochemically
induced reaction with atmospheric oxygen. According to Herzberg [84], wavelengths
longer than ~ 244 nm cannot photodissociate O2 directly by single photon process. Davis
et al. [48] proposed that the reaction may be induced by the hot substrate interacting with
oxygen to form an oxide layer on the surface that changes the absorption characteristics
of GaAs.
Dupont et al. [49] conducted an experimental wavelength to characterize and enhance
the ablation of materials using common industrial laser sources from UV (248 and 308
nm), to visible (532 nm), to infrared (1064 nm) using a stainless workmaterial. They
investigated the effect of plasma confinement on material ablation. A flowing water film
was introduced to trap the plasma created upstream of the sample thereby stopping the
expansion of the plasma and increasing in the mechanical impulses (shock waves)
communicated to the workmaterial. They reported an increase in efficiency of ablation by
a factor of 2 to 15 for a given incident power density. Dupont et al. [49] also found this to
38
be the case with alumina and silica glass. This observation runs counter to the results of
the review presented by Krussing [47].
Park et al. [50] investigated the transient pressure generated by the interaction of
short-pulsed laser light with the liquid-solid interface using a photoacoustic probe beam
deflection method and a broadband piezoelectric transducer. They postulated that when a
short pulse (nanoseconds) KrF excimer laser beam irradiates water on a solid surface, it
induces rapid thermal expansion and explosive vaporization. They reported
compressional pressure wave with peak intensity on the order of 1 MPa at laser fluences
up to ~100 mJ/cm2. By monitoring the bubble growth kinetics, Park et al. [50] observed
that pressure generation is enhanced by the bubble expansion in the superheated water for
laser fluences exceeding the bubble nucleation thresholds.
Sano et al. [51] found an improvement in residual stresses from tensile to
compressive by underwater laser irradiation due to impulsive pressure of the laser
induced plasma generated by the interaction of the intense laser pulse with the
workmaterial. The plasma was generated by the irradiation of the second harmonic of a
Q-switched Nd:YAG laser (λ= 532 nm) on a SUS 304 stainless steel workpiece. The spot
size was 0.75 mm and the pulse duration was 5 ns. They reported the formation of a
high-pressure plasma on the surface of the workmaterial by irradiation of an intense laser
pulse and this pressure is significantly enhanced by the presence of water. They estimated
that the pressure of the water-confined plasma to exceed 2 GPa. They also deduced that
some 20% of the plasma internal energy would represent the thermal energy.
Kim and Grigoropoulos [52] and Kim et al. [53] investigated the mechanisms of
pulse laser-induced ablation of strongly absorbing liquids and the generation of acoustic
39
transients. They used aqueous solutions of K2CrO4 and pure water and irradiated with
KrF excimer laser and CO2 laser, respectively. They observed the ablation process,
including the vapor cavity formation and the acoustic wave propagation, using laser flash
photography. When the absorbing liquid surface is irradiated by a laser pulse and the
energy exceeds a certain threshold, ablation is initiated by thermal (effected by
temperature rise) or mechanical (caused by local pressure drop) mechanisms depending
on the evolution of temperature and pressure fields. If the heating rate is gradual, the
ablation is induced by thermal evaporation due to temperature rise under ambient
pressure without significant pressure variation during the process. However, the ablation
threshold is determined by the local pressure drop in the case of 'rapid' heating by a short
pulsed laser.
Kim and Grigoropoulos [52] also reported no significant surface deformation or
ablation plume ejection during the laser pulse irradiation despite the high surface
temperature rise above the superheat limit. A noticeable surface deformation occurs after
the laser pulse. The upward vapor plume ejection and the shock-wave propagation in air
indicate that surface depression is caused by the recoil momentum applied by the ablation
plume. In this stage, intense hydrodynamic motion of the bulk liquid is activated,
generating upward flow and bulk-liquid ejection. This suggests that significant
enhancement of mass ejection can be achieved by the action of cavitational bubble
dynamics after the laser pulse irradiation.
Ho et al. [54] conducted a computational heat transfer and gas dynamics study in
pulse laser evaporation of metals. They showed that the ejected high-pressure vapor
generates shock waves against the ambient background pressure.
40
Gieger et al [55] conducted excimer laser ablation tests under a thin water film to
modify the microstructure of materials, mainly, ceramics. They used a KrF excimer laser
with an energy density of 9 J/cm2 and a pulse frequency of 10 Hz. They compared dry
machining with underwater machining and found that in underwater machining, the
redeposition of ablated material was completely avoided resulting in better quality of
finished surface and the need to remove the debris generated subsequently. They also
found that melting of the irradiated material is reduced by applying a thin film of water.
They reported that for some ceramic materials(e.g. alumina), the ablation rate is increased
significantly (~15 times) while for many other materials, for example, SiC, Si3N4, ZrO2,
AlN, glass, steel, polyamide, the ablation rates were much lower (1/3 to 1/2) compared to
the machining in air.
Andreic et al. [56] investigated droplet formation during laser sputtering of high-
purity single-crystal silicon with a nitrogen laser radiation wavelength of 337 nm, pulse
duration of 6 ns, a maximum energy density of 1.1 J/cm2, and non-uniform target-energy
distribution. They observed many micrometer-sized droplets ejected out of it and
splashed onto surrounding target area. They proposed that droplets are produced with a
single laser pulse as a result of hydrodynamic instability of the molten surface layer.
They attribute the intense splashing as a consequence of the large plume pressure
generated by the most intense parts of the laser beam.
Feng et al. [57] investigated the co-occurrence of photochemical and thermal effects
during laser polymer ablation using a 248 nm excimer laser with a fluence in the range of
0.4 to 2 J/cm2 and at a repetition rate of 10 Hz. They showed that depending on the
photon energy relative to the bond breaking energy, photochemical and/or thermal
41
mechanisms can be predominant. It appears that in the case of ablation of silicon by short
pulse lasers, the thermal mechanism may be more predominant.
Jeong et al. [58] investigated various material removal mechanisms involved in
single-pulse laser ablation on a single-crystal silicon by high irradiance (109 to 1011
W/cm2). They pointed out that an understanding of the material removal mechanisms
requires the identification of the dominant energy transport mechanism. According to
them, the material removal can occur by both thermal and athermal mechanisms. The
incident laser radiation on silicon creates a large population of highly excited non-
equilibrium electrons near the sample surface. This can lead to bond breaking, an
athermal mechanism. Alternately, the excited electrons transfer energy to phonons during
electron-phonon relaxation. The energy is redistributed through lattice vibrations and
consequently heat is conducted into the sample. This heat may melt or vaporize the
sample. Material removal in the form of large micrometer sized droplets can also result
from hydrodynamic instability of the molten liquid layer.
Yoo et al. [59] used a Nd:YAG laser emitting a beam at 266 nm by quadrupling the
fundamental frequency. The silicon sample was ablated using a laser beam size of 50 µm.
They found a sudden increase in the slope of the crater volume to laser irradiance at ~2.2
x 1010 W/cm2. This is accompanied by large size droplets leaving the silicon surface with
a time delay of ~300 ns. They proposed that explosive boiling (phase explosion) may be
the dominant mechanism for material removal for laser irradiance greater than ~2 x 10¹⁰
W/cm2.
Zhu et al. [60] conducted laser ablation of silicon using a KrF excimer laser of
wavelength 248 nm and pulse duration of 23 ns. They reported that laser ablation rate is
42
highly enhanced by the water film. They assumed that plasma generated in the water
confinement region induces a much higher pressure. Once generated, the plasma expands
adiabatically at a supersonic velocity, creating a shock wave in front. The high pressure,
high temperature plasma results in much higher ablation rate. They reported the laser
fluence threshold for silicon to be ~1.5 J/cm2, which is close to the value found in the
present investigation, namely, 1.4 to 1.7 J/cm2.
Jaschke et al. [61] conducted ultrafast (20 and 500 fs) laser ablation of silicon using
MD simulations and experiments using a Ti:Sapphire laser. They determined ablation
thresholds for pulse durations of 25 and 400 fs. A similar study in the nanosecond region
would be extremely useful for experimental studies involving short pulse laser ablation of
silicon.
Craciun et al. [62] investigated the surface morphology of single crystal (100) silicon
irradiated by 266 and 1064 nm laser pulses emitted by Nd:YAG laser. The found the
morphology at the bottom of the crater with 266 nm wavelength, which is well absorbed
by silicon, (optical absorption coefficient, a = 10 cm-1) remained flat and featureless. The
rims of the craters shown signs of radial liquid flow but the vaporization is confined to
the surface region.
Amer et al. [63] investigated induced stresses and structural changes in silicon wafers
as a result of laser micromachining using µ-Raman spectroscopy. They used a KrF
excimer laser (248 nm wavelength) with energy of 30 µJ per pulse and a pulse frequency
of 100 Hz. They found high tensile stresses (~0.8 to 1GPa) and formation of amorphous
silicon (up to 14%) by laser irradiation.
43
3.3 Borosilicate Glass
Kawaguchi et al. [64] exposed polished silica glass to pulsed KrF radiation.
Somewhat below the threshold for surface optical damage, transient localized
luminescence due to micro-plume formation is observed. Surface optical breakdown
itself is accompanied by localized luminescence due to excited neutral Si atoms region.
These craters reflect the localized heating and vaporization that give rise to the Si
luminescence. The morphology of surfaces damaged by cumulative exposure at fluences
below the damage threshold and by single pulses at fluences above the threshold is
similar, suggesting that damage under cumulative exposure involves the damage centers
responsible for single pulse damage.
Ihlemann [65] based on his comparative study of different wavelengths, pulse
durations, and surface qualities concluded that different ablation mechanisms are
involved: The first seems to be based on volume absorption, bond breaking and material
expansion, and the second appears to be controlled mainly by damage in relation to the
singularity conditions at the surface.
Omori and Inoue [66] observed thermal effect in the excimer laser ablation of
inorganic materials. In the case of femtosecond laser, two different absorption
mechanisms were observed. The first occurs during the initial laser pulses with fluences
above the ablation threshold and determines the incubation range. There, multi-photon
absorption results in moderate energy volume densities. The second mechanism is
determined by a much higher absorption at defects created irreversibly during each
additional pulse. It results in gasification without major participation of the melt. If only
multi-photon and instant color centre generation prevail, crater diameters should be
44
independent of the number of pulses since each single 300 fs pulse would generate its
own absorptivity which reversibly would vanish afterwards. However, the irreversible
laser-induced defects have to be generated for efficient ablation. The rate depends on the
local defect generation which is a direct function of the local intensity decaying towards
the edges of the laser spot profile. Therefore, fluence increases resulting in greater hole
diameters.
Sokolowski et al. [68] observed hydrodynamic expansion of a hot, possibly
supercritical fluid, in the case of femtosecond laser-induced ablation for semiconductor
and metal surfaces. They found that during the ablation process, material undergoes a
transition from an initial metallic state into a highly refractive, insulating phase.
Buerhop et al. [69] conducted laser ablation and surface modification of glasses using
CO2 laser and XeCl excimer laser. They reported float glass fractures after irradiated for
40 s at 60 W/cm2 with CO2 and, vitreous silica withstands higher intensities and material
removal occurs by evaporation. For XeCl laser, experiment was conducted between 9 and
20 J/cm2. When the threshold fluence was exceeded, noise emission, plasma generation
and ablation of front surface were observed. Glasses with higher absorption coefficient
have lower ablation rates. Glass contenting 8% iron gave a constant ablation rate (0.7
µm/pulse) regardless with increases of fluence. Float glass gave 2 µm/pulse and with
slight increase in ablation rate with increase of fluence. However, borosilicate and
vitreous glass showed a decrease in ablation rate with increase of fluence. However, the
reason for this is unknown.
Buerhop et al. [70] used CW CO2 laser (8.6 µm), pulsed Nd:YAG laser (1064 nm)
and pulsed XeCl excimer laser (308 nm) to treat fused silica and soda-lime silicate glass
45
using power densities of 106 W/cm2. They investigated melting, softening and ablation
effects for all the glasses. Evaporation of material produced 0.3 mm diameter holes in
fused silica under CW CO2 laser. And, no obvious surface reaction by Nd:YAG laser,
somehow XeCl gave high ablation rate of 10 µm/pulse but rough surface finish. They
also reported tangential crack around the hole during the cooling process for CO2 and
Nd:YAG laser heat treatment of soda-lime-glass. For XeCl excimer laser, with threshold
fluence of 3 J/cm2, cracks were observed only in the solidified thin molten layer.
Jackson et al. [71] performed excimer laser ablation of neodium (Nd) doped glass and
Nd doped yttrium aluminum garnet (YAG) using ArF (193 nm) and KrF (248 nm). They
found the threshold fluence in the range of 0.5-1.6 J/cm2.
Dyer et al. [72] found the ablation threshold fleunce for soda lime glass to be 1.0
J/cm2 for 248 nm. Fluence above this value produced microcracking on the surface. Also,
the fracture extended well beyond the margin of the irradiated zone. No significant
incubation effect was observed below the ablation threshold even after 103 pulses.
Keiper et al. [73] performed drilling on borosilicate glass (Pyrex®) with 248 nm and
193 nm. Wall angle of 3.5û and 1.6û were reported with respect to 100 and 30 µm beam
diameter. Break off of material were reduced by applying a thin layer of alcohol between
a second wafer underneath the drilling wafer.
Konovalov et al. [74] reported 157 nm laser ablation of fused silicate generates
localized tensile stress in a thin surface layer (~275 nm) that is independent of fluence
(1.9-4.7 J/cm2) and ablation depth (150-1000 nm).
Allcock et al. [75] observed and analyzed CO2 laser-induced microcracking of glass.
They concluded that residual stresses caused by thermal cycling caused microcracking.
46
According Zhang et al [76], when a workpiece is irradiated by an intense (>1
GW/cm2) laser pulse, the surface layer instantaneously vaporizes into a high temperature
and high pressure (1~10 GPa) plasma. This plasma induces shock waves during
expansion from the irradiated surface, and mechanical impulses are transferred to the
target. If the plasma is not confined (in open air), the pressure can only reach several
tenth of one GPa. If the plasma is confined by water or other media, the shock pressure
can be magnified by factor of 5 or more compared to the open air condition [83]. The
shock pressure lasts 2 to 3 times longer than the laser pulse duration. When shock wave is
acting on the substrate, material beneath the shock undergoes both plastic and elastic
deformations. Shock pressure is attenuated as it propagates downwards and outwards.
When the shock wave reaches the bottom, it is bounced back. Peyre et al [77, 78, 79] and
Jeong et al [80] studied laser-driven shockwave in stainless steel and aluminum.
47
CHAPTER 4
PROBLEM STATEMENT
In order to understand the interactions between the laser beam and the work material,
a systematic multi pulses laser micromachining studies were conducted. Results from
analytical studies of multi pulses laser drilling process would help us develop and
optimize the process.
The first objective of this work was the installation of excimer laser with associate
optics for laser micromachining. It may be noted that excimer laser micromachining
facility is being established for the first time at Oklahoma State University.
The second objective is to align the laser and use it under safe, operating conditions.
The third objective is to provide means for computer numerical control (CNC) of the
X, Y, Z and U (rotation)-axis motions of the workpiece and the excimer laser generator
and to link them to a computer in which the micromachining process is being controlled.
The fourth objective is to conduct laser micromachining experiments on silicon wafer
and borosilicate glass. The objective is to determine the response of these materials with
the excimer laser beam under several operating conditions, such as pulse width, number
of pulses, and pulse energy density. The surface quality of the holes drilled is analyzed
using an optical microscope, MicroXAM laser interference microscope, scanning
electron microscope (SEM), and environmental scan electron microscope (ESEM)

48
The fifth objective is to optimize the process parameters to obtain best finish and
uniform geometry with minimum surface damage.
The sixth objective is to analyze the effect of a presence of a layer of liquid (water)
on the surface of workpiece during laser micromachining.
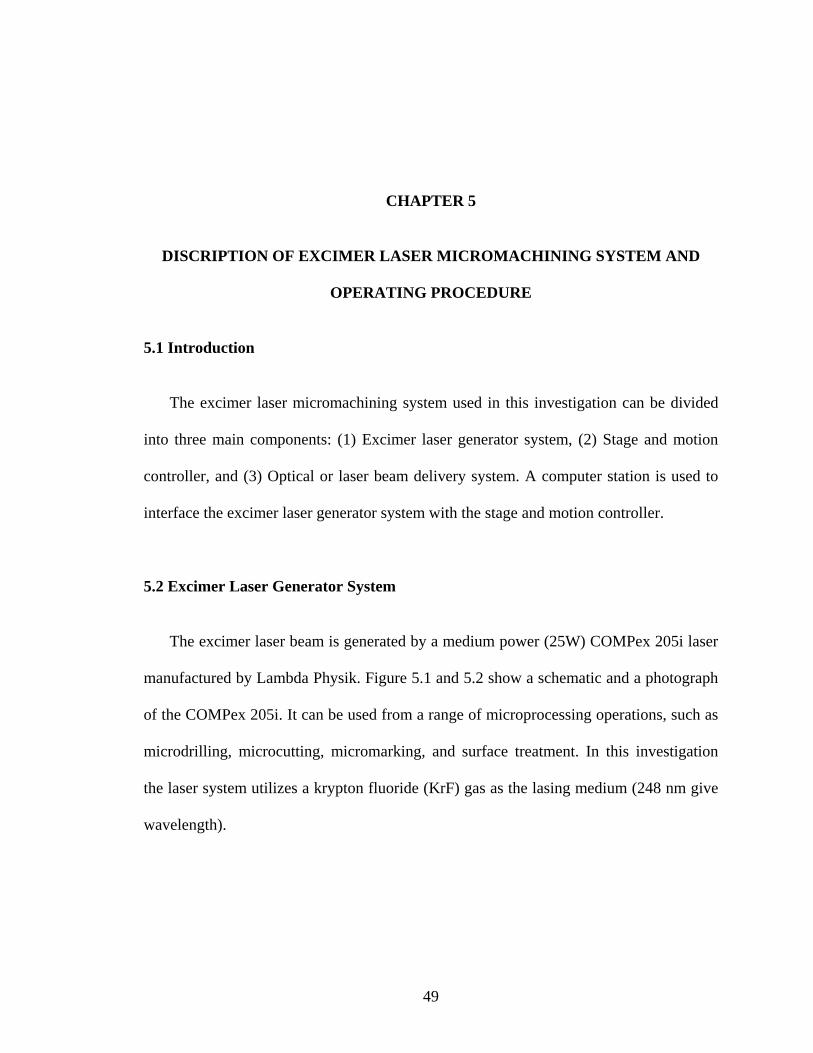
49
CHAPTER 5
DISCRIPTION OF EXCIMER LASER MICROMACHINING SYSTEM AND
OPERATING PROCEDURE
5.1 Introduction
The excimer laser micromachining system used in this investigation can be divided
into three main components: (1) Excimer laser generator system, (2) Stage and motion
controller, and (3) Optical or laser beam delivery system. A computer station is used to
interface the excimer laser generator system with the stage and motion controller.
5.2 Excimer Laser Generator System
The excimer laser beam is generated by a medium power (25W) COMPex 205i laser
manufactured by Lambda Physik. Figure 5.1 and 5.2 show a schematic and a photograph
of the COMPex 205i. It can be used from a range of microprocessing operations, such as
microdrilling, microcutting, micromarking, and surface treatment. In this investigation
the laser system utilizes a krypton fluoride (KrF) gas as the lasing medium (248 nm give
wavelength).
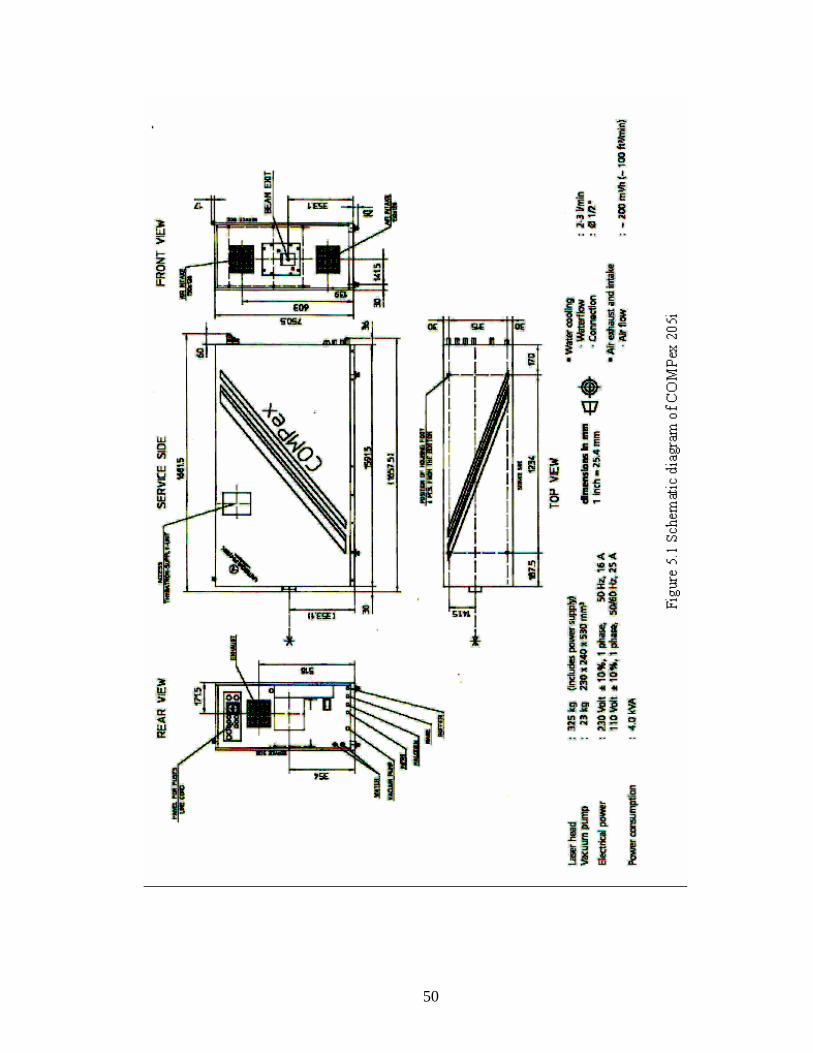
50
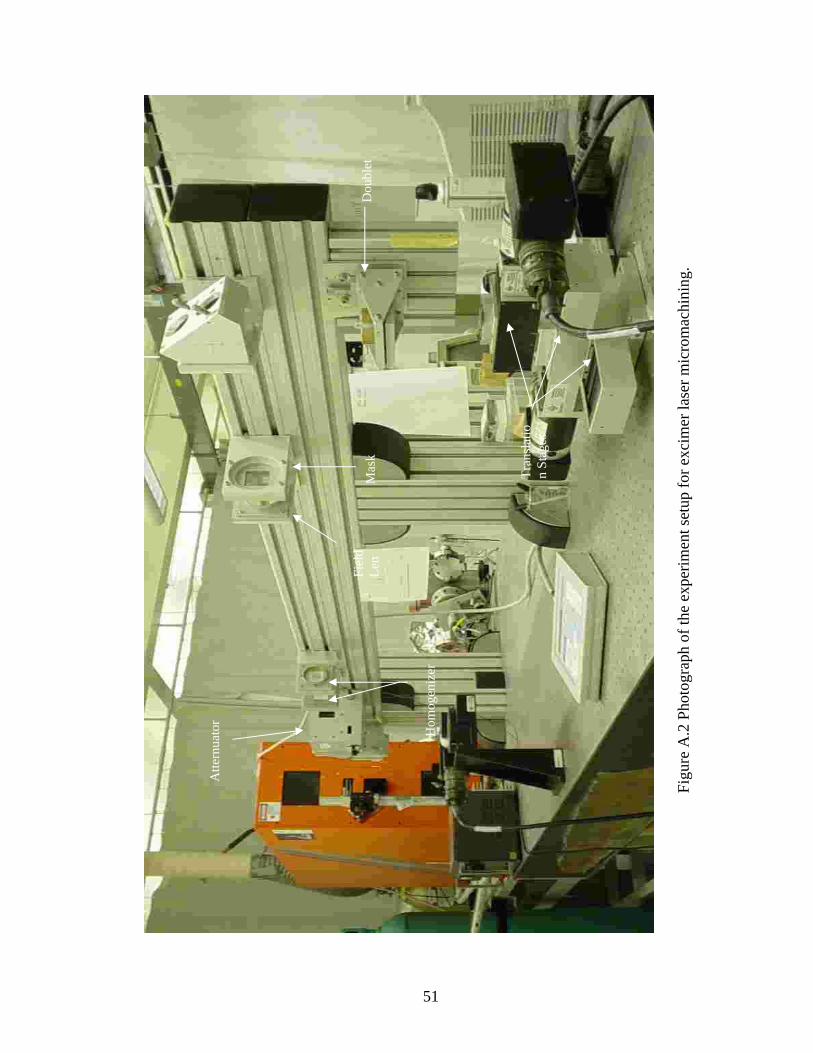
51
Atte
rnua
tor
Dou
blet
M
ask
Tran
slat
ion
Stag
es
Fiel
d Le
n
Hom
ogen
izer
Figu
re A
.2 P
hoto
grap
h of
the
expe
rimen
t set
up fo
r exc
imer
lase
r mic
rom
achi
ning
.
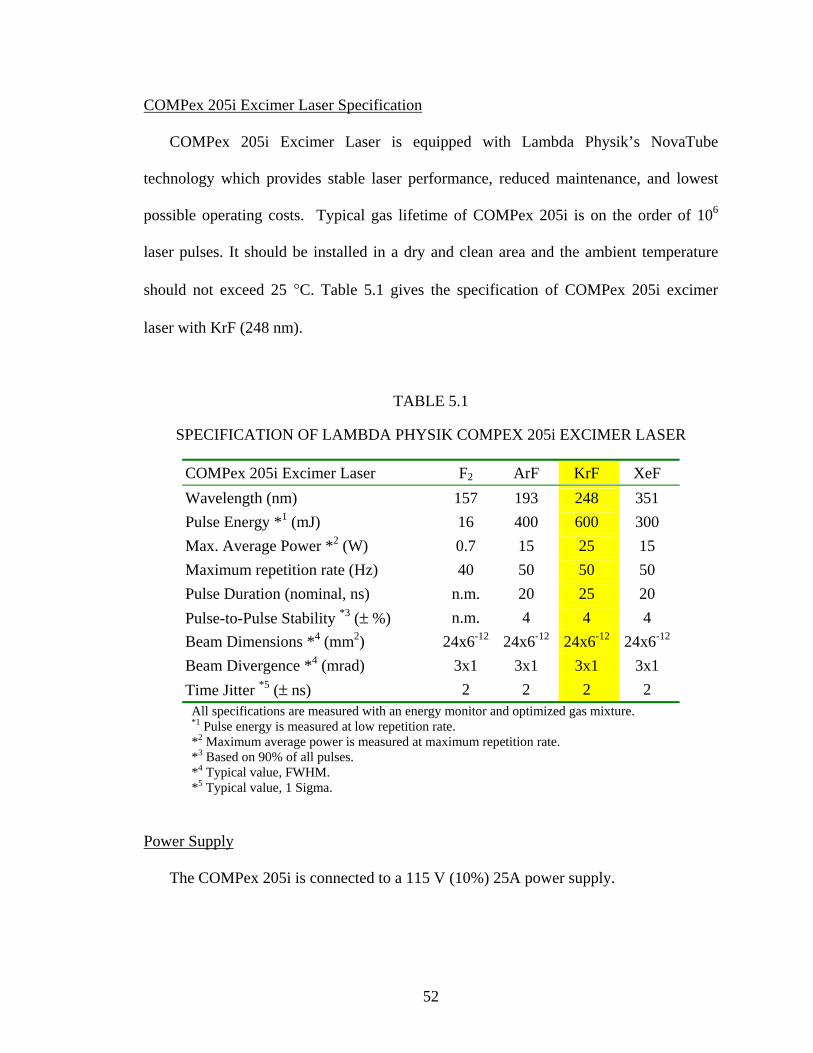
52
COMPex 205i Excimer Laser Specification
COMPex 205i Excimer Laser is equipped with Lambda Physik’s NovaTube
technology which provides stable laser performance, reduced maintenance, and lowest
possible operating costs. Typical gas lifetime of COMPex 205i is on the order of 106
laser pulses. It should be installed in a dry and clean area and the ambient temperature
should not exceed 25 °C. Table 5.1 gives the specification of COMPex 205i excimer
laser with KrF (248 nm).
TABLE 5.1
SPECIFICATION OF LAMBDA PHYSIK COMPEX 205i EXCIMER LASER
COMPex 205i Excimer Laser F2 ArF KrF XeF Wavelength (nm) 157 193 248 351 Pulse Energy *1 (mJ) 16 400 600 300 Max. Average Power *2 (W) 0.7 15 25 15 Maximum repetition rate (Hz) 40 50 50 50 Pulse Duration (nominal, ns) n.m. 20 25 20 Pulse-to-Pulse Stability *3 (± %) n.m. 4 4 4 Beam Dimensions *4 (mm2) 24x6-12 24x6-12 24x6-12 24x6-12 Beam Divergence *4 (mrad) 3x1 3x1 3x1 3x1 Time Jitter *5 (± ns) 2 2 2 2 All specifications are measured with an energy monitor and optimized gas mixture. *1 Pulse energy is measured at low repetition rate. *2 Maximum average power is measured at maximum repetition rate. *3 Based on 90% of all pulses. *4 Typical value, FWHM. *5 Typical value, 1 Sigma.
Power Supply
The COMPex 205i is connected to a 115 V (10%) 25A power supply.
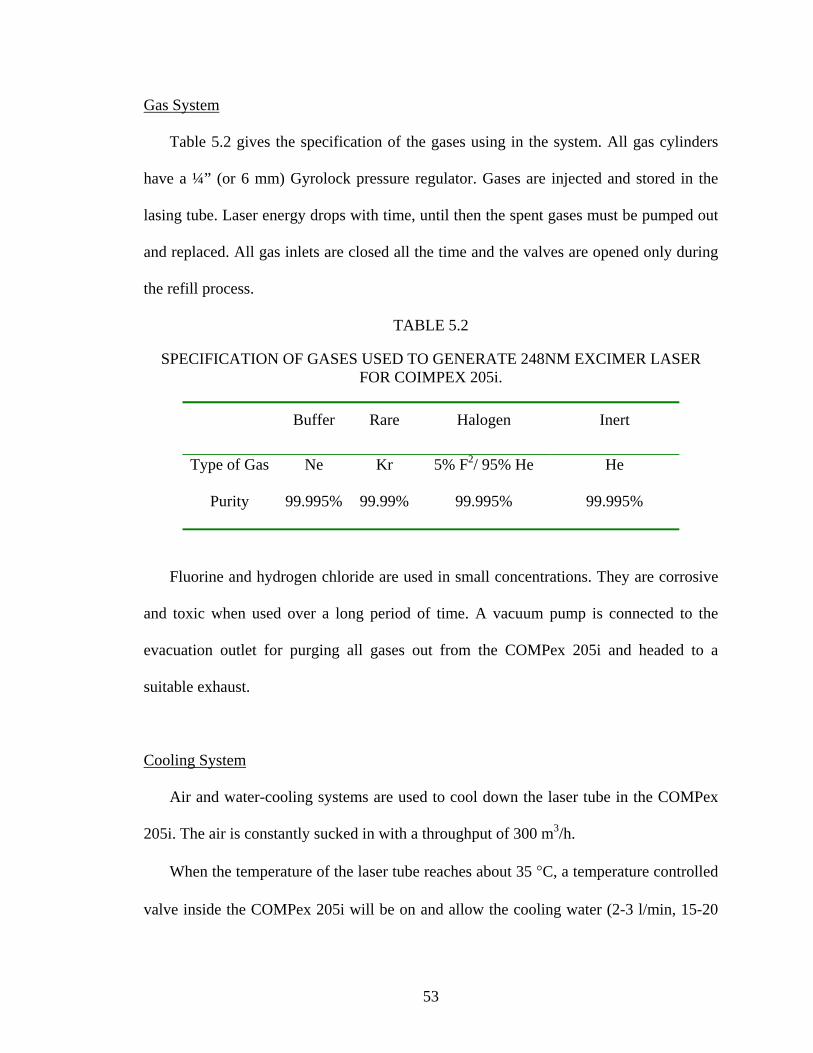
53
Gas System
Table 5.2 gives the specification of the gases using in the system. All gas cylinders
have a ¼” (or 6 mm) Gyrolock pressure regulator. Gases are injected and stored in the
lasing tube. Laser energy drops with time, until then the spent gases must be pumped out
and replaced. All gas inlets are closed all the time and the valves are opened only during
the refill process.
TABLE 5.2
SPECIFICATION OF GASES USED TO GENERATE 248NM EXCIMER LASER FOR COIMPEX 205i.
Buffer Rare Halogen Inert
Type of Gas Ne Kr 5% F2/ 95% He He
Purity 99.995% 99.99% 99.995% 99.995%
Fluorine and hydrogen chloride are used in small concentrations. They are corrosive
and toxic when used over a long period of time. A vacuum pump is connected to the
evacuation outlet for purging all gases out from the COMPex 205i and headed to a
suitable exhaust.
Cooling System
Air and water-cooling systems are used to cool down the laser tube in the COMPex
205i. The air is constantly sucked in with a throughput of 300 m3/h.
When the temperature of the laser tube reaches about 35 °C, a temperature controlled
valve inside the COMPex 205i will be on and allow the cooling water (2-3 l/min, 15-20
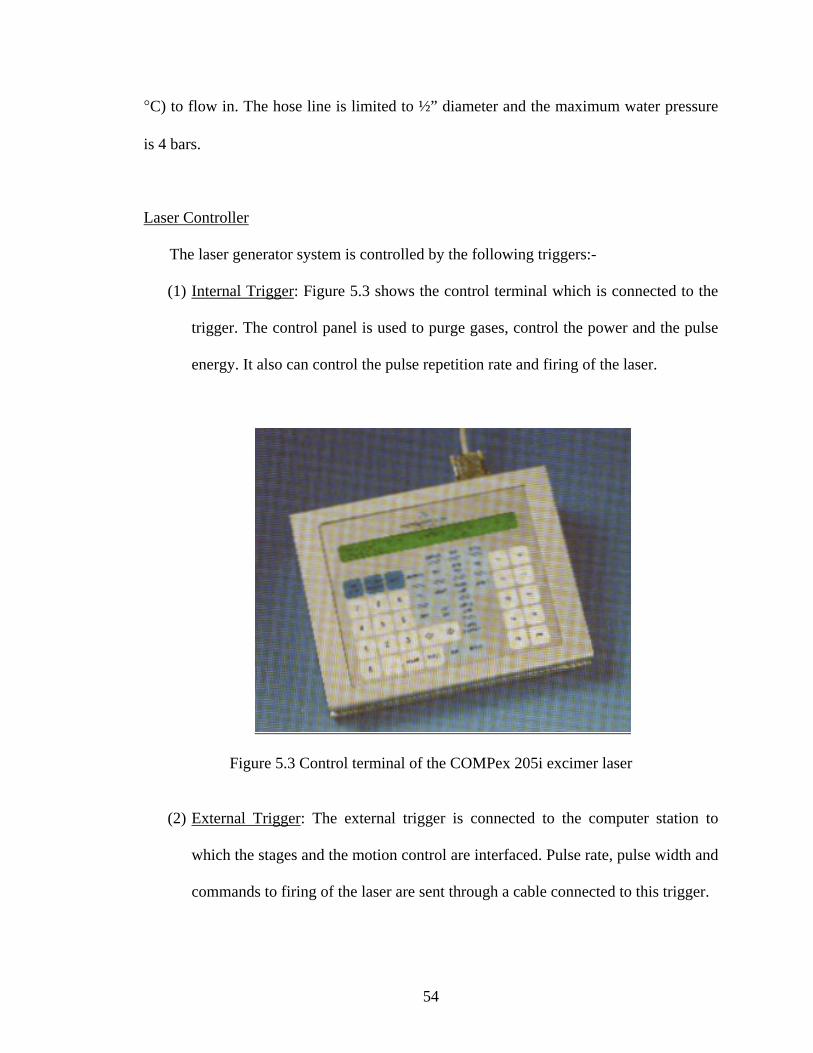
54
°C) to flow in. The hose line is limited to ½” diameter and the maximum water pressure
is 4 bars.
Laser Controller
The laser generator system is controlled by the following triggers:-
(1) Internal Trigger: Figure 5.3 shows the control terminal which is connected to the
trigger. The control panel is used to purge gases, control the power and the pulse
energy. It also can control the pulse repetition rate and firing of the laser.
Figure 5.3 Control terminal of the COMPex 205i excimer laser
(2) External Trigger: The external trigger is connected to the computer station to
which the stages and the motion control are interfaced. Pulse rate, pulse width and
commands to firing of the laser are sent through a cable connected to this trigger.
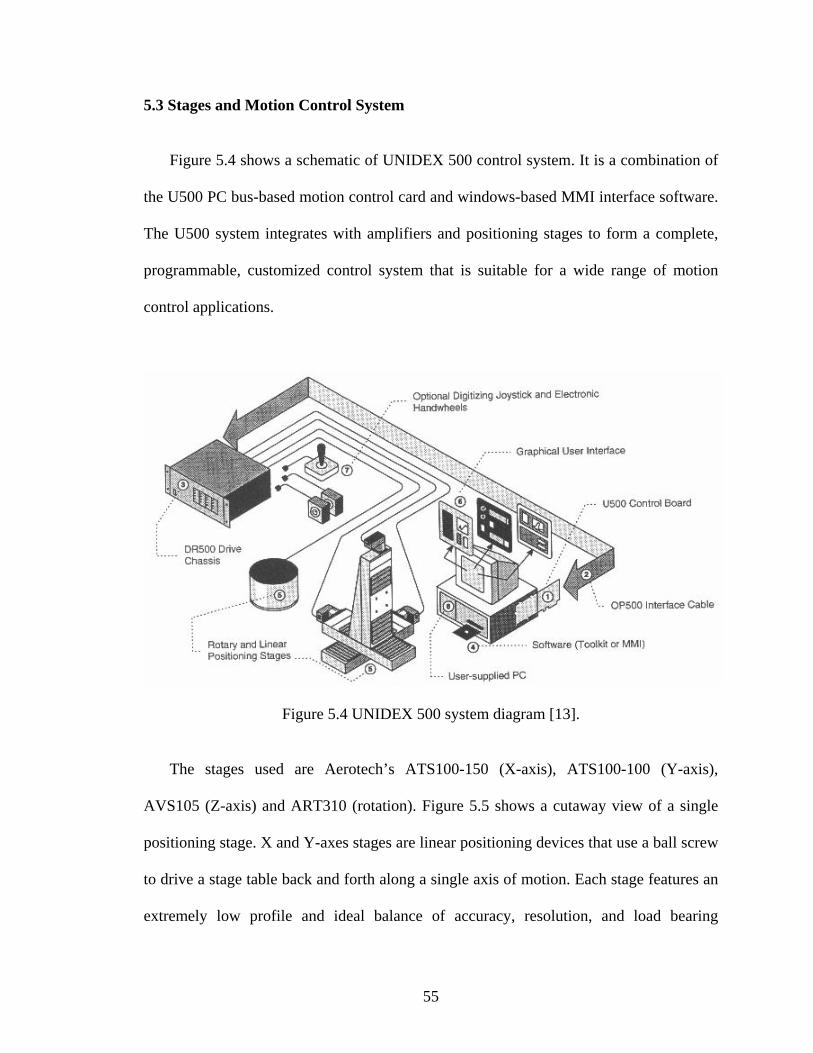
55
5.3 Stages and Motion Control System
Figure 5.4 shows a schematic of UNIDEX 500 control system. It is a combination of
the U500 PC bus-based motion control card and windows-based MMI interface software.
The U500 system integrates with amplifiers and positioning stages to form a complete,
programmable, customized control system that is suitable for a wide range of motion
control applications.
Figure 5.4 UNIDEX 500 system diagram [13].
The stages used are Aerotech’s ATS100-150 (X-axis), ATS100-100 (Y-axis),
AVS105 (Z-axis) and ART310 (rotation). Figure 5.5 shows a cutaway view of a single
positioning stage. X and Y-axes stages are linear positioning devices that use a ball screw
to drive a stage table back and forth along a single axis of motion. Each stage features an
extremely low profile and ideal balance of accuracy, resolution, and load bearing
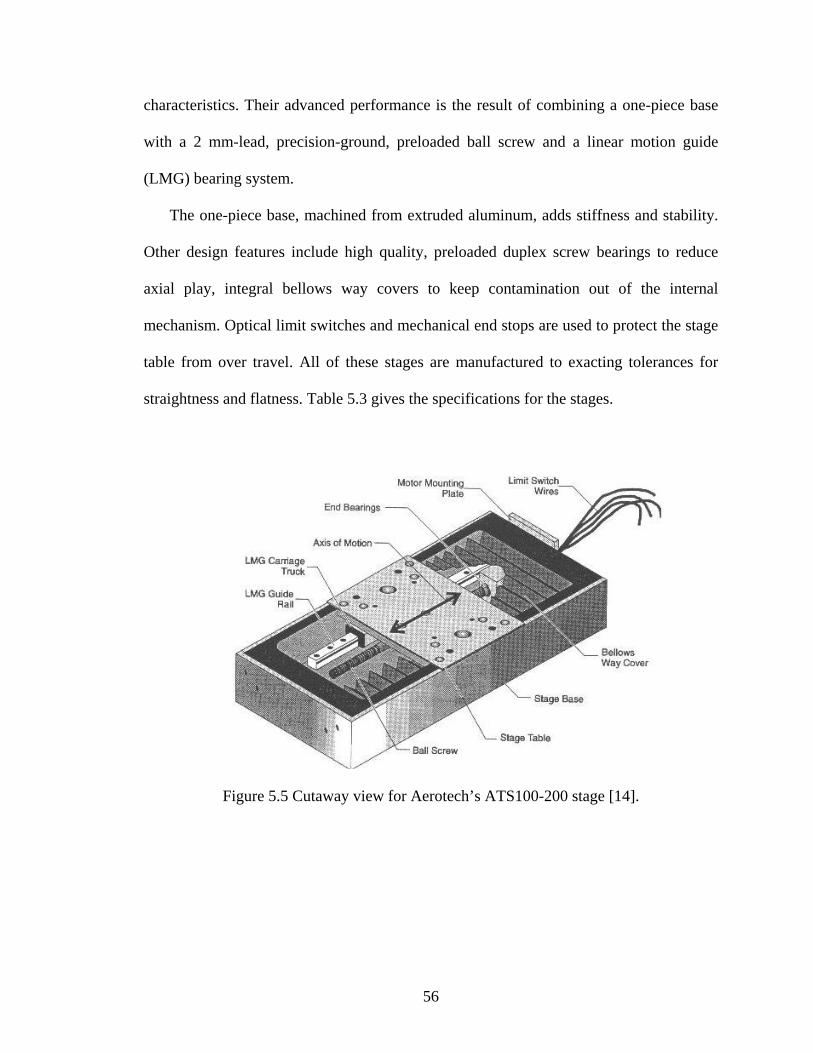
56
characteristics. Their advanced performance is the result of combining a one-piece base
with a 2 mm-lead, precision-ground, preloaded ball screw and a linear motion guide
(LMG) bearing system.
The one-piece base, machined from extruded aluminum, adds stiffness and stability.
Other design features include high quality, preloaded duplex screw bearings to reduce
axial play, integral bellows way covers to keep contamination out of the internal
mechanism. Optical limit switches and mechanical end stops are used to protect the stage
table from over travel. All of these stages are manufactured to exacting tolerances for
straightness and flatness. Table 5.3 gives the specifications for the stages.
Figure 5.5 Cutaway view for Aerotech’s ATS100-200 stage [14].
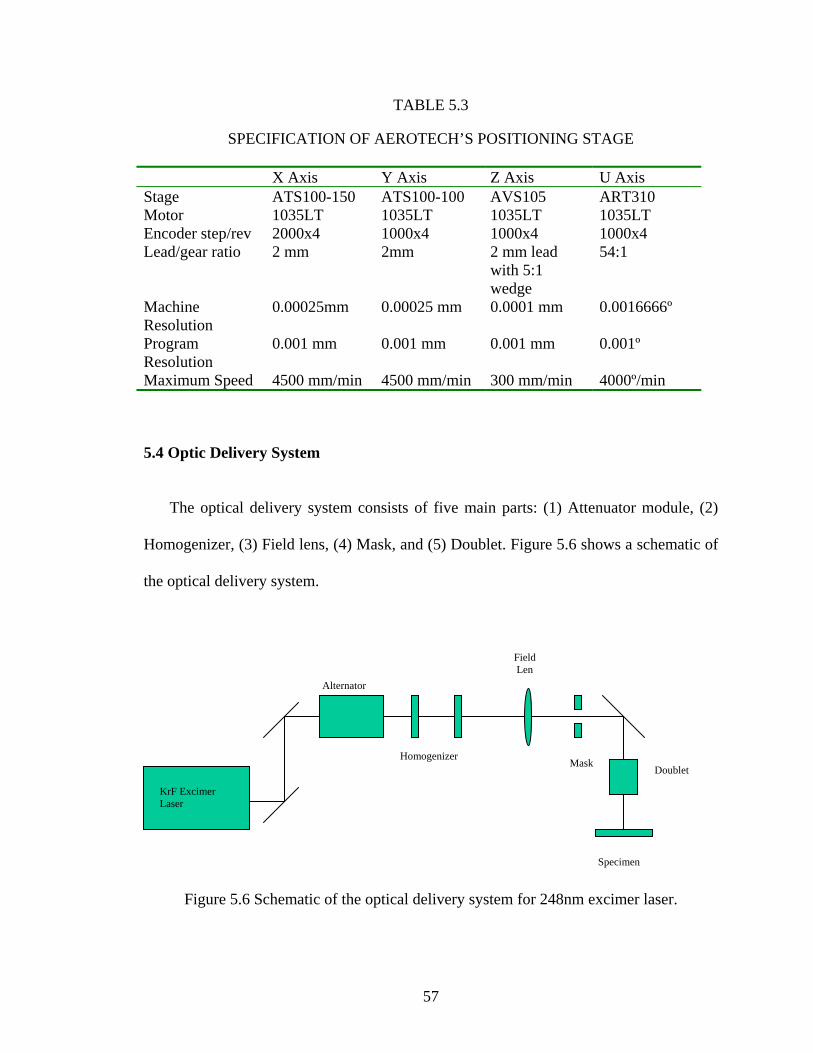
57
TABLE 5.3
SPECIFICATION OF AEROTECH’S POSITIONING STAGE X Axis Y Axis Z Axis U Axis Stage ATS100-150 ATS100-100 AVS105 ART310 Motor 1035LT 1035LT 1035LT 1035LT Encoder step/rev 2000x4 1000x4 1000x4 1000x4 Lead/gear ratio 2 mm 2mm 2 mm lead
with 5:1 wedge
54:1
Machine Resolution
0.00025mm 0.00025 mm 0.0001 mm 0.0016666º
Program Resolution
0.001 mm 0.001 mm 0.001 mm 0.001º
Maximum Speed 4500 mm/min 4500 mm/min 300 mm/min 4000º/min
5.4 Optic Delivery System
The optical delivery system consists of five main parts: (1) Attenuator module, (2)
Homogenizer, (3) Field lens, (4) Mask, and (5) Doublet. Figure 5.6 shows a schematic of
the optical delivery system.
Figure 5.6 Schematic of the optical delivery system for 248nm excimer laser.
KrF Excimer Laser
Alternator
Homogenizer
Field Len
Mask Doublet
Specimen
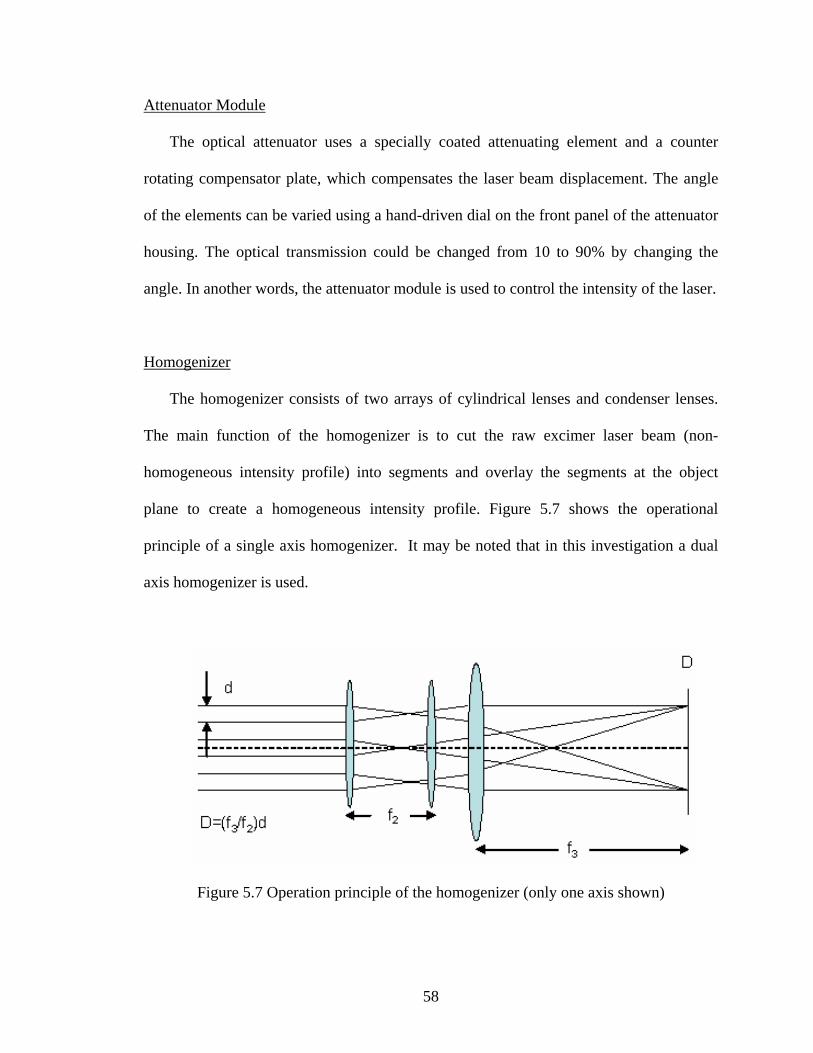
58
Attenuator Module
The optical attenuator uses a specially coated attenuating element and a counter
rotating compensator plate, which compensates the laser beam displacement. The angle
of the elements can be varied using a hand-driven dial on the front panel of the attenuator
housing. The optical transmission could be changed from 10 to 90% by changing the
angle. In another words, the attenuator module is used to control the intensity of the laser.
Homogenizer
The homogenizer consists of two arrays of cylindrical lenses and condenser lenses.
The main function of the homogenizer is to cut the raw excimer laser beam (non-
homogeneous intensity profile) into segments and overlay the segments at the object
plane to create a homogeneous intensity profile. Figure 5.7 shows the operational
principle of a single axis homogenizer. It may be noted that in this investigation a dual
axis homogenizer is used.
Figure 5.7 Operation principle of the homogenizer (only one axis shown)
59
The laser beam is segmented. Each partial beam of width d is distributed onto the full
width D of the illumination field which is located at a distance of f3 behind the curved
surface of the condenser lens.
All lenses are plano-convex. The focal length, f of the lenses is given by
)1( −=
nrf
where
r = radius curvature
n = index of refraction of the material (for e.g. fused silica 1.508)
Field Lens
The function of the field lens is to gather laser light and converge it into a doublet.
Without the light gathering qualities of the field lens, the image would not be clear and
uniformly illuminated. Instead, it would be dark and shadowed along the edges.
Mask
A mask is used to control the shape of the structures produced. There are three
common types of masks: 1) Free standing metal mask, 2) metal film on quartz substrate,
and 3) Dielectric mask. These will be briefly discussed in the following.
Free Standing Metal Mask
These masks can withstand high irradiation energies but due to their high absorptivity
in the UV range they are damaged at high repetition rate. Furthermore, their structure
60
geometry is restricted, and due to their thickness of 10 to 100 mm they cannot be used for
high-resolution patterning.
Metal Film on Quartz Substrate
These masks are better suited for high resolution but their damage threshold is rather
low even for single pulses.
Dielectric Mask
These masks have a high damage threshold due to their high reflectivity and can be
used for high-resolution patterning and for effective use of the laser energy. Due to high
cost, a free standing metal mask is used.
Doublet
The imaging doublet is composed of 2 spherical lenses, each with a radius of
curvature of r =50 mm. These lenses are mounted with a separation of about 7 mm of the
curved surfaces. The doublet is mounted with the curved sides of the lenses both pointing
towards the object (mask). The main function of the imaging doublet is to demagnifying
the object or mask. Table 5.4 gives the distances from the mask plane to the center of the
doublet and from the center of the doublet to the image plane.
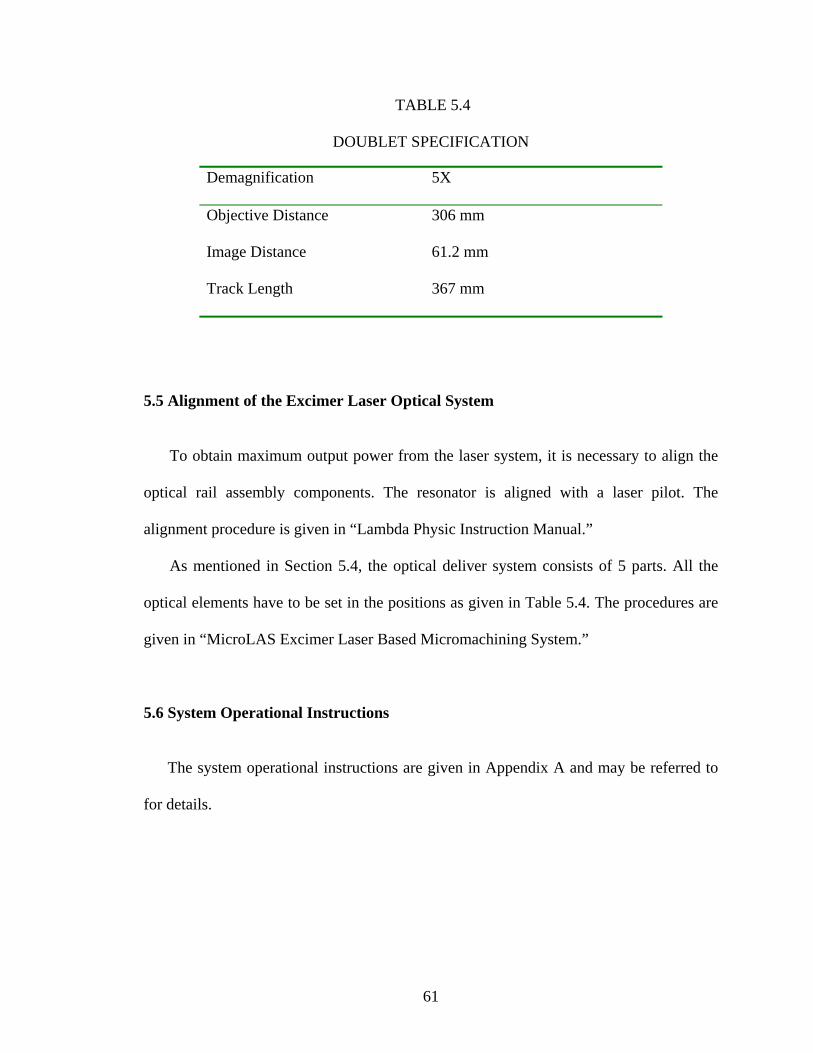
61
TABLE 5.4
DOUBLET SPECIFICATION
Demagnification 5X
Objective Distance 306 mm
Image Distance 61.2 mm
Track Length 367 mm
5.5 Alignment of the Excimer Laser Optical System
To obtain maximum output power from the laser system, it is necessary to align the
optical rail assembly components. The resonator is aligned with a laser pilot. The
alignment procedure is given in “Lambda Physic Instruction Manual.”
As mentioned in Section 5.4, the optical deliver system consists of 5 parts. All the
optical elements have to be set in the positions as given in Table 5.4. The procedures are
given in “MicroLAS Excimer Laser Based Micromachining System.”
5.6 System Operational Instructions
The system operational instructions are given in Appendix A and may be referred to
for details.
62
CHAPTER 6
METHODOLOGY
6.1 Introduction
Following are the standard test procedures used for the laser micromachining tests. It
involves (1) sample preparation, (2) determination of pulsed laser fluence, (3)
determination of focus point, (4) pulsed laser microdrilling, (5) pulsed laser
micromachining, (6) pulsed laser machining in different media, (7) optical microscopy,
(8) MicroXAM laser interference microscopy, and (9) Scanning electron microscopy.
6.2 Sample Preparation
Laser micromachining is very sensitive. Hence, thin layer of dirt or oil on the surface
of the sample can influence the absorption of the UV light. A clean surface is necessary
to eliminate detrimental side effects. The following cleaning procedure will remove most
common surface contaminants.
1. Place the sample in a beaker with a detergent solution and the beaker in an ultrasonic
bath for 120 sec.
2. Rinse with distilled water.
3. Place sample in a beaker filled with distilled water and the beaker in an ultrasonic
bath for 120 sec.
63
4. Rinse with methanol.
5. Place sample in a beaker with methanol and the beaker in an ultrasonic bath for 120
sec.
6. Use compressed air to dry up the sample.
(NOTE: Wear Latex powder-free gloves to prevent oil or dirt contamination)
6.3 Determination of Pulsed Laser Fluence
Pulse energy reduces with gas life time, i.e. after a large number of pulses, pulse
energy will decrease. It is therefore, important to determine the fluence or energy per unit
area each time before the experiment. A Melectron M400 energy detector is used to
measure the laser energy. Laser energy for 50 pulses is measured before every
experiment. The fluence is calculated using the following equation:
2)10
( DE
f avg
⋅=
π (5.1)
where
Eavg = the average of the single pulse laser energy
D = diameter of the hole of mask
6.4 Determination of Focus Point
Imaging plane has to be obtained by performing ablation test. Sample of Plexiglass®
or PMMA is used for this purpose. Machining program (PC-PSOP and G code) is written
to command the firing of excimer laser and the movement of the X-, Y-, Z-table. After
64
machining, samples are analyzed as described in Sections 6.5 to 6.9. Experimental and
results are given in Chapter 7.
6.5 Pulsed Laser Micro Drilling
Different number of pulses are used to irradiate different materials. Optimal fluence
for micromachining is found for different materials. Experimental results are discussed in
Chapters 8 and Chapter 9.
6.6 Pulsed Laser Micro Machining
Pulsed laser with 25 ns FWHM is used to machine different materials. The
experimental results are discussed in Chapter 10.
6.7 Pulsed Laser Machining in Different Media
A liquid medium is using to reduce thermal damage to the laser irradiated area.
Different media are used and the experiments results given in Chapters 8 to 10.
6.8 Optical Microscope Observation
Using an optical microscope, the surface profiles of the pulsed laser micromachining
are observed. Diameter and width of the irradiated area are measured. The thermal
damage areas are observed and compared for different micromachining conditions.
65
6.9 MicroXAM Laser Interference Microscopy Observation
As diameter and width of the holes generated by micromachining is in micrometers,
it is difficult to cut the sample into half to observe the cross section without damaging
the original profile of the irradiated area. Laser interference microscope (MicroXAM) is
used for examining the surfaces. MicroXAM uses different wavelengths of light to scan
through the irradiated area and gives a 3-dimensional profile of the area. The height and
depth for the holes can be obtained using this technique.
6.10 SEM Observation
An ABET-32 scanning electron microscope (SEM) was used to observe the laser
micromachining samples for detailed examination of the thermal damage, cracking,
HAZ, re-deposition, etc. The sample has to be thoroughly cleaned to eliminate any
foreign particles, before placing it in the SEM. The following cleaning procedure has to
be followed. Steps 1 to 6 are the same as mentioned in Section 6.2. Steps 6 and 7 are
additional
7. A thin electrical-conducting coating has to be applied to non-electrical conducting
materials.
8. Place the samples in the SEM chamber and follow the instructions to obtain the image
of the sample. Photographs are taken to compare the finish surfaces.
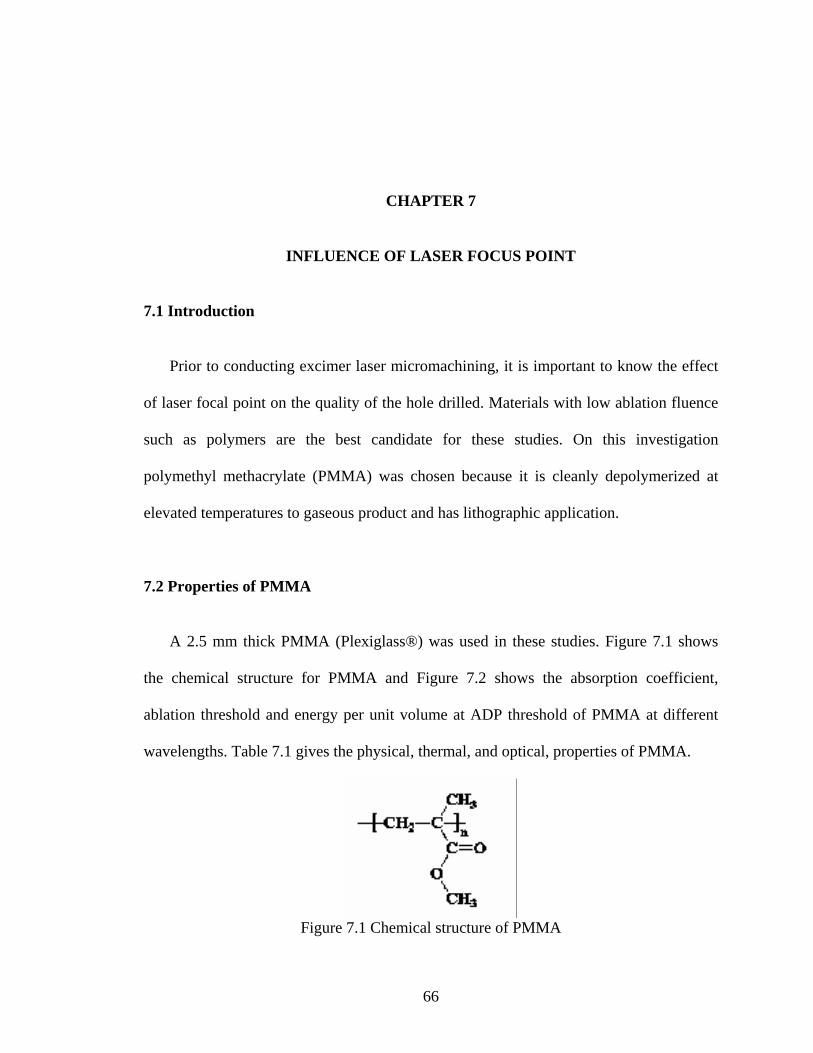
66
CHAPTER 7
INFLUENCE OF LASER FOCUS POINT
7.1 Introduction
Prior to conducting excimer laser micromachining, it is important to know the effect
of laser focal point on the quality of the hole drilled. Materials with low ablation fluence
such as polymers are the best candidate for these studies. On this investigation
polymethyl methacrylate (PMMA) was chosen because it is cleanly depolymerized at
elevated temperatures to gaseous product and has lithographic application.
7.2 Properties of PMMA
A 2.5 mm thick PMMA (Plexiglass®) was used in these studies. Figure 7.1 shows
the chemical structure for PMMA and Figure 7.2 shows the absorption coefficient,
ablation threshold and energy per unit volume at ADP threshold of PMMA at different
wavelengths. Table 7.1 gives the physical, thermal, and optical, properties of PMMA.
Figure 7.1 Chemical structure of PMMA
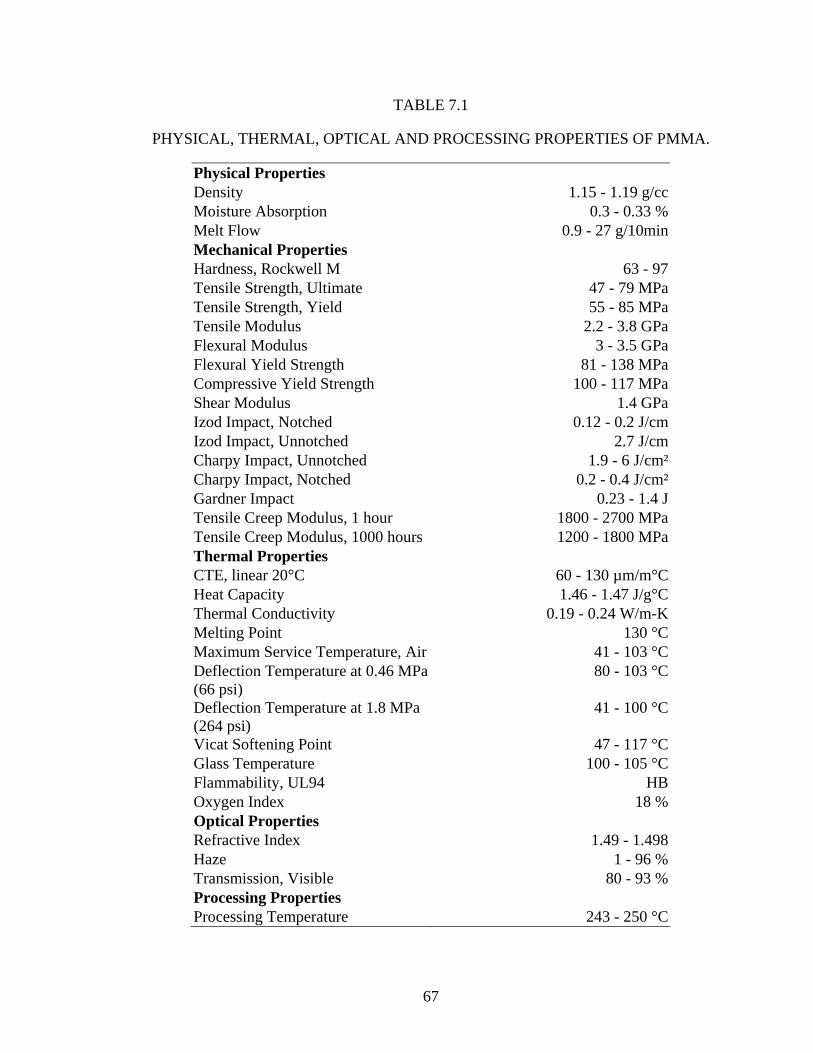
67
TABLE 7.1
PHYSICAL, THERMAL, OPTICAL AND PROCESSING PROPERTIES OF PMMA.
Physical Properties Density 1.15 - 1.19 g/ccMoisture Absorption 0.3 - 0.33 %Melt Flow 0.9 - 27 g/10minMechanical Properties Hardness, Rockwell M 63 - 97Tensile Strength, Ultimate 47 - 79 MPaTensile Strength, Yield 55 - 85 MPaTensile Modulus 2.2 - 3.8 GPaFlexural Modulus 3 - 3.5 GPaFlexural Yield Strength 81 - 138 MPaCompressive Yield Strength 100 - 117 MPaShear Modulus 1.4 GPaIzod Impact, Notched 0.12 - 0.2 J/cmIzod Impact, Unnotched 2.7 J/cmCharpy Impact, Unnotched 1.9 - 6 J/cm²Charpy Impact, Notched 0.2 - 0.4 J/cm²Gardner Impact 0.23 - 1.4 JTensile Creep Modulus, 1 hour 1800 - 2700 MPaTensile Creep Modulus, 1000 hours 1200 - 1800 MPaThermal Properties CTE, linear 20°C 60 - 130 µm/m°CHeat Capacity 1.46 - 1.47 J/g°CThermal Conductivity 0.19 - 0.24 W/m-KMelting Point 130 °CMaximum Service Temperature, Air 41 - 103 °CDeflection Temperature at 0.46 MPa (66 psi)
80 - 103 °C
Deflection Temperature at 1.8 MPa (264 psi)
41 - 100 °C
Vicat Softening Point 47 - 117 °CGlass Temperature 100 - 105 °CFlammability, UL94 HBOxygen Index 18 %Optical Properties Refractive Index 1.49 - 1.498Haze 1 - 96 %Transmission, Visible 80 - 93 %Processing Properties Processing Temperature 243 - 250 °C
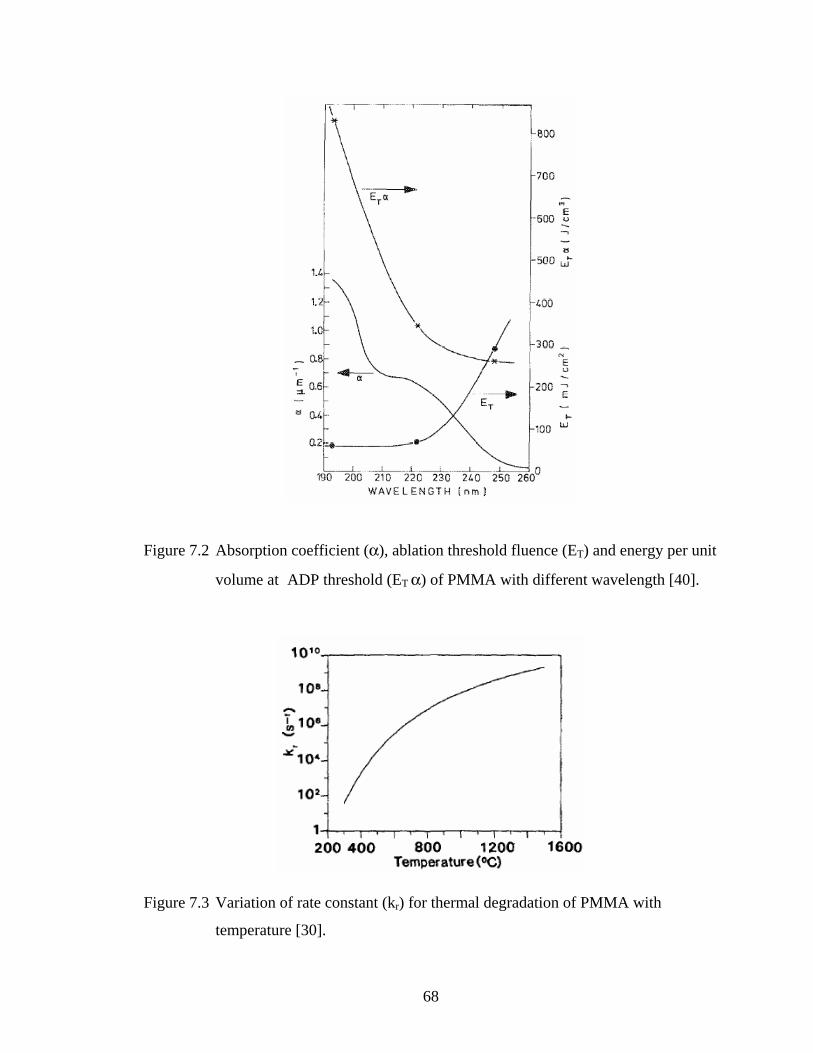
68
Figure 7.2 Absorption coefficient (α), ablation threshold fluence (ET) and energy per unit
volume at ADP threshold (ET α) of PMMA with different wavelength [40].
Figure 7.3 Variation of rate constant (kr) for thermal degradation of PMMA with
temperature [30].
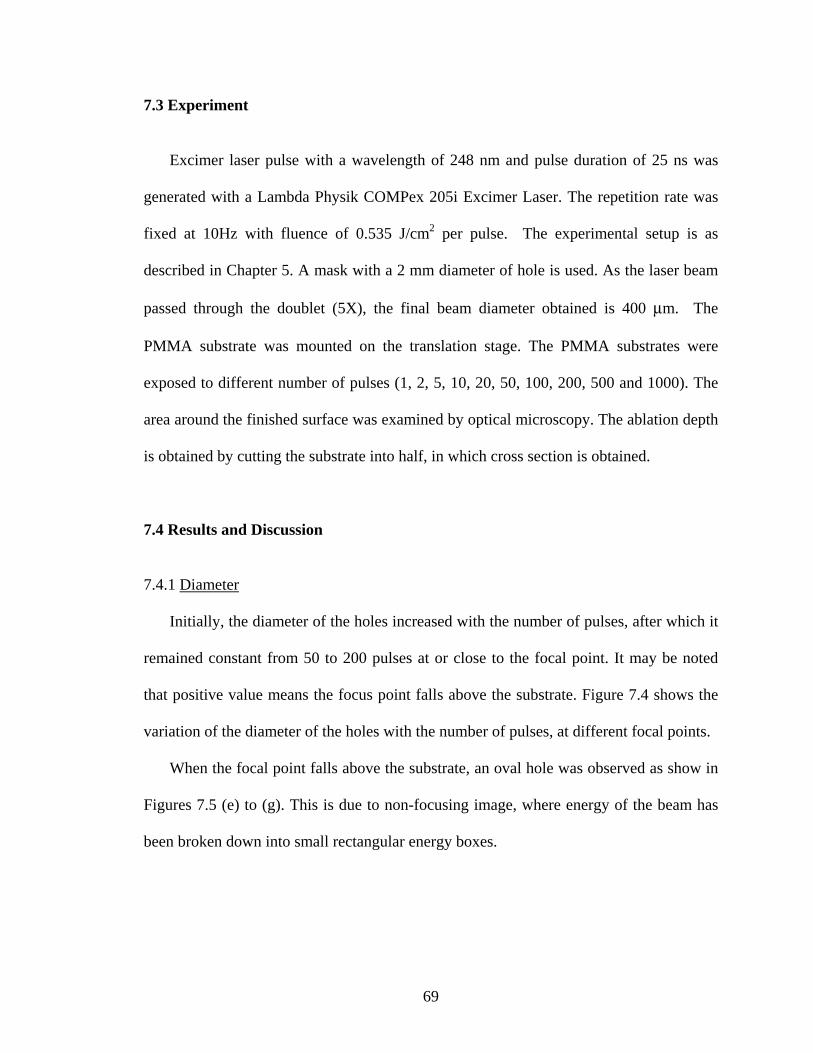
69
7.3 Experiment
Excimer laser pulse with a wavelength of 248 nm and pulse duration of 25 ns was
generated with a Lambda Physik COMPex 205i Excimer Laser. The repetition rate was
fixed at 10Hz with fluence of 0.535 J/cm2 per pulse. The experimental setup is as
described in Chapter 5. A mask with a 2 mm diameter of hole is used. As the laser beam
passed through the doublet (5X), the final beam diameter obtained is 400 µm. The
PMMA substrate was mounted on the translation stage. The PMMA substrates were
exposed to different number of pulses (1, 2, 5, 10, 20, 50, 100, 200, 500 and 1000). The
area around the finished surface was examined by optical microscopy. The ablation depth
is obtained by cutting the substrate into half, in which cross section is obtained.
7.4 Results and Discussion
7.4.1 Diameter
Initially, the diameter of the holes increased with the number of pulses, after which it
remained constant from 50 to 200 pulses at or close to the focal point. It may be noted
that positive value means the focus point falls above the substrate. Figure 7.4 shows the
variation of the diameter of the holes with the number of pulses, at different focal points.
When the focal point falls above the substrate, an oval hole was observed as show in
Figures 7.5 (e) to (g). This is due to non-focusing image, where energy of the beam has
been broken down into small rectangular energy boxes.
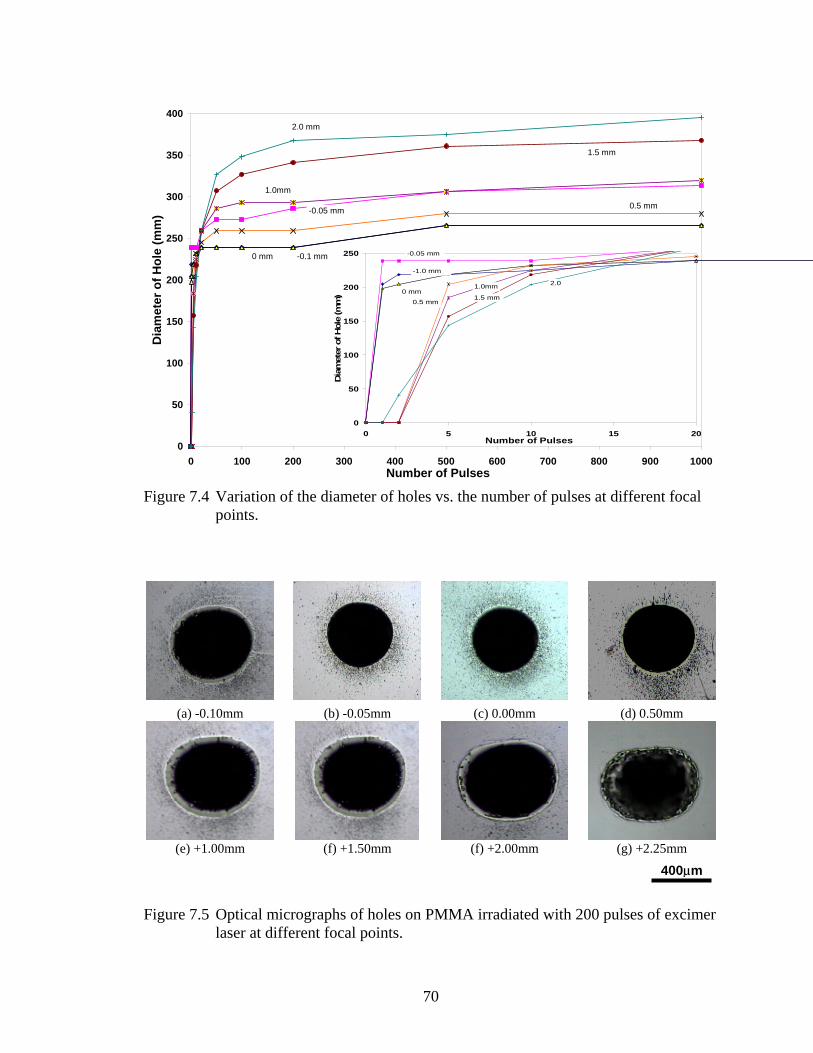
70
0
50
100
150
200
250
300
350
400
0 100 200 300 400 500 600 700 800 900 1000Number of Pulses
Dia
met
er o
f Hol
e (m
m)
0 mm
0.5 mm
1.5 mm
1.0mm
-0.05 mm
2.0 mm
-0.1 mm
Figure 7.4 Variation of the diameter of holes vs. the number of pulses at different focal
points.
Figure 7.5 Optical micrographs of holes on PMMA irradiated with 200 pulses of excimer laser at different focal points.
(a) -0.10mm (b) -0.05mm (c) 0.00mm (d) 0.50mm
(e) +1.00mm (f) +1.50mm (f) +2.00mm (g) +2.25mm
400µm
0
50
100
150
200
250
0 5 10 15 20Number of Pulses
Dia
met
er o
f Hol
e (m
m) 0 mm
0.5 mm1.5 mm
1.0mm
-0.05 mm
2.0
-1.0 mm
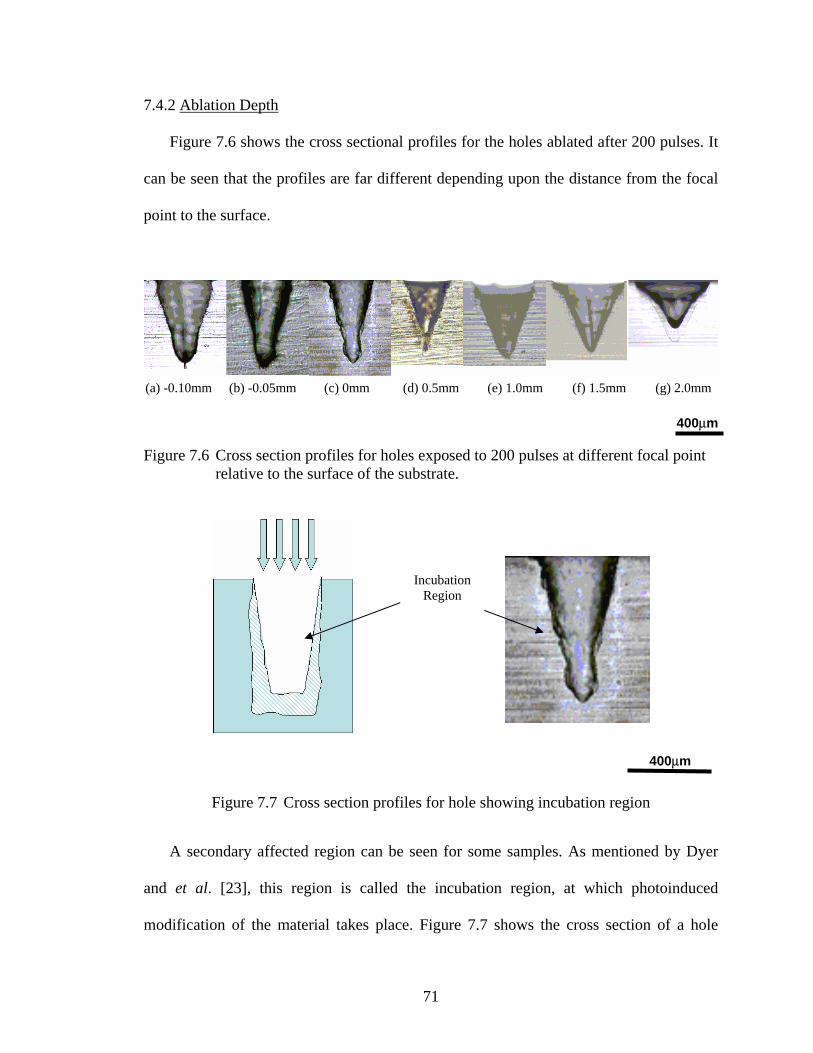
71
7.4.2 Ablation Depth
Figure 7.6 shows the cross sectional profiles for the holes ablated after 200 pulses. It
can be seen that the profiles are far different depending upon the distance from the focal
point to the surface.
(a) -0.10mm (b) -0.05mm (c) 0mm (d) 0.5mm (e) 1.0mm (f) 1.5mm (g) 2.0mm
400µm
Figure 7.6 Cross section profiles for holes exposed to 200 pulses at different focal point relative to the surface of the substrate.
400µm
Figure 7.7 Cross section profiles for hole showing incubation region
A secondary affected region can be seen for some samples. As mentioned by Dyer
and et al. [23], this region is called the incubation region, at which photoinduced
modification of the material takes place. Figure 7.7 shows the cross section of a hole
Incubation Region
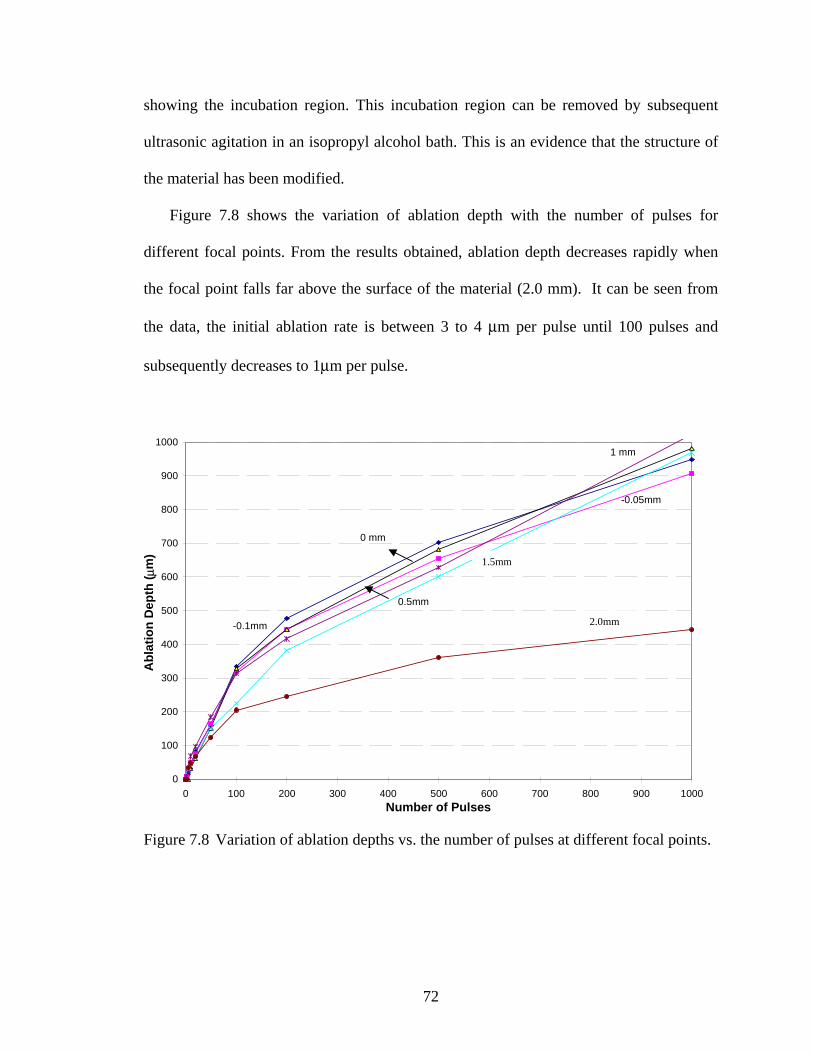
72
showing the incubation region. This incubation region can be removed by subsequent
ultrasonic agitation in an isopropyl alcohol bath. This is an evidence that the structure of
the material has been modified.
Figure 7.8 shows the variation of ablation depth with the number of pulses for
different focal points. From the results obtained, ablation depth decreases rapidly when
the focal point falls far above the surface of the material (2.0 mm). It can be seen from
the data, the initial ablation rate is between 3 to 4 µm per pulse until 100 pulses and
subsequently decreases to 1µm per pulse.
0
100
200
300
400
500
600
700
800
900
1000
0 100 200 300 400 500 600 700 800 900 1000Number of Pulses
Abl
atio
n D
epth
( µm
)
-0.1mm
1 mm
0 mm
0.5mm
1.5mm
-0.05mm
Figure 7.8 Variation of ablation depths vs. the number of pulses at different focal points.
2.0mm
1.5mm
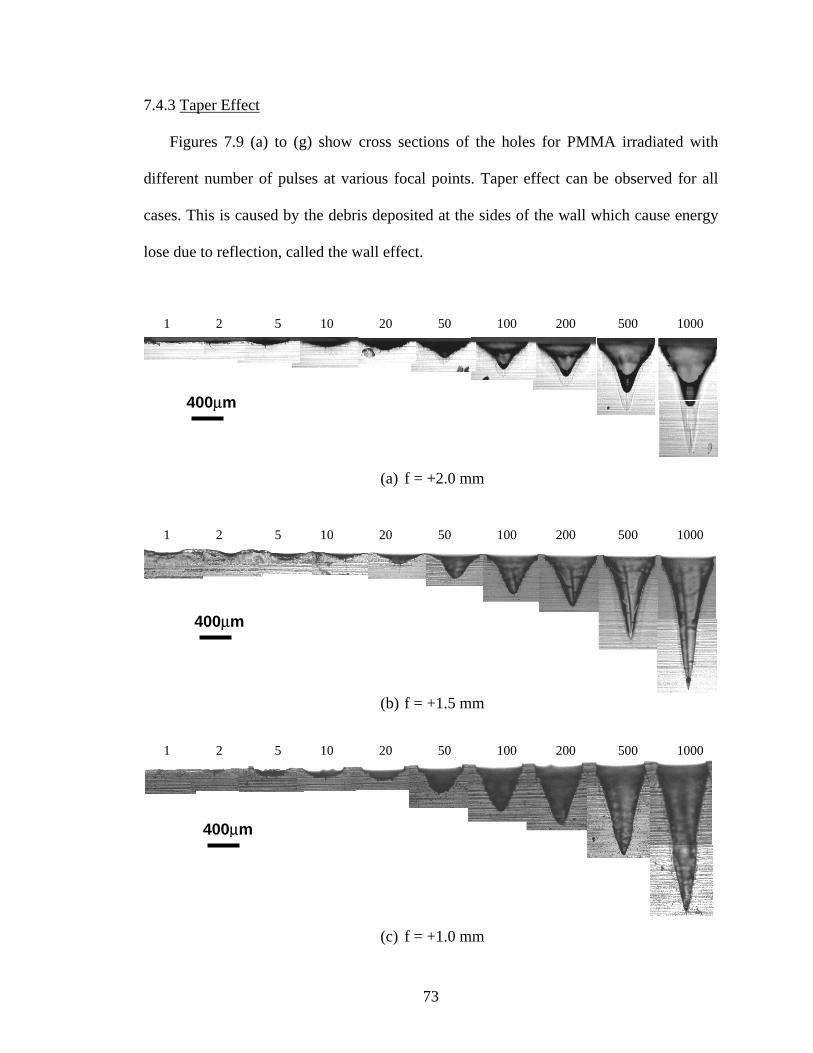
73
7.4.3 Taper Effect
Figures 7.9 (a) to (g) show cross sections of the holes for PMMA irradiated with
different number of pulses at various focal points. Taper effect can be observed for all
cases. This is caused by the debris deposited at the sides of the wall which cause energy
lose due to reflection, called the wall effect.
1 2 5 10 20 50 100 200 500 1000
(a) f = +2.0 mm
1 2 5 10 20 50 100 200 500 1000
(b) f = +1.5 mm
1 2 5 10 20 50 100 200 500 1000
(c) f = +1.0 mm
400µm
400µm
400µm
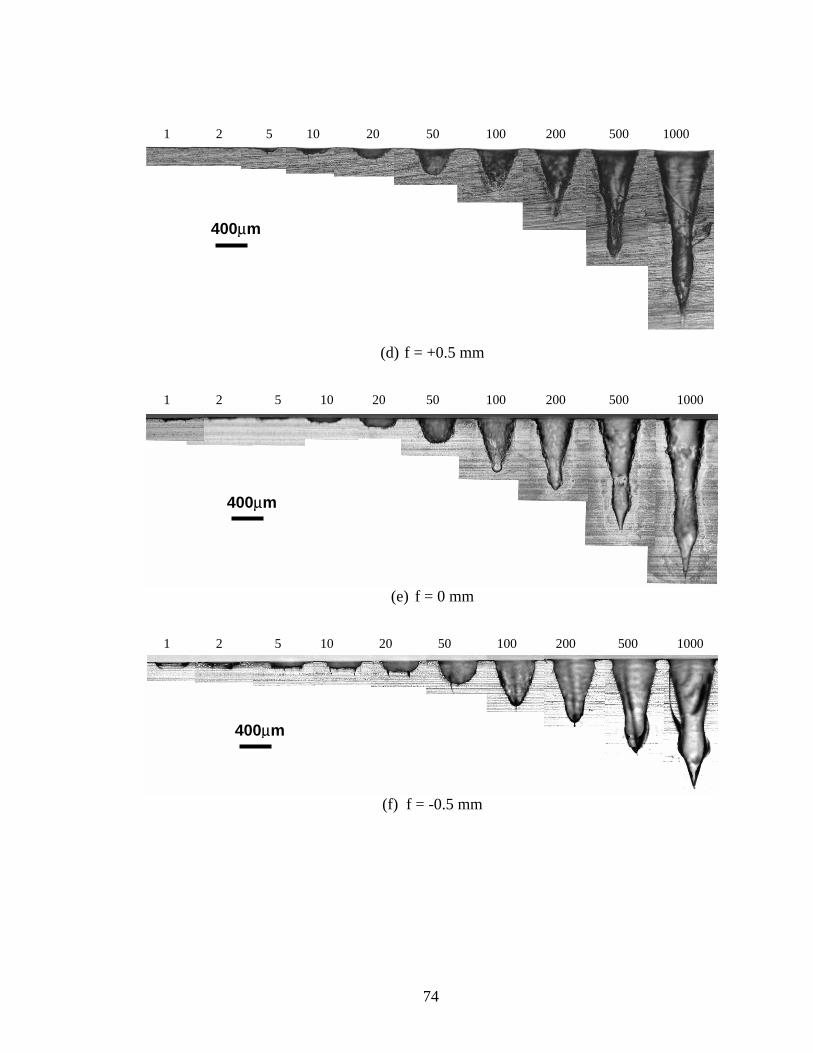
74
1 2 5 10 20 50 100 200 500 1000
(d) f = +0.5 mm
1 2 5 10 20 50 100 200 500 1000
(e) f = 0 mm
1 2 5 10 20 50 100 200 500 1000
(f) f = -0.5 mm
400µm
400µm
400µm
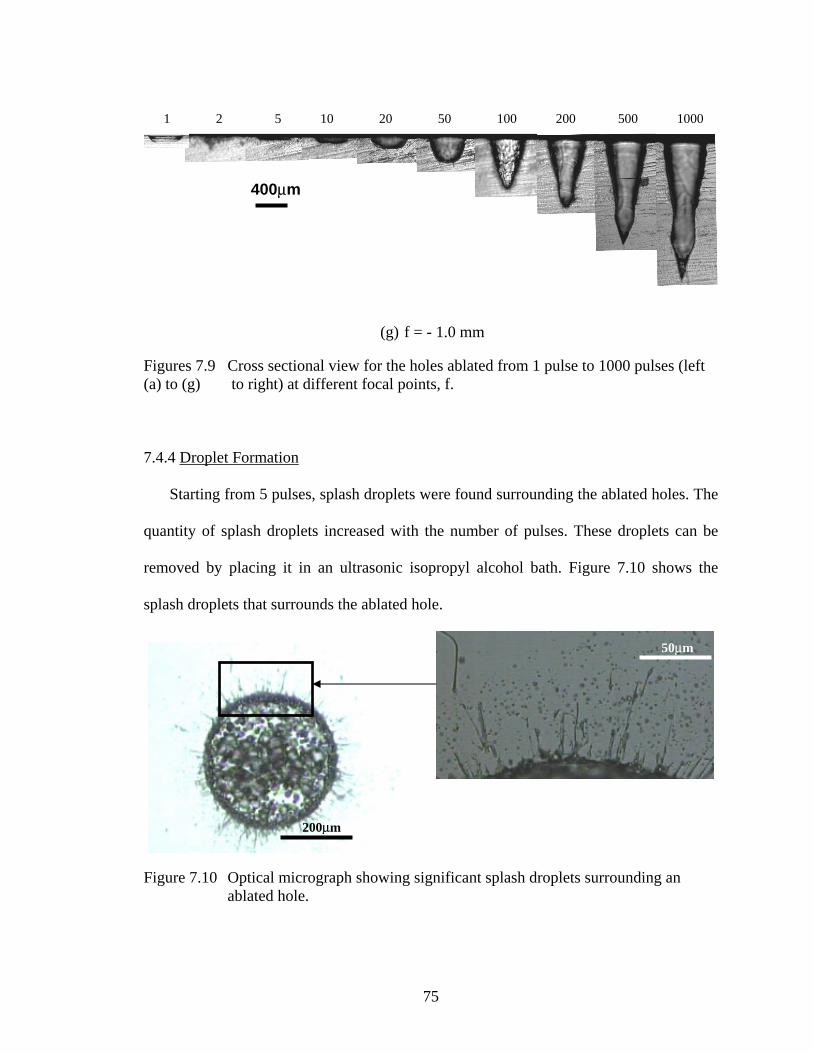
75
1 2 5 10 20 50 100 200 500 1000
(g) f = - 1.0 mm Figures 7.9 Cross sectional view for the holes ablated from 1 pulse to 1000 pulses (left (a) to (g) to right) at different focal points, f.
7.4.4 Droplet Formation
Starting from 5 pulses, splash droplets were found surrounding the ablated holes. The
quantity of splash droplets increased with the number of pulses. These droplets can be
removed by placing it in an ultrasonic isopropyl alcohol bath. Figure 7.10 shows the
splash droplets that surrounds the ablated hole.
Figure 7.10 Optical micrograph showing significant splash droplets surrounding an ablated hole.
400µm
200µm
50µm
76
Kelly and Rothenberg [44] analyzed the possibility of droplet ejection during laser
sputtering of various metals and semiconductors. In their opinion, convex surface
irregularities somehow form on the target surface first. They are then accelerated from
the liquid surface during laser ablation due to volume change on melting followed by
thermal expansion of the liquid. In this way, the condition for droplet ejection implies the
pretextured surface will be formed after a significant number of pulses.
Ang et al. [11] proposed another possible mechanism, namely, the instability of
capillary wave in a molten surface layer. This is a single pulse mechanism in which large
scale surface structures (LSS) with a characteristic spacing of 20-30 µm are formed on
the target surface as a result of surface melt instability that is generated by the plume
pressure. This results in break away of liquid at peaks of a periodically unstable capillary
wave and the ejection of the droplets. All this happens during a single laser pulse. The
expanding plume pressure then splashes droplets back onto the target surface
(recondensation).
77
CHAPTER 8
PULSED LASER MICROMACHINING OF SILICON WAFER
8.1 Introduction
The material covered in this chapter is a joint work and reference [82] give details.
Excimer lasers are high-pressure gas lasers which emit short pulse (a few nanoseconds)
radiation in the ultraviolet range of the electromagnetic spectrum [45]. Since the
absorption length of the UV light is very short for semiconductor materials, the intense
energy is concentrated only at or near the surface. The high-pulse energy (2 J/cm2) and
extremely short duration (ns) leads to rapid melting, vaporization, and plasma formation
of the irradiated material. The transfer of heat into the bulk is relatively small since a
large fraction of laser energy is removed immediately with the ablated material.
Consequently, the subsurface damage can be very small. Hence, micromachining with an
excimer laser can be highly suitable for materials that are very sensitive to both thermal
and mechanical stresses, such as glasses, ceramics, and semiconductor materials.
Laser machining from near infrared to ultraviolet, therefore, can be used for precision
machining of materials in the micrometer range. The type of interaction between the laser
beam and the material being ablated depends not only on the thermo-optical properties of
the workmaterial for a given laser (wavelength) irradiation but also by the appropriate
choice of the laser parameters used (wavelength, pulse energy, pulse duration, energy
78
density). Because of high photon energy per pulse, short-wavelength excimer laser
radiation is used for ablation of practically all materials and especially materials that are
thermally sensitive. Excimer laser ablation of semiconductor materials has proven to a
promising and a very powerful tool for micromachining applications, such as the
fabrication of microelectro-mechanical systems (MEMS), and in the semiconductor IC,
medical, and biomedical fields.
There is great deal of interest in utilizing excimer lasers not only for micro-machining
of semiconductor materials but also in the production of nanomaterials, nanocoatings, etc.
An important requirement in the micromachining of semiconductor materials is the
production of high-quality machined surfaces. In the case of laser ablation, the surface of
the ablated material is usually surrounded by redeposition of molten material or debris
that has to be removed subsequently by other methods. An alternative would be to
remove it during the laser ablation process itself. This can be accomplished by laser
machining under water. There are other advantages of laser ablation under water, as will
be discussed in the following, especially when machining materials which are highly
sensitive under thermal and mechanical stresses and where the subsurface damage has to
be minimal. The main objective of this chapter is to perform short pulse (25 ns) laser
ablation of silicon using a KrF (λ = 248 nm) excimer laser in air and under water at
various laser fluences and number of pulses and compare the results.
8.2 Experiment
The excimer laser micromachining system used in this investigation was described in
Chapter 5. A highly polished, as-received single-crystal silicon was used as the
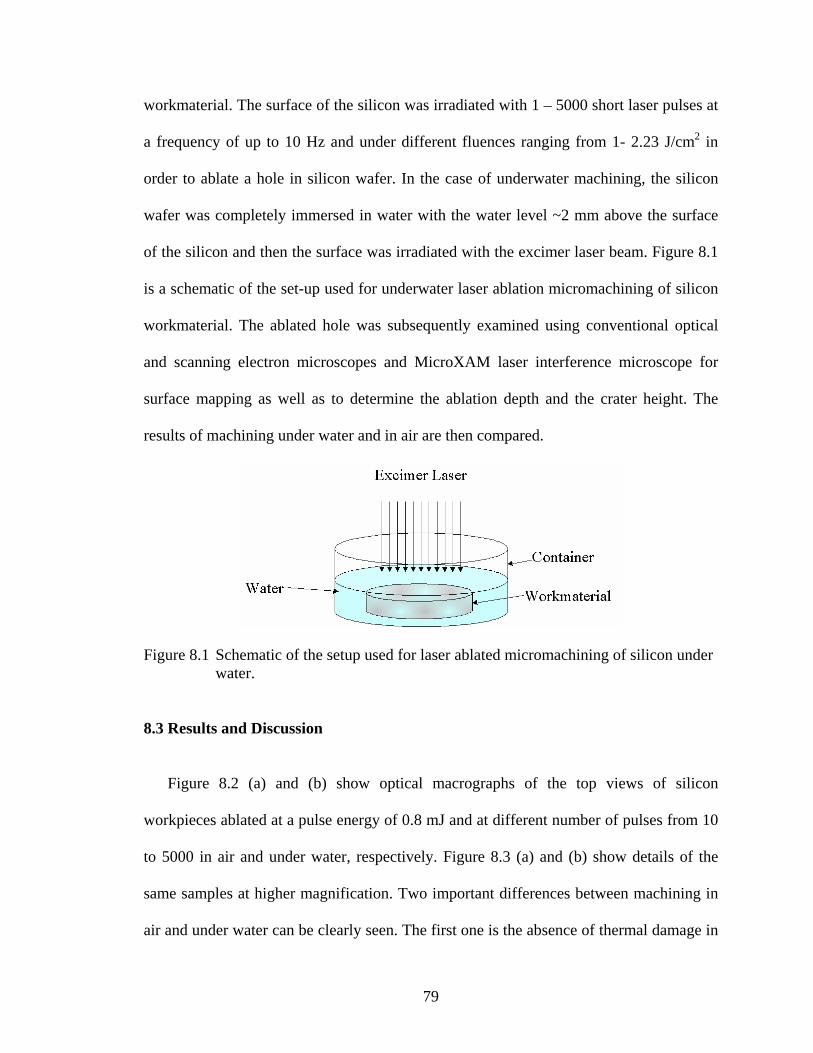
79
workmaterial. The surface of the silicon was irradiated with 1 – 5000 short laser pulses at
a frequency of up to 10 Hz and under different fluences ranging from 1- 2.23 J/cm2 in
order to ablate a hole in silicon wafer. In the case of underwater machining, the silicon
wafer was completely immersed in water with the water level ~2 mm above the surface
of the silicon and then the surface was irradiated with the excimer laser beam. Figure 8.1
is a schematic of the set-up used for underwater laser ablation micromachining of silicon
workmaterial. The ablated hole was subsequently examined using conventional optical
and scanning electron microscopes and MicroXAM laser interference microscope for
surface mapping as well as to determine the ablation depth and the crater height. The
results of machining under water and in air are then compared.
Figure 8.1 Schematic of the setup used for laser ablated micromachining of silicon under water.
8.3 Results and Discussion
Figure 8.2 (a) and (b) show optical macrographs of the top views of silicon
workpieces ablated at a pulse energy of 0.8 mJ and at different number of pulses from 10
to 5000 in air and under water, respectively. Figure 8.3 (a) and (b) show details of the
same samples at higher magnification. Two important differences between machining in
air and under water can be clearly seen. The first one is the absence of thermal damage in
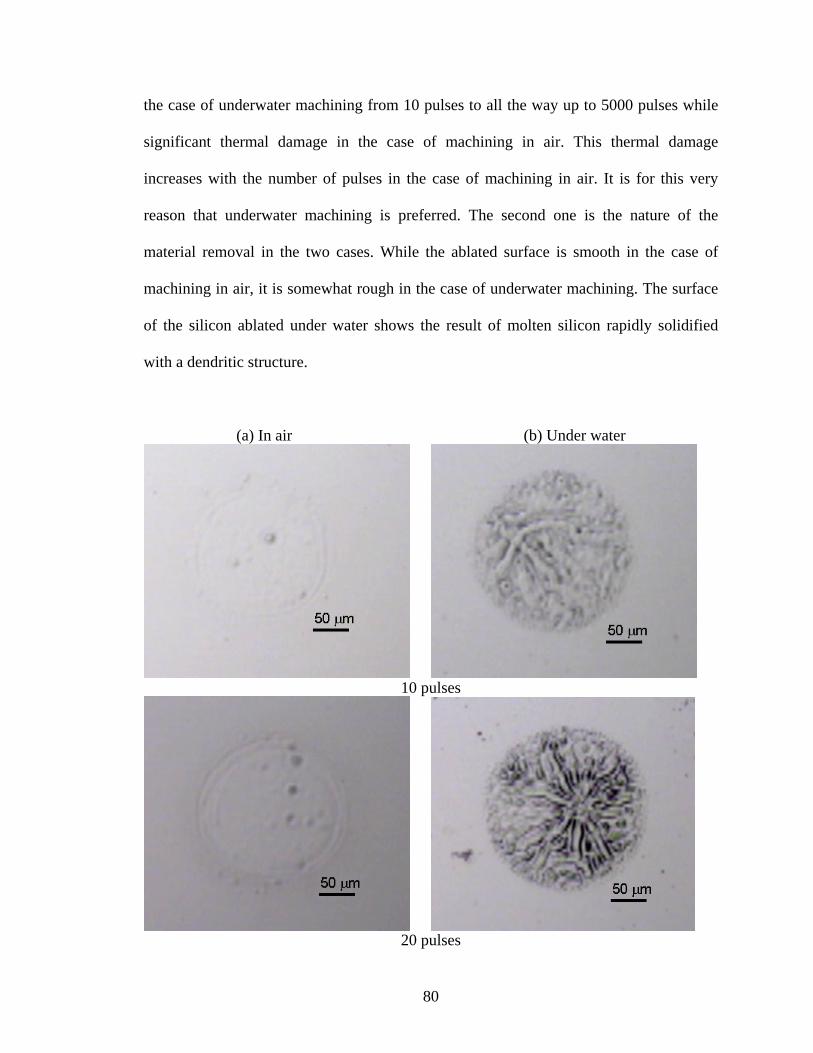
80
the case of underwater machining from 10 pulses to all the way up to 5000 pulses while
significant thermal damage in the case of machining in air. This thermal damage
increases with the number of pulses in the case of machining in air. It is for this very
reason that underwater machining is preferred. The second one is the nature of the
material removal in the two cases. While the ablated surface is smooth in the case of
machining in air, it is somewhat rough in the case of underwater machining. The surface
of the silicon ablated under water shows the result of molten silicon rapidly solidified
with a dendritic structure.
(a) In air (b) Under water
10 pulses
20 pulses
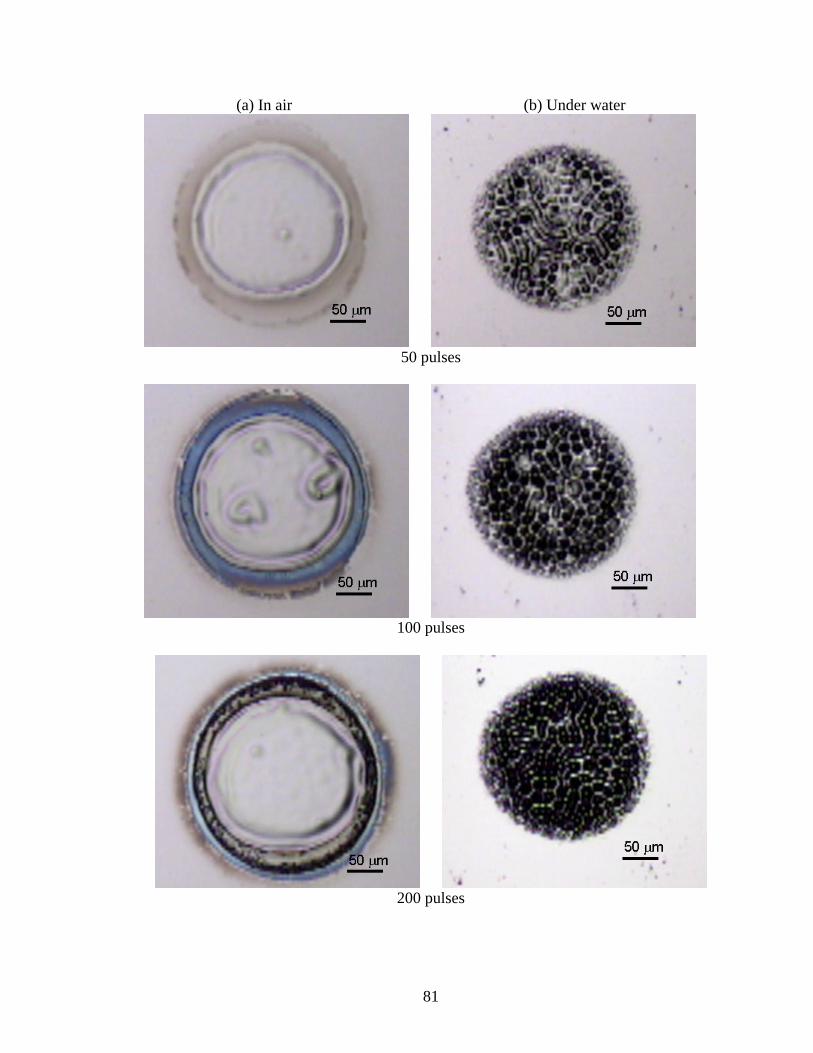
81
(a) In air (b) Under water
50 pulses
100 pulses
200 pulses
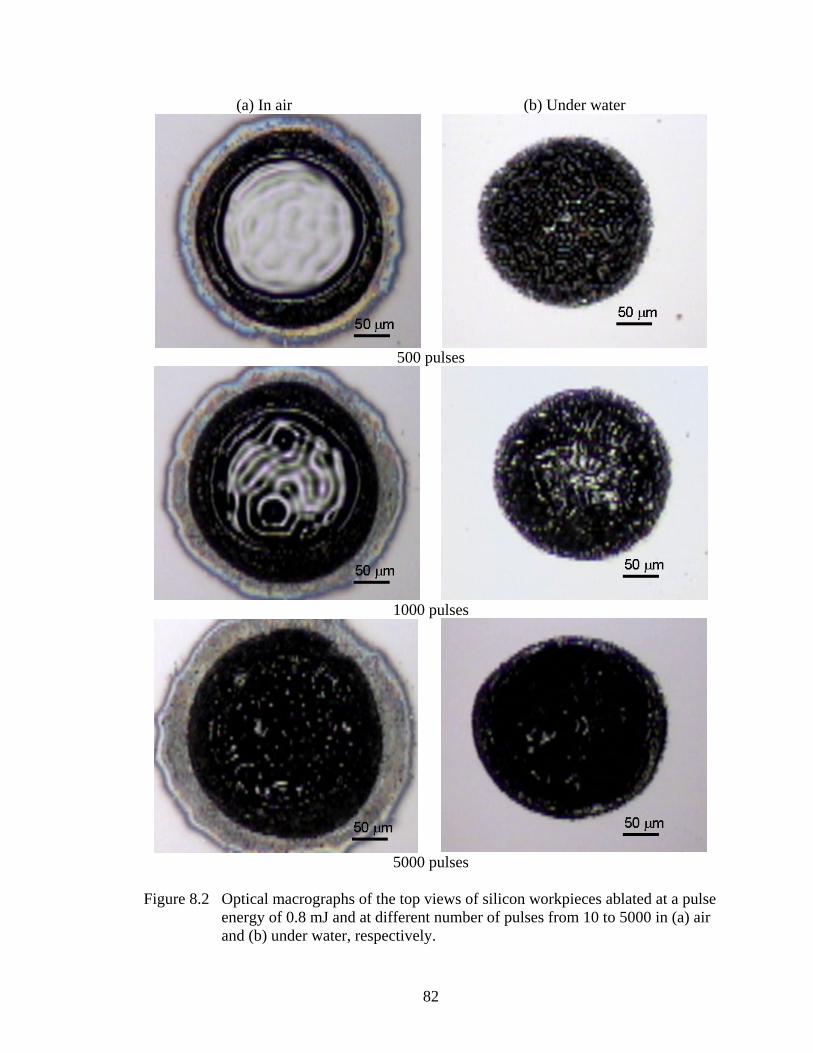
82
(a) In air (b) Under water
500 pulses
1000 pulses
5000 pulses
Figure 8.2 Optical macrographs of the top views of silicon workpieces ablated at a pulse energy of 0.8 mJ and at different number of pulses from 10 to 5000 in (a) air and (b) under water, respectively.

83
(a) In air (b) Under water
10 pulses
20 pulses
50 pulses
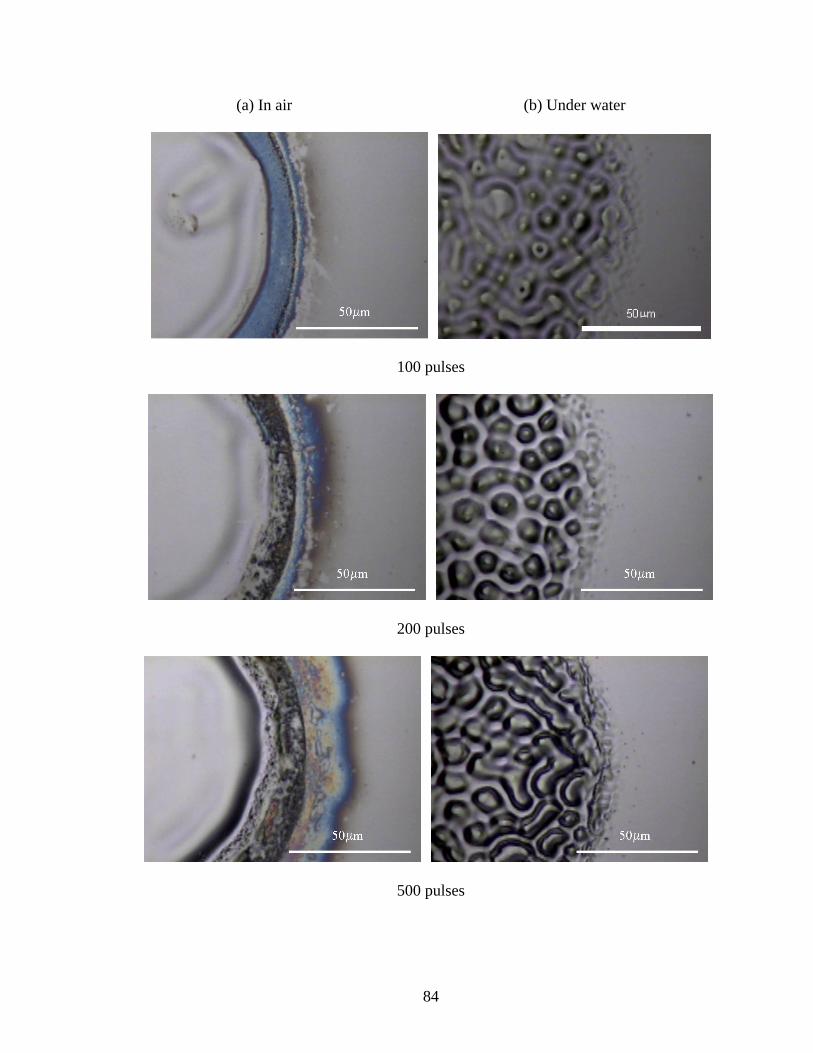
84
(a) In air (b) Under water
100 pulses
200 pulses
500 pulses
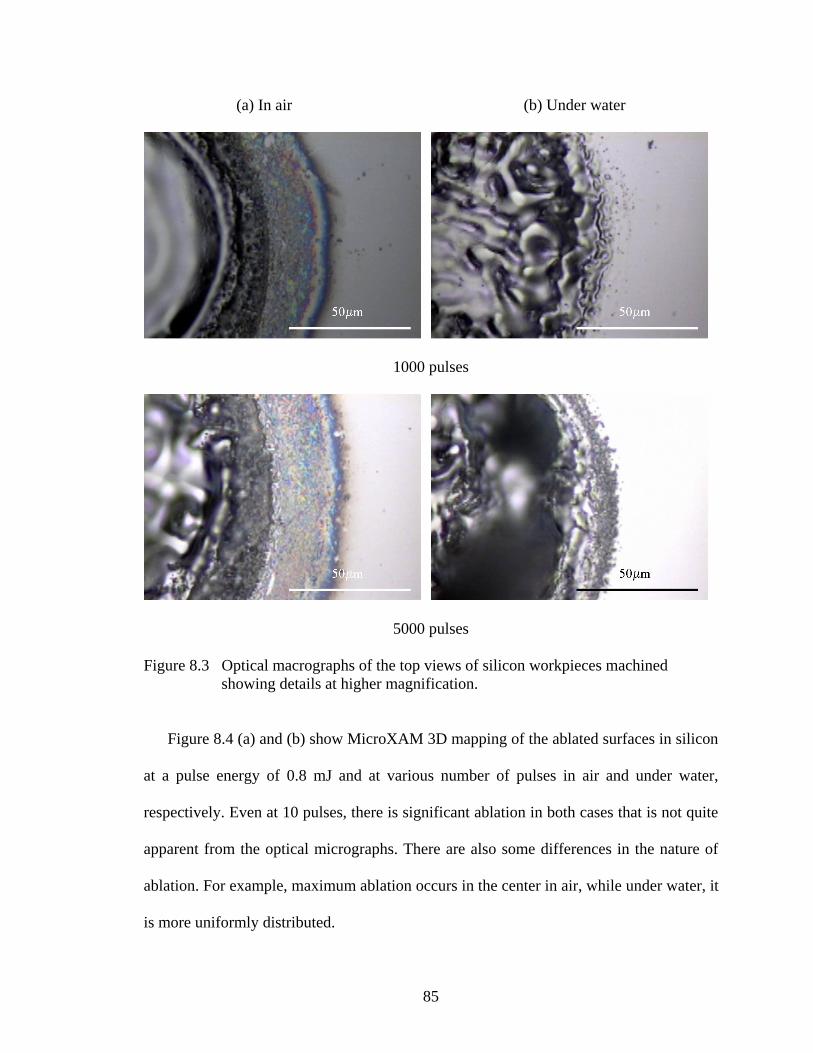
85
(a) In air (b) Under water
1000 pulses
5000 pulses
Figure 8.3 Optical macrographs of the top views of silicon workpieces machined showing details at higher magnification.
Figure 8.4 (a) and (b) show MicroXAM 3D mapping of the ablated surfaces in silicon
at a pulse energy of 0.8 mJ and at various number of pulses in air and under water,
respectively. Even at 10 pulses, there is significant ablation in both cases that is not quite
apparent from the optical micrographs. There are also some differences in the nature of
ablation. For example, maximum ablation occurs in the center in air, while under water, it
is more uniformly distributed.
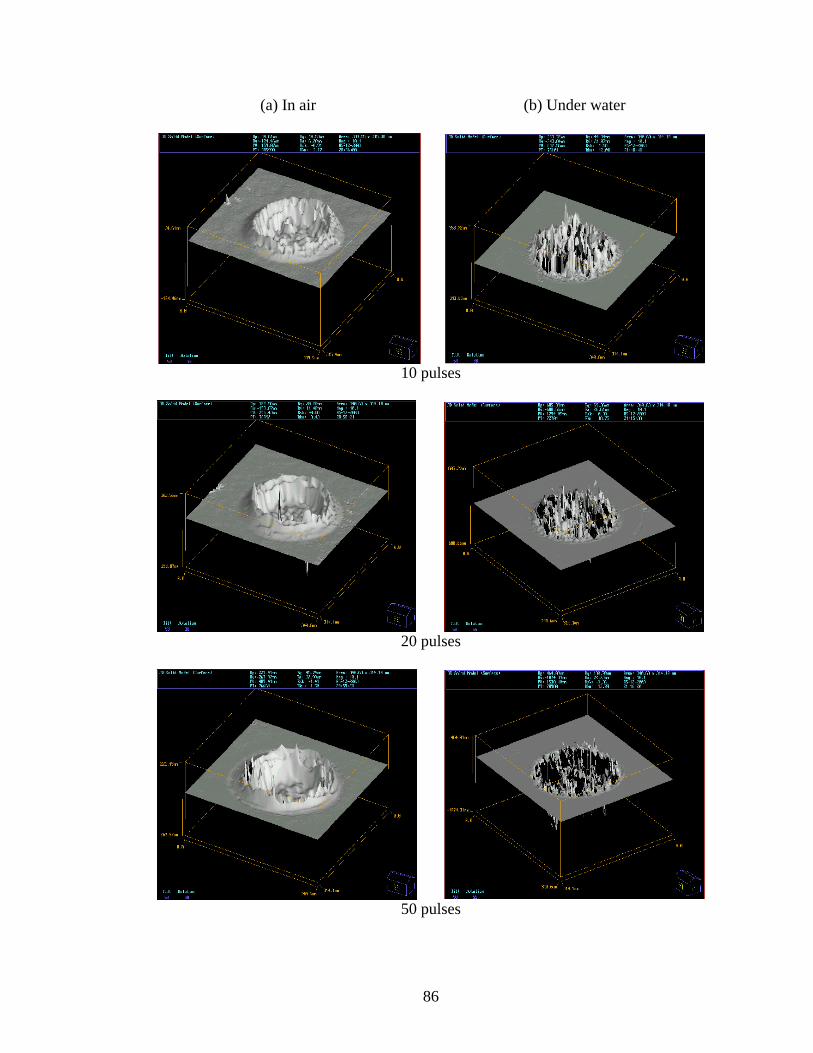
86
(a) In air (b) Under water
10 pulses
20 pulses
50 pulses
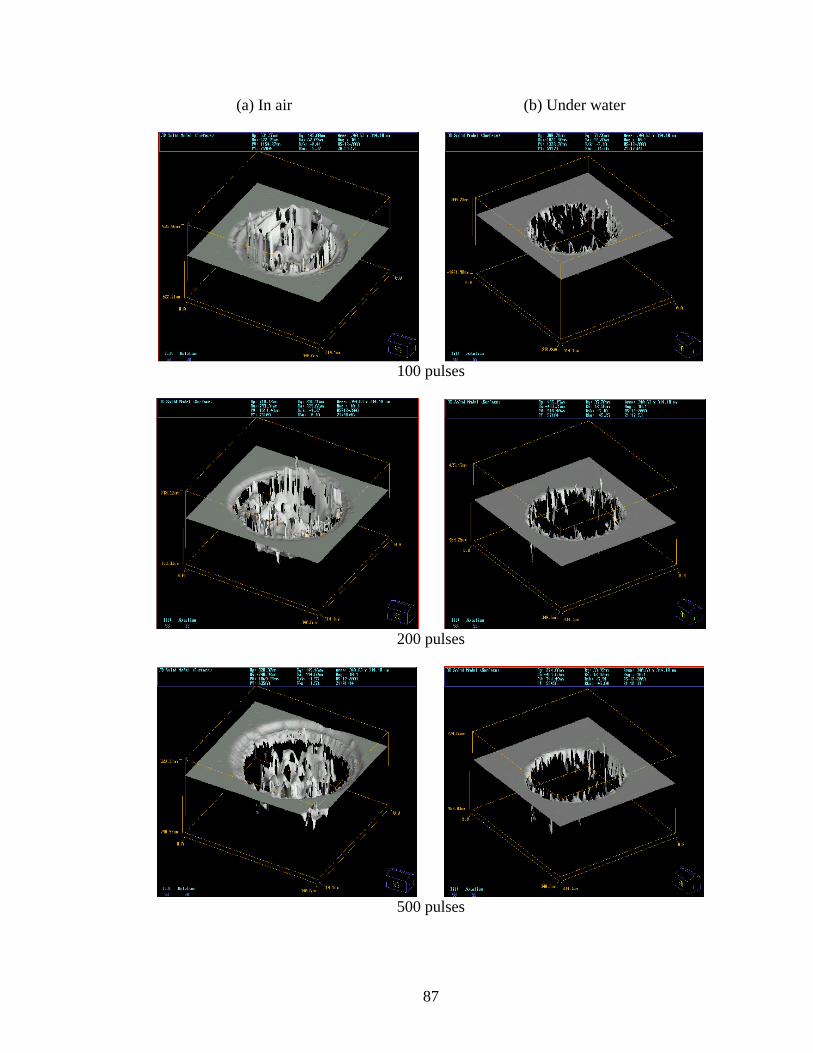
87
(a) In air (b) Under water
100 pulses
200 pulses
500 pulses
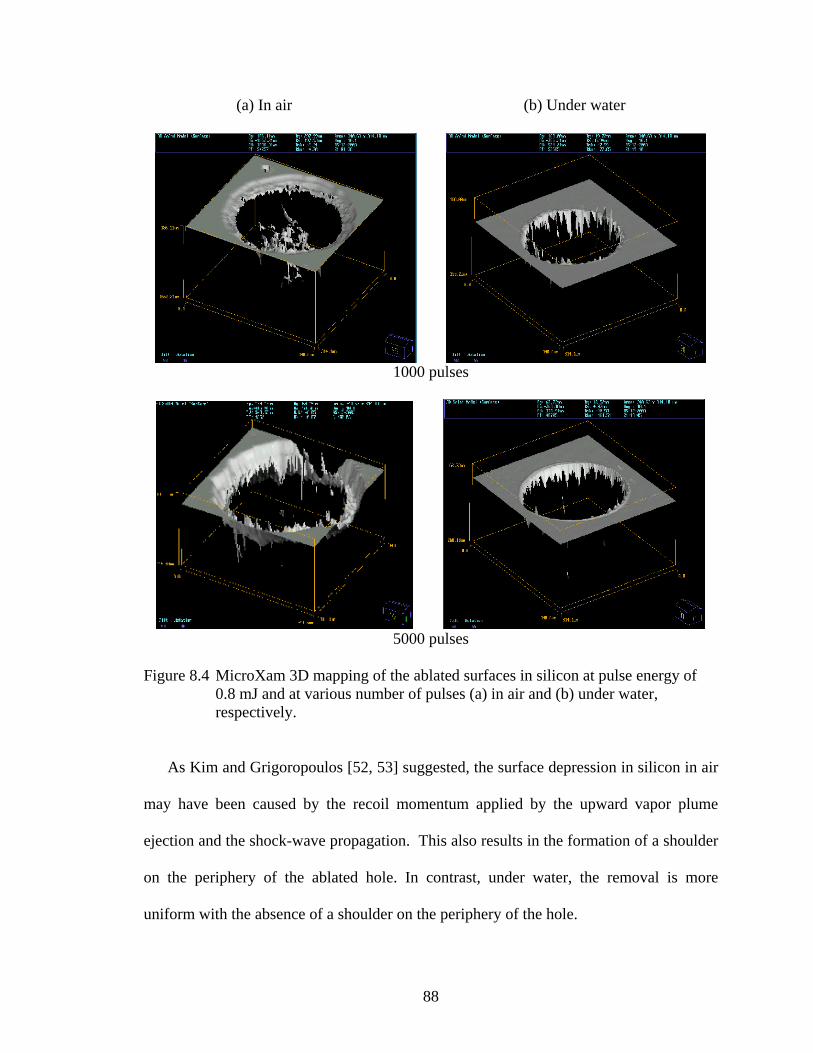
88
(a) In air (b) Under water
1000 pulses
5000 pulses
Figure 8.4 MicroXam 3D mapping of the ablated surfaces in silicon at pulse energy of 0.8 mJ and at various number of pulses (a) in air and (b) under water, respectively.
As Kim and Grigoropoulos [52, 53] suggested, the surface depression in silicon in air
may have been caused by the recoil momentum applied by the upward vapor plume
ejection and the shock-wave propagation. This also results in the formation of a shoulder
on the periphery of the ablated hole. In contrast, under water, the removal is more
uniform with the absence of a shoulder on the periphery of the hole.
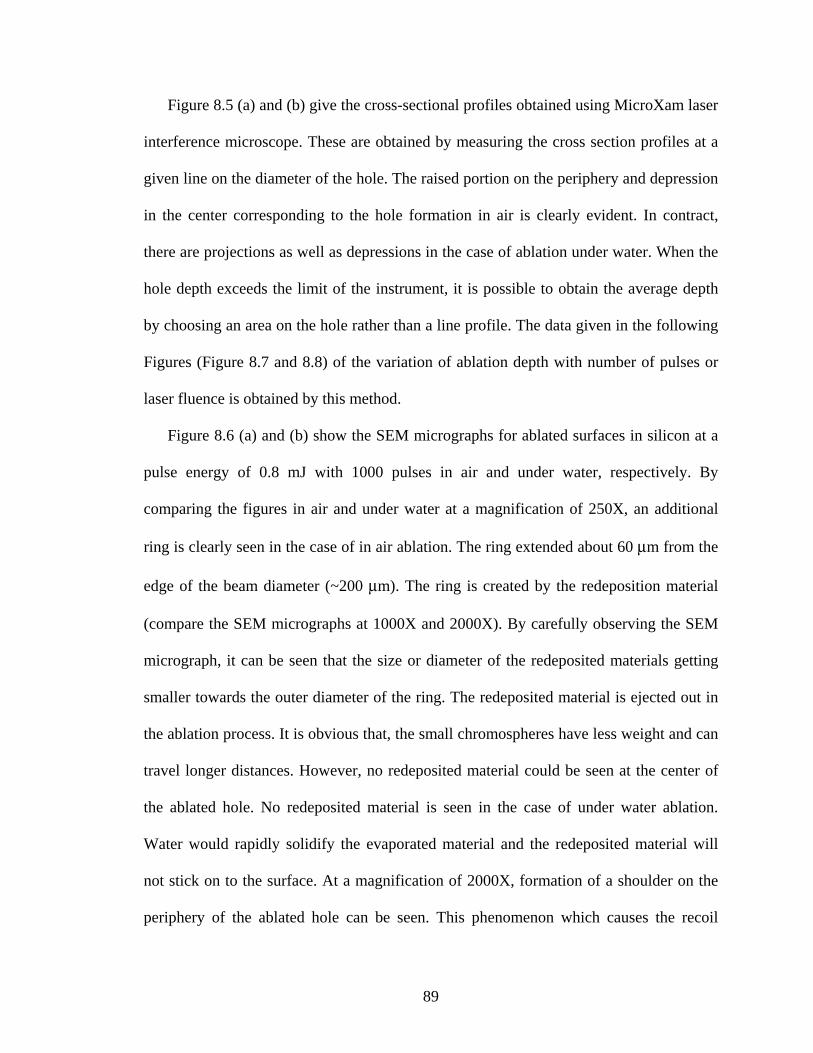
89
Figure 8.5 (a) and (b) give the cross-sectional profiles obtained using MicroXam laser
interference microscope. These are obtained by measuring the cross section profiles at a
given line on the diameter of the hole. The raised portion on the periphery and depression
in the center corresponding to the hole formation in air is clearly evident. In contract,
there are projections as well as depressions in the case of ablation under water. When the
hole depth exceeds the limit of the instrument, it is possible to obtain the average depth
by choosing an area on the hole rather than a line profile. The data given in the following
Figures (Figure 8.7 and 8.8) of the variation of ablation depth with number of pulses or
laser fluence is obtained by this method.
Figure 8.6 (a) and (b) show the SEM micrographs for ablated surfaces in silicon at a
pulse energy of 0.8 mJ with 1000 pulses in air and under water, respectively. By
comparing the figures in air and under water at a magnification of 250X, an additional
ring is clearly seen in the case of in air ablation. The ring extended about 60 µm from the
edge of the beam diameter (~200 µm). The ring is created by the redeposition material
(compare the SEM micrographs at 1000X and 2000X). By carefully observing the SEM
micrograph, it can be seen that the size or diameter of the redeposited materials getting
smaller towards the outer diameter of the ring. The redeposited material is ejected out in
the ablation process. It is obvious that, the small chromospheres have less weight and can
travel longer distances. However, no redeposited material could be seen at the center of
the ablated hole. No redeposited material is seen in the case of under water ablation.
Water would rapidly solidify the evaporated material and the redeposited material will
not stick on to the surface. At a magnification of 2000X, formation of a shoulder on the
periphery of the ablated hole can be seen. This phenomenon which causes the recoil
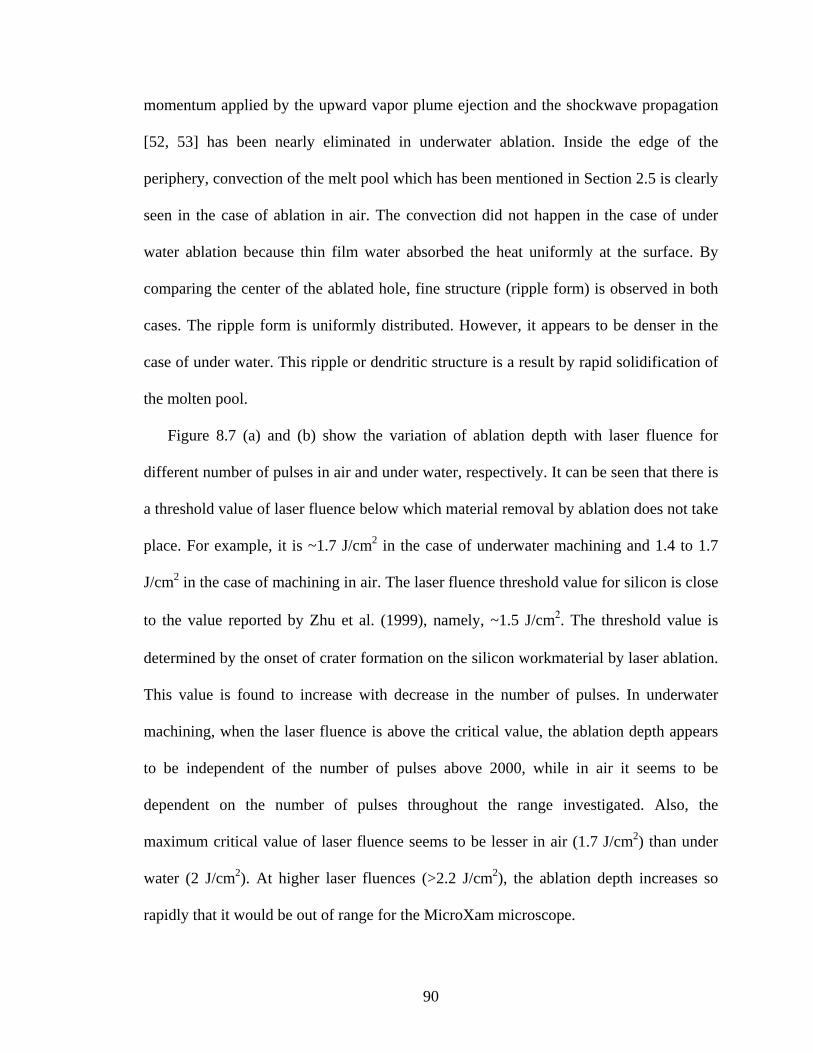
90
momentum applied by the upward vapor plume ejection and the shockwave propagation
[52, 53] has been nearly eliminated in underwater ablation. Inside the edge of the
periphery, convection of the melt pool which has been mentioned in Section 2.5 is clearly
seen in the case of ablation in air. The convection did not happen in the case of under
water ablation because thin film water absorbed the heat uniformly at the surface. By
comparing the center of the ablated hole, fine structure (ripple form) is observed in both
cases. The ripple form is uniformly distributed. However, it appears to be denser in the
case of under water. This ripple or dendritic structure is a result by rapid solidification of
the molten pool.
Figure 8.7 (a) and (b) show the variation of ablation depth with laser fluence for
different number of pulses in air and under water, respectively. It can be seen that there is
a threshold value of laser fluence below which material removal by ablation does not take
place. For example, it is ~1.7 J/cm2 in the case of underwater machining and 1.4 to 1.7
J/cm2 in the case of machining in air. The laser fluence threshold value for silicon is close
to the value reported by Zhu et al. (1999), namely, ~1.5 J/cm2. The threshold value is
determined by the onset of crater formation on the silicon workmaterial by laser ablation.
This value is found to increase with decrease in the number of pulses. In underwater
machining, when the laser fluence is above the critical value, the ablation depth appears
to be independent of the number of pulses above 2000, while in air it seems to be
dependent on the number of pulses throughout the range investigated. Also, the
maximum critical value of laser fluence seems to be lesser in air (1.7 J/cm2) than under
water (2 J/cm2). At higher laser fluences (>2.2 J/cm2), the ablation depth increases so
rapidly that it would be out of range for the MicroXam microscope.
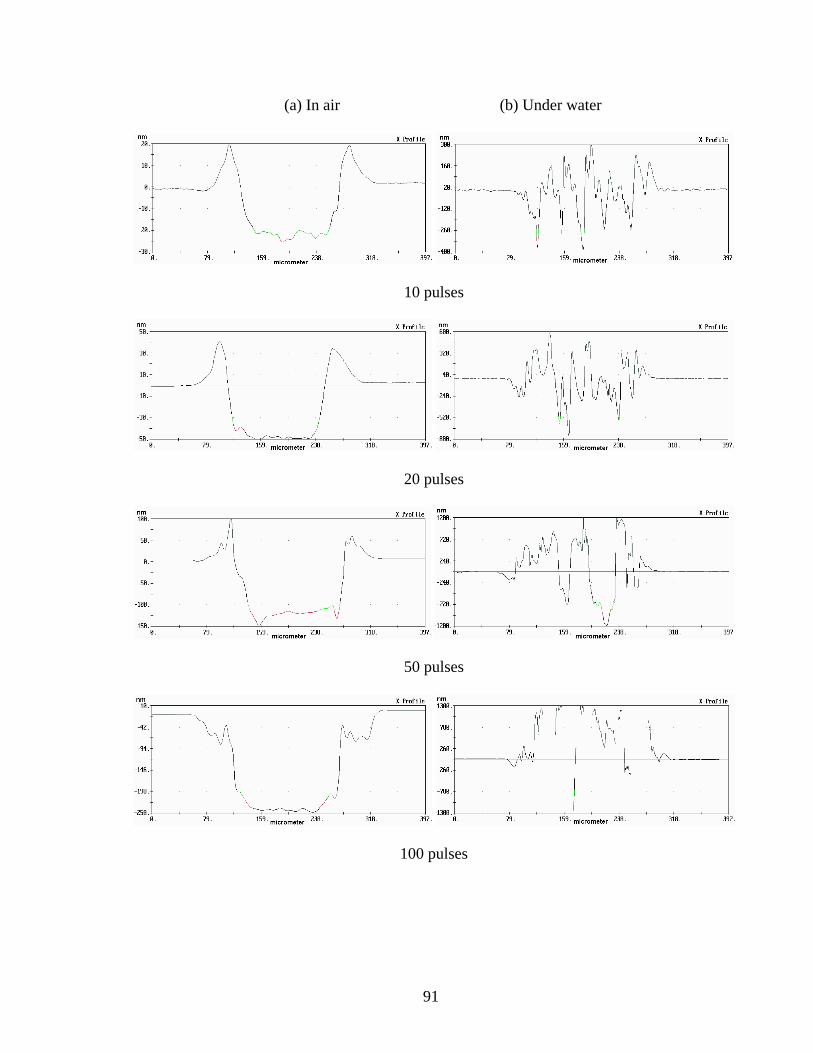
91
(a) In air (b) Under water
10 pulses
20 pulses
50 pulses
100 pulses
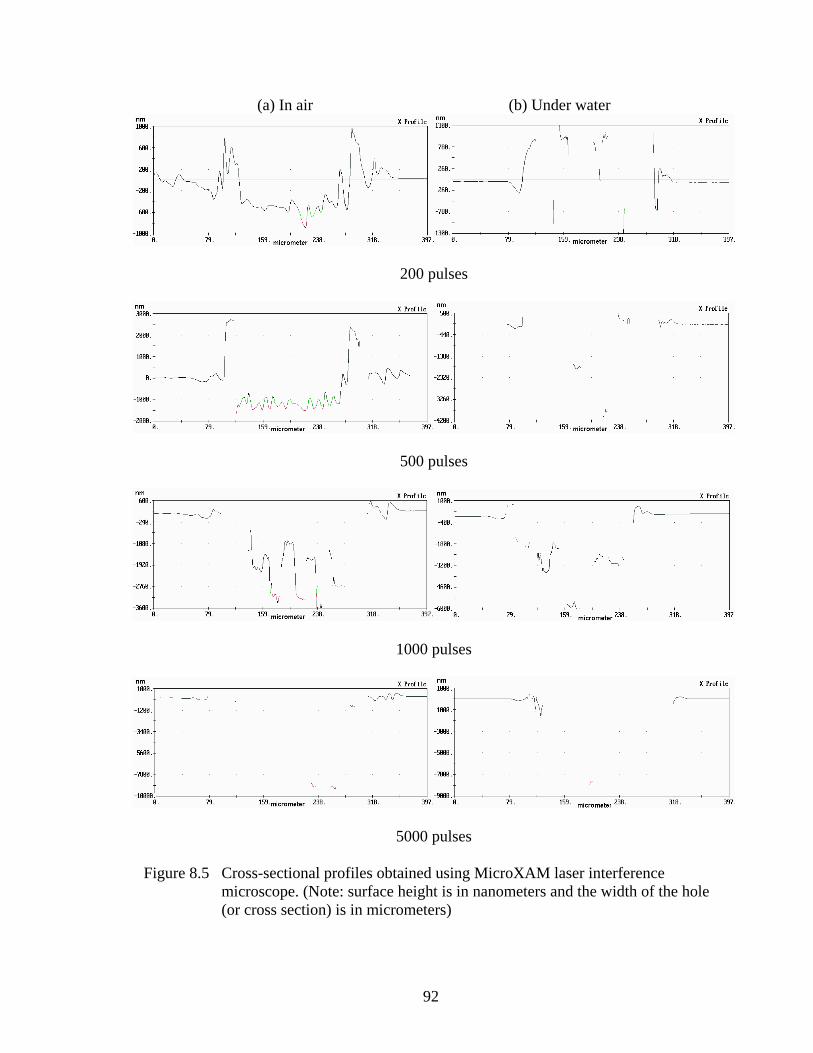
92
(a) In air (b) Under water
200 pulses
500 pulses
1000 pulses
5000 pulses
Figure 8.5 Cross-sectional profiles obtained using MicroXAM laser interference microscope. (Note: surface height is in nanometers and the width of the hole (or cross section) is in micrometers)
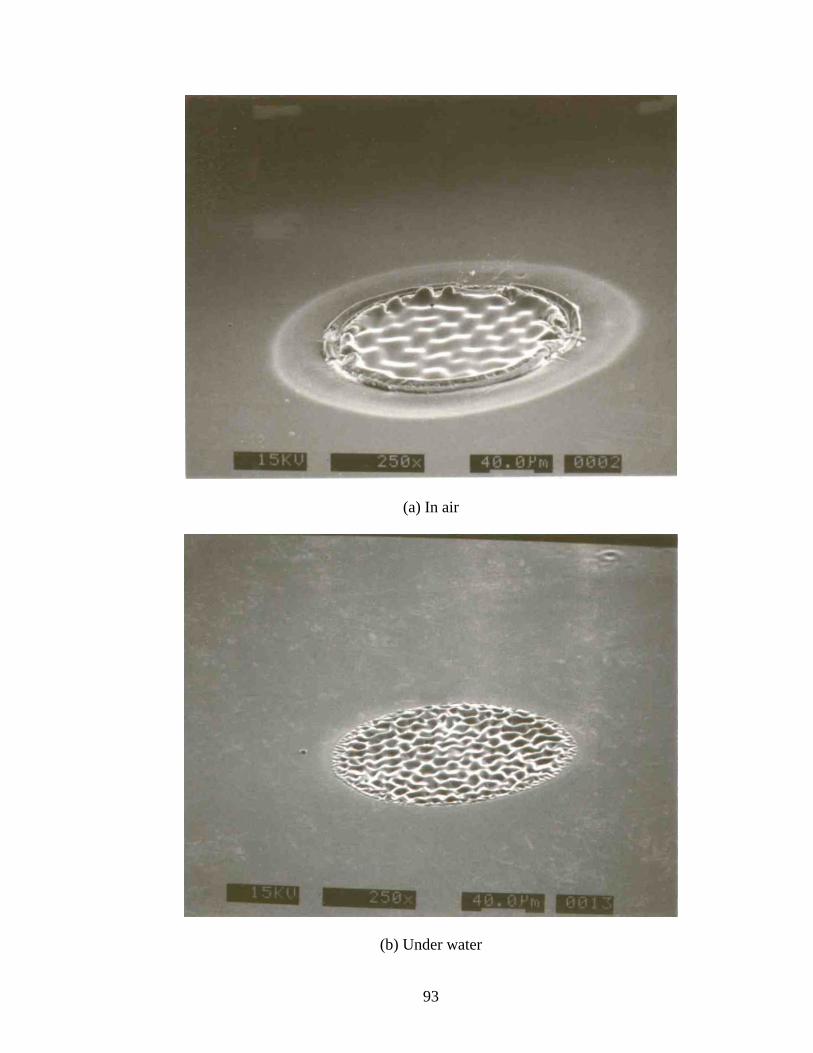
93
(a) In air
(b) Under water
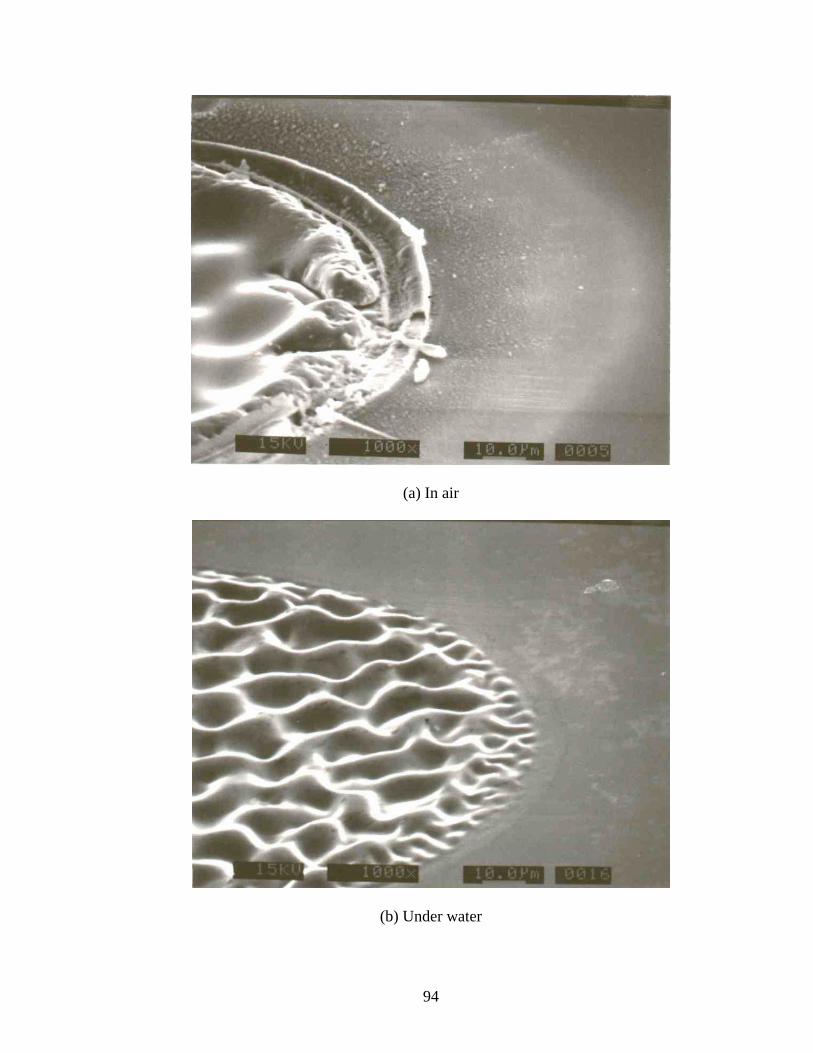
94
(a) In air
(b) Under water
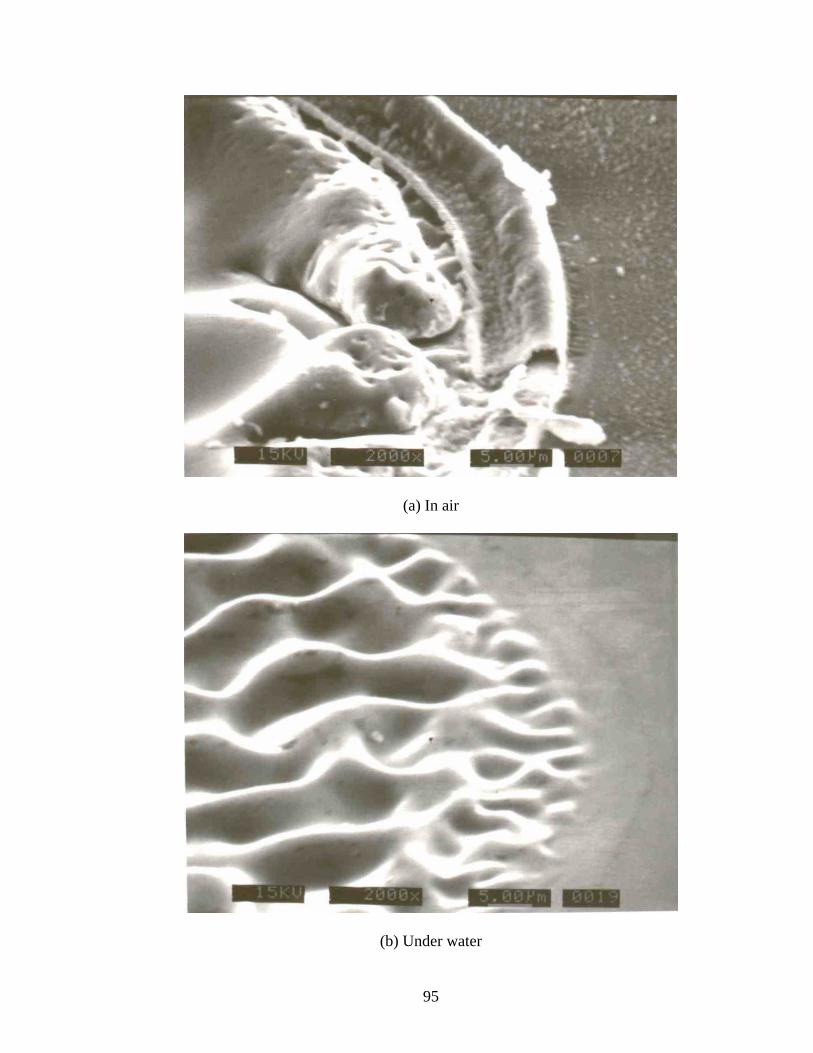
95
(a) In air
(b) Under water
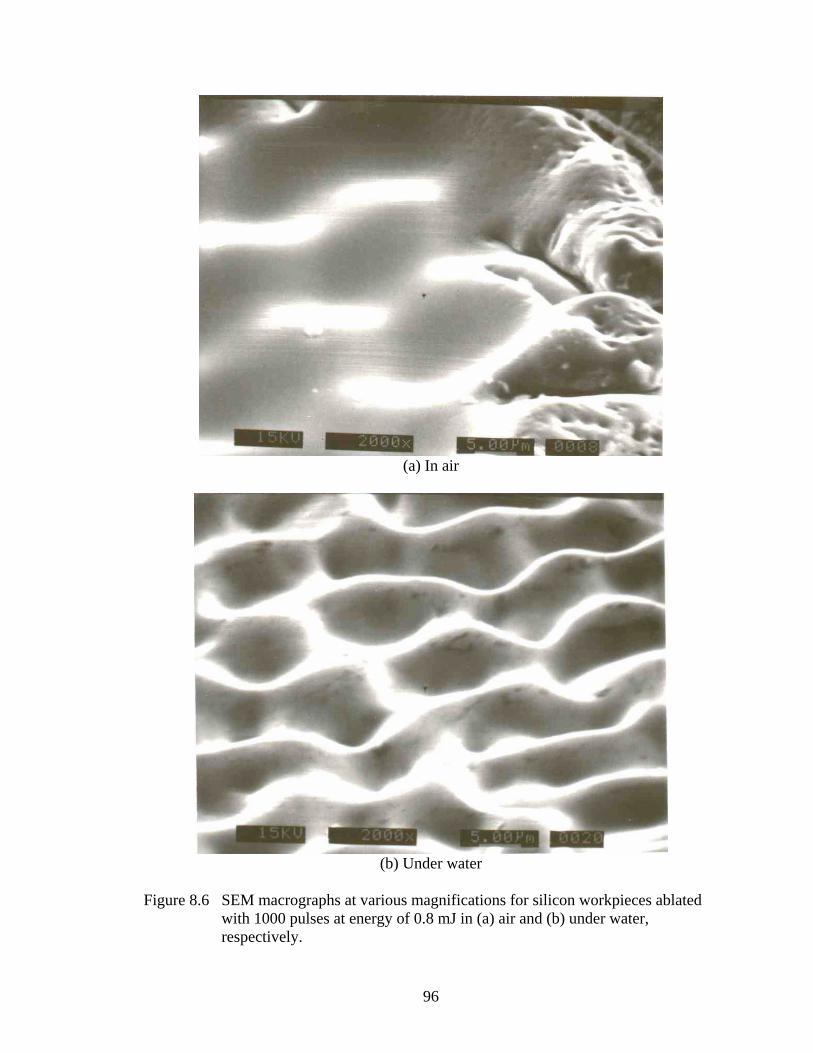
96
(a) In air
(b) Under water
Figure 8.6 SEM macrographs at various magnifications for silicon workpieces ablated with 1000 pulses at energy of 0.8 mJ in (a) air and (b) under water, respectively.
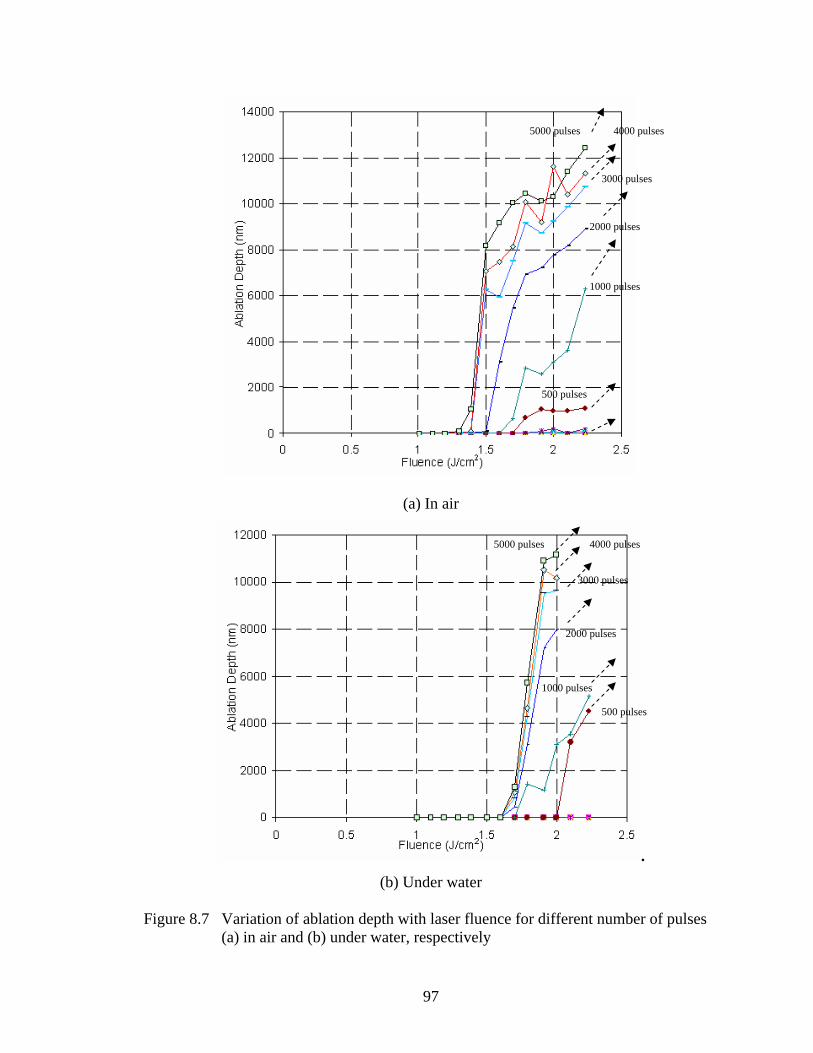
97
(a) In air
. (b) Under water
Figure 8.7 Variation of ablation depth with laser fluence for different number of pulses (a) in air and (b) under water, respectively
5000 pulses 4000 pulses
3000 pulses
2000 pulses
1000 pulses
500 pulses
5000 pulses 4000 pulses
3000 pulses
2000 pulses
1000 pulses
500 pulses
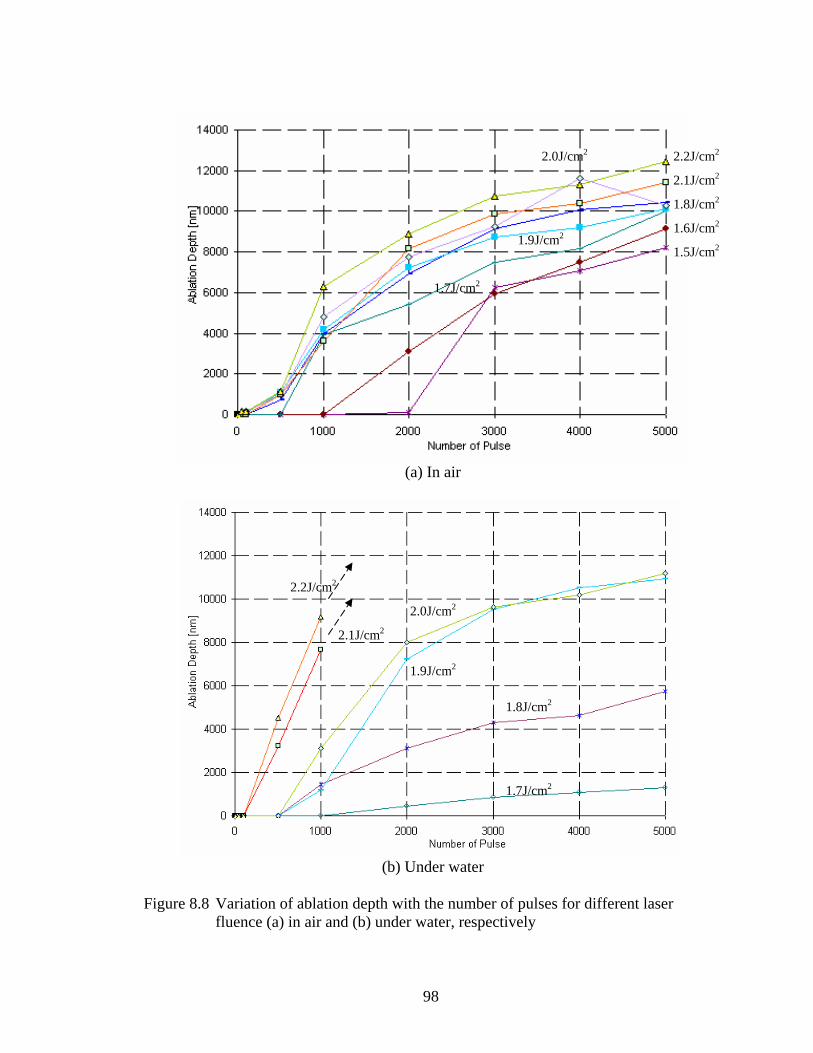
98
(a) In air
(b) Under water
Figure 8.8 Variation of ablation depth with the number of pulses for different laser fluence (a) in air and (b) under water, respectively
2.2J/cm2
2.1J/cm2
2.0J/cm2
1.9J/cm2
1.8J/cm2
1.7J/cm2
1.5J/cm2
1.6J/cm2
2.2J/cm2
2.1J/cm2
2.0J/cm2
1.9J/cm2
1.8J/cm2
1.7J/cm2
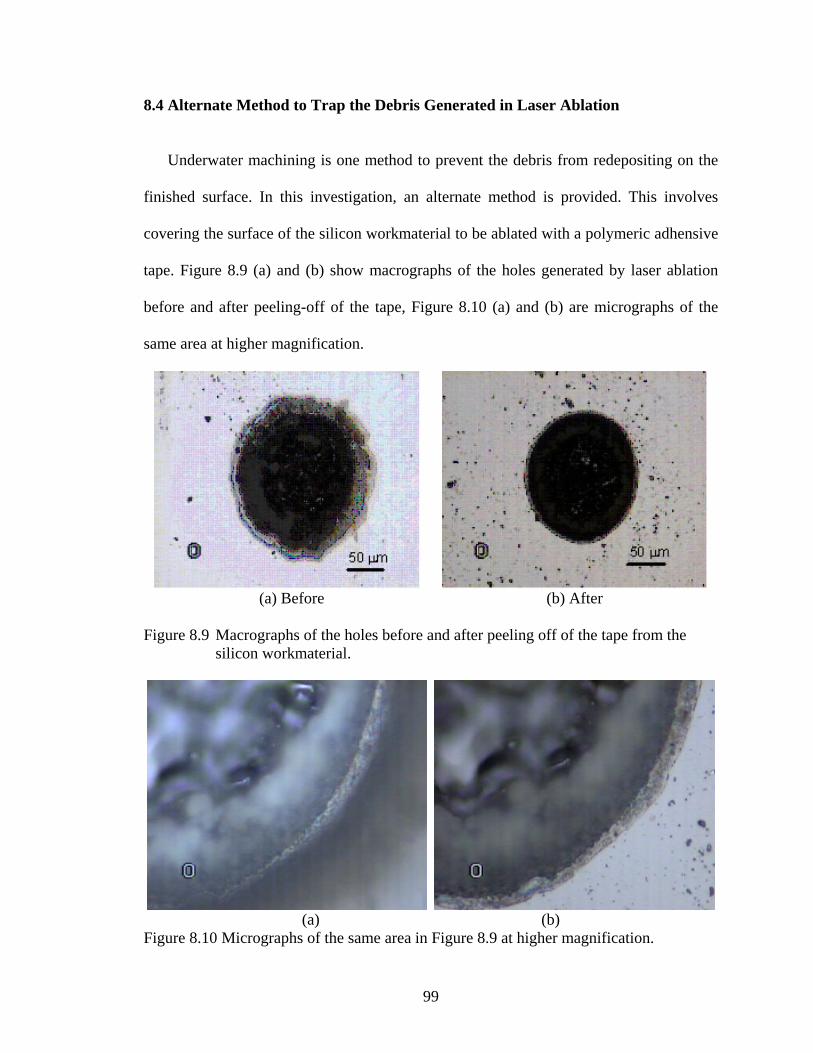
99
8.4 Alternate Method to Trap the Debris Generated in Laser Ablation
Underwater machining is one method to prevent the debris from redepositing on the
finished surface. In this investigation, an alternate method is provided. This involves
covering the surface of the silicon workmaterial to be ablated with a polymeric adhensive
tape. Figure 8.9 (a) and (b) show macrographs of the holes generated by laser ablation
before and after peeling-off of the tape, Figure 8.10 (a) and (b) are micrographs of the
same area at higher magnification.
(a) Before (b) After
Figure 8.9 Macrographs of the holes before and after peeling off of the tape from the silicon workmaterial.
(a) (b)
Figure 8.10 Micrographs of the same area in Figure 8.9 at higher magnification.
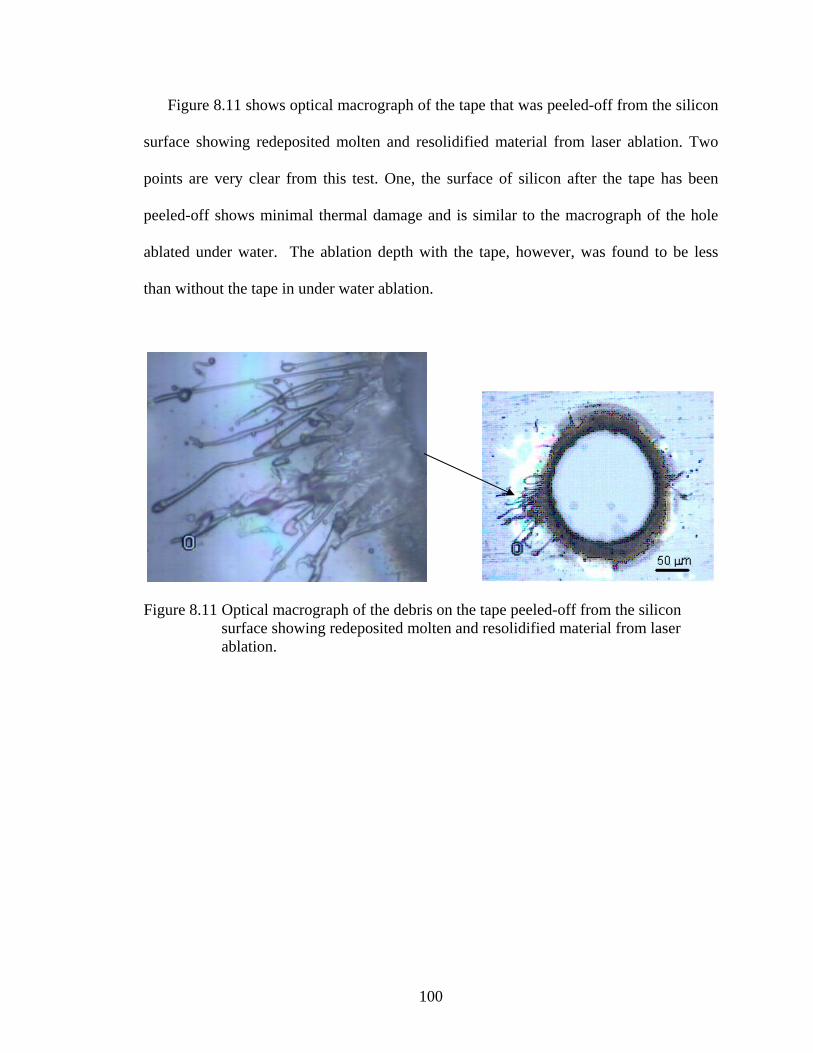
100
Figure 8.11 shows optical macrograph of the tape that was peeled-off from the silicon
surface showing redeposited molten and resolidified material from laser ablation. Two
points are very clear from this test. One, the surface of silicon after the tape has been
peeled-off shows minimal thermal damage and is similar to the macrograph of the hole
ablated under water. The ablation depth with the tape, however, was found to be less
than without the tape in under water ablation.
Figure 8.11 Optical macrograph of the debris on the tape peeled-off from the silicon surface showing redeposited molten and resolidified material from laser ablation.
101
CHAPTER 9
PULSED LASER MICRODRILLING OF BOROSILICATE GLASS
9.1 Introduction
When an intense pulsed laser light is irradiated on the surface of a workpiece, the
following processes will occur. At the beginning of the laser pulse, the absorbed laser
energy will heat up the substrate to the melting point and subsequently to the vaporization
temperature. Depending on the fluence, vaporization can occur within a small fraction of
the pulse duration. Evaporated material is pushed away due to recoil pressure. As the
same time, the recoil pressure also exerts a force on the molten pool and expels it
sideways. Material is removed both in vapor and liquid forms.
For a short and very intense pulse laser, laser induced shock will be generated. Shock
wave could be generated by (1) recoil pressure due to rapid vaporization of material, (2)
interaction of the laser and the plasma. The shock wave can impinge on the workpiece
causing fracture. This damage is referred to as the mechanical damage.
9.2 Analysis
9.2.1 Behavior of Glass
In order to relieve internal stresses that may develop during glass formation, glass is
annealed immediately after shaping. The transformation of a liquid to a glass actually
102
takes place over a range of temperatures at which glass shrinks (thermal contraction).
Glass does not undergo a change from disordered liquid structure to ordered crystal
structure as iron does at its transformation temperature. In glass, the transformation
temperature is the temperature below which viscosity prevents any further
configurational changes. Any contraction beyond the transformation temperature range
is due only to the lower kinetic energy of the grouping.
The transformation temperature of a given glass composition depends on its
constituents and upon the rate of cooling. Slow cooling results in a lower transformation
range because the tetrahedral structure will have more time to rearrange. This results in
tighter packing of the tetrahedral structure as the mass reaches its transformation range.
When glass reaches room temperature, it volume will be smaller when cooled slowly than
when cooled rapidly. Hence, slower cooling from the glass melt results in denser glass.
Glass is thermodynamically unstable at room temperature because configuration
changes would result in a lower free energy configuration. However, the changes are so
slow that they may be considered negligible (it requires eons of years).
As mentioned by Shiu et al. (1999) (refer to Figure 9.1) initially glass is considered to
be a point a. CO2 laser heating with microsecond pulse duration brings glass to the liquid
state point b by following curve 1. With a cooling rate of 106 ˚C/s, cooling is represented
by the fast cooling curve with transition temperature Tg and eventually the molten glass
reach point c. The difference in structure between point a and c results in a net volume
increase.
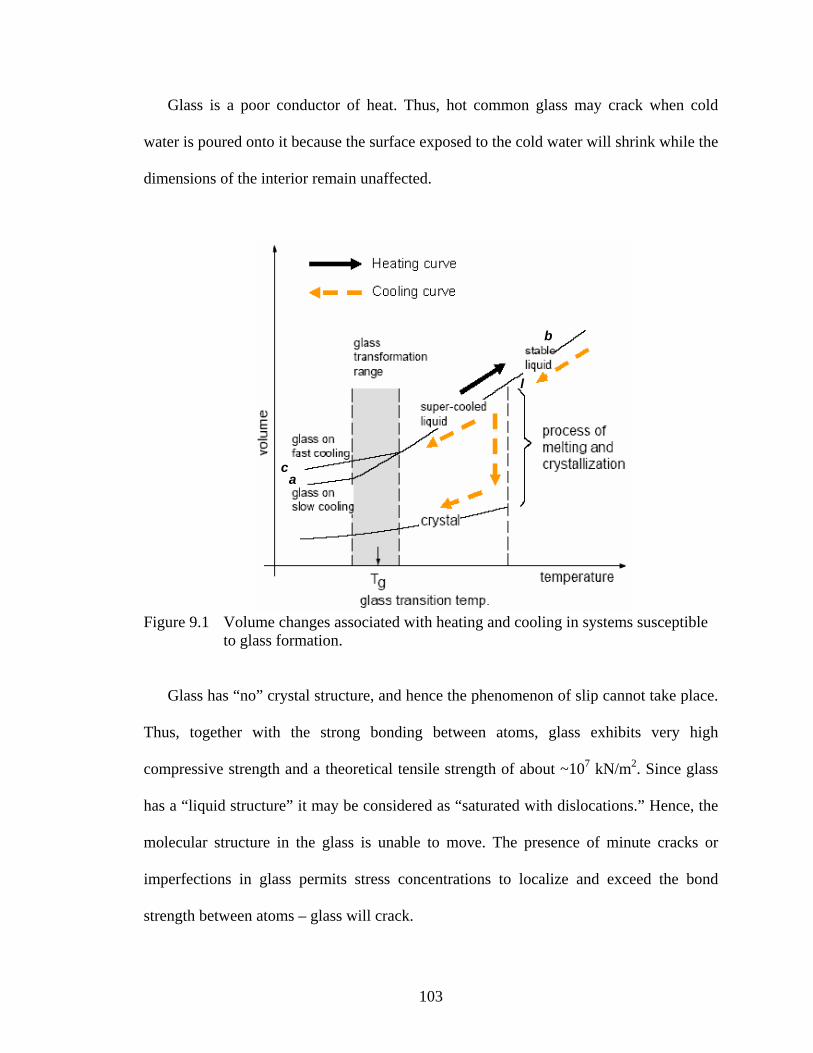
103
Glass is a poor conductor of heat. Thus, hot common glass may crack when cold
water is poured onto it because the surface exposed to the cold water will shrink while the
dimensions of the interior remain unaffected.
Figure 9.1 Volume changes associated with heating and cooling in systems susceptible to glass formation.
Glass has “no” crystal structure, and hence the phenomenon of slip cannot take place.
Thus, together with the strong bonding between atoms, glass exhibits very high
compressive strength and a theoretical tensile strength of about ~107 kN/m2. Since glass
has a “liquid structure” it may be considered as “saturated with dislocations.” Hence, the
molecular structure in the glass is unable to move. The presence of minute cracks or
imperfections in glass permits stress concentrations to localize and exceed the bond
strength between atoms – glass will crack.
a
b
c
l
104
9.2.2 Mechanism of Bump Formation
Normally, for most pure liquids, δσ/δτ < 0, where σ is the surface tension. However,
Kingery [85] found that δσ/δτ could be positive for certain liquids, such as SiO2B2O3
melt due to dissociation with temperature. It is believed that surface tension of a liquid
depends not only on the surface temperature but also on the surfactant concentration [86].
The temperature gradient drives the material towards the cooler region of higher surface
tension, while the surfactant effect tends to move the material to lower surfactant
concentration region [87]. Pulses following the first one would therefore be expected to
drive less significant compositional capillarity, ultimately suppressing the central dome.
Vaporization of absorbed oxygen and water was believed to be the main reason for
generating gradients of surfactant composition.
For the case of laser-induced bump formation, pulsed heating creates a temperature
gradient following the beam intensity profile along the radial direction. The temperature
gradient induced thermocapilary flow, drives the material from the hot center to the cold
periphery forming a bowl-shaped feature.
9.3 Experiment
The experimental setup used for silicon wafer studies (Chapter 8) was used. A
borosilicate glass (Corning 0211 glass) was used as the workmaterial in this study. Table
9.1 lists some properties of the borosilicate glass.
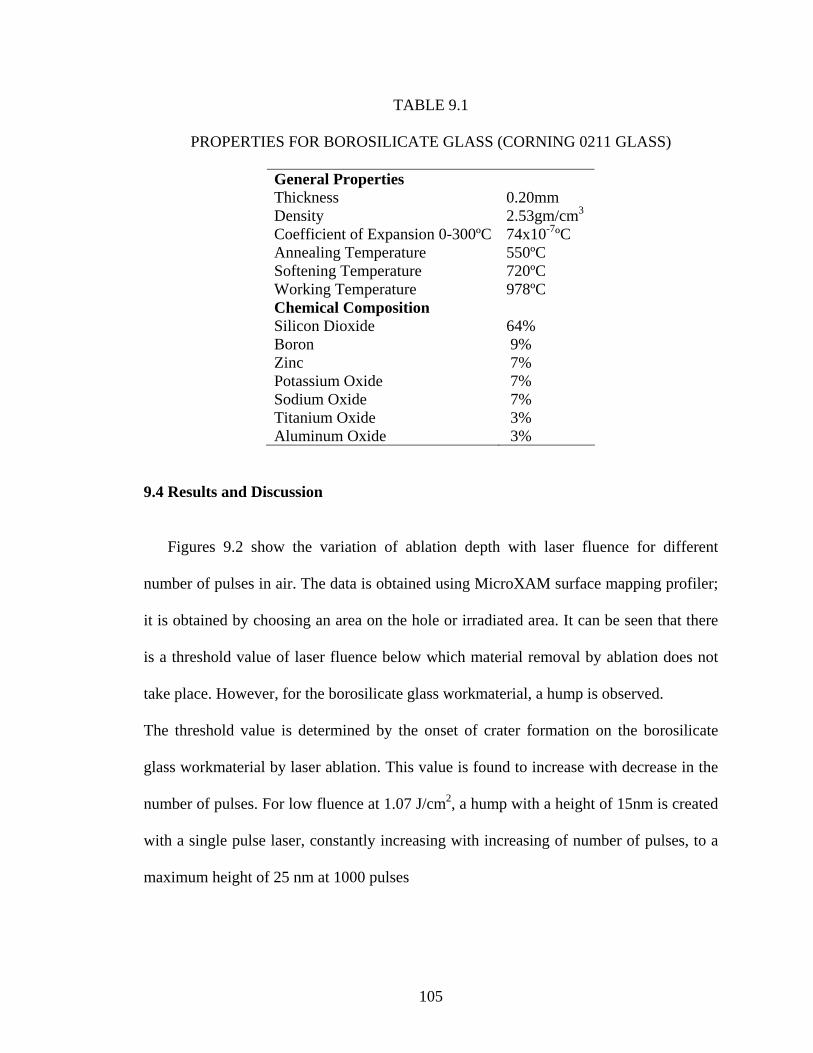
105
TABLE 9.1
PROPERTIES FOR BOROSILICATE GLASS (CORNING 0211 GLASS)
General Properties Thickness 0.20mm Density 2.53gm/cm3 Coefficient of Expansion 0-300ºC 74x10-7ºC Annealing Temperature 550ºC Softening Temperature 720ºC Working Temperature 978ºC Chemical Composition Silicon Dioxide 64% Boron 9% Zinc 7% Potassium Oxide 7% Sodium Oxide 7% Titanium Oxide 3% Aluminum Oxide 3%
9.4 Results and Discussion
Figures 9.2 show the variation of ablation depth with laser fluence for different
number of pulses in air. The data is obtained using MicroXAM surface mapping profiler;
it is obtained by choosing an area on the hole or irradiated area. It can be seen that there
is a threshold value of laser fluence below which material removal by ablation does not
take place. However, for the borosilicate glass workmaterial, a hump is observed.
The threshold value is determined by the onset of crater formation on the borosilicate
glass workmaterial by laser ablation. This value is found to increase with decrease in the
number of pulses. For low fluence at 1.07 J/cm2, a hump with a height of 15nm is created
with a single pulse laser, constantly increasing with increasing of number of pulses, to a
maximum height of 25 nm at 1000 pulses
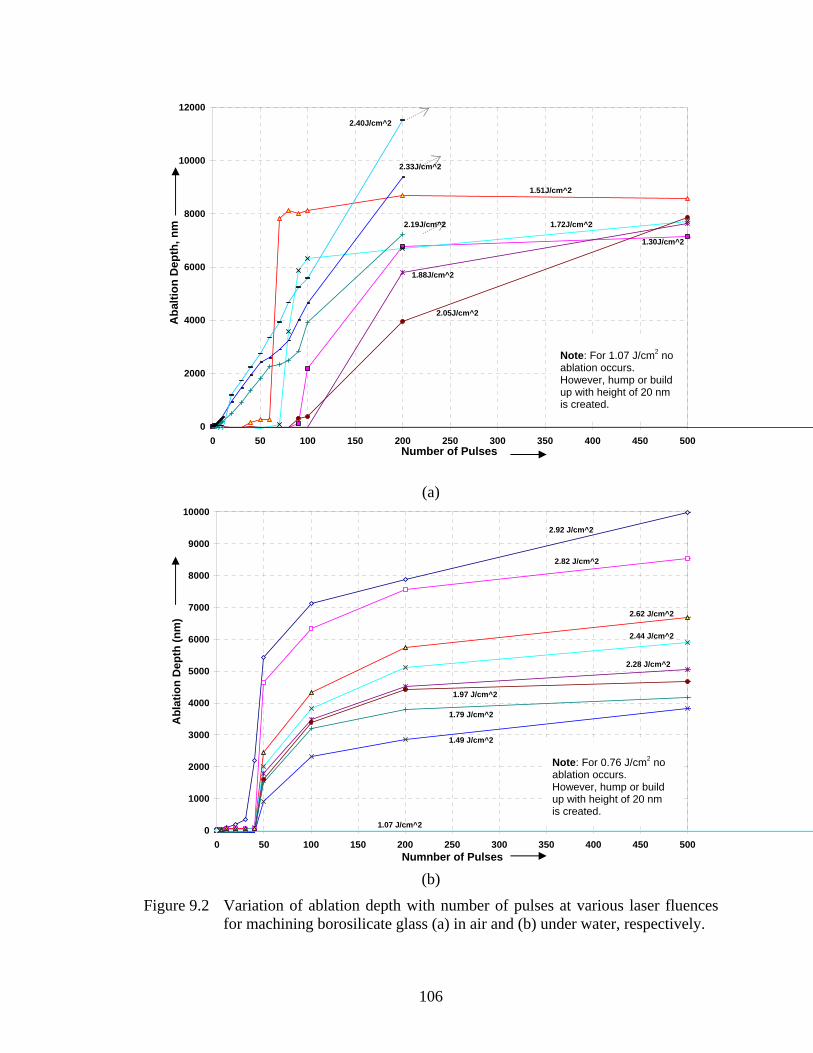
106
0
2000
4000
6000
8000
10000
12000
0 50 100 150 200 250 300 350 400 450 500Number of Pulses
Aba
ltion
Dep
th, n
m1.51J/cm^2
Note: For 1.07 J/cm^2 no ablation occur, however, hump or build up with hieght of 20nm is created.
1.30J/cm^2
1.72J/cm^2
1.88J/cm^2
2.05J/cm^2
2.19J/cm^2
2.33J/cm^2
2.40J/cm^2
(a)
0
1000
2000
3000
4000
5000
6000
7000
8000
9000
10000
0 50 100 150 200 250 300 350 400 450 500Numnber of Pulses
Abl
atio
n D
epth
(nm
)
2.92 J/cm^2
2.82 J/cm^2
2.62 J/cm^2
2.44 J/cm^2
2.28 J/cm^2
1.97 J/cm^2
1.79 J/cm^2
1.49 J/cm^2
1.07 J/cm^2
Note: For 0.76 J/cm^2 no ablation occur, however, hump or build up with hieght of 20nm is created.
(b)
Figure 9.2 Variation of ablation depth with number of pulses at various laser fluences for machining borosilicate glass (a) in air and (b) under water, respectively.
Note: For 1.07 J/cm2 no ablation occurs. However, hump or build up with height of 20 nm is created.
Note: For 0.76 J/cm2 no ablation occurs. However, hump or build up with height of 20 nm is created.
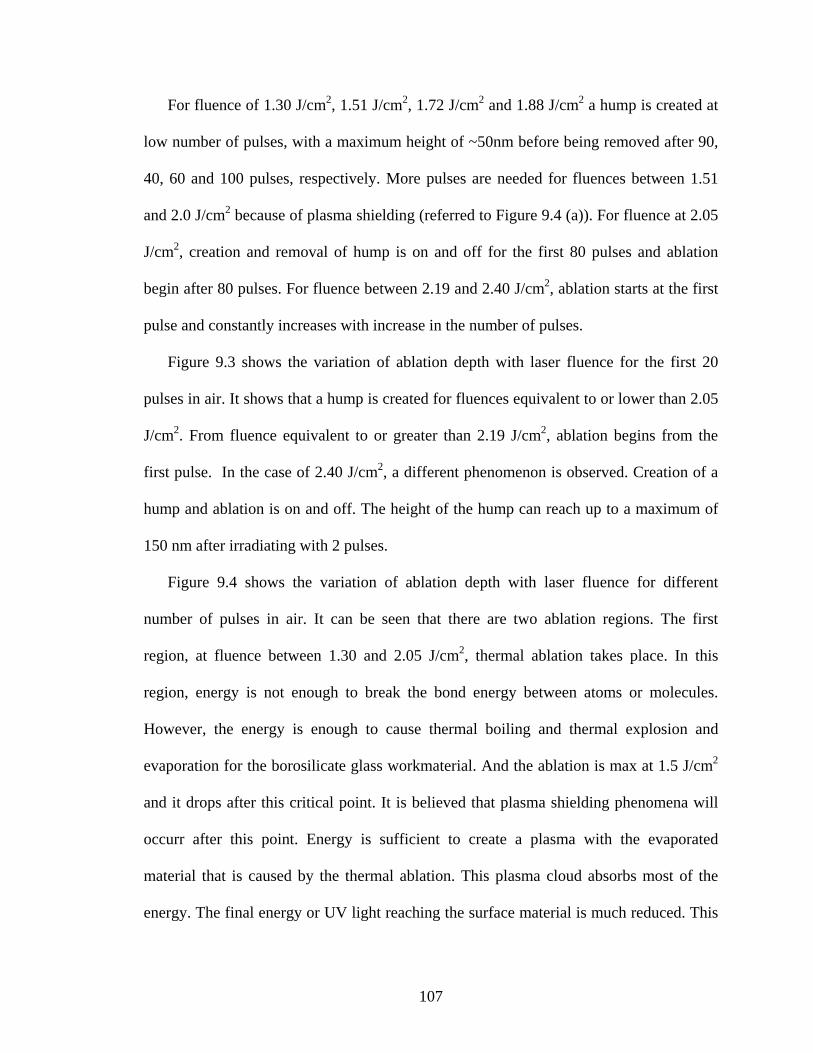
107
For fluence of 1.30 J/cm2, 1.51 J/cm2, 1.72 J/cm2 and 1.88 J/cm2 a hump is created at
low number of pulses, with a maximum height of ~50nm before being removed after 90,
40, 60 and 100 pulses, respectively. More pulses are needed for fluences between 1.51
and 2.0 J/cm2 because of plasma shielding (referred to Figure 9.4 (a)). For fluence at 2.05
J/cm2, creation and removal of hump is on and off for the first 80 pulses and ablation
begin after 80 pulses. For fluence between 2.19 and 2.40 J/cm2, ablation starts at the first
pulse and constantly increases with increase in the number of pulses.
Figure 9.3 shows the variation of ablation depth with laser fluence for the first 20
pulses in air. It shows that a hump is created for fluences equivalent to or lower than 2.05
J/cm2. From fluence equivalent to or greater than 2.19 J/cm2, ablation begins from the
first pulse. In the case of 2.40 J/cm2, a different phenomenon is observed. Creation of a
hump and ablation is on and off. The height of the hump can reach up to a maximum of
150 nm after irradiating with 2 pulses.
Figure 9.4 shows the variation of ablation depth with laser fluence for different
number of pulses in air. It can be seen that there are two ablation regions. The first
region, at fluence between 1.30 and 2.05 J/cm2, thermal ablation takes place. In this
region, energy is not enough to break the bond energy between atoms or molecules.
However, the energy is enough to cause thermal boiling and thermal explosion and
evaporation for the borosilicate glass workmaterial. And the ablation is max at 1.5 J/cm2
and it drops after this critical point. It is believed that plasma shielding phenomena will
occurr after this point. Energy is sufficient to create a plasma with the evaporated
material that is caused by the thermal ablation. This plasma cloud absorbs most of the
energy. The final energy or UV light reaching the surface material is much reduced. This
108
causes the ablation to decrease. At a fluence of 2.19 J/cm2, ablation is regained at this
point.
-200
0
200
400
600
800
1000
1200
1400
0 2 4 6 8 10 12 14 16 18 20Number of Pulses
Abl
atio
n D
epth
, nm
2.33J/cm^2
2.40J/cm^2
2.19J/cm^2
(a)
-60
-40
-20
0
20
40
60
80
100
0 2 4 6 8 10 12 14 16 18 20
Numnber of Pulses
Abl
atio
n D
epth
(nm
)
2.92 J/cm^2
2.82 J/cm^2
2.62 J/cm^2
2.44 J/cm^2
2.28 J/cm^2
1.97 J/cm^2
1.79 J/cm^2
1.49 J/cm^2
1.07 J/cm^2
0.76 J/cm^2
(b)
Figure 9.3 Variation of ablation depth with number of pulses at various laser fluences for machining borosilicate glass (a) in air and (b) under water, respectively.
-50
-45
-40
-35
-30
-25
-20
-15
-10
-5
0
0 1 2 3 4 5 6 7 8 9 10
2.40J/cm^2
1.07J/cm^2
1.30J/cm^2
1.51J/cm^2
1.72J/cm^21.88J/cm^2
2.05J/cm^2
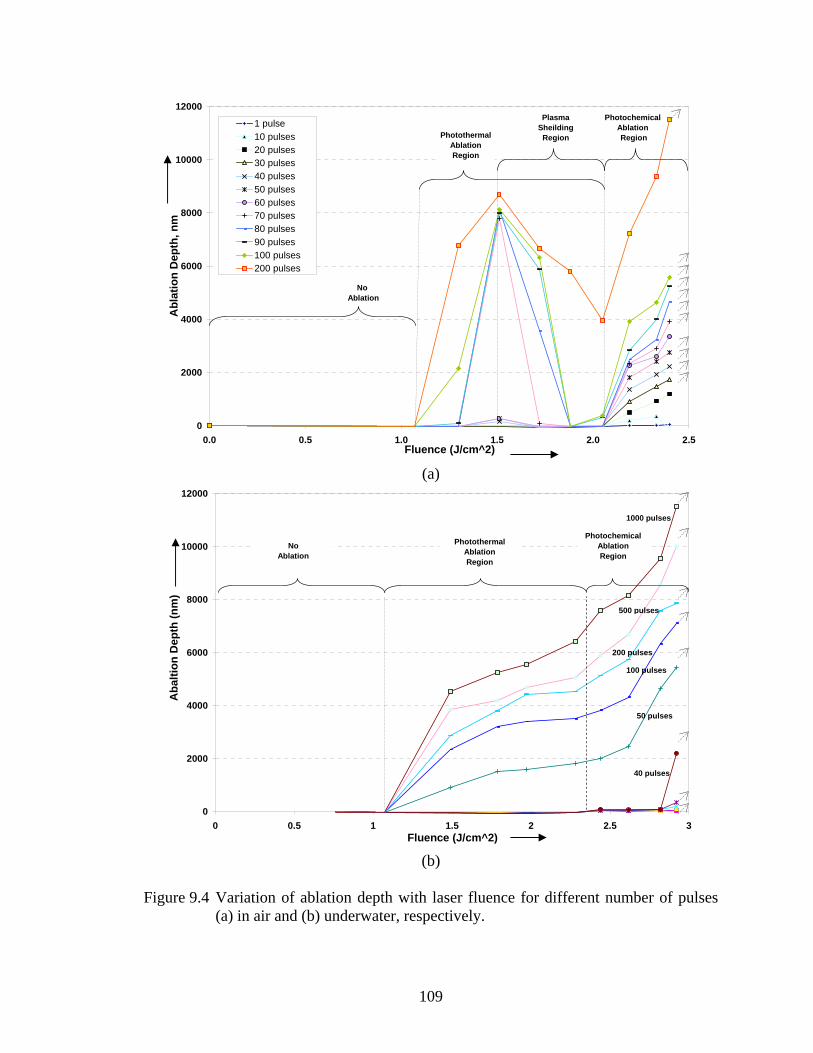
109
0
2000
4000
6000
8000
10000
12000
0.0 0.5 1.0 1.5 2.0 2.5Fluence (J/cm^2)
Abl
atio
n D
epth
, nm
1 pulse10 pulses20 pulses30 pulses40 pulses50 pulses60 pulses70 pulses80 pulses90 pulses100 pulses200 pulses
Photothermal Ablation Region
PlasmaSheilding
Region
Photochemical Ablation Region
No Ablation
(a)
0
2000
4000
6000
8000
10000
12000
0 0.5 1 1.5 2 2.5 3Fluence (J/cm^2)
Aba
ltion
Dep
th (n
m)
1000 pulses
500 pulses
200 pulses
100 pulses
50 pulses
40 pulses
PhotothermalAblationRegion
PhotochemicalAblationRegion
NoAblation
(b)
Figure 9.4 Variation of ablation depth with laser fluence for different number of pulses
(a) in air and (b) underwater, respectively.
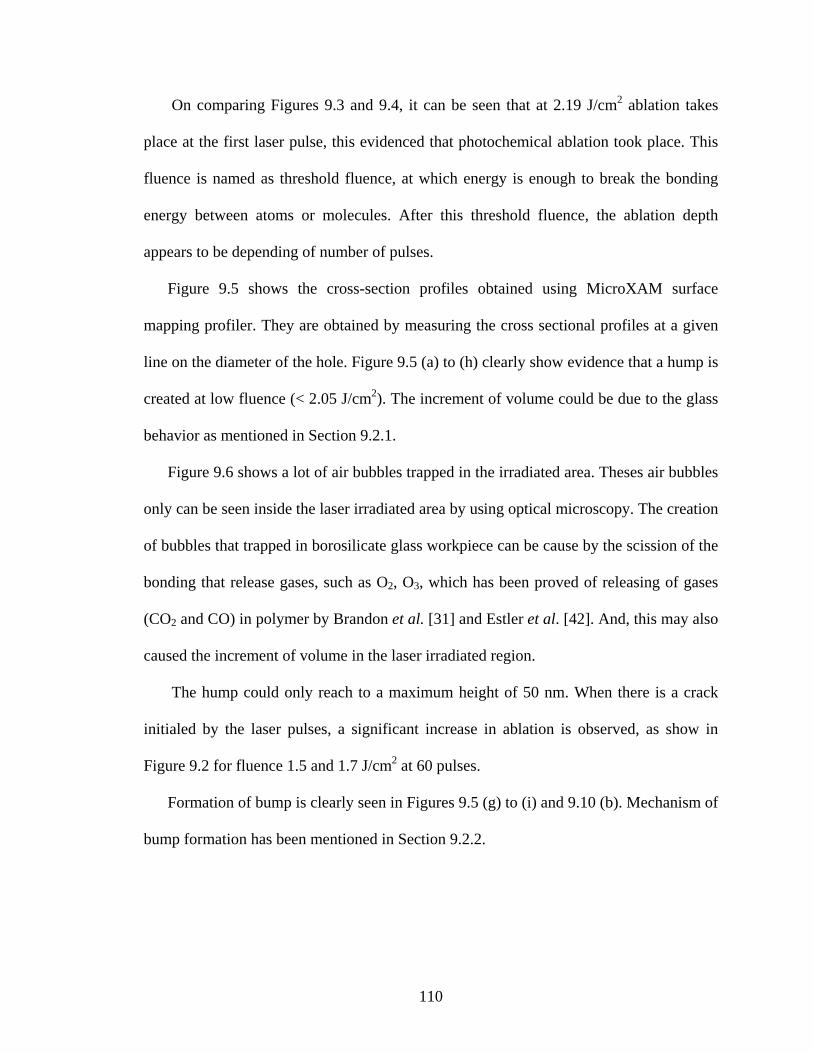
110
On comparing Figures 9.3 and 9.4, it can be seen that at 2.19 J/cm2 ablation takes
place at the first laser pulse, this evidenced that photochemical ablation took place. This
fluence is named as threshold fluence, at which energy is enough to break the bonding
energy between atoms or molecules. After this threshold fluence, the ablation depth
appears to be depending of number of pulses.
Figure 9.5 shows the cross-section profiles obtained using MicroXAM surface
mapping profiler. They are obtained by measuring the cross sectional profiles at a given
line on the diameter of the hole. Figure 9.5 (a) to (h) clearly show evidence that a hump is
created at low fluence (< 2.05 J/cm2). The increment of volume could be due to the glass
behavior as mentioned in Section 9.2.1.
Figure 9.6 shows a lot of air bubbles trapped in the irradiated area. Theses air bubbles
only can be seen inside the laser irradiated area by using optical microscopy. The creation
of bubbles that trapped in borosilicate glass workpiece can be cause by the scission of the
bonding that release gases, such as O2, O3, which has been proved of releasing of gases
(CO2 and CO) in polymer by Brandon et al. [31] and Estler et al. [42]. And, this may also
caused the increment of volume in the laser irradiated region.
The hump could only reach to a maximum height of 50 nm. When there is a crack
initialed by the laser pulses, a significant increase in ablation is observed, as show in
Figure 9.2 for fluence 1.5 and 1.7 J/cm2 at 60 pulses.
Formation of bump is clearly seen in Figures 9.5 (g) to (i) and 9.10 (b). Mechanism of
bump formation has been mentioned in Section 9.2.2.
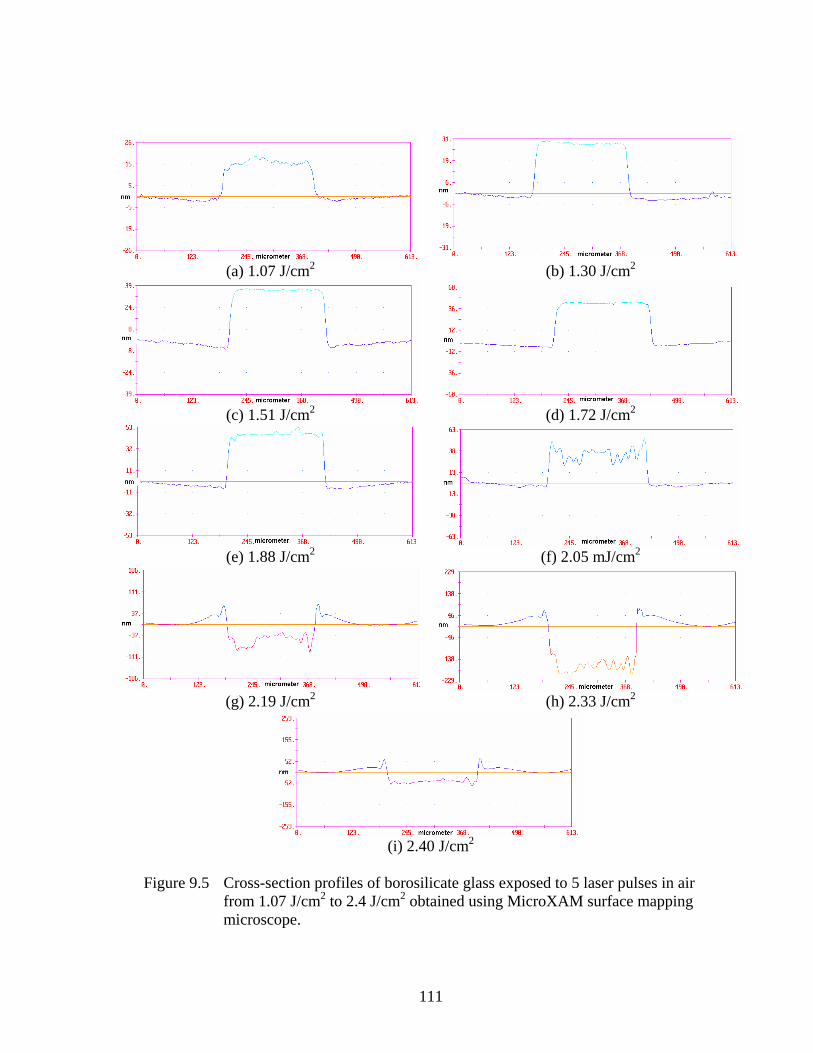
111
(a) 1.07 J/cm2 (b) 1.30 J/cm2
(c) 1.51 J/cm2 (d) 1.72 J/cm2
(e) 1.88 J/cm2 (f) 2.05 mJ/cm2
(g) 2.19 J/cm2 (h) 2.33 J/cm2
(i) 2.40 J/cm2
Figure 9.5 Cross-section profiles of borosilicate glass exposed to 5 laser pulses in air
from 1.07 J/cm2 to 2.4 J/cm2 obtained using MicroXAM surface mapping microscope.
112
Figure 9.6 Optical micrographs of the top view of borosilicate glass workpieces ablated at 1.30 J/cm2 for 1000 pulses under water.
Figures 9.7 (a) and (b) show optical micrographs of the top view of borosilicate glass
workpieces ablated at a fluence of 2.55 J/cm2 and at different number of pulses from 10
to 5000 in air and under water. Two important differences between machining in air and
under water can be seen. The first one is the absence of thermal damage in the case of
underwater machining from 10 pulses to all the way up to 5000 pulses while significant
thermal damage is present in the case of machining in air as shown in Figure 9.7. It is for
this very reason that underwater machining is preferred. The second one is the nature of
the material removal in the two cases. While ablated surface showed less cracking in the
case of machining in air, and more cracking in the case of underwater machining. It is
believed that high pressures and high temperatures associated with laser driven intense
shockwaves are initially responsible for cracking. In the case of underwater machining,
water immerged through the cracks and thermal expansion causes more cracking. It is
interesting to note that the crack do no proceed beyond the laser irradiated area in both
underwater and in air machining.
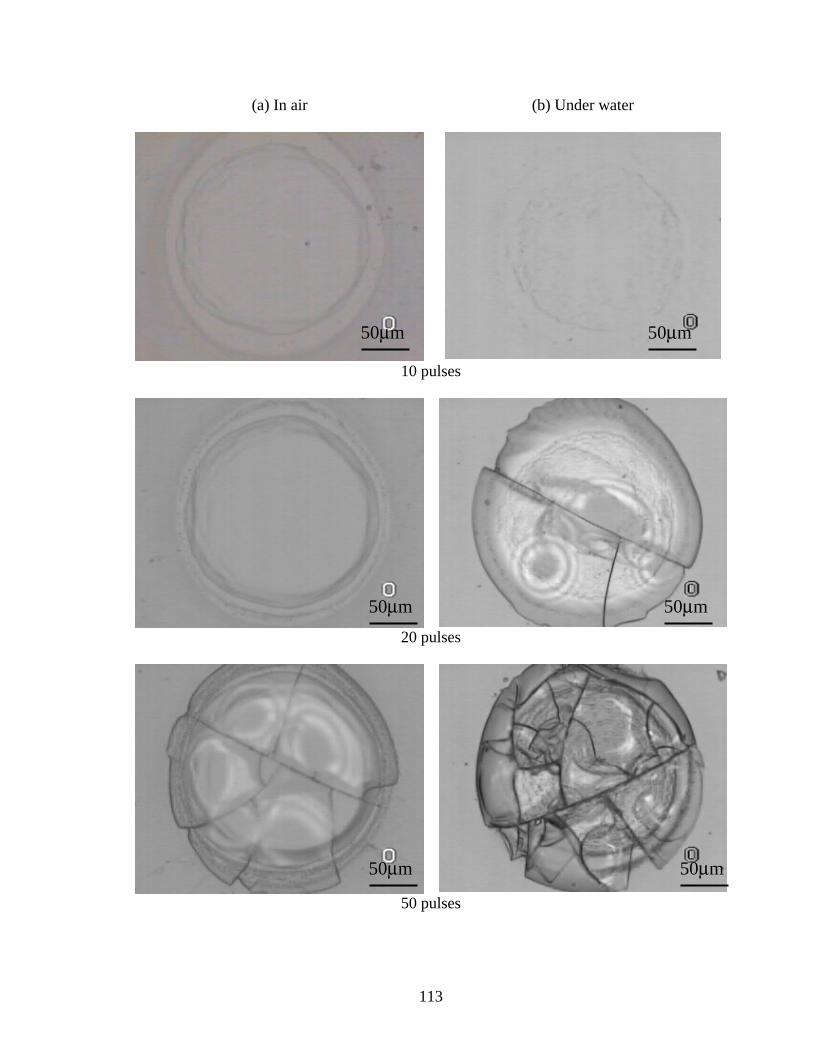
113
(a) In air (b) Under water
10 pulses
20 pulses
50 pulses
50µm 50µm
50µm 50µm
50µm 50µm
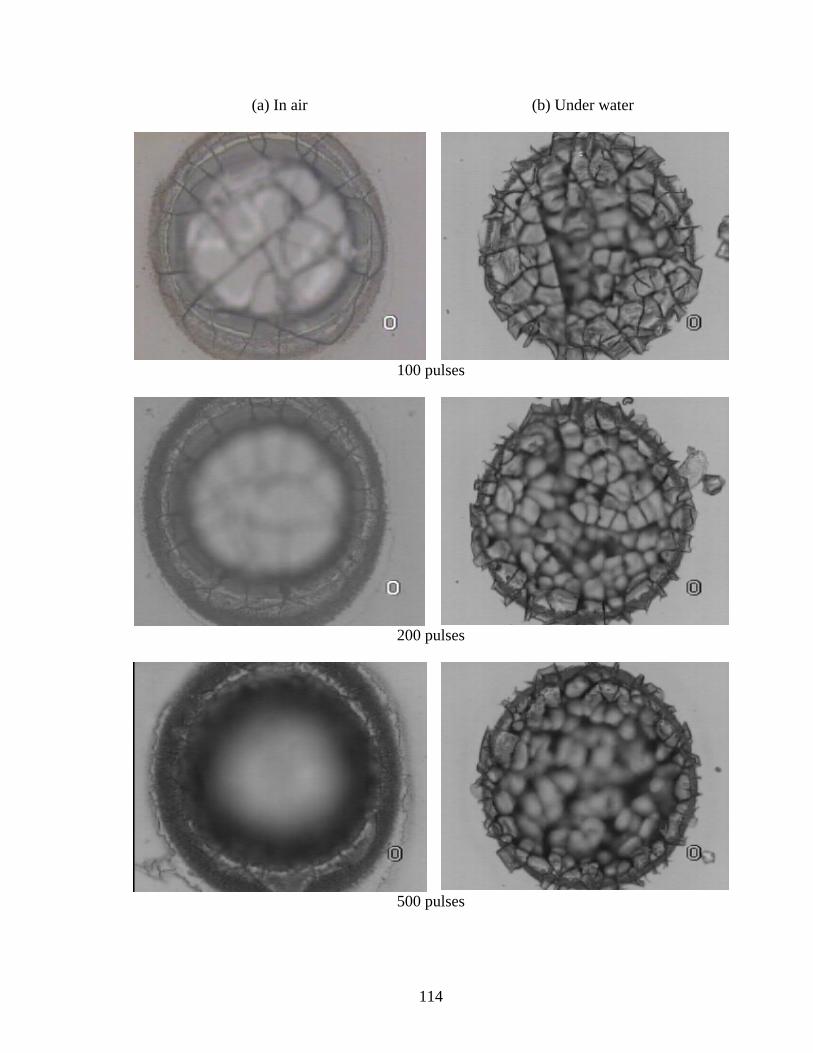
114
(a) In air (b) Under water
100 pulses
200 pulses
500 pulses
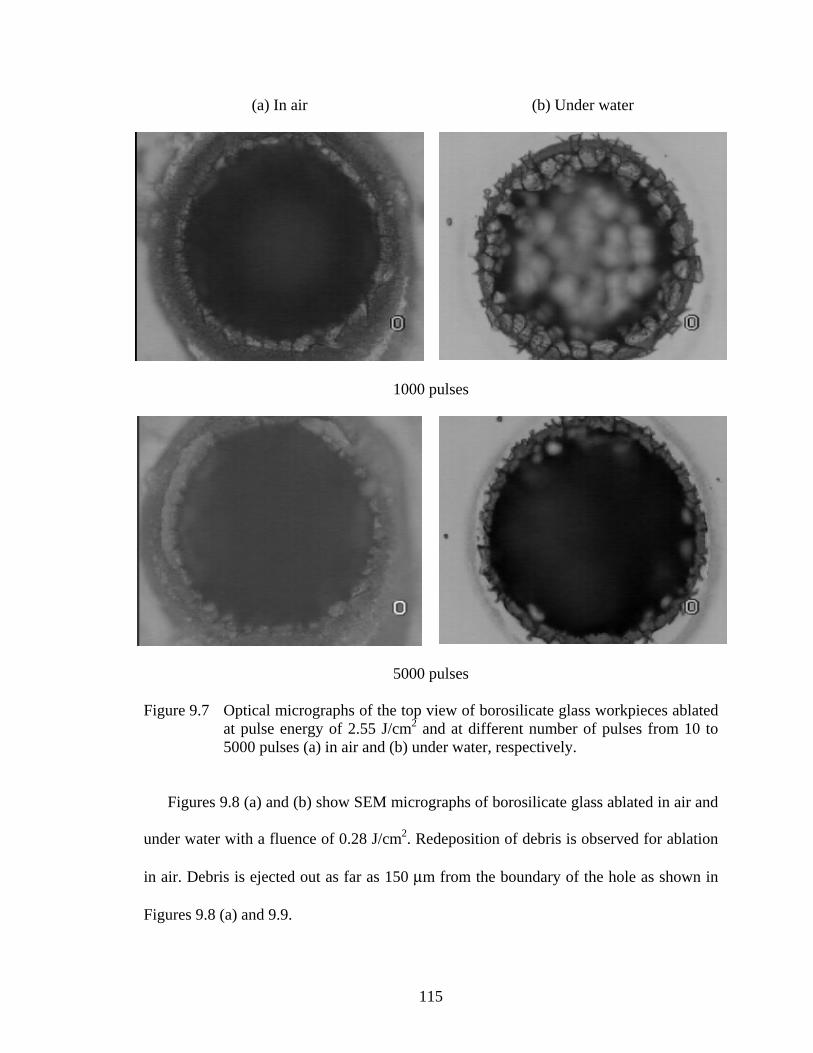
115
(a) In air (b) Under water
1000 pulses
5000 pulses
Figure 9.7 Optical micrographs of the top view of borosilicate glass workpieces ablated at pulse energy of 2.55 J/cm2 and at different number of pulses from 10 to 5000 pulses (a) in air and (b) under water, respectively.
Figures 9.8 (a) and (b) show SEM micrographs of borosilicate glass ablated in air and
under water with a fluence of 0.28 J/cm2. Redeposition of debris is observed for ablation
in air. Debris is ejected out as far as 150 µm from the boundary of the hole as shown in
Figures 9.8 (a) and 9.9.
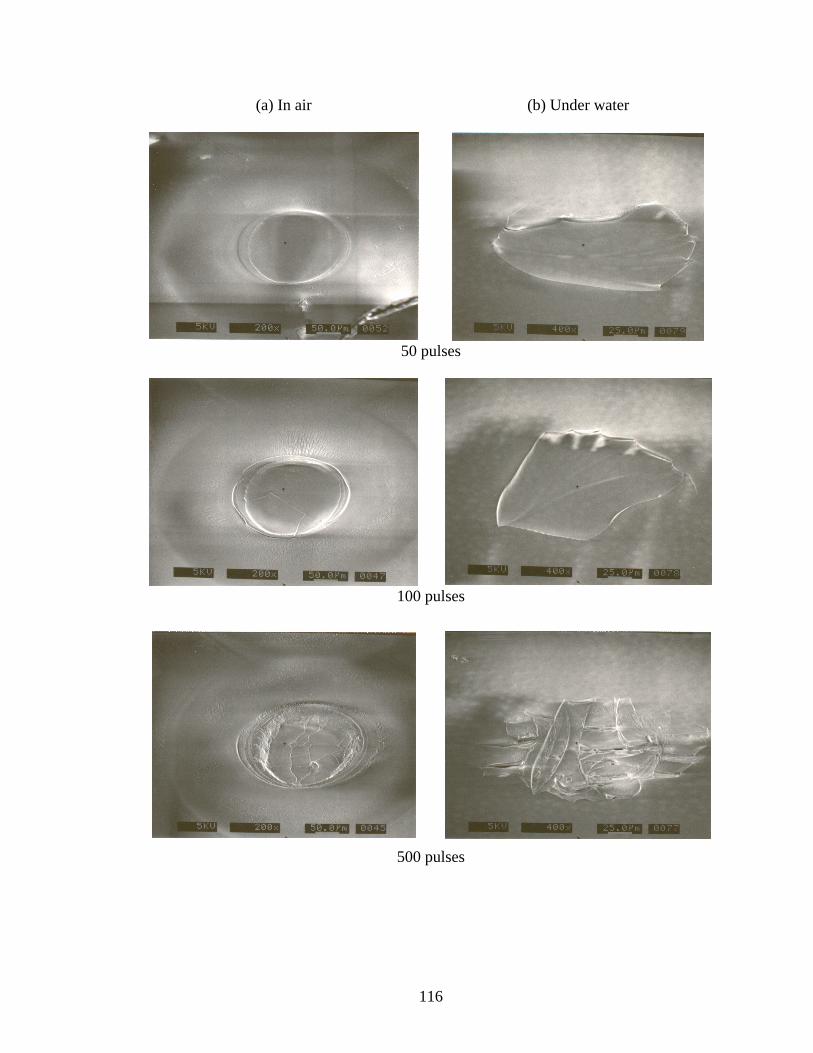
116
(a) In air (b) Under water
50 pulses
100 pulses
500 pulses

117
(a) In air (b) Under water
1000 pulses
Figure 9.8 SEM micrographs of borosilicate glass irradiated with a fluence of 0.28 J/cm2 in air and under water respectively. Note: the scale in air is 50 µm and under water is 25 µm.
Figure 9.9 Optical micrographs of the top view of borosilicate glass workpiece ablated at 2.42 J/cm2 for 1000 pulses in air.
50 µm
10 µm
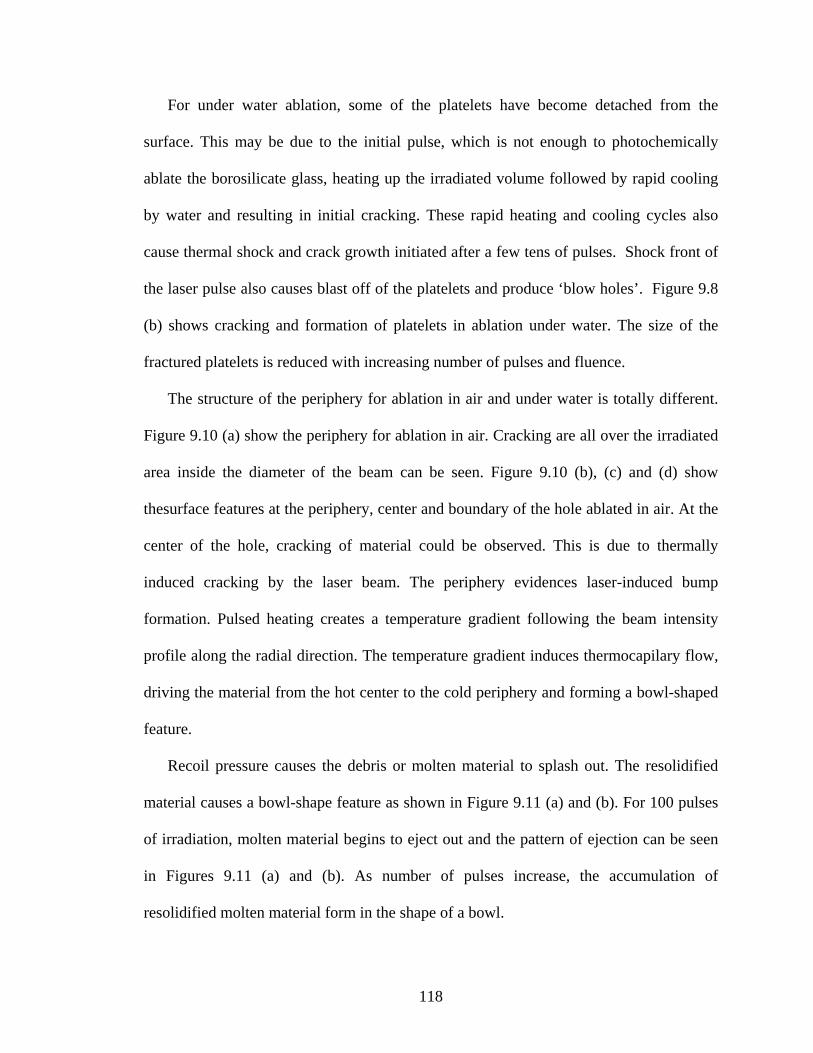
118
For under water ablation, some of the platelets have become detached from the
surface. This may be due to the initial pulse, which is not enough to photochemically
ablate the borosilicate glass, heating up the irradiated volume followed by rapid cooling
by water and resulting in initial cracking. These rapid heating and cooling cycles also
cause thermal shock and crack growth initiated after a few tens of pulses. Shock front of
the laser pulse also causes blast off of the platelets and produce ‘blow holes’. Figure 9.8
(b) shows cracking and formation of platelets in ablation under water. The size of the
fractured platelets is reduced with increasing number of pulses and fluence.
The structure of the periphery for ablation in air and under water is totally different.
Figure 9.10 (a) show the periphery for ablation in air. Cracking are all over the irradiated
area inside the diameter of the beam can be seen. Figure 9.10 (b), (c) and (d) show
thesurface features at the periphery, center and boundary of the hole ablated in air. At the
center of the hole, cracking of material could be observed. This is due to thermally
induced cracking by the laser beam. The periphery evidences laser-induced bump
formation. Pulsed heating creates a temperature gradient following the beam intensity
profile along the radial direction. The temperature gradient induces thermocapilary flow,
driving the material from the hot center to the cold periphery and forming a bowl-shaped
feature.
Recoil pressure causes the debris or molten material to splash out. The resolidified
material causes a bowl-shape feature as shown in Figure 9.11 (a) and (b). For 100 pulses
of irradiation, molten material begins to eject out and the pattern of ejection can be seen
in Figures 9.11 (a) and (b). As number of pulses increase, the accumulation of
resolidified molten material form in the shape of a bowl.
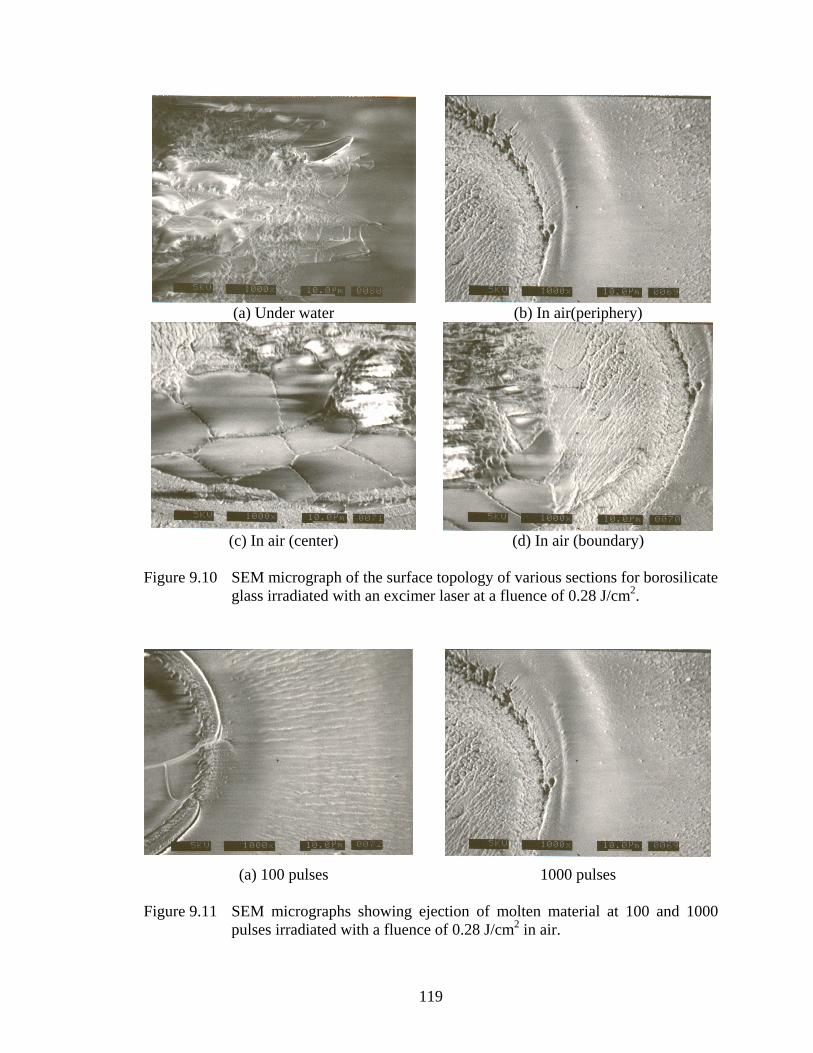
119
(a) Under water (b) In air(periphery)
(c) In air (center)
(d) In air (boundary)
Figure 9.10 SEM micrograph of the surface topology of various sections for borosilicate glass irradiated with an excimer laser at a fluence of 0.28 J/cm2.
(a) 100 pulses 1000 pulses
Figure 9.11 SEM micrographs showing ejection of molten material at 100 and 1000 pulses irradiated with a fluence of 0.28 J/cm2 in air.
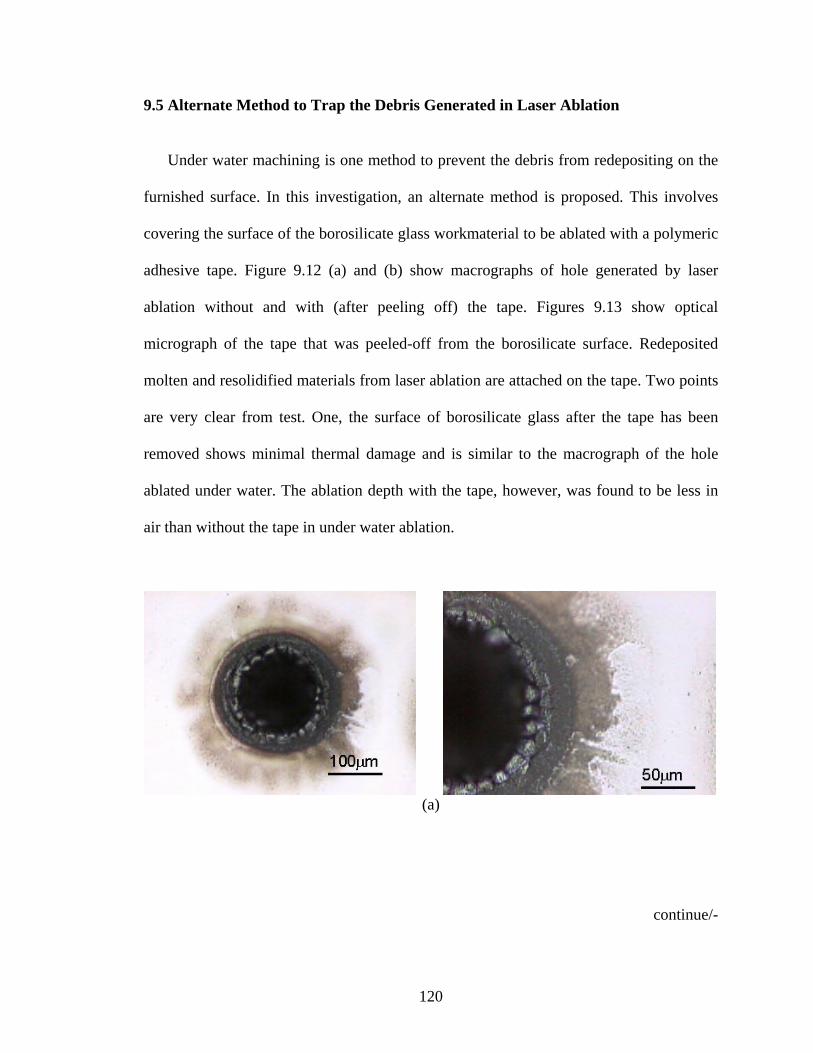
120
9.5 Alternate Method to Trap the Debris Generated in Laser Ablation
Under water machining is one method to prevent the debris from redepositing on the
furnished surface. In this investigation, an alternate method is proposed. This involves
covering the surface of the borosilicate glass workmaterial to be ablated with a polymeric
adhesive tape. Figure 9.12 (a) and (b) show macrographs of hole generated by laser
ablation without and with (after peeling off) the tape. Figures 9.13 show optical
micrograph of the tape that was peeled-off from the borosilicate surface. Redeposited
molten and resolidified materials from laser ablation are attached on the tape. Two points
are very clear from test. One, the surface of borosilicate glass after the tape has been
removed shows minimal thermal damage and is similar to the macrograph of the hole
ablated under water. The ablation depth with the tape, however, was found to be less in
air than without the tape in under water ablation.
(a)
continue/-
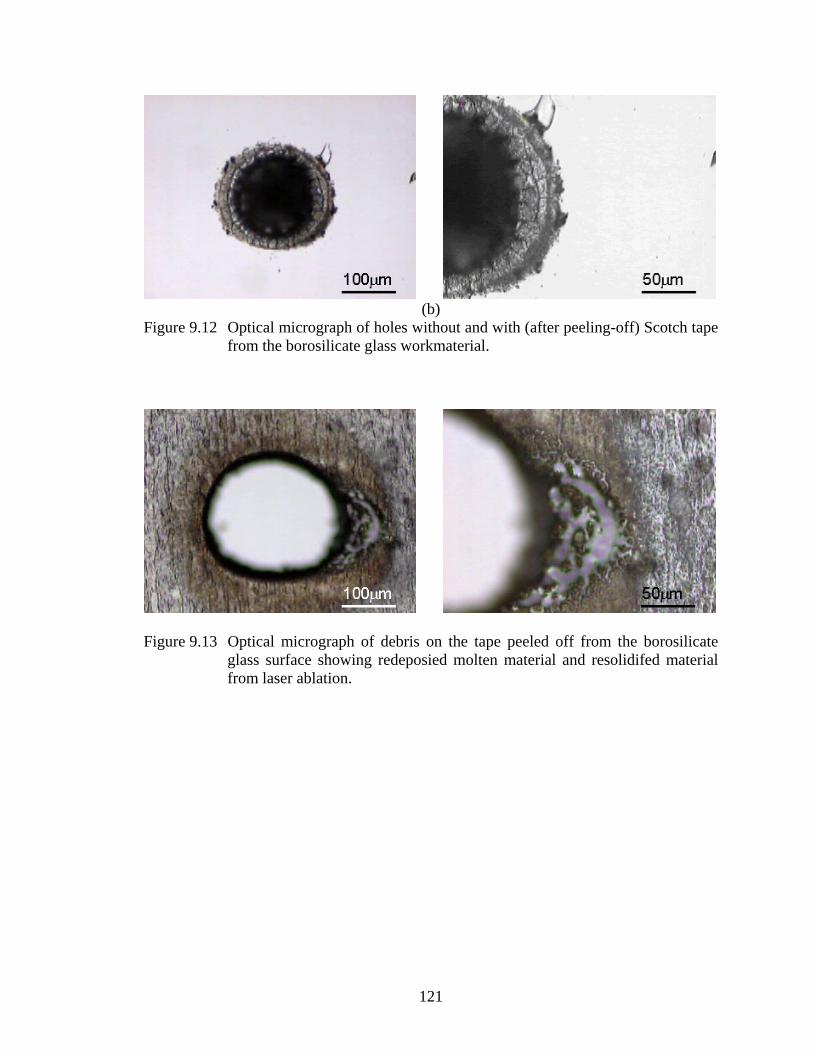
121
(b)
Figure 9.12 Optical micrograph of holes without and with (after peeling-off) Scotch tape from the borosilicate glass workmaterial.
Figure 9.13 Optical micrograph of debris on the tape peeled off from the borosilicate
glass surface showing redeposied molten material and resolidifed material from laser ablation.
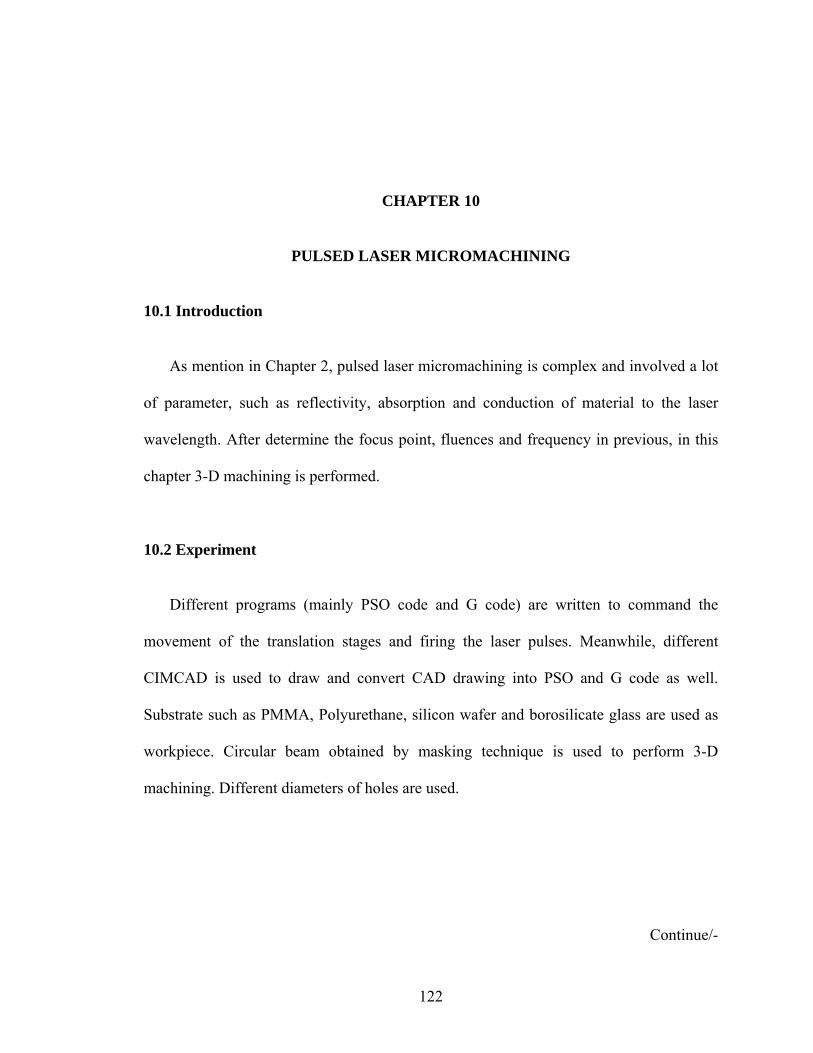
122
CHAPTER 10
PULSED LASER MICROMACHINING
10.1 Introduction
As mention in Chapter 2, pulsed laser micromachining is complex and involved a lot
of parameter, such as reflectivity, absorption and conduction of material to the laser
wavelength. After determine the focus point, fluences and frequency in previous, in this
chapter 3-D machining is performed.
10.2 Experiment
Different programs (mainly PSO code and G code) are written to command the
movement of the translation stages and firing the laser pulses. Meanwhile, different
CIMCAD is used to draw and convert CAD drawing into PSO and G code as well.
Substrate such as PMMA, Polyurethane, silicon wafer and borosilicate glass are used as
workpiece. Circular beam obtained by masking technique is used to perform 3-D
machining. Different diameters of holes are used.
Continue/-
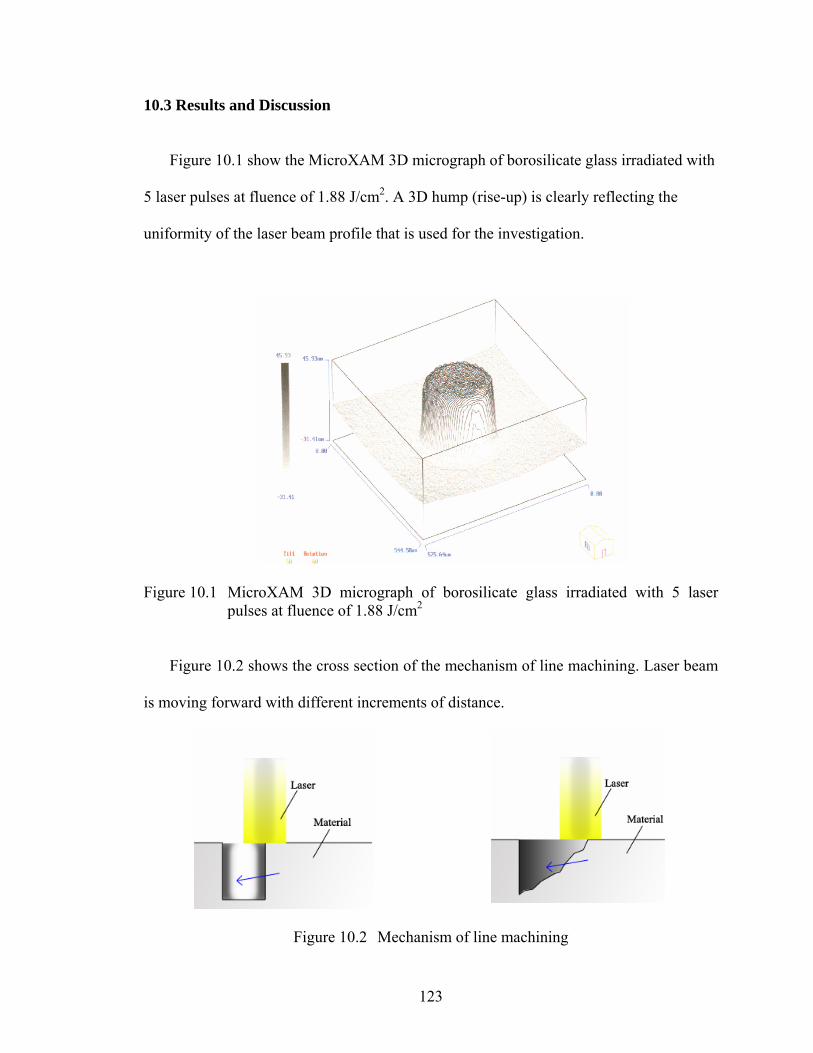
123
10.3 Results and Discussion
Figure 10.1 show the MicroXAM 3D micrograph of borosilicate glass irradiated with
5 laser pulses at fluence of 1.88 J/cm2. A 3D hump (rise-up) is clearly reflecting the
uniformity of the laser beam profile that is used for the investigation.
Figure 10.1 MicroXAM 3D micrograph of borosilicate glass irradiated with 5 laser pulses at fluence of 1.88 J/cm2
Figure 10.2 shows the cross section of the mechanism of line machining. Laser beam
is moving forward with different increments of distance.
Figure 10.2 Mechanism of line machining
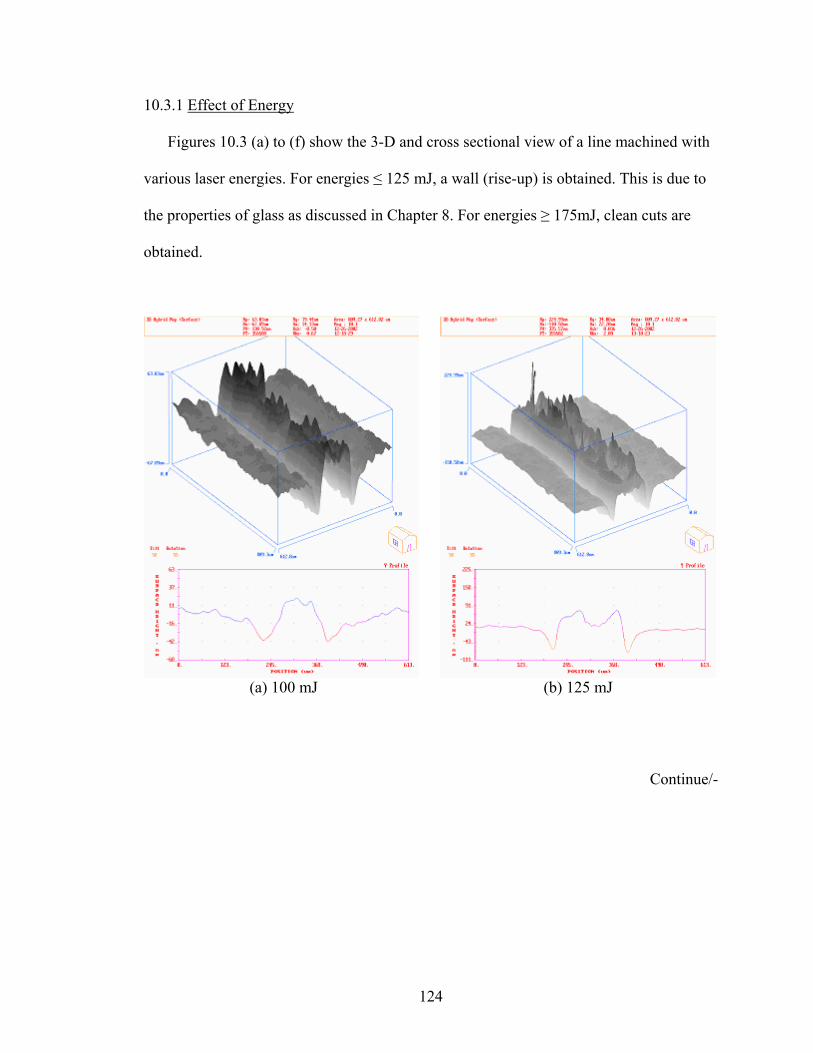
124
10.3.1 Effect of Energy
Figures 10.3 (a) to (f) show the 3-D and cross sectional view of a line machined with
various laser energies. For energies ≤ 125 mJ, a wall (rise-up) is obtained. This is due to
the properties of glass as discussed in Chapter 8. For energies ≥ 175mJ, clean cuts are
obtained.
(a) 100 mJ (b) 125 mJ
Continue/-
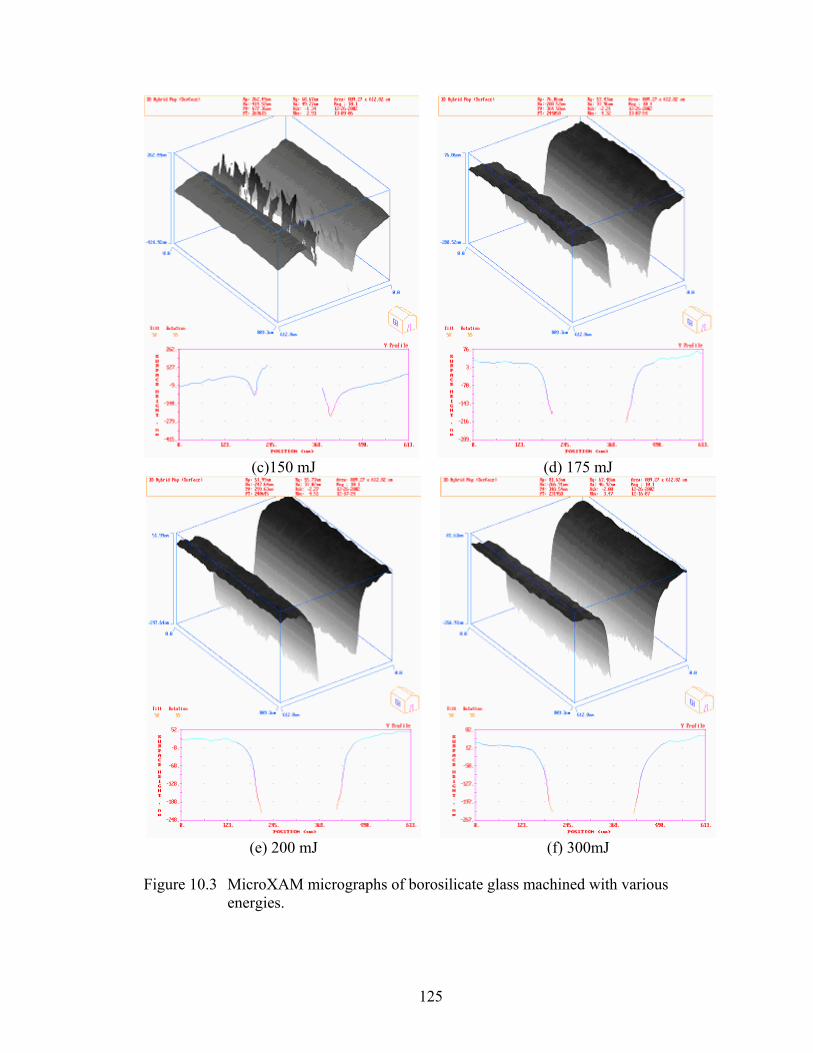
125
(c)150 mJ (d) 175 mJ
(e) 200 mJ (f) 300mJ
Figure 10.3 MicroXAM micrographs of borosilicate glass machined with various energies.
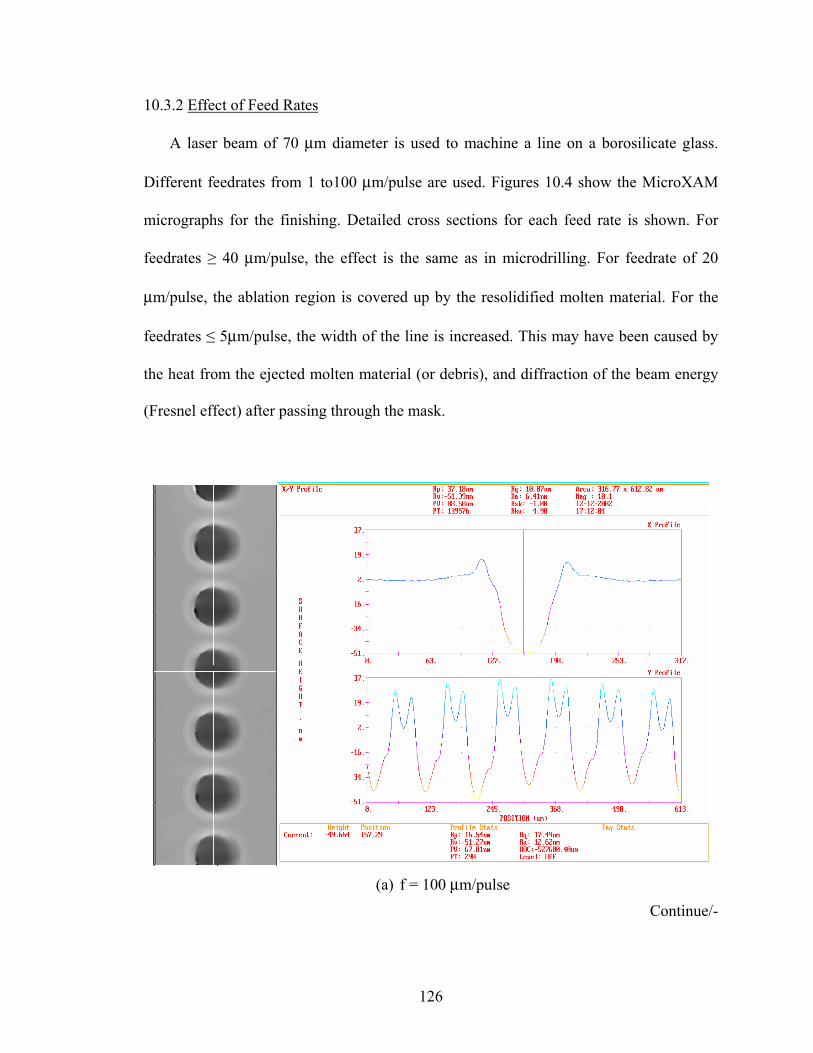
126
10.3.2 Effect of Feed Rates
A laser beam of 70 µm diameter is used to machine a line on a borosilicate glass.
Different feedrates from 1 to100 µm/pulse are used. Figures 10.4 show the MicroXAM
micrographs for the finishing. Detailed cross sections for each feed rate is shown. For
feedrates ≥ 40 µm/pulse, the effect is the same as in microdrilling. For feedrate of 20
µm/pulse, the ablation region is covered up by the resolidified molten material. For the
feedrates ≤ 5µm/pulse, the width of the line is increased. This may have been caused by
the heat from the ejected molten material (or debris), and diffraction of the beam energy
(Fresnel effect) after passing through the mask.
(a) f = 100 µm/pulse
Continue/-
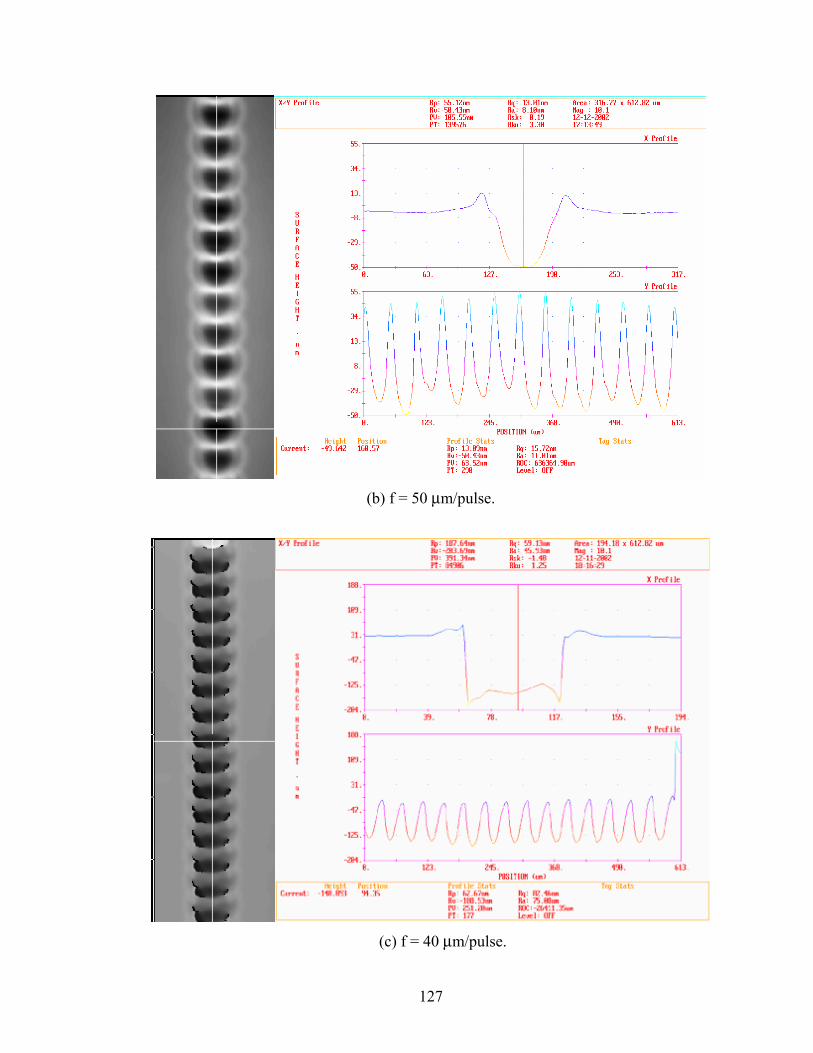
127
(b) f = 50 µm/pulse.
(c) f = 40 µm/pulse.
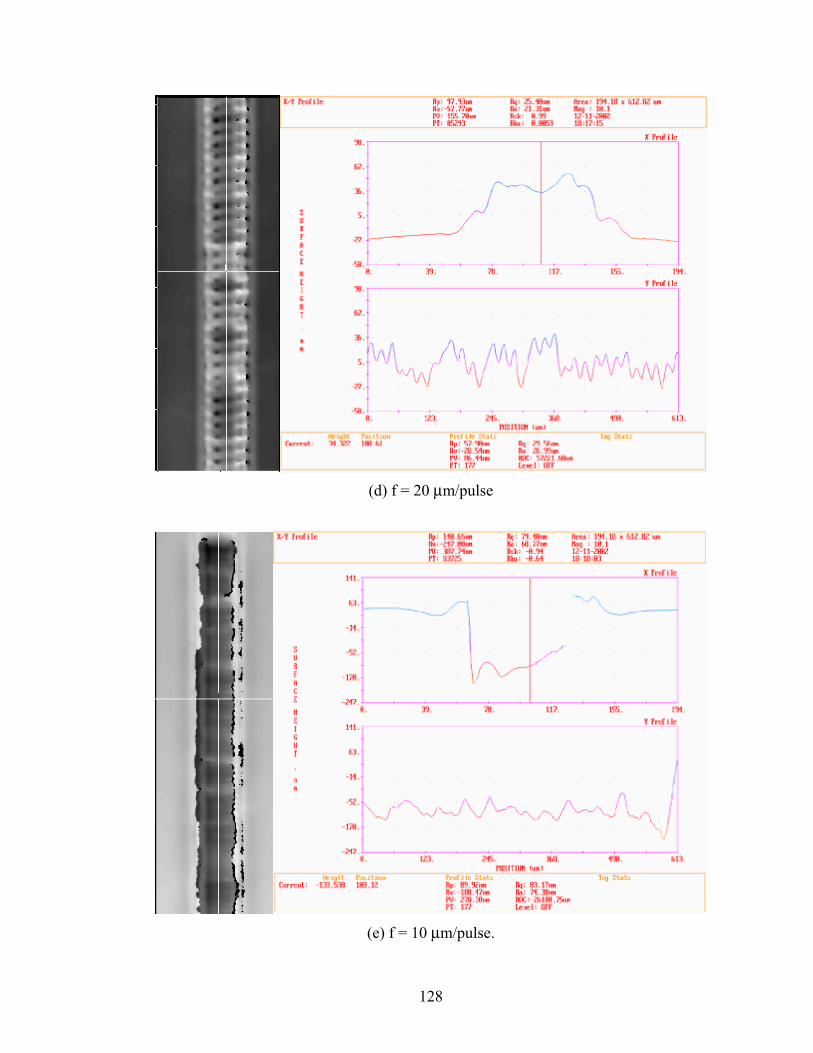
128
(d) f = 20 µm/pulse
(e) f = 10 µm/pulse.
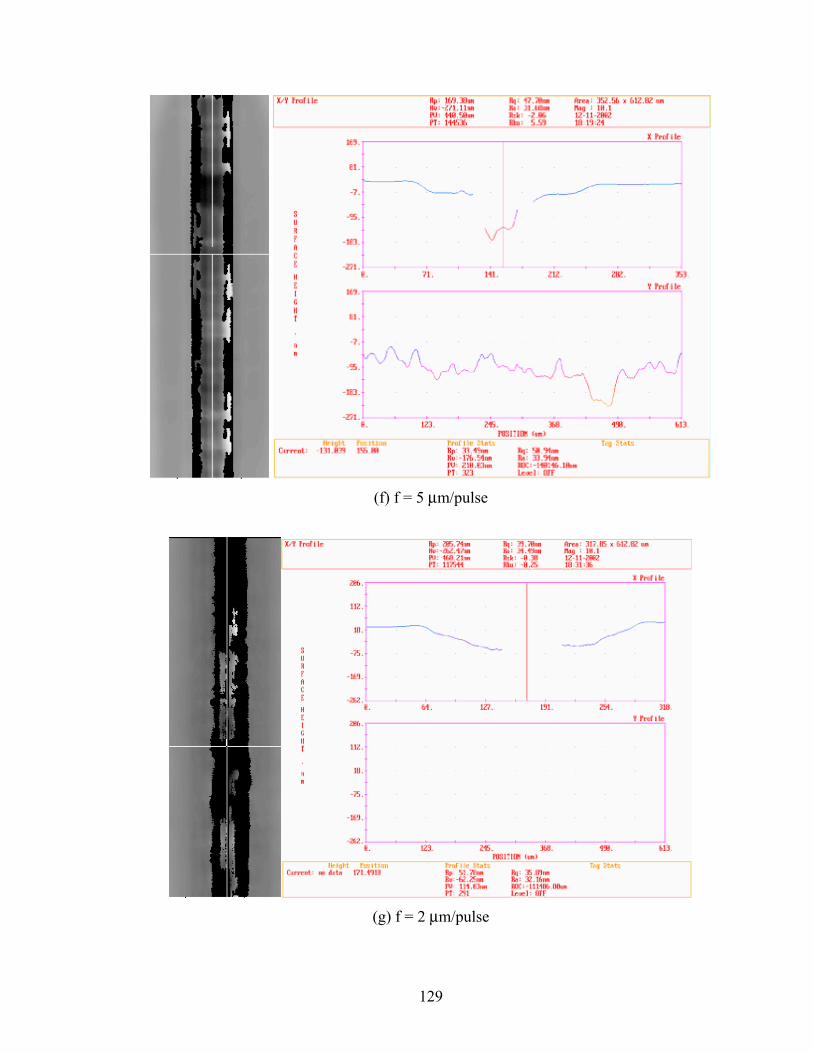
129
(f) f = 5 µm/pulse
(g) f = 2 µm/pulse
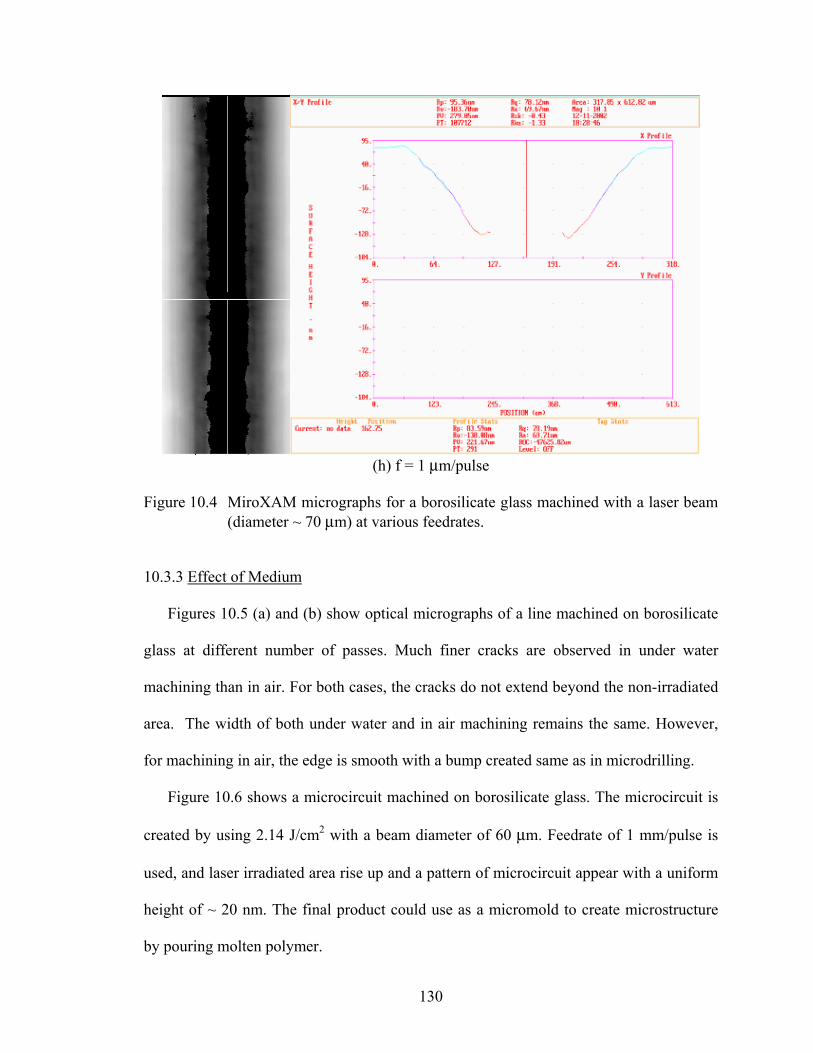
130
(h) f = 1 µm/pulse
Figure 10.4 MiroXAM micrographs for a borosilicate glass machined with a laser beam (diameter ~ 70 µm) at various feedrates.
10.3.3 Effect of Medium
Figures 10.5 (a) and (b) show optical micrographs of a line machined on borosilicate
glass at different number of passes. Much finer cracks are observed in under water
machining than in air. For both cases, the cracks do not extend beyond the non-irradiated
area. The width of both under water and in air machining remains the same. However,
for machining in air, the edge is smooth with a bump created same as in microdrilling.
Figure 10.6 shows a microcircuit machined on borosilicate glass. The microcircuit is
created by using 2.14 J/cm2 with a beam diameter of 60 µm. Feedrate of 1 mm/pulse is
used, and laser irradiated area rise up and a pattern of microcircuit appear with a uniform
height of ~ 20 nm. The final product could use as a micromold to create microstructure
by pouring molten polymer.
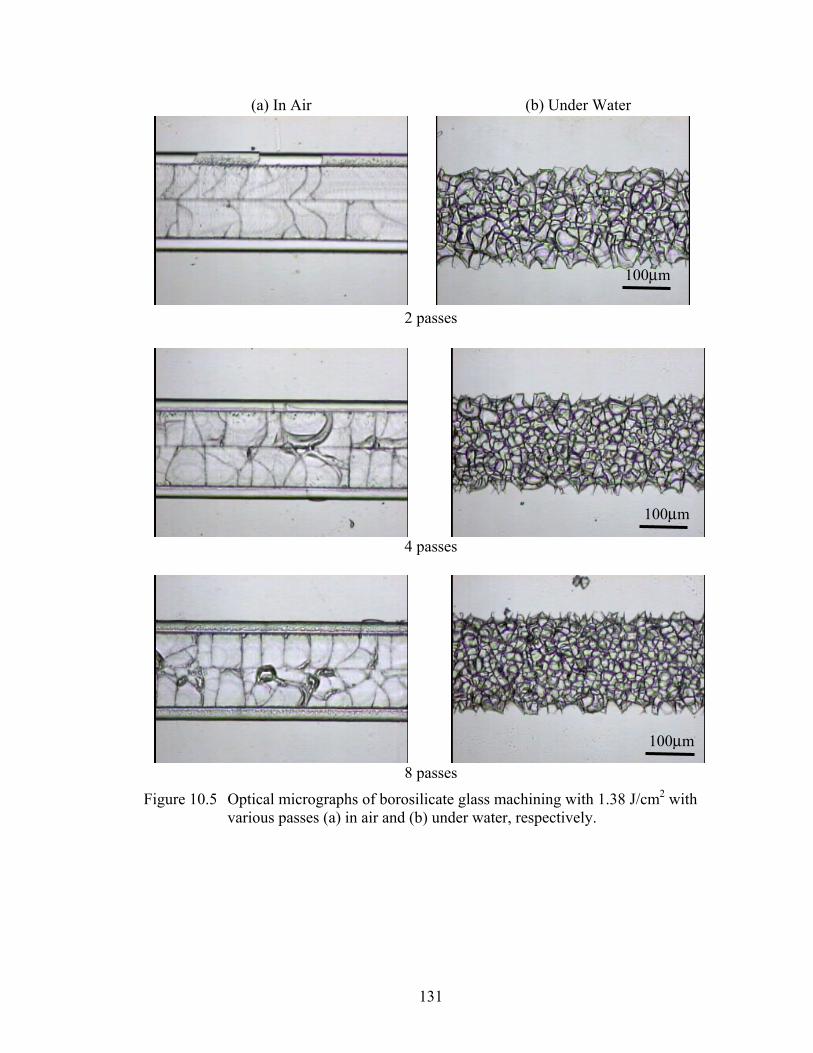
131
(a) In Air (b) Under Water
2 passes
4 passes
8 passes
Figure 10.5 Optical micrographs of borosilicate glass machining with 1.38 J/cm2 with various passes (a) in air and (b) under water, respectively.
100µm
100µm
100µm
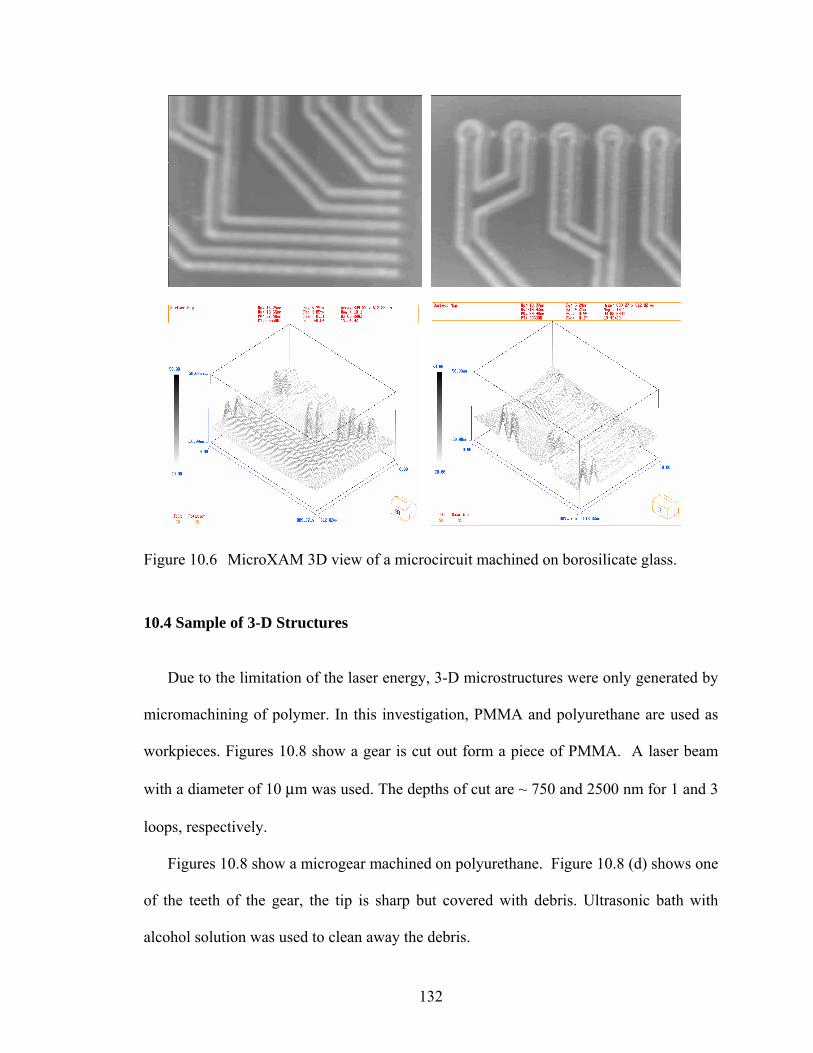
132
Figure 10.6 MicroXAM 3D view of a microcircuit machined on borosilicate glass.
10.4 Sample of 3-D Structures
Due to the limitation of the laser energy, 3-D microstructures were only generated by
micromachining of polymer. In this investigation, PMMA and polyurethane are used as
workpieces. Figures 10.8 show a gear is cut out form a piece of PMMA. A laser beam
with a diameter of 10 µm was used. The depths of cut are ~ 750 and 2500 nm for 1 and 3
loops, respectively.
Figures 10.8 show a microgear machined on polyurethane. Figure 10.8 (d) shows one
of the teeth of the gear, the tip is sharp but covered with debris. Ultrasonic bath with
alcohol solution was used to clean away the debris.
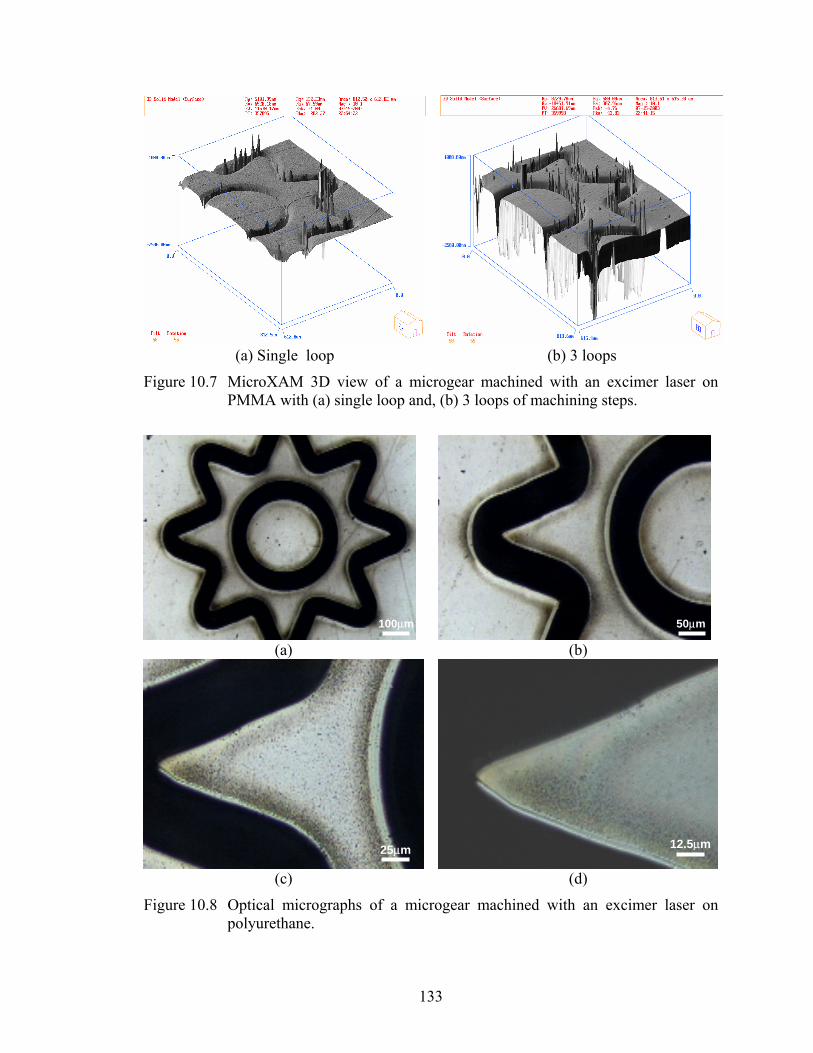
133
(a) Single loop (b) 3 loops
Figure 10.7 MicroXAM 3D view of a microgear machined with an excimer laser on PMMA with (a) single loop and, (b) 3 loops of machining steps.
(a) (b)
(c) (d)
Figure 10.8 Optical micrographs of a microgear machined with an excimer laser on polyurethane.
100µm 50µm
25µm 12.5µm

134
CHAPTER 11
SUMMARY AND CONCLUSIONS
11.1 PMMA
Photochemical ablation is the main mechanism in the case of excimer laser
machining for wavelength of 248 nm or less. The finishing features of the hole are
influenced by the focal point. When the focal point falls above the surface of the
substrate, a large oval shape hole is obtained; at focal point, a prefect round hole is
obtained (same as the mask used). Focus point of the laser facility setup is obtained by
observing the depth of ablation, which is around ± 0.05 mm.
Ablation rate reduces with increase in the number of pulses due to wall effect, and
redeposited material that cause Fresnel effect.
The large production of droplets during the ablation process can be best explained by
the capillary wave instability of the molten material. The instability itself seems to be
generated or enhanced by the irregular energy distribution within the focal spot. A rapidly
expanding plume generated by most intense part of the laser beam was identified as the
source for this force.
A secondary region, called ‘incubation’ region is also observed, which is due to laser
induced modification of the material. Both incubation region and redeposited material
can be easily removed by placing the sample in an ultrasonic isopropyl alcohol bath.
135
11.2 Microdrilling
Laser microdrilling of silicon and borosilicate glass workmaterial were carried out in
air and under water using a short pulse (25 ns), KrF (λ = 248 nm) excimer laser at various
laser energies from 100 mJ to 480 mJ and at different number of pulses from 1 to 5000.
The variation of ablation depth with laser fluence and number of pulses in air and under
water were determined. Figure 11.1 shows flow carts of phenomena for excimer laser
micromachining in air. Phenomena of excimer laser micromachining in air can be
summarized in the following steps:
STEP 1:
When pulsed laser is applied on a substrate, the laser could penetrate into the substrate for
a certain depth (d) which follows the equation:
α1)ln( ∗=
tffd
where
d is depth in µm
f is laser fluence in J/cm2
ft is threshold fluence in J/cm2
α is absorption coefficient of substrate in µm-1
Once the molecules of the workpiece in the irradiated area receive extra energy,
they start to vibrate. If the energy is equivalent or greater than the ablation fluence, it
follow STEP 2A; otherwise STEP 2B.
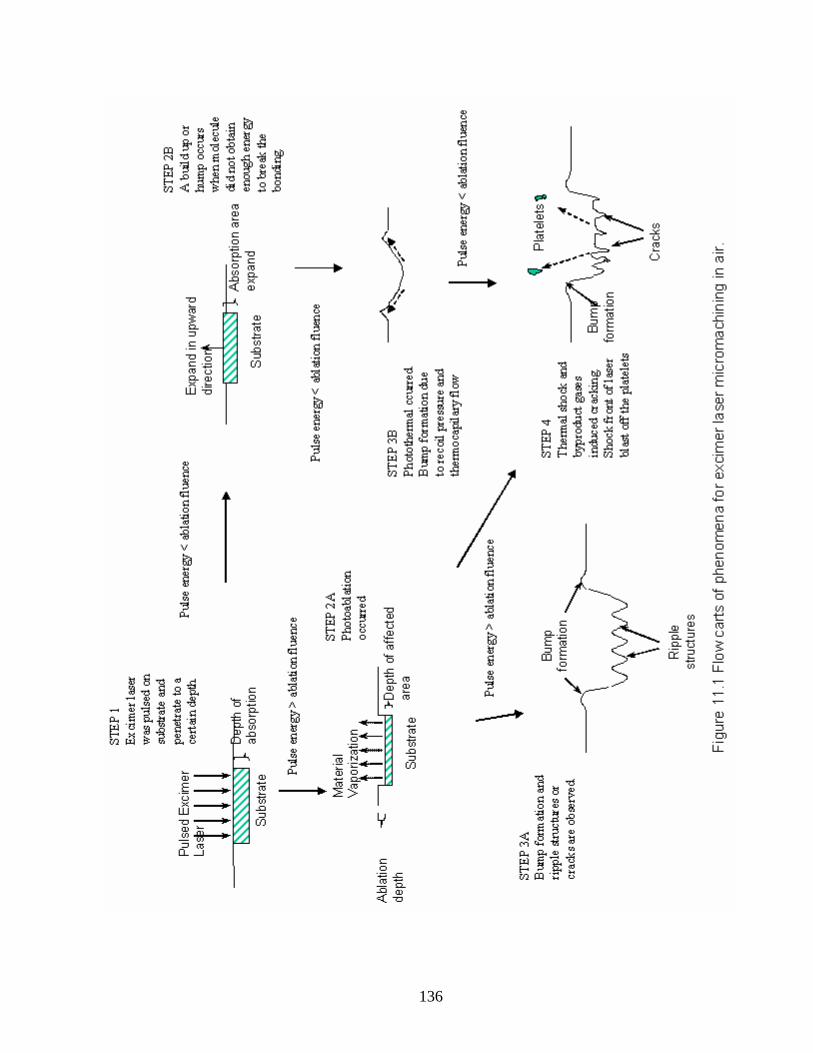
136
137
STEP 2 A:
The molecules in the irradiated area obtain enough energy to break the bonding,
vaporization occurs and an ablation depth is observed. The ablation depth is depended on
(1) laser fluence, (2) laser absorption coefficient of the workpiece, and (3) surface
roughness of the workpiece.
STEP 2 B:
If the affected area did not obtain enough energy to break down energy bonding,
incubation happens. Properties of material will be changed. For example, a build up or
hump can be observed in borosilicate glass and incubation show in PMMA. The
following pulses are irradaiated on the incubation region and less energy is needed. The
ablation will took place as stated in STEP 2A.
STEP 3A:
After the laser impact, ejected materials (or debris) with extremely high temperature
redeposited back onto the surface of the workpiece. Most of the heat of the debris was
conducted into the workpiece and caused thermal damage. Most reposited materials (or
debris) could be seen around the periphery of the ablated area. The travel distance for the
ablated material is highly depending on the laser fluence. The smallest the chromophores
created from the chain scissions (degradation) process, the lighter the weight it becomes
and can travels further. Accumulation of the resolidified molten material (or debris) at the
periphery form in a shape of a bowl.
At the very bottom of the laser and material interaction boundary, a melting pool is
created due to insufficient energy are given to break the bonding. The molten pool is
138
quenched from very high temperature to room temperature, Formation of ripple like
structures are found. The interval between the peaks of the ripple structures reduced with
increase of laser fluence. In the case of under water machining, the interval between of
the ripples is far shorter than in air machining because water rapidly cool down the
molten pool. It has been reported that the formation of ripple is cause by residual stress of
the melting pool.
STEP 3B:
Pulsed heating creates a temperature gradient following the beam intensity profile along
the radial direction. The temperature gradient induces thermocapilary flow, driving the
material from the center to the cold periphery and forming a bowl-shaped feature. Recoil
pressure also causes the molten material to splash out and formed a bowl-shaped feature.
Step 4
For borosilicate glass, cracking is observed due to the rapid cooling and heating cycles
cause thermal shock and the releasing of byproduct gases. Shock front of laser pulse also
cause blast off of the platelets and produce ‘blow hole.’ Cracks are only seen inside the
irradiated area.
Based on those studies, the following conclusions are reached.
Silicone Wafer
1. Significant differences in the nature of ablation and thermal damage were observed
between laser ablation in air and under water. They include absence of thermal damage in
the case of machining under water while significant thermal damage in the case of
machining in air. This thermal damage is found to increase with the number of pulses in
139
the case of machining in air. It is for this reason that underwater machining is preferred.
In addition, the nature of the material removal in the two cases are different. For example,
while the ablated surface is smooth in the case of machining in air, it is somewhat rough
in the case of underwater machining. The surface in the case of machining under water
shows the result of molten silicon rapidly solidified with a dendritic structure.
2. Once the laser fluence exceeds a certain threshold value (1.4 to 1.7 J/cm2)
depending on the number of pulses, the ablation depth was found to increase rapidly with
laser fluence with the variation being nonlinear. The influence of laser fluence on the
ablation depth is much more significant in the case of underwater machining than in air.
At lower fluence, the ablation depth is more in the case of machining in air than under
water. This difference is much less at higher laser fluences.
3. The presence of a liquid layer (in the present case water) on top of the silicon
workmaterial plays an important role in the mechanism of ablation. Water acts as a
cooling media and carries away the debris and eliminates the redeposition of molten
materials.
Borosilicate Glass
1. Significant differences in the nature of ablation and thermal damage were observed
between laser ablation in air and under water. They include absence of thermal damage in
the case of machining under water while significant thermal damage in the case of
machining in air. This thermal damage is found to increase with the number of pulses in
the case of machining in air. It is for this very reason that underwater machining is
preferred. In addition, the nature of the material removal in the two cases is different. For
140
example, while the ablated surface has longer cracks in the case of machining in air, there
were much more cracks in the case of underwater machining.
2. There are two ablation regions, photothermal and photochemical. In the
photothermal region, material is ablated by the accumulation of thermal energy causing
explosive boiling or evaporation. In between the transition to photochemical ablation,
plasma shielding phenomena is observed. UV irradiation is reduced and mainly absorbed
by the plasma cloud. In photochemical ablation region, ablation is mainly happen by
bond breaking between atoms or molecules. The critical point where photochemical
ablation starts it is called the ablation threshold fluence. This value is around 2.19 J/cm2.
3. The presence of a liquid layer (in the present case water) on top of the borosilicate
glass workmaterial plays an important role in the mechanism of ablation. Water acts as a
cooling media and carries away the debris and eliminates the redeposition of molten
material.
A simple, alternate method of collecting the debris generated in laser ablation and
prevention from material redepositing on the finished surface was considered. It involves
covering the surface of the workmaterial to be ablated with an adhesive polymer tape.
Results of the holes ablated before and after peeling off of the tape show, minimal
thermal damage similar to the hole ablated by excimer laser under water and absence of
redeposited molten and resolidified material from laser ablation. This material, in fact,
shows up on the tape film which can be discarded.
141
11.3 3-D Structuring
3-D structure is machined using a single laser (direct writing), the phenomena in both
air and under water are the same as microdrilling. Due to the limitation of pulse energy,
cut off of microstructuring only can be performed on polymers. Microstructures with
sharp edge up to 10 µm were manufactured.
Due to the properties of borosilicate glass, hump (rise up) structure is obtained with
low fluences. Microstructures with a uniform build up in nanometer scale are obtained.
This structure could be used as a micromold.
11.4 The Main Effects Limiting Quality of Laser Machining
In every real laser machining process, significant fraction of liquid phase remains at
the irradiated zone after the end of the laser pulse. Formation of a large amount of liquid
and its incomplete removal from the surface are adverse and hard-to-control phenomena
which cause a considerable decrease of efficiency and quality of laser micromachining.
The redistribution of the liquid prior to crystallization plays a decisive role in a final
shape formation. As a result of the redistribution, the surface shape to the end of
solidification can differ substantially from that determined by the beam geometry, the
vaporization kinetics, and the hydrodynamic rejection of part of the liquid-phase material
at the end of the laser pulse.
142
11.4.1 Main Reasons for Liquid Phase Increase
1. The decrease of the light flux density due to the gradual beam defocusing with the
hole-depth growth;
2. The slow power decrease at the pulse trailing edge contributes to the increase of the
volume of liquid-phase residue at the surface after the pulse;
3. Extra duration of action time: the longest is the action time, the greater is the melted
volume and, therefore, the greater is the hole size and cut width scatter. In addition, a
long action time cause the development of a zone of considerable size where
oxidation and structural changes occur, as well as the appearance of defects on the cut
surface as a result of the increase of the depth of heat-affected layer (incubation
region).
143
CHAPTER 12
FURTURE RECOMENDATIONS
In this investigation, the KrF excimer laser was installed and used in drilling and
some 3-D machining of PMMA, polyurethane, silicon wafer and borosilicate glass. Due
to the high energy limitation, a higher demagnification lens should be installed to obtain
smaller beam without wasting energy (masking technique is used). With this upgrade,
ceramics and metals with high ablation fluence could be machined and testing could be
conducted.
Different shape of masks could be used, for example, a triangle shape can use to
obtain a ‘V’ glove valley while machining a line. The same experiment could be
repeated and compared with using CO2 and Nd:YAG laser which are available in Dr.
Komanduri’s Research Laboratory.
Thermal modeling and MD simulation of laser drilling process can be conducted and
compared with the experimental results.
An ultrahigh-speed camera, could be installed to capture the image where material-
laser interactions take place, and it would contributed toward further understanding of the
laser-material interaction.
Etchant KOH and IPA could be used on the silicon wafer to observe the change of
surface finishing. It was proposed by Nilson et al. [81] that 3M KOH + 2 M IPA at 60˚C
for 6 minutes will reduce the (110) etch rate and surface roughness.
144
REFERENCES
1. Einstein, A., "Zur Quantentheorie der Strahlung" Physikalische Gesellschaft Zürich
Mitteilungen Nr. 16 (18) (1916) 47-62; an English translation appears in B.L. van der
Waerden, ed., “Sources of Quantum Mechanics,” North Holland, Amsterdam (1967).
2. Arthur L. Schawlow and Charles H. Townes, “Infrared and Optical Masers,” Physical
Review 112 (1958) 1940
3. Winburn, D.C., “What Every Engineer Should Know About Lasers,” Marcel Dekker,
Inc., New York (1987).
4. Hecht, J. and D. Teresi, “Laser, Supertool of the 1980’s,” Ticknor and Field, New
York (1982).
5. Hecht, J., “Understanding Laser,” Howard W. Sam & Company Hayden Books,
California (1990).
6. Chryssolouris, G.,“Laser Machining: Theory and Practice,” Springer –Verlag, New
York (1991).
7. Ready, J. F., “Lasers in Modern Industry,” Society of Manufacturing Engineering,
Dearborn, Michigan, (1979).
8. McGeough, J. A., “Advanced Methods of Machining,” Chapman and Hall, London
and New York (1988).
9. Waver, L. A., “Machining and Welding Applications,” Laser Applications Vol. 1,
Academic Press, New York and London (1971) 579-602.
145
10. Carlaw, H. S., and J. C. Jaeger, “Conduction of Heat in Solids,” 2nd edition, Oxford
University Press, Oxford (1959).
11. Ready, J. F. and D. F. Farson, “LIA Handbook of Laser Material Processing,” 1st
edition, Laser Institute of American (2001).
12. Philippe, B., C., William and Ali S., “Introduction to Micromachining Handbook,”
Version 2.2, Clark-MXR, Inc. (2001).
13. “The UNIDEX® 500 Motion Controller and Windows Sofftware Operation &
Technical Manual,” Version 1.2, Aerotech, Inc.
14. “The ATS 100 Series Position Stages Instruction Manual,” Version 1.0, Aerotech,
Inc.
15. Philipp, H. R., Cole, H. S., Liu, Y. S., and T. A. Sitnik, “Optical Absorption of Some
Polymers in the Region 240-170nm,” Appl. Phys. Lett. 48 (2) (1986) 192-194.
16. Srinivasan, R., and V. Mayne-Banton, “Self-Developing Photoetchining of
Poly(ethyleneterephthalate) Films by Far-Ultraviolet Excimer Laser Radiation,”
Appl. Phys. Letts. 41 (1982) 576-578.
17. Garrison, B. J and R. Srinivasan,” Laser Ablation of Organic Polymers: Microscopic
Models for Photochemical and Thermal Processes,” J. Appl. Phys. 57, (1985) 2909-
2914.
18. Srinivasan, R., and W. J. Leigh, “Ablative Photodecomposition: Action of Far-
Ultraviolet (193nm) Laser Radiation on Poly (ethylene terephathalate) Films,” J. Am.
Chem. Soc. 104 (1982) 6784-6785.
146
19. Srinivasan, R., Braren, B., Casey, K. G., and M. Yeh, “Ultrafast Imaging of
Ultraviolet Laser Ablation and Etching of Polymethylmethacrylate,” Appl. Phys. Lett.
55 (1989) 2790-2791.
20. Lauren, P., Sadrs, B., Decobert, F., Arefi, F., and J. Amouroux, “Modifications of
Polyether-Etherketone Surface after 193 nm and 248 nm Excimer Laser Radiation,”
Appl. Surf. Sci, 138-139 (1999) 93-96.
21. Feng, Y., Liu, Z. Q., and X.-S. Yi, “Co-occurrence of Photochemical and Thermal
Effects during Laser Polymer Ablation via a 248-nm Excimer Laser,” Appl. Surf. Sci.
156 (2000) 177-182.
22. Chen, Y. H., Zheng, H. Y., Wong, K. S., and S. C. Tam, “Excimer Laser Drilling of
Polymers,” Proceeding of SPIE – The International Society of Optical Engineering
3184 (1997) 202-210.
23. Dyer, P. E., and D. M. Karnakis, “High Quality ArF Laser Ablation of
Photoincubated Polymer,” Appl. Phys. Lett. 64 (1994) 1344-1346.
24. Braun, A., Zimmer, K., and F. Bigl, “The Influence of Ambient Temperature on KrF
Laser Ablation of Polyimide in Air,” Appl. Surf. Sci., 154-155 (2000) 73-77.
25. Srinivasan, R. and B. Braren, “Influence of Pulse Width on Ultraviolet Laser Ablation
of Poly(Methylmethacrylate),” Appl. Phys. Lett. 53 (1998) 1233-1235.
26. Dijkkamp, D., Gozdz, A. S., Venkatesan, T., and X. D. Wu, “Evidence for the
Thermal Natural of Laser-Induced Polymer Ablation,” Phys. Lett. 58 (1987) 2142-
2145.
27. Dyer, P. E., and J. Sidhu, “Excimer Laser Ablation and Thermal Coupling Efficiency
to Polymer Films,” J. Appl. Phys. 57 (1985) 1420-1422.

147
28. Gorodetsky, G., Kazyaka, T. G., Melcher, R. l., and R. Srinivasan, “Calorimetric and
Acoustic Study of ultraviolet Laser Ablation of Polymers,” Appl. Phys. Lett. 46
(1985) 828-830.
29. Daneilzik, B., Fabricius, N., Rowekamp, M. and D. von der Linde, “Velocity
Distribution of Molecular Fragments from Polymethylmethacrylate Irradiated with
UV Laser Pulses,” Appl. Phys. Lett. 48 (3) (1986) 212-214.
30. Srinivasan, R., Smrtic, M. A. and S. V. Babu, “Excimer Laser Etching of Polymers,”
J. Appl. Phys. 59 (11) (1986) 3861-3867.
31. Brannon, J. H., Lankard, J. R., Baise, A. I., Burns, F., and J. Kaufman, “Excimer
Laser Etching of Polyimide,” J. Appl. Phys. 58 (5) (1985) 2036-2043.
32. Srinivasan, R., Braren, B., and R. W. Dreyfus, “Ultraviolet Laser Ablation of
Polyimide Films,” J. Appl. Phys. 61 (1) (1987) 372-376.
33. Dyer, P. E. and R. Srinivasan, “Nanosecond Photoacoustic Studies on Ultraviolet
Laser Ablation of Organic Polymers,” Appl. Phys. Lett. 48 (6) (1986) 445-447.
34. Dyer, P. E. and Karnakis, D. M., and G. A. Oldershaw, “Analysis and Experimental
Study of One-Photon Incubated Absorption in Polymers,” Appl. Surf. Sci. 86 (1995)
1-6.
35. Dyer, P. E., Karnakis, D. M., Key, P. H., and P. Monk, “Excimer Laser Ablation for
Micro-Machining: Geometric Effects,” Appl. Surf. Sci. 96-98 (1996) 415-419.
36. Sirivasan, R., Casey, K. G., Braren, B., and M. Yeh, “The Significance of a Fluence
Threshold for Ultraviolet Laser Ablation and Etching of Polymers,” J. Appl. Phys. 67
(3) (1990) 1604-1606.
148
37. Sutcliffe, E, and R. Sirivasan, “Dynamic of UV laser Ablation of Organic Polymer
Surfaces,” J. Appl. Phys. 60 (9) (1986) 3315-3322.
38. Sirivasan, R., Braren, B. and K. G. Casey, “Mature of “Incubation Pulses” in the
Ultraviolet Laser Ablation of Polymethyl Methacrylate,” J. Appl. Phys. 68 (4) (1990)
1842-1847.
39. Kueper, S., and M. Stuke, “Femtosecond UV Excimer Laser Ablation,” Appl. Phys.
B. 44 (4) (1987) 199-204.
40. Davis, G. M., and M. C. Gower, “Time Resolved Transmission Studies of
Poly(Methyl Methacrylate) Films During Ultraviolet Laser Ablative
Photodecomposition,” J. Appl.Phys. 61 (5) (1987) 2090-2092.
41. Srinivasan, R., Braren, B., Seeger, D. e., and R. W. Dreyfus, “Photochemical
Cleavage of a Polymeric Solid: Details of the Ultraviolet Laser Ablation of
Poly(Methyl Methacrylate) at 193 and 248nm,” Macromoleclues, 19 (1986) 916-921.
42. Estler, R. C., and N. G. Nogar, “Mass Spectroscopic Indentification of Wavelength
dependent UV Laser Photoablation Fragments from Polymethylmethacrylate,” Appl.
Phys. Lett. 49 (18) (1896) 1175-1177.
43. Dyer, P. E., Karnakis, D. M., Key, P. H., and J. P. Tait, “Excimer Laser Ablation of
Low and High Absorption Index Polymers,” Appl. Surface Sci. 96-98 (1996) 596-
600.
44. Kelly, R., and J. E. Rothenberg, “Laser Sputtering Part III. The Mechanism of the
Sputtering of Metals low energy densities,” Nucl. Instr. Meth. Phys. Res. B7/8 (1985)
755-765.
149
45. Roth, S. and M. Gieger, ”Novel technique for High Quality Microstructuring with
Excimer Lasers,” Proc. SPIE 3933 (2000) 338-346
46. Kruusing, A, "Underwater and Water-assisted Laser Processing: Part 1 - General
Features, Stream Cleaning, and Shock Processing," Optics and Lasers in Engineering
41 (2004) 307-327.
47. Kruusing, A, "Underwater and Water-assisted Laser Processing: Part 2 - Etching,
Cutting, and Rarely Used Methods," Optics and Lasers in Engineering 41 (2004) 329-
532.
48. Davis, G. M., Thomas, D. W., and M. C. Gower, “Excimer Laser Direct Etching of
GaAs,” J. Phys. D: Appl. Phys. 21 (1988) 683-687.
49. Dupont, A., Caminat, P., Bournot, and J. P. Gauchon, "Enhancement of Material
Ablation Using 248, 308,532, 1064 nm Laser Pulse with a Water Film on the Treated
Surface," J. Appl. Physics 78 (3) (1995) 2022-2028
50. Park, H. K., Kim, D., Grigoropoulos, C. P., and A. C. Tan, ”Pressure Generation and
Measurement in the Rapid Vaporization of Water on a Pulsed Laser Heated Surface,”
J Appl. Phys. 80 (7) (1996) 4072-4081
51. Sano, Y., Mukai, N., Okazaki, K., and M. Obata, "Residual Stress Improvement in
Metal Surface by Underwater Laser Irradiation," Nuclear Instruments and Methods in
Physical Research B 121 (1977) 432-436
52. Kim, D and C. P. Grigoropoulos, "Phase-Change Phenomenon and Acoustic
Transient Generation in the pulsed laser Induced Ablation of Absorbing Liquids,"
Applied Surface Science 127-129 (1998) 53-58
150
53. Kim, D., Ye, M., and C. P. Gregoropoulos, "Pulsed Laser-induced Ablation of
Absorbing Liquids and Acoustic-transient Generation," Applied Physics A: Materials
Science and Processing A 67(2) (1998) 169-181
54. Ho, J. R., Grigoropoulos, C. P., and J. A. C. Humphrey, "Computational Study of
Heat Transfer and Gas Dynamics in the Pulsed Laser Evaporation of Metals," J of
Applied Physics 78 (7) (1995) 4696-4709
55. Geiger, M., Roth, S., and W. Becker, "Microstructing and Surface Modification by
Excimer Laser Machining Under Thin Liquid Films," Proc. SPIE, 3407 (1998) 200-
208.
56. Andriac, Z., Henc-Bartolic, V., Gracin, D., and M. Stubicar, ”Droplet Formation
During Laser Sputtering of Silicon,” App. Surface Science 136 (1998) 73-80.
57. Feng, Y., Liu, Z. Q., and X. S. Yi, “Co-occurrence of Photochemical and Thermal
Effects During Laser Polymer Ablation via a 248-nm Excimer Laser,” Applied
Surface Science 156 (2000) 177–182
58. Jeong, S.H., Grief, R., and R. E. Russo, “Shock Wave and Material Vapor Plume
Propagation during Excimer Laser Ablation of Aluminum Samples”, J. Phys. D:
Appl. Phys. 32 (1999) 2578-2585.
59. Yoo, J.H., Jeong, S. H., Grief, R., and R. E. Russo, “Explosive Change in Crater
Properties During High Power Nanosecond laser,” J of Applied Physics 88 (3) (2000)
1638-1649
60. Zhu, S., Lu, Y. F., Hong, M. J., and X. Y. Chen, "Laser Ablation of Solid Substrates
in Water and Ambient Air," J of App. Physics 89 (4) (2001) 2400-2403
151
61. Jeschke, H. O., Garcia, M. E., Lenzer, M., Bonse, J., Kruger, J., and W. Kautek,
“Laser Ablation Thresholds of Silicon for Different Pulse Durations: Theory and
Experiment” Applied Surface Science 197-198 (2002) 839-844
62. Craciun, V., Bassim, N., Singh, R. K., Craciun, D., Hermann, and C. Boulmer-
Leborgne, “Laser Induced Explosive Boiling During Nanosecond Laser Ablation of
Silicon” Appl. Surface Science 186 (2002) 288-292
63. Amer, M., L. Dosser, S. LeClair, and J. F. Maguire, “Induced Stresses and Structural
Changes in Silicon Wafers as a Result of Laser Micro-machining,” App. Surface
Science 187 (2002) 291-296
64. Kawaguchi, Y., Narazaki, A., Sato, T., Niino, H., Yabe, A., Langford, S.C. and J.T.
Dickinson, “The Onset of Optical Breakdown in KrF-Laser-Irradiated Silica Glass
Surfaces,” Appl. Surf. Sci. 197–198 (2002) 50–55
65. Ihlemann, J., “Excimer Laser Ablation of Fused Silica,” Appl. Surf. Sci. 54 (1992)
193-200
66. Omori, N. and M. Inoue, “Excimer Laser Ablation of Inorganic Materials,” Appl.
Surf. Sci. 54 (1992) 232-236
67. Kruger, J. and W. Kautek, “Femtosecond-Pulse Visible Laser Processing of
Transparent Materials,” Appl .Surf. Sci. 96-98 (1996) 430-438
68. Sokolowski-Tinten, K, Bialkowski, J., Cavalleri, A., and D. Von Der Linde,
“Observation of A Transient Insulating Phase of Metals and Semiconductors during
Short-Pulse Laser Ablation,” Appl. Surf. Sci. 127–129 (1998) 755–760
69. Buerhop, C., Blumenthal, B., Weissmann, R., Lutz, N. and S. Biermann, “Glass
Surface Treatment with Excimer and CO2 Laser,” Appl. Surf. Sci. 46 (1990) 430-434.
152
70. Buerhop, C., Weissmann, R. and N. Lutz, “Ablation of Silicate Glasses by Laser
Irradiation: Modeling and Experimental Results,” Appl. Surf. Sci. 54 (1992) 187-192.
71. Jackson, S. R., Metheringham, W. J. and P. E. Dyer, “Excimer Laser Ablation of
ND:YAG and Nd:Glass,” Appl. Surf. Sci. 86 (1995) 223-227.
72. Dyer, P. E., Farley, R. J., Giedl, R. and D. M. Karnakis, “Excimer Laser Ablation of
Polymers and Glasses for Grating Fabrication,” Appl. Surface Sci. 96-98 (1996) 537-
549.
73. Keiper, B., Exner, H., Loschner, U. and T. Kuntze, “Drilling of Glass by Excimer
Laser Mask Projection Technique,” ICALEO M110 (1999) 1-7
74. Konovalov, I. A. and P. R. Herman, “Ablation-Induced Stresses in Fused Silica by
157-nm F2-Laser Irradiation,” Mat. Res. Soc. Symp. 617 (2000) J3.3.1-J3.3.7.
75. Allcock, G., Dyer, P. E., Elliner, G. and H. V. Snelling, “Experimental Observations
and Analysis of CO2 Laser-Induced Microcracking of Glass” J. Appl. Phys. 78 (1995)
7295-7303.
76. Zhang, W. and Y. L Yao, “Micro Scale Laser Shock Processing of Metallic
Components,” J. Manufac. Sci. Eng., 124 (2002) 369-378.
77. Peyre, P., Fabbro, R., Merien, P. and H. P. Lieurade, “Laser Shock Processing of
Aluminum Alloys. Application to High Cycle Fatigue Behavior,” Mat. Sci Eng. A
A210 (1996) 102-113.
78. Peyre, P., Berthe, L., Scherpereel, X., Fabbro, R. and E. Bartnicki, “Experimental
Study of Laser-Driven Shcok Waves in Stainless Steel,” J. Appl. Phys. 84 (1998)
5985-5992.
153
79. Berthe, L., Fabbro, R., Peyre, P., Tollier, L. and E. Bartnicki, “Shock Waves from a
Water-Confined Laser-Generated Plasma,” J. Appl. Phys. 82 (1997) 2826-2831.
80. Jeong, J. H. Grief, R. and R. E. Russo, “Shock Wave and Material VApour Plume
Propagateion during Exciemr Laser Ablation of Aluminum Samples,” J. Phys. D:
Appl. Phys. 32 (1999) 2578-2585.
81. Nilsson, D., Jensen, S. and Menon, “Fabrication of Silicon Molds for Polymer
Optics,” J. Micromech. Microeng, submitted.
82. Choo, K. L, Ogawa, Y., Kanbargi, G., Raff, L. M., and R. Komanduri,
“Micromachining of Silicon by Short Pulse Laser Ablation in Air and Under Water”,
Proceedings of NSF Workshop on Research Needs in Thermal Aspects of Material
Removal Processes (2003) 346-365. Also, in print Material Science B (2004).
83. Fox, J. A., “Effect of Water and Paint Coating on Laser-Irradiated Target,” Appl.
Phys. Lett. 24 (10) (1974) 461-464.
84. Herzberg, G., “Spectra of Diatomic Molecules,” New York: D. Van Nostrand
Company, Inc. (1950).
85. Kingery, W. D., “Surface Tension of Some Liquid Oxides and Their Temperature
Coefficients,” J. Am. Ceram. Soc, 42 (1959) 6-10.
86. Guthrie, R. I. L., and T. Iida, “Thermodynamic Properties of Liquid Metals,” Mater.
Sci. Eng. A A178 (1994) 35-41.
87. Balandin, Yu, V., Otte, D., and O. Bostanjoglo, “Thermocapillary Flow Excited by
Focused Nanosecond Laser Pulses in Contaminated Thin Liquid Iron Films,” J. Appl.
Phys. 78 (1995) 2037-2044.
154
APPENDIX A: SYSTEM OPERATOIN INSTRUCTIONS
Turn On Procedure
1) Wear safety goggles that block 248 nm laser radiation.
2) Remove bracelets, rings, watch, or other reflective jewelry.
3) Before turning the laser on, make sure the safety window is close.
4) Turn key switch to ON
5) Turn main switch to ON
6) The laser will operate in the self-testing mode.
a. first the internal data link is checked
b. at the same time, the controller watchdog and the communication between the
terminal and laser is checked.
7) The laser is now in warm up mode for 8 min.
8) While waiting for the laser to warn up, turn on the exhaust vent and the cooling
water supply.
9) Turn on the power supply for the attenuator; it should be ~24 VDC.
10) Switch on the computer and DR500 Drive Chassis.
Operating Procedure
1) After the warm up, the laser is ready for normal operation.
2) Push key <<TRIGGER INT/EXT>>, second line on the display shows the
current mode. Use the arrow key to choose the external trigger and then push key
<<ENTER>>.
155
3) Push key <<HV>>, then punch in the desired voltage between 18.0 to 27.0
follow by pushing key <<ENTER>>. The chosen value will pop up on the
display.
4) Push key <<RUN/STOP>> on the control terminal. The message ‘RUN LASER’
will pop up on the display.
5) Press <<EXE>> on the control terminal. Control LED at key <<RUN/STOP>>
will light up.
6) Load the U500 software in the computer. A window of U500 will pop up.
7) Reset all the X, Y, Z, and U axes by dragging the mouse to the RESET icon or
press F9.
8) Load the program written for specific application into the U500 software. For
details on the command please refer to the instruction manual. Basically the
program contains G codes and PSO codes, where G code commands the table
movement and the PSO code commands the firing of the laser.
9) After loading the program, make sure nothing is blocking in front of all the
optical components.
10) Dust off all the optical components with compress air.
11) Open the safety window.
12) Now, start laser machining by pressing the icon, RUN or F6.
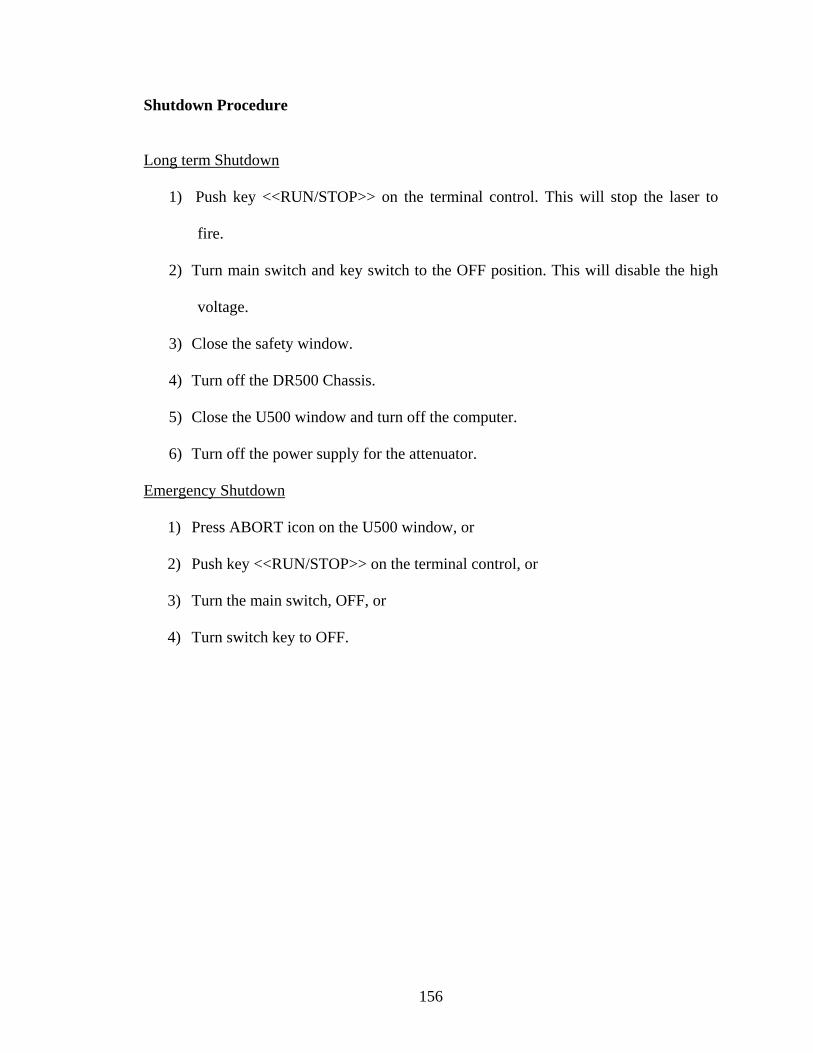
156
Shutdown Procedure
Long term Shutdown
1) Push key <<RUN/STOP>> on the terminal control. This will stop the laser to
fire.
2) Turn main switch and key switch to the OFF position. This will disable the high
voltage.
3) Close the safety window.
4) Turn off the DR500 Chassis.
5) Close the U500 window and turn off the computer.
6) Turn off the power supply for the attenuator.
Emergency Shutdown
1) Press ABORT icon on the U500 window, or
2) Push key <<RUN/STOP>> on the terminal control, or
3) Turn the main switch, OFF, or
4) Turn switch key to OFF.
VITA
Choo Kok Leong
Candidate for the Degree of
Master of Science
Thesis: MICROMACHINING USING AN EXCIMER (248 nm) LASER Major Field: Mechanical Engineering Biographical:
Personal Data: Born in Ipoh, Perak, Malaysia, on October 14, 1974, the youngest
son of Mr. Choo Si Pei and Madam Ng Yoke Lan.
Education: Received Bachelor of Science in Mechanical Engineering from
Oklahoma State University, Stillwater, in May 1999. Completed the
requirements for the Master of Science degree with a major in Mechanical
Engineering from Oklahoma State University, Stillwater, in May 2004.
Experience: Worked as a Teaching Assistant in Mechanical and Aerospace
Engineering Department, Oklahoma State University, Stillwater, Oklahoma,
August 1999 – December 2000. Graduate Research Assistant in Mechanical
and Aerospace Engineering Department, Oklahoma State University,
Stillwater, Oklahoma, August 2000 – Present.
Professional Membership: The American Society of Mechanical Engineers.


![Phototherapy, Photochemotherapy, and Excimer Laser Therapy ... · Excimer Laser Therapy Office-based targeted excimer laser therapy (i.e., 308 nanometers [nm]) is considered medically](https://img.dokumen.tips/doc/110x75/5f14ea18414c5a02c231f9fa/phototherapy-photochemotherapy-and-excimer-laser-therapy-excimer-laser-therapy.jpg)