Embed Size (px)
Citation preview
Microbiological Water Quality Guidelines for
Marine and Freshwater Recreational Areas
Published in June 2002 by the Ministry for the Environment
Manatu Mo Te Taiao PO Box 10-362, Wellington, New Zealand
Updated in June 2003
ISBN: 0-478-24091-0 ME number: 474
This document is available under publications on the Ministry for the Environment’s website:
www.mfe.govt.nz
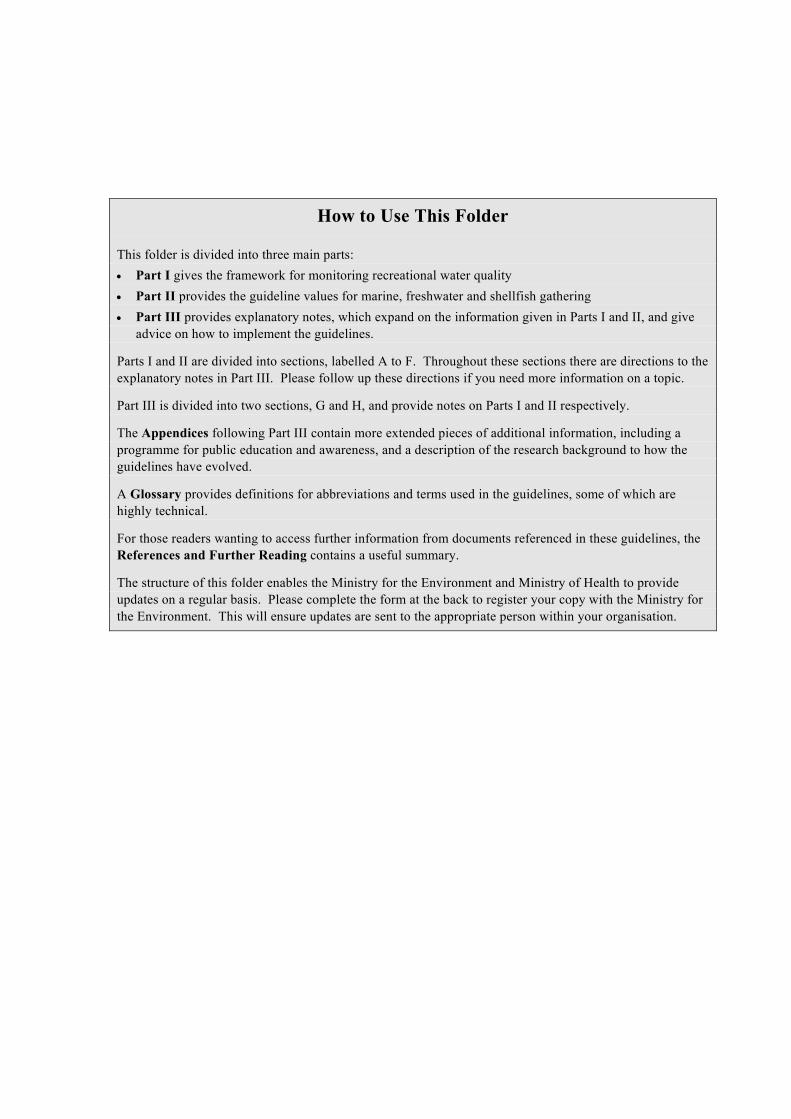
How to Use This Folder
This folder is divided into three main parts: • Part I gives the framework for monitoring recreational water quality • Part II provides the guideline values for marine, freshwater and shellfish gathering • Part III provides explanatory notes, which expand on the information given in Parts I and II, and give
advice on how to implement the guidelines.
Parts I and II are divided into sections, labelled A to F. Throughout these sections there are directions to the explanatory notes in Part III. Please follow up these directions if you need more information on a topic.
Part III is divided into two sections, G and H, and provide notes on Parts I and II respectively.
The Appendices following Part III contain more extended pieces of additional information, including a programme for public education and awareness, and a description of the research background to how the guidelines have evolved.
A Glossary provides definitions for abbreviations and terms used in the guidelines, some of which are highly technical.
For those readers wanting to access further information from documents referenced in these guidelines, the References and Further Reading contains a useful summary.
The structure of this folder enables the Ministry for the Environment and Ministry of Health to provide updates on a regular basis. Please complete the form at the back to register your copy with the Ministry for the Environment. This will ensure updates are sent to the appropriate person within your organisation.

Foreword
New Zealanders care about the quality of their waters. We want to swim and collect kai moana at our beaches and rivers without the risk of getting sick. Thousands of us use our beaches and rivers to swim, surf, sail, and collect kai moana, and we highly value the ability to do this.
The Microbiological Water Quality Guidelines for Marine and Freshwater Recreational Areas incorporate a risk-based approach to monitoring water quality promoted by the World Health Organization. The guidelines will provide councils with the information they need to monitor the state of their waters.
These guidelines are the result of a wide consultative effort. Extensive consultation with regional councils, territorial local authorities and public health agencies since the release of the 1999 guidelines resulted in the formation of a working group. The Ministry for the Environment and Ministry of Health have been working with this group over the 2000–03 period to develop guidance on public health monitoring and reporting, and state of the environment monitoring and reporting.
We have deliberately formatted the guidelines so they can be easily revised without requiring a complete re-publication of the entire guidelines. If you would like to receive updates of these guidelines, please complete and return the registration form at the back of the folder. You can also download the most up-to-date edition of the guidelines from the publications area of the Ministry for the Environment’s website: www.mfe.govt.nz.
FOREWORD. June 2003
v
We would like to thank everyone who has been involved in the development of the guidelines and acknowledge that without your input it would not have been possible. We look forward to your continuing contribution in the future.
Barry Carbon Chief Executive Ministry for the Environment
Karen O Poutasi (Dr) Director-General of Health Ministry of Health
FOREWORD. June 2003
vi

Acknowledgements
This document has been produced and funded by the Ministry for the Environment and the Ministry of Health. We would like to thank the members of the Marine Bathing Working Group for their contributions to the preparation of this document:
Donald Campbell Healthcare Taranaki
Keith Hamill (formerly) Environment Southland
Peter Hamill Marlborough District Council
Sophie Heighway (formerly) North Shore City Council
Andrea Johnson Canterbury Crown Public Health
Erin Kearney Valley Health
Gillian Lewis Auckland Regional Forum
Shaun Lewis Earth matters
Graham McBride NIWA
Adrian Meredith Environment Canterbury
Stephen Palmer Hutt Valley Health
Paul Prendergast Ministry of Health
Graham Sevicke-Jones Wellington Regional Council
Brian Sharman Metrowater
Rennae Shirley Auckland City Council
Brett Stansfield Hawke’s Bay Regional Council
Desmond Till Consultant
ACKNOWLEDGEMENTS. June 2003
vii
Contents
Foreword v
Acknowledgements vii
Introduction 1 How do these guidelines differ from previous ones? 1 What is the aim of the guidelines? 2 What is the status of these guidelines? 2 What does this document cover? 2 State of the environment reporting and links with the Environmental Performance Indicators Programme 3 Conditions on the use of these guidelines 3
Part I: The Framework for Monitoring Recreational Water Quality A1 SECTION A: Why Monitor Water? A1
A.1 Health risks A1 A.2 State of the environment reporting A2
SECTION B: Who Monitors and Reports? B1 B.1 Roles and responsibilities B1 B.2 Recommended framework for roles and responsibilities B1 B.3 Regional protocols B2 B.4 Abating the nuisance B3 B.5 Legal implications B3
Part II: Guidelines for Recreational Water Quality C1 SECTION C: How Do We Develop Guideline Values? C1
C.1 The overall approach C1 C.2 The framework C2
SECTION D: Microbiological Guidelines for Marine Waters D1 D.1 Designation of a contact recreation area D1 D.2 Sampling beach water D1 D.3 Grading a beach D2 D.4 Monitored beaches: surveillance, alert and action modes D7 D.5 Marine bathing surveillance, alert and action levels D8 D.6 Conditions of using the guidelines D9
CONTENTS. June 2003
viii
SECTION E: Microbiological Guidelines for Freshwaters E1 E.1 Designation of a contact recreation area E1 E.2 Sampling rivers and lakes E1 E.3 Grading a freshwater site E2 E.4 Monitored beaches: surveillance, alert and action modes E8 E.5 Freshwater surveillance, alert and action levels E8 E.6 Conditions of using the guidelines E10
SECTION F: Microbiological Guidelines for Shellfish-Gathering Waters F1 F.1 The preferred indicator for waters used for shellfish gathering F1 F.2 Recreational shellfish-gathering guideline values F1
Part III: Explanatory Notes to the Guidelines G1 SECTION G: NOTES TO PART I: The Framework for Monitoring Recreational Water Quality G1
Note G(i): Respiratory illness G1 Note G(ii): Examples of health risks G2 Note G(iii): State of the Environment Reporting G3 Note G(iv): Pressure-State-Response model G3 Note G(v): Integrating public health and state of the environment data G4 Note G(vi): Merging with existing microbiological programmes G4 Note G(vii): Different roles and responsibilities adopted around New Zealand G6 Note G(viii): The legislative basis for the Ministry’s recommendations G7 Note G(ix): Legal opinion on roles and responsibilities G9 Note G(x): The Annapolis Protocol G9
SECTION H: NOTES TO PART II: Guidelines for Recreational Water Quality H1 Note H(i): Sampling times and periods H1 Note H(ii): Techniques for taking and analysing samples H3 Note H(iii): Establishing a Sanitary Inspection Category (SIC) H5 Note H(iv): Catchment Assessment Checklist (CAC) for marine recreational waters H7 Note H(v): Microbiological Assessment Category (MAC) for marine recreational waters H12 Note H(vi): Suitability for recreation grade for marine recreational waters H12 Note H(vii): Catchment Assessment Checklist for freshwater recreational areas H15 Note H(viii): Microbiological Assessment Category for freshwater recreational areas H19 Note H(ix): Suitability for recreation grade for freshwater recreational areas H20 Note H(x): Application of grades and single samples H21 Note H(xi): Interim grading H22 Note H(xii): Modifying beach grades H22 Note H(xiii): Percentile guideline values for seawater (WHO 2001) and freshwater H24 Note H(xiv): Derivation of alert and action levels for seawater and freshwater H27 Note H(xv): State of the environment analysis and reporting H27 Note H(xvi): Reporting to the public H28 Note H(xvii): Management responses to exceedances for marine and freshwater H28
CONTENTS. June 2003
ix
Section I: Appendices Appendix 1: Public Education and Awareness Programme Outline I1 Appendix 2: Developing the Guidelines I9 Appendix 3: Signs I23 Appendix 4: Case Study – Implementing the Marine and Freshwater Guidelines I25 Appendix 5: Fact Sheets I31
Abbreviations J1
Glossary J2
References and Further Reading J6
About the Ministry for the Environment J30
Registration Form J31
CONTENTS. June 2003
x
Tables
Table D1: Microbiological Assessment Category definitions for marine waters D6
Table D2: Suitability for recreation grade for marine sites D7
Table E1: Microbiological Assessment Category (MAC) definitions E6
Table E2: Suitability for Recreation Grade for freshwater sites E7
Table G1: Bathing-related illnesses, symptoms and pathogens, with relevant references G2
Table H1: Guideline values for microbiological quality of marine recreational waters H25
Table H2: Guideline values for microbiological quality of freshwater recreational waters H26
Table I1: Example of completed Catchment Assessment Checklist I26
Table I2: Example of a completed Catchment Assessment Checklist I28
Figures
Figure C1: Surveillance requirements for graded beaches C3
Figure D1: Recreational water-quality decision tree D3
Figure E1: Recreational water-quality decision tree (duplicated) E3
Figure H1: Example of a proposed sampling strategy (marine waters) H2
Figure H2: Sanitary Inspection Category flow chart for marine recreational waters H11
Figure H3: Sanitary Inspection Category for freshwater sites H19
CONTENTS. June 2003
xi

Introduction
New Zealand’s coastal waters are widely used for a range of recreational activities, such as bathing, sailing, boating, various forms of surfing, water skiing, underwater diving and shellfish gathering. Maintaining and protecting the quality of this recreational water is therefore an important environmental health and resource management issue.
How do these guidelines differ from previous ones?
In the past, guidelines for assessing the public health risk of using recreational waters have been largely based on microbiological faecal indicator counts. The previous (1999) marine bathing guidelines (Recreational Water Quality Guidelines) were developed using the results of international and New Zealand studies, and after consultation with regional and local environmental and health agencies.
The guidelines presented here move away from the sole use of guideline values of faecal indicator bacteria, and instead use a combination of a qualitative risk grading of the catchment, supported by the direct measurement of appropriate faecal indicators to assess the suitability of a site for recreation. In addition, alert and action guideline levels are used for surveillance throughout the bathing season.
The two components to providing a grading for an individual beach are:
the Sanitary Inspection Category (SIC), which generates a measure of the susceptibility of a water body to faecal contamination
•
• historical microbiological results, which generate a Microbiological Assessment Category (MAC), which provides a measurement of the actual water quality over time.
INTRODUCTION. June 2003
1
These two combined give an overall Suitability for Recreation Grade (SFRG), which describes the general condition of a site at any given time, based on both risk and indicator bacteria counts. This grade helps to determine whether ongoing monitoring is required, and provides the basis for telling people whether or not the water is suitable for recreational use, from a public health perspective.
Throughout this document the term ‘beach’ refers to both marine and freshwater recreational water sites.
What is the aim of the guidelines? The aim of these guidelines is to help water managers control the public health risk from microbiological contamination in recreational waters, and to provide for monitoring and reporting on the general health of beaches. The guidelines were designed to provide guidance to water managers in implementing the Resource Management Act 1991 (RMA), and the Health Act 1956 for shellfish – gathering or contact recreation. A crucial part of this is ensuring that the public are informed of the health risks in time for them to make informed decisions about whether to enter the water. The guidelines replace the previous Ministry for the Environment / Ministry of Health Recreational Water Quality Guidelines published in November 1999.
Guidance is provided for three categories of water use:
•
•
• •
marine bathing and other contact recreation activities
freshwater bathing and other contact recreation activities
recreational shellfish gathering in marine waters (but not commercial shellfish harvesting).
The Ministry for the Environment is specifically concerned with ensuring that the public has ready access to regional or local authority water quality information on the potential health risks from faecal contamination of recreational waters. The guidelines should provide this.
The guidelines also provide the monitoring protocol for the state of the environment indicators “the percentage of monitored beaches in each beach grade”, and “the percentage of the season beaches or coastal areas were suitable for contact recreation or shellfish gathering”.
What is the status of these guidelines?
The guidelines have been developed over an extensive period of consultation with regional and local councils and health authorities, and present a preferred approach to monitoring recreational waters. They are not legislated standards that must be adhered to at all times.
What does this document cover? The guidelines cover the monitoring and interpretation of results from surveys for bacteriological indicators of faecal contamination in recreational waters. They do not cover other impacts on the above water uses, such as water clarity, chemical pollution, or marine biotoxins from algal blooms. The guidelines should not be used as the basis for establishing conditions for discharge consents, although they may be used as a component for decision making.
Documents that may be of interest to anyone managing water for contact recreation include two produced by the Ministry for the Environment:
Water Quality Guidelines No 1, which covers the management of biological growths in rivers used for swimming
INTRODUCTION. June 2003
2
Water Quality Guidelines No 2, which covers the management of water clarity for bathing in freshwaters.
•
These guidelines take precedence over the ANZECC Water Quality Guidelines for Fresh and Marine Water for microbiological water quality.
Finally, visit the Ministry for the Environment’s website for further information on water-quality publications: www.mfe.govt.nz.
State of the environment reporting and links with the Environmental Performance Indicators Programme
These guidelines constitute the monitoring protocol for recreational beaches in New Zealand. Although the focus of this document is on monitoring recreational waters for public health purposes, regional councils and the Ministry for the Environment also use this information to report on the state of the environment at a regional and national level.
Indicators for recreational waters have been developed through the Ministry’s Environmental Performance Indicators (EPI) Programme, and will be reported nationally through the EPI website.
These guidelines and the accompanying explanatory notes provide information on the data management relationship between the Ministry and data providers, and contain guidance on data transfer protocols. Links with other indicators are also discussed.
See Note G(iii) for discussion on the EPI programme.
See Note G(v) for discussion on integrating state of the environment and public health programmes.
Conditions on the use of these guidelines These guidelines have been prepared to support the management of bacteriological water quality for recreational use. These guidelines cannot be applied to water uses other than recreational use.
Guidance for wastewater discharges
These guidelines cannot be directly used to determine water quality criteria for wastewater discharges because there is the potential for the relationship between indicators and pathogens to be altered by the treatment process. The relationship between indicator bacteria and disease-causing bacteria, viruses and protozoa in the discharge needs to be established.
The Ministry for the Environment has published the Wastewater Monitoring Guidelines, which provide guidance on monitoring treated wastewater. Information on these guidelines is available on the Ministry’s website (www.mfe.govt.nz). Information on the Sustainable Wastewater Management Handbook for Smaller Communities is also available on the Ministry’s website.
Applying the guidelines to water impacted by wastewater discharges
These guidelines should not be directly applied to assess the microbiological quality of water that is impacted by a nearby point source discharge of treated effluent without first confirming that they are appropriate. This is particularly important for disinfected effluent (Disinfection Review Group 2002) and for waste stabilisation pond effluent (Sinton et al 2002). It is important when planning the location and degree of treatment for wastewater treatment plants to recognise that the guideline values are not necessarily a guarantee of safety.
INTRODUCTION. June 2003
3
While it is correct to infer that water exceeding the guideline values poses an unacceptable health risk, the converse is not necessarily true. This is because effluent may be treated to a level where the indicator bacteria concentrations are very low, but pathogens such as viruses and protozoa may still be present at substantial concentrations, effectively changing the indicator/pathogen ratio.
To assess the microbiological quality of water that is impacted by a discharge of treated effluent, the relationship between indicator bacteria and key pathogens (such as viruses and protozoa) must be established for that treatment.
This would require the generation of statistically robust data to establish that the treatment process produces an effluent that meets the guideline indicator bacteria values, and is capable of destroying pathogenic micro-organisms.
Treatment plants also require ongoing auditing and monitoring. Wastewater plants may not operate 100% of the time (e.g. during high water flows) and the health status of the population at any given time affects the pathogens likely in wastewater.
INTRODUCTION. June 2003
4
Part I:
The Framework for
Monitoring Recreational
Water Quality
SECTION A: Why Monitor Water?
A.1 Health risks
Water contaminated by human or animal excreta may contain a range of pathogenic (disease-causing) micro-organisms, such as viruses, bacteria and protozoa. These organisms may pose a health hazard when the water is used for recreational activities such as swimming and other high-contact water sports. In these activities there is a reasonable risk that water will be swallowed, inhaled (Harrington et al 1993), or come in contact with ears, nasal passages, mucous membranes or cuts in the skin, allowing pathogens to enter the body.
Research is continuing into the health risks associated with contamination of water by sewage and excreta. Until recently scientists believed that gastro-enteritis was the main health effect, but it is now becoming clear that respiratory health effects are also important, and may even be more prevalent than gastro-enteritis.
See Note G(i) for evidence on respiratory illness caused by water contamination.
In most cases the ill-health effects from exposure to contaminated water are minor and short-lived. However, there is the potential for more serious diseases, such as hepatitis A, giardiasis, cryptosporidiosis, campylobacteriosis and salmonellosis (Philip 1991).
Adhering to the guideline values and using the framework set out in this document should ensure that people using the water for recreation or collecting shellfish for eating are informed of health risks, and can make appropriate decisions to avoid exposing themselves to significant health risks.
Do these guidelines measure the level of pathogens in the water? In fact it is difficult and impractical
PART I: THE FRAMEWORK FOR MONITORING RECREATIONAL WATER QUALITY. June 2003
A1
to do this directly. Instead, we measure the levels of ‘indicator’ micro-organisms, which indirectly tell us about the levels of pathogens. The marine guidelines were developed from many studies relating bacteriological indicators to illness in the general public after bathing (see especially the WHO review by Prüss 1998). These studies include, but are not confined to, those carried out at seven New Zealand marine beaches in 1994–95 (McBride, Salmond, et al 1998). The freshwater guidelines were developed from the findings of the Freshwater Microbiology Research Programme Report: Pathogen Occurrence and Human Health Risk Assessment Analysis, November 20021 (McBride, et al 2002).
The guidelines work with a defined ‘tolerable risk’ rather than no risk at all. For most healthy people water conforming to the guideline value will pose a minimal level of risk. However, water conforming to the guideline values may still pose a potential health risk to high-risk user groups such as the very young, the elderly and those with impaired immune systems.
See Note G(ii) for more information on health risks.
A.2 State of the environment reporting
Regional councils and the Ministry for the Environment have responsibilities under the RMA to monitor the state of the environment. Reporting on state is achieved regionally through state of the environment reports and nationally through national state of the environment reporting.
The purpose of state of the environment monitoring and reporting is to use environmental performance indicators (EPIs) to measure and monitor human activities and their effects on the environment. The Government’s objectives for the state of the environment monitoring and reporting are to:
•
•
•
•
•
•
•
•
•
•
•
•
1 A copy of the report can be downloaded from the Ministry for the Environment’s website www.mfe.govt.nz.
systematically report on the state of New Zealand’s environmental assets
systematically measure the performance of its environmental policies and legislation
better prioritise policy and improve environmental decision making.
Over time, the information produced through monitoring environmental performance indicators will:
contribute to raising the level of knowledge about the state of New Zealand’s environment
increase our ability to report on environmental health and trends
provide the tools for effective evaluation of policy
provide the information base for more informed policy and management decisions.
This document serves as a monitoring protocol for two confirmed indicators for human health and values for marine and freshwater environments:
the percentage of monitored beaches in each grade
the percentage of the season beaches or coastal areas were suitable for contact recreation or shellfish gathering.
‘Beaches’ refers to both marine and freshwater recreation sites.
The national objectives of these indicators are to:
quantify the human health risks at recreational water sites and shellfish-gathering areas
measure the general state of recreational water areas
report on the overall suitability of recreational water areas for bathing.
See Note G(iii) for more information on state of the environment reporting.
PART I: THE FRAMEWORK FOR MONITORING RECREATIONAL WATER QUALITY. June 2003
A2
Integrating public health and state of the environment data
The purpose of the microbiological water quality guidelines for marine and freshwater recreational areas is to help control the public health risk from microbiological contamination in recreational waters and to provide a framework for monitoring and reporting on the general health of beaches. Integrating the needs of both state of the environment and public health monitoring may present some challenges, but it is achievable.
Microbiological information is generated more intensively to keep stock of short-term variation that can affect the public health risk of water quality. This monitoring takes place on a weekly basis, although at times follow-up monitoring is required to identify the permanence of an identified guideline exceedance.
The purpose of state of the environment monitoring is to collect sufficient data to produce information on the general health of the environment. This information can then be used to measure how well our management practices, policies and laws are working, and whether environmental outcomes are being achieved. The beach grades generated through the combination of the catchment assessment and the microbiological assessment provide the state of the environment information to the public on the general condition of the recreational area with respect to public health risk. The microbiological information collected to assess the public health risk at the beach on a weekly basis is aggregated over five years to generate the Microbiological Assessment Category that is used in the beach grading process.
PART I: THE FRAMEWORK FOR MONITORING RECREATIONAL WATER QUALITY. June 2003
A3
SECTION B: Who Monitors and Reports?
B.1 Roles and responsibilities
The Microbiological Water Quality Guidelines for Marine and Freshwater Recreational Areas have been developed for the agencies involved in the monitoring and reporting of recreational waters. This is primarily regional, territorial and unitary councils, District Health Boards and Medical Officers of Health.
During the development of this manual there was an overwhelming request from all those involved in beach water-quality monitoring for guidance from the Ministry for the Environment and Ministry of Health on the appropriate delegation of roles and responsibilities for recreational beach monitoring. Determining precisely which agency is responsible for which roles in monitoring and reporting beach water quality for public health protection must be one of the first steps in developing a sampling and reporting programme.
Some regional, territorial and unitary councils have clearly defined these roles, basing their decisions on council ‘ownership’ of the roles, and the available resources and areas of expertise.
See Note G(vii) on different responsibility scenarios operating around the country.
The following section outlines an approach for clarifying roles and responsibilities at the regional level by way of protocols, agreed to by the different agencies that have a role in monitoring and reporting recreational water quality. This section also presents a recommended framework for the roles regional councils, territorial local authorities, unitary councils and health agencies will have with respect to recreational water-quality monitoring and reporting.
B.2 Recommended framework for roles and responsibilities
The Ministry for the Environment and Ministry of Health have agreed on the following recommended framework for roles and responsibilities in relation to recreational waters. i. The regional council co-ordinates the
monitoring and reporting strategy. ii. The regional council implements surveillance
and alert-level monitoring. iii. The Medical Officer of Health reviews the
effectiveness of the monitoring and reporting strategy.
iv. The regional council informs the Medical Officer of Health and territorial authority if alert or action levels are reached.
v. The Medical Officer of Health will ensure that the territorial authority is informed.
vi. The territorial authority will inform the public when the action level is exceeded – the Medical Officer of Health will ensure the public is informed within agreed timeframes.
vii. If the action level is reached, the territorial authority will undertake nuisance monitoring and cause all proper steps to be taken to abate or remove the nuisance. On occasion it may be more appropriate for the regional council to undertake this duty. The Medical Officer of Health will provide advice and ensure that proper steps are taken by the territorial local authorities and/or regional councils.
viii. It is the responsibility of the Medical Officer of Health to ensure that sites with modified grades are audited in accordance with these guidelines.
ix. The regional council will collate the information for state of the environment reporting and a review of management policies.
See Note G(viii) for the legislative basis for these recommendations. See Note H(xii) for an explanation of modified beach grades.
PART I: THE FRAMEWORK FOR MONITORING RECREATIONAL WATER QUALITY. June 2003
B1
The Medical Officer of Health has a lead role, given his/her responsibilities under the Health Act, to ensure the proper steps are taken by the territorial local authorities to protect public health.
In some situations it may be more appropriate for the regional council to abate/remove the nuisance, as when the source of contamination has been identified as being within its jurisdiction (e.g. discharges of farm dairy effluent). Although the guidelines advise investigation of the nuisance, they do not require that steps be undertaken to remove it. However, taking proper steps to abate or remove the nuisance is a Health Act requirement, and it is an RMA requirement to remedy and mitigate, so removing the nuisance is a logical next step.
A legal opinion on legislated roles and an outline of the current monitoring and reporting scenarios around the country provided the background for the recommendation on roles and responsibilities.
See Note G(ix) for details of the legal opinion.
The Explanatory Notes also present a number of alternative roles and responsibilities frameworks that are applied by some councils around the country (see Note G(vii)). These illustrate that there are a range of options for ensuring that the public are able to make informed choices about their recreational activities. They are provided for agencies that do not have an effective roles and responsibilities framework in place and wish to use an alternative to the recommended framework. Regional councils, territorial authorities and health authorities must decide what best suits their circumstances, taking into consideration what has previously proven to be successful.
B.3 Regional protocols
The Ministry for the Environment and Ministry of Health recommend that local government and public health services develop regional protocols that clearly identify a lead agency, which develops a monitoring protocol that specifies the details of:
•
•
•
•
•
the agreed roles and responsibilities protocol, including who is accountable2
how the programme will be implemented
what the management and communication/ education responses will be to exceedance events.
Each agency involved in the monitoring programme should also be consulted to ensure there is agreement on how each site is assessed.
These protocols should be based on the agencies’ respective legislative functions relating to recreational water-quality monitoring and reporting, with the aim of:
reflecting and clarifying local/regional conditions and arrangements
enhancing collaboration, operational co-ordination and the performance of their respective roles and responsibilities.
Consideration must be given to the role of non-regulatory groups, such as community groups and or iwi. Interactions between communities, authorities and organisations are a key requirement in monitoring, reporting and resolving water-quality issues.
2 At the time of writing, such protocols have been suggested for
inclusion in the proposed Public Health Bill. The protocols outlined in the Bill relate to all matters of public health, of which recreational water quality is one.
PART I: THE FRAMEWORK FOR MONITORING RECREATIONAL WATER QUALITY. June 2003
B2
When developing the protocols, consideration should be given to the expertise and resourcing generally held within the regional councils, territorial local authorities and by the Medical Officers of Health. For example, Medical Officers of Health have expertise in the implementation of health regimes, and regional councils generally have the technical expertise in water issues.
These protocols should detail who is responsible for each of the roles (i to ix) outlined in B.2, and copies should be held by each of the participating agencies. Protocols may also be needed when reviewing an event, or to justify actions during an event. In extreme circumstances they may be necessary as supporting material for litigation.
B.4 Abating the nuisance
Investigating, identifying and remedying a nuisance should be based on the expertise within the agencies and the functions of these agencies within their jurisdiction. How the problem is mitigated is at the discretion of the council, although the course of action taken should meet the approval of the Medical Officer of Health.
The guidelines do not specify that the cause of failure to meet the specified levels must be rectified. They merely require that the public is informed when beaches are not suitable for contact recreation. However, once a problem is identified, many councils – and, indeed, the public – will want it fixed. Some causes (e.g. broken sewers, illegal sewer–stormwater connections) are easier to fix than others, but are still difficult. Aged stormwater systems and rural run-off will require long-term planning and solutions, and may never be fully fixed. In these situations the territorial local authorities, regional councils and Medical Officer of Health may develop a strategy for reducing or eliminating the problem.
B.5 Legal implications
Failure to notify the public of a known health risk, which then results in damage to members of the public, may lead to legal action being taken against the agency responsible (regional council, territorial local authority or Medical Officer of Health) by affected groups or individuals.
All agencies involved in monitoring water quality should be aware of their legal obligation to protect the public health, and that failure to meet these obligations may result in legal action. Legal action can be avoided by notifying the public as soon as a health risk is identified.
PART I: THE FRAMEWORK FOR MONITORING RECREATIONAL WATER QUALITY. June 2003
B3
Part II:
Guidelines
for Recreational
Water Quality
SECTION C: How Do We Develop Guideline Values?
C.1 The overall approach
The principle of using guideline values is simple: we measure the level of ‘faecal indicator organisms’, which do not necessarily cause disease themselves but signal the potential presence of disease-causing organisms. Guideline values of faecal indicator organisms such as enterococci have been used successfully for a long time in recreational waters. However, there are still questions about the effectiveness of this approach for monitoring and measuring water quality, and a number of environmental and physical factors may influence the usefulness of faecal bacteria as indicators.
The main constraints to the approach used in current guidelines are as follows:
•
•
•
Management actions are retrospective – they can be deployed only after human exposure to the hazard.
While beaches may be designated as suitable or unsuitable for recreational activities, there is in fact a gradient of increasing severity, variety and frequency of health effects with increasing sewage pollution. It is therefore desirable to promote incremental improvements or prevention, prioritising ‘worst features’, to achieve cost-effective intervention.
Although enterococci have been identified as having the best relationship with health effects in marine waters, they may also be derived from other than faecal sources in some conditions.3
3 Such conditions as sub-tropical temperatures and the influence of
mangrove swamps and freshwater run-off from dense vegetation have been identified in parts of New Zealand.
PART II: GUIDELINES FOR RECREATIONAL WATER QUALITY. June 2003
C1
•
Many New Zealand recreational sites are at estuaries, where historical results from both Escherichia coli (E. coli) (as the preferred indicator for freshwater faecal contamination) and enterococci are required for an assessment of health risk.
Such constraints to the use of guideline values are not confined to New Zealand. In November 1998 a group of experts from the WHO, the Commission of the European Communities and the United States Environmental Protection Agency (USEPA) met in Annapolis, USA, to consider ways to address such anomalies and constraints. The experts agreed that an improved approach to regulating recreational water that better reflected health risk and provided enhanced scope for effective management intervention was necessary – and feasible. The resulting approach has become known as the ‘Annapolis Protocol’. Published in 1999, it covers approaches involving both an environmental hazard assessment and a microbiological water quality assessment.
See Note G(x) for further details on the Annapolis Protocol.
The Ministry for the Environment responded by establishing the Marine Bathing Working Group in 1999 as a consultation of interested parties to investigate the application of an ‘Annapolis’ approach to New Zealand conditions. The approach has been modified after consultation and trial during the 2001 bathing season. It has also been modified to incorporate updates from the WHO contained in their publications Bathing Water Quality and Human Health: Protection of the human environment water, sanitation and health (WHO 2001) and Guidelines for Safe Recreational Water Environments: Volume 1 Coastal and Freshwaters4 (WHO 2003), and as such is incorporated as part of these guidelines.
4 A copy of this report can be downloaded from the WHO website
www.who.int.
This approach has also been applied in the development of the freshwater guidelines, for which the Ministry for the Environment established the Freshwater Guidelines Advisory Group. The freshwater guidelines were trialled over the 2003 bathing season, and have been updated in light of feedback.
C.2 The framework
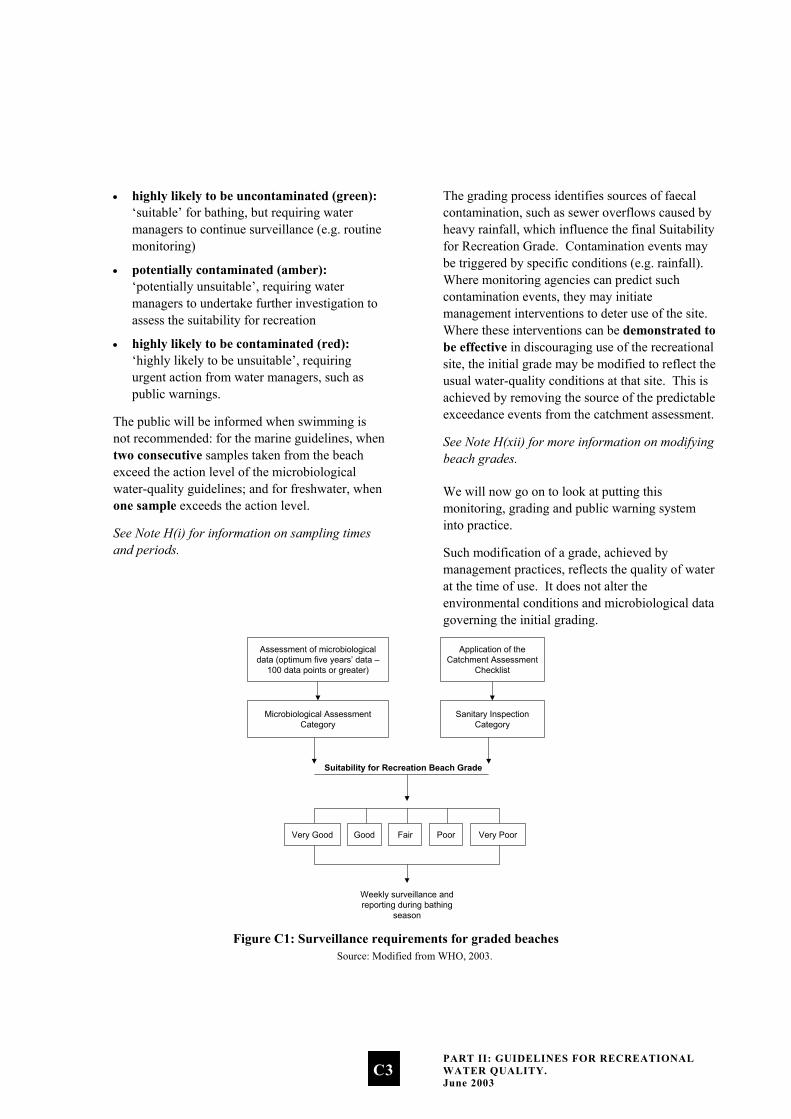
The framework used in these guidelines is a combination of catchment risk grading and single samples to assess suitability for recreation. This is a move away from the sole use of quantitative ‘guideline’ values of faecal indicator bacteria towards a qualitative ranking of faecal loading in a recreational water environment, supported by direct measurement of appropriate faecal indicators. The framework is summarised in Figure C1.
An explanation of all the features of this framework, including the Catchment Assessment Checklist (used to derive the Sanitary Inspection Category), the Microbiological Assessment Category and the Sanitary Inspection Category, will be given when we look in Part II at setting out to grade a beach. For the moment we are focusing on the final result of this process – the Suitability for Recreation Beach Grade.
This grade provides an indication of the general condition of a beach. The risk of becoming sick from swimming at a beach increases as the beach grading shifts from Very Good to Very Poor.
Conditions affecting water quality vary for the middle range of beach grades (Good, Fair and Poor). For example, ‘Good’ beaches usually comply with the guidelines, but events such as high rainfall increase the risk of contamination levels from run-off.
Weekly monitoring should be carried out during the bathing season for these middle-range beaches. For beaches where routine monitoring will be ongoing during the bathing season, the three-tier system applies, analogous to traffic lights:
PART II: GUIDELINES FOR RECREATIONAL WATER QUALITY. June 2003
C2
highly likely to be uncontaminated (green): ‘suitable’ for bathing, but requiring water managers to continue surveillance (e.g. routine monitoring)
•
•
•
potentially contaminated (amber): ‘potentially unsuitable’, requiring water managers to undertake further investigation to assess the suitability for recreation
highly likely to be contaminated (red): ‘highly likely to be unsuitable’, requiring urgent action from water managers, such as public warnings.
The public will be informed when swimming is not recommended: for the marine guidelines, when two consecutive samples taken from the beach exceed the action level of the microbiological water-quality guidelines; and for freshwater, when one sample exceeds the action level.
See Note H(i) for information on sampling times and periods.
The grading process identifies sources of faecal contamination, such as sewer overflows caused by heavy rainfall, which influence the final Suitability for Recreation Grade. Contamination events may be triggered by specific conditions (e.g. rainfall). Where monitoring agencies can predict such contamination events, they may initiate management interventions to deter use of the site. Where these interventions can be demonstrated to be effective in discouraging use of the recreational site, the initial grade may be modified to reflect the usual water-quality conditions at that site. This is achieved by removing the source of the predictable exceedance events from the catchment assessment.
See Note H(xii) for more information on modifying beach grades.
We will now go on to look at putting this monitoring, grading and public warning system into practice.
Such modification of a grade, achieved by management practices, reflects the quality of water at the time of use. It does not alter the environmental conditions and microbiological data governing the initial grading.
Assessment of microbiologicaldata (optimum five years’ data –
100 data points or greater)
Application of theCatchment Assessment
Checklist
Microbiological AssessmentCategory
Sanitary InspectionCategory
Suitability for Recreation Beach Grade
Very Good Good Fair Poor Very Poor
Weekly surveillance andreporting during bathing
season Figure C1: Surveillance requirements for graded beaches
Source: Modified from WHO, 2003.
PART II: GUIDELINES FOR RECREATIONAL WATER QUALITY. June 2003
C3

SECTION D: Microbiological Guidelines for Marine Waters
The framework in these guidelines uses both beach grading and guideline values. Beach grades provide the basic means to assess suitability for recreation over time, using a combination of knowledge of beach catchment characteristics and microbiological information gathered over previous years. Single sample results are compared against guideline values, to help water managers determine when management intervention is required. The guideline values that have been decided on are summarised in D.5.
D.1 Designation of a contact recreation area
People are generally free to swim wherever they like around New Zealand’s many beaches, but it would be impossible to monitor them all. Criteria for identifying which beaches to monitor will vary from region to region, but will generally be based on usage, available information and the resources available to the monitoring authority. The Ministry for the Environment and Ministry of Health recommend that the beaches to be included in the monitoring programme be agreed by all agencies involved in the programme and documented in the regional protocol.
D.2 Sampling beach water
The following information is provided to help develop a sampling programme for monitoring beaches.
Sampling period
Samples should be collected during the bathing season, or when the water body is used for contact recreation. The bathing season will vary according to location, but will generally extend from 1 November to 31 March. Sampling should take place between 8 am and 6 pm.
See Note H(i) for details on sampling times and periods.
Bacteriological indicators, catchment assessment and single samples
For marine water the preferred indicator is enterococci. The New Zealand Marine Bathing Study showed that enterococci are the indicator most closely correlated with health effects in New Zealand marine waters, confirming a pattern seen in a number of overseas studies (as reviewed by Prüss 1998). Faecal coliforms and E. coli were not as well correlated with health risks, although they may be used as an indicator in addition to enterococci in environmental conditions where enterococci levels alone may be misleading.5 (See Appendix 2 for a detailed report on the development of indicators internationally.)
E. coli rather than enterococci should be used as an indicator wherever the primary source of faecal contamination is a waste stabilisation pond (WSP). Enterococci are damaged in WSPs (Davies-Colley et al 1999), whereas faecal coliforms that emerge from a pond appear to be more sunlight resistant than those that enter it (Sinton et al 1999). Thus WSP enterococci are inactivated in receiving water faster than WSP faecal coliforms (Sinton et al 2002).
5 Estuarine and brackish waters may require a combination of both
indicators, identified through the catchment assessment.
PART II: GUIDELINES FOR RECREATIONAL WATER QUALITY. June 2003
D1
Type of sampling programme
The guidelines recommend a systematic random-sampling regime. Generally this means samples should be collected weekly, regardless of the weather. There may be exceptions if conditions present a health and safety hazard, in which case samples should be collected as soon after the programmed time as possible.
Sampling depth
Samples should be collected at approximately 15 cm below the surface at a point where the depth of the water is approximately 0.5 metres (based on data in McBride, Salmond, et al 1998).
See Note H(ii) for techniques for taking and analysing samples.
D.3 Grading a beach
The results obtained from weekly sampling under a monitoring programme are only one aspect of the process. We also need to grade the beach we are monitoring. There are two components to grading beaches:
the Sanitary Inspection Category (SIC), which generates a measure of the susceptibility of a water body to faecal contamination
•
• historical microbiological results, which generate a Microbiological Assessment Category (MAC). This provides a measurement of the actual water quality over time.
The two combined give an overall Suitability for Recreation Grade (SFRG), which describes the general condition of a site at any given time, based on both risk and indicator bacteria counts. The SIC, MAC and SFRG are explained below.
Note: Whereas before the guidelines were not applicable where a beach received treated sewage, the grading system now allows an assessment of the health risk present at a beach (via the Sanitary Inspection Category) after evaluating the effectiveness of the treatment processes.
Assessing a beach
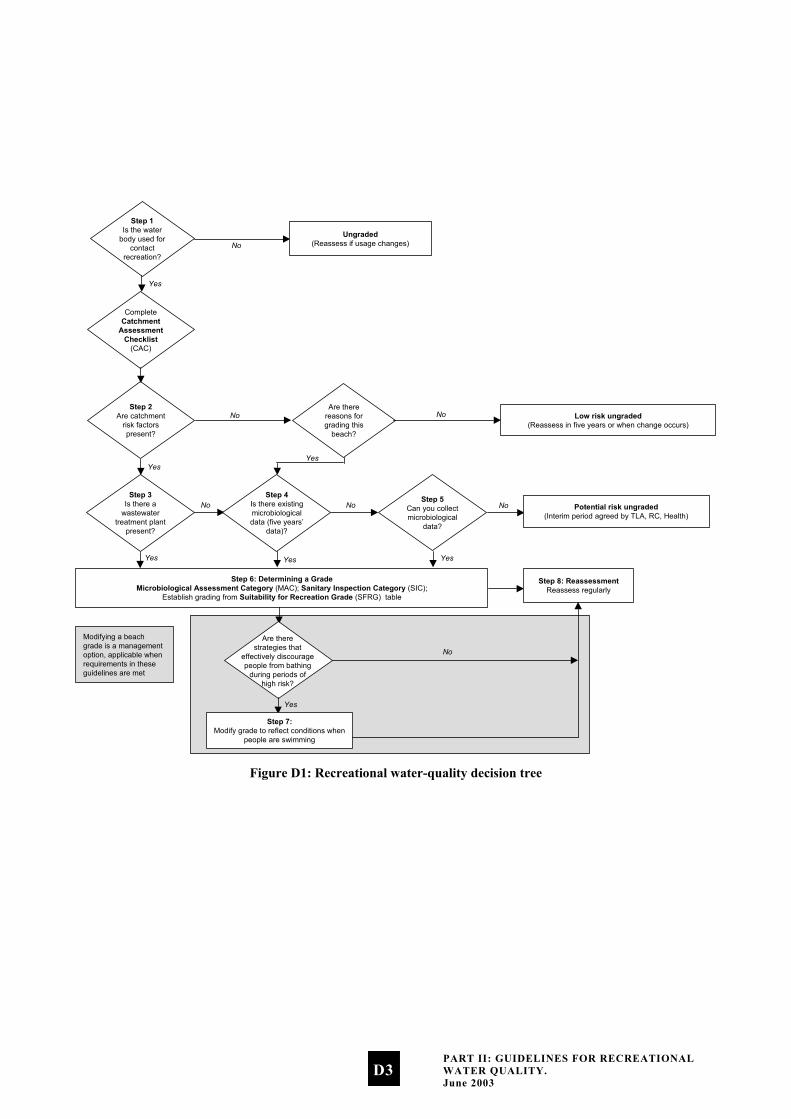
The recreational water-quality decision tree (Figure D1) outlines the process that will lead to grading a beach. All beaches will have to go through this process, which helps to identify the information needed in order to grade a site.
Collecting background information
As much information as is feasible about the site should be collected to make the assessment of risk-contributing factors as accurate as possible. Sources of information will vary from region to region. Gathering this information may involve a range of agencies (health, water and sewerage industries; district, city, regional councils), which will have access to different information for the same beach catchment. Relevant information includes drainage plans, site maps, previous season’s monitoring results, and consent applications.
The purpose of the decision tree is to provide a logical course that allows the responsible authority to make defensible decisions on whether or not to grade a particular water body.
PART II: GUIDELINES FOR RECREATIONAL WATER QUALITY. June 2003
D2
Step 1Is the water
body used forcontact
recreation?
CompleteCatchment
AssessmentChecklist
(CAC)
Step 2Are catchment
risk factorspresent?
Step 3Is there a
wastewatertreatment plant
present?
Step 6: Determining a GradeMicrobiological Assessment Category (MAC); Sanitary Inspection Category (SIC);
Establish grading from Suitability for Recreation Grade (SFRG) table
Yes
Yes
Yes
Are therereasons forgrading this
beach?
Low risk ungraded(Reassess in five years or when change occurs)
Ungraded(Reassess if usage changes)No
No No
No
Yes
NoStep 5
Can you collectmicrobiological
data?
No Potential risk ungraded(Interim period agreed by TLA, RC, Health)
Yes
Step 8: ReassessmentReassess regularly
Yes
Step 4Is there existingmicrobiologicaldata (five years’
data)?
Yes
Step 7:Modify grade to reflect conditions when
people are swimming
No
Are therestrategies that
effectively discouragepeople from bathing
during periods ofhigh risk?
Modifying a beachgrade is a managementoption, applicable whenrequirements in theseguidelines are met
Figure D1: Recreational water-quality decision tree
PART II: GUIDELINES FOR RECREATIONAL WATER QUALITY. June 2003
D3
The following notes describe the process and decisions required to complete each of the steps described in Figure D1.
Step 1: Is the water body used for contact recreation?
Beaches are considered either contact recreation areas (well used) or not contact recreation areas (not well used). The guidelines apply to contact recreation areas, and involve grading and monitoring.
This does not mean water quality can be allowed to deteriorate at ungraded beaches. Rather, it is expected that the guidelines will be rigorously applied at graded beaches, while the monitoring required and associated costs may not be justified at ungraded beaches.
Which beaches are monitored will be a local decision, and should be decided on a site-specific basis by the local authorities (regional or local authority, or Medical Officer of Health) depending on the local relevance of the site.
Step 2: Are catchment risk factors present?
The ‘risk factors’ refer to activities in the catchment that may result in faecal contamination of a recreational water site. To assess the catchment risk factors, the Catchment Assessment Checklist should be completed.
See Note H(iv) for the Catchment Assessment Checklist for marine recreational waters.
‘Yes’ responses to the ‘Microbiological Hazards’ (Part D) section of the checklist show the presence of catchment risk factors that affect, or are likely to affect, recreational water quality.
Step 3: Is there a wastewater treatment plant present?
Wastewater treatment processes often effectively reduce microbial indicators such as enterococci but are less effective at removing pathogens such as viruses. The result may be an altered pathogen-to-indicator ratio compared to that of untreated waste. This means that if there is a wastewater treatment plant present, pathogens may still be present even when indicator levels are very low.
See Note H(iii) for Catchment Assessment Checklist Base Conditions – discussion on risk assessment for tertiary treated effluent.
A ‘Yes’ answer in this box means the wastewater treatment plant discharges directly to the recreational water, or to an area where discharge water may reasonably be expected to be carried to a recreational water site by tides, currents or streams.
Step 4: Is there existing microbiological data?
Ideally there should be 100 data points6 or greater collected over the previous five years, although it is feasible to consider grading with a minimum of 20 data points collected over one full bathing season. The data should normally be on enterococci. The grading should be considered as interim until five years of data have been collected.
Note: Follow-up samples from an alert or action mode response should not be included in the data used to generate an MAC (see Step 6). If using the software provided by the Ministry for the Environment to generate grades, follow-up samples should be manually removed from the dataset.
See Note H(xv) for details on the software available to analyse results.
6 Data points are the results of samples collected.
PART II: GUIDELINES FOR RECREATIONAL WATER QUALITY. June 2003
D4
Step 5: Can you collect microbiological data?
If microbiological data is required, the sampling programme should collect at least 20 data points over the period of greatest recreational use. This will normally be the summer bathing season, but may vary with the types of recreational activity most common in the area.
Step 6: Determining a grade
In order to grade a recreational water body, the authority must establish:
•
•
the Microbiological Assessment Category (MAC): an MAC category (ranging from A to D) is established from the existing or collected microbiological data; definitions for the different categories are given in Table D1.
the Sanitary Inspection Category (SIC): this category is either Very High, High, Moderate, Low or Very Low, and is determined for a specific water body by using the SIC flow chart.
See Note H(iv) for the Sanitary Inspection Category flow chart for marine waters.
The information for using the flow chart should come from the Catchment Assessment Checklist (CAC), Part D, and may require further investigation to establish the principal source of contamination.
Determining a grade involves using both the MAC and the SIC (see Table D2). A grade is established on the basis of five years’ data. Thereafter recalculation of the grade may be done annually using the previous five years’ data.
Step 7: Modifying a grade
Modifying a beach grade is a management option, applicable when requirements in these guidelines have been met.
Beach grades may be modified where management interventions can be demonstrated to effectively discourage recreational use during occasional and predictable contamination events. The modified grade should reflect the water – quality conditions the public are usually exposed to, and be verified by the Medical Officer of Health.
See Note H(xii) for more information on modifying beach grades.
Step 8: Reassessment
Reassess on a five-yearly basis, or sooner if significant change occurs. Such changes will be reflected in new information in parts A, B, C and D of the Catchment Assessment Checklist. Examples of significant change would be:
altered catchment characteristics or land use •
•
•
significantly higher or lower microbiological indicator levels
major infrastructure works affecting water-quality parameters.
Beaches graded Very Good will almost always comply with the guideline values for recreation, and there are few sources of faecal contamination in the catchment. Consequently there is a low risk of illness from bathing. Beaches graded Very Poor are in catchments with significant sources of faecal contamination, and they rarely pass the guidelines. The risk of illness from bathing at these beaches is high, and swimming is not recommended. For the remaining beaches (Good, Fair and Poor) it is recommended that weekly monitoring be carried out during the bathing season. The public will be informed when guideline values are exceeded and swimming is not recommended.
The following table lists the criteria that define the Microbiological Assessment Category (MAC), based on five years’ historical data.
PART II: GUIDELINES FOR RECREATIONAL WATER QUALITY. June 2003
D5
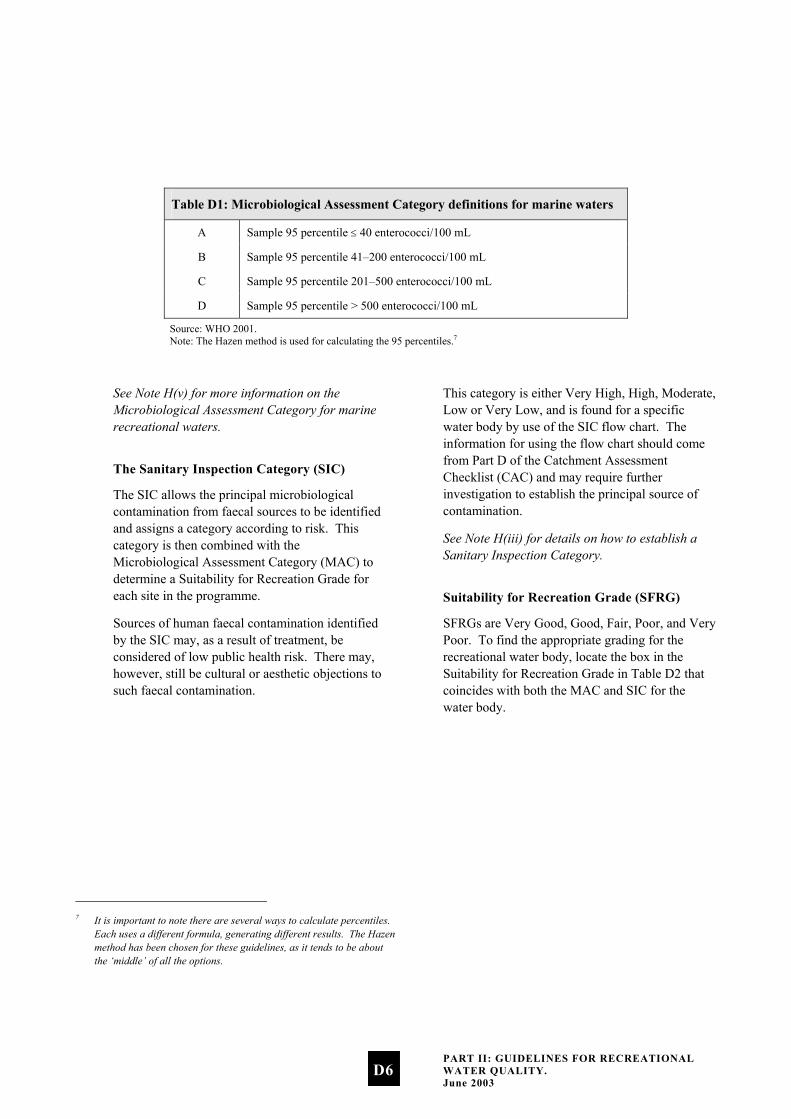
Table D1: Microbiological Assessment Category definitions for marine waters
A Sample 95 percentile ≤ 40 enterococci/100 mL
B Sample 95 percentile 41–200 enterococci/100 mL
C Sample 95 percentile 201–500 enterococci/100 mL
D Sample 95 percentile > 500 enterococci/100 mL
Source: WHO 2001. Note: The Hazen method is used for calculating the 95 percentiles.7
7 It is important to note there are several ways to calculate percentiles.
Each uses a different formula, generating different results. The Hazen method has been chosen for these guidelines, as it tends to be about the ‘middle’ of all the options.
See Note H(v) for more information on the Microbiological Assessment Category for marine recreational waters.
The Sanitary Inspection Category (SIC)
The SIC allows the principal microbiological contamination from faecal sources to be identified and assigns a category according to risk. This category is then combined with the Microbiological Assessment Category (MAC) to determine a Suitability for Recreation Grade for each site in the programme.
Sources of human faecal contamination identified by the SIC may, as a result of treatment, be considered of low public health risk. There may, however, still be cultural or aesthetic objections to such faecal contamination.
This category is either Very High, High, Moderate, Low or Very Low, and is found for a specific water body by use of the SIC flow chart. The information for using the flow chart should come from Part D of the Catchment Assessment Checklist (CAC) and may require further investigation to establish the principal source of contamination.
See Note H(iii) for details on how to establish a Sanitary Inspection Category.
Suitability for Recreation Grade (SFRG)
SFRGs are Very Good, Good, Fair, Poor, and Very Poor. To find the appropriate grading for the recreational water body, locate the box in the Suitability for Recreation Grade in Table D2 that coincides with both the MAC and SIC for the water body.
PART II: GUIDELINES FOR RECREATIONAL WATER QUALITY. June 2003
D6
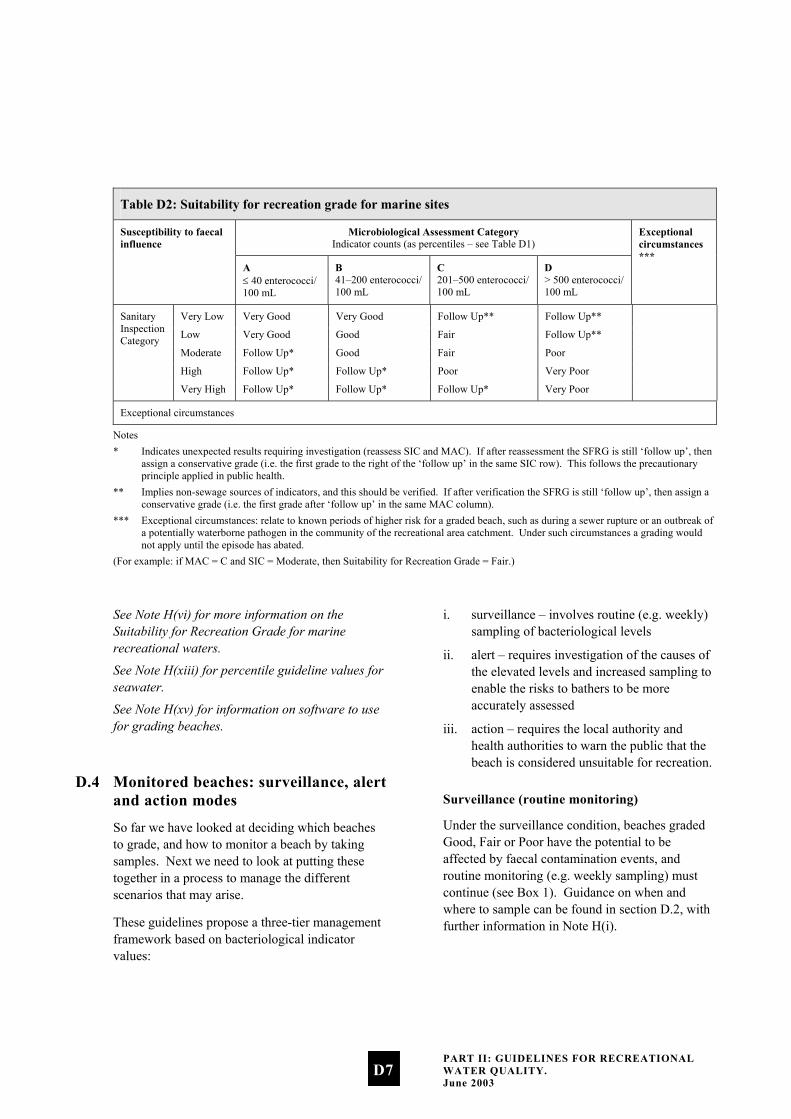
Table D2: Suitability for recreation grade for marine sites
Microbiological Assessment Category Indicator counts (as percentiles – see Table D1)
Susceptibility to faecal influence
A ≤ 40 enterococci/ 100 mL
B 41–200 enterococci/ 100 mL
C 201–500 enterococci/ 100 mL
D > 500 enterococci/ 100 mL
Exceptional circumstances ***
Very Low Very Good Very Good Follow Up** Follow Up**
Low Very Good Good Fair Follow Up**
Moderate Follow Up* Good Fair Poor
High Follow Up* Follow Up* Poor Very Poor
Sanitary Inspection Category
Very High Follow Up* Follow Up* Follow Up* Very Poor
Exceptional circumstances
Notes * Indicates unexpected results requiring investigation (reassess SIC and MAC). If after reassessment the SFRG is still ‘follow up’, then
assign a conservative grade (i.e. the first grade to the right of the ‘follow up’ in the same SIC row). This follows the precautionary principle applied in public health.
** Implies non-sewage sources of indicators, and this should be verified. If after verification the SFRG is still ‘follow up’, then assign a conservative grade (i.e. the first grade after ‘follow up’ in the same MAC column).
*** Exceptional circumstances: relate to known periods of higher risk for a graded beach, such as during a sewer rupture or an outbreak of a potentially waterborne pathogen in the community of the recreational area catchment. Under such circumstances a grading would not apply until the episode has abated.
(For example: if MAC = C and SIC = Moderate, then Suitability for Recreation Grade = Fair.)
See Note H(vi) for more information on the Suitability for Recreation Grade for marine recreational waters.
See Note H(xiii) for percentile guideline values for seawater.
See Note H(xv) for information on software to use for grading beaches.
D.4 Monitored beaches: surveillance, alert and action modes
So far we have looked at deciding which beaches to grade, and how to monitor a beach by taking samples. Next we need to look at putting these together in a process to manage the different scenarios that may arise.
These guidelines propose a three-tier management framework based on bacteriological indicator values:
i. surveillance – involves routine (e.g. weekly) sampling of bacteriological levels
ii. alert – requires investigation of the causes of the elevated levels and increased sampling to enable the risks to bathers to be more accurately assessed
iii. action – requires the local authority and health authorities to warn the public that the beach is considered unsuitable for recreation.
Surveillance (routine monitoring)
Under the surveillance condition, beaches graded Good, Fair or Poor have the potential to be affected by faecal contamination events, and routine monitoring (e.g. weekly sampling) must continue (see Box 1). Guidance on when and where to sample can be found in section D.2, with further information in Note H(i).
PART II: GUIDELINES FOR RECREATIONAL WATER QUALITY. June 2003
D7
Alert (amber) mode: single samples
The alert mode is triggered when a single bacteriological sample exceeds a predetermined value. Under alert mode, sampling frequency should be increased to daily, and catchment assessment data referred to for potential faecal sources. A sanitary survey should then be undertaken to positively identify the sources of contamination and the potential management options.
See Note H(iv) for the Sanitary Inspection Category flow chart for marine recreational waters.
Action (red) mode: consecutive samples
The action mode is triggered when two consecutive single samples (within 24 hours) exceed a pre-determined value (see Box 1 for guideline values). Under the action mode, the local authority and health authorities warn the
public, using appropriate methods, that the beach is unsuitable for recreation and arrange for the local authority to erect signs at the beach warning the public of a health danger.
See Note H(xvi) for information on reporting to the public.
See Note H(xvii) for management responses to exceedances.
D.5 Marine bathing surveillance, alert and action levels
The marine bathing guidelines are summarised in Box 1 . They are based on keeping illness risks associated with recreational water use to less than about 2%.
See Appendix 2 for details on how guideline values have been developed.
PART II: GUIDELINES FOR RECREATIONAL WATER QUALITY. June 2003
D8
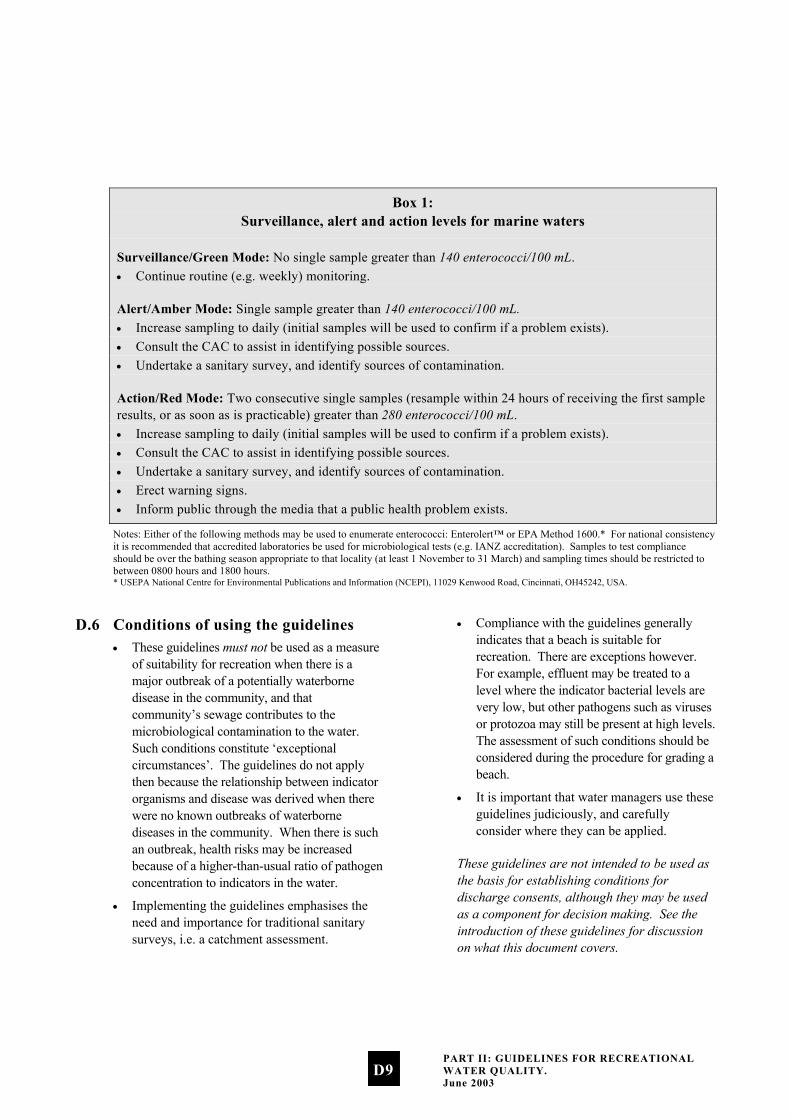
Box 1: Surveillance, alert and action levels for marine waters
Surveillance/Green Mode: No single sample greater than 140 enterococci/100 mL. • Continue routine (e.g. weekly) monitoring.
Alert/Amber Mode: Single sample greater than 140 enterococci/100 mL. • Increase sampling to daily (initial samples will be used to confirm if a problem exists). • Consult the CAC to assist in identifying possible sources. • Undertake a sanitary survey, and identify sources of contamination.
Action/Red Mode: Two consecutive single samples (resample within 24 hours of receiving the first sample results, or as soon as is practicable) greater than 280 enterococci/100 mL. • Increase sampling to daily (initial samples will be used to confirm if a problem exists). • Consult the CAC to assist in identifying possible sources. • Undertake a sanitary survey, and identify sources of contamination. • Erect warning signs. • Inform public through the media that a public health problem exists.
Notes: Either of the following methods may be used to enumerate enterococci: Enterolert™ or EPA Method 1600.* For national consistency it is recommended that accredited laboratories be used for microbiological tests (e.g. IANZ accreditation). Samples to test compliance should be over the bathing season appropriate to that locality (at least 1 November to 31 March) and sampling times should be restricted to between 0800 hours and 1800 hours. * USEPA National Centre for Environmental Publications and Information (NCEPI), 11029 Kenwood Road, Cincinnati, OH45242, USA.
D.6 Conditions of using the guidelines
•
•
•
•
These guidelines must not be used as a measure of suitability for recreation when there is a major outbreak of a potentially waterborne disease in the community, and that community’s sewage contributes to the microbiological contamination to the water. Such conditions constitute ‘exceptional circumstances’. The guidelines do not apply then because the relationship between indicator organisms and disease was derived when there were no known outbreaks of waterborne diseases in the community. When there is such an outbreak, health risks may be increased because of a higher-than-usual ratio of pathogen concentration to indicators in the water.
Implementing the guidelines emphasises the need and importance for traditional sanitary surveys, i.e. a catchment assessment.
Compliance with the guidelines generally indicates that a beach is suitable for recreation. There are exceptions however. For example, effluent may be treated to a level where the indicator bacterial levels are very low, but other pathogens such as viruses or protozoa may still be present at high levels. The assessment of such conditions should be considered during the procedure for grading a beach.
It is important that water managers use these guidelines judiciously, and carefully consider where they can be applied.
These guidelines are not intended to be used as the basis for establishing conditions for discharge consents, although they may be used as a component for decision making. See the introduction of these guidelines for discussion on what this document covers.
PART II: GUIDELINES FOR RECREATIONAL WATER QUALITY. June 2003
D9

SECTION E: Microbiological Guidelines for Freshwaters
The framework in these guidelines uses both beach grading and guideline values. Beach grades provide the basic means to assess suitability for recreation over time, using a combination of knowledge of beach catchment characteristics and microbiological information gathered over previous years. Single-sample results are compared against guideline values, to help water managers determine when management intervention is required. The guideline values that have been decided on are summarised in E.5.
Throughout this document the term ‘beach’ refers to both marine and freshwater recreational water sites.
E.1 Designation of a contact recreation area
People are generally free to swim wherever they like around New Zealand’s many beaches, but it would be impossible to monitor them all. Criteria for identifying which beaches to monitor will vary from region to region, but will generally be based on usage, available information and the resources available to the monitoring authority. The Ministry for the Environment and Ministry of Health recommend that the beaches to be included in the monitoring programme be agreed by all agencies involved in the programme and documented in the regional protocol.
E.2 Sampling rivers and lakes
The following information is provided to help develop a sampling programme for monitoring rivers and beaches.
Sampling period
Samples should be collected during the bathing season, or when the water body is used for contact recreation. For rivers this may exclude periods of high flow, during which hazardous river conditions would prohibit bathing. The bathing season will vary according to location, but will generally extend from 1 November to 31 March. Sampling should take place between 8 am and 6 pm.
See Note H(i) for details on sampling times and periods.
Bacteriological indicators, catchment assessment and single samples
The pathogens occurring in contaminated freshwater are the same as those occurring in marine waters, except that survival times in freshwater are likely to be longer, especially for protozoan cysts (e.g. Giardia and Cryptosporidium) and viruses. E. coli is the preferred indicator organism for freshwaters, although there may be exceptions (e.g. in proximity to large waste stabilisation pond outfalls). Enterococci should not be used because some enterococci can multiply from natural sources, such as the decay of leaf material. This means that enterococci levels can be very high even in pristine waters, but this may not necessarily indicate high levels of pathogens.
Type of sampling programme
The guidelines recommend a systematic random-sampling regime. Generally this means samples should be collected weekly, regardless of the weather. There may be exceptions if conditions present a health and safety hazard, in which case samples should be collected as soon after the programmed time as possible.
PART II: GUIDELINES FOR RECREATIONAL WATER QUALITY. June 2003
E1

Sampling depth
Samples should be taken at approximately 30 cm below the surface, where the depth of the water is approximately 1 metre.
See note H(ii) for techniques for taking and analysing samples.
E.3 Grading a freshwater site
The results we obtain from microbiological sampling under a monitoring programme are only one aspect of the process. We also need to grade the site we are monitoring. There are two components to grading freshwater sites:
the Sanitary Inspection Category (SIC),
which generates a measure of the susceptibility of a water body to faecal contamination
•
• historical microbiological results, which generate a Microbiological Assessment Category (MAC). This provides a measurement of the actual water quality over time.
The two combined give an overall Suitability for Recreation Grade (SFRG), which describes the general condition of a site at any given time, based on both risk and indicator bacteria counts. The SIC, MAC and SFRG are explained below.
Note: Whereas before the guidelines were not applicable where a site received treated sewage, the grading system now allows an assessment of the health risk present at a site after evaluating the effectiveness of the treatment processes.
Assessing a freshwater site
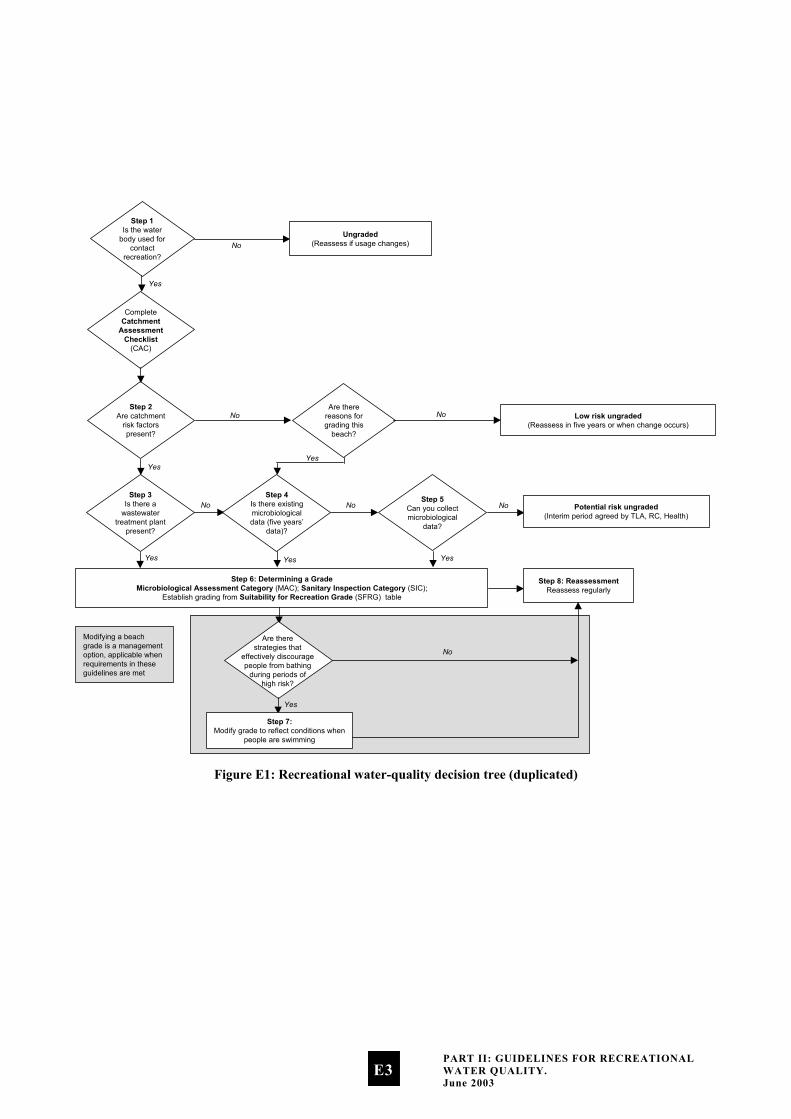
The recreational water-quality decision tree (Figure E1) and accompanying descriptions outline the process that will lead to grading a site. All freshwater sites will have to go through this process, which helps to identify the information needed in order to grade a site.
Collecting background information
As much information as is feasible about the site should be collected to make the assessment of risk-contributing factors as accurate as possible. Sources of information will vary from region to region. Gathering this information may involve a range of agencies (health, water and sewerage industries; district, city, regional councils), which will have access to different information for the same site catchment. Relevant information includes drainage plans, site maps, previous season’s monitoring results, and consent applications. The purpose of the decision tree is to provide a logical course that allows the responsible authority to make defensible decisions on whether or not to grade a particular water body. The following notes describe the process and decisions required to complete each of the steps described in Figure E1.
PART II: GUIDELINES FOR RECREATIONAL WATER QUALITY. June 2003
E2
Step 1Is the water
body used forcontact
recreation?
CompleteCatchment
AssessmentChecklist
(CAC)
Step 2Are catchment
risk factorspresent?
Step 3Is there a
wastewatertreatment plant
present?
Step 6: Determining a GradeMicrobiological Assessment Category (MAC); Sanitary Inspection Category (SIC);
Establish grading from Suitability for Recreation Grade (SFRG) table
Yes
Yes
Yes
Are therereasons forgrading this
beach?
Low risk ungraded(Reassess in five years or when change occurs)
Ungraded(Reassess if usage changes)No
No No
No
Yes
NoStep 5
Can you collectmicrobiological
data?
No Potential risk ungraded(Interim period agreed by TLA, RC, Health)
Yes
Step 8: ReassessmentReassess regularly
Yes
Step 4Is there existingmicrobiologicaldata (five years’
data)?
Yes
Step 7:Modify grade to reflect conditions when
people are swimming
No
Are therestrategies that
effectively discouragepeople from bathing
during periods ofhigh risk?
Modifying a beachgrade is a managementoption, applicable whenrequirements in theseguidelines are met
Figure E1: Recreational water-quality decision tree (duplicated)
PART II: GUIDELINES FOR RECREATIONAL WATER QUALITY. June 2003
E3
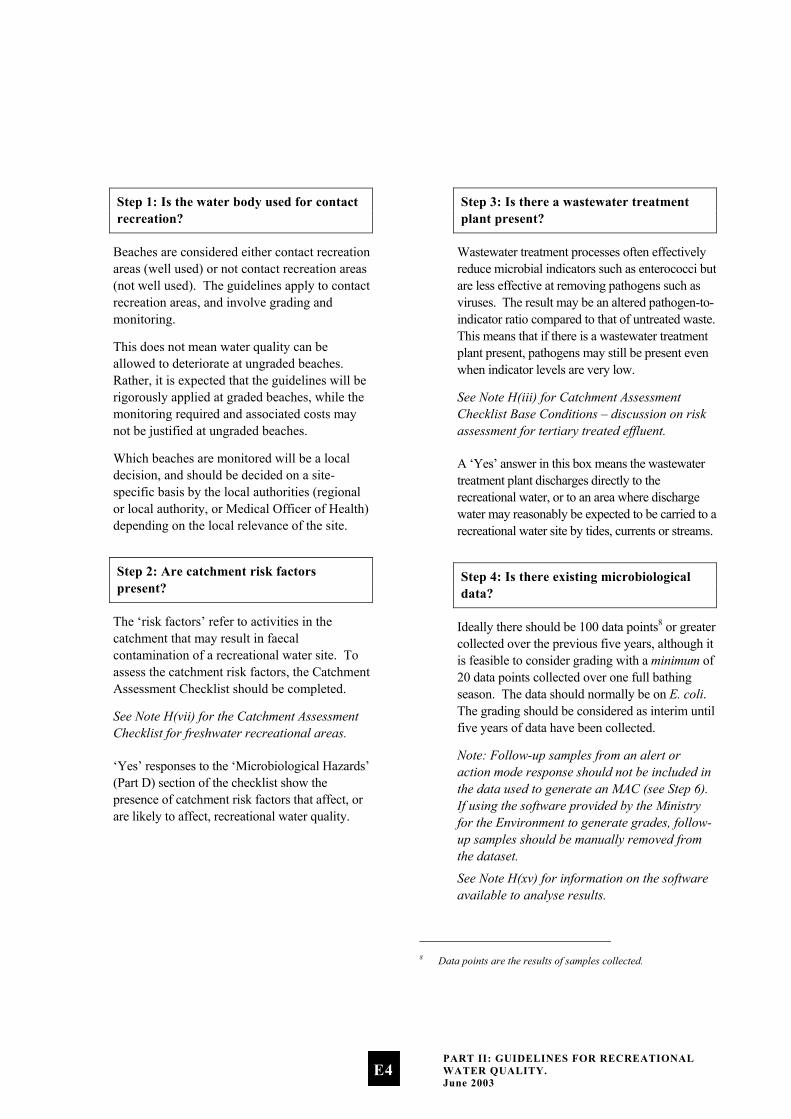
Step 1: Is the water body used for contact recreation?
Beaches are considered either contact recreation areas (well used) or not contact recreation areas (not well used). The guidelines apply to contact recreation areas, and involve grading and monitoring.
This does not mean water quality can be allowed to deteriorate at ungraded beaches. Rather, it is expected that the guidelines will be rigorously applied at graded beaches, while the monitoring required and associated costs may not be justified at ungraded beaches.
Which beaches are monitored will be a local decision, and should be decided on a site-specific basis by the local authorities (regional or local authority, or Medical Officer of Health) depending on the local relevance of the site.
Step 2: Are catchment risk factors present?
The ‘risk factors’ refer to activities in the catchment that may result in faecal contamination of a recreational water site. To assess the catchment risk factors, the Catchment Assessment Checklist should be completed.
See Note H(vii) for the Catchment Assessment Checklist for freshwater recreational areas.
‘Yes’ responses to the ‘Microbiological Hazards’ (Part D) section of the checklist show the presence of catchment risk factors that affect, or are likely to affect, recreational water quality.
Step 3: Is there a wastewater treatment plant present?
Wastewater treatment processes often effectively reduce microbial indicators such as enterococci but are less effective at removing pathogens such as viruses. The result may be an altered pathogen-to-indicator ratio compared to that of untreated waste. This means that if there is a wastewater treatment plant present, pathogens may still be present even when indicator levels are very low.
See Note H(iii) for Catchment Assessment Checklist Base Conditions – discussion on risk assessment for tertiary treated effluent.
A ‘Yes’ answer in this box means the wastewater treatment plant discharges directly to the recreational water, or to an area where discharge water may reasonably be expected to be carried to a recreational water site by tides, currents or streams.
Step 4: Is there existing microbiological data?
Ideally there should be 100 data points8 or greater collected over the previous five years, although it is feasible to consider grading with a minimum of 20 data points collected over one full bathing season. The data should normally be on E. coli. The grading should be considered as interim until five years of data have been collected.
Note: Follow-up samples from an alert or action mode response should not be included in the data used to generate an MAC (see Step 6). If using the software provided by the Ministry for the Environment to generate grades, follow-up samples should be manually removed from the dataset.
See Note H(xv) for information on the software available to analyse results.
8 Data points are the results of samples collected.
PART II: GUIDELINES FOR RECREATIONAL WATER QUALITY. June 2003
E4
Step 5: Can you collect microbiological data?
If microbiological data is required, the sampling programme should collect at least 20 data points over the period of greatest recreational use. This will normally be the summer bathing season, but may vary with the types of recreational activity most common in the area.
Step 6: Determining a grade
In order to grade a recreational water body, the authority must establish:
•
•
the Microbiological Assessment Category (MAC): an MAC category (ranging from A to D) is established from the existing or collected microbiological data; definitions for the different categories are given in Table E1.
the Sanitary Inspection Category (SIC): this category is either Very High, High, Moderate, Low or Very Low, and is determined for a specific water body by using the SIC flow chart.
See Note H(vii) for the Sanitary Inspection Category flow charts for rivers and lakes.
The information for using the flow chart should come from the Catchment Assessment Checklist (CAC), Part D, and may require further investigation to establish the principal source of contamination.
Determining a grade involves using both the MAC and the SIC (see Table E2: Suitability for Recreation Grade matrix). A grade is established on the basis of five years’ data. Thereafter recalculation of the grade may be done annually using the previous five years’ data.
Step 7: Modifying a grade
Modifying a beach grade is a management option, applicable when requirements in these guidelines have been met.
Beach grades may be modified where management interventions can be demonstrated to effectively discourage recreational use during occasional and predictable contamination events. The modified grade should reflect the water quality conditions the public are usually exposed to, and be verified by the Medical Officer of Health.
See Note H(xii) for more information on modifying beach grades.
Step 8: Reassessment
Reassess on a five-yearly basis, or sooner if significant change occurs. Such changes will be reflected in new information in parts A, B, C and D of the Catchment Assessment Checklist. Examples of significant change would be:
altered catchment characteristics or land use •
•
•
significantly higher or lower microbiological indicator levels
major infrastructure works affecting water-quality parameters.
Beaches graded Very Good will almost always comply with the guideline values for recreation, and there are few sources of faecal contamination in the catchment. Consequently there is a low risk of illness from bathing. Beaches graded Very Poor are in catchments with significant sources of faecal contamination, and they rarely pass the guidelines. The risk of illness from bathing at these beaches is high, and swimming is not recommended. For the remaining beaches (Good, Fair and Poor) it is recommended that weekly monitoring be carried out during the bathing season. The public will be informed when guideline values are exceeded and swimming is not recommended.
The Microbiological Assessment Category
The following table lists the criteria that define the MAC, based on five years’ historical data.
PART II: GUIDELINES FOR RECREATIONAL WATER QUALITY. June 2003
E5
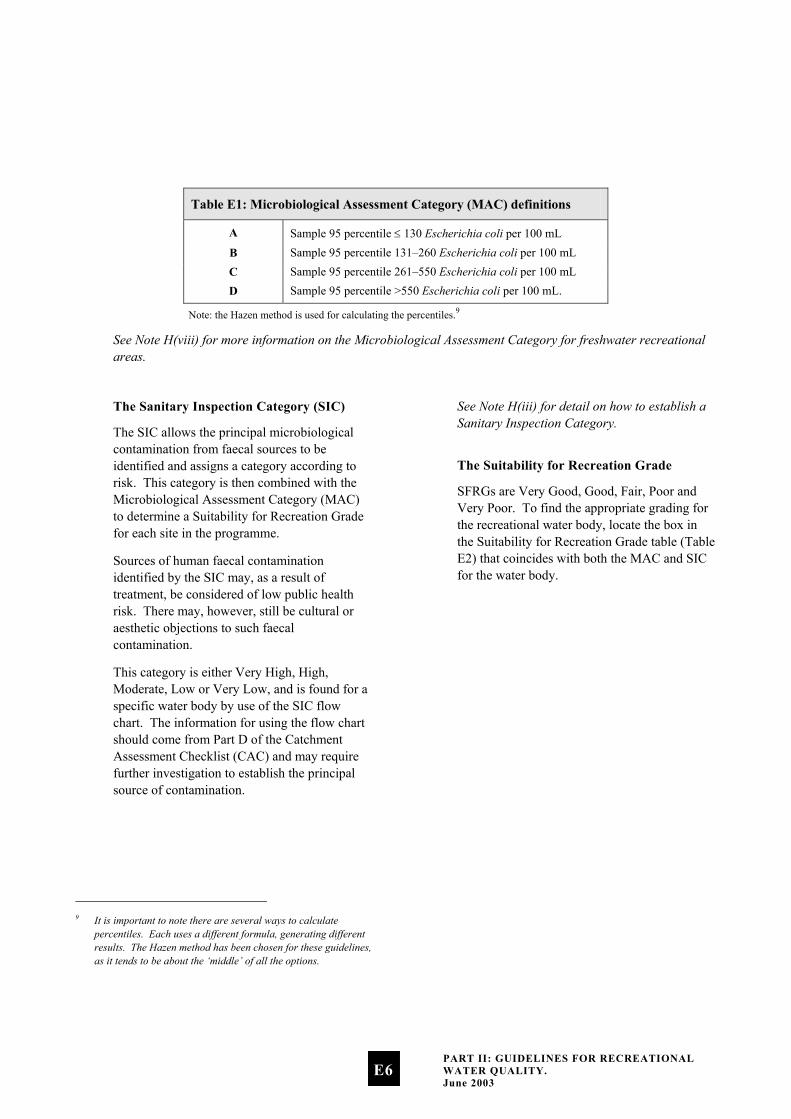
Table E1: Microbiological Assessment Category (MAC) definitions
A Sample 95 percentile ≤ 130 Escherichia coli per 100 mL
B Sample 95 percentile 131–260 Escherichia coli per 100 mL C Sample 95 percentile 261–550 Escherichia coli per 100 mL D Sample 95 percentile >550 Escherichia coli per 100 mL.
Note: the Hazen method is used for calculating the percentiles.9
See Note H(viii) for more information on the Microbiological Assessment Category for freshwater recreational areas.
9 It is important to note there are several ways to calculate
percentiles. Each uses a different formula, generating different results. The Hazen method has been chosen for these guidelines, as it tends to be about the ‘middle’ of all the options.
The Sanitary Inspection Category (SIC)
The SIC allows the principal microbiological contamination from faecal sources to be identified and assigns a category according to risk. This category is then combined with the Microbiological Assessment Category (MAC) to determine a Suitability for Recreation Grade for each site in the programme.
Sources of human faecal contamination identified by the SIC may, as a result of treatment, be considered of low public health risk. There may, however, still be cultural or aesthetic objections to such faecal contamination.
This category is either Very High, High, Moderate, Low or Very Low, and is found for a specific water body by use of the SIC flow chart. The information for using the flow chart should come from Part D of the Catchment Assessment Checklist (CAC) and may require further investigation to establish the principal source of contamination.
See Note H(iii) for detail on how to establish a Sanitary Inspection Category.
The Suitability for Recreation Grade
SFRGs are Very Good, Good, Fair, Poor and Very Poor. To find the appropriate grading for the recreational water body, locate the box in the Suitability for Recreation Grade table (Table E2) that coincides with both the MAC and SIC for the water body.
PART II: GUIDELINES FOR RECREATIONAL WATER QUALITY. June 2003
E6
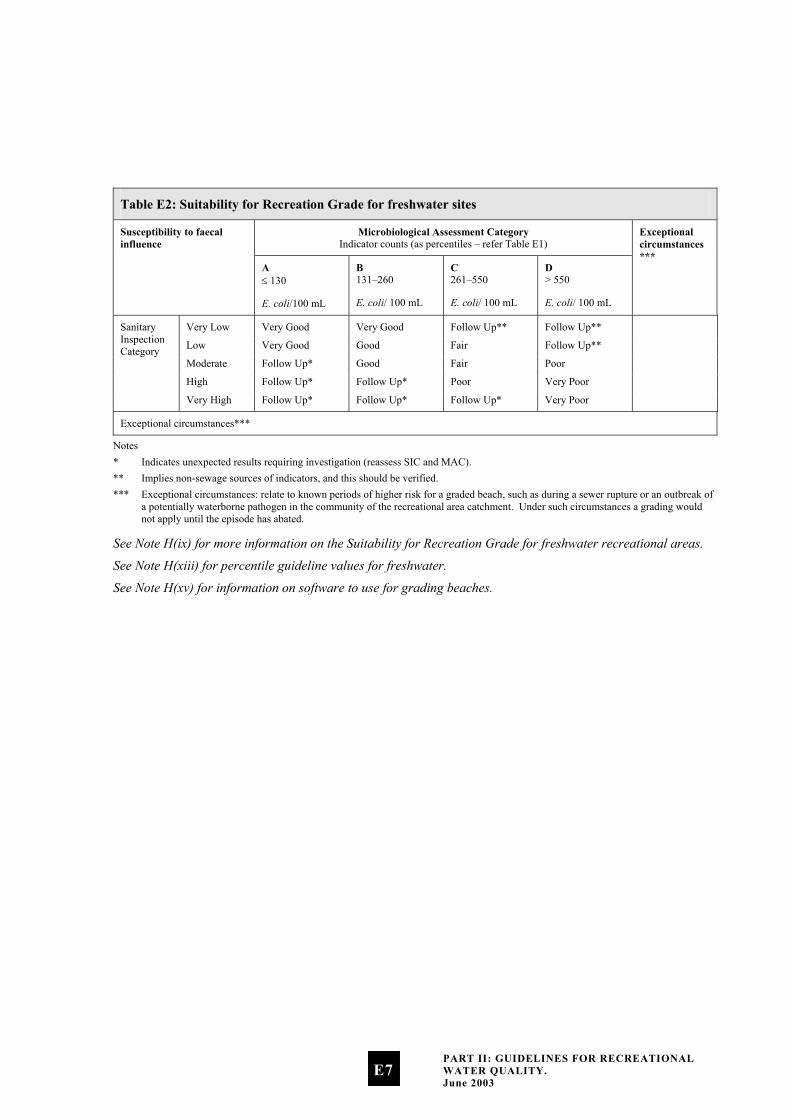
Table E2: Suitability for Recreation Grade for freshwater sites
Microbiological Assessment Category Indicator counts (as percentiles – refer Table E1)
Susceptibility to faecal influence
A ≤ 130
E. coli/100 mL
B 131–260
E. coli/ 100 mL
C 261–550
E. coli/ 100 mL
D > 550
E. coli/ 100 mL
Exceptional circumstances ***
Very Low Very Good Very Good Follow Up** Follow Up**
Low Very Good Good Fair Follow Up**
Moderate Follow Up* Good Fair Poor
High Follow Up* Follow Up* Poor Very Poor
Sanitary Inspection Category
Very High Follow Up* Follow Up* Follow Up* Very Poor
Exceptional circumstances***
Notes * Indicates unexpected results requiring investigation (reassess SIC and MAC). ** Implies non-sewage sources of indicators, and this should be verified. *** Exceptional circumstances: relate to known periods of higher risk for a graded beach, such as during a sewer rupture or an outbreak of
a potentially waterborne pathogen in the community of the recreational area catchment. Under such circumstances a grading would not apply until the episode has abated.
See Note H(ix) for more information on the Suitability for Recreation Grade for freshwater recreational areas.
See Note H(xiii) for percentile guideline values for freshwater.
See Note H(xv) for information on software to use for grading beaches.
PART II: GUIDELINES FOR RECREATIONAL WATER QUALITY. June 2003
E7
E.4 Monitored beaches: surveillance, alert and action modes
So far we have looked at deciding which beaches to grade, and how to monitor a beach by taking samples. Next we need to look at putting these together in a process to manage the different scenarios that may arise.
These guidelines propose a three-tier management framework based on bacteriological indicator values:
i. surveillance – involves routine (e.g. weekly) sampling of bacteriological levels
ii. alert – requires investigation of the causes of the elevated levels and increased sampling to enable the risks to bathers to be more accurately assessed
iii. action – requires the local authority and health authorities to warn the public that the beach is considered unsuitable for recreation.
Surveillance (routine monitoring)
Under the surveillance condition, beaches graded Good, Fair or Poor have the potential to be affected by faecal contamination events, and routine monitoring (e.g. weekly sampling) must continue (see Box 2). Guidance on when and where to sample can be found in section E.2, with further information in Note H(i).
Alert (amber) mode: single samples
The alert mode is triggered when a single bacteriological sample exceeds a predetermined value. Under alert mode, sampling frequency should be increased to daily, and catchment assessment data referred to for potential faecal sources. A sanitary survey should then be undertaken to positively identify the sources of
contamination and the potential management options.
See Note H(vii) for the Sanitary Inspection Category flow charts for rivers and lakes.
Action (red) mode: consecutive samples
The action mode is triggered when a single sample exceeds a pre-determined value (see Box 2 for guideline values). Under the action mode, the local authority and health authorities warn the public, using appropriate methods, that the beach is unsuitable for recreation and arrange for the local authority to erect signs at the beach warning the public of a health danger.
See Note H(i) for discussion on sampling requirements.
See Note H(xvi) for information on reporting to the public.
See Note H(xvii) for management responses to exceedances.
E.5 Freshwater surveillance, alert and action levels
The surveillance, alert and action levels are summarised in Box 2. They are based on an estimate that approximately 5% of Campylobacter infections could be attributable to freshwater contact recreation.
See Appendix 2 for details on how guideline values have been developed.
PART II: GUIDELINES FOR RECREATIONAL WATER QUALITY. June 2003
E8
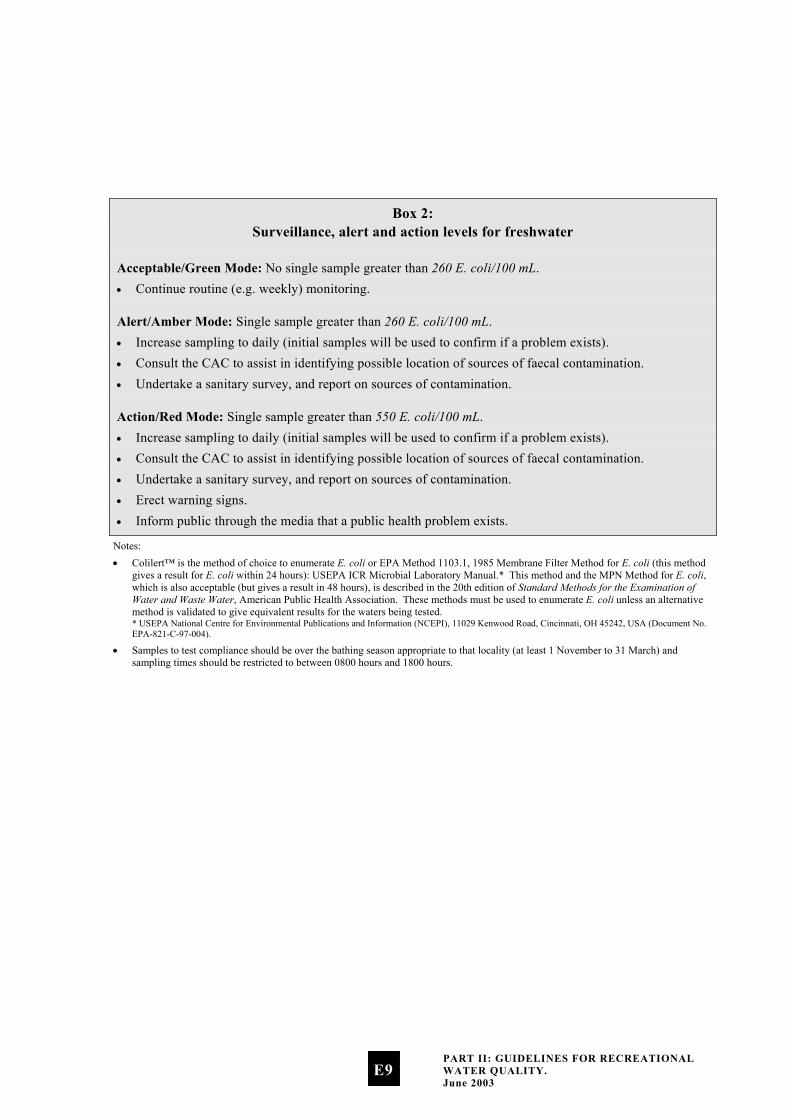
Box 2: Surveillance, alert and action levels for freshwater
Acceptable/Green Mode: No single sample greater than 260 E. coli/100 mL. • Continue routine (e.g. weekly) monitoring.
Alert/Amber Mode: Single sample greater than 260 E. coli/100 mL. • Increase sampling to daily (initial samples will be used to confirm if a problem exists). • Consult the CAC to assist in identifying possible location of sources of faecal contamination. • Undertake a sanitary survey, and report on sources of contamination.
Action/Red Mode: Single sample greater than 550 E. coli/100 mL. • Increase sampling to daily (initial samples will be used to confirm if a problem exists). • Consult the CAC to assist in identifying possible location of sources of faecal contamination. • Undertake a sanitary survey, and report on sources of contamination. • Erect warning signs. • Inform public through the media that a public health problem exists.
Notes: • Colilert™ is the method of choice to enumerate E. coli or EPA Method 1103.1, 1985 Membrane Filter Method for E. coli (this method
gives a result for E. coli within 24 hours): USEPA ICR Microbial Laboratory Manual.* This method and the MPN Method for E. coli, which is also acceptable (but gives a result in 48 hours), is described in the 20th edition of Standard Methods for the Examination of Water and Waste Water, American Public Health Association. These methods must be used to enumerate E. coli unless an alternative method is validated to give equivalent results for the waters being tested. * USEPA National Centre for Environmental Publications and Information (NCEPI), 11029 Kenwood Road, Cincinnati, OH 45242, USA (Document No. EPA-821-C-97-004).
• Samples to test compliance should be over the bathing season appropriate to that locality (at least 1 November to 31 March) and sampling times should be restricted to between 0800 hours and 1800 hours.
PART II: GUIDELINES FOR RECREATIONAL WATER QUALITY. June 2003
E9
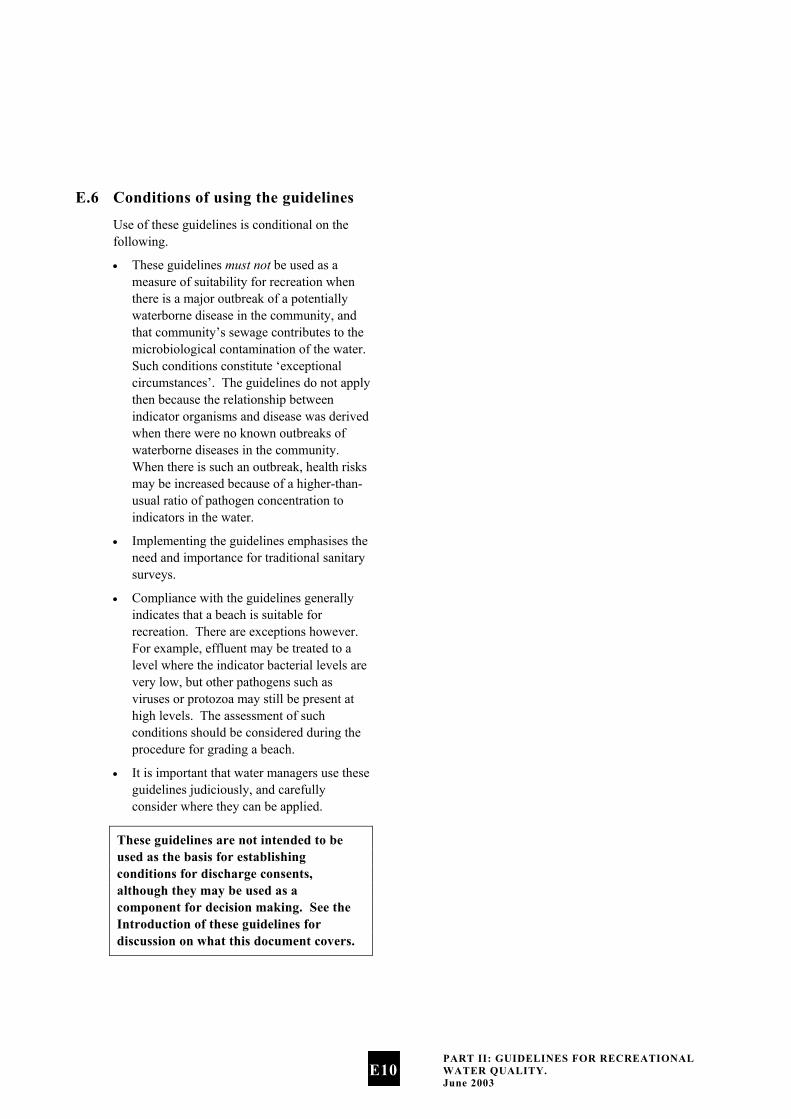
E.6 Conditions of using the guidelines
Use of these guidelines is conditional on the following.
These guidelines must not be used as a measure of suitability for recreation when there is a major outbreak of a potentially waterborne disease in the community, and that community’s sewage contributes to the microbiological contamination of the water. Such conditions constitute ‘exceptional circumstances’. The guidelines do not apply then because the relationship between indicator organisms and disease was derived when there were no known outbreaks of waterborne diseases in the community. When there is such an outbreak, health risks may be increased because of a higher-than-usual ratio of pathogen concentration to indicators in the water.
•
•
•
•
Implementing the guidelines emphasises the need and importance for traditional sanitary surveys.
Compliance with the guidelines generally indicates that a beach is suitable for recreation. There are exceptions however. For example, effluent may be treated to a level where the indicator bacterial levels are very low, but other pathogens such as viruses or protozoa may still be present at high levels. The assessment of such conditions should be considered during the procedure for grading a beach.
It is important that water managers use these guidelines judiciously, and carefully consider where they can be applied.
These guidelines are not intended to be used as the basis for establishing conditions for discharge consents, although they may be used as a component for decision making. See the Introduction of these guidelines for discussion on what this document covers.
PART II: GUIDELINES FOR RECREATIONAL WATER QUALITY. June 2003
E10
SECTION F: Microbiological Guidelines for Shellfish-Gathering Waters
The microbiological water-quality guidelines for recreational shellfish gathering are as defined in the Shellfish Quality Assurance Circular (Ministry of Agriculture and Forestry 1995) for areas of approved shellfish-growing waters. These guidelines are used by the shellfish export sector and are internationally accepted as indicating that shellfish grown in such classified waters under given conditions of sanitary safety are expected to have suitable microbiological quality for public consumption.
Note: These recreational shellfish-gathering water quality guidelines only cover microbiological contamination. They do not cover marine biotoxins, which in certain places and locations can pose a significant risk to recreational shellfish gatherers.
F.1 The preferred indicator for waters used for shellfish gathering
The guidelines use faecal coliform indicator organism values to denote the potential presence of pathogenic bacteria, viruses and protozoa.
F.2 Recreational shellfish-gathering guideline values
Compliance with these guidelines alone does not guarantee that shellfish grown in waters of this microbiological quality will be safe. The guidelines apply to waters in a catchment where a prior sanitary survey has shown that there are no point sources of pollution of public health concern. The guidelines are solely a management tool to measure any change from the conditions prevailing at the time of assessment.
The guidelines are also useful for assessing the impact of pollution from surface run-off after rainfall, and of tidal movement under storm conditions. Such factors are used to decide when gathering should be curtailed in commercial shellfish-growing areas when weather conditions cause pollution. They are equally applicable for recreational shellfish-growing waters.
The guidelines are set out in Box 3.
PART II: GUIDELINES FOR RECREATIONAL WATER QUALITY. June 2003
F1
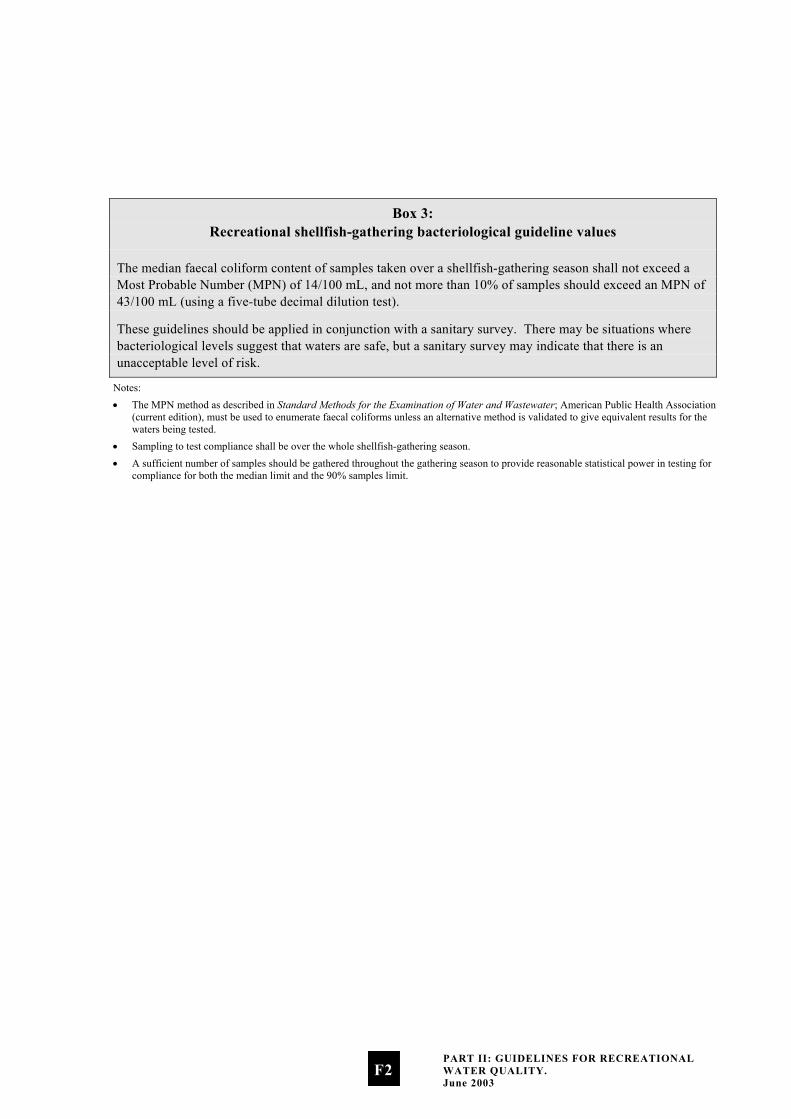
Box 3: Recreational shellfish-gathering bacteriological guideline values
The median faecal coliform content of samples taken over a shellfish-gathering season shall not exceed a Most Probable Number (MPN) of 14/100 mL, and not more than 10% of samples should exceed an MPN of 43/100 mL (using a five-tube decimal dilution test).
These guidelines should be applied in conjunction with a sanitary survey. There may be situations where bacteriological levels suggest that waters are safe, but a sanitary survey may indicate that there is an unacceptable level of risk.
Notes: • The MPN method as described in Standard Methods for the Examination of Water and Wastewater; American Public Health Association
(current edition), must be used to enumerate faecal coliforms unless an alternative method is validated to give equivalent results for the waters being tested.
• Sampling to test compliance shall be over the whole shellfish-gathering season. • A sufficient number of samples should be gathered throughout the gathering season to provide reasonable statistical power in testing for
compliance for both the median limit and the 90% samples limit.
PART II: GUIDELINES FOR RECREATIONAL WATER QUALITY. June 2003
F2
Part III:
Explanatory Notes
to the Guidelines
The following explanatory notes are provided to give more detail on some of the issues raised in Parts I and II.
SECTION G: NOTES TO PART I: The Framework for Monitoring Recreational Water Quality
Note G(i): Respiratory illness
Studies have increasingly found significant relationships between respiratory illness risk and a bacterial indicator. This has been shown in recent studies in at least four different countries, but it may not be a new phenomenon:
Hong Kong (Cheung et al 1990) •
•
•
•
England (Balarajan et al 1989; Fewtrell et al 1992; Fleisher, Kay, Salmon et al 1996)
Australia (Corbett et al 1993)
New Zealand (McBride, Salmond et al 1998).
The aetiological agent(s) for this are unclear, although it is generally recognised that a number of bacterial and viral pathogens that cause respiratory illness (e.g. members of the enterovirus and adenovirus group, and certain species of the genus Klebsiella) are shed in faecal matter. Infection is generally acquired by inhalation of aerosols containing these infectious particles (Horwitz 1990; Melnick 1990; Tyler & Fields 1990; Grimont et al 1992), and the potential for transmission of viral pathogens via wave-generated aerosols has been demonstrated (Baylor et al 1977).
PART III: EXPLANATORY NOTES TO THE GUIDELINES. June 2003
G1
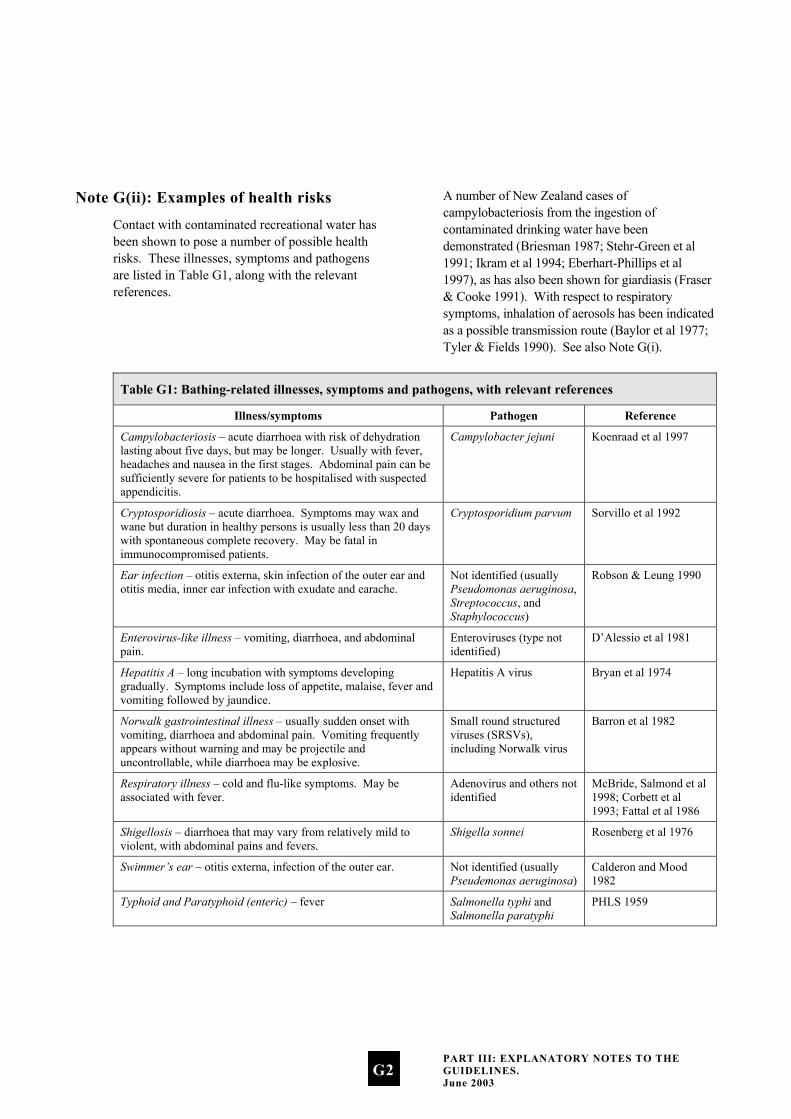
Note G(ii): Examples of health risks
Contact with contaminated recreational water has been shown to pose a number of possible health risks. These illnesses, symptoms and pathogens are listed in Table G1, along with the relevant references.
A number of New Zealand cases of campylobacteriosis from the ingestion of contaminated drinking water have been demonstrated (Briesman 1987; Stehr-Green et al 1991; Ikram et al 1994; Eberhart-Phillips et al 1997), as has also been shown for giardiasis (Fraser & Cooke 1991). With respect to respiratory symptoms, inhalation of aerosols has been indicated as a possible transmission route (Baylor et al 1977; Tyler & Fields 1990). See also Note G(i).
Table G1: Bathing-related illnesses, symptoms and pathogens, with relevant references
Illness/symptoms Pathogen Reference
Campylobacteriosis – acute diarrhoea with risk of dehydration lasting about five days, but may be longer. Usually with fever, headaches and nausea in the first stages. Abdominal pain can be sufficiently severe for patients to be hospitalised with suspected appendicitis.
Campylobacter jejuni Koenraad et al 1997
Cryptosporidiosis – acute diarrhoea. Symptoms may wax and wane but duration in healthy persons is usually less than 20 days with spontaneous complete recovery. May be fatal in immunocompromised patients.
Cryptosporidium parvum Sorvillo et al 1992
Ear infection – otitis externa, skin infection of the outer ear and otitis media, inner ear infection with exudate and earache.
Not identified (usually Pseudomonas aeruginosa, Streptococcus, and Staphylococcus)
Robson & Leung 1990
Enterovirus-like illness – vomiting, diarrhoea, and abdominal pain.
Enteroviruses (type not identified)
D’Alessio et al 1981
Hepatitis A – long incubation with symptoms developing gradually. Symptoms include loss of appetite, malaise, fever and vomiting followed by jaundice.
Hepatitis A virus Bryan et al 1974
Norwalk gastrointestinal illness – usually sudden onset with vomiting, diarrhoea and abdominal pain. Vomiting frequently appears without warning and may be projectile and uncontrollable, while diarrhoea may be explosive.
Small round structured viruses (SRSVs), including Norwalk virus
Barron et al 1982
Respiratory illness – cold and flu-like symptoms. May be associated with fever.
Adenovirus and others not identified
McBride, Salmond et al 1998; Corbett et al 1993; Fattal et al 1986
Shigellosis – diarrhoea that may vary from relatively mild to violent, with abdominal pains and fevers.
Shigella sonnei Rosenberg et al 1976
Swimmer’s ear – otitis externa, infection of the outer ear. Not identified (usually Pseudemonas aeruginosa)
Calderon and Mood 1982
Typhoid and Paratyphoid (enteric) – fever Salmonella typhi and Salmonella paratyphi
PHLS 1959
PART III: EXPLANATORY NOTES TO THE GUIDELINES. June 2003
G2
Note G(iii): State of the Environment Reporting
Environmental performance indicators are designed for use in state of the environment monitoring programmes. They help us to:
•
•
•
•
•
•
•
•
•
•
•
•
systematically report on the state of New Zealand’s environmental assets
systematically measure the performance of its environmental policies and legislation
better prioritise policy and improve environmental decision making.
Over time, the information produced by State of the Environment reporting can:
contribute to raising the level of knowledge about the state of New Zealand’s environment
increase our ability to report on environmental health and trends
provide the tools for effective evaluation of policy
provide the information base for more informed policy and management decisions.
This document serves as a monitoring protocol two state of the environment performance indicators developed by the Ministry under the Environmental Performance Indicators (EPI) Programme. Please note that beaches refer to both freshwater and marine recreational areas, so each of the following indicators would be reported for marine and freshwater beaches:
the percentage of monitored beaches in each beach grade
the percentage of the season beaches or coastal areas were suitable for bathing or shellfish gathering.
Note G(iv): Pressure-State-Response model
The Pressure-State-Response (PSR) model was used to measure environmental performance of management responses to develop environmental performance indicators. The PSR model asks three important questions:
What are the pressures on the environment?
What is the state of the environment?
What is being done to manage changes in pressures or state?
Pressure indicators answer the first question by measuring the stresses from human activities (and natural variations) that cause environmental change. State indicators answer the second question by measuring actual changes or trends in the physical or biological state of the environment. Response indicators answer the third question by monitoring the effectiveness of policies or actions taken by people to reduce, prevent or mitigate undesirable change in the state of the environment.
The indicators on which these guidelines are based; percentage of monitored beaches in each beach grade, and percentage of the season beaches or coastal areas were suitable for contact recreation or shellfish gathering, are state indicators that provide general information on the public health risk presented by recreational waters. Pressure indicators would measure the surrounding land use and discharges to water to assist identification of potential causes of changes in water quality. Response indicators would identify management or policy changes at the regional or national level (for example infrastructural improvements, land use management policies, national environmental standards) to manage issues for recreational waters.
PART III: EXPLANATORY NOTES TO THE GUIDELINES. June 2003
G3
Implementation of integrated pressure, state and response monitoring provides a measure of the entire system in question and supports detection of policy gaps or opportunities for management improvements.
Note G(v): Integrating public health and state of the environment data
The purpose of the Microbiological Water Quality Guidelines for Marine and Freshwater Recreational Areas is to help control the public health risk from microbiological contamination in recreational waters, and to provide a framework for monitoring and reporting on the general health of beaches. Integrating the needs of both state of the environment and public health monitoring may present some challenges, but it is achievable.
Microbiological information is generated more intensively to keep stock of short-term variation that can affect the public health risk of water quality. This monitoring takes place on a weekly basis, although at times follow-up monitoring is required to identify the permanence of an identified guideline exceedance.
The purpose of state of the environment monitoring is to collect sufficient data to produce information on the general health of the environment. This information can then be used to measure how well our management practices, policies and laws are working, and whether environmental outcomes are being achieved. The beach grades generated through the combination of the catchment assessment and microbiological assessment provide state of the environment information to the public on the general condition of the recreational area with respect to public health risk. The microbiological information collected to assess the public health risk at the beach on a weekly basis is aggregated over five years to generate the Microbiological Assessment Category used in the beach grading process.
Note G(vi): Merging with existing microbiological programmes
Councils may monitor microbiological water quality for objectives other than public health reporting (e.g. land-use pressure, trends). Merging monitoring programmes can result in significant cost savings, though there are some issues to be aware of.
The following considerations should be made when merging programmes other than for public health reporting:
Can the sampling requirements of both programmes be satisfied?
•
• Will the sampling locations be appropriate for both programmes?
See Box 4 for an example of merging programmes.
PART III: EXPLANATORY NOTES TO THE GUIDELINES. June 2003
G4
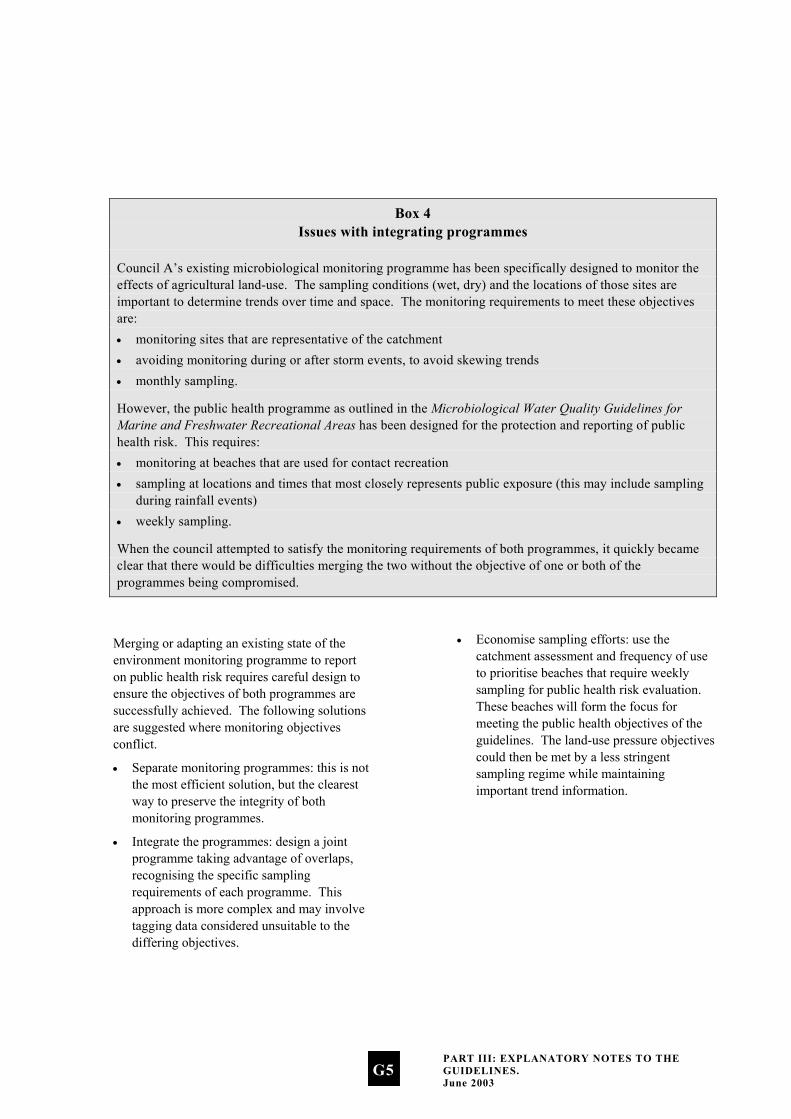
Box 4 Issues with integrating programmes
Council A’s existing microbiological monitoring programme has been specifically designed to monitor the effects of agricultural land-use. The sampling conditions (wet, dry) and the locations of those sites are important to determine trends over time and space. The monitoring requirements to meet these objectives are: • monitoring sites that are representative of the catchment • avoiding monitoring during or after storm events, to avoid skewing trends • monthly sampling.
However, the public health programme as outlined in the Microbiological Water Quality Guidelines for Marine and Freshwater Recreational Areas has been designed for the protection and reporting of public health risk. This requires: • monitoring at beaches that are used for contact recreation • sampling at locations and times that most closely represents public exposure (this may include sampling
during rainfall events) • weekly sampling.
When the council attempted to satisfy the monitoring requirements of both programmes, it quickly became clear that there would be difficulties merging the two without the objective of one or both of the programmes being compromised.
Merging or adapting an existing state of the environment monitoring programme to report on public health risk requires careful design to ensure the objectives of both programmes are successfully achieved. The following solutions are suggested where monitoring objectives conflict.
•
•
•
Separate monitoring programmes: this is not the most efficient solution, but the clearest way to preserve the integrity of both monitoring programmes.
Integrate the programmes: design a joint programme taking advantage of overlaps, recognising the specific sampling requirements of each programme. This approach is more complex and may involve tagging data considered unsuitable to the differing objectives.
Economise sampling efforts: use the catchment assessment and frequency of use to prioritise beaches that require weekly sampling for public health risk evaluation. These beaches will form the focus for meeting the public health objectives of the guidelines. The land-use pressure objectives could then be met by a less stringent sampling regime while maintaining important trend information.
PART III: EXPLANATORY NOTES TO THE GUIDELINES. June 2003
G5

Note G(vii): Different roles and responsibilities adopted around New Zealand
As part of determining a sensible and pragmatic approach to recommending an assignment of roles and responsibilities, the Ministry for the Environment investigated a number of scenarios operating around the country.
Scenario One: Integrated approach
•
•
•
•
•
•
•
•
•
•
•
•
•
•
•
•
•
•
•
•
The regional council undertakes all beach monitoring in an area.
When the alert level is exceeded, the territorial local authority carries out additional monitoring. Additional sampling is funded by the Medical Officer of Health.
A sanitary survey is carried out when in alert mode II.
When the action level is exceeded the territorial local authority carries out additional monitoring. Additional sampling is funded by the Medical Officer of Health.
Investigation of nuisance is carried out by the territorial local authority.
When in action mode, public notification is undertaken by the Medical Officer of Health (includes signage).
Scenario Two: Medical Officer of Health lead
The Medical Officer of Health brings the regional council and territorial local authorities in the region together before the beginning of the bathing season to ascertain the degree of monitoring programmed for the region. The Medical Officer of Health is kept informed of the status of beaches throughout the entire season.
The territorial local authority carries out all monitoring in each district.
When the alert level is exceeded the territorial local authority undertakes a degree of investigation (additional sampling is rarely carried out).
When the action level is exceeded signs are put up at beaches (sometimes permanent around some discharge points) and a public communications strategy is implemented.
An investigation into the cause of nuisance is carried out.
The regional council is kept informed throughout the season.
Scenario Three: Single agency
The territorial local authority carries out monitoring.
The public are not alerted when action levels are exceeded, although an investigation is carried out to find the cause of the problem and abate nuisance.
The Medical Officer of Health is available to provide advice to the territorial local authority on whether to inform the public.
Scenario Four: Regional lead
The regional council carries out all monitoring.
Territorial local authorities remain informed of water quality in their district through regional councils.
The Medical Officer of Health is informed by regional councils when the action level is exceeded, and provides advice on the public health significance.
Regional councils take additional samples and investigate when the action level is exceeded.
The Medical Officer of Health informs the public when the action level is exceeded.
PART III: EXPLANATORY NOTES TO THE GUIDELINES. June 2003
G6
Scenario Five: Double check •
•
•
•
•
•
•
•
•
•
•
The regional council monitors beaches for state of the environment reporting.
The territorial local authorities monitor beaches for public health purposes.
The Medical Officer of Health provides advice on a sampling strategy and the public health significance of sampling results.
The territorial local authorities carry out additional sampling and investigation when alert levels are exceeded.
Territorial local authorities inform the public when action levels are exceeded and investigate the nuisance.
Note G(viii): The legislative basis for the Ministry’s recommendations
The recommendations made by the Ministry for the Environment and the Ministry of Health are supported by legislation as follows.
The regional council undertakes surveillance and alert-level monitoring (including resource consent monitoring).
Section 35 of the Resource Management Act, 1991 requires regional councils to undertake monitoring to carry out their functions under the RMA effectively. Section 35(2) requires regional councils to undertake “state of the environment” monitoring.
Under the RMA, regional councils have functions in relation to the coastal marine area, including coastal waters, which are linked to the purpose of the RMA. The aspects of the purpose of the RMA (Part II) that are relevant to coastal waters/marine bathing and, in particular, the public health aspects of beach water quality are:
section 5 – sustainable management incorporates health and safety, safeguarding the life-supporting capacity of water and avoiding, remedying or mitigating any adverse effects of activities on the environment
section 6 – the preservation of the natural character of the coastal environment, including the coastal marine area and the maintenance and enhancement of public access to and along the coastal marine area are matters of national importance
section 7 – the maintenance and enhancement of amenity values and the quality of the environment are matters to which particular regard must be had by decision makers under the RMA.
Section 30 of the RMA ascribes functions to regional councils for the purpose of giving effect to the RMA, including:
control of land use for the purpose of maintaining and enhancing the quality of coastal water
in respect of the coastal marine area, the control of discharges of contaminants into water and discharges of water into water
the general, control of discharges of contaminants into water and discharges of water into water.
Policy 5.1.1 of the New Zealand Coastal Policy Statement directs regional councils that:
Rules should be made as soon as possible with the object of enhancing water quality in the coastal environment where that is desirable to assist in achieving the purpose of the Act, and in particular where there is a high public interest in, or use of the water.
PART III: EXPLANATORY NOTES TO THE GUIDELINES. June 2003
G7
In summary, it is consistent with the RMA to require regional councils to undertake surveillance monitoring and alert-level monitoring of marine bathing waters. Arguably, the RMA requires regional councils to go further than this and undertake stepped-up nuisance monitoring, where necessary.
There is no provision in the Health Act for the Medical Officer of Health to audit the monitoring carried out by regional councils. However, the recommendation that the Medical Officer of Health be satisfied with the manner in which the monitoring is carried out is to protect public health and safety. It also helps to ensure that the guidelines will be consistently applied around the country.
If alert or action levels are reached the regional council informs the Medical Officer of Health and the territorial authority. The Medical Officer of Health ensures the territorial authority is informed.
Section 35(2) of the RMA requires regional councils to “take appropriate action (having regard to the methods available to it under the RMA) where this is shown to be necessary”. This is linked to state of the environment monitoring requirements. Appropriate action may include informing the Medical Officer of Health and territorial authority.
Once the Medical Officer of Health is aware that alert or action levels have been exceeded, it is consistent with the Health Act that he or she ensure that the territorial authority is informed. Under the Health Act, the Director-General of Health (and his or her officers) has an overriding duty to improve, promote and protect public health. The Medical Officers of Health and Health Protection Officers under the Director-General of Health have supervisory/ auditing roles in relation to public nuisances. While there is specific legislative authority for the Medical Officer of Health to direct territorial
authorities, there is currently no such authority for him or her to direct regional councils.
The territorial authority informs the public, where necessary. The Medical Officer of Health ensures the public are informed.
Territorial authorities have a duty to improve, promote and protect public health within their districts under section 23 of the Health Act. This extends to specific powers and duties:
If satisfied that any nuisance, or any condition likely to be injurious to health or offensive, exists in the district, the territorial authority is to cause all proper steps to be taken to secure the abatement of the nuisance or the removal of the condition.
“All proper steps” arguably includes informing the public. Also, as outlined above, the Medical Officer of Health has an auditing role under the Health Act, and it is consistent with this that he or she ensures that the public is informed.
Section 57 of the RMA provides for a New Zealand Coastal Policy Statement (NZCPS), which is mandatory. By virtue of sections 55 and 57, local authorities must take such action as is necessary to implement the NZCPS. Policy 5.1.7 of the NZCPS states:
Provision should be made to ensure that the public is adequately warned when the degradation of water in the coastal environment has rendered the water unsafe for swimming, shellfish gathering or other activities.
Consequently, the NZCPS directs local authorities to make provision to warn the public.
Regional councils have functions to ensure that integrated management of the natural and physical resources of a region is achieved, and provision could be achieved by ensuring that territorial authorities will carry out this function.
PART III: EXPLANATORY NOTES TO THE GUIDELINES. June 2003
G8
If the action level is reached, in the first instance the territorial authority will undertake nuisance monitoring and cause all proper steps to be taken to abate or remove the nuisance. On occasion it may be more appropriate for the regional council to undertake this duty. The Medical Officer of Health will provide advice and ensure that the territorial local authorities and/or regional councils take proper steps.
The Health Act requires territorial authorities to undertake nuisance monitoring in relation to their districts pursuant to section 23:
To cause inspection of its district to be regularly made for the purpose of ascertaining if any nuisances, or any conditions likely to be injurious to health or offensive, exist in the district.
‘District’ is not defined in the Health Act, and arguably the coastal marine area is not within a territorial authority’s district because of the definition of ‘district’ in the RMA. However, this definition does not expressly apply to the Health Act. Further, the source of the nuisance is likely to be within the territorial authority’s district (i.e. the land, as defined in the RMA), and it is appropriate that the territorial authority locate the source of the nuisance.
The RMA requirements for regional councils to monitor may extend to nuisance monitoring. For example, where the cause of the nuisance is found to be a consented activity or an activity controlled by the regional council rather than the territorial local authority, then responsibility for continued monitoring and abatement rests with the regional council. Other situations where it may be more appropriate for the regional council to carry out nuisance monitoring include when it has been agreed by all agencies involved before the beginning of the bathing season, and where the territorial local authority is too small to cope with increased monitoring. The Medical Officer of Health may need to assist the territorial local authorities and regional councils in determining
the most appropriate agency to investigate and monitor the nuisance.
Note G(ix): Legal opinion on roles and responsibilities
A legal opinion sought by the Ministry for the Environment found that the two major pieces of legislation concerned (the RMA and Health Act) did not explicitly define responsibilities for beach water-quality monitoring and reporting. However, the proposed framework is consistent with current legislation.
Note G(x): The Annapolis Protocol
The Annapolis Protocol combines a monitoring scheme of microbiological testing with broader data collection on sources and transmission of pollution. It involves both an environmental hazard assessment and a microbiological water-quality assessment.
Councils and health authorities have been consulted on the concept and implementation of a risk-based approach and guideline values for recreational waters. The Annapolis Protocol framework as detailed in the guidelines has been adapted to suit New Zealand conditions after trial at 30 New Zealand recreational beaches and consideration by a Marine Bathing Working Group established for the purpose. The same approach has been applied to the guidelines for freshwater recreational use, following consideration and trial by the Freshwater Guidelines Advisory Group.
PART III: EXPLANATORY NOTES TO THE GUIDELINES. June 2003
G9

SECTION H: NOTES TO PART II: Guidelines for Recreational Water Quality
Note H(i): Sampling times and periods
Season period
The bathing season period will vary according to location, but will generally extend from 1 November to 31 March. If a beach is used all year round the grade and weekly monitoring should reflect this (i.e. should be based on data for a period relevant to usage).
A Suitability for Recreation Grade (SFRG) is established for each beach in the programme at the beginning of the season. The SFRG is applicable for up to five years, provided there are no significant changes within the catchment that might affect water quality. The grade provides an indication of the overall condition of the site.
Weekly sampling should continue at those beaches graded Good, Fair or Poor. Weekly sampling is required for determining the public health risk at a beach. Beaches graded Very Good may not require ongoing monitoring because of the low risk identified. The same applies to beaches graded Very Poor, as they will generally be unsuitable for recreational use.
Resource limitations may restrict the number of beaches in a region that can be monitored. The grading system applied in these guidelines enables beaches to be prioritised according to their grade, and creates the potential to have all beaches within a region, city or district graded over time.
Number of samples to collect
A minimum of 20 samples should be collected from each site in the monitoring programme, usually at weekly intervals. Additional samples may be taken throughout the season as a result of single-sample exceedances. While these do not contribute to the recommended 20 samples, they should be recorded in the database/spreadsheet with all other samples.
Timing sample collection
Figure H1 shows how a sampling regime may be timed. In this instance it ensures that the results are generated in time to inform the public of the quality of the beach at the time of highest use (the weekend). There may be other peak times when the regime in Figure H1 is not appropriate and staff should design programmes accordingly.
Flexibility in sample timing
In setting up a programme it is important to allow for the minimum number of samples to be collected (20). This will usually require weekly monitoring, depending on season period (which may vary from region to region). As sampling is not likely to take place during conditions which may present a health and safety hazard (e.g. heavy rainfall, storm conditions, large surf), it is important to design a weekly sampling programme that has sufficient flexibility to allow sampling to take place as soon as practical after adverse conditions have abated. This may also better reflect the conditions under which people are swimming.
PART III: EXPLANATORY NOTES TO THE GUIDELINES. June 2003
H1
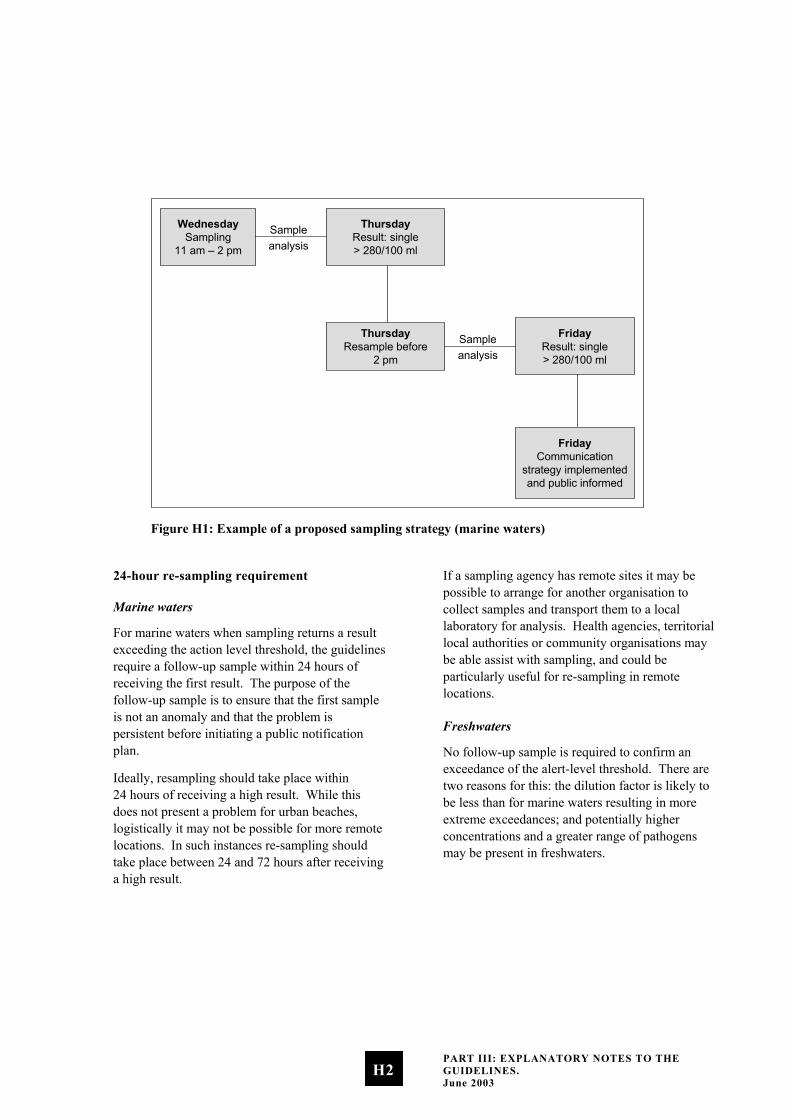
WednesdaySampling
11 am – 2 pm
ThursdayResult: single> 280/100 ml
Sampleanalysis
ThursdayResample before
2 pm
FridayResult: single> 280/100 ml
Sampleanalysis
FridayCommunication
strategy implementedand public informed
Figure H1: Example of a proposed sampling strategy (marine waters)
24-hour re-sampling requirement
Marine waters
For marine waters when sampling returns a result exceeding the action level threshold, the guidelines require a follow-up sample within 24 hours of receiving the first result. The purpose of the follow-up sample is to ensure that the first sample is not an anomaly and that the problem is persistent before initiating a public notification plan.
Ideally, resampling should take place within 24 hours of receiving a high result. While this does not present a problem for urban beaches, logistically it may not be possible for more remote locations. In such instances re-sampling should take place between 24 and 72 hours after receiving a high result.
If a sampling agency has remote sites it may be possible to arrange for another organisation to collect samples and transport them to a local laboratory for analysis. Health agencies, territorial local authorities or community organisations may be able assist with sampling, and could be particularly useful for re-sampling in remote locations.
Freshwaters
No follow-up sample is required to confirm an exceedance of the alert-level threshold. There are two reasons for this: the dilution factor is likely to be less than for marine waters resulting in more extreme exceedances; and potentially higher concentrations and a greater range of pathogens may be present in freshwaters.
PART III: EXPLANATORY NOTES TO THE GUIDELINES. June 2003
H2

Note H(ii): Techniques for taking and analysing samples
Where to sample
Water-quality samples should be taken from the area where swimming occurs. In general, the sample will be taken at approximately 15 cm below the surface at a point where the depth of water is 0.5 metres for marine water, and 30 cm below the surface at a point where the depth of water is 1 metre for freshwater.
Multiple sample sites
Sometimes it may be desirable to take multiple samples along a beach, particularly where a beach extends for some distance and one sample point is not representative of the whole beach. The way multiple samples are incorporated into results will vary. If samples are taken at considerable distances from each other, then each of the samples should be considered an individual sample site. However, if multiple samples are taken from a small beach (e.g. with the purpose of trying to find a potential source of contamination), then these will need to be treated differently, and the highest value should be taken as the maximum for the whole beach.
Sample collection techniques
At the time of sampling, enter in a logbook (for later transcription to a sample sheet) details of weather conditions (wind speed and direction, rainfall), water temperature, salinity, and observations of conditions such as turbidity or discoloration, and any unusual circumstances affecting the site (e.g. seaweed, jellyfish).
The following steps for sampling are recommended.
i. Ensure that the bottle is clearly labelled for later sample identification.
ii. Immediately before sample collection, remove the bottle cap while ensuring that the inner of the cap is protected from soiling. The laboratory generally supplies sterile containers of a suitable size.
iii. Quickly plunge the bottle upside down to the required sampling depth set for the site. (For marine water the sample will be taken at approximately 15–20 cm below the surface at a point where the depth of water is 0.5 metres; for freshwater the sample will be taken at approximately 30 cm below the surface where the depth of the water is approximately 1 metre.)
iv. Tilt the bottle until the neck points slightly upwards, with the mouth directed towards the current. The bottle can be moved forward horizontally until filled if necessary. Completely fill the bottle.
v. Rapidly bring the bottle to the surface and pour out a small portion (leave a space of 2–3 cm) to permit proper mixing for analysis. Quickly fit the cap and secure tightly.
vi. Record the time of sample collection and check sample identification labelling.
vii. Place in a chilly bin containing frozen slicker pads.
Sampling after wet weather
The guidelines relate to samples taken throughout the total bathing season irrespective of weather conditions. Results influenced by rainfall should not be excluded: people do swim shortly after a rainfall event, and it is important to sample when people are likely to be swimming. This may be particularly so for freshwater lakes and rivers.
PART III: EXPLANATORY NOTES TO THE GUIDELINES. June 2003
H3
The separation of dry-weather and wet-weather data is also impractical because the definition of the two is problematic. For example, coastal water can be less polluted in the early stages of a wet spell but more polluted when the weather has become fine just after substantial rainfall; the reverse can be true in estuaries.
Safety
The safety of field officers is vital and should be taken into account when selecting sample sites with respect to entering the water.
Transporting samples
The sample should be transported to the analytical laboratory as quickly as facilities allow, preferably within six hours, but no longer than 24 hours.
When it is not possible to have the samples analysed by the local laboratory, a courier should be arranged well in advance. Courier companies can be requested to make a pick-up from the council in time to courier the samples to the laboratory on the same day or overnight. Samples should be packed in chilly bins (polystyrene bins are sufficient) with ice packs to keep them cool.
It is particularly important that samples analysed for E. coli are analysed within 24 hours of sampling, as bacteria may begin to die or replicate, depending on storage conditions and the status of the water sample.
Documentation of the transport history and of all those who have handled the sample should accompany all samples. This is known as a chain of custody.
On arrival at the laboratory the samples should be placed in a refrigerator, and analysed within two hours of receipt (particularly for enterococci and E. coli; different time factors may be applicable for other micro-organisms). The analytical laboratory should record the times of sample receipt and analysis.
Where analysis for other micro-organisms is required, obtain specific instructions from the analytical laboratory.
Laboratory techniques
Marine studies have generally concluded that enterococci are the indicator of choice for the presence of faecal pollution. The recommended method for their detection in the Recreational Water Quality Guidelines are the Membrane Filter (MF) Test Method for Enterococci in Water as described in Document No. EPA-821-C-97-004, and Enterolert™ (note: Enterolert™ may not be considered suitable for state of the environment monitoring and reporting due to inadequate detection limits).
The above method has been evaluated for marine waters and has the advantage of giving results in 24 hours. Earlier methods gave a result within 48 hours. The value of this for monitoring agencies is to be able to identify alert, and action-level exceedances more quickly.
For similar reasons, in freshwater where E. coli is the indicator of choice, Colilert™ and EPA method 1103.1, 1985 Membrane Filter Method for E. coli are the preferred methods to enumerate Escherichia coli. Both methods give a result within 24 hours.
Quality control
Laboratories conducting testing for monitoring agencies must be able to demonstrate competence. Ideally this means an IANZ accredited laboratory.
It is essential that laboratories have documented quality assurance procedures. This does not have to be in the form of very detailed manuals, but the basic procedures of the laboratory must be written down. It needs to be quite clear what procedures are being used and exactly how the tests are being carried out. All key activities must be documented, and everyone involved in testing – from sample collector to the person reporting the results – must have a thorough understanding of
PART III: EXPLANATORY NOTES TO THE GUIDELINES. June 2003
H4
their responsibilities and duties, any problems that could arise, and how they should be dealt with. All activities undertaken must be recorded so that it is quite clear, from the time of collection of the sample to the reporting of results, what actions were taken, by whom and when.
In showing competence, laboratories need to consider participation in an inter-laboratory proficiency programme, spiked samples, split samples, duplicates, positive and negative controls, both within the laboratory and in collaborative tests with other laboratories.
New method validation
New methods must be proven to provide results equivalent in sensitivity and specificity to those of the preferred test methods for the waters being tested. Statistical analysis of parallel test results must show strong linear correlation and no significant difference between the methods by paired t-test analysis.
Note H(iii): Establishing a Sanitary Inspection Category (SIC)
The following steps are required to determine an SIC.
i. Carry out an initial desktop analysis based on historical information.
ii. Use Parts A, B and C of the Catchment Assessment Checklist to help identify relevant information about the site.
iii. Use Part D of the Catchment Assessment Checklist to identify the presence of sources of faecal contamination likely to cause effects in the water body.
iv. If more than one source is present, then choose the most important. Importance is assessed in terms of the susceptibility of the water body to faecal influence. For example, a continual moderate source of faecal contamination may be considered more
important than an occasional but high-load faecal source. This may require specific pathogen testing to determine the source of greater impact.
v. Locate the number corresponding to the most significant impact in the SIC flow chart (Figure H2) to determine the SIC.
It is important to recognise there are two questions to be answered in Part D of the catchment assessment checklist. The first is “Is it present”. The purpose of this question is to determine the presence of a potential source of faecal contamination to the recreational site. The second question “Is it likely to cause an effect” determines, after evaluation, if the potential source of faecal contamination actually affects the recreational site, thus posing a risk.
Initial desktop assessment before sanitary inspection
Start the assessment of the sanitary status of a recreational site with a review of its previous history and, where applicable, an assessment of what triggers pollution events, including when and how the guidelines are exceeded.
When considering historical microbiological data to help determine causal relationships, bear in mind the limitations – under some conditions – of the indicator (enterococci/faecal coliform) used. Additional information, such as that set out in Parts A, B and C of the Catchment Assessment Checklist, may be needed to verify the cause of elevated indicator levels, and may already be available in the historical information.
Carrying out a sanitary inspection
Generally, local authorities will have GIS systems or maps to identify the important known discharges and conditions that could cause an issue. The initial emphasis of any assessment should be on potential causes from known discharges and existing conditions, identified using resource information, local data and historical
PART III: EXPLANATORY NOTES TO THE GUIDELINES. June 2003
H5
information. In addition, identifying what is not known is important. Gaps in the knowledge about an area can be addressed in a catchment inspection, as well as by reviewing known existing conditions.
To assess the immediate area and catchment data, an annotated map of the beach and catchment is required. The checklist can be used to verify that all aspects and areas that should be included in the map have been added.
Questions that require information for annotation may include:
number of bathers •
•
•
•
•
•
•
•
location of oxidation ponds duck ponds bird-roosting areas (daytime and night time) boat anchor and mooring areas possibility of septic tank seepage location of swamps and mangroves location of wastewater treatment and disposal systems and effluent outfalls.
Possible contamination sources (rivers, streams, stormwater drains outfalls) should be included in the map of the sanitary inspection area. Where available, maps of the entire catchment area indicating land use, topography and infrastructure networks (i.e. wastewater and storm drain systems etc.) should also be attached.
Base conditions for establishing a Sanitary Inspection Category
All beaches will have been recognised as having contact recreational activity, so a factor for human-to-human transmission of disease during recreational activity is not included. A single most significant source of faecal contamination has been used to categorise the beach. This is because a second source, even of similar magnitude, can only increase the risk by a factor of two and as such is of limited significance in microbiological terms.
Other impacts not included above may produce an ‘unexpected result requiring verification’ in the grading matrix (Tables D2 and E2). This source should be identified in the ‘more detailed investigation’ suggested in the note to Part D of the Catchment Assessment Checklist.
Note: The Sanitary Inspection Category (SIC) is based on the use of, and monitoring for, faecal indicator bacteria to support risk assessment. As discussed in the introduction, where there are discharges of treated effluent enterococci alone are not an appropriate indicator of public health risk. If pathogen monitoring is carried out then the SIC category for tertiary treated wastewater discharge may be amended.
PART III: EXPLANATORY NOTES TO THE GUIDELINES. June 2003
H6
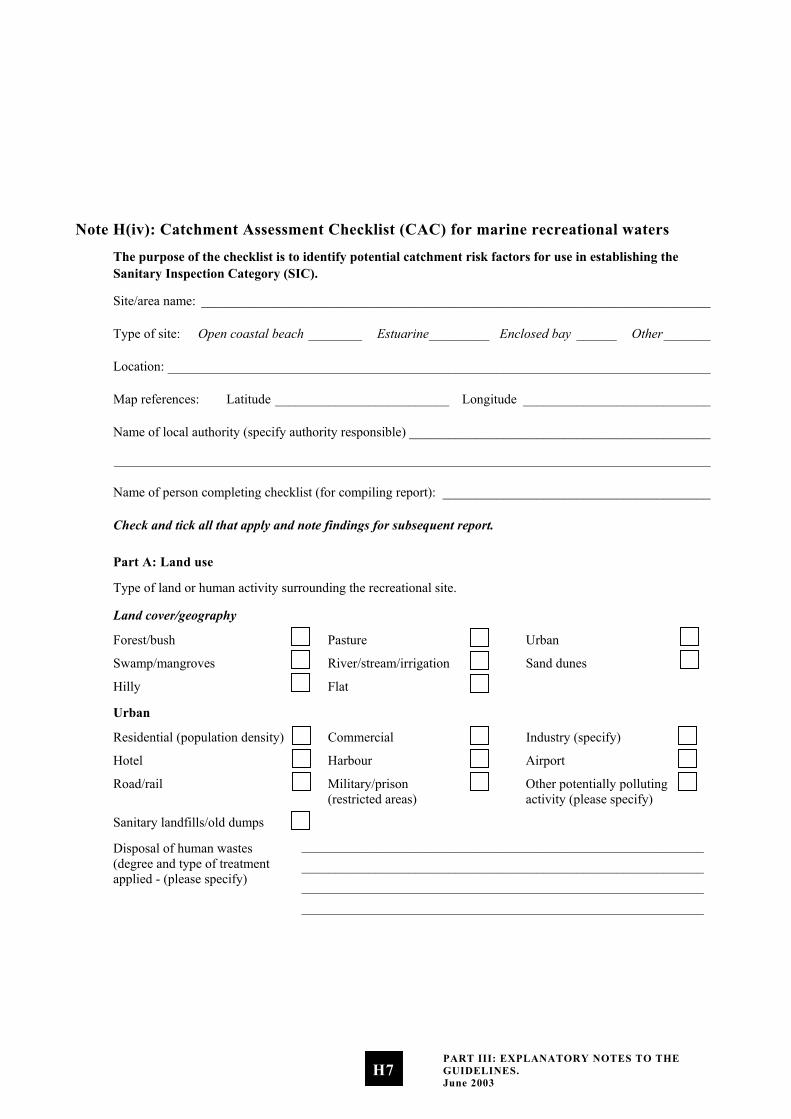
Note H(iv): Catchment Assessment Checklist (CAC) for marine recreational waters
The purpose of the checklist is to identify potential catchment risk factors for use in establishing the Sanitary Inspection Category (SIC).
Site/area name: ____________________________________________________________________________
Type of site: Open coastal beach ________ Estuarine_________ Enclosed bay ______ Other_______
Location: _________________________________________________________________________________
Map references: Latitude __________________________ Longitude ____________________________
Name of local authority (specify authority responsible) _____________________________________________
_________________________________________________________________________________________
Name of person completing checklist (for compiling report): ________________________________________
Check and tick all that apply and note findings for subsequent report.
Part A: Land use
Type of land or human activity surrounding the recreational site.
Land cover/geography
Forest/bush Pasture Urban
Swamp/mangroves River/stream/irrigation Sand dunes
Hilly Flat
Urban
Residential (population density) Commercial Industry (specify)
Hotel Harbour Airport
Road/rail Military/prison (restricted areas)
Other potentially polluting activity (please specify)
Sanitary landfills/old dumps
Disposal of human wastes (degree and type of treatment applied - (please specify)
____________________________________________________________ ____________________________________________________________ ____________________________________________________________ ____________________________________________________________
PART III: EXPLANATORY NOTES TO THE GUIDELINES. June 2003
H7

Part B: Rural land use
Indicate the presence of the following for agricultural land use.
Sheep Dairy/beef Horses
Pigs Deer
Poultry Feral
Is there disposal of animal wastes? (please specify)
____________________________________________________________ ____________________________________________________________ ____________________________________________________________
Part C: Water uses
Indicate the presence of the following for the marine area.
Marina Fish boat berths
Permanent boat moorings Harbour
Temporary boat moorings Ferry berth
Additional influencing factors
Size of bathing area: Area _____ m2 Length ______m Mean width ______m
Is there a beach? Average area _____ m2 Length ______m Width at low tide ______m Width at high tide ______m
Are there lagoons used for bathing?
Is the beach subject to above average seasonal/holiday loading?
Direction of prevailing onshore winds _______
Direction of prevailing water currents _______
Shoreline configuration/geomorphology/erosion gullies: ________________ _____________________________________________________________ Presence of sandbars
Presence of surf: average wave heights _______
Total rainfall
Total annual: _______ mm
Seasonal patterns: ______________________________________________
PART III: EXPLANATORY NOTES TO THE GUIDELINES. June 2003
H8

Part D: Microbiological hazards
Sewage and animal waste
Is the water quality in the recreational area affected, or likely to be affected by:
Is it present?
Is it likely to cause an effect?
1 discharge of untreated human effluent onto or adjacent to a recreational area
2 stormwater outlets with potential sewage contamination / combined stormwater outlet onto or adjacent to a recreational area
3 urban stormwater that is protected from sewage ingress
4 on-site or other private sewage disposal systems (e.g. septic tank or package plant)
5 communal sewage disposal or primary or secondary treatment facilities
6 communal sewage disposal with tertiary treatment facilities
7 intensive agricultural use in immediate catchment and potential for run-off from untreated animal effluent (e.g. dairying, piggeries, milking sheds)
8 the incidence and density of bird life (particularly where lagoons or estuarine conditions exist)
9 water craft mooring or use (for boats, proximity, densities and pump-outs).
Yes No
Is there a river or stream (including a piped stream) discharging into the recreational area?
If ‘Yes’ complete Questions 10–15 to determine an effect.
PART III: EXPLANATORY NOTES TO THE GUIDELINES. June 2003
H9
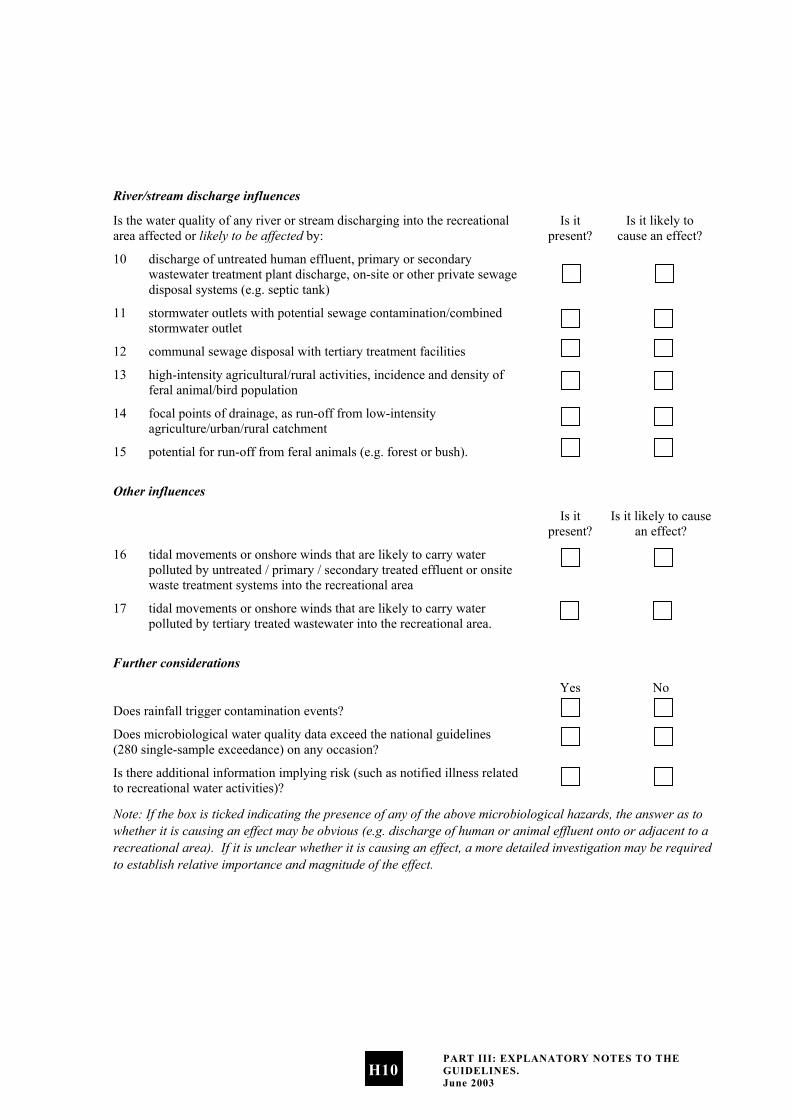
River/stream discharge influences
Is the water quality of any river or stream discharging into the recreational area affected or likely to be affected by:
Is it present?
Is it likely to cause an effect?
10 discharge of untreated human effluent, primary or secondary wastewater treatment plant discharge, on-site or other private sewage disposal systems (e.g. septic tank)
11 stormwater outlets with potential sewage contamination/combined stormwater outlet
12 communal sewage disposal with tertiary treatment facilities
13 high-intensity agricultural/rural activities, incidence and density of feral animal/bird population
14 focal points of drainage, as run-off from low-intensity agriculture/urban/rural catchment
15 potential for run-off from feral animals (e.g. forest or bush).
Other influences
Is it present?
Is it likely to cause an effect?
16 tidal movements or onshore winds that are likely to carry water polluted by untreated / primary / secondary treated effluent or onsite waste treatment systems into the recreational area
17 tidal movements or onshore winds that are likely to carry water polluted by tertiary treated wastewater into the recreational area.
Further considerations
Yes No
Does rainfall trigger contamination events?
Does microbiological water quality data exceed the national guidelines (280 single-sample exceedance) on any occasion?
Is there additional information implying risk (such as notified illness related to recreational water activities)?
Note: If the box is ticked indicating the presence of any of the above microbiological hazards, the answer as to whether it is causing an effect may be obvious (e.g. discharge of human or animal effluent onto or adjacent to a recreational area). If it is unclear whether it is causing an effect, a more detailed investigation may be required to establish relative importance and magnitude of the effect.
PART III: EXPLANATORY NOTES TO THE GUIDELINES. June 2003
H10
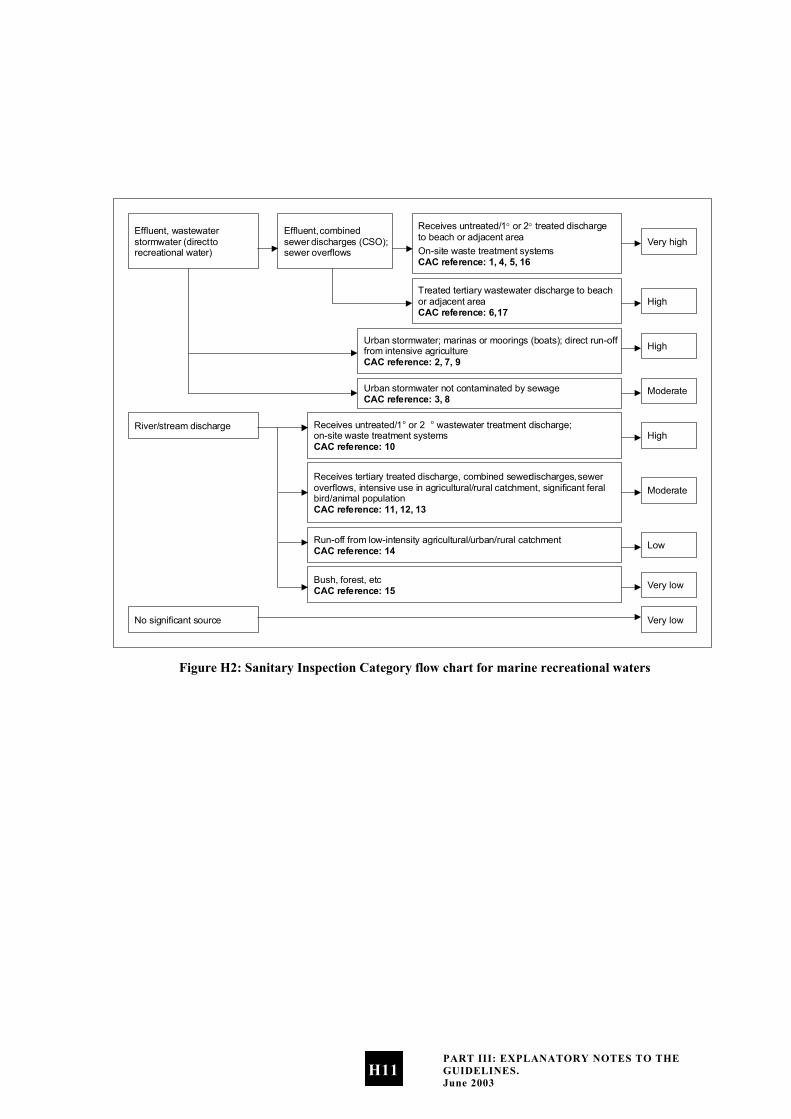
Effluent, wastewater stormwater (direct to recreational water)
Effluent, combined sewer discharges (CSO); sewer overflows
Receives untreated/1° or 2° treated discharge to beach or adjacent area On-site waste treatment systems CAC reference: 1, 4, 5, 16
Very high
Treated tertiary wastewater discharge to beach or adjacent area CAC reference: 6, 17
High
Urban stormwater; marinas or moorings (boats); direct run-off from intensive agriculture CAC reference: 2, 7, 9
High
Urban stormwater not contaminated by sewage CAC reference: 3, 8 Moderate
Receives untreated/1 o or 2 o wastewater treatment discharge; on-site waste treatment systems CAC reference: 10
High River/stream discharge
Receives tertiary treated discharge, combined sewer discharges, sewer overflows, intensive use in agricultural/rural catchment, significant feral bird/animal population CAC reference: 11, 12, 13
Moderate
Run-off from low-intensity agricultural/urban/rural catchment CAC reference: 14 Low
Bush, forest, etc CAC reference: 15 Very low
Very low No significant source
Figure H2: Sanitary Inspection Category flow chart for marine recreational waters
PART III: EXPLANATORY NOTES TO THE GUIDELINES. June 2003
H11
Note H(v): Microbiological Assessment Category (MAC) for marine recreational waters
The Microbiological Assessment Category is calculated on the basis of five years of historical data (at least 100 data points). Data collected during or immediately following rainfall, as part of routine sampling, should be included in the calculation of the MAC. The purpose of the MAC is to give an indication of general water quality over an extended period, to allow for variations in climatic conditions. The MAC is used in conjunction with the Sanitary Inspection Category (SIC) to determine the Suitability for Recreation Grade, and to confirm that the selected SIC is accurate, based on historical water-quality results.
Note: Follow-up samples from an alert or action mode response should not be included in the data used to generate an MAC. If using the software provided by the Ministry for the Environment to generate grades, follow-up samples will need to be removed from the dataset prior to importing.
See Section D.3 for MAC definitions.
Change in indicators
If a change between indicators is made, there may be limited amounts of data available in the initial years of implementation. To overcome this, correction factors appropriate to local conditions can be applied to historical records. Such conversion factors would normally be based on the results of local analyses.
For many locations there will be a large amount of historical data available that can be used for preliminary recreational water environment classification. If this data includes analysis for enterococci, there will be no problem using the data. However, many recreational water environment managers will have data based only on coliform and faecal coliform counts.
Although there is no exact relationship between enterococci and E. coli counts, a relationship expressed by the following equation (WHO 2001) may help in interpreting historical data:
log10(faecal coliform) = 1.028 + 0.601log10(enterococci)
Even more helpful are the following simpler forms of this equation, relating enterococci to faecal coliforms and vice versa:
faecal coliform = 10.67(enterococci)0.601
enterococci = 0.0195(faecal coliform)1.67
Using the first formula, a count of 70 enterococci equates to 137.1 faecal coliforms. Using the second formula, a count of 100 faecal coliforms/100 mL equates to 42.7 enterococci/ 100 mL.
However, this equivalence is not exact as it is based on the relationship between faecal coliform and faecal streptococcal/enterococci counts in United Kingdom bathing waters after censoring zero values. If possible, local recreational-water environment managers should define the relationship that exists in their own waters.
Note H(vi): Suitability for recreation grade for marine recreational waters
Explanation of grades
Beaches are graded by considering microbiological monitoring results from previous years in combination with the factors in the catchment that may contribute faecal contamination to the beach. It is a risk-associated grading of the beach, meaning that it provides an indication of what the likely condition of the beach will be on any day. The following general explanation provides a description of each of the beach grades.
PART III: EXPLANATORY NOTES TO THE GUIDELINES. June 2003
H12
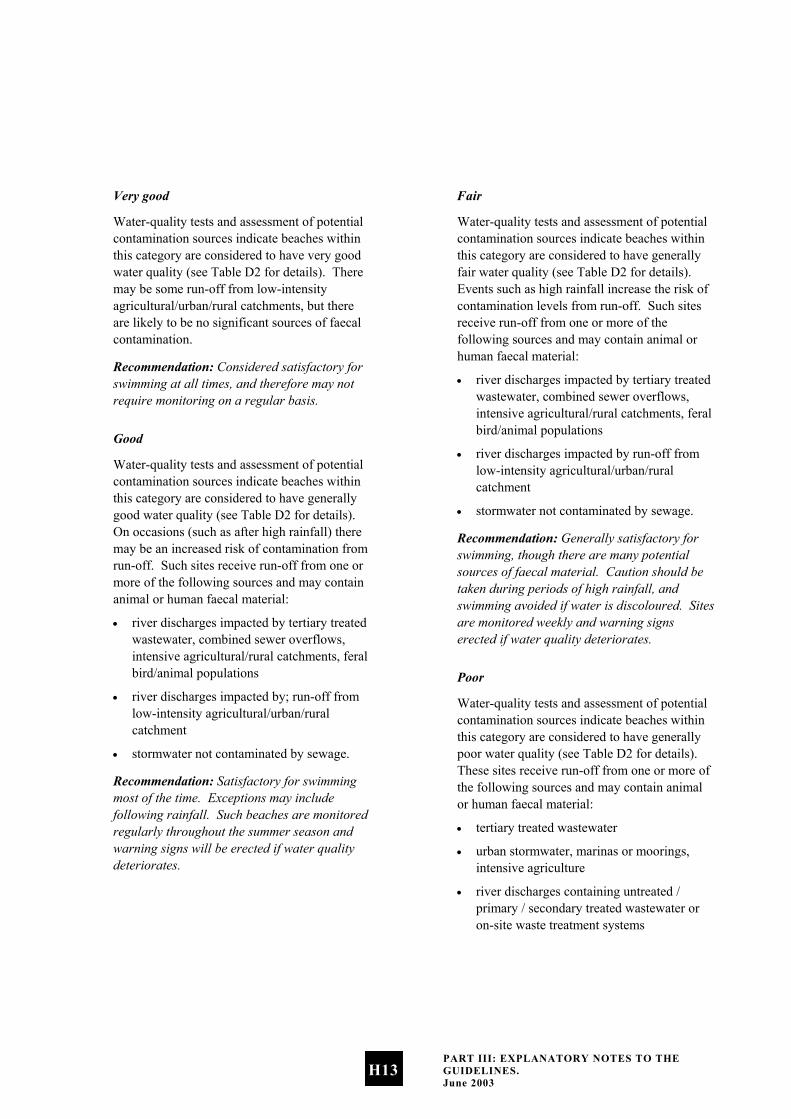
Very good
Water-quality tests and assessment of potential contamination sources indicate beaches within this category are considered to have very good water quality (see Table D2 for details). There may be some run-off from low-intensity agricultural/urban/rural catchments, but there are likely to be no significant sources of faecal contamination.
Recommendation: Considered satisfactory for swimming at all times, and therefore may not require monitoring on a regular basis.
Good
Water-quality tests and assessment of potential contamination sources indicate beaches within this category are considered to have generally good water quality (see Table D2 for details). On occasions (such as after high rainfall) there may be an increased risk of contamination from run-off. Such sites receive run-off from one or more of the following sources and may contain animal or human faecal material:
•
•
•
•
•
•
•
•
•
river discharges impacted by tertiary treated wastewater, combined sewer overflows, intensive agricultural/rural catchments, feral bird/animal populations
river discharges impacted by; run-off from low-intensity agricultural/urban/rural catchment
stormwater not contaminated by sewage.
Recommendation: Satisfactory for swimming most of the time. Exceptions may include following rainfall. Such beaches are monitored regularly throughout the summer season and warning signs will be erected if water quality deteriorates.
Fair
Water-quality tests and assessment of potential contamination sources indicate beaches within this category are considered to have generally fair water quality (see Table D2 for details). Events such as high rainfall increase the risk of contamination levels from run-off. Such sites receive run-off from one or more of the following sources and may contain animal or human faecal material:
river discharges impacted by tertiary treated wastewater, combined sewer overflows, intensive agricultural/rural catchments, feral bird/animal populations
river discharges impacted by run-off from low-intensity agricultural/urban/rural catchment
stormwater not contaminated by sewage.
Recommendation: Generally satisfactory for swimming, though there are many potential sources of faecal material. Caution should be taken during periods of high rainfall, and swimming avoided if water is discoloured. Sites are monitored weekly and warning signs erected if water quality deteriorates.
Poor
Water-quality tests and assessment of potential contamination sources indicate beaches within this category are considered to have generally poor water quality (see Table D2 for details). These sites receive run-off from one or more of the following sources and may contain animal or human faecal material:
tertiary treated wastewater
urban stormwater, marinas or moorings, intensive agriculture
river discharges containing untreated / primary / secondary treated wastewater or on-site waste treatment systems
PART III: EXPLANATORY NOTES TO THE GUIDELINES. June 2003
H13
• •
•
•
•
•
river discharges impacted by tertiary treated wastewater, combined sewer overflows, intensive agricultural/rural catchments, feral bird/animal populations.
Recommendation: Generally not okay for swimming, as indicated by historical results. Swimming should be avoided, particularly by the very young, the very old and those with compromised immunity. Permanent warning signs may be erected at these sites, although councils may monitor these sites weekly and post temporary warnings.
Very poor
Water-quality tests and assessment of potential contamination sources indicate beaches within this category are considered to have very poor water quality (see Table D2 for details). These sites receive run-off from one or more of the following sources and may contain animal or human faecal material:
untreated/primary/secondary treated wastewater
on-site waste treatment systems
tertiary treated wastewater
urban stormwater, marinas or moorings, intensive agriculture
river discharges containing untreated/ primary/secondary treated wastewater or on-site waste treatment systems.
Recommendation: Avoid swimming, as there are direct discharges of faecal material. Permanent signage will be erected at the beach stating that swimming is not recommended.
PART III: EXPLANATORY NOTES TO THE GUIDELINES. June 2003
H14
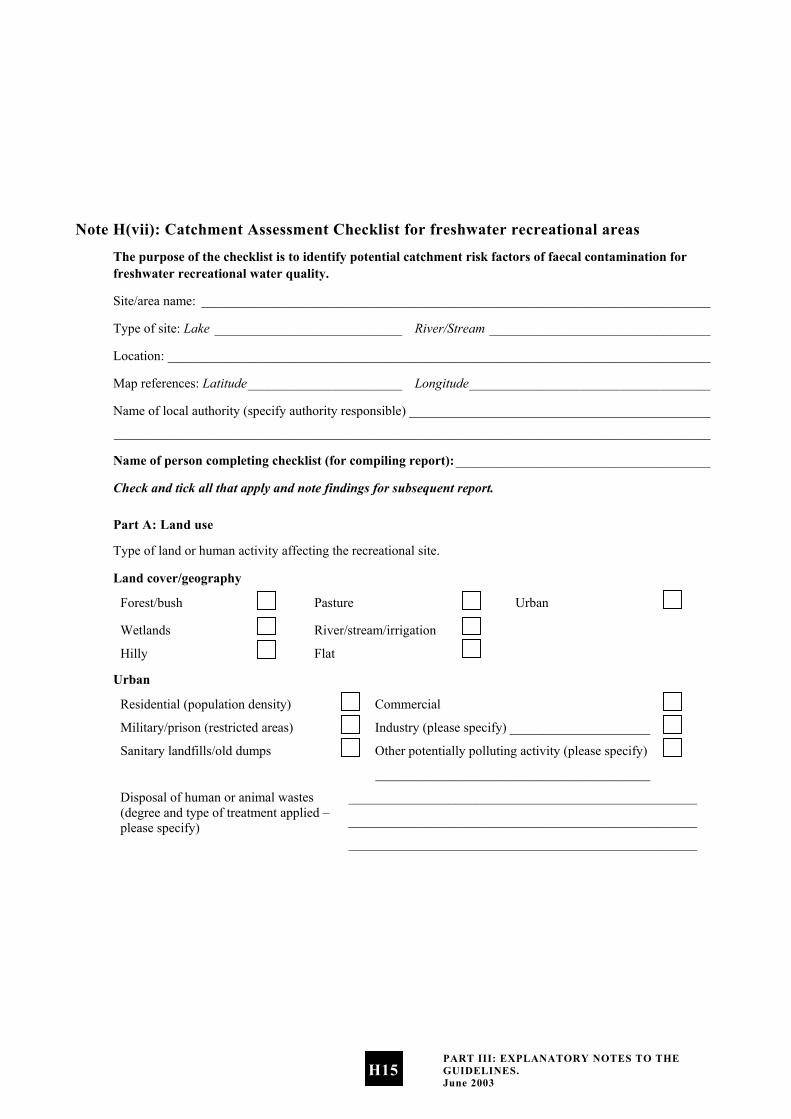
Note H(vii): Catchment Assessment Checklist for freshwater recreational areas
The purpose of the checklist is to identify potential catchment risk factors of faecal contamination for freshwater recreational water quality.
Site/area name: ____________________________________________________________________________
Type of site: Lake ____________________________ River/Stream _________________________________
Location: _________________________________________________________________________________
Map references: Latitude_______________________ Longitude____________________________________
Name of local authority (specify authority responsible) _____________________________________________
_________________________________________________________________________________________
Name of person completing checklist (for compiling report):______________________________________
Check and tick all that apply and note findings for subsequent report.
Part A: Land use
Type of land or human activity affecting the recreational site.
Land cover/geography
Forest/bush Pasture Urban
Wetlands River/stream/irrigation
Hilly Flat
Urban
Residential (population density) Commercial
Military/prison (restricted areas) Industry (please specify) _____________________
Sanitary landfills/old dumps Other potentially polluting activity (please specify)
_________________________________________
Disposal of human or animal wastes (degree and type of treatment applied – please specify)
____________________________________________________
____________________________________________________
____________________________________________________
PART III: EXPLANATORY NOTES TO THE GUIDELINES. June 2003
H15
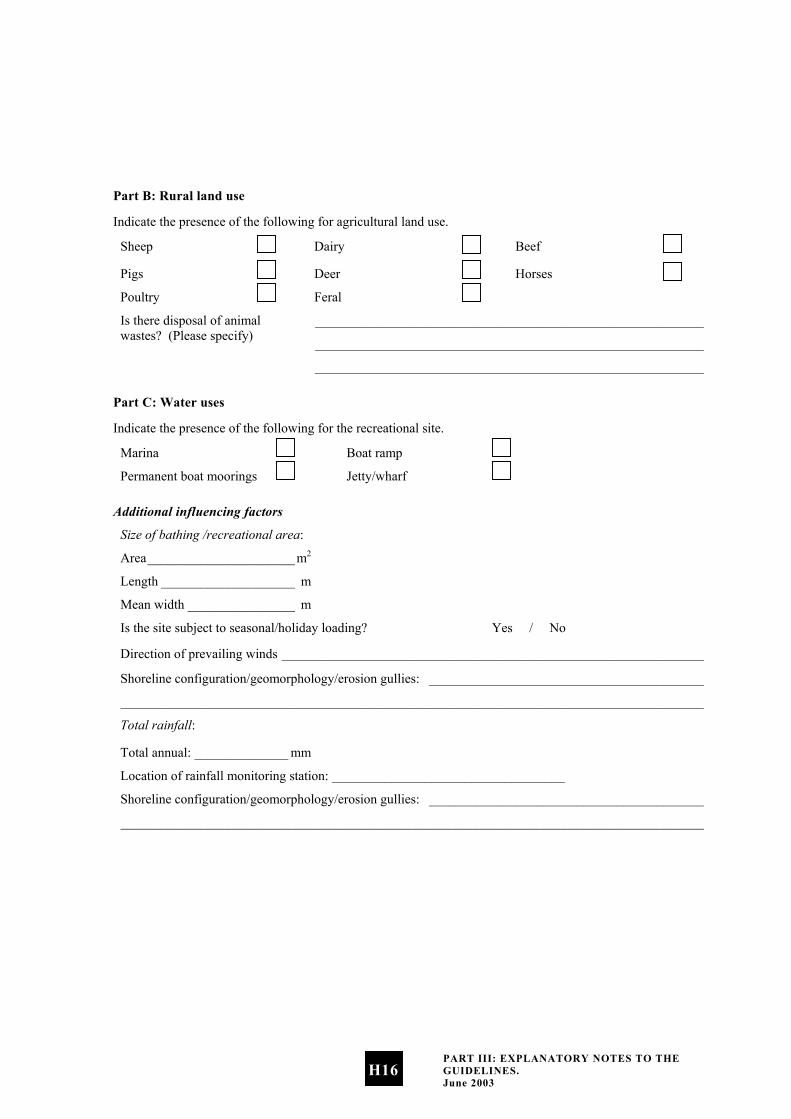
Part B: Rural land use
Indicate the presence of the following for agricultural land use.
Sheep Dairy Beef
Pigs Deer Horses
Poultry Feral
Is there disposal of animal wastes? (Please specify)
__________________________________________________________
__________________________________________________________
__________________________________________________________
Part C: Water uses
Indicate the presence of the following for the recreational site.
Marina Boat ramp
Permanent boat moorings Jetty/wharf
Additional influencing factors
Size of bathing /recreational area:
Area______________________m2
Length ____________________ m
Mean width ________________ m
Is the site subject to seasonal/holiday loading? Yes / No
Direction of prevailing winds _______________________________________________________________
Shoreline configuration/geomorphology/erosion gullies: _________________________________________
_______________________________________________________________________________________
Total rainfall:
Total annual: ______________ mm
Location of rainfall monitoring station: ___________________________________
Shoreline configuration/geomorphology/erosion gullies: _________________________________________
_______________________________________________________________________________________
PART III: EXPLANATORY NOTES TO THE GUIDELINES. June 2003
H16

Part D: Microbiological hazards
Sewage and animal wastes
Is the water quality in the recreational area affected, or likely to be affected by:
Is it present?
Is it likely to cause an effect?
1 discharge of untreated human effluent onto or upstream to a recreational area
2 stormwater outlets with potential sewage contamination / combined stormwater outlet onto or upstream to a recreational area
3 urban stormwater that is protected from sewage ingress
4 on-site or other private sewage disposal systems (e.g. septic tank or package plant)
5 communal sewage disposal or primary or secondary treatment facilities
6 communal sewage disposal with tertiary treatment facilities
7 intensive agricultural use in immediate catchment and potential for run-off from untreated animal effluent (e.g. dairying, piggeries, milking sheds etc.)
8 focal points of drainage, as run-off from low-intensity agriculture/urban/rural catchment
9 unrestricted stock access to waterways
10 the incidence and density of birdlife
11 water craft mooring or use
12 potential for run-off from feral animals (e.g. forest or bush).
Indirect influences
Yes No
Is there a stream (including a piped stream or tributary) or drain or wetland discharging into or upstream to the recreational area?
PART III: EXPLANATORY NOTES TO THE GUIDELINES. June 2003
H17
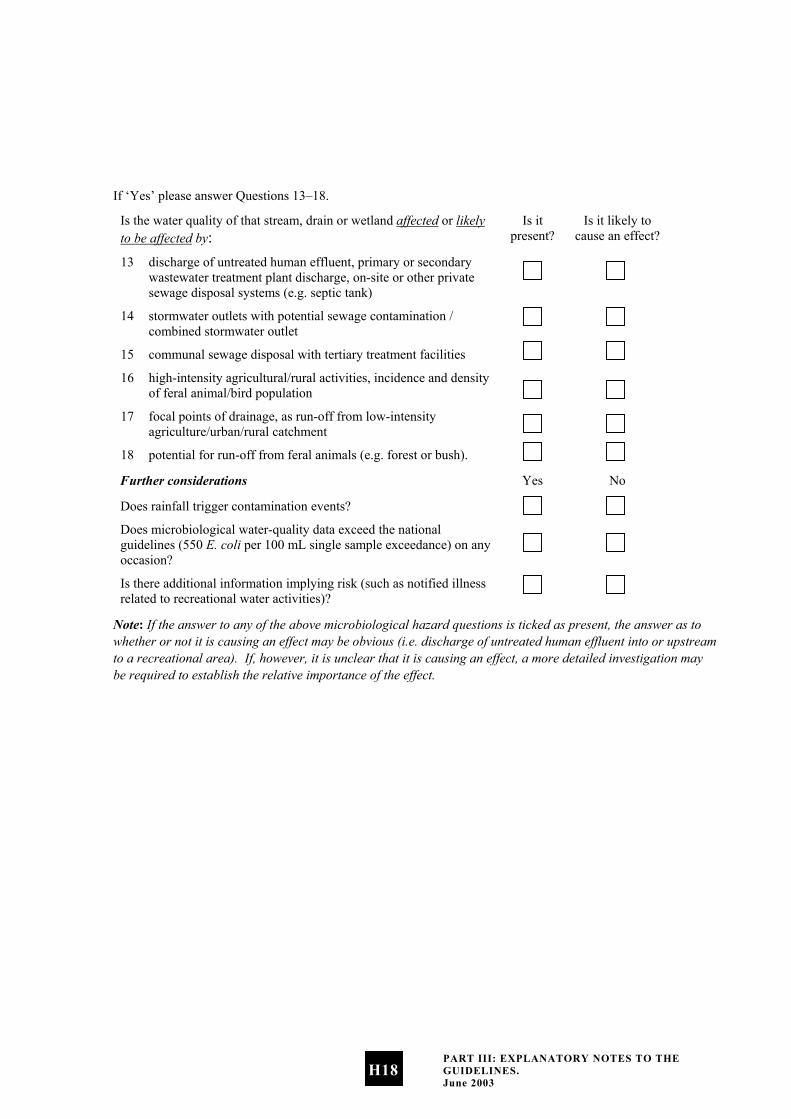
If ‘Yes’ please answer Questions 13–18.
Is the water quality of that stream, drain or wetland affected or likely to be affected by:
Is it present?
Is it likely to cause an effect?
13 discharge of untreated human effluent, primary or secondary wastewater treatment plant discharge, on-site or other private sewage disposal systems (e.g. septic tank)
14 stormwater outlets with potential sewage contamination / combined stormwater outlet
15 communal sewage disposal with tertiary treatment facilities
16 high-intensity agricultural/rural activities, incidence and density of feral animal/bird population
17 focal points of drainage, as run-off from low-intensity agriculture/urban/rural catchment
18 potential for run-off from feral animals (e.g. forest or bush).
Further considerations Yes No
Does rainfall trigger contamination events?
Does microbiological water-quality data exceed the national guidelines (550 E. coli per 100 mL single sample exceedance) on any occasion?
Is there additional information implying risk (such as notified illness related to recreational water activities)?
Note: If the answer to any of the above microbiological hazard questions is ticked as present, the answer as to whether or not it is causing an effect may be obvious (i.e. discharge of untreated human effluent into or upstream to a recreational area). If, however, it is unclear that it is causing an effect, a more detailed investigation may be required to establish the relative importance of the effect.
PART III: EXPLANATORY NOTES TO THE GUIDELINES. June 2003
H18
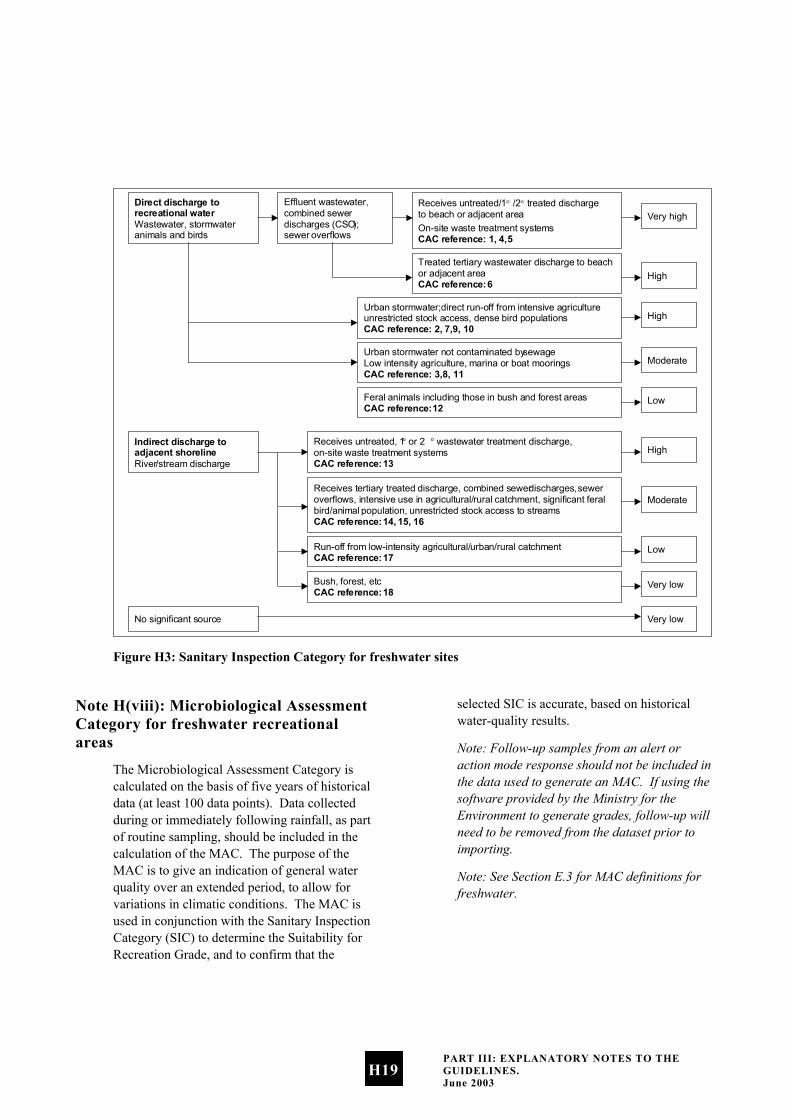
Direct discharge to recreational water Wastewater, stormwater animals and birds
Effluent wastewater, combined sewer discharges (CSO ); sewer overflows
Receives untreated/1° /2° treated discharge to beach or adjacent area On-site waste treatment systems CAC reference: 1, 4, 5
Very high
Treated tertiary wastewater discharge to beach or adjacent area CAC reference: 6 High
Urban stormwater; direct run-off from intensive agriculture unrestricted stock access, dense bird populations CAC reference: 2, 7, 9, 10
High
Urban stormwater not contaminated by sewage Low intensity agriculture, marina or boat moorings CAC reference: 3, 8, 11
Moderate
Receives untreated, 1 o or 2 o wastewater treatment discharge, on-site waste treatment systems CAC reference: 13
High Indirect discharge to adjacent shoreline River /stream discharge
Receives tertiary treated discharge, combined sewer discharges, sewer overflows, intensive use in agricultural/rural catchment, significant feral bird/animal population, unrestricted stock access to streams CAC reference: 14, 15, 16
Moderate
Run-off from low-intensity agricultural/urban/rural catchment CAC reference: 17 Low
Bush, forest, etc CAC reference: 18 Very low
Very low No significant source
Feral animals including those in bush and forest areas CAC reference: 12 Low
Figure H3: Sanitary Inspection Category for freshwater sites
Note H(viii): Microbiological Assessment Category for freshwater recreational areas
The Microbiological Assessment Category is calculated on the basis of five years of historical data (at least 100 data points). Data collected during or immediately following rainfall, as part of routine sampling, should be included in the calculation of the MAC. The purpose of the MAC is to give an indication of general water quality over an extended period, to allow for variations in climatic conditions. The MAC is used in conjunction with the Sanitary Inspection Category (SIC) to determine the Suitability for Recreation Grade, and to confirm that the
selected SIC is accurate, based on historical water-quality results.
Note: Follow-up samples from an alert or action mode response should not be included in the data used to generate an MAC. If using the software provided by the Ministry for the Environment to generate grades, follow-up will need to be removed from the dataset prior to importing.
Note: See Section E.3 for MAC definitions for freshwater.
PART III: EXPLANATORY NOTES TO THE GUIDELINES. June 2003
H19
Note H(ix): Suitability for recreation grade for freshwater recreational areas
Explanation of grades
Beaches are graded by considering microbiological monitoring results from previous years in combination with the factors in the catchment that may contribute faecal contamination to the beach. It is a risk-associated grading of the beach, meaning that it provides an indication of what the likely condition of the beach will be on any day. The following general explanation provides a description of each of the beach grades.
Very good
Water-quality tests and assessment of potential contamination sources indicate beaches within this category are considered to have very good water-quality (see Table E2 for details). This indicates there may be some indirect run-off from low intensity agricultural/urban/rural/bush catchments, but there are likely to be no significant sources of faecal contamination.
Recommendation: Considered satisfactory for swimming at all times, and therefore may not require monitoring on a regular basis.
Good
Water-quality tests and assessment of potential contamination sources indicate beaches within this category are considered to have generally good water-quality (see Table E2 for details). On occasions (such as after high rainfall) there may be an increased risk of contamination from run-off. Such sites receive run-off from one or more of the following sources and may contain animal or human faecal material:
•
•
•
•
•
•
•
•
river discharges impacted by tertiary treated wastewater, combined sewer overflows, sewer overflows, intensive agricultural/rural catchments, significant feral bird/animal populations
river discharges impacted by; run-off from low-intensity agricultural/urban/rural catchment
direct discharges from stormwater not contaminated by sewage, boat moorings or marinas
direct discharges from low-intensity agriculture.
Recommendation: Satisfactory for swimming most of the time. Exceptions may include following rainfall. Such beaches are monitored regularly throughout the summer season and warning signs will be erected if water quality deteriorates.
Fair
Water-quality tests and assessment of potential contamination sources indicate beaches within this category are considered to have generally fair water-quality (see Table E2 for details). However, events such as high rainfall increase the risk of contamination levels from run-off. Such sites receive run-off from one or more of the following sources and may contain animal or human faecal material:
river discharges impacted by tertiary treated wastewater, combined sewer overflows, sewer overflows, intensive agricultural/rural catchments, significant feral bird/animal populations
river discharges impacted by; run-off from low-intensity agricultural/urban/rural catchment
direct discharges from stormwater not contaminated by sewage, boat moorings or marinas
direct discharges from low-intensity agriculture.
Recommendation: Generally satisfactory for swimming, though there are many potential sources of faecal material. Caution should be taken during periods of high rainfall, and swimming avoided if water is discoloured. Sites are monitored weekly and warning signs erected if water quality deteriorates.
PART III: EXPLANATORY NOTES TO THE GUIDELINES. June 2003
H20
Poor
Water-quality tests and assessment of potential contamination sources indicate beaches within this category are considered to have generally poor water-quality (see Table E2 for details). These sites receive run-off from one or more of the following sources and may contain animal or human faecal material:
•
•
•
•
•
•
•
•
•
•
tertiary treated wastewater
urban stormwater, intensive agriculture, unrestricted stock access, dense bird populations
low-intensity agriculture, marinas or boat moorings, urban stormwater not contaminated by sewage
river discharges containing untreated/ primary/secondary treated wastewater or on-site waste treatment systems
river discharges impacted by tertiary treated wastewater, combined sewer overflows, intensive agricultural/rural catchments, feral bird/animal populations.
Recommendation: Generally not okay for swimming, as indicated by historical results. Swimming should be avoided, particularly by the very young, the very old and those with compromised immunity. Permanent warning signs may be erected at these sites, although councils may monitor these sites weekly and post temporary warnings.
Very poor
Water-quality tests and assessment of potential contamination sources indicate beaches within this category are considered to have very poor water-quality (see Table E2 for details). These sites receive run-off from one or more of the following sources and may contain animal or human faecal material:
untreated/primary/secondary treated wastewater
on-site waste treatment systems
tertiary treated wastewater
urban stormwater, intensive agriculture, unrestricted stock access, dense bird populations
river discharges containing untreated/ primary/secondary treated wastewater or on-site waste treatment systems.
Recommendation: Avoid swimming, as there are direct discharges of faecal material. Permanent signage will be erected at the beach stating that swimming is not recommended.
Note H(x): Application of grades and single samples
The risk of becoming sick from swimming at a beach is inferred from the associated grade. Beaches graded Very Good almost always pass the Microbiological Water Quality Guidelines, and there are few sources of faecal contamination in the catchment. Consequently, the risk of becoming sick is low. Beaches graded Very Poor are within catchments with significant sources of faecal contamination, and they rarely pass the guidelines. The risk of becoming sick at these beaches is high and swimming is not recommended. Unless there is a change in the catchment characteristics of beaches graded Very Poor, monitoring is not justified.
For the remaining grades of beaches (Good, Fair, Poor), water quality deteriorates and the risk of illness from swimming increases down the gradient from Good to Poor. The conditions affecting water quality vary (e.g. Good beaches usually pass the guidelines, but occasions such as high rainfall increase the risk of contamination from run-off).
For these beaches it is recommended that weekly monitoring be carried out during the bathing season. The public will be informed when swimming is not recommended (when a sample taken from the beach exceeds the action-level single-sample criteria of the Microbiological Water Quality Guidelines).
PART III: EXPLANATORY NOTES TO THE GUIDELINES. June 2003
H21
Note H(xi): Interim grading
An interim grade is provisional, and dependent on annual review as additional information becomes available until five years of data is obtained. An interim grade is mainly for management purposes, although it may be communicated to the public if it is clearly defined as interim only.
An interim grade can be derived using less than the recommended five years’ data where at least 20 data points over the period of greatest recreational use are available. This period will normally be the summer bathing season, but may vary with the types of recreational activity most common in the area.
Circumstances under which an interim grade might be applied include:
where the data available is incomplete, either with respect to the MAC, or the SIC, or both
•
• where there is reason to believe that the existing grading no longer accords with changed circumstances, but the data required for completing the grading is insufficient.
Note H(xii): Modifying beach grades
Modifying a beach’s SFRG is justified where occasional and predictable contamination events are identified, and interventions can be demonstrated to be effective in discouraging recreational use. Sites with a modified SFRG should be labelled, and their condition and the effectiveness of management interventions assessed annually.
Modifying an SFRG is particularly relevant to mid-range beaches (Good, Fair and Poor) and where there is disagreement between the SIC and MAC (i.e. a ‘Follow Up’). The process for modifying a beach grade is as follows.
i. Determine whether contamination events are occasional and predictable (i.e. triggered by an event such as heavy rainfall).
ii. Implement and evaluate the effectiveness of management interventions to discourage recreational use during known high-risk periods.
iii. Reassess the SIC, removing the source of predictable contamination events (provided interventions are effective).
iv. Reassess the MAC (where there is sufficient data), excluding results caused by the trigger event.
v. Modify the beach grade according to the revised SIC and MAC.
Data requirements for modifying an SFRG
To reassess the MAC, rainfall-related data should be identified and removed from the dataset. This requires all rainfall data to be marked for easy identification in subsequent years. If removing rainfall data decreases the size of the dataset below the 100 required to generate a MAC, it cannot be modified. Sampling in the subsequent season may be sufficient to generate the required number of samples to reassess the MAC. If not, councils should design a programme to meet this requirement, or stick with modifying the SFRG based on the revised SIC category only. Once sufficient data has been collected the MAC can be reassessed and the SFRG modified accordingly.
The following example illustrates how to modify a grade.
PART III: EXPLANATORY NOTES TO THE GUIDELINES. June 2003
H22
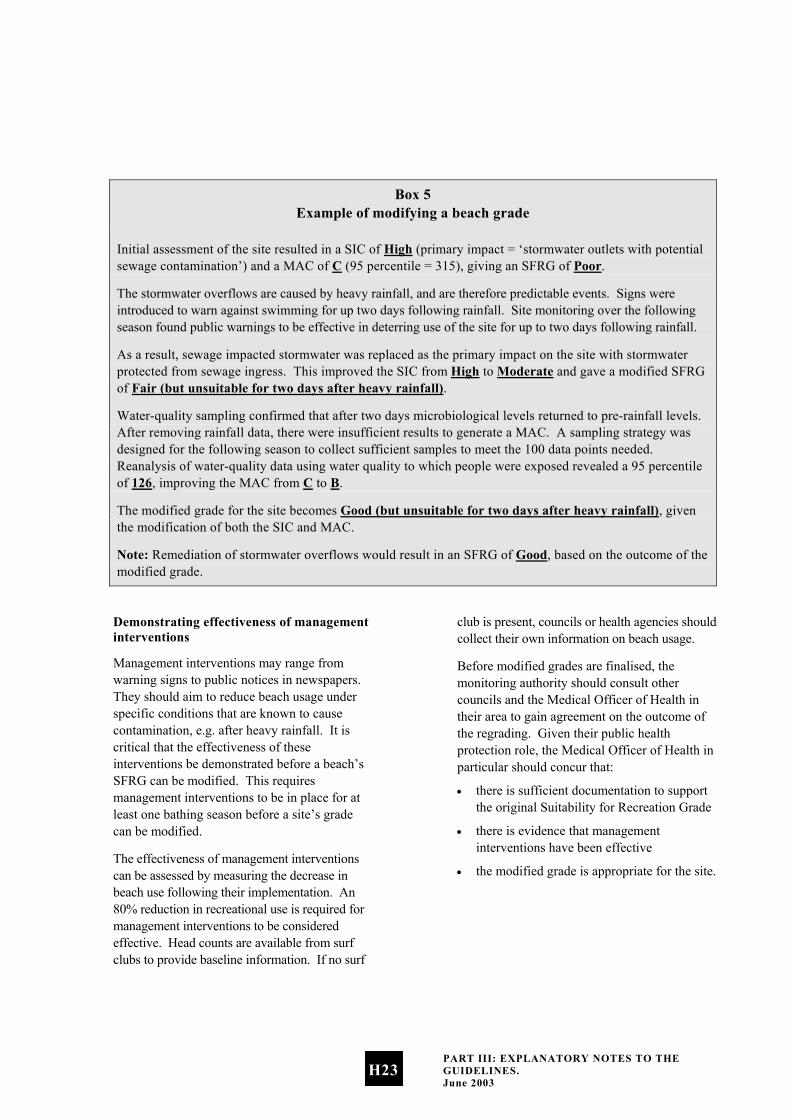
Box 5 Example of modifying a beach grade
Initial assessment of the site resulted in a SIC of High (primary impact = ‘stormwater outlets with potential sewage contamination’) and a MAC of C (95 percentile = 315), giving an SFRG of Poor.
The stormwater overflows are caused by heavy rainfall, and are therefore predictable events. Signs were introduced to warn against swimming for up two days following rainfall. Site monitoring over the following season found public warnings to be effective in deterring use of the site for up to two days following rainfall.
As a result, sewage impacted stormwater was replaced as the primary impact on the site with stormwater protected from sewage ingress. This improved the SIC from High to Moderate and gave a modified SFRG of Fair (but unsuitable for two days after heavy rainfall).
Water-quality sampling confirmed that after two days microbiological levels returned to pre-rainfall levels. After removing rainfall data, there were insufficient results to generate a MAC. A sampling strategy was designed for the following season to collect sufficient samples to meet the 100 data points needed. Reanalysis of water-quality data using water quality to which people were exposed revealed a 95 percentile of 126, improving the MAC from C to B.
The modified grade for the site becomes Good (but unsuitable for two days after heavy rainfall), given the modification of both the SIC and MAC.
Note: Remediation of stormwater overflows would result in an SFRG of Good, based on the outcome of the modified grade.
Demonstrating effectiveness of management interventions
Management interventions may range from warning signs to public notices in newspapers. They should aim to reduce beach usage under specific conditions that are known to cause contamination, e.g. after heavy rainfall. It is critical that the effectiveness of these interventions be demonstrated before a beach’s SFRG can be modified. This requires management interventions to be in place for at least one bathing season before a site’s grade can be modified.
The effectiveness of management interventions can be assessed by measuring the decrease in beach use following their implementation. An 80% reduction in recreational use is required for management interventions to be considered effective. Head counts are available from surf clubs to provide baseline information. If no surf
club is present, councils or health agencies should collect their own information on beach usage.
Before modified grades are finalised, the monitoring authority should consult other councils and the Medical Officer of Health in their area to gain agreement on the outcome of the regrading. Given their public health protection role, the Medical Officer of Health in particular should concur that:
there is sufficient documentation to support the original Suitability for Recreation Grade
•
•
•
there is evidence that management interventions have been effective
the modified grade is appropriate for the site.
PART III: EXPLANATORY NOTES TO THE GUIDELINES. June 2003
H23
What information to report?
Where site grades have been modified, regional and local councils will report the modified grade to the public. The modified grade provides information on the condition of the site, including when it is not suitable for recreational use (i.e. Good – except for two days following rainfall). While the ‘actual’ water quality at the site hasn’t been improved by removing the source of contamination, the risk has been mitigated through effective management interventions.
The Ministry for the Environment is interested in reporting the original SFRGs, as these reflect the actual water quality and potential for faecal contamination. Reporting the original SFRG will enable the Ministry to pick up improvements to the overall condition of beaches as a result of infrastructural or landuse changes over time.
Note H(xiii): Percentile guideline values for seawater (WHO 2001) and freshwater
Seawater
For marine waters, only faecal streptococci (enterococci) showed a dose–response relationship for both gastrointestinal illness (Kay et al 1994) and Acute Febrile Respiratory Infection (AFRI) (Fleisher, Kay, Salmon et al 1996). A recent reanalysis of this data (Kay et al 2001) using a range of contemporary statistical tools has confirmed that the relationships originally reported are robust to alternative statistical approaches.
The guideline values for microbiological quality given in Table H1 are derived from the key studies described in the previous paragraph.
The cut-off or bounding values (40, 200, 500) are expressed in terms of the 95th percentile of numbers of faecal streptococci per 100 mL, and represent readily understood levels of risk, based on the exposure conditions of the key studies.
For the purposes of water-quality monitoring, the terms ‘faecal streptococci’, ‘intestinal enterococci’ and ‘enterococci’ are considered to be synonymous (Figueras et al 2000). Exposure to recreational waters with these measured indicators refers to body contact that is likely to involve head immersion, such as swimming, surfing, white-water canoeing, scuba diving and dinghy-boat sailing.
PART III: EXPLANATORY NOTES TO THE GUIDELINES. June 2003
H24
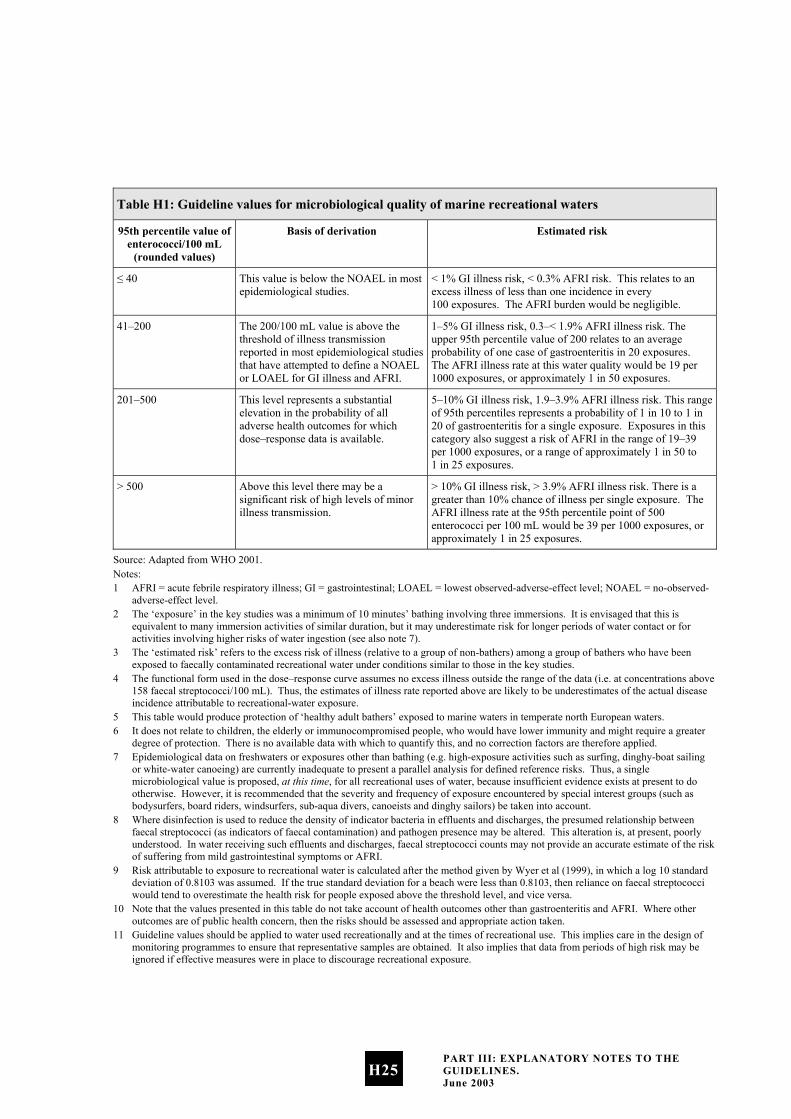
Table H1: Guideline values for microbiological quality of marine recreational waters
95th percentile value of enterococci/100 mL
(rounded values)
Basis of derivation Estimated risk
≤ 40 This value is below the NOAEL in most epidemiological studies.
< 1% GI illness risk, < 0.3% AFRI risk. This relates to an excess illness of less than one incidence in every 100 exposures. The AFRI burden would be negligible.
41–200 The 200/100 mL value is above the threshold of illness transmission reported in most epidemiological studies that have attempted to define a NOAEL or LOAEL for GI illness and AFRI.
1–5% GI illness risk, 0.3–< 1.9% AFRI illness risk. The upper 95th percentile value of 200 relates to an average probability of one case of gastroenteritis in 20 exposures. The AFRI illness rate at this water quality would be 19 per 1000 exposures, or approximately 1 in 50 exposures.
201–500 This level represents a substantial elevation in the probability of all adverse health outcomes for which dose–response data is available.
5–10% GI illness risk, 1.9–3.9% AFRI illness risk. This range of 95th percentiles represents a probability of 1 in 10 to 1 in 20 of gastroenteritis for a single exposure. Exposures in this category also suggest a risk of AFRI in the range of 19–39 per 1000 exposures, or a range of approximately 1 in 50 to 1 in 25 exposures.
> 500 Above this level there may be a significant risk of high levels of minor illness transmission.
> 10% GI illness risk, > 3.9% AFRI illness risk. There is a greater than 10% chance of illness per single exposure. The AFRI illness rate at the 95th percentile point of 500 enterococci per 100 mL would be 39 per 1000 exposures, or approximately 1 in 25 exposures.
Source: Adapted from WHO 2001. Notes: 1 AFRI = acute febrile respiratory illness; GI = gastrointestinal; LOAEL = lowest observed-adverse-effect level; NOAEL = no-observed-
adverse-effect level. 2 The ‘exposure’ in the key studies was a minimum of 10 minutes’ bathing involving three immersions. It is envisaged that this is
equivalent to many immersion activities of similar duration, but it may underestimate risk for longer periods of water contact or for activities involving higher risks of water ingestion (see also note 7).
3 The ‘estimated risk’ refers to the excess risk of illness (relative to a group of non-bathers) among a group of bathers who have been exposed to faecally contaminated recreational water under conditions similar to those in the key studies.
4 The functional form used in the dose–response curve assumes no excess illness outside the range of the data (i.e. at concentrations above 158 faecal streptococci/100 mL). Thus, the estimates of illness rate reported above are likely to be underestimates of the actual disease incidence attributable to recreational-water exposure.
5 This table would produce protection of ‘healthy adult bathers’ exposed to marine waters in temperate north European waters. 6 It does not relate to children, the elderly or immunocompromised people, who would have lower immunity and might require a greater
degree of protection. There is no available data with which to quantify this, and no correction factors are therefore applied. 7 Epidemiological data on freshwaters or exposures other than bathing (e.g. high-exposure activities such as surfing, dinghy-boat sailing
or white-water canoeing) are currently inadequate to present a parallel analysis for defined reference risks. Thus, a single microbiological value is proposed, at this time, for all recreational uses of water, because insufficient evidence exists at present to do otherwise. However, it is recommended that the severity and frequency of exposure encountered by special interest groups (such as bodysurfers, board riders, windsurfers, sub-aqua divers, canoeists and dinghy sailors) be taken into account.
8 Where disinfection is used to reduce the density of indicator bacteria in effluents and discharges, the presumed relationship between faecal streptococci (as indicators of faecal contamination) and pathogen presence may be altered. This alteration is, at present, poorly understood. In water receiving such effluents and discharges, faecal streptococci counts may not provide an accurate estimate of the risk of suffering from mild gastrointestinal symptoms or AFRI.
9 Risk attributable to exposure to recreational water is calculated after the method given by Wyer et al (1999), in which a log 10 standard deviation of 0.8103 was assumed. If the true standard deviation for a beach were less than 0.8103, then reliance on faecal streptococci would tend to overestimate the health risk for people exposed above the threshold level, and vice versa.
10 Note that the values presented in this table do not take account of health outcomes other than gastroenteritis and AFRI. Where other outcomes are of public health concern, then the risks should be assessed and appropriate action taken.
11 Guideline values should be applied to water used recreationally and at the times of recreational use. This implies care in the design of monitoring programmes to ensure that representative samples are obtained. It also implies that data from periods of high risk may be ignored if effective measures were in place to discourage recreational exposure.
PART III: EXPLANATORY NOTES TO THE GUIDELINES. June 2003
H25
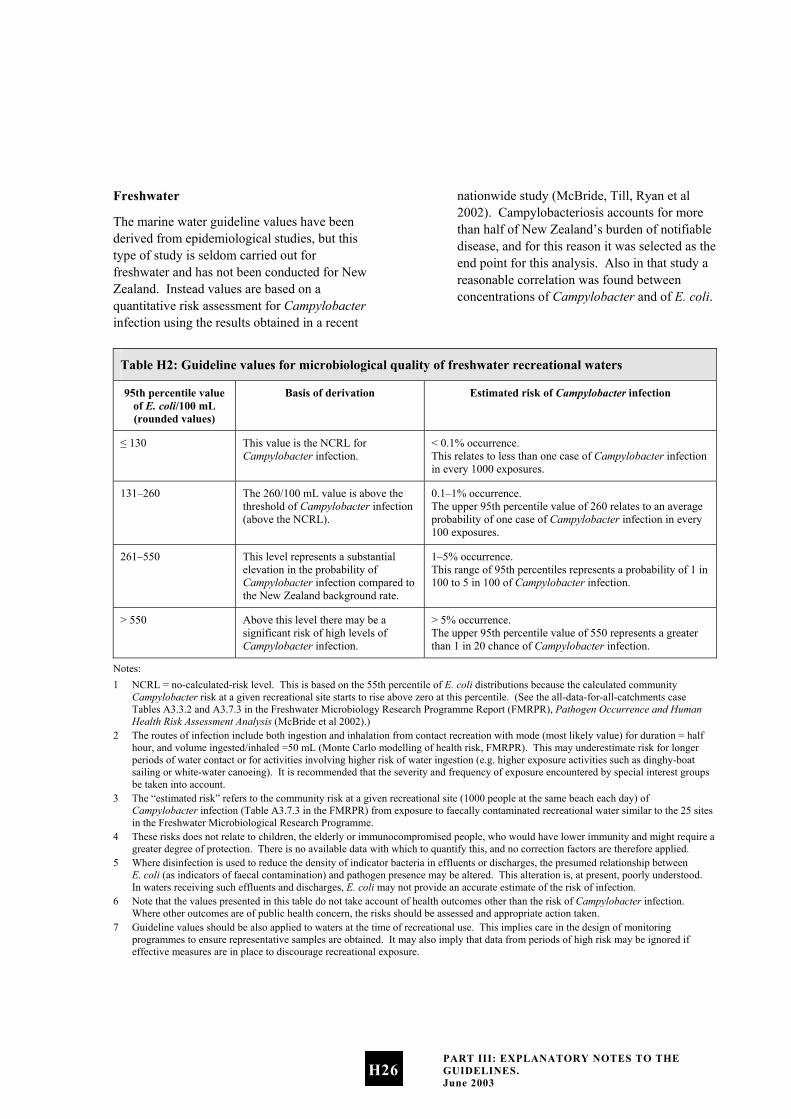
Freshwater
The marine water guideline values have been derived from epidemiological studies, but this type of study is seldom carried out for freshwater and has not been conducted for New Zealand. Instead values are based on a quantitative risk assessment for Campylobacter infection using the results obtained in a recent
nationwide study (McBride, Till, Ryan et al 2002). Campylobacteriosis accounts for more than half of New Zealand’s burden of notifiable disease, and for this reason it was selected as the end point for this analysis. Also in that study a reasonable correlation was found between concentrations of Campylobacter and of E. coli.
Table H2: Guideline values for microbiological quality of freshwater recreational waters
95th percentile value of E. coli/100 mL (rounded values)
Basis of derivation Estimated risk of Campylobacter infection
≤ 130 This value is the NCRL for Campylobacter infection.
< 0.1% occurrence. This relates to less than one case of Campylobacter infection in every 1000 exposures.
131–260 The 260/100 mL value is above the threshold of Campylobacter infection (above the NCRL).
0.1–1% occurrence. The upper 95th percentile value of 260 relates to an average probability of one case of Campylobacter infection in every 100 exposures.
261–550 This level represents a substantial elevation in the probability of Campylobacter infection compared to the New Zealand background rate.
1–5% occurrence. This range of 95th percentiles represents a probability of 1 in 100 to 5 in 100 of Campylobacter infection.
> 550 Above this level there may be a significant risk of high levels of Campylobacter infection.
> 5% occurrence. The upper 95th percentile value of 550 represents a greater than 1 in 20 chance of Campylobacter infection.
Notes: 1 NCRL = no-calculated-risk level. This is based on the 55th percentile of E. coli distributions because the calculated community
Campylobacter risk at a given recreational site starts to rise above zero at this percentile. (See the all-data-for-all-catchments case Tables A3.3.2 and A3.7.3 in the Freshwater Microbiology Research Programme Report (FMRPR), Pathogen Occurrence and Human Health Risk Assessment Analysis (McBride et al 2002).)
2 The routes of infection include both ingestion and inhalation from contact recreation with mode (most likely value) for duration = half hour, and volume ingested/inhaled =50 mL (Monte Carlo modelling of health risk, FMRPR). This may underestimate risk for longer periods of water contact or for activities involving higher risk of water ingestion (e.g. higher exposure activities such as dinghy-boat sailing or white-water canoeing). It is recommended that the severity and frequency of exposure encountered by special interest groups be taken into account.
3 The “estimated risk” refers to the community risk at a given recreational site (1000 people at the same beach each day) of Campylobacter infection (Table A3.7.3 in the FMRPR) from exposure to faecally contaminated recreational water similar to the 25 sites in the Freshwater Microbiological Research Programme.
4 These risks does not relate to children, the elderly or immunocompromised people, who would have lower immunity and might require a greater degree of protection. There is no available data with which to quantify this, and no correction factors are therefore applied.
5 Where disinfection is used to reduce the density of indicator bacteria in effluents or discharges, the presumed relationship between E. coli (as indicators of faecal contamination) and pathogen presence may be altered. This alteration is, at present, poorly understood. In waters receiving such effluents and discharges, E. coli may not provide an accurate estimate of the risk of infection.
6 Note that the values presented in this table do not take account of health outcomes other than the risk of Campylobacter infection. Where other outcomes are of public health concern, the risks should be assessed and appropriate action taken.
7 Guideline values should be also applied to waters at the time of recreational use. This implies care in the design of monitoring programmes to ensure representative samples are obtained. It may also imply that data from periods of high risk may be ignored if effective measures are in place to discourage recreational exposure.
PART III: EXPLANATORY NOTES TO THE GUIDELINES. June 2003
H26
Note H(xiv): Derivation of alert and action levels for seawater and freshwater
The alert and action levels are management tools, ensuring that risks are kept below illness risks of about 2% per 1000 swimmers. They represent, respectively, 80% and 90% one-sided upper tolerance limits, assuming that the waters are borderline for compliance with previous guidelines and a stated variability applies (measured as the standard deviation of logarithms).
See Appendix 2: Developing the Guidelines.
Note H(xv): State of the environment analysis and reporting
Monitoring and reporting the state of the environment
This section discusses the Ministry’s Environmental Monitoring and Reporting system, which uses environmental performance indicators to report on the state of the environment. The Microbiological Water Quality Guidelines for Marine and Freshwater Recreational Areas serve as the monitoring protocol for the marine and freshwater recreation indicators. In this document the monitoring approach, analysis and data management procedures are described to ensure the generation of robust information for reporting of the indicators.
Good-quality information is increasingly important for central and local government to meet public expectations, be accountable and demonstrate performance. Information is used to produce State of the Environment reports; to review national legislation, regional and district plans; to assess compliance of resource consents; for environmental education, and for the strategic and annual planning process.
Partnerships for monitoring and reporting
The Ministry for the Environment has been working with Regional, City and District Councils, Medical Officers of Health and the Ministry of Health to develop approaches for monitoring and reporting the state of recreational beaches.
Should the Ministry for the Environment want to use the information generated for National State of the Environment reporting then the Ministry would work in partnership with Councils to agree on the principles for information sharing.
Software
The Ministry for the Environment has developed software to assist councils with the process of grading beaches, and calculating the two state of the environment indicators. The software (Bathewatch.exe) follows the same format as the guidelines and uses historical data and information from the Catchment Assessment Checklist to calculate the Microbiological Assessment Category and the Sanitary Inspection Category. The MAC and SIC are used to generate a Suitability for Recreation Grade and percentage compliance with the guidelines for the site.
The software and a user guide can be downloaded from the Ministry’s website: www.mfe.govt.nz.
PART III: EXPLANATORY NOTES TO THE GUIDELINES. June 2003
H27
Data storage and archiving
Most councils store their data as Excel files. The user guide for the Bathewatch software specifies the data file format requirements for loading data into the software. For the MAC component of the SFRG assessment, the data collected from field observations must be stored in a comma-delimited value (*.csv) file format. The data must be stored in this specific file format or it will fail to load properly. It is a simple process to convert files from an Excel format into a *.csv format. The procedure is detailed in the Bathewatch user guide.
It is expected that councils will archive their monitoring data using the council’s normal computer back-up system. The council may wish to consider burning the data onto a CD or an otherwise secure file.
Note H(xvi): Reporting to the public
Public health reporting
If exceedances of alert and/or action levels are recorded during weekly monitoring of recreational beaches, the appropriate responses should be undertaken, as described in section D.4 of the guidelines and Note H(xvii) of these notes.
State of the Environment reporting
The two beach water quality indicators can be reported using the data generated by councils. For:
•
•
the percentage of monitored beaches in each beach grade
the indicator provides a measure of the general state of bathing beaches by combining the risk of contamination from the catchment with the microbiological monitoring at the beach. It reports the overall suitability of beaches for bathing. Beaches will be classified into one of five grades (from very good to very poor).
And for:
the percentage of the season beaches or coastal areas are suitable for bathing or shellfish gathering
the indicator will give an indication of the amount of time in a season the water quality was considered suitable for bathing or shellfish gathering. It provides a measure of the variation of microbiological quality of bathing waters within a bathing season.
Indicator fit with the pressure-state-response model
The Ministry for the Environment has used the pressure-state-response (PSR) model for developing environmental performance indicators – refer to Note G(iii): State of the Environment Reporting, page G3.
The indicators on which these guidelines are based - percentage of monitored beaches in each beach grade, and percentage of the season beaches or coastal areas were suitable for contact recreation or shellfish gathering - are state indicators that provide general information on the public health risk presented by recreational waters. Pressure indicators would measure the surrounding land use and discharges to water to assist identification of potential causes of changes in water quality. Response indicators would identify management or policy changes (e.g. infrastructural improvements, land-use management policies, national environmental standards) to manage issues for recreational waters.
Note H(xvii): Management responses to exceedances for marine and freshwater
The planned responses to exceedances of the guidelines should be considered and documented when establishing a regional monitoring protocol, and communicated to all
PART III: EXPLANATORY NOTES TO THE GUIDELINES. June 2003
H28
agencies that will have a role to play (e.g. regional councils, territorial local authorities and health agencies). Documentation should clearly state who is responsible for carrying out what actions in response to exceedances. If the response varies from site to site, depending on the overall grade, this should also be clearly stated.
See Section B for details on who monitors and reports.
Single-sample exceedances
The point of having single-sample limits is to identify variations in water quality within the bathing season that pose an immediate risk to human health.
There are two levels of response to single-sample exceedances.
Alert mode
The first is alert (or amber) mode, and is triggered when a single sample is greater than 140 enterococci per 100 mL for marine waters and 260 E. coli per 100 mL for freshwaters. In this situation, sampling should be increased to daily to improve the information base and identify whether or not the problem is ongoing. A catchment assessment should be carried out to identify all possible sources of contamination. The monitoring authority should inform the Medical Officer of Health and the other council(s) (either regional or local, depending on who is doing the monitoring).
Action mode
The second level of response to a single-sample exceedance is action (or red) mode. In the case of marine waters this is triggered when two consecutive samples are greater than 280 enterococci per 100 mL, and for freshwaters when a single sample exceeds 550 mL E. coli per 100 mL. In this instance the monitoring authority informs the Medical
Officer of Health and the other council(s) of the problem. Sampling is increased to daily and a catchment assessment carried out to identify the source of the contamination. The public should be notified of the health risks using appropriate methods identified in the regional monitoring plan. Discussion between the regional council, territorial local authority and Medical Officer of Health should take place to ascertain who is responsible for fixing the problem.
The Ministry for the Environment and Ministry of Health have developed sign templates in consultation with councils and health agencies to use in response to exceedance events and at high-risk sites. (See Appendix 3 for these sign templates.)
High-risk sites
High-risk sites are those sites graded Poor or Very Poor, and will generally have direct discharges, such as sewer outfalls, impacting on them. While the guidelines and notes provide details on assessing these sites and recommend that permanent signs be erected to warn the public of the health risks (see Appendix 3 for sign templates), there is no discussion on remediation work. The agencies responsible for managing the infrastructure or land use affecting water quality, and those responsible for monitoring the sites and public health protection, may wish to discuss and document the remediation work required, and the timeframes, budgets, etc, for achieving this.
Communicating health risks
Communicating health risk is required after exceedance of the action level of the guidelines, as monitoring has identified increased levels of faecal material, which mean the site is unsuitable for recreational use. In order to protect public health, local authorities are required to notify the public of those health risks until the problem has been remedied.
PART III: EXPLANATORY NOTES TO THE GUIDELINES. June 2003
H29
When to issue warnings
The guidelines identify an action level, at which point use of a recreational site is considered unsuitable for contact recreation. For marine waters this is when two consecutive samples taken are greater than 280 enterococci per 100 mL, and for freshwaters when a single sample exceeds 550 E. coli per 100 mL. Warnings should be issued as soon as possible after the results from the sample are available. If contamination is obvious and likely to be ongoing, it is not necessary to wait for results from samples before issuing a health warning.
Other agencies involved in monitoring and reporting should be notified of exceedances before notifying the public of health risks.
Who to contact
The regional monitoring plan will clearly define lines of communication and responsibilities, such as whose role it is to notify the public. Results should be communicated as soon as possible to the agency responsible for public notifications.
What messages to convey
There are several messages to consider when issuing warnings, other than that there is a health risk. These are:
•
•
•
•
•
•
•
•
•
•
•
•
•
•
•
there is a health risk
the council is investigating the cause of the problem (i.e. the council is on to it)
a list of alternative beaches to visit in the region
an announcement when the problem has been fixed.
How to deliver the message
There are many ways to communicate information to the public. A number of factors will determine the methods chosen to deliver the warnings, including:
the urgency of the message how well informed the community is the demographic make-up of the community.
The public awareness and education section provides more detail on establishing the best methods of delivering messages to the public (see Appendix 1), but the most widely used methods for health warnings are:
signs newspaper articles radio notices in local shops websites 0800 numbers.
Signs
The Ministry for the Environment and Ministry of Health have developed sign templates in consultation with regional councils, local authorities and public health agencies. These are provided in Appendix 3.
Fact sheets
Fact sheets have been written to help communicate information about the guidelines and monitoring programmes. These generic fact sheets can be used for media releases, handing out at public at meetings, etc. See Appendix 5 for fact sheets on different topics.
Summary
The most important messages to get across are: the health risk the council is responding quickly to the event.
It is also important to convey the unpredictable nature of this type of problem and the difficulties in isolating the cause.
PART III: EXPLANATORY NOTES TO THE GUIDELINES. June 2003
H30
Once the problem has been fixed, the public should be notified. This will be apparent from the removal of signs, but should be highlighted through use of the media, community meetings, and contact with user groups, etc.
The public education and awareness programme outline (Appendix 1) provides more information on engaging public support for the monitoring programme.
Management interventions for modified grades
Management interventions will vary in type according to the nature of the predictable event leading to the modification and the target audience. Interventions may range from permanent warning signs on beaches, to public meetings (see Appendix 1: Public Education and Awareness Programme Outline). The ability to demonstrate the effectiveness of interventions in discouraging the public from using the site during periods of high risk is critical. This is what will lead to a modified grade. How this is assessed will vary, but must be verified by the Medical Officer of Health.
See Note H(xii) for details on modifying grades.
PART III: EXPLANATORY NOTES TO THE GUIDELINES. June 2003
H31

Section I: Appendices
Appendix 1: Public
Education and Awareness
Programme Outline
The need to incorporate guidance on developing a public education and awareness programme as part of the Microbiological Water Quality Guidelines for Marine and Freshwater Recreational Areas was identified through feedback from councils and health authorities. Communicating risk, changing attitudes and behaviours towards monitoring programmes and water-quality issues, and inter-agency communication were among the main drivers for developing this appendix.
The goal of the Guidelines is to protect human health. In many cases, there is no ‘quick fix’ to bacteriological contamination of recreational waters, so one of the goals becomes risk communication. Relevant information must be communicated in an effective, efficient and timely way to the public, allowing them to make informed choices about whether to swim. Implementing a public education and awareness programme will help the public better understand what the guidelines mean to them, how they can minimise their chances of becoming sick as a result of swimming, and what – if anything – they can do to help improve their local water quality.
Designing and implementing your own programme
This appendix aims to provide councils and health agencies with a broad template for designing and implementing their own public education and awareness programme, to help achieve the broad aim of the guidelines:
to ensure that the public are informed of the microbiological health risks in time for them to make informed decisions about whether or not to enter the water.
APPENDIX 1: PUBLIC EDUCATION AND AWARENESS PROGRAMME OUTLINE. June 2003
I1

Local variation and differences in the learning methods of the different stakeholder groups (e.g. informed versus uninformed) will to some extent determine the best means of delivering a message or forum for consultation. Taking the process in ‘bite-sized chunks’ and providing local context is a good basis for local programmes.
For additional information on designing, implementing and evaluating an environmental education programme, contact the education officer within your organisation or visit the Sustainable Management Fund website (ww.smf.govt.nz) and download a copy of Environmental Education: A guide for programme providers – how to develop, implement and evaluate strategies and programmes.
Objectives
While the objective of the Guidelines may be met through risk communication in response to contamination events, mitigating contamination events requires a more detailed approach. Longer-term goals to clean up where poor water quality exists and where the community10 demands good water quality will inevitably require some action from individuals. In order to facilitate a change in attitudes and behaviours from the community, they need to be aware of their impact on water quality and what they can do to minimise those impacts.
Therefore, the two objectives of a public education and awareness programme are:
•
•
•
•
•
•
•
•
•
•
•
10 For the purposes of any public education and awareness programme, ‘the community’ is defined as people, or groups of people such as businesses, councils, public health agencies, iwi, landowners, etc.
to protect human health through the efficient, effective and timely communication of the health risks associated with using recreational waters
to prevent, and where necessary isolate and remedy, bacteriological contamination of recreational waters.
Other objectives of this type of programme will be to:
develop a base level of understanding of the issues within the community
gain public support for the monitoring programme
build confidence in the authority carrying out the monitoring
accentuate the positive areas and use them as a selling point for the region
build an image of responsibility for the council
inform beach users of the immediate health risk
manage community concern and public outrage
maintain a responsible image
encourage and facilitate community ownership and participation.
What is public education and awareness?
The following hierarchy defines public awareness and education:
i. information: pamphlets, posters, etc.
ii. communication: public meetings, submissions, call centres, etc.
iii. education: consultation, developing knowledge, awareness, attitudes, values and skills that contribute to maintaining and improving the environment (Ministry for the Environment 1999).
APPENDIX 1: PUBLIC EDUCATION AND AWARENESS PROGRAMME OUTLINE. June 2003
I2
The level at which councils and health agencies enter into a programme will depend on their statutory functions and their agreed role in implementing the guidelines. It will also depend on what level of participation or action the community expects. For example, one community may wish to be directly involved in a local monitoring programme, while others may be content to see weekly results published in the local paper.
Whatever the intention, this should be clear from the outset, and care taken not to raise expectations beyond this, as it will inevitably result in community backlash and mistrust in the council or health agency.
What is the environmental issue?
New Zealand has an extensive coastline and freshwater recreational area, which is used for a wide variety of recreational activities. Primarily usage is highest during the summer months (November to March), but there may be areas of the country or user groups that use recreational sites all year round. While water quality at New Zealand’s recreational beaches and freshwater sites is good most of the time, there are occasions when water may become contaminated with bacteria or viruses that cause respiratory or gastrointestinal illnesses, or skin infections. Susceptibility to illness is increased in those who have a compromised immune system, the very young and the elderly, and in severe cases may result in hospitalisation.
At the local/regional level specific environmental issues may vary. Consultation with local communities will help to identify these issues.
Who are the stakeholders?
It is important when designing an education strategy to identify the key stakeholders and how they use the beach in question. This will vary across the country and within each region or district, and may depend on the type of recreational site. There will also be variability over time within each user group; for example, there may be walkers who use the beach every day throughout the year, and those that only visit two or three times a season.
The main point is that baseline levels of awareness between and within stakeholder groups will vary considerably, as will the way in which they want/need to be involved in the programme. It is important to recognise this when designing a programme and to ensure the programme can be delivered at a variety of levels to suit the needs of those involved.
The following is a list of potential stakeholders, divided into those within monitoring agencies and those within the wider community.
Within council
Council staff
Council staff will inevitably have contact with the public, particularly after a pollution event when signs are posted advising against swimming. Frontline staff in particular should be trained appropriately to deal with possible irate members of the public, and be informed when they might expect such calls. Field staff may also come into contact with members of the public who are angry with the council for closing a beach. It is vital these staff are prepared for such encounters, and that the information they give the public is consistent with what other staff are communicating.
APPENDIX 1: PUBLIC EDUCATION AND AWARENESS PROGRAMME OUTLINE. June 2003
I3

Councillors and potential councillors
It is important that councillors and potential councillors are aware of the issues surrounding beach water quality as they have a great deal of influence on what priority programmes are given. They are also directly affected by bad press and will need to be prepared should a pollution event result in media coverage.
Outside the council
Beach users
This group includes a variety of users that will vary locally. It is important to identify all user groups and how best to involve them in the programme, or at least how to communicate information. Some potential user groups are:
•
•
•
•
•
•
•
•
•
•
•
local clubs (e.g. surf life-saving, Lions, waterski, sea scouts, walkers, kayakers)
national and international groups (e.g. triathletes, boaties)
schools
parent networks
iwi
Pacific peoples’ groups
other community groups
ratepayers (including community boards).
These groups may be unaware of water-quality issues. They are also directly affected by poor water quality, beach closures and health impacts. The level of understanding and awareness should be established and programmes set accordingly. It is important that beach/river users are brought up to speed on the issue and kept informed throughout the monitoring season.
Local community (non-beach users)
Not everyone in the local community is interested in going to the beach. However, everyone will be affected by publicity about poor water quality at bathing beaches in their region. For example, homeowners may suffer a drop in property values and local businesses may notice a drop in trade. As with beach users it is important the local community is informed about the issue, and kept informed throughout the monitoring season.
Environmental interest groups
Environmental groups may have a greater level of understanding of the issues, so communicating with them at the same level as the above groups may be redundant or even detrimental. Instead, support from these groups should be sought. Environmental groups have the ability to sway the opinion of the general public, and if supportive of the council’s programme may be a real asset.
Media
The way the media interpret and report events will inevitably influence the community. Efforts should be made to ensure the message being reported by the media is accurate and factual, and that the positive aspects of the monitoring programme are highlighted.
Business
This includes:
retail outlets, cafes, dairies, etc
tourism operators (including the Tourism Board)
dive clubs.
APPENDIX 1: PUBLIC EDUCATION AND AWARENESS PROGRAMME OUTLINE. June 2003
I4

Local businesses can be dramatically affected when a water-quality problem is identified. They can also be very influential in the community. Keeping them informed and getting their support for the monitoring programme at all stages is essential. Encouraging tourist operators to use clean beaches as a selling point will benefit the whole region, and provide an incentive to clean up beaches that experience water-quality problems.
Public health agencies, hospitals, GPs and laboratories
These groups need to be made aware that gastric and respiratory illnesses as well as skin infections can be caused through contact with bacteriologically contaminated bathing water. These agencies have a lot of contact with the public, so they are able to disseminate information effectively. This can be done through posters, fact sheets, and advice from staff.
What are the key outcomes sought?
If the objective of a public education and awareness programme is to encourage public participation, then the key outcomes of a programme should be developed in consultation with the community and be prepared to deliver what is jointly agreed. Developing outcomes in consultation with local communities will ensure they relate closely to regional or local issues.
On the other hand, if the intention is purely to communicate the results of your monitoring and to alert the public to specific contamination events, then consultation would be inappropriate, as it would raise false expectations and inevitably result in backlash.
Some key outcomes of a public education and awareness programme might be:
increased understanding within the community of what the monitoring programme is about including:
•
•
•
– how, when, where and why monitoring is done
– what the indicator bacteria are and what their presence means
– costs and other resourcing issues – how the results will be used – the scale of the issue: put it into a local,
national and international context – sources of contamination and problem
areas (e.g. stormwater, ageing infrastructure)
– causes of contamination are not always predictable
– even if a beach is ‘clean’, councils will monitor anyway to identify unexpected risks
participation in ‘care’ groups
a decrease in the number of swimming-related illnesses.
What methods should you use and what materials do you need?
The methods and materials used to get the message across will vary locally and with each stakeholder group. Consultation with the community will help to identify the level at which various groups wish to be involved and how they prefer to receive material and information. Consulting within the council will also help to identify existing programmes that can be tapped into to avoid reinventing the wheel and creating confusion.
The urgency of the message/information will also determine the methods used; e.g. if there is a contamination event and the message is a public health warning.
APPENDIX 1: PUBLIC EDUCATION AND AWARENESS PROGRAMME OUTLINE. June 2003
I5
See Note H(xvii) for information on issuing health warnings.
The following are a variety of methods that can be used to deliver a range of materials:
media – press (local and regional papers, magazines), radio
•
•
•
•
•
•
•
•
•
•
•
•
•
•
internet
fact sheets (see Appendix 5)
pamphlets
community meetings
school visits
notices in local businesses
notices/pamphlets in medical centres and hospital waiting rooms
presentations to council committee meetings
meetings with specific user groups
establishing ‘care’ groups
signs at beaches (see Appendix 3)
0800 numbers
getting influential community members on board.
Practical considerations for delivering the programme
Identifying up front the practical aspects of how the programme will be delivered will avoid confusion and frustration when it comes time to implementing it. The following factors should be considered in advance of implementing the programme.
Who?
Clearly define who is responsible for delivering the programme. This is critical. Identify which agency will be responsible and the roles of individuals/officers within each organisation. The roles and responsibilities set out in Section B of Part I will help to identify which agencies and officers should be involved in a public education and awareness programme.
Clearly defined lines of communication within monitoring agencies, between agencies (regional council, territorial local authority and Medical Officer of Health) and to the public should be documented in the monitoring plan. This will include identifying the agency and officer responsible for notifying the public of health risks.
When?
Determining the timing for the programme is also very important, especially when communicating information about contamination events, which requires an immediate response. Starting the programme with sufficient time to lead in to the bathing season may also be useful. Timing of programmes will vary considerably across the country and will need to be decided locally.
As there is likely to be a number of agencies involved in the programme, it is important to define exactly when each of those agencies becomes involved and how.
Where?
Defining the extent of the programme will also affect how it is delivered and will depend on which agency is implementing the programme. Local authorities that co-ordinate programmes regionally may also wish to co-ordinate the public education and awareness programme. More specifically, this will affect what venues are used for public meetings, etc.
APPENDIX 1: PUBLIC EDUCATION AND AWARENESS PROGRAMME OUTLINE. June 2003
I6
How will you monitor implementation and effectiveness?
It is important before beginning a programme such as this to establish a base level of awareness. This will enable progress to measured using this pre-programme information. User-group surveys, household surveys and council staff surveys are some of the methods that can be used to achieve this.
It is also important to review the programme on a regular basis. It will take time before changes in attitudes and behaviours are noticed, so a long-term plan for review is essential. Again, annual surveys are useful for this purpose.
Summary
An open, honest and transparent policy with the public is essential if the council is to gain support for their monitoring and remediation programmes. Authorities who have adopted this approach have received additional funding for infrastructure upgrades and increased community and media backing.
A number of councils have implemented programmes that utilise the community resource, such as training community volunteers to monitor water quality. Volunteers are trained and perform some monitoring functions. This approach has proven to be successful in raising levels of awareness and understanding of the issues surrounding beach water quality and in gaining support for monitoring programmes.
For further information on designing and implementing environmental education programmes, refer to the Ministry for the Environment’s Environmental Education: A guide for programme providers – how to develop, implement and evaluate environmental education programmes (1999).
APPENDIX 1: PUBLIC EDUCATION AND AWARENESS PROGRAMME OUTLINE. June 2003
I7

APPENDIX 1: PUBLIC EDUCATION AND AWARENESS PROGRAMME OUTLINE. June 2003
I8
Appendix 2:
Developing the Guidelines
In this appendix:
section 1 summarises the two basic approaches that have been taken internationally and in New Zealand to the relation between recreational water users’ health risks and the degree of faecal contamination of the water, either by human or animal waste residues
•
•
•
section 2 explains how the results of these studies have been incorporated into these Guidelines
section 3 discusses some implementation issues.
Two basic approaches
Microbiological water-quality guidelines for recreational areas may be developed from two main strands of enquiry into health effects: epidemiological studies or quantitative risk assessment. In the former the focus is on direct measurement of health effects while in the latter the focus is first on pathogen concentrations, with health effects then being inferred using known dose-response relationships. Both types of study have been used to develop these guidelines: epidemiological for the marine waters and quantitative risk assessment for the freshwaters.
The main reason for choosing to base marine water guidelines on the epidemiological approach is that there is a wealth of results from such studies (Prüss 1998), including some for New Zealand (McBride, Salmond et al 1998). On the other hand very few such studies are available for freshwaters, and those that are available are nearly all confined to lakes, not rivers. However, we are now in possession of a large amount of data for pathogens and indicators in freshwaters and this has facilitated a quantitative risk assessment approach. Accordingly, the guidelines for freshwaters are based on this approach.
APPENDIX 2: DEVELOPING THE GUIDELINES. June 2003
I9
It is important to note that the wealth of results from international studies now available point overwhelmingly to an association between illness risk to recreational water users and the concentration of suitable faecal indicators (as reviewed by Prüss 1998). They show that careful studies are needed to reveal the relationship, particularly because many of the illnesses concerned are mild and no records are kept of their occurrence (i.e. they are not ‘notifiable’).11 Furthermore, these illnesses include both gastrointestinal and respiratory categories (when sought, respiratory illness effects have often been found; e.g. Fattal et al 1986; Corbett et al 1993; Fleisher, Kay, Salmon et al 1996; McBride, Salmond et al 1998).12 While some studies fail to detect an association (e.g. New Jersey Department of Health 1989), this appears to be caused either by a lack of sufficient statistical power or a lack of an ‘exposure gradient’; i.e. a sufficient range of contamination in the waters studied (as was the case in the New Jersey study).
Epidemiological studies
In these studies one aims to discover the illness record of a number of water users who used a recreational site on a particular day – a day on which water-quality samples were also taken. This calls for an intensive effort in interviewing beach users on the sampling day, and following them up some days later to obtain a record of health effects; i.e. a record of self-diagnosis is obtained (medical records are not available for examination because most swimming-associated illnesses are mild and not notifiable). Associations between health effects and the swimmers versus non-swimmers are sought, to get an estimate of any swimming-associated, pollution-related effects.
11 More severe illnesses (e.g. typhoid) do occur among swimmers at
grossly polluted beaches (e.g. in Egypt, El-Sharkawi & Hassan 1979; Cabelli 1983a).
12 Ear, nose, throat and skin symptoms are also found, often being attributed to bather-to-bather transmission, rather than to micro-organisms of faecal origin.
The group of people interviewed may be those who have decided of their own volition to attend the beach, without knowing that a study was in progress, in which case it is an uncontrolled prospective study. On the other hand people may be recruited into the study and taken to a particular beach where they may swim, in which case it is a controlled cohort study. Most epidemiological studies have been of the former kind, but more recent efforts have used the controlled approach.
Results from controlled cohort studies have recently been endorsed by the World Health Organization and are being incorporated into their international guidance (WHO 2003). Accordingly, these New Zealand guidelines are also based on that approach, marking a distinct change from previous editions of the New Zealand guidelines (1992, 1998, 1999).
Nevertheless, comprehending the history of the development of these studies may be helpful, as given in the following sections.
US studies
Concerns about health risks to bathers in contaminated water in America in the 1940s led to the US Public Health Service conducting a series of uncontrolled prospective follow-up epidemiological studies at river, lake and coastal sites from 1948 to 1950 (Stevenson 1953). This was a large study that reported two statistically significant associations between swimmers’ health risk and water quality, measured as concentration of total coliforms. These two findings were for beaches on Lake Michigan, at Chicago, and for the Ohio River at Dayton, Kentucky (none were found for the two marine sites, in New York City).
APPENDIX 2: DEVELOPING THE GUIDELINES. June 2003
I10
The study design consisted of three major elements:
•
•
•
•
•
•
approaching people at the beach to see whether they would agree to being questioned a few days later about their health
making water-quality measurements at the beach on the same day as beach-goers are approached
within a few days, questioning those who agreed to the follow-up as to any subsequent illness, as well as a host of other possibly confounding factors (such as other swimming, foods eaten, animal contact and household sickness).
Elements of the design of studies used to develop guidelines have been questioned over the years (e.g. Cabelli et al 1975; Moore 1975). This has included the following objections:
‘swimming’ did not necessarily include head immersion
total coliforms are not very effective indexes of faecal pollution
non-swimmers were not at the beach.
Such flaws were addressed in major further studies carried out in the US in the late 1970s and early 1980s for both marine waters (Cabelli 1983a) and freshwaters (Dufour 1984), with the motivation of providing public policy agencies with a relationship between “swimming-associated, pollution-related illness risk” and typical concentrations of faecal indicators (Cabelli et al 1975). The idea was that those agencies could use an ‘acceptable’ health risk to derive limits for faecal indicator concentrations. These researchers never did advocate any acceptable particular values of these risks. Motivation for the other studies was similar. Some workers have actually recommended guidelines or standards (Grabow et al 1989; Wyer et al 1999).
Other marine water epidemiological studies have been carried out in the USA, at New Jersey beaches (New Jersey Department of Health 1989) and at Santa Monica Bay, near stormwater outfalls (Haile et al 1996). The latter study did discover health effects related to proximity to the outfalls.
UK studies
Meanwhile, in the UK a view had held sway since the late 1950s that swimmers’ health risk had no relationship to degree of faecal contamination, unless beaches were “aesthetically revolting” (MRC 1959) or “aesthetically very unsatisfactory” (PHLS 1959). That view was challenged increasingly over the years as being untenable (e.g. Kay & McDonald 1986a; 1986b): it was derived from a retrospective case control study for two severe and notifiable illnesses, and generalised to all illnesses (many of which are not notifiable, and so lack any substantial data). Accordingly, some prospective uncontrolled studies have also been carried out in the UK also (Pike 1994).13
Another UK group has proposed that such studies are better carried out using a recruited, controlled cohort approach (Jones et al 1991). This cohort is randomly split into swimming and non-swimming parts. All eat the same foods. The swimmers are directed where to swim and for how long (immersing the head three times). Many water-quality measurements are made at the assigned swimming points. The follow-up consists of both self-reporting and clinical examinations.
13 This report reviews two sets of UK studies: controlled studies at
four beaches (subsequently reported by Kay et al 1994 and by Fleisher, Kay, Salmon et al 1996), and uncontrolled studies at another eight beaches (partly reported by Balarajan et al 1989 and Alexander et al 1992). A full open-literature paper on the eight-beach study has not been sighted.
APPENDIX 2: DEVELOPING THE GUIDELINES. June 2003
I11
The findings of these careful studies (endorsed by Telford 1996) have reported that faecal streptococci were related to adverse gastrointestinal health effects (threshold 32 per 100 mL, Kay et al 1994) and to acute febrile respiratory illness (threshold 60 per 100 mL, Fleisher, Kay, Salmon et al 1996). (This definition of respiratory illness requires an accompanying fever, and so is more stringent than that used in other studies, such as the one carried out in New Zealand by McBride, Salmond et al 1998.)
Note that the analysis of these UK studies postulates the existence of a threshold effect (a value of water quality below which there is no illness risk to swimmers whatsoever and above which there is). Analyses of other studies (e.g. Cabelli 1983a; Dufour 1984) have used continuous relationships between water quality and swimmers’ health. This is more consistent with the mixture of ages and health status of usual beach-goers: while an individual may have a particular threshold, it is unlikely that a whole population would share the same value. For that reason the UK analysis notes that the threshold should not be considered as an “absolute” value, noting that it may be set to a lower value were the study to have included a larger number of people (Wyer et al 1999).
Other relevant UK marine water studies are Brown et al 1987; Balarajan et al 1989 (see also its discussion by Hall & Rodrigues 1992); Alexander et al 1992 and Fewtrell et al 1994. Freshwater studies for canoeists and rafters have been reported by Fewtrell et al (1992, 1994) and by Lee et al (1997).
New Zealand studies
Prospective epidemiological studies were carried out at seven New Zealand beaches in the 1995/96 bathing season (McBride, Salmond et al 1998). This was particularly driven by concerns in the Auckland region about possible health effects at marine beaches.
Prior to statistical analysis each beach was placed into one of three categories: (i) impacted by human wastes, (ii) impacted by animal wastes, or (iii) pristine.
An association between enterococci concentration and respiratory illness symptoms among those entering the water was identified.14 This included “paddlers”, who entered the water but did not immerse their heads (e.g. tending small children). Relative risks in the highest enterococci quartile were rather high: 4.5 for the paddlers and 3.3 for long-duration swimmers. The unexpectedly limited range of beach contamination during the survey precluded the possibility of developing a detailed statistical model of health risk versus indicator density, as had been hoped.15 No substantial differences in illness risks were found between the two types of impacted beach, but the health risks for both were separable from that at pristine beaches.
Studies in other countries
Other relevant epidemiological studies have been conducted in the following countries (an asterisk * denotes a retrospective study):
•
•
•
•
Australia: Corbett et al 1993; Harrington et al 1993
Canada: EHD 1980; Seyfried et al 1985a and 1985b; Lightfoot 1989
Egypt: Cabelli 1983a; El-Sharkawi & Hassan 1979*
France: Foulon et al 1983; Ferley et al 1989*
14 Some statistically significant associations with faecal coliform and
E. coli concentrations were also noted. However their strength was lower because they tended not to rise through the quartiles of that indicator’s concentrations (whereas enterococci did so rise) and their relative risks were also lower than for enterococci.
15 The enterococci quartiles cut-offs were 1.5, 3.75 and 13 enterococci per 100 mL.
APPENDIX 2: DEVELOPING THE GUIDELINES. June 2003
I12
•
•
•
•
•
•
Holland: Medema et al 1995, 1997
Hong Kong: Holmes 1989; Cheung et al 1990; Kueh et al 1995
Israel: Fattal et al 1986, 1987, 1991
New Zealand: Bandaranayake et al 1993;16 McBride, Salmond et al 1998
Spain: Mujeriego et al 1982*; Mariño et al 1995b
South Africa: Von Schirnding et al 1992; 1993
Comparing controlled and uncontrolled studies
Most of the studies listed above are of the uncontrolled type, so it is appropriate to consider which of the two main approaches to epidemiological studies is the better.
The first consideration is to note that there is no optimal way of conducting epidemiological surveys – each approach has its drawbacks (Lacey and Pike 1989). Clearly some are better than others, and flaws in older studies have been identified and remedied in later studies, such that a reasonably consistent body of evidence has now been gathered (Prüss 1998). In spite of the uncertainties involved in epidemiological studies with low attack rates, it is often still considered to be the best line of approach (cf. a risk calculation approach), where feasible (Ware 1990). This view is in spite of the fact that funds that would be spent on extensive interviewing in the epidemiological approach could be spent on a wider range of indicators and pathogens in a risk-calculation approach.
16 This reports a preliminary trial at two beaches.
The controlled cohort prospective approach offers the most accurate methodology, minimising bias and providing for a balanced matching of swimmers and non-swimmers (Fleisher 1990b; Fleisher, Jones, Kay & Morano 1993). However, its use does require pre-publicity, which may cause enhanced self-reporting rates (Wheeler & Alexander 1992). Also, the cohort used (healthy adult volunteers) is not typical of the usual beach-going population (which includes many ages and variable health status), and the type of swimming activity may not be typical either – especially for high wave-energy New Zealand beaches where boogey boarding and body surfing are so popular. (This is important, because close-to-shore waters are often the more polluted.)
The uncontrolled cohort prospective approach offers the advantages of minimal pre-publicity and of using the actual population using the beach. It suffers from difficulties in assigning water quality to particular swimmers (according to where they swam) and in having a somewhat unbalanced set of swimmers and non-swimmers.
The view taken in these guidelines is that, given the endorsement of the WHO (2003), the results of the carefully conducted controlled cohort UK studies will be used as a basis for marine beach grading. Note that the illness rates reported by these studies, both for swimmers and for non-swimmers, tend to be higher than for uncontrolled studies.
APPENDIX 2: DEVELOPING THE GUIDELINES. June 2003
I13
The quantitative risk assessment approach
Some early work leading to the setting of water-quality microbiological standards and guidelines was based on a risk calculation approach. For example, Streeter (1951) calculated an individual’s risk of contracting typhoid fever or “diarrhoea-enteritis” assuming a concentration of 1000 total coliforms per 100 mL. For 90 consecutive daily exposures to this concentration the calculated risks were 1:950 and 1:50 for the two illnesses, respectively. Also, Furfari (1968) reports how shellfish standards have been calculated.17
Recent developments in this approach have noted a number of shortcomings (see especially Haas et al 1999). In particular:
•
•
•
water users experience a range of concentrations of pathogens and indicators from one day to the next, and even within a day
they also have variable rates of ingestion or inhalation of water, and for varying times
dose-response relationships (between illness risk and indicator density) have been lacking.
With the advent of powerful computer technology these issues can now be addressed relatively easily, using ‘Monte Carlo’ mathematical modelling. This is known as the Quantitative Risk Assessment (QRA) approach. Historical data is used to assign statistical distributions to the ingestion/inhalation rates, duration of exposure, and the concentration of pathogens in the water. Then a random sample is taken from each distribution to calculate the dose, which is then turned into infection or illness probabilities, or into cases, using a dose-response curve. This sampling is done many times over to simulate a large population being exposed to beach water that may, on some occasions, be contaminated.
17 By requiring that no more than 50% of 1 mL samples were positive
for coliforms, that being equivalent to an MPN of about 70 per 100 mL.
When this is done for a population of people at a given beach (not dispersed over many beaches) the end result is that on a majority of occasions there are no cases of infection, but on a few occasions (when the contamination is unusually high and recreational water contact actually occurs) a number of infections, and hence illness, could occur.
The greatest weakness of this approach is the paucity of dose-response information. However, a surprising amount is now available – as reviewed by Teunis et al (1996) for gastrointestinal pathogens; McBride et al (2002) also include a review of material for adenovirus respiratory pathogens, only some of which is covered by Haas et al (1999).
The New Zealand study
The QRA approach has been reported in some detail for New Zealand freshwater recreational waters, as a consequence of a large national study at 22 river and three lake sites, in which five indicators and six pathogens were sampled fortnightly for 15 months in the period 1998–2000 (McBride et al 2002). The main reason for adopting the QRA approach was that epidemiological studies – either controlled or uncontrolled – were held to be unfeasible. While McBride et al (1996) concluded that a controlled cohort study would in fact be feasible, two subsequent considerations ruled it out. First was the difficulty in recruiting suitable cohorts within proper ethical requirements, and second was the paucity of available data on pathogens and indicators in New Zealand freshwaters. Given that there were many indications that freshwaters were rather more contaminated than marine beaches, it seemed prudent to attempt to plug this gap and to use the results in a QRA approach.
APPENDIX 2: DEVELOPING THE GUIDELINES. June 2003
I14
That study produced a wealth of information on the distribution of pathogens and indicators. In particular it found that Campylobacter was present in 60% of all samples, and that human enterovirus and/or human adenovirus were present in 54% of samples. Concentrations and occurrences of Salmonellae, Giardia cysts and Cryptosporidium oocysts were low. Catchments impacted predominantly by birds were the most contaminated, followed by those in which the dominant impact was from dairying or sheep farming. The degree of contamination was strongly related to the turbidity of the water.
In essence the study confirmed the continued use of E. coli as a faecal health-risk indicator, at least so far as Campylobacter is concerned.18 Unfortunately correlations between this indicator and the two virus groups examined (human enterovirus and human adenovirus) were very poor, as was the case for all other indicators examined – somatic coliphage, FRNA phage and C. perfingens spores. Also, correlation between the enterovirus and adenovirus groups was poor (enterovirus has also been used as a general virus indicator).
Accordingly, in the health-risk modelling particular attention was paid to Campylobacter infection as well as enterovirus and adenovirus infections.19 Of the two virus groups, dose-response information suggests strongly that adenovirus is much the more infective, with risk profiles for a given beach being very similar to that for Campylobacter infections.
18 Campylobacteriosis illness forms more than half of all reported
notifiable illnesses in New Zealand, in recent times being around 300 cases per 100,000 population per annum (see the New Zealand Public Health Reports, published by ESR).
19 The endpoint of this analsyis was taken as infection, not illness, principally because once infection rates are controlled to low levels, so too will be the illness rate. Also there are some severe practical difficulties in determining the probability of illness (given infection has occurred) as a function of dose (Teunis et al 1999).
Deriving the guidelines
The following sections describe the basis of the guidelines for marine water and then for freshwater, both for the grading of beaches and for their ongoing surveillance. In each case a subsection describes the changes from previous guidelines.
General considerations
Since 1999 the WHO has favoured using 95 percentiles of microbiological concentrations for grading beaches via a Microbiological Assessment Category (first proposed in the Annapolis Protocol, WHO 1999). That approach is adopted here; i.e. these 2003 guidelines incorporate a risk-based approach to monitoring recreational waters, in addition to single samples as used in previous guidelines. The purpose of incorporating risk assessment is to overcome the constraints of these previous guidelines, as discussed in Section C.
Taking risk into consideration when assessing a site is achieved via a grading process, combining historical microbiological results and sanitary inspection information to give an overall Suitability for Recreation Grade. This grade provides an assessment of the condition of a site at any given time, while single samples are used to identify any immediate health risk.
The WHO provides no guidance for surveillance values; their derivation is explained below.
See Note G(x) for discussion on the Annapolis Protocol.
APPENDIX 2: DEVELOPING THE GUIDELINES. June 2003
I15
Marine waters
Beach grading
Results of the UK controlled epidemiological trials have been used to develop a four-category scale, as shown in Table H1. The essential results are those for gastrointestinal illness (as reported by Kay et al 1994; Wyer et al 1999), but also accompanied by the results for respiratory illness reported by Fleisher, Kay, Salmon et al (1996). In essence 95 percentile enterococci values have been identified relating to cut-off gastrointestinal risks of 1%, 5%, and 10%. The associated respiratory illness risk cut-offs are 0.3%, 1.9% and 3.9%.20 Readers are directed to these publications for details of the modelling approach used to derive these values.
Beach surveillance
Neither the WHO (2003) nor the authors of the UK studies on which the WHO guidance is based give any guidance for deriving surveillance values. Accordingly, we have used results from previous uncontrolled epidemiological studies, in particular those of Cabelli (1983a), also used in previous versions of the guidelines. While this could be argued to be somewhat dislocated, it has the advantage of maintaining good continuity with past practice.
20 Note that these are risks of acute febrile respiratory illness (AFRI).
In the New Zealand study (McBride, Salmond et al 1998), and in other studies, a less strict definition of respiratory illness has been used – essentially not requiring fever as an accompanying symptom. This was a deliberate choice in the New Zealand study, given our incidence of asthma. Accordingly, the risks of more respiratory illness would be higher than these AFRI results indicate.
These values are obtained by assuming that the distribution of enterococci is lognormal, the standard deviation of the logarithms of enterococci concentration is 0.7 (a reasonable average of available data) and the enterococci concentration is at the previous limit of a median of 35 per 100 mL (corresponding, under Cabelli’s model, to a swimming-associated risk of 19 per 1000 bathing events). Then the alert (amber) and action (red) limits are taken as the 80% and 90% upper one-sided tolerance limits for that distribution.21 These figures may be simply calculated as 136 and 276 enterococci per 100 mL.22 Having regard to the uncertainty in estimating the standard deviation (of the logarithms) it seems appropriate to round these figures to 140 and 280 enterococci per 100 mL.
It is important to note that while this calculation is based on the assumption that waters are marginal for compliance with the median value, this does not mean that the alert and action limits will only be exceeded once the health risk rises above 19 per 1000 swimming events. In fact the alert and action limits begin to be exceeded when the true median concentration is someway below 19 per 1000 events. The unfortunate fact is that we can only associate particular risks with average or median values of enterococci; it is impossible to associate risks with any particular enterococci value. All that can be said is that if the alert and action levels are not exceeded then the illness risks are some way below 19 per 1000 recreational events.
21 In the one-sided case, tolerance limits and confidence limits are
operationally identical; this is not so in a two-sided case. 22 The 80 percentile and 90 percentile abscissae of the unit normal
distribution are 0.8416 and 1.2816 respectively. So the one-sided 80% upper tolerance limit is 35x100.8416x0.7 = 135.9. Similarly the 90% upper tolerance limit is 35x101.2816x0.7 = 276.2.
APPENDIX 2: DEVELOPING THE GUIDELINES. June 2003
I16
Changes from previous guidelines
The previous guidelines were based on Cabelli’s uncontrolled study, as implemented by the USEPA. That is a median enterococci concentration of 35 per 100 mL, corresponding to a swimming-associated illness risk of 19 per 1000 swimmers. Also the alert and action limits have been rounded from 136 and 277 enterococci per 100 mL to 140 and 280 enterococci per 100 mL.
Background to the changes
It is of interest to note that the previous guidelines were not based on an explicit adoption of an ‘acceptable illness risk’ of 19 per 1000 bathers. What in fact happened is that the USEPA first proposed that criteria be based on a maximum acceptable illness risk of six per 1000 bathers (in the Federal Register 1984), corresponding to a geometric mean (or median) concentration of three enterococci per 100 mL. Submissions on the proposal noted this limit was so low as to be impractical (i.e. unattainable) in near-shore coastal environments. The counter-argument was made that the previous limit (geometric mean 200 faecal coliforms per 100 mL) had appeared to work satisfactorily, so why not use corresponding limits of enterococci? This argument was accepted by the USEPA, which used ratios of faecal coliforms versus enterococci to establish correspondences between faecal coliforms and the new preferred enterococci indicator (Favero 1985; USEPA 1986a), i.e. 200 faecal coliforms per 100 mL corresponded to 35 enterococci per 100 mL in coastal waters. Using Cabelli’s relationship, this corresponds to an illness risk of 19 per 1000 bathing events.
That is, the ‘acceptable’ illness risks were not chosen a priori23 but were calculated, once it was decided that risks corresponding to the previous criteria (200 faecal coliforms per 100 mL, as a geometric mean) should be adopted.
23 It would be very odd if they had been, since 19 is not a number that
the public might generally adopt as being ‘acceptable’.
In contrast, these new guidelines are based on an explicit choice of acceptable risks.
Freshwaters
Beach grading
For consistency with the marine grading system, the same basic structure is used for the Microbiological Assessment Category, i.e. a four-category scale. However, the risk cut-offs have been set at lower values: 0.1%, 1% and 5%. There are two reasons for adopting these lower values. First, they are based on Campylobacter infection only: we simply lack credible information to develop risk figures for other illnesses. However, as this particular infection is important in the New Zealand setting these risks have been taken as a suitably precautionary approach. Second, the upper level (5%) represents a doubling of the background infection rate and this has been viewed as a tolerable upper limit.
These risks have been calculated in the New Zealand QRA study (McBride, Till, Ryan et al 2002) for Campylobacter infection, results for which as given in Table H2.
The derivation of that table’s figures relied on the moderate correlations found in the New Zealand study between Campylobacter and E. coli concentrations. The values of calculated Campylobacter concentrations corresponding to the risk cut-offs were obtained. These corresponded to Campylobacter percentiles of 55%, 70% and 80–85%.24 The corresponding percentiles of E. coli were then read from its distribution, being 131, 261 and about 550 E. coli per 100 mL. These values were then rounded to the values in Table H2 (viz, 130, 260, 550 E. coli respectively).
24 Using the results for all beaches and all times in Table A3.7.3 of
McBride et al (2002).
APPENDIX 2: DEVELOPING THE GUIDELINES. June 2003
I17
Beach surveillance
In the absence of better information, the alert and action levels have been taken as the second and third E. coli cut-offs for beach grading.
Changes from previous guidelines
The previous guidelines were based on the Dufour (1984) study, as implemented by the USEPA. That is a median E. coli concentration of 126 per 100 mL, corresponding to a swimming-associated illness risk of 8 per 100 bathers. Also, the alert and action limits have been rounded from 273 and 410 E. coli per 100 mL to 260 and 550 E. coli per 100 mL.
Background to the changes
Once again, the previous guidelines were not based on an explicit adoption of an ‘acceptable illness risk’ of 8 per 100 bathers. The reasoning was entirely similar to that given above for marine waters, in which 200 faecal coliforms per 100 mL was found to be equivalent to 126 E. coli per 100 mL. That is, the ‘acceptable’ illness risks were not chosen a priori but were calculated, once it was decided that risks corresponding to the previous criteria (200 faecal coliforms per 100 mL, as a geometric mean) should be adopted.
In contrast, these new guidelines are based on an explicit choice of acceptable risks.
Implementation issues
Change in sampling depth
The provisional guidelines (Department of Health 1992) required sampling at adult chest depth, the reason being that this was the sampling depth used by the two studies on which the guidelines were based (Cabelli 1983a; Dufour 1984). This has now been changed to sampling at 0.5 m. This was partly driven by a concern expressed by some New Zealand sampling teams about the safety of sampling in New Zealand’s high-energy coastal waters. But it was also done in the light of other studies. Controlled-cohort studies in the UK have
shown very clearly that swimming-associated illness risks are related to water quality measured at and only at the swimming location (Fleisher, Jones, Kay, Stanwell-Smith et al 1993; Kay et al 1994).
The 1998 guidelines advocated sampling at 0.5 m. This considered children, who use shallower-depth water and may be more susceptible to illness than adults, and that adults are also exposed to shallower water. The technical justification for the change in sampling depth is as follows.
In the New Zealand study, bathers were exposed to a variety of depths. Water samples were taken at both chest and knee depths. Using a median of 35/100 mL and taking into consideration both gastrointestinal and respiratory illnesses (not considered in studies on which the 1992 provisional guidelines were based), the maximum level of risk to swimmers at a depth of 0.5 m (previously applied to chest depth) remained at 19/1000. Therefore the risk level of 19/1000 relates to the number (35/100 mL) of indicator bacteria measured at any given depth.
However, concentrations of indicator bacteria at 0.5 m are nearly always found to be more than at chest depth (and considerably more than water beyond breaking waves). In fact the New Zealand study found that, on average, the values found at chest depth were about 50% lower than those found at 0.5 m.
Single category for bathing areas
The provisional guidelines followed the USEPA (1986b) in using four separate categories for maximum limits for indicator bacteria. These four categories correspond to four levels of beach usage (infrequent use, light use, moderate use and designated bathing beaches). This was based on the notion of minimising community risk rather than of minimising individual risk, a factor often criticised (Fleisher 1991). The adjustment of the limits to one category of use is based on the principle that the level of risk at a beach is independent of its popularity.
APPENDIX 2: DEVELOPING THE GUIDELINES. June 2003
I18
Difference between faecal streptococci and enterococci
The faecal streptococcus group consists of a number of species of the genus Streptococcus, such as S. faecalis, S. faecium, S. avium, S. bovis, S. equinus and S. gallinarum. They have all been isolated from the faeces of warm-blooded animals, and S. avium and S. gallinarum occur in poultry. S. bovis and S. equinus are residents of the bovine and equine intestinal tracts and, although detectable in their faeces, do not survive well outside the animal host and die off rapidly once exposed to aquatic environments. The faecal streptococci have been used in many of the European, UK and Australian studies of water pollution.
The enterococcus group is a subgroup of the faecal streptococci that includes S. faecalis, S. faecium, S. gallinarum and S. avium. Procedures for the isolation and identification of the enterococcus group from aquatic environments have been well validated as identifying this group as a valuable indicator for determining the extent of faecal contamination of recreational marine waters. Studies at marine and freshwater bathing beaches have indicated that swimming-associated gastroenteritis and respiratory illness can be related directly to the quality of the bathing water, and that enterococci are the most efficient bacterial indicator for marine water quality (Cabelli, Dufour, et al 1983; Dufour 1984; McBride, Salmond et al 1998). The enterococci have been used predominantly in American studies of water pollution, but also in Europe. Studies in New Zealand using enterococci as the indicator of choice form the basis of the current recreational water-quality guidelines for the marine environment.
Urban and rural run-off
Rural and urban run-off can contain both human and animal faeces. The catchment type will reflect the likely proportions of each. Animals can carry pathogens that may be passed on to humans (zoonoses) such as Giardia, Salmonella, Campylobacter, Cryptosporidium (Donnison and
Ross 1999) and verotoxic E. coli (E. coli 0157). In times of high rainfall the pathogens present in animal faeces can be transferred into waterways via stormwater drains or overland flow.
The results of some studies (Calderon et al 1991, as interpreted by McBride 1993; McBride, Salmond et al 1998) indicate that illness risks posed by animal versus human faecal material should be considered to be equivalent, although the first Hong Kong study results are less clear (Cheung et al 1990).
For urban catchments, at least, indicators at beaches could be elevated by inflow (wrong connections) and infiltration of stormwater into the sewer system, leading to sewer overflows which then contaminate stormwater conduits (streams, channels, direct pipes, etc). These contamination events are probably dependent on rain intensity and may be able to be quantified. Also, animal faecal matter, soil and vegetative indicator inputs and other undefined sources can contaminate stormwater itself (without sewer overflow). Directly leaking sewers (termed ‘exfiltration’) can occur in any weather, contributing significantly to infiltration when it does rain or when groundwater levels rise.
Stormwater from unreticulated (but not necessarily ‘rural’) areas may contain faecal indicators from direct surface run-off containing animal or bird faecal matter and vegetative inputs, direct stock access to waterways, direct stormwater delivery to the coastal marine area, and indirectly via streams, all of which are believed to constitute a risk to human health.
Only one study (Haile et al 1996) has been conducted in waters impacted by direct urban run-off (storm drains). The rates of illnesses presented were similar to those of other studies conducted in waters contaminated with domestic sewage. However, Ferguson et al (1996) found that increased levels of faecal coliforms, faecal streptococci, Clostridium perfringens spores, Giardia and Cryptosporidium occurred in an urban estuary after rainfall. Gibson et al 1998 found that
APPENDIX 2: DEVELOPING THE GUIDELINES. June 2003
I19
combined sewer overflows contributed increased Cryptosporidium and Giardia in both dry and (particularly) wet weather. Data from a study by Grohmann et al (1993) suggests that stormwater was a source of virus contamination in river and coastal water systems. It is therefore very likely that increased indicator levels identified at a beach following rainfall are indicating increased pathogen levels, and increased risk.
During the epidemiological study in New Zealand (see below), insufficient questionnaires were filled out immediately following rainfall events because people were not swimming at those times. However, the microbiological analyses were still conducted and the data shows that indicator levels go up at times of rainfall as a result of subsequent run-off.
The original claim from Cabelli was that rural point sources probably do not pose as great a risk as sources of human wastes. The advent of findings of Giardia, Cryptosporidium and Campylobacter, and the reinterpretation of the Connecticut rural swimming-pond study (McBride 1993), confounds this. Furthermore, the 1995 New Zealand marine beaches study (McBride, Salmond et al 1998) showed no statistically significant difference between beaches with urban versus rural impacts; indeed, the illness risks actually measured for those two impacts were very similar.
Illness:indicator relationships
Many more studies have been conducted for marine waters than for freshwaters. For marine waters the indicator of choice has usually been faecal streptococci (especially in the UK, Europe and Australia) and its subset, enterococci (especially in the US and New Zealand). For freshwaters, E. coli is usually the indicator of choice.
The essential idea behind the use of bacterial faecal indicators is that they may best represent overall pathogenicity of the water, as they may be well correlated to some pathogens but poorly correlated to others (e.g. protozoa and viruses).
This lack of correlation has been shown in many studies (e.g. Elliott and Colwell 1985; Grabow et al 1989; Ashbolt et al 1993; Ferguson et al 1996). It must always be remembered that only a portion of the pathogens are ever measured, and some (e.g. Norwalk-like viruses) cannot be enumerated routinely.
Both the controlled and uncontrolled cohort approaches have identified significant (in the statistical and social senses of that word) increasing relationships between the risk of illness to swimmers in water containing faecal residues and the concentration of one or more bacterial faecal indicators. While many of the illness-causing organisms are not bacterial (e.g. viruses and protozoan cysts) and may not be well correlated to the bacterial indicator(s), the general form of this relationship is found among many studies (as reviewed recently by Prüss 1998).
Symptoms are reported to increase with increased exposure to water and to aerosols (spray from breaking waves). Studies have increasingly found significant relationships between respiratory illness risk and a bacterial indicator (Balarajan et al 1989; Cheung et al 1990; Fewtrell et al 1992; Corbett et al 1993; Fleisher, Kay, Salmon et al 1996; McBride, Salmond et al 1998), as well as gastrointestinal illness. Skin rash, and eye and ear complaints seem to be related more to the presence of other bathers (bather-to-bather transmission occurs) than to degree of faecal contamination.
Children may be more susceptible to illness than adults, although they do tend to swim in waters that are shallower and are hence more polluted.
Interpreting human health risk
Investigations on the possible relationship between water contamination and human health risk (e.g. of swimmers) have to account for various uncertainties. These arise because we only have a small number of samples from which to characterise the degree of contamination of the water the swimmers use, and we have health status
APPENDIX 2: DEVELOPING THE GUIDELINES. June 2003
I20
information from only a tiny part of the whole population of swimmers.25 If we took the measured relationship to be the true relationship, these uncertainties would be ignored and our relationship would have a high chance of being incorrect. Statistical methods allow us to account for these uncertainties.
It is traditional to use ‘null hypothesis tests’ to account for uncertainties. These test the hypothesis that there is no association between the indicator concentration and the swimmers’ risk of illness.26 If the association (measured by a correlation coefficient or by a regression coefficient) indicated by the data is in some sense strong enough,27 one concludes that the null hypothesis should be rejected and that a ‘statistically significant’ result has been found. In this case, the true association is estimated by that found in the sample data. The level of uncertainty in this estimate is indicated by an interval (usually the 95% confidence interval) within which we might usually expect the underlying true value to lie, 95% of the time.
On the other hand, failing to reject the hypothesis simply means that the observed data is not inconsistent with the null hypothesis. It does not mean that we can regard the null hypothesis as being true, i.e. that there is no association at all. There may well be an association, but our sample data is held to be insufficient to reliably infer either this or its magnitude. This can be either because there is too much variability in the data, or that insufficient data was collected given its degree of variability. Increasing the size of the sample
data set may identify an association – unless the variability continues.
25 As well as some non-swimmers, who are used as controls, it is the difference in illness risk between swimmers and non-swimmers that we are interested in.
26 That is, one posits a ‘null’ hypothesis – that the correlation is exactly zero.
27 The computed p-value would be less than half of the a priori significance level (usually denoted by α). The p-value is the probability of getting a correlation at least as extreme as has been obtained, if the null hypothesis were true.
A cautionary note: the form of words used by some authors to interpret a negative result for a null hypothesis test can be ambiguous (McBride, Loftis et al 1993). For example, in reporting on a study of bathers’ illness risks in a freshwater pond contaminated by animal faecal material (Calderon et al 1991), a null hypothesis test (only just) failed to reach ‘statistical significance’. This led the authors to state that there was “no association” between swimmers’ illness risk and animal faecal contamination.
This conclusion had quite dramatic consequences because it was thought to support the idea that bathers’ illness risks from exposure to animal faecal residues are much lower than for exposure to human faecal residues, and perhaps did not even exist (as is implied by the phrase “no association”). But if more swimmers had been included it is entirely plausible that the test result would have been statistically significant (McBride, Loftis, et al 1993).28
In fact the measured relationship was quite large, but the data’s variability and limited size meant that the associated null hypothesis test failed to attain statistical significance. In other words, failure to attain statistical significance does not necessarily imply that the relationship tested lacks practical significance. The actual results found can be used, with results from other studies, in some kind of meta-analysis.29
28 Technically, the ‘power of the test’ increases with the number of
data used, making it more likely that a null hypothesis will be rejected.
29 Meta-analysis refers to pooling data from a number of studies to reanalyse the relationship.
APPENDIX 2: DEVELOPING THE GUIDELINES. June 2003
I21

APPENDIX 2: DEVELOPING THE GUIDELINES. June 2003
I22
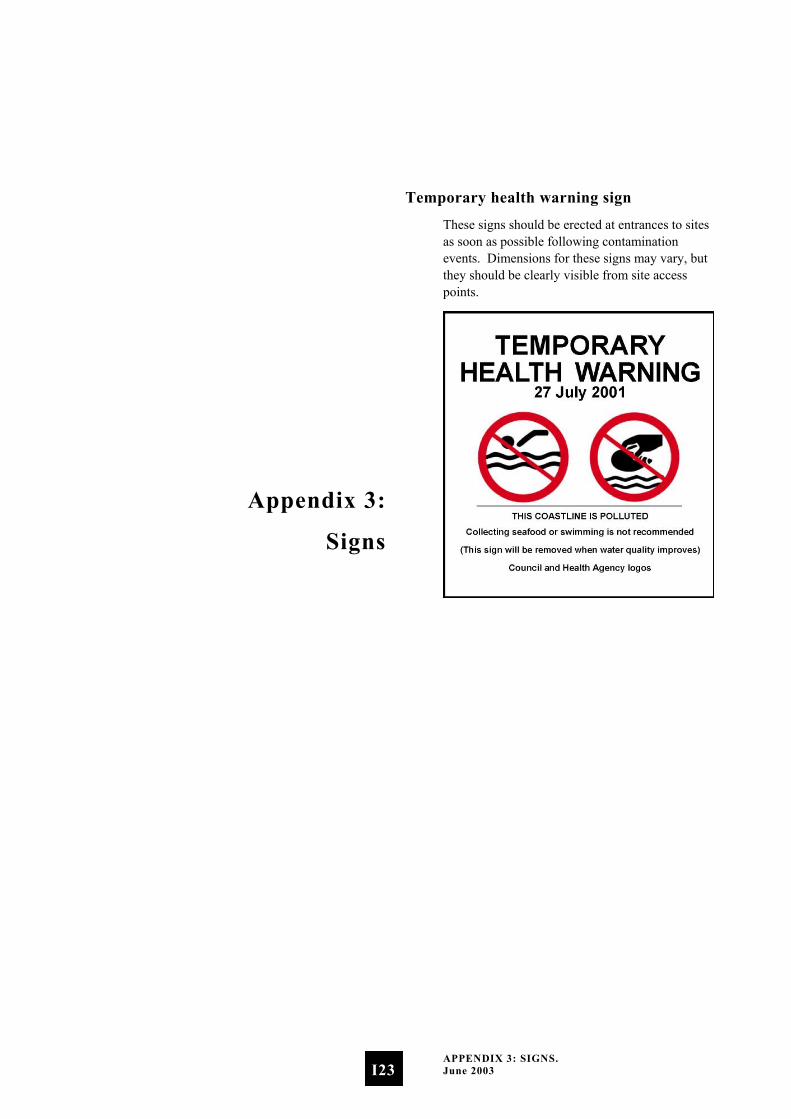
Appendix 3:
Signs
Temporary health warning sign
These signs should be erected at entrances to sites as soon as possible following contamination events. Dimensions for these signs may vary, but they should be clearly visible from site access points.
APPENDIX 3: SIGNS. June 2003
I23
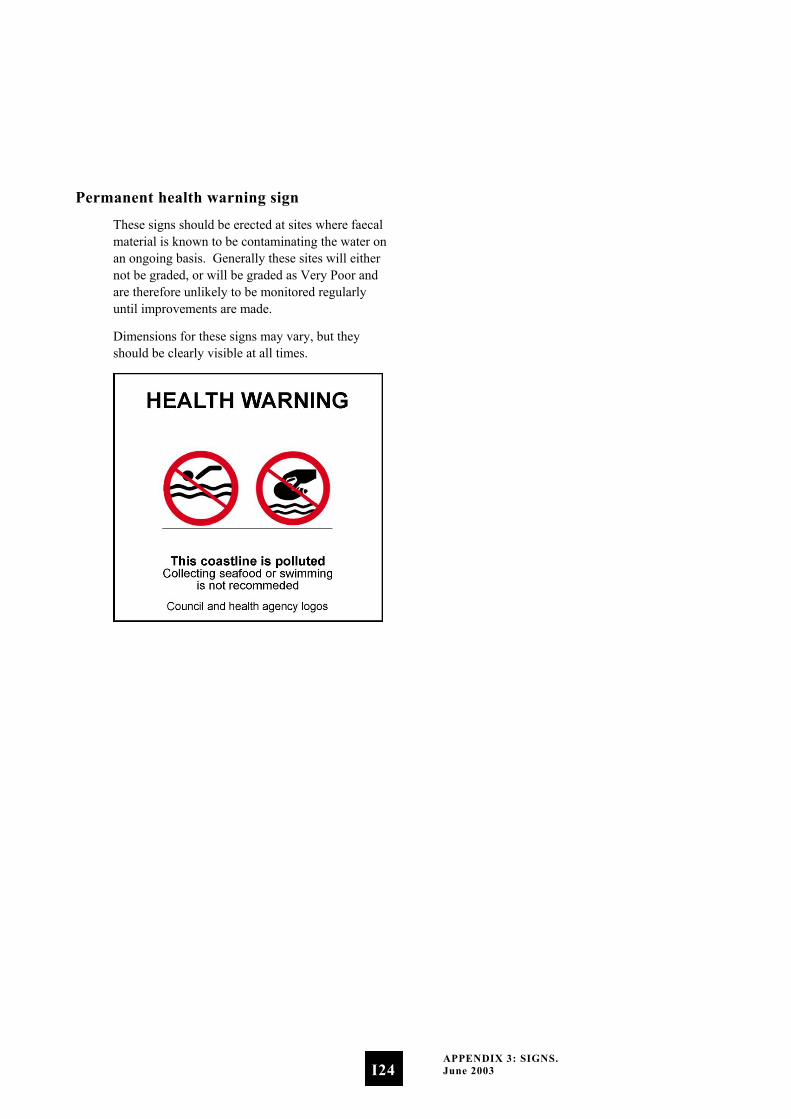
Permanent health warning sign
These signs should be erected at sites where faecal material is known to be contaminating the water on an ongoing basis. Generally these sites will either not be graded, or will be graded as Very Poor and are therefore unlikely to be monitored regularly until improvements are made.
Dimensions for these signs may vary, but they should be clearly visible at all times.
APPENDIX 3: SIGNS. June 2003
I24
Appendix 4:
Case Study –
Implementing the Marine
and Freshwater Guidelines
Jacobs Estuary, Southland
Environment Southland co-ordinates recreational water-quality monitoring in the Southland region. The following case study focuses on one of 13 marine recreational sites monitored in the region, details the process for developing a grade for the site, and defines the resulting surveillance monitoring regime and responses.
Microbiological Assessment Category (MAC)
Jacobs Estuary has been monitored for at least five years, so there is sufficient data to generate a MAC. Using the Hazen method recommended in the guidelines, the 95th percentile for this site is 99. Repeat or follow-up samples are not included when calculating the MAC.
Referring to the Microbiological Assessment Category Definitions the MAC for Jacobs Estuary is B.
Sanitary Inspection Category
The following table presents the findings after working through the Catchment Assessment Checklist and the resulting Sanitary Inspection Category.
APPENDIX 4: CASE STUDY – IMPLEMENTING THE MARINE AND FRESHWATER GUIDELINES. June 2003
I25
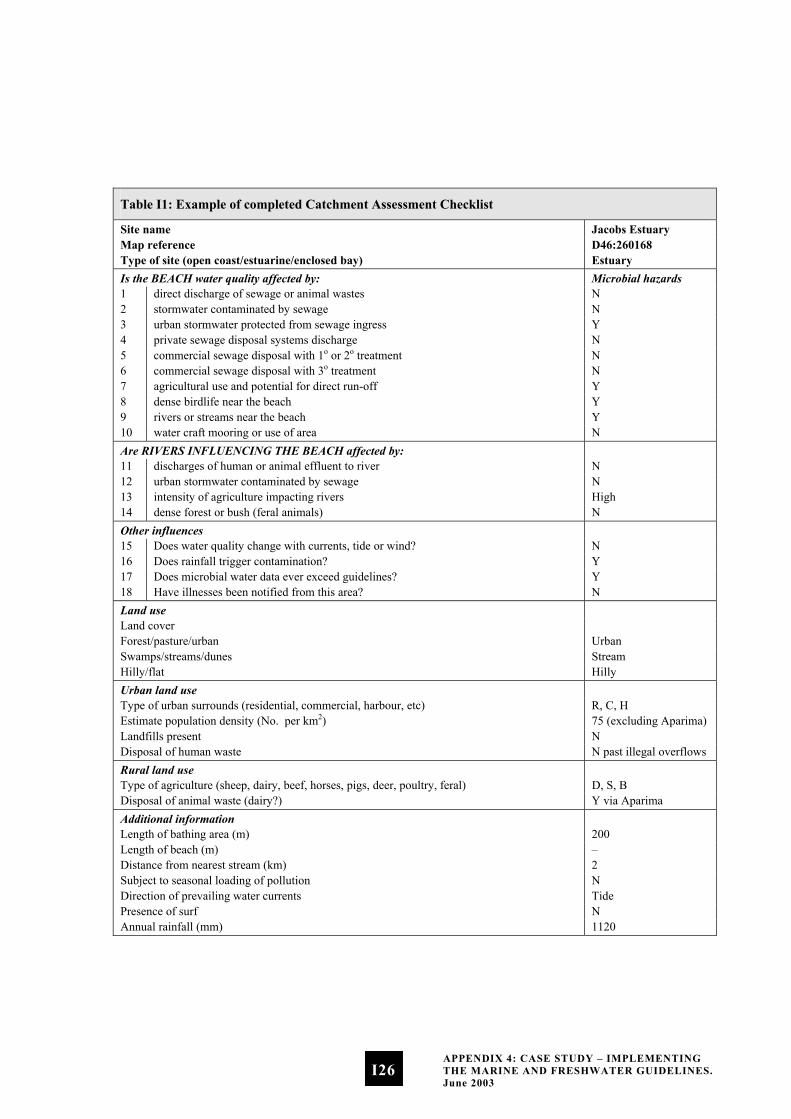
Table I1: Example of completed Catchment Assessment Checklist
Site name Jacobs Estuary Map reference D46:260168 Type of site (open coast/estuarine/enclosed bay) Estuary Is the BEACH water quality affected by: Microbial hazards 1 direct discharge of sewage or animal wastes N 2 stormwater contaminated by sewage N 3 urban stormwater protected from sewage ingress Y 4 private sewage disposal systems discharge N 5 commercial sewage disposal with 1o or 2o treatment N 6 commercial sewage disposal with 3o treatment N 7 agricultural use and potential for direct run-off Y 8 dense birdlife near the beach Y 9 rivers or streams near the beach Y 10 water craft mooring or use of area N Are RIVERS INFLUENCING THE BEACH affected by: 11 discharges of human or animal effluent to river N 12 urban stormwater contaminated by sewage N 13 intensity of agriculture impacting rivers High 14 dense forest or bush (feral animals) N Other influences 15 Does water quality change with currents, tide or wind? N 16 Does rainfall trigger contamination? Y 17 Does microbial water data ever exceed guidelines? Y 18 Have illnesses been notified from this area? N Land use Land cover Forest/pasture/urban Urban Swamps/streams/dunes Stream Hilly/flat Hilly Urban land use Type of urban surrounds (residential, commercial, harbour, etc) R, C, H Estimate population density (No. per km2) 75 (excluding Aparima) Landfills present N Disposal of human waste N past illegal overflows Rural land use Type of agriculture (sheep, dairy, beef, horses, pigs, deer, poultry, feral) D, S, B Disposal of animal waste (dairy?) Y via Aparima Additional information Length of bathing area (m) 200 Length of beach (m) – Distance from nearest stream (km) 2 Subject to seasonal loading of pollution N Direction of prevailing water currents Tide Presence of surf N Annual rainfall (mm) 1120
APPENDIX 4: CASE STUDY – IMPLEMENTING THE MARINE AND FRESHWATER GUIDELINES. June 2003
I26
The primary source of potential contaminants to the bathing site in Jacobs Estuary is the Aparima River. The land adjoining the Aparima River has moderately intensive agriculture with an increasing amount of dairy farming in the catchment. This corresponds to a ‘moderate’ risk. Stormwater drains enter Jacobs Estuary, but these are distant from the bathing sites and were not considered to be significant influences. A sewage overflow was discovered on the western side of Jacobs Estuary in 2001, but this did not appear to influence monitoring results and has since been rectified.
The Regional Council confirmed its catchment assessment of the site with the relevant territorial local authority and the Medical Officer of Health. The resulting Sanitary Inspection Category (moderate) was referenced from the Sanitary Inspection Flowchart.
Suitability for Recreation Grade
The suitability for recreation of this marine bathing water site was determined by integrating the site’s Sanitary Inspection Category with the site’s Microbial Assessment Category according to the Suitability for Recreation Grade matrix. The resulting grade for this site is Good.
The factors that contributed to the SFRG for this site can be summarised as follows.
Site ID 13 Site name Jacobs Estuary Map reference D46:260 168 SIC Moderate MAC B (95 percentile = 99) SFRG Good Monitoring frequency Weekly
Boyes Beach, Bay of Plenty
Environment Bay of Plenty monitors marine and freshwater recreational areas throughout the Bay of Plenty region. This case study examines a freshwater site graded using these guidelines, including how each component is assessed and brought together to achieve an overall grade for the site.
Microbiological Assessment Category (MAC)
Boyes Beach has been monitored for two years, giving insufficient data to generate a final grade. However, there is sufficient data to generate an interim grade. An interim grade is used primarily for management purposes and must be reviewed annually as new data becomes available, until five years’ data has been collected.
The 95th percentile for this site, generated using the Hazen Method is 207. Therefore the resulting Microbiological Assessment Category is B.
Sanitary Inspection Category
The results of the catchment assessment are summarised in the following table.
APPENDIX 4: CASE STUDY – IMPLEMENTING THE MARINE AND FRESHWATER GUIDELINES. June 2003
I27
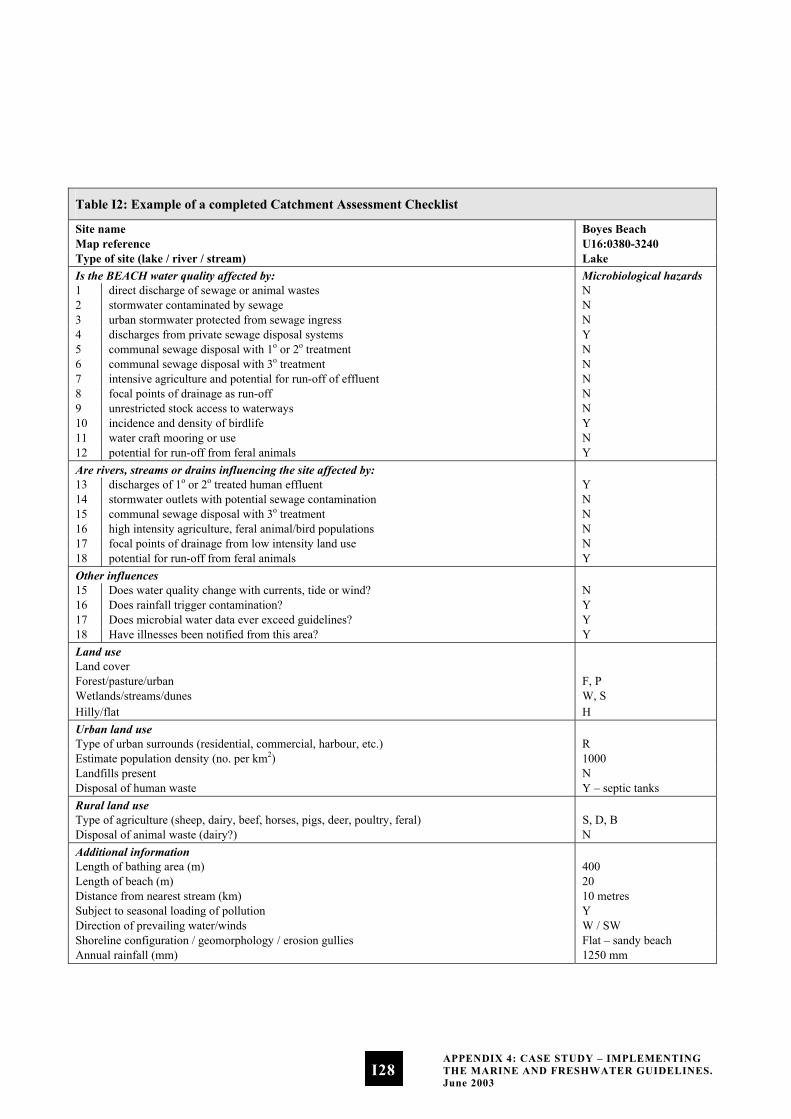
Table I2: Example of a completed Catchment Assessment Checklist
Site name Boyes Beach Map reference U16:0380-3240 Type of site (lake / river / stream) Lake Is the BEACH water quality affected by: Microbiological hazards 1 direct discharge of sewage or animal wastes N 2 stormwater contaminated by sewage N 3 urban stormwater protected from sewage ingress N 4 discharges from private sewage disposal systems Y 5 communal sewage disposal with 1o or 2o treatment N 6 communal sewage disposal with 3o treatment N 7 intensive agriculture and potential for run-off of effluent N 8 focal points of drainage as run-off N 9 unrestricted stock access to waterways N 10 incidence and density of birdlife Y 11 water craft mooring or use N 12 potential for run-off from feral animals Y Are rivers, streams or drains influencing the site affected by: 13 discharges of 1o or 2o treated human effluent Y 14 stormwater outlets with potential sewage contamination N 15 communal sewage disposal with 3o treatment N 16 high intensity agriculture, feral animal/bird populations N 17 focal points of drainage from low intensity land use N 18 potential for run-off from feral animals Y Other influences 15 Does water quality change with currents, tide or wind? N 16 Does rainfall trigger contamination? Y 17 Does microbial water data ever exceed guidelines? Y 18 Have illnesses been notified from this area? Y Land use Land cover Forest/pasture/urban F, P Wetlands/streams/dunes W, S Hilly/flat H Urban land use Type of urban surrounds (residential, commercial, harbour, etc.) R Estimate population density (no. per km2) 1000 Landfills present N Disposal of human waste Y – septic tanks Rural land use Type of agriculture (sheep, dairy, beef, horses, pigs, deer, poultry, feral) S, D, B Disposal of animal waste (dairy?) N Additional information Length of bathing area (m) 400 Length of beach (m) 20 Distance from nearest stream (km) 10 metres Subject to seasonal loading of pollution Y Direction of prevailing water/winds W / SW Shoreline configuration / geomorphology / erosion gullies Flat – sandy beach Annual rainfall (mm) 1250 mm
APPENDIX 4: CASE STUDY – IMPLEMENTING THE MARINE AND FRESHWATER GUIDELINES. June 2003
I28
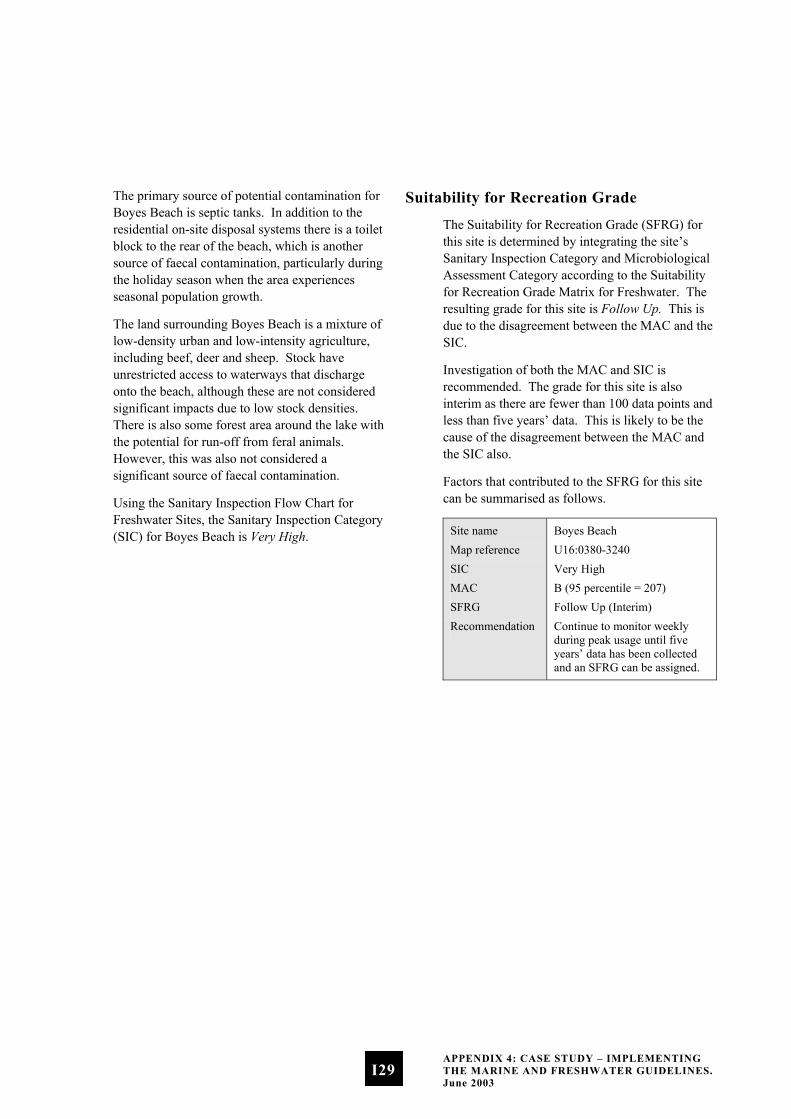
The primary source of potential contamination for Boyes Beach is septic tanks. In addition to the residential on-site disposal systems there is a toilet block to the rear of the beach, which is another source of faecal contamination, particularly during the holiday season when the area experiences seasonal population growth.
The land surrounding Boyes Beach is a mixture of low-density urban and low-intensity agriculture, including beef, deer and sheep. Stock have unrestricted access to waterways that discharge onto the beach, although these are not considered significant impacts due to low stock densities. There is also some forest area around the lake with the potential for run-off from feral animals. However, this was also not considered a significant source of faecal contamination.
Using the Sanitary Inspection Flow Chart for Freshwater Sites, the Sanitary Inspection Category (SIC) for Boyes Beach is Very High.
Suitability for Recreation Grade
The Suitability for Recreation Grade (SFRG) for this site is determined by integrating the site’s Sanitary Inspection Category and Microbiological Assessment Category according to the Suitability for Recreation Grade Matrix for Freshwater. The resulting grade for this site is Follow Up. This is due to the disagreement between the MAC and the SIC.
Investigation of both the MAC and SIC is recommended. The grade for this site is also interim as there are fewer than 100 data points and less than five years’ data. This is likely to be the cause of the disagreement between the MAC and the SIC also.
Factors that contributed to the SFRG for this site can be summarised as follows.
Site name Boyes Beach Map reference U16:0380-3240 SIC Very High MAC B (95 percentile = 207) SFRG Follow Up (Interim) Recommendation Continue to monitor weekly
during peak usage until five years’ data has been collected and an SFRG can be assigned.
APPENDIX 4: CASE STUDY – IMPLEMENTING THE MARINE AND FRESHWATER GUIDELINES. June 2003
I29

APPENDIX 4: CASE STUDY – IMPLEMENTING THE MARINE AND FRESHWATER GUIDELINES. June 2003
I30

Appendix 5:
Fact Sheets
In this appendix we have provided a series of fact sheets about recreational water-quality monitoring. Please feel free to photocopy and distribute these to anyone wanting more information about this issue.
APPENDIX 5: FACT SHEETS. Published by the Ministry for the Environment. June 2003
I31
Beaches and rivers are important Every weekend thousands of people flock to beaches, lakes and rivers around the country and take the plunge. The numbers soar during the summer holidays. Whether it is swimming, diving, surfing or sailing, when the sun shines Kiwis head for the beach.
A part of New Zealand culture
The Hillary Commission’s 1991 Life in New Zealand Survey looked at recreational water use and found that in the 15–18-year age groups:
28% had been swimming in the past four weeks
•
•
•
•
31% had been to the beach in the past four weeks
23% of males and 8% of females had been either surfing or wind surfing in the past four weeks
20% had been involved in water-based leisure or activities in the past four weeks.
This represents only a small slice of New Zealand’s population but is a strong indicator of how our beaches are a significant part of Kiwi culture.
Mostly clean, but ...
New Zealand’s ‘clean green image’ extends to our oceans, lakes and rivers. The perception many of us have that our coasts and freshwaters are some of the cleanest in the world is well founded. We don’t have the severity of problems facing nations such as the United Kingdom or the US. But we do have some problems.
Some of our stormwater and sewerage systems are approaching 100 years old. Combined sewerage and stormwater pipes can sometimes pump untreated human effluent into lakes, rivers and the sea, especially in urban areas. Stormwater (urban run-off) collects waste from streets, lawns and parks and deposits it in waterways. This run-off often contains animal waste. Run-off from farmland (rural run-off) collects waste from farm animals, which also ends up in rivers and finally in the sea or lakes. Animal and human waste contains disease-causing organisms that may survive in the marine environment, posing a risk to human health.
What is being done about it?
Councils monitor water quality according to guidelines developed by the Health and Environment Ministries. The purpose of monitoring is to identify risks to public health from disease-causing organisms, and to inform the public of these risks. This information allows people to make informed decisions about where, when and how they use the aquatic environment for recreational activities.
Aside from monitoring water quality, many councils have long-term plans in place to deal with ageing sewerage and stormwater systems and carry out routine inspections of these systems. Regular inspection ensures the systems are maintained to as high a standard as possible so that the waters receiving the discharge meet acceptable health criteria. But it is important to realise there has always been a health risk while in contact with waters that receive stormwater, rural run-off and sewage.
APPENDIX 5: FACT SHEETS. Published by the Ministry for the Environment. June 2003
I32
Health impacts of contaminated recreational water
There are a number of disease-causing bugs (called pathogens) that once discharged into the marine and freshwater environments can survive for some time. Every time we come into contact with waters that have been contaminated with human and animal faeces, we expose ourselves to these bugs and risk getting sick. Pristine waters are unlikely to present a health risk from these pathogens.
What does ‘risk’ mean?
The risk is of getting sick when swimming, surfing or otherwise being exposed to freshwater or seawater. The guidelines that New Zealand councils use are based on fixed levels of risk, which in turn are based on overseas guidelines (which have been confirmed by New Zealand studies). Overseas investigations have settled on a maximum acceptable level of risk for marine waters of 19 in every 1000 bathers contracting an illness. For freshwaters the accepted level of risk is 8 in every 1000 bathers contracting an illness.
Even when beaches and rivers meet the guidelines there will still be a health risk associated with recreational activities in the sea. Because scientists are not directly measuring the pathogens, it is not possible to say there is zero risk to public health, especially where there are known inputs of human and animal faeces.
If tested waters exceed the acceptable level of risk, the public is advised that the area is unsuitable for recreational activities.
What does ‘illness’ refer to?
Illnesses related to contact with recreational waters were initially thought to be confined to gastrointestinal illness such as salmonellosis. More recently Giardia, Campylobacter and Cryptosporidium have also been shown to cause gastrointestinal illness. These pathogens cause
diarrhoea and sometimes vomiting associated with ‘tummy bug’ symptoms. Recent studies indicate that respiratory illnesses, such as those that cause cold and flu-like symptoms, can also result from swimming in sewage-contaminated water. Skin, eye and ear infections can also be caught through contact with marine and fresh waters.
Illnesses related to toxic substances – such as heavy metals or PCBs – are not measurable with indicator bacteria and are not covered in this fact sheet.
Risk factors
Stormwater, and treated and untreated sewage discharged directly into our oceans, rivers and lakes, can contain a variety of micro-organisms that can cause disease. Therefore there may be a greater risk of getting sick under certain conditions, such as:
two to three days after rainfall •
•
•
during full immersion in water that may be contaminated with sewage or run-off
high exposure to shallow water where there may be higher concentrations of pathogens.
There may also be a greater risk to those with reduced immunity, the elderly and the very young.
When do the guidelines not apply?
In most communities the effluent produced will contain pathogens all year round, and the guidelines councils use are designed for use under such conditions. However, when there is an outbreak of a potentially waterborne disease in the community, and where that community’s sewage is discharged directly into or close to recreational waters without adequate treatment, the guidelines that councils use are not suitable. Under these circumstances an area may be deemed suitable for recreational use based on the indicator bacteria, when in fact the levels of pathogens are elevated to a point where there is an unacceptable risk to public health.
APPENDIX 5: FACT SHEETS. Published by the Ministry for the Environment. June 2003
I33
What are councils doing?
Councils around the country monitor water quality to minimise the risk to public health. They do this by measuring the number of enterococci (indicator bacteria) in our water. They do not measure pathogens directly because the science to do this cost effectively and reliably isn’t yet available.
In addition to measuring indicator bacteria, councils look at the area surrounding the beach or river and identify potential sources of contamination. This helps councils assess the potential risk of contamination, so they can ‘grade’ recreational sites for their suitability for recreational use.
Where do I get more information?
Councils monitor water quality and will have detailed information on specific beaches. There may be an 0800 number to call for this information.
•
•
•
•
Local papers and radio stations may also provide information in their community bulletins.
Signs at monitored beaches will have details about where to get more information (0800 number, radio stations, etc.) and will indicate if the beach is suitable for recreational use.
Some council websites have information about monitoring programmes locally.
APPENDIX 5: FACT SHEETS. Published by the Ministry for the Environment. June 2003
I34
The water-quality monitoring programme
Regional, city and district councils have been monitoring water quality at beaches for many years. The guidelines now used by the councils are the Microbiological Water Quality Guidelines for Marine and Freshwater Recreational Areas published by the Ministry for the Environment and the Ministry of Health in 2002. These guidelines aim to establish national consistency in recreational water quality and public awareness of when there is a health risk.
Which beaches are being monitored?
The councils decide which freshwater and marine sites they will monitor before the bathing season begins. How councils decide this varies from region to region. Contact your local city or regional council to find out which sites in your region are monitored.
When are beaches monitored?
Beaches and rivers are monitored by the council on a weekly basis throughout the bathing season. The bathing season is generally from 1 November to 31 March, although this may vary depending on the local climate.
What do councils ‘do’ when they monitor water quality?
There are two parts to the council’s monitoring programme. Firstly, an overall grade for the site is worked out based on previous years’ monitoring results and an assessment of potential sources of contamination from the surrounding area. This grade gives an idea of the general condition of the site on any given day.
In addition to the overall grade, councils monitor recreational waters on a weekly basis during the bathing season. Samples are collected from monitored sites and tested for bacteria that indicate whether disease-causing micro-organisms, or
pathogens, are present. The councils use the ‘traffic light’ approach of the guidelines to decide whether the beaches and rivers are suitable for swimming.
Surveillance monitoring is carried out when levels of indicator bacteria are low. Sites in surveillance mode are monitored weekly. The purpose of surveillance monitoring is to routinely check that water quality is at a level that doesn’t pose an unacceptable risk to public health.
The alert or ‘amber’ level acts as a trigger for councils to collect samples more frequently. The guidelines also recommend that when in this mode councils investigate whether there is a source of contamination causing the higher indicator levels at the beach or river.
For marine waters, when a sample taken during either surveillance monitoring or while in alert mode exceeds the action or ‘red’ mode indicator level, a second sample is taken immediately. If this also exceeds the action-level threshold the public are informed that the beach is not suitable for swimming.
For freshwater, if a sample taken during either surveillance monitoring or while in alert mode exceeds the action or ‘red’ mode indicator level, a second sample is not required to confirm the result. This is due to the potential for greater pathogen levels and their survival in freshwater. Illnesses may range from a skin infection, to a cold, to gastrointestinal disease. In action mode, sampling may increase to daily if the cause is unknown. The guidelines specify that a catchment assessment should be carried out in the surrounding catchment. This involves the council checking the sewerage and stormwater systems for leaks, illegal connections and other causes of contamination of the site. A catchment assessment can also involve investigating further up the catchment to identify contaminating activities or discharges.
APPENDIX 5: FACT SHEETS. Published by the Ministry for the Environment. June 2003
I35
How do I know if it is OK to swim?
Councils have communication strategies as part of their monitoring programmes to ensure the public are informed of a health risk at a beach or river as soon as possible. If you are concerned about water quality at beaches or rivers in your area, contact your local council for more information.
The bugs
In New Zealand we are becoming increasingly aware of the potential health risks associated with swimming (and other related activities) in marine and fresh waters. Although this problem is not as severe as in many other countries, it is important that we manage the problem in the interests of public health.
When monitoring water quality at New Zealand beaches and rivers, water managers and scientists are interested in the number of disease-causing pathogens present. It is impractical to measure the pathogens directly, so indicator bacteria are used to alert water managers to possible health risks presented by the pathogens.
What are indicator bacteria?
In the case of the recreational water-quality guidelines, the indicator bacteria are enterococci for marine waters and E. coli for freshwaters. These bacteria occur naturally in the gut of humans and animals, including mammals, birds, fish and reptiles. The indicator bacteria themselves do not pose a significant risk to human health. Rather, they indicate the presence of faecal material, which contains disease-causing pathogens. It is the number of enterococci or E. coli per 100 mL of water that is measured and on which the guideline levels are based.
What are pathogens?
Pathogens are microscopic organisms that cause disease in humans and animals. There are many different kinds. Some of the more widely known are Campylobacter, Salmonella, Giardia, Cryptosporidium, and viruses that cause diarrhoea and cold and flu-like symptoms. These pathogens are present in faeces and may enter our waterways through untreated sewage discharges, and from leaky sewerage pipes, septic tanks, stormwater and rural run-off.
When do the guidelines not apply?
In most communities the effluent produced will contain pathogens all year round, and the guidelines councils use are designed for use under such conditions. However, when there is an outbreak of a potentially waterborne disease in the community, and where that community’s sewage is discharged directly into or close to recreational waters without adequate treatment, the guidelines councils use are not suitable. If the guidelines are used under these circumstances a beach or river may be deemed suitable for recreational use based on the indicator bacteria, when in fact the levels of pathogens are raised to a point where there is an unacceptable risk to public health.
Indicator bacteria tell us about the likelihood of there being pathogens present in the water. We don’t use indicator bacteria to measure the likelihood of there being toxic contaminants or harmful poisons such as heavy metals, poly-aromatic carbons or PCBs.
APPENDIX 5: FACT SHEETS. Published by the Ministry for the Environment. June 2003
I36
The sources of contamination in waters used for recreation
This fact sheet discusses the sources of bacteria and pathogens in waters used for recreation that pose a risk to human and animal health.
Sewage
Sewage from many communities is collected via a network of pipes and pumped to a central facility, where it is treated before being discharged to the environment. Sewage consists mostly of water, but also contains organic material and micro-organisms. There are a number of factors that can cause sewage to enter the environment before completing its journey through the treatment facility. The main ones include:
•
•
•
•
•
broken or leaky pipes – these can be caused by ageing pipes, construction activities or road works
overflows, during heavy rainfall – the treatment facility may not be able to cope with the volumes of water and sewage entering the system, so pumps are turned off and sewage is discharged directly to the environment. This is made worse where houses have stormwater illegally connected to wastewater. Also, some older sewerage systems do not have completely separated sewage and stormwater pipes. During high rainfall, stormwater (urban run-off) can enter the sewerage system and cause sewage to overflow into the stormwater pipes. Sewage is then discharged directly to the environment
emergency overflows – these can also occur periodically during maintenance of sewerage systems.
There are also other sources of sewage.
Some older properties, especially baches, are still connected to a septic tank. Where these have deteriorated they leak contaminated water into the groundwater system. This
contaminated water then ends up in waterways and eventually at the beach.
Some boaties discharge their waste directly into the sea, without treatment. The Ministry for the Environment’s booklet, Dealing with Sewage Safely and Responsibly on Your Boat, deals with discharges from all marine vessels.
The cost of upgrading much of the country’s ageing pipes to cope with our increasing population is estimated to be several billion dollars. It is anticipated that these upgrades will be spread over several decades.
Stormwater
Rainwater collected from roofs, driveways, roads, carparks and other sealed surfaces is piped directly to rivers, lakes and the marine environment without treatment. During its travels stormwater collects a number of nasties along the way. This includes waste from domestic animals, which collects on footpaths, gutters and lawns. This contaminated water is washed into the stormwater system during rainfall and ultimately ends up on our beaches. Animal waste collected in stormwater contains disease-causing organisms that can affect human health. These pathogens can cause colds, flu, respiratory illness, gastrointestinal illness and skin, eye and ear infections.
Rural run-off
Farm run-off can add significantly to the contamination of waterways. Apart from farm oxidation ponds, which have been shown to contain high levels of bacteria and pathogens, a large amount of animal waste ends up on the paddock. Depending on a number of factors – including distance to the nearest stream, rainfall intensity and stock numbers – faecal material ends up in rivers and streams, which ultimately discharge to the sea. Where stock have access to streams and rivers for drinking water, excrement may be deposited directly into the water.
APPENDIX 5: FACT SHEETS. Published by the Ministry for the Environment. June 2003
I37

APPENDIX 5: FACT SHEETS. Published by the Ministry for the Environment. June 2003
I38
Abbreviations
CAC Catchment Assessment Checklist
EHO Environmental Health Officer
IANZ International Accreditation New Zealand
MAC Microbiological Assessment Category
NZCPS New Zealand Coastal Policy Statement
RMA Resource Management Act 1991
SFRG Suitability for Recreation Grade
SIC Sanitary Inspection Category
ABBREVIATIONS. June 2003
J1
Glossary
Word/term Definition
Agricultural land use
Land use involving cultivation of land or raising of livestock.
Agricultural run-off
Surface water after rainfall from an area of agricultural land use.
Animal waste Animal faecal material.
Bacteriological indicators
Micro-organisms selected as indicators of faecal material.
Bathers Those who enter the water, and either partially or fully immerse themselves.
Bathing season Generally the bathing season extends between 1 November and 31 March. However, this may vary according to local climatic conditions.
Beach The shore or any access point to the sea, a freshwater lake or river used for recreational purposes
Bird-roosting areas
Where birds congregate routinely.
Bush Fallow areas, predominantly covered with native or exotic bush or scrub.
Catchment That area of land from which runoff or direct discharges may affect water-quality at a recreational water site.
Category One of five possible outcomes based on historical microbiological results and potential risk of faecal contamination.
Central tendency The degree of clustering of the values of a statistical distribution that is usually measured by the arithmetic mean, mode, or median.
Coastal water Seawater within the outer limits of the territorial sea. Includes seawater with a substantial freshwater component; and seawater in estuaries, fiords, inlets, harbours or embayments (RMA).
Combined sewer overflows
Where stormwater and sewer overflows are combined.
Communal sewage disposal
Where a number of houses have a combined sewage disposal system.
GLOSSARY. June 2003
J2
Word/term Definition
Contact recreation
Recreational activities that bring people physically in contact with water, involving a risk of involuntary ingestion or inhalation of water (see also Bathers).
Contamination Reduction in water quality by faecal material, resulting in a breach of guideline values.
Cryptosporidiosis Diarrhoeal disease caused by oocysts of the protozoa Cryptosporidium parvum.
Direct discharges Piped or channelled discharge of wastewater concentrated at a given point (point source).
Effluent The liquid effluent from sewage treatment processes (sometimes called wastewater).
Enterococci Members of the Streptococcus group of bacteria characterised as faecal in origin.
Enterolert Trade name of test kit for detecting enterococci.
Environmental hazard assessment
Assessment of risk of potential sources of faecal contamination within a catchment.
Escherichia coli (E. coli)
Member of the Enterobacteriaceae group of bacteria.
Exceedance When indicator levels from samples taken at a recreational site exceed those recommended in these guidelines.
Exceptional circumstances
Circumstances under which the result of the grading matrix indicates an inconsistency between the Sanitary Inspection Category and the Microbiological Assessment Category, requiring further investigation or analysis.
Feral animal A wild, untamed animal.
Follow-up sample Second sample taken to confirm an initial high result; usually within 24–72 hours depending on accessibility / sample turnaround time, etc.
Forest Area predominantly covered by exotic or native trees.
Word/term Definition
Freshwater All water except coastal water and geothermal water (RMA).
Gastroenteritis Stomach condition causing diarrhoea.
Giardiasis Clinical condition caused by infection with cysts of Giardia intestinalis.
Graded beaches Beaches identified by a grade according to their suitability for recreational use, as per these guidelines.
Hazen method Method for calculating percentile numerical values.
High-contact water sports
Recreational activities that bring people physically in contact with water, involving a risk of involuntary ingestion of water (e.g. swimming, surfing, water skiing, windsurfing).
Human waste Faecal material.
Median Central value when values are arranged in order of magnitude.
Membrane filter test
Test to capture bacteria on a filter by means of filtration.
Microbial indicators
Bacteria used as indicators of faecal contamination.
Micro-organisms Collective term for bacteria, viruses and protozoa.
Middle-range beaches
Beaches with a Suitability for Recreation Grade of good, fair or poor.
Multiple-sample sites
When more than one sample is taken along a beach, either because the beach extends for some distance, or to investigate potential causes of exceedances.
Non-point-source discharge
Diffuse pollution sources (without a single point of origin, or not introduced into a receiving stream from a specific outlet). The pollutants are generally carried off the land by stormwater (http://www.epa.gov/OCEPAterms/ nterms.html).
On-site waste treatment
Septic tank.
GLOSSARY. June 2003
J3
Word/term Definition
Pathenogenic micro-organisms
Micro-organisms that can cause disease.
Pathogens Pathenogenic micro-organisms.
Point-source discharge
Piped or channelled discharge of waste water concentrated at a given point.
Potential contamination source
Any feature of the catchment that may contribute human or animal waste that affects the microbiological condition of a recreational site.
Primary treatment The first major stage of treatment following preliminary treatment in a wastewater works, usually involving removal of settleable solids.
Principal source (of contamination)
The source of faecal contamination that has the greatest effect on recreational water quality.
Private sewage disposal system
Septic tank, long drop (pit privy).
Protozoa Single-celled micro-organisms.
Rainfall event A rainfall event is one that has an effect on beach water quality. This may be described in mm of rainfall over time. The definition of rainfall events will vary within and between catchments. Factors such as land use, vegetation cover and catchment size will affect the quality and quantity of water that impacts on a beach. Water managers in each region will need to determine what qualifies as a rainfall event in their region, or maybe even in catchments in their region. Historical data may help to determine the levels of rainfall required to impact on a region’s beaches. Note: data specific to dry-weather sampling is likely to reflect the most favourable indication of a health risk.
Recreational use See contact recreation.
Respiratory illness
Cold and flu-like symptoms; may be associated with fever.
Word/term Definition
Risk The public health risk when considering beach water quality is the probability of illness occurring. The best available means of predicting the probability of illness occurring at a beach is given by the number of particular indicator bacteria present in the water.
Risk factors Potential sources of faecal contamination.
Salmonellosis Disease caused by infection with members of the Salmonellae group of bacteria.
Sanitary landfills Landfills (tips) where sewage sludge is disposed.
Sanitary survey Survey to detect potential sources of faecal pollution within a catchment.
Secondary treatment
The treatment of waste water, usually after removal of suspended solids, by bacteria under aerobic conditions during which organic matter in solution is oxidised or incorporated into cells, which may be removed by settlement. This may be achieved by biological filtration or by the activated-sludge process. Sometimes called ‘aerobic biological treatment’.
Septic tank A type of sedimentation tank in which the sludge is retained sufficiently long for the organic content to undergo anaerobic digestion. (When efficient, this equates to secondary treatment.)
Sewage The liquid wastes of a community, including toilet wastes, sullage and trade wastes. May include stormwater infiltration.
Sewerage A system of pipes to convey sewage to the place of disposal or treatment. The term ‘sewerage’ is analogous to ‘sewer reticulation’ or ‘drainage system’.
GLOSSARY. June 2003
J4
Word/term Definition
Tertiary treatment The further treatment of biologically treated waste water by removing suspended matter to enable the effluent to comply with a standard more stringent than 30:20 (not containing more than 30 mg/L suspended solids and with a biological oxygen demand (BOD) not exceeding 20 mg/L) before discharge to a receiving water. Also termed ‘polishing’. Note: this is not equivalent to disinfection. A system should be described as secondary treatment + disinfection, but not tertiary treatment.
Treated effluent Effluent that has been through at least primary treatment (see also Primary treatment, Secondary treatment, and Tertiary treatment).
Ungraded beaches
Beaches that are not used for contact recreation and therefore have not been through the grading process.
Word/term Definition
Wastewater treatment plant
A facility for treating effluent before discharging it into the environment (see also Treated effluent).
Water manager A generic term used for any person(s) or organisation(s) that make(s) decisions regarding water use or quality, including those that monitor for state of the environment reporting and for public health protection.
Water quality The bacteriological condition of a water body as it relates to human health, measured using indicator bacteria.
Waterborne pathogen
Disease-causing micro-organisms capable of being transmitted by water.
GLOSSARY. June 2003
J5
References and
Further Reading
The following documents are ordered alphabetically by author, then by date, with accompanying commentary.
A librarian can easily obtain most of the items in this list. For those more difficult to access, supplemental information is given on their availability.
Abbott S, Caughley B, Scott G. 1998. Evaluation of Enterolert® for the enumeration of enterococci in the marine environment. New Zealand Journal of Marine and Freshwater Research 32: 505–13. Reports comparative evaluation of Enterolert® versus membrane filtration on 343 marine samples from the Wellington area. Found sensitivity of 99.8% and specificity of 97% (2.4% false positives and 0.3% false negatives).
Alexander LM, Heaven A, Morris R. 1992. Symptomatology of children in contact with sea water contaminated with sewage. Journal of Epidemiology and Community Health 46: 340–4. A prospective study of parents of children between 6 and 11 years was conducted at Blackpool beach (UK) in 1990, resulting in 703 cases of matched data. Concluded that “children who came into contact with contaminated sea water are likely to develop symptoms as a result”.
Anderson SA, Turner SJ, Lewis GD. 1997. Enterococci in the New Zealand environment: implications for water quality monitoring. Water Science and Technology 35(11–12): 325–31. A considerable part of the enterococci load in urban and rural catchments and waterways (typically 102–103 cfu/100 mL) comes from non-human sources. They may multiply within some non-faecal environments (e.g. on degrading seaweed).
Ashbolt NJ, Grohmann GS, Kueh CSW. 1993. Significance of specific bacterial pathogens in the assessment of polluted receiving waters of Sydney, Australia. Water Science and Technology 27(3–4): 449–52. Primary sewage released from Sydney’s ocean outfalls and tertiary chlorinated sewage discharged to rivers were studied for two years. Diverting the ocean discharge from a cliff-edge release to deepwater ocean release 3 km offshore resulted in significant reductions of bacteria in water, but not in near-shore sediments. Campylobacters were found in rivers but not in effluents or seawater, being associated with rural land.
REFERENCES AND FURTHER READING. June 2003
J6
Balarajan R, Soni Raleigh V, Yuen P, Wheeler D, Machin D, Cartwright R. 1989. Health risks associated with bathing in sea water. British Medical Journal 303: 1444–5. Reports a three-week prospective cohort study at Ramsgate Beach (Kent, UK) using 1,883 persons, including 839 non-bathers as a control. The waters occasionally failed EC standards (but this is not quantified). Relative risk of gastrointestinal symptoms (age- and gender-adjusted) was elevated among the bathers (i.e. swimmers and waders). Relative risks of eye/ear/nose/throat and respiratory illness among surfers and divers were statistically significant.
Bandaranayake DR, Salmond CE, Cooper AB, McBride GB, Lewis GD, Hatton C, Turner SJ, Till DG. 1993. Health Effects from Sea Bathing: A report on the preliminary study carried out at two Auckland beaches over the 1992/93 summer. Ministry for the Environment, Wellington. Reports on the New Zealand 1992/93 preliminary trials. Includes the paper, the questionnaire, and a sample size calculation (power analysis) for the planned final study.
Barron RC, Murphy F, Greenberg HB, Davis CE, Bregman DJ, Gary GW, Hughes JM, Schonberger LB. 1982. Norwalk gastrointestinal illness: an outbreak associated with swimming in a recreational lake and secondary person-to-person transmission. American Journal of Epidemiology 115(2): 163–72. Incubation period for 121 first-in-their-household persons becoming ill at a Michigan recreational park was 4–77 hours. A history of swimming in the park’s lake was elicited with significantly greater frequency of illness compared to those who did not swim (odds ratio 4.8, 95% CI = 1.8–12.7). Serological studies identified Norwalk virus as the aetiological agent. Water appeared to meet current bacterial guidelines.
Baylor ER, Baylor MB, Blanchard DC, Syzdek LD, Appel C. 1977. Virus transfer from surf to wind. Science 198: 575–80. Documents this mode of pathogen transfer.
Brieseman MA. 1987. Town water supply as the cause of an outbreak of Campylobacter infection. New Zealand Medical Journal 100: 212–13. An outbreak of 19 cases in Ashburton was attributed to the local water supply being contaminated after heavy rain during a period in which water treatment was temporarily not operating.
Brown JM, Campbell EA, Rickards AD, Wheeler D. 1987. Sewage pollution of bathing water. The Lancet (21 November): 1208–9. Reports a Greenpeace study on two southern England resorts, one polluted the other not, interviewing 190 people. Found that “bathers who immersed their heads in seawater polluted by sewage were more likely to complain of gastrointestinal symptoms than those who did not immerse their heads or those who bathed at a non-polluted resort”.
Bryan JA, Lehmann JD, Setiady IF, Hatch MH. 1974. An outbreak of Hepatitis-A associated with recreational lake water. American Journal of Epidemiology 99(2): 145–54. In a 15-day period in September 1969, 14 cases of viral hepatitis-A developed in members of a boy scout troop who had been camping on an island in a lake recreation area about four weeks earlier. Exposure to contaminated lake water was indicated.
Cabelli VJ, Levin MA, Dufour AP, McCabe LJ. 1975. The development of criteria for recreational waters. In: ALH Gameson (ed). Discharge of Sewage from Sea Outfalls. Oxford and New York, Pergamon Press, 63–73. Foreshadows the full trials reported in Cabelli (1983a). Explains how the design was aimed at improving perceived shortcomings in the 1940s study reported by Stevenson (1953), including: ‘swimming’ to require head-immersion, multiple exposures to be avoided, non-bather controls to be beach attenders, include more candidate indicators. Notes that studies need to be large enough to obtain “significant results”.
Cabelli VJ. 1977. Indicators of recreational water quality. In: AW Hoadley and BJ Dukta (eds) Bacterial Indicators/Health Hazards Associated with Water. ASTM STP 635, American Society for Testing and Materials, Washington: 222–38. An early review of Cabelli’s approach. Points to the need to develop a scientific basis for standards applicable to waters containing faecal wastes of lower animals (from waterfowl, wild animals, farm run-off and urban stormwater). Reports results from New York component of the full study reported by Cabelli (1983a).
Cabelli VJ. 1978. New standards for enteric bacteria. In: R Mitchell (ed) Water Pollution Microbiology, Vol 2. Wiley, New York: 233–71. Covers risk assessment, drinking water, swimming pool water, recreational waters and shellfish-growing waters. Reviews each area up to the mid-1970s.
REFERENCES AND FURTHER READING. June 2003
J7
Cabelli VJ. 1979. Evaluation of recreational water quality, the EPA approach. In: A James and L Evison (eds) Biological Indicators of Water Quality. Wiley, Chichester, 14-1–14-23. Discusses EPA’s use of “criteria”, “guidelines” and “standards”: a criterion is a relationship (e.g. between indicator density and illness risk); a guideline is a suggested upper limit, derived from the criterion; and a standard is a guideline with the force of law. The beach studies underway were designed to provide criteria.
Cabelli VJ, Dufour AP, Levin MA, McCabe LJ, Haberman PW. 1979. Relationship of microbiological indicators to health effects at marine bathing beaches. American Journal of Public Health 69(7): 690–6. Reports results of second year for the New York part of the full study reported by Cabelli (1983a).
Cabelli VJ, Dufour AP, McCabe LJ, Levin MA. 1982. Swimming-associated gastroenteritis and water quality. American Journal of Epidemiology 115: 606–16. Reports main results of Cabelli (1983a). Concludes that “swimming in even marginally polluted marine bathing water is a significant route of transmission for the observed gastroenteritis”.
Cabelli VJ. 1983a. Health Effects Criteria for Marine Recreational Waters. Report EPA 600/1-80-031, USEPA Cincinnati, OH (first published 1980). NTIS access #: PB 83-259994. Major prospective epidemiological study at coastal beaches in New York and Boston, and a brackish beach at Lake Ponchartrain (Louisiana), involving 26,686 persons. Beaches were impacted by (mostly) chlorinated effluents. Most notable result was a relationship between swimming-associated illness risk and (the logarithm of) enterococci concentration. The illness was HCGI (highly credible gastro-intestinal illness, essentially vomiting or GI accompanied by fever). Analysis methods used data grouping followed by linear regression, rather than the more modern “generalized linear models” (e.g. logistic regression); appropriate software was not then available. Also includes a 1976–78 study in Alexandria, Egypt. Some beaches were very polluted (enterococci up to 104 per 100 mL). Egyptian participants included 12,532 locals and 10,707 visitors (from Cairo). Only E. coli and enterococci were measured, both showing strong associations with highly credible gastrointestinal illness. For equivalent enterococci concentrations illness risks were lower than found in the US studies, attributed to local immunity (Cairo visitors appeared to
be less immune). Four cases of typhoid were found among swimmers at the polluted beach.
Cabelli VJ. 1983b. Public health and water quality significance of viral diseases transmitted by drinking water and recreational water. Water Science & Technology 15(5):1–15. Presents predictions of gastrointestinal illness at beaches using the relationships derived in Cabelli (1983a). Notes the inapplicability of the model to beaches with small immediate waste sources, and local outbreaks.
Cabelli VJ, Dufour AP, McCabe LJ, Levin MA. 1983. A marine recreational water quality criterion consistent with indicator concepts and risk analysis. Journal of the Water Pollution Control Federation 55: 1306–14. Presents the health effects enterococci indicator relationship derived in Cabelli (1983a). Companion paper to Cabelli et al (1982).
Cabelli VJ. 1989. Swimming-associated illness and recreational water quality criteria. Water Science and Technology 21(2): 13–21. Presents the application of results in Cabelli (1983a) by USEPA (1986b). Contains an error in the intercept term (‘0.02’ in Table E1 should be ‘0.2’). States the expectation that contamination of water with faecal wastes from lower animals would carry a much lower risk of illness than from humans.
Calderon RL, Mood EW. 1982. An epidemiological assessment of water quality and ‘swimmer’s ear’. Archives of Environmental Health 37(5): 300–5. A retrospective study of otitis externa in 1980 on 29 cases and controls finding that swimming and length of time spent in the water were associated positively with cases of otitis externa. No significant correlation of the illness with water quality was found (faecal coliforms, enterococci, Pseudomonas aeruginosa).
Calderon RL, Mood EW, Dufour AP. 1991. Health effects of swimmers and nonpoint sources of contaminated water. International Journal of Environmental Health Research 1: 21–31. Reports a diary illness study of users of freshwater ponds impacted only by animal wastes. Gastrointestinal illness was related to the number of swimmers and to staphylococcal counts. “Swimmer illness was not associated with high densities of common faecal indicator bacteria ...”.
REFERENCES AND FURTHER READING. June 2003
J8
Carrie MS. 1973. Coliforms and water quality legislation. Soil and Water 10(2): 20–3. Gives some explanation of how the standards in the 1971 Water and Soil Conservation Amendment Act (No. 2) came to pass.
Cheung WHS, Chang KCK, Hung RPS, Kleevens JWL. 1990. Health effects of beach water pollution in Hong Kong. Epidemiology and Infection 105: 139–62. Reports on a 1987 prospective study at nine Hong Kong beaches using 18,741 useable responses. E. coli was found to be the best indicator of health effects (gastrointesteritis and skin symptom rates) among swimmers. Overall symptom rates for gastrointestinal, ear, eye, skin, respiratory, fever and total illness was (statistically) significantly higher for swimmers than for non-swimmers. Low gastrointestinal illness rates were observed at the two beaches impacted by animal wastes. Concludes that illness associated with swimming is a public health problem in Hong Kong. While this study reported low gastro-intestinal swimming-associated rates at the two beaches influenced by livestock (pig) wastes, respiratory illness and skin infections rates were elevated such that the total illness rate was very similar to the other beaches.
Cheung WHS, Chang KCK, Hung RPS. 1991. Variations in microbial indicator densities in beach waters and health-related assessment of bathing water quality. Epidemiology and Infection 106: 329–44. Describes daily and hourly variations in microbial indicators. E. coli was influenced by tide, by staphylococci and by the number of bathers. Average staphylococci: E. coli ratio was 0.04:3. Staphylococci serve as an indicator of bather density and risk of cross-contamination between bathers. Recommends weekend sampling for compliance assessment.
Chung H, Jaykus L-A, Lovelace G, Sobsey MD. 1998. Bacteriophages and bacteria as indicators of enteric viruses in oysters and their harvest waters. Water Science and Technology 38(12): 37–44. Concentrations of male-specific (F+) coliphages, Bacteroides fragilis phages, Salmonella phages and several indicator bacteria in wastewater, estuarine receiving water and its oysters were examined at 2–4-week intervals for 14 months. The levels of most indicators were higher in oysters and water when oysters were virus-positive. F+ coliphages and C. perfringens were the only indicators significantly associated with the presence of enteric viruses in oysters.
Conover WJ. 1980. Practical Nonparametric Statistics. 2nd ed. Wiley, New York. The best introduction to this class of methods, whereby data ranks are used in place of their actual magnitudes (e.g. medians and percentiles).
Corbett SJ, Rubin GL, Curry GK, Kleinbaum DG, et al 1993. The health effects of swimming at Sydney beaches. American Journal of Public Health 83(12): 1701–6. Reports follow-up study of 2,839 beach-goers in 1989/90; 683 reported experiencing symptoms in the 10 days following initial interview, of whom 435 reported respiratory symptoms. A linear relationship between water pollution and all reported symptoms (except gastrointestinal) was shown.
Cornax R, Morinigo MA, Balebona C, Castro D, Borrego JJ. 1991. Significance of several bacteriophage groups as indicators of sewage pollution in marine waters. Water Research 25: 673–8. From a two-beach study this documents a poor correlation between FRNA phages and pathogen occurrence and persistence. Concludes that faecal streptococci and E. coli “C bacteriophages” are the most appropriate indicators of remote pollution in marine waters.
Dadswell JV. 1993. Microbiological quality of coastal water and its health effects. International Journal of Environmental Health Research 3: 32–46. Reviews health-related marine microbiology, both natural and pollution-related organisms.
D’Alessio D, Minot TE, Allen CI, Tsiatis AA, Nelson DB. 1981. A study of the proportions of swimmers among well controls and children with enterovirus-like illness shedding or not shedding an enterovirus. American Journal of Epidemiology 113(5): 533–41. A retrospective study of children visiting a paediatric clinic in Madison, Wisconsin, in 1977: 679 well children and 296 with enteroviral-like symptoms. Exclusive beach swimmers had significantly (p < 0.0005) relative risk (odds ratio estimate 3.41) of enterovirus illness. The highest relative risk (10.63) of enterovirus illness occurred in children less than four years old who were exclusive beach swimmers.
REFERENCES AND FURTHER READING. June 2003
J9
Davies-Colley RJ, Bell RG, Donnison AM. 1994. Sunlight inactivation of enterococci and fecal coliforms in sewage effluent diluted in seawater. Applied and Environmental Microbiology 60: 2049–58. Two parameters are required to describe the inactivation (loss of culturability): a shoulder constant and a rate constant. Depth-dependent inactivation rate for both indicators matched the attenuation profile of UV-A radiation at about 360 nm (attributable to inactivation maxima in the 318–340 and > 400 nm ranges, Sinton et al 1994). Inactivation by UV-B (290–320 nm, which penetrates less into seawater) is of lesser importance.
Davies-Colley RJ, Donnison AM, Speed DJ. 1997. Sunlight wavelengths inactivating faecal indicator micro-organisms in waste stabilisation ponds. Water Science and Technology 35(11–12): 219–25. UVB, UVA and blue-green (< 550 nm) radiation all contributed to inactivation of enterococci and (possibly) FRNA phage, consistent with a photo-oxidation mechanism. In contrast, E. coli and (possibly) FDNA phage were inactivated mainly by UVB in these freshwaters. Results suggest E. coli may be a better freshwater indicator than enterococci.
Davies-Colley RJ, Donnison AM, Speed DJ, Ross CM, Nagels JW. 1999. Inactivation of faecal indicator microorganisms in waste stabilisation ponds: Interactions of environmental factors with sunlight. Water Res 33: 1220–30. Sunlight exposure is considered to be the most important cause of “natural” disinfection in waste stabilisation ponds (WSPs). The influence of dissolved oxygen (DO), pH, and particulate and dissolved constituents in WSP effluent, on sunlight inactivation of faecal micro-organisms, using small reactors operated under controlled physico-chemical conditions was examined. Inactivation of both enterococci and F-RNA phages increased strongly as DO was increased, and also depended on light-absorbing pond-water constituents, but pH was not influential over the range investigated (7.5 to 10). Inactivation of E. coli increased strongly when pH increased above 8.5, as well as being strongly dependent on DO. Inactivation of F-DNA phage was independent of the factors investigated. These results are consistent with the F-DNA phages being inactivated as a result of direct DNA damage by UVB in sunlight, whereas the other three microbiological indicators are inactivated as a result of photo-oxidative damage, although the target of damage is apparently different. Our findings of diverse influences of physico-chemical conditions suggest difficulties in interpreting data for a single micro-organism to indicate WSP effluent quality. However, sunlight remains the factor of overriding importance, and disinfection in WSPs may be enhanced by increasing sunlight exposure.
Deely J, Hodges S, McIntosh J, Bassett D. 1997. Enterococcal numbers measured in waters of marine, lake, and river swimming sites of the Bay of Plenty, New Zealand. New Zealand Journal of Marine and Freshwater Research 31: 89–101. Reports enterococci numbers for 32 coastal beaches, 23 lake beaches and 31 river swimming holes, using medians of five samples. Most marine, lake and up-river sites had low enterococci counts, complying with current guidelines, but mid-river and lowland river reaches tended to breach those guidelines.
Department of Health. 1992. Provisional Microbiological Water Quality Guidelines for Recreational and Shellfish-gathering Waters in New Zealand. Department of Health, Public Health Services, Wellington. Previous guidelines, issued in response to a number of authorities beginning to use the USEPA (1986b) criteria. These guidelines attempted to interpret those criteria in terms of New Zealand conditions.
Disinfection Review Group. 2002. Pilot Study: Pilot plant investigations, surrogate study results and recommendations. Final report to Watercare Services Ltd, Auckland, June. Reports on an extensive set of trials examining inactivation rates of a number of faecal indicators and pathogens in a pilot plant mimicking the processes to be used in the upgraded Mangere Wastewater Treatment Plant. Demonstrates decreasing correlations between indicators and pathogens (enteroviruses) as the level of treatment is increased.
Donnison AM, Cooper RN. 1990. Enumeration of faecal coliforms and Escherichia coli in New Zealand receiving waters and effluents. Environmental Technology 11: 1123–7. Describes mTEC membrane filtration method for enumeration of faecal coliforms and E. coli (as a subsequent step). Compares the method favourably to alternatives (MPN and mFC).
Donnison AM. 1992. Enumeration of enterococci in New Zealand waters and effluents. Environmental Technology 13: 771–8. Compares an in-house MPN method to the USEPA Membrane Filter Method, suggesting it as a desirable method for enumerating enterococci in effluents (particularly if they are minimally treated).
REFERENCES AND FURTHER READING. June 2003
J10
Donnison AM, Ross CM. 1995. Somatic and F-specific coliphages in New Zealand waste treatment lagoons. Water Research 29(4): 1105–10. Concludes that the FRNA:FDNA coliphage ratio may distinguish between animal and human faecal material.
Donnison AM, Ross CM. 1999. Animal and human faecal pollution in New Zealand. New Zealand Journal of Marine and Freshwater Research 33: 119–28. Sentinel freshwater mussels were placed in rivers impacted by faecal pollution. E. coli were recovered from all sites (including a forest control site) but were highest at sites impacted by treated sewage, meat-processing wastes or dairy farm inputs. The pathogens measured (Campylobacter jejuni, E. coli, Salmonella typhimurium, Yersinia enterocolitica) were recovered from mussels – except at the control site. Untreated wastewaters (sheep, beef, human sewage) all indicated the presence of these pathogens, mostly in more than half the samples. Thermophilic Campylobacters “are likely to remain after secondary treatment of either meat plant waste water or sewage”.
Dufour AP. 1984. Health Effects Criteria for Fresh Recreational Waters. Report EPA 600/1-84.004, USEPA Cincinnati, OH. NTIS access #: PB 85-150878. Major prospective epidemiological study at lake beaches in Tulsa, Oklahoma, and Erie, Pennsylvania, involving 34,598 persons. Most notable result was a relationship between “swimming-associated pollution-related illness risk” and (the logarithm of) E. coli and enterococci concentrations. The association with E. coli was the stronger of the two. The illness was HCGI (highly credible gastro-intestinal illness, being GI accompanied by fever). Analysis methods used data grouping followed by linear regression, rather than the more modern “generalized linear models” (e.g. logistic regression); appropriate software was not available. Also reports results of Egyptian studies, but these were not included in their final analysis.
Dutka BJ. 1979. Microbiological indicators, problems and potential of new microbial indicators of water quality. In: A James and L Evison (eds) Biological Indicators of Water Quality. Wiley and Sons, London. Reviews alternatives, each of which may signal contamination.
Eberhart-Phillips J, Walker N, Garrett N, Bell D, Sinclair D, Rainger W, Bates M. 1997. Campylobacteriosis in New Zealand: results of a case-control study. Journal of Epidemiology and Community Health 51: 686–91. Reports a study on 621 people with notified illness between June 1994 and February 1995 in Auckland, Hamilton, Wellington and Christchurch. Found undercooked chicken to be a strong risk factor. Rainwater as a source at home was a lesser factor. Recreational water use appears not to have been in the questionnaire.
EEC. 1976. Council Directive of 8 December 1975 concerning the quality of bathing water (76/160/EEC). Official Journal of the European Communities. No. L31/1–7. Available at: http://europa.eu.int/water/water-bathing/directiv.html. Documents the EEC bathing water directive. Imperative standards require 95% of fortnightly samples to not exceed 10,000 total coliforms per 100 mL or 2000 faecal coliforms per 100 mL. If inspection shows that other substances may be present, or that water quality has deteriorated, then there should be zero Salmonella per litre and zero enterovirus per 10 litres in 95% of samples (sampling frequency unspecified). Guideline values require 80% of fortnightly samples to not exceed 500 total coliforms per 100 mL or 100 faecal coliforms per 100 mL. If inspection shows that the substances may be present, or that water quality has deteriorated, then 80% of samples should not exceed 100 faecal streptococci per 100 mL (sampling frequency unspecified). There are other limits on pH, colour, mineral oils, surface-active substances, phenols, transparency, dissolved oxygen, tarry residues and floatables (fortnightly sampling being required for colour, mineral oils, surface-active substances, phenols, transparency, tarry residues and floatables). The following should be checked if there is a tendency toward eutrophication: ammonia and Kjeldahl nitrogen. If inspection shows that other substances may be present, or that water quality has deteriorated, then sampling is required for pesticides, heavy metals, cyanides, nitrates and phosphates.
EEC. 1979. Council Directive of 30 October 1979 on the quality required of shellfish waters. Official Journal of the European Communities. No. L 281/47–49 plus annex. Details, with amendment 391L0692, at: http://europa.eu.int/eur-lex/en/lif/dat/1979/en_379L0923.html.
REFERENCES AND FURTHER READING. June 2003
J11
EHD. 1980. A Study of Disease Incidence and Recreational Water Quality in the Great Lakes. Phase I. Report 81-EHD-67. Environmental Health Directorate, Health Protection Branch, Health and Welfare, Ottawa, Canada (prepared by The University of Toronto). A prospective study using 6,166 interviews, of whom 65% were swimmers at lake beaches. Swimmers were found to have higher morbidity risks. Main feature was evidence of bather-to-bather transmission of infections (strongest association was with Staphylococci).
El-Sharkawi F, Hassan MNER. 1979. The relation between the state of pollution in Alexandria swimming beaches and the occurrence of typhoid among bathers. Bulletin of the High Institute of Public Health of Alexandria IX: 337–51. (Reprinted by the Alexandria University Press, 1980.) Report obtainable from G McBride, NIWA, Hamilton, New Zealand. Reports on a 1976 retrospective study of hospital inpatients. Concludes that “there is a significant risk of contracting Typhoid from bathing in the polluted water and the mostly affected were the young age group”. Sewer outfalls discharged raw material directly to some beaches.
Elliot EL, Colwell RR. 1985. Indicator organisms for estuarine and marine waters. FEMS Microbiology Reviews 32: 61–79. Documents finding the presence of pathogens in waters and shellfish when faecal coliforms are either absent or in low numbers.
Elliott AH. 1998. Prediction of illness risk near ocean outfalls using frequency distributions of bacterial concentrations. Water Research 32(10): 3182–7. Presents a method for combining temporal concentration frequency distribution with a concentration–response relation to obtain an averaged illness rate, applied to North Shore (Auckland).
Ellis JC, Lacey RF. 1980. Sampling: defining the task and planning the scheme. Water Pollution Control 79: 452–67; discussion: 482–4. Wide review of sampling programme design. Discusses statistics of assessing compliance with percentile standards, where the percentile refers to a percentage of time (not of samples).
EU. 1994. Proposal for a Council Directive concerning the quality of bathing water. Official Journal of the European Communities. No. C 112/3–10. Available at: http://europa.eu.int/eur-lex/en/com/dat/1994/en_594PC0036.html. Clarifies method of compliance assessment and proposes revised quality requirements based on E. coli, faecal streptococci, enteroviruses (bacteriophages mentioned, but no limits are proposed). Compliance is to be assessed using look-up tables (e.g. for an imperative standard, 95% percentile are assessed by allowing no exceedances in 19 samples, one exceedance in between 20 and 39 samples, etc). The imperative 95% percentile limits for E. coli and faecal streptococci are 2000 and 400 per 100 mL respectively, and for enteroviruses it remains at 0 pfu/10 L.
Fattal B, Vasl RJ, Katzenelson E, Shuval HI. 1983. Survival of bacterial indicator organisms and enteric viruses in the Mediterranean coastal waters off Tel-Aviv. Water Research 17: 397–402. Reports ‘die-away’ studies on coliforms and enteric viruses offshore from Tel Aviv. Concentrations of total coliforms, faecal coliforms and faecal streptococci were correlated with enterovirus concentrations (though not all correlations were statistically significant). Faecal streptococci displayed a similar die-away rate to enteroviruses; the other bacteria reduced more quickly. About 76% of positive enterovirus samples were found at beaches within ‘safe’ levels, as indicated.
Fattal B, Peleg-Olevsky E, Yoshpe-Purer Y, Shuval HI. 1986. The association between morbidity among bathers and microbial quality of seawater. Water Science and Technology 18(11): 59–69. Reports a prospective epidemiological study at three Tel Aviv coastal beaches in 1983, comprising 2,231 persons (23% below four years of age). Strongest finding was symptoms of enteric morbidity among swimmers, particularly the 0–4-year-olds, related to elevated levels of enterococci, E. coli and staphylococci (not faecal coliforms). Swimmers had more morbidity of all types of symptoms (enteric, respiratory, others) than non-swimmers.
Fattal B, Peleg-Olevsky E, Agursky T, Shuval HI. 1987. The association between seawater pollution as measured by bacterial indicators and morbidity among bathers at Mediterranean bathing beaches of Israel. Chemosphere 16(2/3): 565–70. A briefer description of the 1983 study than that given by Fattal et al (1986).
REFERENCES AND FURTHER READING. June 2003
J12
Fattal B, Peleg-Olevsky E, Cabelli VJ. 1991. Bathers as a possible source of contamination for swimming-associated illness at marine bathing beaches. International Journal of Environmental Health Research 1: 204–14. Further analysis of the 1983 study. Notes that the best association between an indicator and swimmers’ illness is with Staphylococcus aureus (rather than enterococcus or E. coli), suggesting bather-to-bather contamination as a dominant mechanism.
Favero MS. 1985. Microbiological indicators of health risks associated with swimming. American Journal of Public Health 75(9): 1051–3. Reviews the history of this topic up to 1985 (Seyfried et al’s papers were in this issue). Notes that faecal coliforms may now be regarded as “relatively useless for judging the safety of natural bathing waters”. Notes also the USEPA promulgated a proposal that the criteria be set at 20 enterococci per 100 mL or 77 E. coli per 100 mL for freshwaters or only three enterococci per 100 mL for marine waters (Federal Register May 1984, 49(102): 21987–8). These limits were revised upward after feedback from professionals, many of whom suggested that the proposed limits were too stringent (Federal Register February 1986, 51(45): 8012–16).
Fayer R, Graczyk TK, Lewis EJ, Trout JM, Farley CA. 1998. Survival of infectious Cryptosporidium parvum oocysts in seawater and Eastern oysters (Crassostrea viginica) in the Chesapeake Bay. Applied and Environmental Microbiology 64(3): 1070–4. Oocysts placed in artificial seawater were infectious for up to 12 weeks. Oysters sampled from natural waters contained infectious oocysts and can serve as mechanical vectors of this organism.
Ferguson CM, Coote BG, Ashbolt NJ, Stevenson AM. 1996. Relationships between indicators, pathogens and water quality in an estuarine system. Water Research 30(9): 2045–54. Water and sediment sampling for a range of indicators and pathogens is reported for an urban estuary in Sydney, Australia. Significant increases of faecal coliforms, faecal streptococci, Clostridium perfringens spores, F-RNA bacteriophage, Aeromonas spp., Giardia and Cryptosporidium spp. occurred in the water after rain, but only faecal coliforms showed significant increases in the sediments. Isolations of enteric viruses were sporadic and not exclusively related to wet weather events. C. perfringens was identified as the most useful indicator of faecal pollution.
Ferley JP, Zmirou D, Balducci F, Baleux B, Fera P, Larbaigt G, Jacq E, Moissonnier B, Blineau A, Boudot J. 1989. Epidemiological significance of microbiological pollution criteria for river recreational waters. International Journal of Epidemiology 18: 198–205. Reports a retrospective 1986 follow-up study in the Ardèche basin using 5737 tourists in eight holiday camps. Found a relative risk of 2.3 (95% CI = 1.7–3.2) for “objective” gastrointestinal cases (requires vomiting or diarrhoea). Faecal streptococci were best correlated to morbidity, with threshold 20 per 100 mL.
Fewtrell L, Godfree AF, Jones F, Kay D, Salmon RL, Wyer MD. 1992. Health effects of white-water canoeing. The Lancet 339: 1587–9. Reports a prospective cohort study using 516 canoeists on two channels with different degrees of pollution: arithmetic mean enterovirus 198 and 0 pfu/L and geometric mean faecal coliforms 285 and 22/dL for streams A and B. Between five and seven days after exposure canoeists using stream A had significantly higher incidences of gastrointestinal and upper respiratory symptoms than either canoeists using stream B or non-exposed controls (spectators).
Fewtrell L, Kay D, Salmon RL, Wyer MD, Newman G, Bowering G. 1994. The health effects of low-contact water activities in fresh and estuarine waters. Journal of the Institution of Water and Environmental Management 8: 97–101. Four studies were carried out at separate locations (two freshwater and two estuarine) using about 1000 participants in marathons and canoeing. Geometric mean faecal coliforms ranged from 62 to 4613 per 100 mL. Comparison of exposed and unexposed groups five – seven days after exposure showed minimal health effects for the low water-contact sports.
Figueras MJ, Polo F, Inza I, Guarro J. 1997. Past, present and future perspectives of the EU bathing water directive. Marine Pollution Bulletin 34(3): 148–56. Reviews reasons put forward for changes to the 1976 standards (EEC 1976) and recent proposals.
REFERENCES AND FURTHER READING. June 2003
J13
Figueras MJ, Robertson W, Pike EB, Ashbolt NJ, Borrego JJ. 2000. Sanitary inspection and microbiological water quality. In: J Bartram, G Rees (eds). Monitoring Bathing Waters: A practical guide to the design and implementation of assessments and monitoring programmes. London, E & FN Spons, 113–67. Published on behalf of the World Health Organization, Commission of the European Communities and US Environmental Protection Agency.
Fleisher JM, McFadden RT. 1980. Obtaining precise estimates in coliform enumeration. Water Research 14: 477–83. Argues for increasing precision in coliform enumerations by replication of sampling.
Fleisher JM. 1985. Implications of coliform variability in the assessment of the sanitary quality of recreational waters. Journal of Hygiene (Cambridge) 94: 193–200. Reanalysed New York coliform compliance data, showing the impact of lack of precision. Within-day variations were identified.
Fleisher JM. 1990a. Conducting recreational water quality surveys: Some problems and suggested remedies. Marine Pollution Bulletin 21(2): 562–7. Discusses need to account for measurement error and temporal within-day variability of microbiological examinations. Argues it is better to maximise replications instead of sample dates.
Fleisher JM. 1990b. The effects of measurement error on previously reported mathematical relationships between indicator organism density and swimming associated illness: a quantitative estimate of the resulting bias. International Journal of Epidemiology 19(4): 1100–6. Uses computer simulations to demonstrate the effect of measurement error on indicator–health risk relationships. Underestimation of health risks was shown. Recommendations for future study designs were made.
Fleisher JM. 1991. A re-analysis of data supporting US federal bacteriological water quality criteria governing marine recreational waters. Research Journal WPCF 63(3): 259–65. Criticises the USEPA criteria for including brackish water (Lake Ponchartrain, Louisiana), and reanalyses the data using logistic regression. Some aspects of the reanalysis are also open to question in our opinion (especially the weight put on Boston data beyond their range).
Fleisher JM. 1992. US Federal bacteriological water quality standards: a re-analysis. In: D Kay (ed) Recreational Water Quality Management. Vol. 1, Coastal Waters. New York, Ellis Horwood, 113–28. Criticises the USEPA criterion’s basis for incorporating three different relationships (for the three beaches) developed by the author, using logistic regression.
Fleisher JM, Jones F, Kay D, Morano R. 1993. Setting recreational water quality criteria. In: D Kay and R Hanbury (eds). Recreational Water Quality Management. Vol. 2. Fresh Water. New York, Ellis Horwood, 123–36. Identifies sources of bias probably incorporated in previous epidemiological studies, and promotes methods to minimise them.
Fleisher JM, Jones F, Kay D, Stanwell-Smith R, Wyer MD, Morano R. 1993. Water and non-water related risk factors for gastroenteritis among bathers exposed to sewage contaminated marine waters. International Journal of Epidemiology 22: 698–708. Finds three faults in previous epidemiological studies, being failures to: account for within-day and spatial variability at beaches, relate indicator concentration to an individual bather, and rigorously control non-water-related risk factors. Results of two “intervention follow-up studies” (controlled-cohort trials) are reported. These were at Langland Bay (109 bathers and 124 non-bathers) and Moreton Beach (97 bathers and 154 non-bathers). Faecal streptococci (and not faecal coliforms) were associated with bathers’ gastrointestinal illness, and only for chest-depth samples (two shallower sampling depths were used): “excess risk among bathers did not occur until exposure to waters containing 40–59 faecal streptococci/100 mL”.
REFERENCES AND FURTHER READING. June 2003
J14
Fleisher JM, Kay D, Salmon RL, Jones F, Wyer MD, Godfree AF. 1996. Marine waters contaminated with domestic sewage, non-enteric illnesses associated with bather exposure in the United Kingdom. American Journal of Public Health 86(9): 1228–34. Reports on results from all four UK controlled-cohort studies using 1216 healthy adult volunteers (average age about 32 years). Intensive water-quality monitoring was used to assign possible health-risk indicators (all bacteria) to individual bathers. Faecal streptococci exposure (threshold 60 per 100 mL) was predictive of acute febrile respiratory illness (which must include fever), while faecal coliform exposure (threshold 100 per 100 mL) was predictive of ear ailments. Bathers were at higher risk for eye ailments.
Fleisher JM, Kay D, Wyer MD, Merrett H. 1996. The enterovirus test in the assessment of recreational water-associated gastroenteritis. Water Research 30(10): 2341–6. Uses polychotomous logistic regression on 2066 parallel faecal streptococci and enterovirus enumerations from 416 UK locations. Found that the actual viruses enumerated by the assay are not aetiologically related to recreational water-associated gastroenteritis. Suggest that enterovirus assay may be of limited use in assessing marine recreational water quality.
Fleisher JM, Kay D, Wyer MD, Godfree AF. 1998. Estimates of the severity of illnesses associated with bathing in marine recreational waters contaminated with domestic sewage. International Journal of Epidemiology 27: 722–6. Reviews findings of the four UK controlled-cohort trials. Concludes that “illness associated with bathing in marine waters contaminated with domestic sewage can no longer be viewed as minor, and indeed can have a substantial impact on the public health”.
Foulon G, Maurin J, Quoi N, Martin-Boyer G. 1983. Relationship between the microbial quality of water and health effects. Revue Francaise des Sciences de L’Eau 2: 127–43. Beach interviews of 4,921 persons at five coastal beaches were followed by an answer card (only 1532 persons did so). The study indicates that an answer card system should be avoided. See also the review by Shuval (1986).
Fraser GG, Cooke KR. 1991. Epidemic giardiasis and municipal water supply. American Journal of Public Health 81(6): 760–2. Compares reported rates of giardiasis in Dunedin (New Zealand) for two 10-month periods. The city had two water supplies, one “unfiltered” (microstrained, 23 µm) and the other a modern plant with dual filters (anthracite and silica sand). Found incidence rate-ratio of 3.3 (90% CI = 1.1, 10.1, 49 cases). A parallel case-control study found an odds ratio of 1.8 (90% CI = 0.5, 6.5). These results do not achieve “statistical significance” at the 95% level, but are suggestive of transmission of Giardia via water.
Furfari SA. 1968. History of the 70 MPN/100 mL standard. Memo, Northeast Marine Health Services Laboratory, USA. Documents the history of the 70 MPN per 100 mL shellfish-gathering water standard, as used by the US Public Health Service. The calculation was based on a requirement that no more than 50% of 1 mL portions were positive for coliforms, equivalent to an MPN of about 70 per 100 mL. (Available only from G McBride, NIWA, Hamilton, New Zealand.)
Gameson ALH, Gould DJ. 1975. Effects of solar radiation on the mortality of some terrestrial bacteria in sea water. In: ALH Gameson (ed) Discharge of Sewage from Sea Outfalls. Pergamon Press, Oxford and New York, 209–19. Rate of die-off of coliforms in water is much greater in daylight than in the dark. Die-off of E. coli was slower than that of total coliforms. Reports seminal work on this topic.
Gameson ALH. 1979. EEC directive on quality of bathing water. Water Pollution Control 78(2): 206–14. Notes some practical difficulties in implementing the EEC Directive (EEC 1976).
Geldreich EE. 1978. Bacterial populations and indicator concepts in feces, sewage, stormwater and solid wastes. In: G Berg (ed) Indicators of Viruses in Water and Food. Ann Arbor Science, Ann Arbor, Mich., 51–97. Substantial review of literature up to the late 1970s.
REFERENCES AND FURTHER READING. June 2003
J15
Gibson CJ, Stadterman KL, States S, Sykora J. 1998. Combined sewer overflows: a source of Cryptosporidium and Giardia. Water Science and Technology 38(12): 67–72. Combined overflows were found to contribute both parasites in dry and (particularly) wet weather.
Gilbert RO. 1987. Statistical Methods for Environmental Pollution Monitoring. Van Nostrand Reinhold, New York. This is an excellent book on many aspects of statistical interpretation of pollution data. Particularly strong on the log-normal distribution, which is often followed by microbiological particles.
Godfree A, Jones F, Kay D. 1990. Recreational water quality: the management of environmental health risks associated with sewage discharges. Marine Pollution Bulletin 9: 414–22. Reviews past studies and claims the 1986 USEPA “standards” do not have a firm scientific foundation.
Goodman SN. 1993. p values, hypothesis tests, and likelihood: implications for epidemiology of a neglected historical debate. American Journal of Epidemiology 137(5): 485–96. Discusses valid and invalid conclusions from significance tests and hypothesis tests.
Grabow WOK, Idema GK, Coubrough P, Bateman BW. 1989. Selection of indicator systems for human viruses in polluted seawater and shellfish. Water Science and Technology 21(3): 111–17. Analysed 610 samples of sewage, polluted seawater and shellfish. Ratios of indicators:viruses varied considerably. Recommends sample medians of 100 faecal coliforms per 100 mL, 40 faecal streptococci per 100 mL, 50 coliphages per 100 mL, 0 human viruses per 10 L.
Green DH, Lewis GD. 1999. Comparative detection of enteric viruses in wastewaters, sediments and oysters by reverse transcription-PCR and cell culture. Water Research 33(5): 1195–200. Reports results from eight occasions over a 12-month period around Auckland’s Mangere treatment plant. Enteroviruses were found up to 276 pfu per L in the final effluent, being highest in winter and spring (four samples were less than detection limit). They were also present in most sediment samples and in three oyster samples. Rotavirus was present in most final effluent and oyster samples, and in one sediment sample. Hepatitis A virus was confirmed in seven sediment samples, but not in any final effluent or oyster samples.
Grimes DJ. 1991. Ecology of estuarine bacteria capable of causing human disease: a review. Estuaries 14(4): 345–60. Reviews current knowledge concerning A. cinetobacter, Aeromonas, Clostridium, Enterobacter, Flavobacterium, Legionella, Listeria, Pleisiomonas, Pseudomonas and Vibrio.
Grimont F, Grimont PAD, Richard C. 1992. The genus Klebsiella. In: A Balows et al (eds) The Prokaryotes, 2nd ed. Springer-Verlag, New York, 2673–4. Discusses Klebsiella species as infectious particles.
Grohmann GS, Ashbolt NJ, Genova MS, Logan G, Cox P, Kueh CSW. 1993. Detection of viruses in coastal and river water systems in Sydney, Australia. Water Science and Technology 27(3–4): 457–61. Isolated enteroviruses, adenoviruses and reoviruses. Data suggest “long-term survival of viruses in sediments and/or contamination from other sources such as storm water discharge”. Since the use of deep ocean outfalls there was a decrease in the number of positive seawater samples close to the beaches, whereas in stormwater drains viral presence remained constant.
Haas CN, Rose JB, Gerba CP. 1999. Quantitative Microbial Risk Assessment. Wiley, New York. Authoritative reference for this new field of risk modelling, and associated techniques.
REFERENCES AND FURTHER READING. June 2003
J16
Haile RW, Alamillo J, Barrett K, Cressey R, Dermond J, Ervin C, Glasser A, Harawa N, Harmon P, Harper J, McGee C, Millikan RC, Nides M, Witte JS. 1996. An Epidemiological Study of Possible Adverse Health Effects of Swimming in Santa Monica Bay. Santa Monica Bay Restoration Project. Final Report, 7 May (summary dated October 1996). Reports a large-scale epidemiological study of head-immersing bathers aimed at evaluating the possible adverse health effects of urban run-off. Some 11,793 successful follow-up interviews were completed with beach attenders, and daily ankle-depth water samples were analysed for faecal coliforms, enterococci and E. coli. Findings include: (i) an increased risk of illness (about 1%) associated with swimming near flowing storm drain outlets (based on groups swimming at and 400 yards from drains); (ii) an increased risk of illness associated with swimming in areas with high densities of bacterial indicators; (iii) the total coliform to faecal coliform ratio was one of the better indicators for predicting health risk; (iv) illnesses were reported more often on days when samples were positive for enteric viruses.
Hall AJ, Rodrigues LC. 1992. Health risks associated with bathing in sea water. British Medical Journal 302: 572. A letter to the editor faulting Balarajan et al (1991) for lack of detail on a number of issues (pre-publicity, influence of non-ownership of telephones, forms of immersion, accounting for possible confounders). In reply (same page) the authors clarified aspects of these questions (e.g. explaining how they minimised pre-publicity so as to avoid enhanced self-reporting of symptoms). They noted that their main finding was a “dose-response effect of different forms of contact with sea water: those bathing activities that entailed more immersion usually resulted in more symptoms being reported”.
Harrington JF, Wilcox DN, Giles PS, Ashbolt NJ, Evans JC, Kirton HC. 1993. The health of Sydney surfers: an epidemiological study. Water Science and Technology 27(3–4): 175–81. Reports a 90-day, six-beach study wherein 2003 recruits returned 4011 questionnaires incorporating 43,175 swimming events. Overall, swimmers reported illness 1.63 times more often than non-swimmers. Relative risks for total illness in males rose from 1.79 in high-frequency beach swimmers, to 2.26 when their swims at non-ocean sites were included. No firm health-based risk threshold was reported.
Henshilwood K, Green J, Lees DN. 1993. Monitoring the marine environment for small round structured viruses (SRSVs): a new approach to combating the transmission of these viruses by molluscan shellfish. Water Science and Technology 38(12): 51–6. Shellfish were measured every 1–2 weeks over a 14-month period for SRSVs. Concentrations were highest in winter, when oyster-associated gastrointestinal illness is at its peak. Sequence analysis identified 11 SRSV strains. Virus monitoring of shellfish is now possible.
Holmes PR. 1989. Research into health risks at bathing beaches in Hong Kong. Journal of the Institution of Water and Environmental Management 3: 488–95. Partial presentation of results of the 1987 Hong Kong study (see Cheung et al 1990).
Horwitz MS. 1990. Adenoviruses. In: BN Fields et al (eds) Virology, 2nd ed. Raven Press, New York, 1723–43. Describes this virus, which can cause significant respiratory illness.
IAWPRC. 1991. Bacteriophages as model viruses in water quality control. In: AH Havelaar (ed) Study Group on Health Related Water Microbiology. Water Research 25: 529–45. Reviews possible use of F-specific RNA phages and phages of Bacteroides fragilis as virus surrogates. Usefulness of somatic coliphages is compromised by their ability to multiply in freshwater.
Ikram R, Chambers S, Mitchell P, Brieseman MA, Ikram OH. 1994. A case control study to determine risk factors for Campylobacter infection in Christchurch in the summer of 1992–93. New Zealand Medical Journal 107: 430–2. A study aimed at determining the risk factors for acquiring Campylobacter infection in Christchurch in the 1992/93 summer found eating undercooked chicken away from home is a major factor, but also drinking water from a non-urban supply.
REFERENCES AND FURTHER READING. June 2003
J17
Jones F, Kay D. 1989. Bathing waters and health studies. Water Services 93: 87–9. Raises questions about the Cabelli studies (between-site range of illness rates, use of telephone survey rather than medical follow-up, lack of control of length of swim, lack of information on alternative modes of infection). Opined that USA results may not be transferable to UK.
Jones F, Kay D, Stanwell-Smith R, Wyer M. 1990. An appraisal of the potential health impacts of sewage disposal to UK coastal waters. Journal of the Institution of Water and Environmental Management 4: 295–303. Claims that North American epidemiological studies are not scientifically robust, leaving a “research vacuum”, such that UK studies should proceed (pilot controlled cohort studies had been carried out in 1989 at Langland Bay in Wales).
Jones F, Kay D, Stanwell-Smith R, Wyer M. 1991. Results of the first pilot-scale controlled cohort epidemiological investigation into possible health effects of bathing in sea water at Langland Bay, Swansea. Journal of the Institution of Water and Environmental Management 5: 91–8. Reviews the 1989 controlled-cohort pilot study. Notes that responses to their detailed medical questionnaire resulted in higher reported attack rates of perceived illness for both bathers and non-bathers. Some statistically significant results were reported for perceived illness, which were not confirmed by clinical tests. Concludes full-scale studies are desirable.
Jones N, Graham J. 1995. Outbreak of gastroenteritis associated with oysters: a Norwalk-like virus most likely cause. The New Zealand Public Health Report 2(3): 25–7. Thirty-six of 95 people attending a Christmas party in December 1994 developed a gastrointestinal illness. Epidemiological and microbiological investigation indicated that oysters contaminated with a Norwalk-like virus were the most likely cause of infection. The oysters were all probably from a Bay of Islands farm.
Kay D. 1988. Coastal bathing water: the application of water quality standards to Welsh beaches. Applied Geography 8: 117–34. Compares relative utility of European and North American standards to Welsh beach data. Equates faecal coliforms to E. coli.
Kay D, McDonald A. 1986a. Coastal bathing water quality. Journal of Shoreline Management 2: 259–83. Notes the need for very large samples to identify statistically significant relationships. Criticises the PHLS (1959) and MRC (1959) findings as inferences going far beyond the data gathered (which was for two severe notifiable illnesses).
Kay D, McDonald A. 1986b. The relevance of epidemiological research in the British context. European Water and Sewage 90: 321–8. Documents the UK shift away from the views expressed by MRC (1959) and PHLS (1959). Notes that statistically significant transmission of minor illnesses could be expected even at beaches that comply with the EEC standards.
Kay D, Wyer M, McDonald A, Woods N. 1990. The application of water-quality standards to UK bathing waters. Journal of the Institute of Water and Environmental Management 4: 436–41. Analyses data for 425 sampling locations. Ranks EEC, US EPA and Canadian standards for stringency. Equates faecal coliforms to E. coli.
Kay D, Fleisher JM, Jones F, Salmon RL, Wyer MD, Godfree AF, Zelenauch-Jacquotte Z, Shore R. 1994. Predicting the likelihood of gastro-enteritis from sea bathing: results from randomised exposure. Lancet 344: 905–9. Reports controlled-cohort trials at four UK beaches with 1216 adults, including 548 who entered the water, immersing the head three times. Adverse (gastrointestinal) health effects were identified when faecal streptococci (at chest depth) exceeded 32 per 100 mL (being the median of the highest faecal streptococci band which failed to attain statistical significance). Equation used is Logn odd (of gastroenteritis) = √(FS-32) – 2.3561. Medical follow-up was included. Some 65.7% of gastrointestinal cases had onset dates 7–21 days after exposure. Non-bather gastrointestinal illness rate was 9.7%.
Kay D, Fleisher J, Wyer MD, Salmon RL. 2001. Re-analysis of the seabathing data from the UK randomised trials. A report to DETR, Aberystwyth, University of Wales, Centre for Research into Environment and Health.
REFERENCES AND FURTHER READING. June 2003
J18
Koenraad PMF, Rombouts FM, Notermans SHW. 1997. Epidemiological aspects of thermophilic Campylobacter in water-related environments: a review. Water Environment Research 69(1): 52–63. Risk analysis indicates that the contribution of contaminated recreational water to human infections may be greater than previously assumed. “The contribution of viable but non-culturable Campylobacter cells in the contamination cycle has been found to be negligible.”
Kueh CS, Tam T-Y, Lee T, Wong SL, Lloyd OL, Yu ITS, Wong TW, Tam JS, Bassett DCJ. 1995. Epidemiological study of swimming-associated illnesses relating to bathing-beach water quality. Water Science and Technology 31(5–6): 1–4. Reports results from a 1992 study at two beaches with 18,122 swimmers, following on from that in 1987 (Cheung et al 1990). Only swimmer’s gastrointestinal symptoms were found to be associated with pollution level, not with faecal coliforms or E. coli, but with Clostridium perfringens, Aeromonas spp. and Vibrio cholerae (non-O1). The study did not measure faecal streptococci or enterococci.
Lacey RF, Pike EB. 1989. Water recreation and risk. Journal of the Institution of Water and Environmental Management 3: 13–18. Discusses the role of society in regulating voluntary risks, difficulties of measuring risks via epidemiological studies, questionable predictive power of bacterial indicators, and identifying a satisfactory rationale for standards for recreational waters. Concludes that there is no completely satisfactory way of providing guidance on recreational risk.
Lacey RF, Gunby A, Hay SV. 1995. Methods of Assessing Compliance with Standards for the Quality of Bathing Waters. Final report to the Department of the Environment. Report No. DoE 3837/1, Water Research Centre, Medmenham, Marlow, Bucks, England. Addresses statistical issues in deciding whether bathing sites conform to the imperative (I) values in EU Directive (which are based on 95% of samples).
Lee JV, Dawson SR, Ward S, Surman SB, Neal KR. 1997. Bacteriophages are a better indicator of illness rates than bacteria amongst users of a white water course fed by a lowland river. Water Science and Technology 35(11–12): 165–70. Reports results from 473 questionnaires from canoeists and rafters. Logistic regression identified F-specific RNA bacteriophages as the best microbiological parameter associated with the risk of gastrointestinal illness. No pattern was found with other illnesses (including respiratory). Regular users of the course had lower risks of illness. The level of contamination was very high (median enterococci = 102 per 100 mL).
Leeming R, Ball A, Ashbolt N, Nichols P. 1996. Using faecal sterols from humans and animals to distinguish faecal pollution in receiving waters. Water Research 30(12): 2893–900. Analysed up to seven replicates for faecal samples: hen, seagull, duck, magpie, Rosella, swan, pig, human. Species chosen from those common to both urban and rural catchments. Cats and pigs were the only animals with similar faecal sterol profiles to humans. Sterol fingerprints are sufficiently distinctive to be of diagnostic value in determining the origin of faecal pollution.
Le Guyader F, Miossec L, Haugarreau L, Dubois E, Kopecka H, Pommepuy M. 1998. RT-PCR evaluation of viral contamination in five shellfish beds over a 12-month period. Water Science and Technology 38(12): 45–50. Five shellfish beds were surveyed for 12 months. Of the 104 samples, 66% contained at least one virus. The two sites regularly contaminated by faecal coliforms had the highest percentage of viruses, but HAV was detected at only one site. Sampling sites meeting the criteria for commercialisation showed occasional viral contamination and viruses were detected in sites with no faecal coliform contamination.
Lewis GD, Loutit MW, Austin FJ. 1985. Human enteroviruses in marine sediments near a sewage outfall on the Otago coast. New Zealand Journal of Marine and Freshwater Research 19: 187–92. Sediment and beach sand samples were collected from around a sewer outfall and tested for presence of enteroviruses and faecal coliforms. Enteroviruses were recovered from five of 14 samples collected on three occasions and were recovered from two samples in which faecal coliforms were low.
REFERENCES AND FURTHER READING. June 2003
J19
Lewis GD, Austin FJ, Loutit MW, Sharples K. 1986. Enterovirus removal from sewage: the effectiveness of four different treatment plants. Water Research 20: 1291–7. Human enterovirus removal from four sewage plants (oxidation pond, two trickling filters, sedimentation/chlorination) showed insignificant removal through the plants and poor correlation with faecal coliforms, suspended solids, pH or conductivity. More viruses were present in summer. Maximum concentration was 2570 pfu per L.
Lewis GD, Loutit MW, Austin FJ. 1986. Enteroviruses in mussels and marine sediments and deputation of naturally accumulated viruses by green-lipped mussels (Perna canaliculus). New Zealand Journal of Marine and Freshwater Research 20: 431–7. A 16-month survey assessing the distribution of human enteroviruses in sediments and mussels near two sewage outfalls on the North Taranaki coast. Enteroviruses were present in high numbers near the New Plymouth outfall (maximum 32,000 pfu (100 g)–1 of wet mussel tissue and 59 pfu (100 g)–1of wet sediment material). Viruses were recovered occasionally from sediments and mussels near the Waitara Borough outfall. Attempts to depurate the New Plymouth mussels over eight days were unsuccessful.
Lewis GD. 1995. F-specific bacteriophage as an indicator of human viruses in natural waters and sewage effluents in northern New Zealand. Water Science and Technology 31(5–6): 231–4. While F-phage matched pathogen behaviour in several respects, its low abundance in marine waters, uncertainty as to source and detection irregularities pose problems for its use as an indicator.
Lightfoot NE. 1989. A prospective study of swimming related illness at six freshwater beaches in Southern Ontario. Unpublished PhD thesis, University of Toronto. A Cabelli-type study, but “highly credible” gastrointestinal illness was not included in the analysis (the author disagreed with the inclusion of fever in its definition). It was concluded that there was “no evidence to suggest that bacterial count contributed to the prediction of illness in swimmers” (abstract) and that “only tenuous correlations exist, at best” (p. 141). A logistic regression model was fitted to the data, finding that interviewer and contact person were significant confounders.
Liston J. 1994. Association of Vibrionaceae, natural toxins and parasites with fecal indicators. In: CR Hackney and MD Pearson (eds) Environmental Indicators and Shellfish Safety. Chapman & Hall, New York. Notes strong evidence for vibrios being indigenous to estuaries. No useful correlation between vibrios or Plesiomonas and faecal indicators has been found for shellfish. Natural toxins are, and should be, completely independent of testing for faecal contamination. Association between parasites (Giardia and Cryptosporidium) is “moot until there is substantial evidence of actual parasite infection by one of these organisms or any other (e.g. Entamoeba histolytica) parasite where the vehicle is molluscan shellfish”.
Loutit M. 1985. The fate of certain bacteria and heavy metals in sewage discharged through an ocean outfall. Proceedings of the Australasian Conference on Coastal and Ocean Engineering, Vol. 1, Christchurch, December, pp. 211–19. Sponsored by Institution of Engineers, Australia, Institution of Professional Engineers, New Zealand, National Water and Soil Conservation Organisation. Bacteria could be detected in sediments up to 8 km from Dunedin’s Lawyer’s Head outfall. On occasion E. coli could be detected in the sediments but not in the water.
Mariño FJ, Moiñigo MA, Martinez-Manzanares E, Borrego JJ. 1995a. Microbiological epidemiological study of selected marine beaches in Malaga (Spain). Water Science and Technology 31(5–6): 5–9. Reports a three-year study at two beaches. Skin infections were found to be associated with levels of Pseudomonas aeruginosa, Candida albicans and Aeromonas hydrophilia. The study had very small numbers of non-exposed individuals, making the attainment of statistical significance difficult.
Mariño FJ, Moiñigo MA, Martinez-Manzanares E, Borrego JJ. 1995b. Application of the recreational water quality standard guidelines. Water Science and Technology 31(5–6): 27–31. Examines applicability of WHO/UNEP and EC bathing water directive using data from their epidemiological study. Concludes the best indicators are faecal coliforms, E. coli and coliphages (at low pollution level) and faecal streptococci and coliphages (at high pollution level).
REFERENCES AND FURTHER READING. June 2003
J20
McBride GB. 1990. Background Notes for the Development of Guidelines for Microbiological Receiving Water Standards for New Zealand. Water Quality Centre Publication No. 18. DSIR, Hamilton. Report available from the librarian, NIWA, Hamilton. Documents historical development of microbiological standards for New Zealand, and issues to be addressed in the forthcoming Resource Management Act’s implementation.
McBride GB. 1993. Discussion of ‘Health effects of swimmers and nonpoint sources of contaminated water’, by Calderon et al. International Journal of Environmental Health Research 3: 115–16. Disagrees with the claim by Calderon et al (1991) that there was “no association” between swimmers’ health risk and the concentration of animal faecal material. Notes that reported rates appear to be in fact rather high.
McBride GB, Bandaranayake DR, Salmond CE, Turner SJ, Lewis GD, Till D, Hatton C, Cooper AB. 1993. Faecal indicator density and illness risk to swimmers in coastal waters: a preliminary study for New Zealand. Proceedings of the Annual Conference of the New Zealand Water and Wastes Association, Havelock North, 1–3 September 1993. Reports results of preliminary trials (1992/93) carried out at Auckland beaches only. Enterococci emerged as a statistically significant indicator for HCGI (highly credible gastrointestinal illness). Sample size was too small to reach firm conclusions about how this might have related to pollution levels. Minor corrections (hand-annotated on the original) have been made in the version of this paper appearing in Bandaranayake et al 1993.
McBride GB, Loftis JC, Adkins NC. 1993. What do significance tests really tell us about the environment? Environmental Management 17(4): 423–32. Errata in 18: 317. Notes that an individual p-value may not be instructive about patterns and associations in the environment, particularly because one seldom has confidence that a null hypothesis could in fact be true.
McBride GB, Salmond CE, Bandaranayake DR, Turner SJ, Lewis GD, Till DG. 1998. Health effects of marine bathing in New Zealand. International Journal of Environmental Health Research 8: 173–89. Reports New Zealand national prospective study performed at seven beaches in the 1995 summer using 1577 beach-users who entered the water, and 2307 who did not. On each of the 107 interview days multiple samples of the beach water were examined for three faecal indicators (faecal coliforms, E. coli, enterococci). Log-linear modelling showed that enterococci was most strongly and consistently associated with illness risk for the exposed groups, particularly for respiratory illness among paddlers and long-duration swimmers. Crude risk differences for these two groups were 7 and 33 per 1000 individuals, rising to 62 and 87 per 1000 individuals for the highest enterococci quartile. No substantial differences in illness risks were found between the human and animal waste impacted beaches, though both were markedly different from the control beaches.
McBride GB, Thorn C, Salmond C. 1996. Feasibility of Bathing-health Effects Study for New Zealand Freshwaters. Ministry for the Environment Report No. 202. Examines patterns of freshwater recreation at lower North Island sites. Concluded that an epidemiological study was feasible only if of the controlled type.
McBride GB, Till DG, Salmond CE. 1998. National study of health effects of marine bathing and implications for new guidelines. Proceedings of the 40th Annual Conference and Expo of the New Zealand Water & Wastes Association, Museum of New Zealand, Wellington, 23–25 September, 251–5. Implications of the national study (McBride, Salmond et al 1998) for the review of microbiological water quality guidelines are discussed, particularly in terms of the ‘single-sample maxima’ and sampling depth.
REFERENCES AND FURTHER READING. June 2003
J21
McBride G, Till D, Ryan T, Ball A, Lewis G, Palmer S, Weinstein P. 2002. Freshwater Microbiological Research Programme: Pathogen Occurrence and Human Health Risk Assessment Analysis. Ministry for the Environment. A study of New Zealand freshwater recreational sites. The main outcomes were that: (i) Campylobacter and human adenoviruses are the pathogens most likely to cause human waterborne illness; (ii) an estimated 4% of notified campylobacteriosis in New Zealand could be attributable to water contact recreation; (iii) E. coli as an indicator of increased Campylobacter infection is in the range of 200–500 E. coli per 100 mL; (iv) other pathogens examined could not be related to E. coli concentrations in fresh waters; (v) pathogens are more likely to be present and in greater numbers in turbid waters. The report can be downloaded from www.mfe.govt.nz.
Medema GJ, Asperen IA van, Havelaar AH. 1997. Assessment of the exposure of swimmers to microbiological contaminants in fresh waters. Water Science and Technology 35(11–12): 157–63. Reports on a follow-up study using 1,313 participants in seven triathlons in 1993/94. All sites were influenced by sewage effluents and most by agricultural run-off. The risk of gastrointestinal infection correlated well with concentration of thermotolerant coliforms and E. coli, but not with other variables (faecal enterococci, Staphylococcus aureus, F-specific RNA phages, enteroviruses , thermophilic Campylobacter, Salmonella, Aeromonas, Pleisiomonas shigelloides, Pseudomonas aeruginosa). Note that the abstract says more than the paper on epidemiological parts, but an accompanying poster paper reported illness results from 827 of the triathletes, with 773 non-swimming controls (in a run-bike-run event). Thresholds of 220 cfp per 100 mL (thermotolerant coliforms) and 355 cfp per 100 mL (E. coli) were reported.
Medema GJ, Asperen IA van, Klokman-Houweling JM, Nooitgedagt A, de Laar MJW van, Havelaar AH. 1995. The relationship between health effects in triathletes and microbiological quality of freshwater. Water Science and Technology 31(5–6): 19–26. Reports on a follow-up pilot study of 314 triathletes and 81 run-bike-run controls. The triathletes showed elevated illness rates, indicating that a full study is feasible. Geometric mean E. coli and enterococci were 170 and 13 per 100 mL, respectively.
Medema GJ, Teunis PFM, Havelaar AH, Haas CN. 1996. Assessment of dose-response relationship of Campylobacter jejuni. International Journal of Food Microbiology 30: 101–11. Reports the best-fit beta-Poisson dose response model for a common strain of Campylobacter jejuni (Penner serotype 27).
Melnick JL. 1990. Enteroviruses: polioviruses, coxsackieviruses, echoviruses, and newer enteroviruses. In: BN Fields et al (eds) Virology, 2nd ed. Raven Press, New York, 549–606. Good review of virology.
Miles MA. 1973. An investigation into the possible relationship between bathing and ear complaints in Taupo. New Zealand Sanitarian 28(2): 75. Propose that further examination be made into ear complaints among swimmers at Taupo.
Ministry for the Environment. 1992. ME91. Water Quality Guidelines No. 1. Ministry for the Environment, Wellington. Guidelines for the control of undesirable biological growths in water.
Ministry for the Environment. 1994. ME142. Water Quality Guidelines No. 2. Ministry for the Environment, Wellington. Guidelines for management of water colour and clarity.
Ministry for the Environment. 1996. Feasibility of Bathing-health Effects Study for New Zealand Freshwaters. Prepared by GB McBride, C Thorn and C Salmond. Ministry for the Environment, Wellington. Considers possibilities for freshwater epidemiological study of swimmers’ health risk, and concludes that only a controlled-cohort design is likely to be fruitful. Includes a survey of the degree of recreational use of freshwaters at sites in Hawke’s Bay, Wairarapa and Manawatu. Implies that hundreds of thousands of New Zealanders swim at freshwater sites annually, but in a very dispersed manner (there are seldom more than 100 people at a ‘site’).
REFERENCES AND FURTHER READING. June 2003
J22
Ministry for the Environment. 1999. Environmental Education: A guide for programme providers – how to develop, implement and evaluate strategies and programmes. Ministry for the Environment, Wellington. A guide to assist with preparing and implementing effective environmental education programmes, tailored to meet the needs of individual organisations.
Ministry of Agriculture and Forestry. 1995. Shellfish Quality Assurance Circular. Ministry of Agriculture, Wellington.
Moore B. 1975. The case against microbial standards for bathing beaches. In: ALH Gameson (ed) Discharge of Sewage from Sea Outfalls. Pergamon Press, Oxford and New York, 103–9. Argues against standards, noting that a health-effects versus indicator relationship had not yet been developed, and that total or faecal coliforms are not appropriate.
Moore B. 1977. The EEC bathing water directive. Marine Pollution Bulletin 8: 269–72. Expresses dissatisfaction with the 1976 EEC Directive (EU 1976), with concern about competition for public funds. Notes the effect of the Directive is to give high priority to “epidemiological studies that will provide a quantitative dimension to the postulated health risks of bathing in sewage contaminated seawater”.
Moriñgo MA, Wheeler D, Berry C, Jones C, Muñoz MA, Cornax R, Borrego JJ. 1992. Evaluation of different bacteriophage groups as faecal indicators in contaminated natural waters in southern England. Water Research 26(3): 267–71. River and seawater affected by faecal discharges were analysed to evaluate the reliability of coliphages and F-specific RNA bacteriophages as indicators of the microbiological quality of waters. FRNA phages showed no direct relationship with levels of faecal pollution and were never detected in samples with few enteroviruses, whereas coliphages were detected. Coliphages could be considered an optimal indicator.
Morris R. 1991. The EC bathing water virological standard: is it realistic? Water Science and Technology 24(2): 49–52. Notes that only culturable enteroviruses and rotaviruses have available enumeration methods, and that sampling frequency is generally not sufficient to give effect to the requirement that 95% of samples be free of enteroviruses. Nevertheless concludes that the present imperative standard should remain.
MRC. 1959. Sewage Contamination of Bathing Beaches in England and Wales. Medical Research Council Memorandum (UK) No. 37. Interpreted the PHLS (1959) study results as: “With the exception of a few aesthetically revolting beaches around the coast of England and Wales, the risk to health of bathing in sewage-contaminated sea-water can, for all practical purposes, be ignored.”
Mujeriego R, Bravo JM, Feliu MT. 1982. Recreation in coastal waters: public health implications. Vier Journée Études Pollutions. Cannes, Centre Internationale d’Exploration Scientifique de la Mer (CIESM): 585–94. Reports on a follow-up epidemiological study of 24 beaches at Málaga and Tarragona, using 20,219 responses. Ailments found were skin infections (2%), ear and eye infections (1.5%) and intestinal infection (< 1%). According to Shuval (1986) the study does supply “some suggestive evidence as to the value of enterococci as an indicator of marine pollution”, but suffers from a lack of controls and appropriate water quality data.
New Jersey Department of Health. 1989. Ocean Health Study: A study of the relationship between illness and ocean beach water quality in New Jersey. A 1988 prospective study using 16,089 (10% under age 10) at nine coastal and two lake beaches impacted by chlorinated effluents. Swimmers consistently reported higher symptom rates than non-swimmers (excess of 12.2 cases per 1000). Water quality was very good and attempts to relate the excess illness rates with pollution levels failed.
NTAC. 1968. Water Quality Criteria. Report of the National Technical Advisory Committee to the Federal Water Pollution Control Administration. The first federal compilation of quality ‘criteria’, sometimes called the “Green Book”. It was compiled by five separate committees, which each recommended different definitions of how one would judge compliance.
REFERENCES AND FURTHER READING. June 2003
J23
Nuzzi R, Burhans R. 1997. The use of enterococcus and coliform in characterising bathing-beach waters. Environmental Health (July/August): 16–21. Reports water quality studies at New York beaches for total and faecal coliforms (still used in New York for bathing waters) and enterococci. Found that enterococcus correlated well with both sets of coliforms, but would result in more beach closures.
Philip R. 1991. Risk Assessment and Microbiological Hazards Associated with Recreational Water Sports. Reviews in Medical Microbiology 2: 208–14.
PHLS. 1959. Sewage contamination of coastal bathing waters in England and Wales: a bacteriological and epidemiological study. Journal of Hygiene (Cambridge) 57: 435–72. Reports on a retrospective study of enteric fever and poliomyelitis (both notifiable). Concludes “that bathing in sewage polluted sea water carries only a negligible risk to health, even on beaches that are aesthetically very unsatisfactory ...”. This is sometimes quoted as Moore (1959); Dr Brendan Moore was the main author.
Pike EB. 1993. Recreational use of coastal waters: development of health-related standards. Journal of the Institution of Water and Environmental Management: 163–69. Compares USA/UK/EU approaches to setting standards, noting that all are primarily directed at bathing. Statistical issues in defining central and extreme values of indicator variables are discussed, in particular the use of single sample maxima is problematical. Notes that only the USEPA criteria had been developed from epidemiological studies (up to 1993).
Pike EB. 1994. Health effects of sea bathing (WMI 9021) – Phase III. Final Report to the Department of the Environment. Report No. DoE 3412/2, Water Research Centre, Medmenham, England. Available from Water Research Centre. Summarises results from the two sets of UK studies in the early 1990s. These were on 16,569 holidaymakers at 10 beaches using an uncontrolled prospective cohort design, and on 1112 healthy adult volunteers at four beaches, using a controlled cohort design. Holidaymakers entering the sea perceived all symptoms more frequently than those who did not, the relative increases being related to degree of water contact and age, being greatest in surfers and in 15–24-year-olds. Relative increases in frequencies of eye, ear nose and throat, respiratory and skin symptoms were not strongly related to microbiological
water quality. Relative increases in diarrhoea in those entering the water were related to total coliform counts and enteroviruses. In the volunteer study, the incidence in bathers of symptoms suggesting gastroenteritis was related to counts of faecal streptococci at chest depth. No relationship was evident between self-recording of symptoms and results of clinical examinations. Overall conclusions from both types of study are in agreement with the results of earlier studies.
Prüss A. 1998. Review of epidemiological studies on health effects from exposure to recreational water. International Journal of Epidemiology 27: 1–9. Reviews 22 epidemiological studies conducted for freshwater and coastal water. Most reported a dose-related increase of health risk in swimmers with an increase in indicator bacteria count in recreational waters. Relative risks for swimmers versus non-swimmers are typically in the range 1.0 to 3.0. Enterococci and faecal streptococci were opined to be the best indicators for seawater and E. coli for freshwater. Reviews Bradford Hill’s nine criteria for causation in environmental studies, as applied to gastrointestinal symptoms. Passes seven of them: strength of association (yes), consistency (yes), specificity of association (no), temporality (yes), biological gradient (yes), plausibility (yes), coherence (yes), experiment (no), analogy (yes).
Robertson WJ. 1993. Guidelines for the protection of human health on bathing beaches. Journal of the Canadian Institute of Public Health Inspectors (Spring): 14–17. Reviews national recreational water data and proposes that E. coli and the enterococcus group are currently the best available indicators for fresh and marine waters respectively. Proposed limits similar to those of USEPA 1986a.
Robson WLM, Leung AKC. 1990. Swimming and ear infection. Journal of the Royal Society of Health 199–200. Reviews the association of ear infection with swimming. Chlorinated water or stagnant ponds may pose a risk for otitis media or otitis externa.
REFERENCES AND FURTHER READING. June 2003
J24
Rosenberg ML, Hazlet KK, Schaefer J, Wells JG, Pruneda RC. 1976. Shigellosis from swimming. Journal of the American Medical Association 236(16): 1849–52. In August 1974, 31 of 45 cases of Shigella sonnei infection in Dubuque (Iowa) were traced to swimming in the Mississippi River (in an eight-mile stretch). Significant associations between illness and swimming were also reported by a retrospective survey of 60 families who had camped at a park beside the river. The attack rate for swimmers was 18%. Mean faecal coliform content was 17,500 per 100 mL.
Salas HJ. 1986. History and application of microbiological water quality standards in the marine environment. Water Science & Technology 18: 47–57. Reviews many countries standards up to the mid-1980s. Proposes that standards are best expressed as an average concentration, and a ‘maximum value’ that is not to be exceeded for more than a high percentage of the time (e.g. 90%).
Seyfried PL, Tobin RS, Brown NE, Ness PF. 1985a. A prospective study of swimming-related illness. I. Swimming-associated health risk. American Journal of Public Health 75(9): 1068–70. Reports on a 1980 prospective study on 10 Ontario river and lake beaches (see EHD 1980), using 4537 interviews. Crude morbidity rates were 69.6 per 1000 swimmers and 29.5 per 1000 non-swimmers. Swimmers experienced respiratory ailments most frequently, followed by gastrointestinal, eye, ear, skin and allergenic symptoms.
Seyfried PL, Tobin RS, Brown NE, Ness PF. 1985b. A prospective study of swimming-related illness. II. Morbidity and the microbiological quality of water. American Journal of Public Health 75(9): 1071–6. Reports results for faecal coliforms, faecal streptococci, heterotrophic bacteria, Pseudomonas aeruginosa, and total staphylococci. Logistic modelling showed morbidity among swimmers to be related to staphylococcal counts, faecal coliforms and, less strongly, to faecal streptococci.
Shuval HI. 1986. Thalassogenic diseases. UNEP Regional Seas Reports and Studies No. 79, UNEP. (Greek: thalass = sea, genesis = source.) Comprehensive review of many studies. Concludes that after years of debate there is now firm evidence that bathing in sewage-polluted waters causes an excess of gastrointestinal disease, the rates of which correlate generally with enterococci or E. coli concentrations.
Simmonds RS, Loutit MW, Austin FJ. 1983. Enteric viruses in New Zealand wastewaters. New Zealand Journal of Science 26: 437–41. Forty-seven samples from three treatment plants were tested for human enteroviruses. Nine different viruses were detected in 36 samples ranging up to 4000 pfu/L. Chlorine reduced numbers, but they were still detectable in 11 of 16 chlorinated samples.
Sinton LW, Davies-Colley RJ, Bell RG. 1994. Inactivation of enterococci and fecal coliforms from sewage and meatworks effluents in seawater chambers. Applied and Environmental Microbiology 60: 2040–8. Inactivation of faecal coliforms (FC) and enterococci (Ent) from sewage and meatworks effluents was measured in experiments (meatworks FC > sewage FC > meatworks Ent > sewage Ent). Decay coefficient (1st-order) for FC was two to four times that for Ent, and was slower at lower temperatures. Factors other than insolation were implicated (by between-experiment variations). Most inactivation appeared to be in the 318–340 nm and > 400 nm ranges.
Sinton LW, Donnison AM, Hastie CM. 1993a. Faecal streptococci as faecal pollution indicators: a review. Part I: Taxonomy and enumeration. New Zealand Journal of Marine and Freshwater Research 27: 101–15. Notes that there is no universally accepted method for isolating faecal streptococci.
REFERENCES AND FURTHER READING. June 2003
J25
Sinton LW, Donnison AM, Hastie CM. 1993b. Faecal streptococci as faecal pollution indicators: a review. Part II: Sanitary significance, survival, and use. New Zealand Journal of Marine and Freshwater Research 27: 117–37. Faecal streptococci (or the subset enterococci) are more resistant to sunlight-induced inactivation than faecal coliforms. Notes adoption of USEPA criteria, using enterococci for marine and freshwaters (and E. coli for freshwaters) should be adopted with caution in New Zealand. Also notes the general failure of the faecal streptococci:faecal coliform ratio as a measure of human:animal contributions to a faecal load.
Sinton LW, Finlay RK, Hannah DJ. 1998. Distinguishing human from animal faecal contamination: a review. New Zealand Journal of Marine and Freshwater Research 32: 323–48. Notes that reliable evidence is lacking on the relative health risks posed by exposure to either human or animal faeces. Notes that New Zealand’s high grazing animal:human ratio makes “it seem prudent to assume that human and animal faecal pollution both constitute a risk to human health”. Reviews methods for distinguishing animal and human faecal residues, noting that DNA-based techniques (e.g. PCR) may assist.
Sinton LW, Finlay RK, Lynch PA. 1999. Sunlight inactivation of fecal bacteriophages and bacteria in sewage-polluted seawater. Applied and Environmental Microbiology. Sunlight inactivation in seawater water of faecal indicators from sewage was measured in outdoor experiments over a two-year period. The ranking (from the greatest to least inactivation) was faecal coliforms > F-RNA phages > somatic coliphages. These results suggest that, in seawater, somatic coliphages are likely to be the best enteric virus indicators. This inactivation ranking was also evident in a two-day experiment, which included enterococci. Although enterococci were initially more sunlight resistant than faecal coliforms, the two indicators fell to counts of < 1/100 mL at around the same time on day two.
Sinton LW, Hall CH, Lynch PA, Davies-Colley RJ. 2002. Sunlight inactivation of fecal indicator bacteria and bacteriophages from waste stabilization pond effluent in fresh and saline water. Applied and Environmental Microbiology 68: 3. An important paper on the topic of receiving waters affected by pond discharges. Experiments demonstrate that enterococci survive longer than faecal coliforms in freshwater / raw sewage mixtures, but the opposite pattern was observed for pond effluents. Enterococci appear to suffer photo-oxidative damage in ponds, rendering them susceptible to further such damage after discharge, suggesting that they are unsuitable as indicators of pond effluents to natural waters.
Sorvillo FJ, Fujioka F, Nahlen B, Tormey P, Kebebjian RS, Mascola L. 1992. Swimming-associated Cryptosporidiosis. American Journal of Public Health 82(5): 742–44. An example of a swimming-pool outbreak of this disease.
Stehr-Green JK, Nicholls C, McEwan S, Payne A, Mitchell P. 1991. Waterborne outbreak of Campylobacter jejuni in Christchurch: the importance of a combined epidemiologic and microbiologic investigation. New Zealand Medical Journal 104: 356–8. Two cases at a camp and convention centre near Christchurch had water supply strongly suggested as the source of infection.
Stevenson AH. 1953. Studies of bathing water quality and health. American Journal of Public Health 43: 529–38. Reports findings from US Public Health Service studies in 1948–50 at freshwater sites on lake Michigan at Chicago, the Ohio River at Dayton Ohio (and Tacoma Park pool at Dayton), and New York tidal waters (New Rochelle and Mamaroneck). Used prospective study with 22,164 persons. ‘Swimming’ didn’t require head immersion. Found illness in swimmers was appreciably higher than in non-swimmers. Also found two statistically significant results for illness related to degree of pollution (assessed using total coliforms), between low and high contamination days at one of the Chicago beaches and between the Ohio swimmers.
REFERENCES AND FURTHER READING. June 2003
J26
Streeter HW. 1951. Bacterial Quality Objectives for the Ohio River: A guide for the evaluation of sanitary conditions of waters used for potable supplies and recreational uses. Ohio River Valley Water Sanitation Commission, Cincinnati, OH. Presents calculations on the risk of contracting typhoid fever for someone who bathes every day for 90 days in water containing 1000 total coliforms per 100 mL. This gave a risk of 1:950, or 1:50 for “diarrhea-enteritis”. This result was used in early standards (Waters Pollution Regulations 1963).
Telford SR. 1996. Annotation: marine waters and non-enteric illness: matching the degree of analytical rigour to the biology of the infection process. American Journal of Public Health 86(9): 1203–04. A comment on the article by Fleisher and others appearing in the same issue. Notes that their paper represents a “vast methodological improvement over previous studies”, particularly that of Stevenson (1953). Notes that causation studies are now desirable.
Teunis PFM, Havelaar AH. 2000. The beta Poisson dose-response model is not a single-hit model. Risk Analysis 20(4): 513–20. Cogent account of the validity of a standard dose response model at low doses, and methods for accounting for uncertainty in that model (via Bayesian posterior intervals).
Teunis PFM, Nagelkerke NJD, Haas CN 1999. Dose response models for infectious gastroenteritis. Risk Analysis 19(6): 1251–60. Identifies some difficulties in modelling the probability of illness given infection for a range of doses – much less straightforward than modelling infection given dose.
Teunis PFM, van der Heijden OG, van der Giessen JWB, Havelaar AH. 1996. The Dose-response Relation in Human Volunteers for Gastro-intestinal Pathogens. RIVM Report No. 284 550 002. Antonie van Leeuwenhoeklaan 9, PO Box 1, NL-3720 BA Bilthoven, The Netherlands. In-depth review of the available data on clinical trials for a range of gastro-intestinal pathogens. Identifies the most satisfactory models (exponential or beta-Poisson) for each case.
Turner SJ, Lewis GD. 1995. Comparison of F-specific bacteriophage, enterococci, and faecal coliform densities through a wastewater treatment plant employing oxidation ponds. Water Science and Technology 31(5–6): 85–9. A 12-month study suggests that enterococci may be the best indicator for oxidation pond systems. Did not include E. coli.
Turner SJ, Lewis GD, Bellamy AR. 1997. Detection of sewage-derived Escherichia coli in a rural stream using multiplex PCR and automated DNA detection. Water Science and Technology 35(11–12): 85–9. A DNA marker shows promise in identifying E. coli isolates of human origin. Field trials upstream and downstream of sewage ponds appear to confirm this.
Tyler KL, Fields BN. 1990. Pathogenesis of viral infections. In: BN Fields et al (eds) Virology, 2nd ed. Raven Press, New York, 191–240. Includes discussion of inhalation of aerosols as a means of acquiring infectious viral disease.
Tyrrell SA, Rippey SR, Watkins WD. 1995. Inactivation of bacterial and viral indicators in secondary sewage effluents, using chlorine and ozone. Water Science and Technology 29(11): 2483–90. Chlorine reduced faecal coliforms and enterococci > 100-fold, but for bacteriophages < 10-fold. In contrast, ozonation gave > 100-fold reduction of the phages, but not so much for vegetative bacteria. Concludes faecal coliforms are inadequate for predicting viral response to chlorine or ozone.
USEPA. 1985. Test Methods for Escherichia coli and Enterococci in Water by the Membrane Filtration Procedure. Report EPA 600/4-85-076. United States Environmental Protection Agency, Cincinnati, OH. Details the test methods to be used at that time when applying the EPA guidelines to recreational waters.
USEPA. 1986a. Ambient Water Quality for Bacteria 1986. Report EPA 440/5-84-002. USEPA Office of Water Regulations and Standards, Washington, DC 20460. Gives explanatory material about the derivation of the criteria, using the results of Cabelli (1983a) and Dufour (1984).
REFERENCES AND FURTHER READING. June 2003
J27
USEPA. 1986b. Quality Criteria for Water 1986: Bacteria. Report EPA 440/5-86-001. USEPA Office of Water Regulations and Standards, Washington, DC 20460. Promulgates “criteria” (i.e. recommended state standards) based on the work of Cabelli (1983a) and Dufour (1984).
USEPA. Standard Methods for the Examination of Water and Waste Water. 20th ed, American Public Health Association.
Von Schirnding YER, Kfir R, Cabelli VJ, Franklin L, Joubert G. 1992. Morbidity among bathers exposed to polluted seawater. South African Medical Journal 81(6): 543–6. Reports on the first phase of a 1990/91 prospective follow-up study at two beaches in Cape Town, using 733 people. Found an excess of gastrointestinal, respiratory and skin symptoms among swimmers, relative to non-swimmers. Results were suggestive of a relationship between swimmers’ illness and water quality.
Von Schirnding YER, Strauss N, Robertson P, Kfir R, Fattal B, Mathee A, Franck M, Cabelli VJ. 1993. Bather morbidity from recreational exposure to sea water. Water Science and Technology 27(3–4): 183–6. Reports on the full study carried out at two Cape Town beaches in the early 1990s, using 5551 people. Symptom rates for gastrointestinal, respiratory and skin effects were substantially higher at the polluted beach, although they did not reach statistical significance. Does not use the more advanced statistical methods.
Ward RC, Loftis JC, McBride GB. 1990. Design of Water Quality Monitoring Systems. Van Nostrand Reinhold, New York. Documents important features of design. Includes case studies.
Ware JH. 1990. The role of epidemiology in the assessment of societal risk: a statistician’s perspective. Chance: New Directions for Statistics and Computing: 41–7. Tracks the development of new statistical methods for design and analysis of chronic diseases. Argues that, in spite of inherent uncertainties, epidemiology plays an essential role in risk assessment.
Wheeler D, Alexander LM. 1992. Assessing the health risks of sea bathing. Journal of the Institution of Water and Environmental Management 6: 459–67 (with discussion). Reviews the UK-controlled cohort and uncontrolled cohort studies. Questions the effect of necessary pre-publicity of possible self-reporting of health effects in healthy-adult controlled-cohort trials. Concludes that using “captive volunteer” populations of healthy adults has technical merit, but that “there is no epidemiologically defensible way of linking the output of such methods to the results of more conventional techniques for assessing risks in marine waters”. Notes that the Langland Bay pilot controlled cohort study volunteers’ rate of self-reporting of symptoms was very high and correlated poorly with clinical examinations.
WHO. 1986. Correlation between Coastal Water Quality and Health Effects. Report ICP/CEH OO1 m06. World Health Organization, Copenhagen. Reviews known information, and proposes protocol for carrying out prospective epidemiological studies (with input from Prof. Cabelli, and Drs Fattal and Geldreich). Updated in (uncited) documents ICP/CEH 083/10 (1989) and EUR/ICP/CEH/103(S) (1991).
WHO. 1998. Guidelines for Safe Recreational-water Environments: Coastal and fresh-waters. Draft. Report EOS/DRAFT/98.14. World Health Organization, Geneva. Proposes 95 percentile guideline values for faecal streptococci (per 100 mL): 10 – NOAEL (No Observed Adverse Effect Level); 50 – LOAEL (Lowest Observed Adverse Effect Level); 200 – value is above threshold and LOAEL in most studies; 1000 – derived from limited evidence concerning typhoid fever.
WHO. 1999. Health-Based Monitoring of Recreational Waters: The feasibility of a new approach (The ‘Annapolis Protocol’). World Health Organization, Geneva.
WHO. 2001. Bathing Water Quality and Human Health: Protection of the human environment water, sanitation and health. Report WHO/SDE/WSH/01.2. World Health Organization, Geneva. Details of the application of the Annapolis Approach. Percentile values of enterococci for risk based on exposure conditions.
REFERENCES AND FURTHER READING. June 2003
J28
WHO. 2003. Guidelines for Safe Recreational Water Environments: Volume 1 Coastal and Freshwaters. World Health Organization, Geneva. Provides a review and assessment of the health hazards encountered during recreational use of coastal and freshwater environments. A wide range of hazards are addressed, including water quality.
Wilkinson J, Jenkins A, Wyer M, Kay D. 1995. Modelling faecal coliform dynamics in streams and rivers. Water Research 29(3): 847–55. Field experiments and modelling have been used to account for sediment entrainment and release of bacteria, as governed by stream flow.
Wittman RJ, Flick GJ. 1995. Microbial contamination of shellfish: prevalence, risk to human health, and control strategies. Annual Review of Public Health 16: 123–40. In the US the largest number of disease cases are of unknown aetiology. The greatest percentage of known death (95%) is caused by non-cholera vibrio. People with underlying health conditions are the group most at risk.
Wyer MD, Fleisher JM, Gough J, Kay D, Merrett H. 1995. An investigation into parametric relationships between enterovirus and faecal indicator organisms in the coastal waters of England and Wales. Water Research 29(8): 1863–8. Examined a large combined dataset. The amount of variance in enterovirus concentration explained by bacterial concentrations was only 15–16%.
Wyer MD, Kay D, Fleisher JM, Salmon RL, Jones F, Godfree AF, Jackson G, Rogers A. 1999. An experimental health-related classification for marine waters. Water Research 33(3): 715–22. Proposes a health-related bathing water standard system (based on gastrointestinal illness avoidance) using faecal streptococci in units per 100 mL. Water quality is: ‘good’ if more than 50% of the FS distribution above 32 is below 73; ‘moderate’ if more than 50% of the FS distribution above 32 is above 73; ‘poor’ if more than 50% of the FS distribution above 32 is above 137; ‘very poor’ if more than 75% of the FS distribution above 32 is above 137.
REFERENCES AND FURTHER READING. June 2003
J29
About the Ministry for the Environment
The Ministry for the Environment works with others to identify New Zealand’s environmental problems and get action on solutions. Our focus is on the effects people’s everyday activities have on the environment, so our work programmes cover both the natural world and the places where people live and work.
We advise the Government on New Zealand’s environmental laws, policies, standards and guidelines, monitor how they are working in practice, and take any action needed to improve them. Through reporting on the state of our environment, we help raise community awareness and provide the information needed by decision makers. We also play our part in international action on global environmental issues.
On behalf of the Minister for the Environment, who has duties under various laws, we report on local government performance on environmental matters and on the work of the Environmental Risk Management Authority and the Energy Efficiency and Conservation Authority.
Besides the Environment Act 1986 under which it was set up, the Ministry is responsible for administering the Soil Conservation and Rivers Control Act 1941, the Resource Management Act 1991, the Ozone Layer Protection Act 1996, and the Hazardous Substances and New Organisms Act 1996.
Head Office
Grand Annexe Building 84 Boulcott Street PO Box 10-362 Wellington, New Zealand Phone (04) 917 7400, fax (04) 917 7523 Internet www.mfe.govt.nz
Northern Regions Office
8–10 Whitaker Place PO Box 8270 Auckland Phone (09) 913 1640, fax (09) 913 1649
South Island Office
Level 4 Price Waterhouse Centre 119 Armagh Street PO Box 1345 Christchurch Phone (03) 963 0940, fax (03) 963 2050
ABOUT THE MINISTRY FOR THE ENVIRONMENT. June 2003
J30
Registration Form
The Ministry for the Environment may from time to time undertake updates of these guidelines. If you would like to receive any updated sections or updated software, please complete this form and return it to:
Implementation Team Ministry for the Environment PO Box 10-362 Wellington Attn: Business Administrator
Ph: (04) 917 7400 Fax: (04) 914 7523
Company name:____________________________________________________________________________
Position (of person to receive updates): _________________________________________________________
Postal address: _____________________________________________________________________________ _________________________________________________________________________________________
Phone: ___________________________________________________________________________________
Fax: _____________________________________________________________________________________
Email: ___________________________________________________________________________________
REGISTRATION FORM. June 2003 J31