Embed Size (px)
Citation preview

Microbial Risk Assessment
Global Water Sanitation and Health
Mark D. Sobsey and Lisa Casanova
Spring, 2007

WHO Health-Risk Based Framework: Application to WHS
These principles apply to all types of WSH activities

WHO Health-Risk Based Framework: Application to WHS
• A risk-based framework
• Source-to-consumer management approach to protection from exposure to environmental agents
• Establishes health based-targets for control (specific microbes and chemicals)
• Sets acceptable level of risk appropriate to setting and population
• Helps establish and carry out Management Plans (Safety Plans) to achieve control
• Includes independent surveillance
• Is an integrated, proactive approach
• Consistent across, compatible with and applicable to all WSH measures

Quantitative Microbial Risk Assessment: The Definition
Applications of the principles of risk assessment to the estimation of the consequences from anticipated or actual exposure to infectious microorganisms

Exposure, Level of Protection and Microbial Risk: The Relationship
Risk
Exposure Level of Protection (e.g., technologic control)
= Confidence Region or Interval

Important Differences Between Microbial & Chemical Risks: The Microbial
• A single microbe (one unit) is infectious and can cause dramatic effects
• Microbes multiply in a host (increases adverse effects)
• Microbes multiply in environmental media (some microbes)
• Microbes are capable of secondary spread
– Can infect a host from an environmental route of exposure (water, food, etc.)
– Can then spread to other hosts by person-to-person transmission
• Some microbes cause a wide range (spectrum) of adverse effects
• Microbes can change: mutate, evolve, adapt, change gene expression, etc.

Important Differences Between Microbial & Chemical Risks: the Chemical
• Unique and specific structures that define (predict) activities
• Many molecules may be required for an effect; gradation of effects
• Do not multiply/reproduce• No secondary spread• Accumulation and compartmentalization• Metabolism and chemical reactivity• Detoxification• Threshold (no adverse effect level)• Cumulative effects• Magnitude of exposure influences magnitude of
adverse effects and their appearance/manifestation• Distinctive health effects based on chemical reactions
with specific molecules, tissues and organs

Adapted from: National Academy of Sciences - National Research Council framework by US EPA and the International Life Sciences Institute (ILSI)
Quantitative Risk Assessment for Agents from Environmental Sources: a Conceptual
Framework

Risk Management and Communication
RISK ASSESSMENT FOR ENVIRONMENTALLY TRANSMITTED PATHOGENS: ILSI/EPA PARADIGM
PROBLEM FORMULATION: HAZARD IDENTIFICATION
CHARACTERIZATIONOF EXPOSURE EFFECTS
CHARACTERIZATION OF HUMAN HEALTH EFFECTS
RISK CHARACTERIZATION

ILSI/EPA Risk Assessment Framework and Steps: Analysis Phase

QRA for Agents from Environmental Sources: Steps in the Conceptual Framework

Conducting Hazard Identification for Microbes
• Identify microbe(s) that is (are) the causative agent(s) of disease
• Develop/identify diagnostic tools to:
– identify symptoms
– identify infection
– isolate causative microbe in host specimens
– identify causative microbe in host specimens
• Understand the disease process from exposure to infection, illness (pathophysiology) and death
• Identify transmission routes
• Identify transmission scenarios

Conducting Hazard Identification for Microbes
• Assess virulence factors and other properties of the microbe responsible for disease, including life cycle
• Identify and apply diagnostic tools to determine incidence and prevalence in populations and investigate disease outbreaks
• Develop models (usually animals) to study disease process and approaches to treatment
• Evaluate role of immunity in overcoming/preventing infection and disease and possible vaccine development
• Study epidemiology of microbe associated with exposure scenarios

QRA for Agents from Environmental Sources: Steps in the Conceptual Framework

Purpose: determine the quantity or dose
Dose = number, quantity or amount of microorganisms corresponding to a single exposure (e.g., by ingestion)
Exposure Assessment
•Average or typical dose
–A measure of central tendency (mean or median)
•Distribution of doses
–microbe quantity varies in time and space
–described as a probability or frequency distribution
–a probability density function

CHARACTERIZATION OF EXPOSURE - ELEMENTS INCLUDED IN PATHOGEN CHARACTERIZATION:
OCCURRENCE
• Temporal distribution, duration and frequency
• Concentration in food or environmental media
• Spatial distribution
– clumping, aggregation, association with particles, clustering
• Niche
– ecology and non-human reservoirs: Where are they in the environment and what other host harbors them?
– potential to multiply/survive in specific media

CHARACTERIZATION OF EXPOSURE - ELEMENTS INCLUDED IN PATHOGEN CHARACTERIZATION:
OCCURRENCE
• Survival, persistence, and amplification
• Seasonality
• Meteorological and climatic events
• Presence of control or treatment processes
– reliability and variability of processes
• Indicators/surrogates for indirect evaluation
– predictive of pathogen

ELEMENTS CONSIDERED IN PATHOGEN CHARACTERIZATION
• Virulence and pathogenicity of the microorganism
• Pathologic characteristics and diseases caused
• Survival and multiplication of the microorganism
• Resistance to control or treatment processes
• Host specificity
• Infection mechanism and route; portal of entry
• Potential for secondary spread
• Taxonomy and strain variation
• Ecology and natural history

KEY: Multiple sources and high endemicity (continued presence) in humans, animals and environment
• High concentrations released into or present in environmental media (water, food, air, etc.)
• High carriage rate in human and animal hosts
• Asymptomatic carriage in non-human hosts
• Ability to proliferate in water and other media
• Ability to adapt to and persist in different media or hosts
• Seasonality and climatic effects
• Natural and anthropogenic sources
Pathogen Characteristics or Properties Favoring Environmental Transmission

Pathogen Characteristics or Properties Favoring Environmental Transmission
• Ability to persist or proliferate in environment
• Ability to survive or penetrate treatment processes
• Stable environmental forms
– spores, cysts, oocysts, stable outer viral layer (protein coat), bacterial capsule (outer polysaccharide layer), etc.
• Resistance to biodegradation, heat, cold (freezing), drying, dessication, UV light, ionizing radiation, pH extremes, etc.
• Resists proteases, amylases, lipases and nucleases
– Possesses DNA repair mechanisms and other injury repair processes
• Colonization, biofilm formation, resting stages, protective stages, parasitism
– Spatial distribution
– Aggregation, particle association, intercellular accumulation, etc.

Virulence properties: structures or chemical constituents that contribute to pathophysiology
• Outer cell membrane of Gram negative bacteria: an endotoxin (fever producer)
• Exotoxins: release toxic chemicals
• Pili: for attachment and effacement to cells and tissues
• Invasins: to facilitate cell invasion
• Effacement factors
• Spores• highly resistant to physical and chemical agents
• very persistent in the environment
• plasmids, lysogenic bacteriophages, etc.
Virulence Properties of Pathogenic Bacteria Favoring Environmental Transmission

Genetic properties favoring survival and pathogenicity
•Double-stranded DNA or RNA
•DNA repair
•Ability for genetic exchange, mutation and selection–recombination
–plasmid exchange, transposition, conjugation, etc.
–point mutation
–reassortment
–gene expression control
•Virulence properties: expression, acquisition, exchange
•Antibiotic resistance
Pathogen Characteristics or Properties Favoring Environmental Transmission
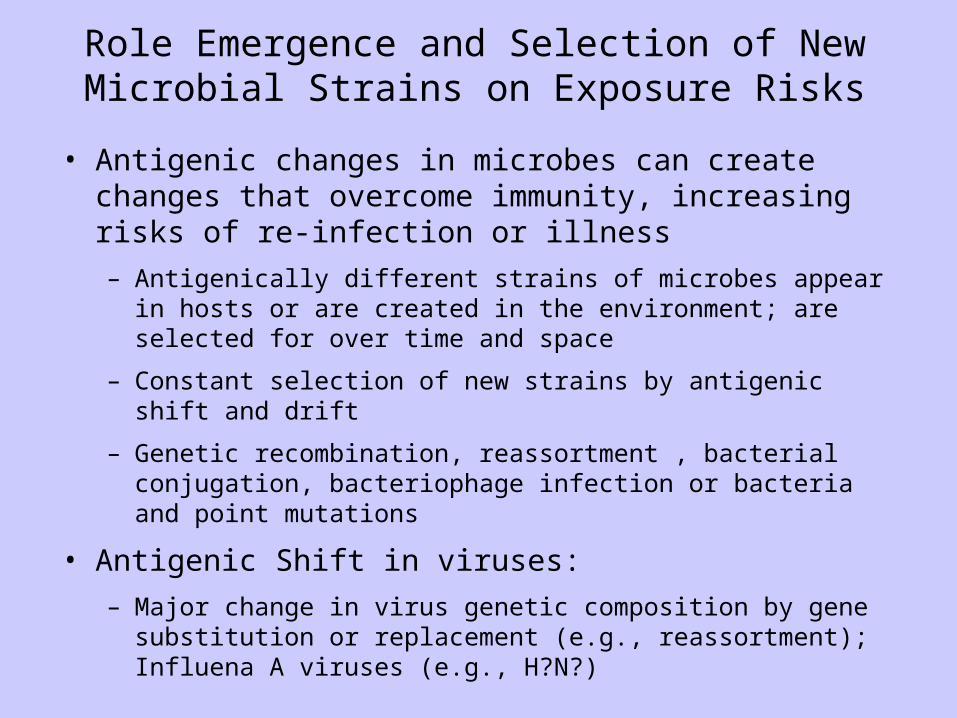
Role Emergence and Selection of New Microbial Strains on Exposure Risks
• Antigenic changes in microbes can create changes that overcome immunity, increasing risks of re-infection or illness– Antigenically different strains of microbes appear in
hosts or are created in the environment; are selected for over time and space
– Constant selection of new strains by antigenic shift and drift
– Genetic recombination, reassortment , bacterial conjugation, bacteriophage infection or bacteria and point mutations
• Antigenic Shift in viruses:– Major change in virus genetic composition by gene
substitution or replacement (e.g., reassortment); Influena A viruses (e.g., H?N?)

Role Emergence and Selection of New Microbial Strains on Exposure Risks
• Antigenic Drift:
– Minor changes in genetic composition, often by mutation involving specific codons in existing genes (point mutations)
– A single point mutation can greatly alter microbial virulence
• Microbial mimicking of host antigens; e.g. malaria
– Antigens expressed by pathogen resemble host antigens; they can change

Other Pathogen Characteristics or Properties Favoring Environmental
Transmission
• Ability to Cause Infection and Illness– Low infectious dose
– High probability of infection and illness from exposure to one or a few microbes
• Infects by multiple routes– Ingestion: gastrointestinal (GI)
– Inhalation: respiratory
– Cutaneous: skin
– eye
– Other routes

Microbe Levels in Environmental Media Vary Over Time
Occurrence of Giardia Cysts in a Water: Cumulative Frequency Distribution

CHARACTERIZATION OF EXPOSURE:ELEMENTS CONSIDERED IN EXPOSURE
ANALYSIS• Identification of water, food or other media/vehicles of
exposure
• Units of exposure (e.g number of cells)
• Routes of exposure and transmission potential
• Size of exposed population
• Demographics of exposed population
• Spatial and temporal nature of exposure
(single or multiple; intervals)
• Behavior of exposed population
• Treatment (e.g. of water), processing (e.g., of foods), and recontamination

QRA for Agents from Environmental Sources: Steps in the Conceptual Framework

CHARACTERIZATION OF HUMAN HEALTH EFFECTS:
ELEMENTS OF HOST CHARACTERIZATION
• Age
• Immune status
• Concurrent illness or infirmity
• Genetic background or status
• Pregnancy
• Nutritional status
• Demographics of the exposed population (density, movement or migration, etc.)
• Social and behavioral traits and conditions

CHARACTERIZATION OF HUMAN HEALTH EFFECTS:ELEMENTS OF HOST CHARACTERIZATION
• Infectivity• Illness• Duration of illness• Severity of illness• Morbidity, mortality, sequelae of illness• Extent or amount of secondary spread
– Initial host from an environmental exposure spreads infection and illness to others
• Quality of life• Chronicity or recurrence

Characteristics or Properties of Pathogens -Interactions with
Hosts • Disease characteristics and spectrum
– Signs, symptoms, pathophysiology
• Persistence in hosts:– Chronicity
– Persistence
– Recrudescence
– Sequelae and other post-infection health effects
– cancer, heart disease, arthritis, neurological effects
– Yes, some microbes can cause these conditions!
• Secondary spread

Elements That May be Included in Dose-Response Analysis
• Statistical model(s) to analyze or quantify dose-response relationships
– probability of infection/illness as a function of microbe dose
• Human dose-response data
• Animal dose-response data
• Utilization of outbreak or intervention data
• Route of exposure or administration

Elements That May be Included in Dose-Response Analysis
• Source and preparation of exposure material or inoculum
• Organism type and strain
– including virulence factors or other measures of pathogenicity
• Characteristics of the exposed population
– age, immune status, etc.
• Duration and multiplicity of exposure

Dose-Response Data and Probability of Infection for Human Rotavirus
Dose # Dosed # Infected 90,000 3 3 9,000 7 5 900 8 7 90 7 6 9 7 1
0.9 7 0 0.09 5 0


Dose-Response Models and Extrapolation to Low Dose
Range• Most dose-response data for microbes
are for:– high doses of the microbes– few hosts
• Practicalities and cost limits• Dosing hundreds or thousands of
volunteers is not possible• But, many people become ill during
epidemics– if we can be there, we can study them as
“natural” experiments

Dose-Response Models and Extrapolation to Low Dose
Range• Real world exposures to microbes from
water, food and air are often much lower microbial doses than used in human volunteer studies
• It becomes necessary to extrapolate the dose-response relationship of human volunteer studies– Extrapolation to the low dose range – This is the range where there are no
experimental data points having discrete values above zero from the low exposure doses
• a best-fit modelling approach is employed

Models Typically Applied in Microbial Dose-Response Analyses
Exponential model
Pinfection = 1 - e-rx
•r = probability of infection
•x = mean concentration/dose
•Assumes
– organisms are distributed randomly (Poisson)
– approaches a linear model at low doses

Models Typically Applied in Microbial Dose-Response Analyses
• Exponential (linear) model; two populations:
– one-hit kinetics, but
– two classes of human susceptibility to microbe
– or perhaps two form of microbes with different infectivity or illness risks
• Beta-Poisson: a distributed threshold model
– assumes Poisson distribution of microbes and a Beta-distributed probability of infection
– r is not a constant but a probability distribution (Beta-distribution)
– two variables in the model

Probabilities of Exposure and Infection
• Pexp (j Dose) = Probability of having j pathogenic microbes in an ingested dose
• Pinf (j Inf) = Conditional probability of infection from j pathogens ingested

Probability of Exposure

Exponential Dose-Response Model

Beta-Poisson Dose-Response Model
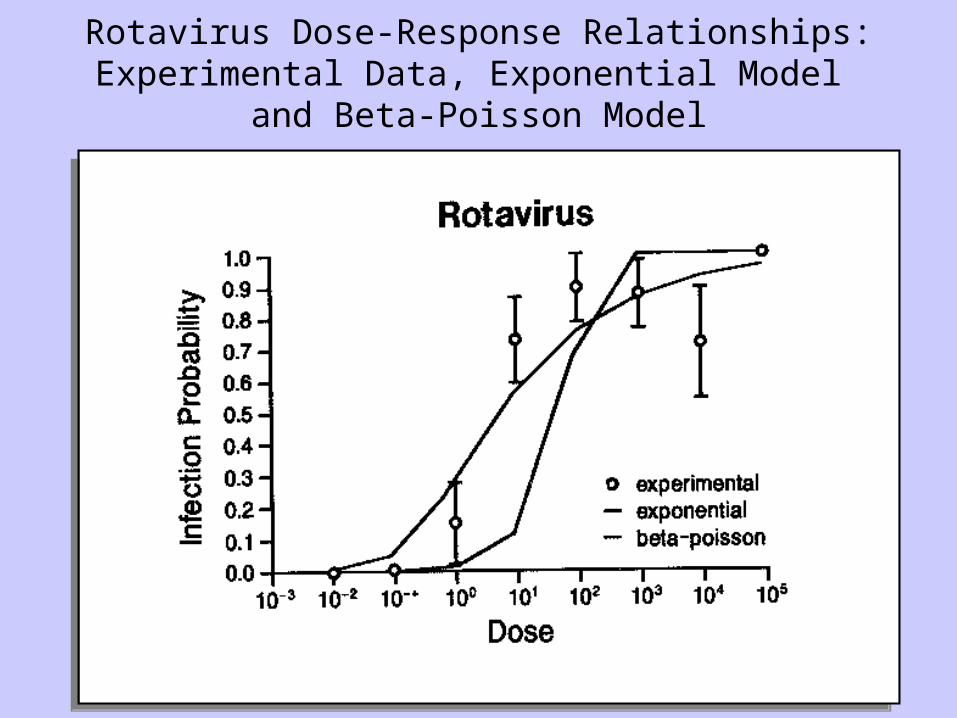
Rotavirus Dose-Response Relationships:Experimental Data, Exponential Model
and Beta-Poisson Model

Daily and Annual Risks of Various Outcomes from Exposure to Water Containing
Rotaviruses4 Rotaviruses per 1000 Liters

Volunteer Dose-Response Data for Norwalk Virus*
*"1st passage NV": Dolin et al. 1972; Wyatt et al., 1974.
Dose (mL) # dosed
# ill % ill
4 16 11 69
1 21 14 67
0.01 4 2 50
0.0001 4 0 0

0
0.1
0.2
0.3
0.4
0.5
0.6
0.7
0.8
0.9
1
0 0.0001 0.01 1 4
Dose (ml)
P(D)
Fra
ctio
n w
ith E
ffect
Measured
Linear (exp)
Lin (2pop)
b-Poisson
0
0.1
0.2
0.3
0.4
0.5
0.6
0.7
0.8
0.9
1
0 0.0001 0.01 1 4
Dose (ml)
P(D)
Fra
ctio
n w
ith E
ffect
Measured
Linear (exp)
Lin (2pop)
b-Poisson
Norwalk Virus Dose-Response Analysis Using Alternative
Models

Dose-Response Relationships for Various Waterborne Pathogens:
Downward Extrapolation to Low-Dose Range

Comparing Risks of Disease Agents
• Comparing chemical to microbial risks as well as among agents of each type
• Effects vary widely in severity, mortality rates and time scale of exposure
• Need to protect both quality and quantity of life
• WSH policy needs to be linked to overall public health policy
• Decision making process needs to take social and economic factors into account

Desirable attributes of an integrated measure of risk
• Address probability, nature and magnitude of adverse health consequences
• Incorporate age and health status of those affected

DALYs as unit measures for health
• Conceptually simple:
– health loss = N x D x S
– N = number of affected persons
– D = duration of adverse health effect
– S = measure for severity of the effect
• Disability Adjusted Life Years (DALYs)
– mortality: years of life lost (YLL)
– morbidity: years lived with disability (YLD)
– DALY = YLL + YLD

Hypothetical example
0
0.2
0.4
0.6
0.8
1
0 20 40 60 80
Age
Dis
abili
ty w
eigh
t
0
0.2
0.4
0.6
0.8
1
0 20 40 60 80
Age
Dis
abili
ty w
eigh
t
Residual disability
Premature deathAcute
(infectious) disease

Key Question: How do we define health?
• ‘a state of complete physical, mental and social well-being, and not merely the absence of disease or infirmity’ (WHO charter, 1946)
• ‘the ability to cope with the demands of daily life’ (the Dunning Committee on Medical Cure and Care, 1991)
• the absence of disease and other physical or psychological complaints (NSCGP, 1999)

Deriving severity weights
Global Burden of Disease Project• Define 22 indicator conditions
• Use Person Trade Off method to elicit severity weights
• Panel of physicians and public health scientists
• Use scale of indicator conditions to attribute severity weights to other conditions
• Methodology also applied in other studies

Using Epidemiology for Microbial Risk Analysis
Problem Formulation
• what’s the problem? • determine what infectious disease is posing
a risk• its clinical features• causative agent• routes of exposure/infection• health effects

Using Epidemiology for Microbial Risk Analysis
Exposure Assessment• how• how much• when• where and why exposure occurs• vehicles• vectors• doses• loads

Using Epidemiology for Microbial Risk Analysis
Health Effects Assessment • Human clinical trials for dose-response• field studies of endemic and epidemic disease
in populations

Using Epidemiology for Microbial Risk Analysis
Risk characterization • Epidemiologic measurements and analyses of risk:
– relative risk– risk ratios– odds ratios– regression models of disease risk – dynamic models of population disease risk
• Other disease burden characterizations:– relative contribution to overall disease burdens– effects of prevention and control measures and
interventions– economic considerations (monetary cost of the disease,
cost effectiveness of prevention and control measures)

Elements That May Be Considered in Risk Characterization
• Evaluate health consequences of exposure scenario– Risk description (event)
– Risk estimation (magnitude, probability)
• Characterize uncertainty/variability/confidence in estimates
• Conduct sensitivity analysis– evaluate most important variables and information needs
• Address items in problem formulation (reality check)
• Evaluate various control measures and their effects on risk magnitude and profile
• Conduct decision analysis– evaluate alternative risk management strategies

Types of Epidemiological Studies that Have Been Used in Risk Assessment for
Waterborne Disease

Some More Epidemiological Terms and Concepts
• Outbreaks: two or more cases of disease associated with a specific agent, source, exposure and time period
• Epidemic Curve (Epi-curve): Number of cases or other measure of the amount of illness in a population over time during an epidemic– Describes nature and time course of outbreak
– Can estimate incubation time if exposure time is known
– Can give clues to modes of transmission: point source, common source, and secondary transmission

Some More Epidemiological Terms and Concepts: Epidemic Curves
Point Source
#
case
s
Time
Common Source
#
case
sTime

Databases for Quantification and Statistical Assessment of Disease -
USA• National Notifiable Disease Surveillance System• National Ambulatory Medical Care Survey• International Classification of Disease (ICD) Codes• Other Databases
– Special surveys– Sentinel surveillance efforts
• Resources for disease surveillance vary greatly by country.– WHO and other international health entities assist
countries lacking capacity for disease surveillance to obtain such data in various ways
– Tracking is poor for some diseases, such as gastroenteritis and its specific causative agents (etiologies)

Additional Analyses of Health Effects:
Health Effects Assessments• Health Outcomes of Microbial Infection
• Identification and diagnosis of disease caused by the microbe
– disease (symptom complex and signs)
– Acute and chronic disease outcomes
– mortality
– diagnostic tests
• Sensitive populations and effects on them
• Disease Databases and Epidemiological Data

Methods to Diagnose Infectious Disease
• Symptoms (subjective: headache, pain) and Signs (objective: fever, rash, diarrhea)
• Clinical diagnosis: lab tests
– Detect causative organism in clinical specimens
– Detect other specific factors associated with infection
• Immune response
– Detect and assay antibodies
– Detect and assay other specific immune responses

Health Outcomes of Microbial Infection
• Acute Outcomes– Diarrhea, vomiting, rash, fever, etc.
• Chronic Outcomes– Paralysis, hemorrhagic uremia,
reactive arthritis, etc.
• Hospitalizations• Deaths

Morbidity Ratios for Salmonella (Non-typhi)
Study Population/Situation Morb. (%) 1 Children/food handlers 50 2 Restaurant outbreak 55 3 College residence outbreak 69 4 Nursing home employees 7 5 Hospital dietary personnel 8 6 " 6 7 Nosocomial outbreak 27 8 Summer camp outbreak 80 9 Nursing home outbreak 23 10 Nosocomial outbreak 43 11 Foodborne outbreak 54 12 Foodborne outbreak 66
Avg. 41

Acute and Chronic Outcomes Associated with Microbial Infections
Microbe Acute Outcomes
Chronic Outcomes Campylobact
er Diarrhea Guillain-Barre
Syndrome E. coli O157:H7
Diarrhea Hemolytic Uremic Syn. Helicobacter Gastritis Ulcers & Stomach
Cancer Sal., Shig., Yer.
Diarrhea Reactive arthritis Coxsackie B3 Encephalitis,
etc. Myocarditis &
diabetes Giardia Diarrhea Failure to thrive; joint pain Toxoplasma
Newborn Syndrome
Mental retardation, dementia, seizures

Outcomes of Infection Process to be Quantified
Hospitalization
Infection Asymptomatic Infection
Mortality
Disease
Advanced Illness, Chronic Infections and Sequelae
Acute Symptomatic Illness: Severity and Debilitation
Exposure
Sensitive Populations

Health Effects Outcomes: E. coli O157:H7

Health Effects Outcomes: Campylobacter

Sensitive Populations• Infants and young children
• Elderly
• Immunocompromised
– Persons with AIDs
– Cancer patients
– Transplant patients
• Pregnant
• Malnourished

Mortality Ratios for Enteric Pathogens in Nursing Homes Versus
General Population
Mortality Ratio (%) in: Microbe
General Pop. Nursing Home Pop.
Campylobacter jejuni
0.1 1.1
E. coli O157:H7 0.2 11.8
Salmonella 0.01 3.8
Rotavirus 0.01 1.0
Snow Mtn. Agent 0.01 1.3
Mortality Ratio (%) in: Microbe
General Pop. Nursing Home Pop.
Campylobacter jejuni
0.1 1.1
E. coli O157:H7 0.2 11.8
Salmonella 0.01 3.8
Rotavirus 0.01 1.0
Snow Mtn. Agent 0.01 1.3

Impact of Waterborne Outbreaks of Cryptosporidiosis on AIDS Patients
Outbreak Attack Rate Mortal. Ratio (%)
Comments
Oxford/ Swindon, UK, 1989
36 Not reported
3 of 28 renal transplants pts. Shedding oocysts asymptomatically
Milwaukee, WI, 1993
45 68 17% biliary disease; CD4 counts <50 associated with high risks
Las Vegas, NV, 1994
Not known; increase in Crypto-+ stools
52.6 CD4 counts <100 at high risk; bottled water case-controls protective

Mortality Ratios Among Specific Immunocompromised Patient
Groups with Adenovirus InfectionPatient Group % Mortality
(Case-Fatality Ratio)
Overall Mean Age of Patient Group
(Yrs.)
Bone marrow transplants
60 15.6
Liver transplant recipients
53 2.0
Renal transplant recipients
18 35.6
Cancer patients 53 25
AIDS patients 45 31.1

Databases for Quantification and Statistical Assessment of
Disease• National Notifiable Disease
Surveillance System• National Ambulatory Medical Care
Survey• International Classification of Disease
(ICD) Codes• Other Databases
– Special surveys– Sentinel surveillance efforts

Waterborne Outbreak Attack Rates- USA

Waterborne Outbreak Hospitalizations - USA

Adults Children Adults with AIDS
Pediatric AIDS
Total NYC population 6,080,000 1,360,000 30,000 1,200 Reported cases (1995)
40 30 390 10
Predicted tapwater-related reported cases (% of total actually reported)
2 (5%) 3 (10%) 33 (8.5%) 1(10%)
Predicted annual risk from tapwater unreported (% of those predicted to be reported)
5,400 (0.03%)
940 (0.3%)
56 (59%) 1 (100%)
Perz et al., 1998, Am. J. Epid., 147(3):289-301
Predicted Waterborne Cryptosporidiosis in NYC in AIDS Patients Compared to the General Population
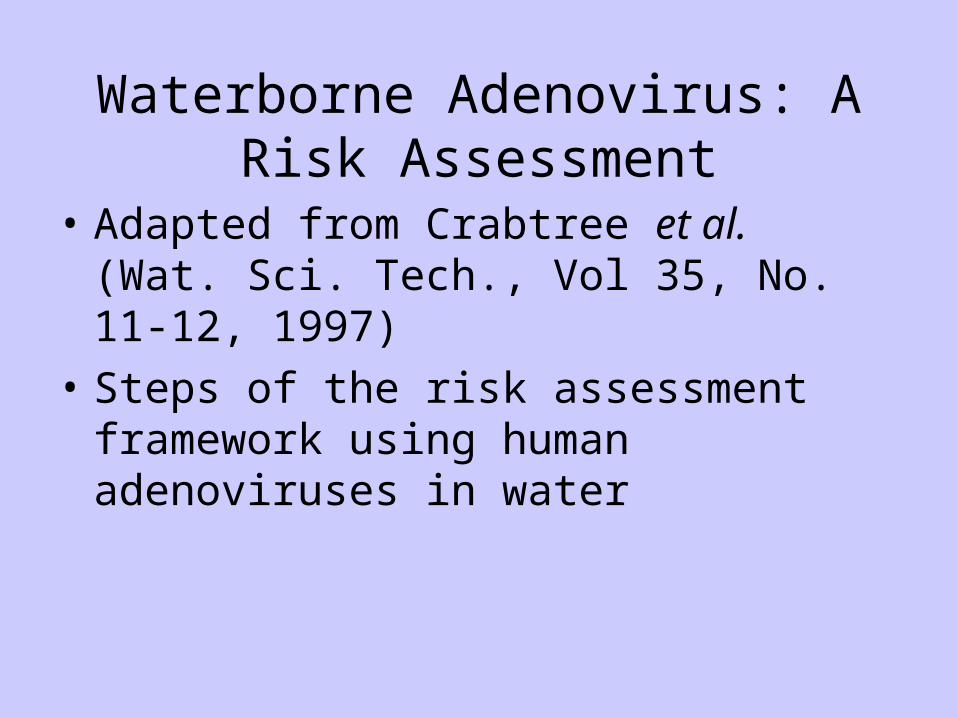
Waterborne Adenovirus: A Risk Assessment
• Adapted from Crabtree et al. (Wat. Sci. Tech., Vol 35, No. 11-12, 1997)
• Steps of the risk assessment framework using human adenoviruses in water

Step 1: Hazard Identification
Infection and clinical disease
• About 1/3 of known adenoviruses cause human illness
• A wide range of illnesses, involving several different organ systems– pharyngitis– pneumonia– conjunctivitis– gastroenteritis and intussusception– hemorrhagic cystitis– meningoencephalitis
• Diagnosed by culture and immunologic techniques

Step 1: Hazard Identification
The transmission routes
• Fecal oral route– Makes waterborne transmission possible– Contamination of water supplies with fecal waste,
spread when others come in contact with water
• Inhalation of aerosols (sneezing, coughing)• Proximity of individuals encourages transmission
– groups of military recruits, hospitals, day care centers, schools
• Virus is shed for extended periods in feces and respiratory secretions– Encourages transmission: large window of opportunity
for spread to others

Step 2: Exposure Assessment
Occurrence in the environment and in human populations
• Infected people shed virus for long periods• Adenoviruses have been found in water
– Appear to be stable (survives and remains infectious) in seawater and tap water
– Spread via swimming pools (outbreak study)– Exposure via recreational waters is possible
• Occur worldwide in sewage– Appears to be stable in sewage– Fecal oral transmission if drinking or recreational water
becomes contaminated by sewage
• Adenoviruses seem to be particularly resistant to disinfection by ultraviolet light– May be difficult to remove by water treatment processes

Step 3: Health Effects Assessment
Characteristics of illness
• Illnesses of varying severity – from eye infection to brain infections and pneumonia
• Can have secondary spread, especially in crowded environments
• Secondary spread also seen in waterborne outbreaks
• Many serotypes and many illnesses, making prevention difficult
• Vaccination currently not available

Step 3: Health Effects Assessment
Susceptible populations• The elderly
– Outbreaks in nursing homes: people in close proximity encourages spread
– Elderly may consume more water than other populations, increasing their risk of exposure to waterborne adenovirus
• Children– Spread in schools and day care environments
– Children may be frequent users of recreational waters, increasing their risk of exposure
– Hygiene habits of small children in schools and daycares may encourage spread

Step 3: Health Effects Assessment:
Dose Response Assessment• Relationship between dose of virus received and probability of illness
• Use data from a human volunteer study• Inhalation of aerosols of adenovirus 4• Probability of illness calculated using the
exponential model
Pi = 1-exp(-rN)
• Pi = probability of illness
• N = number of viruses ingested or inhaled
• R = parameter calculated from experimental dose-response data

Step 3: Health Effects Assessment:
Dose Response AssessmentCalculating r from dose-response data
• When N=11, Pi = 1
• When N=5, Pi = 1
• When N=1, Pi = (3/1), or Pi = 0.333
• We can use this value to calculate the value of r
Dose of virus(infectious
units)
No. of volunteers exposed
No. of volunteers infected
11 3 3
5 3 3
1 3 1

Step 3: Health Effects Assessment:Dose Response Assessment
• Calculating R from dose-response data• When N=1, Pi = (3/1), or Pi = 0.333
Pi = 1-exp(-rN)
0.333 = 1-exp(-r(1))
0.333 = 1-exp(-r)
-0.667 = -exp(-r)
0.667 = exp(-r)
ln(0.667) = ln(exp(-r))
-0.4049 = -r
r = 0.4049

Step 3: Health Effects Assessment:
Dose Response Assessment• We have solved for a value of r
specific to the dose-response relationship of this organism
• Using this value of r, we can determine the probability of infection, Pi, from any dose N
• Question: What is the dose N??
Step 3: Health Effects Assessment:
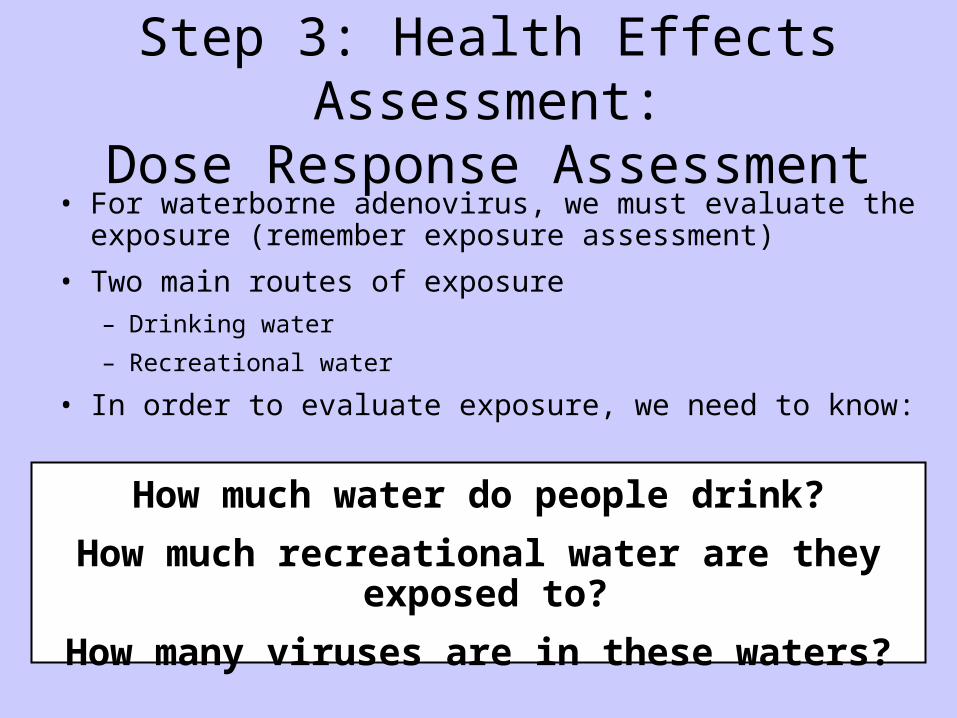
Dose Response Assessment• For waterborne adenovirus, we must evaluate the
exposure (remember exposure assessment)
• Two main routes of exposure– Drinking water
– Recreational water
• In order to evaluate exposure, we need to know:
How much water do people drink?
How much recreational water are they exposed to?
How many viruses are in these waters?

Step 3: Health Effects Assessment:
Dose Response Assessment• We can gather these data from
various sources
– Studies of adenovirus occurrence in environmental and drinking water
– Studies of people’s water consumption habits (it’s been done!)
• These data can then be used to calculate doses to feed into the model

Step 3: Health Effects Assessment:
Dose Response Assessment• On average, people drink about 2L of water
per day
• Data on the occurrence of adenoviruses in drinking water is limited
– There is data on the occurrence of other enteric viruses in drinking water
– We can use this data as a surrogate measure of adenovirus occurrence in water
• Estimate: enteric viruses can occur in drinking water at levels of 1 per 100L to 1 per 1000L

Step 3: Health Effects Assessment:
Dose Response Assessment• On average, people will be exposed to about
30 mL of recreational freshwater per day (try not to swallow the swimming pool water!)
• There is some data on the occurrence of adenoviruses in environmental waters– From a monitoring study of a by– We can use this data as a surrogate measure of
adenovirus occurrence in recreational water
• Estimate: adenovirus can be present in recreational water at levels of 0.118 per 100L to 12.8 per 100L
Step 3: Health Effects Assessment:
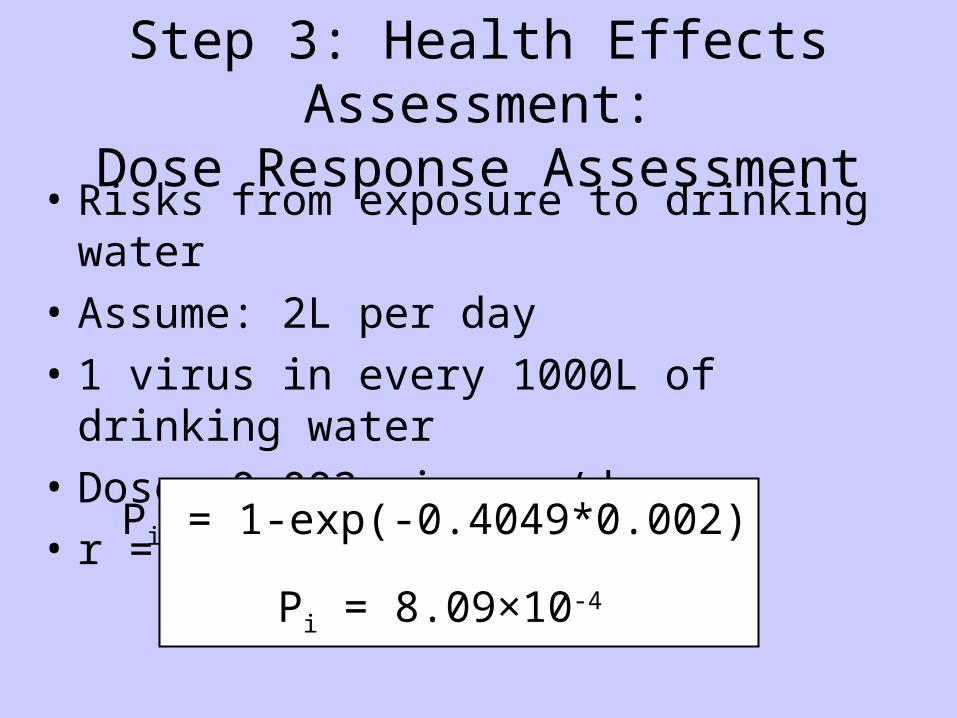
Dose Response Assessment• Risks from exposure to drinking water• Assume: 2L per day• 1 virus in every 1000L of drinking
water• Dose: 0.002 viruses/day• r = 0.4049Pi = 1-exp(-0.4049*0.002)
Pi = 8.09×10⁻⁴

Step 3: Health Effects Assessment:
Dose Response Assessment• Therefore, the daily probability of infection
from exposure to drinking water with 1 virus per 1000L = 8.09×10⁻⁴
• This is the probability of infection, not illness
• To determine the probability of illness, we need a value for the fraction of infected individuals who will actually become clinically ill
• This will be unique for each organism
Step 3: Health Effects Assessment:
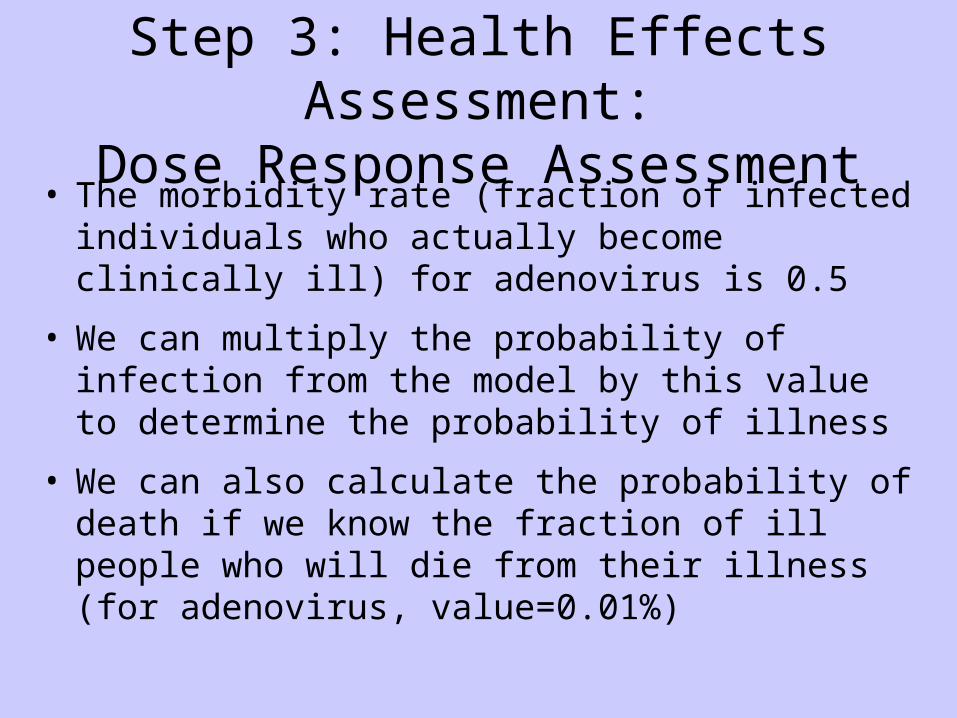
Dose Response Assessment• The morbidity rate (fraction of infected
individuals who actually become clinically ill) for adenovirus is 0.5
• We can multiply the probability of infection from the model by this value to determine the probability of illness
• We can also calculate the probability of death if we know the fraction of ill people who will die from their illness (for adenovirus, value=0.01%)

Example: Daily risks from adenovirus in drinking water
• Assume: 2L per day• 1 virus in every 1000L of drinking
water• Probability of illness in the infected =
0.5• Probability of death in the ill = 0.01%Risk of
infection8.09×10-4
Risk of illness 4.05×10⁻⁴
Risk of death 4.05×10⁻⁸
Example: Yearly risks from adenovirus in drinking water
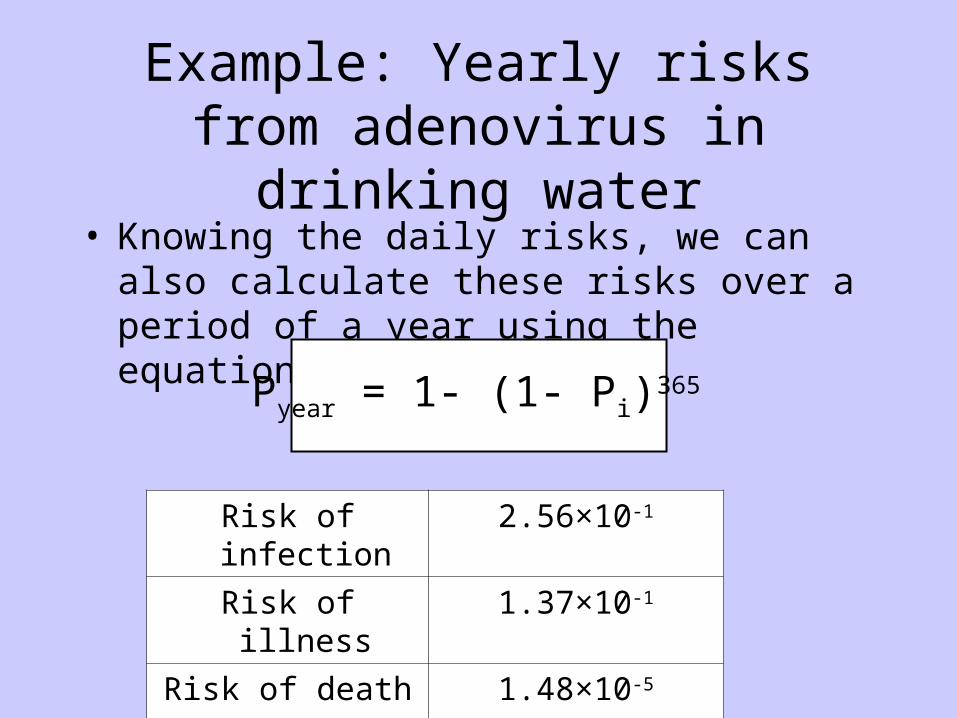
• Knowing the daily risks, we can also calculate these risks over a period of a year using the equation:
Pyear = 1- (1- Pi)365
Risk of infection
2.56×10⁻¹
Risk of illness 1.37×10⁻¹
Risk of death 1.48×10⁻⁵

Step 3: Health Effects Assessment:
Dose Response Assessment• We now know the daily and yearly risks
from waterborne adenovirus in drinking water at a level of 1 virus per 1000L
• The same model can be used to assess risk for other levels of adenovirus in water
• The model can also be applied in exactly the same way to recreational water risks

Step 4: Risk Characterization
• Using the dose-response relationship and exponential model, we now have information about the risks from waterborne adenovirus
– Risk from drinking water and recreational water
– Risk from different amounts of virus in these water sources
– Daily risks and yearly risks
– Risk of infection, illness, and death
• What can we do with this information?

Step 4: Risk Characterization
• Compare the values to predetermined benchmarks of acceptable risk
• Example: EPA recommends that the risk of infection from drinking water should not exceed 1 in 10,000 per year
• Risk levels from our models exceed this risk
• Suggests that waterborne adenovirus in water poses an unacceptable risk to consumers

Step 4: Risk CharacterizationWhat can be done about this?
• First: determine the dose of adenovirus that does not exceed the 1:10,000/year benchmark– This can be done using the model (Pi = 10-4)
• How do we ensure that people’s exposure does not exceed this dose?– Evaluating water treatment efficacy– Does water treatment reduce adenovirus levels
below the level of acceptable risk?– How do we improve treatment to achieve
acceptable levels of risk?– Changes in water treatment practices