Embed Size (px)
Citation preview

Microalgae Commodities from Coal Plant Flue Gas CO2 U.S. Department of Energy, Office of Fossil Energy, NETL
Cooperative Agreement DE-FE0026490, 10/01/15– 09/30/17 May 24, 2017
MicroBio Engineering Inc. John Benemann, Principal Investigator, Tryg Lundquist Co-P.I.
1

• Facilities Designs • Algae Equipment • R&D and Business Consulting • Techno-Economic Analyses • Life Cycle Assessments
• Wastewater Reclamation • Nutraceuticals, Aquafeeds • Biofuels, Biofertilizers
J. Benemann T. Lundquist 2

Pre-Fabricated
200-m2
Mobile 0.5-m2
75-m2
3
MBE’s RNEW® Process for wastewater treatment and biofuels production
Recycle Nutrients Energy Water
4

NETL Project Objectives • Primary Objective: Develop detailed techno-economic and life cycle
assessments specifically for OUC SEC coal-fired power plant with two microalgae CO2 utilization/mitigation options: 1. Biogas production to replace coal for maximum CO2 mitigation
(task modified to produce vehicle biofuel). 2. Commodity animal feeds production for maximum economic
benefit of flue gas CO2 use.
• Secondary Objective: Demonstrate algae biomass production using OUC SEC flue gas with native algae and conversion to biogas; evaluate suitability as animal feed.
5
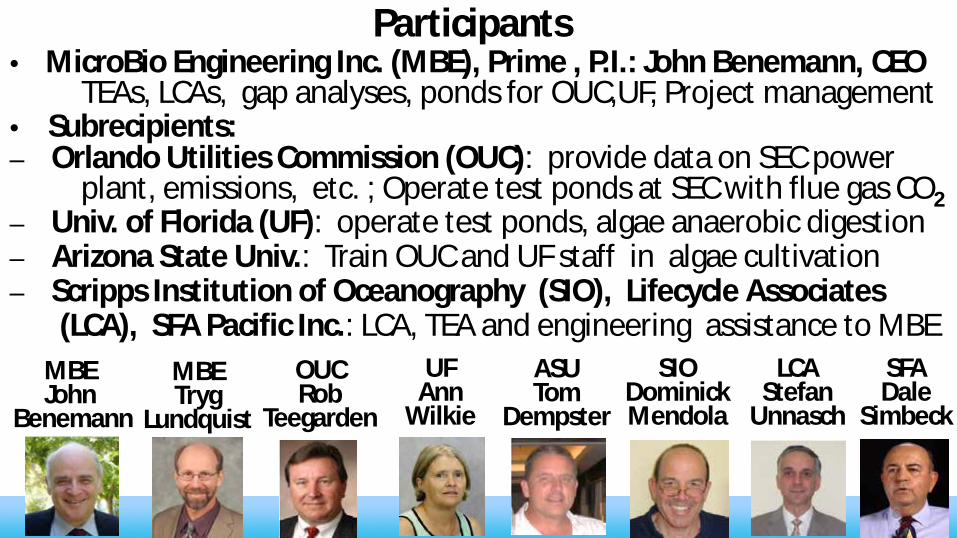
Participants • MicroBio Engineering Inc. (MBE), Prime , P.I.: John Benemann, CEO TEAs, LCAs, gap analyses, ponds for OUC,UF, Project management • Subrecipients: – Orlando Utilities Commission (OUC): provide data on SEC power plant, emissions, etc. ; Operate test ponds at SEC with flue gas CO2 – Univ. of Florida (UF): operate test ponds, algae anaerobic digestion – Arizona State Univ.: Train OUC and UF staff in algae cultivation – Scripps Institution of Oceanography (SIO), Lifecycle Associates (LCA), SFA Pacific Inc.: LCA, TEA and engineering assistance to MBE
SFA Dale
Simbeck
MBE John
Benemann
MBE Tryg
Lundquist
OUC Rob
Teegarden
UF Ann
Wilkie
ASU Tom
Dempster
SIO Dominick Mendola
LCA Stefan
Unnasch
6
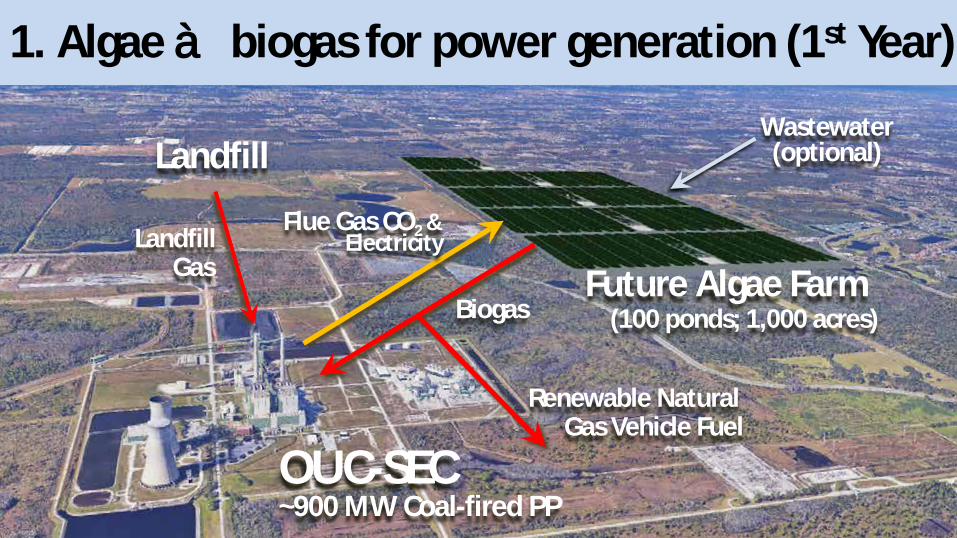
OUC-SEC ~900 MW Coal-fired PP
Landfill
Landfill Gas
Biogas
Future Algae Farm (100 ponds; 1,000 acres)
Wastewater (optional)
1. Algae à biogas for power generation (1st Year)
Flue Gas CO2 & Electricity
7
Renewable Natural Gas Vehicle Fuel

OUC-SEC ~900 MW Coal-fired PP
Landfill
Landfill Gas
Animal Feeds
Future Algae Farm (100 ponds; 1,000 acres)
Freshwater Ag Fertilizers
2. Algae à animal feed production (this year)
Flue Gas CO2 & Electricity
8

Technology Background
9
10
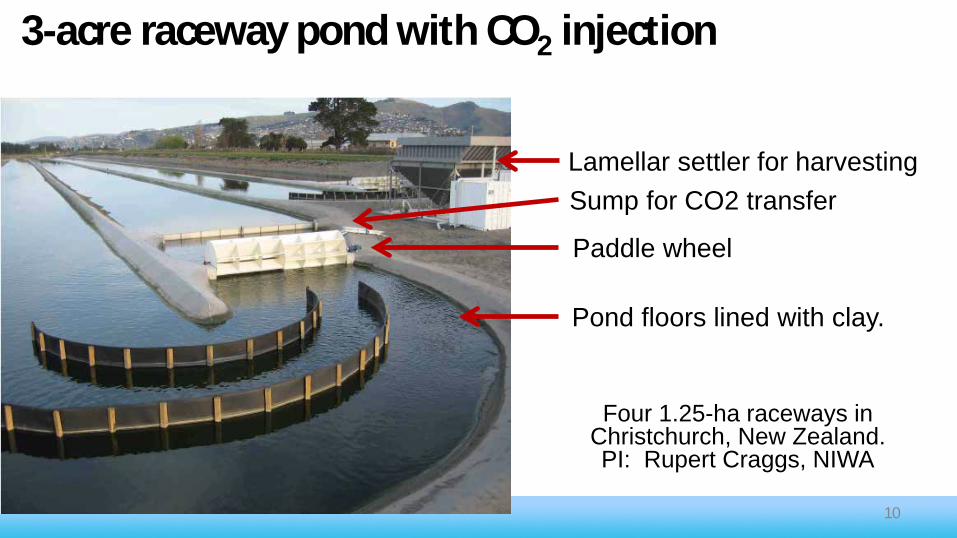
3-acre raceway pond with CO2 injection
Pond floors lined with clay.
Lamellar settler for harvesting Sump for CO2 transfer
Paddle wheel
Four 1.25-ha raceways in Christchurch, New Zealand. PI: Rupert Craggs, NIWA
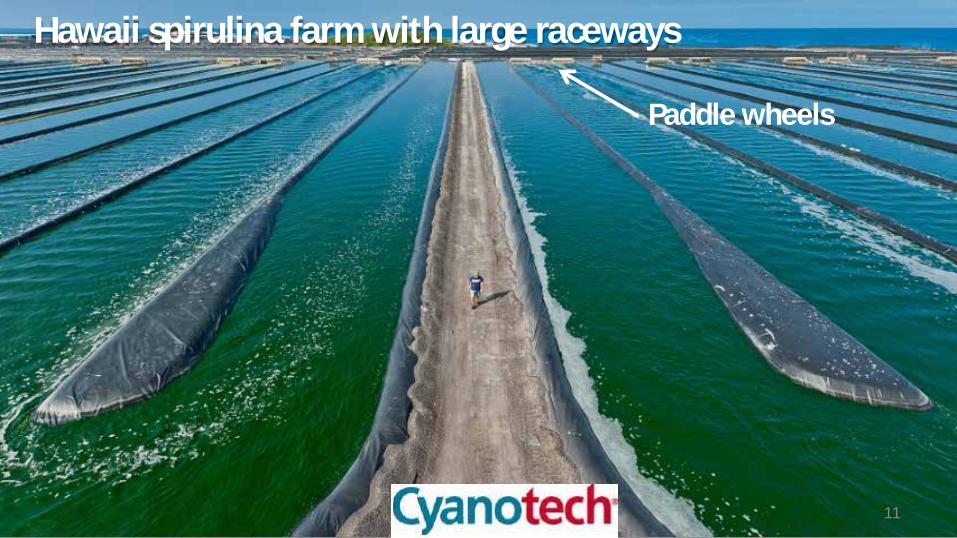
Paddle wheels
11
Hawaii spirulina farm with large raceways
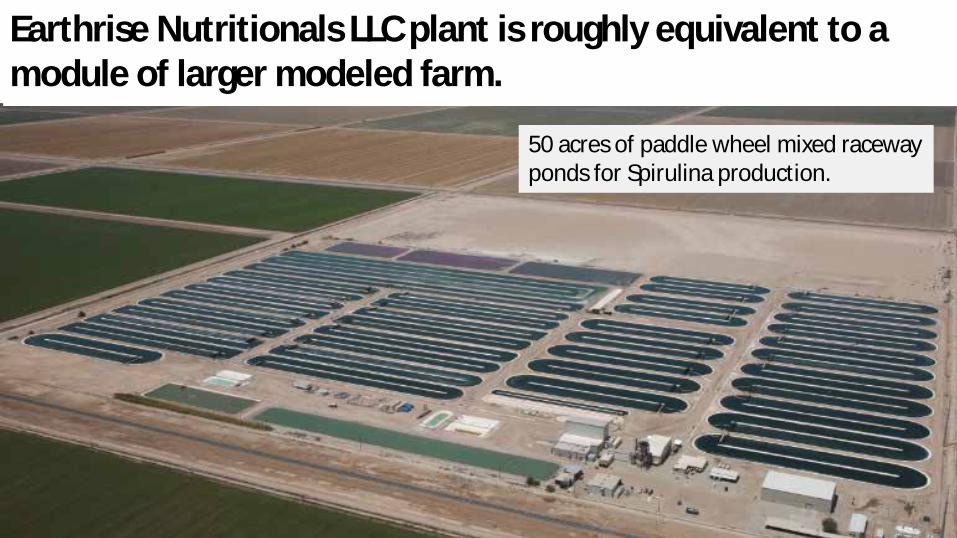
Earthrise Nutritionals LLC plant is roughly equivalent to a module of larger modeled farm.
12
50 acres of paddle wheel mixed raceway ponds for Spirulina production.

Algae demonstration plant design at a small fossil power plant for a California utility. MBE design: Six 5-acre raceways with smaller ponds for inoculation
13
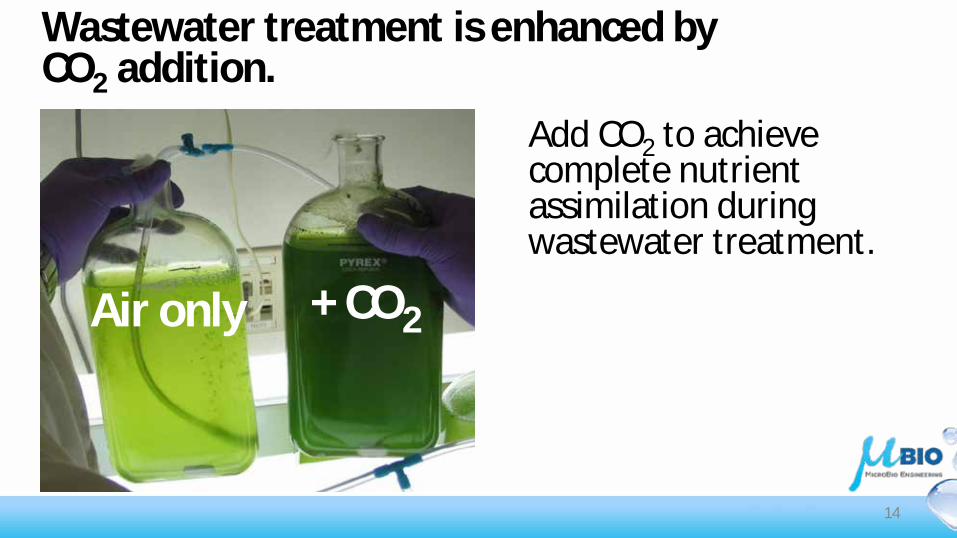
Air only + CO2
Add CO2 to achieve complete nutrient assimilation during wastewater treatment.
Wastewater treatment is enhanced by CO2 addition.
14

2. Two 3.5-acre raceways
Paddle wheels
Full-scale wastewater project in California. MBE & Cal Poly biofuel R&D supported by DOE BETO.
1. Facultative Ponds
3. Settling Ponds
15

Algae are coagulated, settled , and solar dried. ~100,000 gallons of 3% solids
algae in decanted settling basin Solar dried algae
Concrete drying pad 16

5-acre covered lagoon digester at a California dairy. Such low-cost design could be used for algae digestion.
17

Experimental Work
18

Task 2: Experimental Work at OUC and UF • Operate four 3.5-m2 ponds at each location
• At OUC, compare flue gas to pure CO2 – Productivity, metals concentration (water & biomass)
• At OUC and UF, determine seasonal productivities at optimized hydraulic residence times (HRTs)
• At UF, determine methane yields at one biomass concentration in batch methane potential tests
20

Flue gas from scrubbers to condensate traps to pump to pilot ponds
21

Flue gas from scrubbers to condensate traps to pump to pilot ponds
22
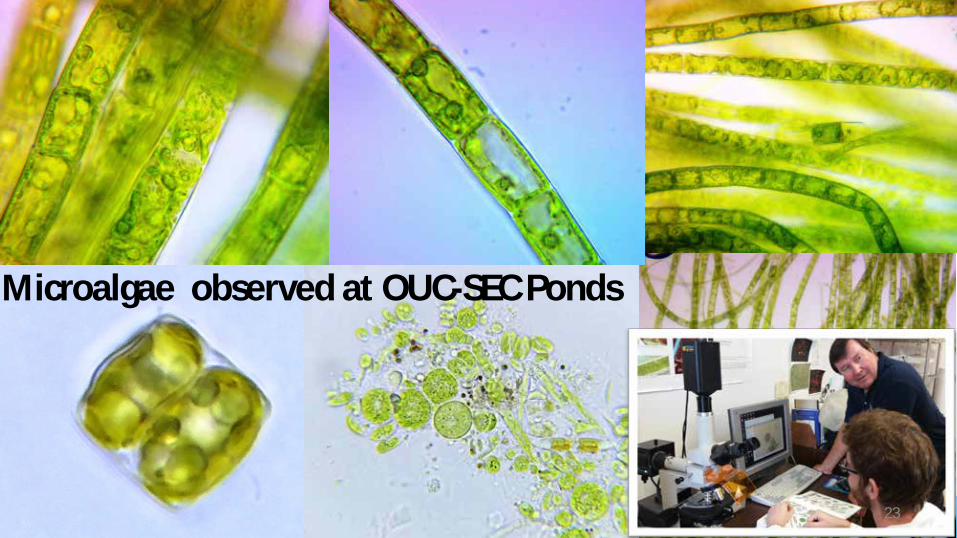
Microalgae observed at OUC-SEC Ponds
23

Filamentous algae dominate at OUC, which allows for easy harvesting of the biomass.
24

Filamentous algae dominate at OUC.
25
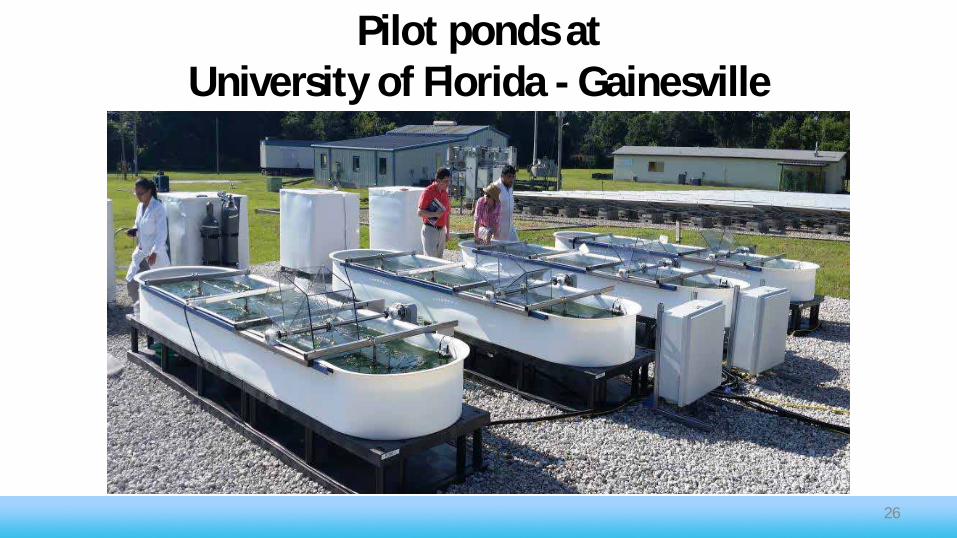
Pilot ponds at University of Florida - Gainesville
26

Bioflocculating cultures that settle
27
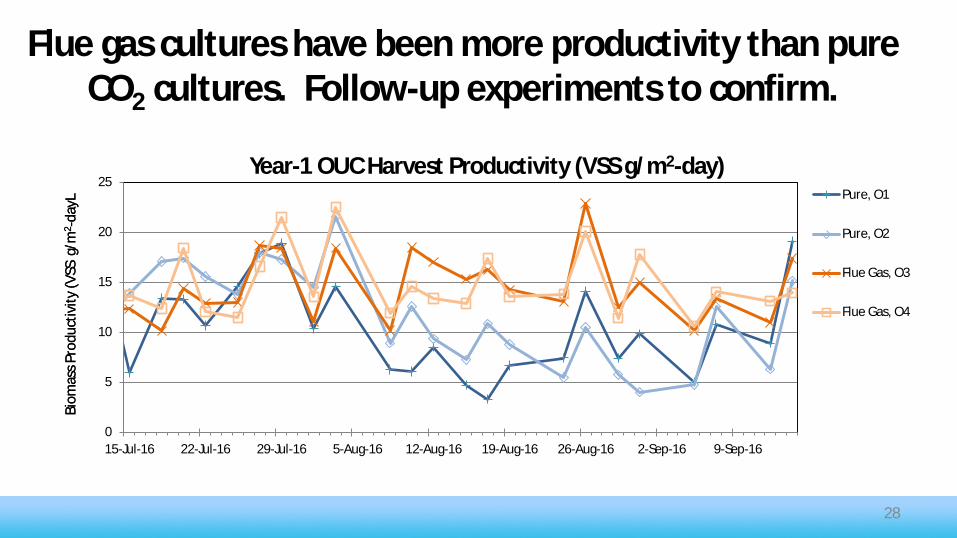
Flue gas cultures have been more productivity than pure CO2 cultures. Follow-up experiments to confirm.
0
5
10
15
20
25
15-Jul-16 22-Jul-16 29-Jul-16 5-Aug-16 12-Aug-16 19-Aug-16 26-Aug-16 2-Sep-16 9-Sep-16
Year-1 OUC Harvest Productivity (VSS g/m2-day) Pure, O1
Pure, O2
Flue Gas, O3
Flue Gas, O4
Biom
ass P
rodu
ctiv
ity (V
SS g
/m2 -
dayL
Bi
omas
s Pro
duct
ivity
(VSS
g/m
2 -da
yL
28

Site Selection
29

Potential Sites near OUC-SEC
ß Site Selected for Study
30

Eastern Regional Water Reclamation Facility
Orange County Water Reclamation
Layout of 400 ha Algae Production Ponds near OUC-SEC
31

Modeling
32

Modeling assumptions are based on MBE experimental data and analysis. • Annual average productivity: 33 g/m2-d
– 15 g/m2-d: autotrophic growth on flue gas CO2 – 18 g/m2-d: mixo-/hetero-trophic growth on organic C from recycle of whole
anaerobic digestate to raceways – 4.5 g/m2-hr: Peak summer productivity on flue gas CO2
• 45% Overall loss factor in flue gas CO2 supply to ponds • 90% efficiency in gravity harvesting (losses are recycled to ponds) • Biogas production: 0.32 L methane/g VSS • Nutrient recycle losses: 10% nutrient loss
33
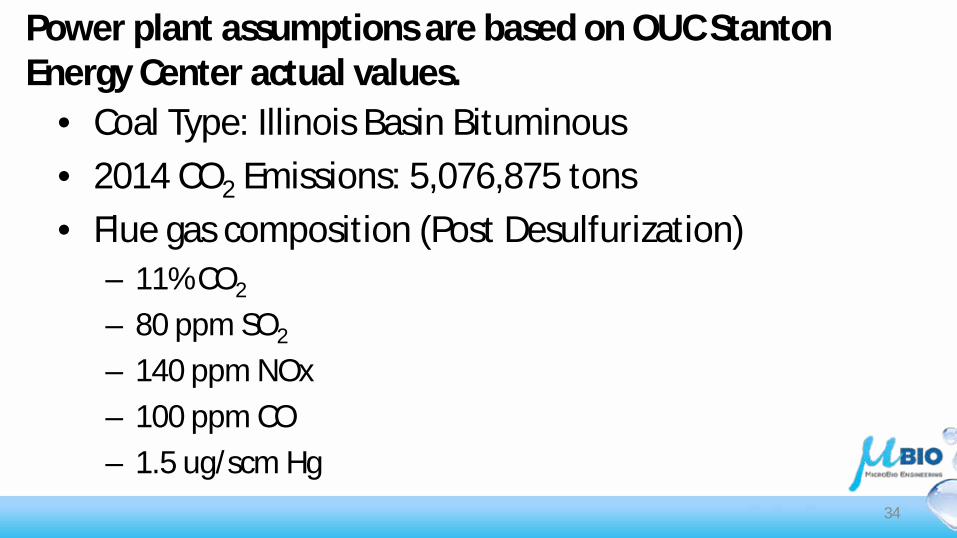
Power plant assumptions are based on OUC Stanton Energy Center actual values.
• Coal Type: Illinois Basin Bituminous • 2014 CO2 Emissions: 5,076,875 tons • Flue gas composition (Post Desulfurization)
– 11% CO2
– 80 ppm SO2
– 140 ppm NOx – 100 ppm CO – 1.5 ug/scm Hg
34

Techno-Economic Analysis
35

Renewable natural gas (RNG) production from algae is straightforward and allows for use of wastewater.
36

Capex is mostly ponds, site, and land for RNG case.
Production Ponds 21%
Site Development 14%
Biofuels Processing 12% Land
9%
CO2 & Electrical Distribution
9%
Engineering & Construction Fee
7%
Project Contingency 6%
Working Capital 4%
Field Expenses 4%
Prorateable Expenses 3%
Dewatering System 3%
Other Costs (Start-up, permits, etc)
3%
Make-up Water Syste, 2%
Inoculum Ponds 2%
Warehouse 1%
Total Capital Investment: $132,000,000 Debt: Equity 80%:20% Bond Payment (20 yrs at 5%): $8,500,000 /yr Return on Equity (15%): $3,900,000 /yr
Preliminary 37

Distribution of opex and annualized capex Bond Repayment: $8,500,000 /yr Return on Equity: $3,900,000 /yr Operating Costs: $11,600,000 /yr Biogas Revenue: $933,000 /yr @ $2 /mmBTU CO2 Utilization Cost: $816 /metric ton (without coproducts)
Labor 20%
Depreciation 34% Property
Insurance & Tax 7%
Equipment Maintenance
15%
Electricity 7%
Make-up Water 15%
Fertilizer 2%
Opex is mostly labor, water, and maintenance for RNG case. Co-product revenue is needed for CO2 utilization.
Preliminary 38
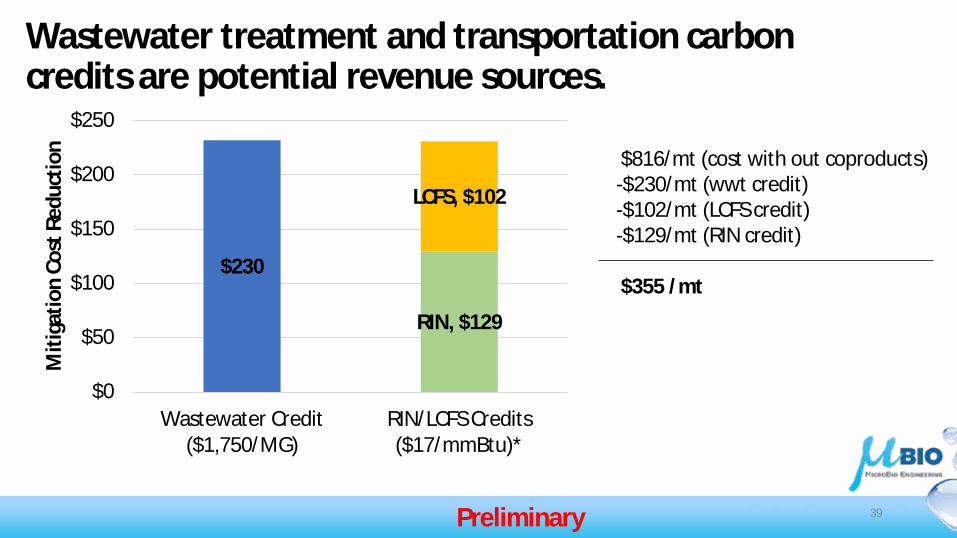
Wastewater treatment and transportation carbon credits are potential revenue sources.
$230
RIN, $129
LCFS, $102
$0
$50
$100
$150
$200
$250
Wastewater Credit($1,750/MG)
RIN/LCFS Credits($17/mmBtu)*
Miti
gatio
n Co
st R
educ
tion
$816/mt (cost with out coproducts) -$230/mt (wwt credit) -$102/mt (LCFS credit) -$129/mt (RIN credit) $355 /mt
Preliminary 39
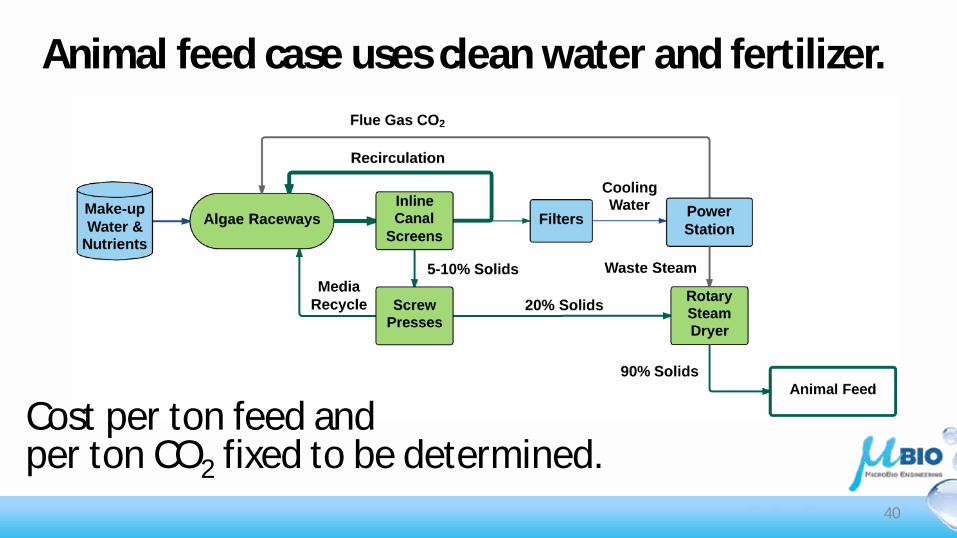
Animal feed case uses clean water and fertilizer.
Cost per ton feed and per ton CO2 fixed to be determined.
40
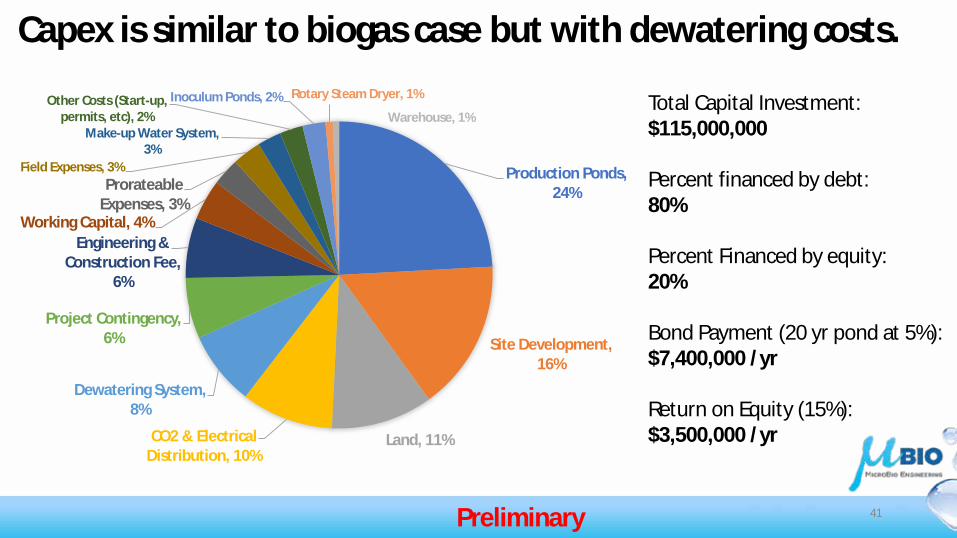
Production Ponds, 24%
Site Development, 16%
Land, 11% CO2 & Electrical Distribution, 10%
Dewatering System, 8%
Project Contingency, 6%
Engineering & Construction Fee,
6%
Working Capital, 4%
Prorateable Expenses, 3%
Field Expenses, 3%
Make-up Water System, 3%
Other Costs (Start-up, permits, etc), 2%
Inoculum Ponds, 2% Rotary Steam Dryer, 1%
Warehouse, 1% Total Capital Investment: $115,000,000 Percent financed by debt: 80% Percent Financed by equity: 20% Bond Payment (20 yr pond at 5%): $7,400,000 /yr Return on Equity (15%): $3,500,000 /yr
Preliminary 41
Capex is similar to biogas case but with dewatering costs.

Bond Repayment: $7,400,000 /yr Return on Equity: $3,500,000 /yr Operating Costs: $11,900,000 /yr Feed Revenue @ $350 /mt: $10,200,000 /yr CO2 Utilization Cost $249/metric ton
Labor, 20%
Depreciation, 27%
Property Insurance & Tax, 6%
Equipment Maintenance, 12%
Electricity, 9%
Fertilizer, 11%
Make-up Water, 15%
Preliminary 42
Opex is similar to RNG case but with fertilizer costs added.
Conclusions
Economical CO2 mitigation with biogas will require a combination of:
– WWT credit – RIN and LCFS credits – Further cost cutting/process improvements
43
Work in Progress • Production of animal feed instead of biogas • Land-use change • Albedo change • Non-GHG LCA impacts • Site Specific Layout • Additional sensitivity analysis
44


![Industrial application of microalgae in the circular ... · Industrial application of microalgae in the circular bioeconomy Dorinde Kleinegris [Applied Biotechnology / Microalgae]](https://img.dokumen.tips/doc/110x75/5ead3c152d0239422909016e/industrial-application-of-microalgae-in-the-circular-industrial-application.jpg)