Embed Size (px)
Citation preview

www.eprg.group.cam.ac.uk
1
Why and How to subsidise Energy R+D?
Michael Pollitt
Cambridge Judge Business School
IEB Barcelona
28 January 2014
www.eprg.group.cam.ac.uk
2
Outline
• Economists and Research and Development
• R+D, innovation and productivity in theory
• Empirical evidence on R+D and market reform
• Historical context of energy innovation
• What to do about supporting energy R+D?
• Conclusions and future directions for research

www.eprg.group.cam.ac.uk
3
ECONOMISTS AND RESEARCH AND DEVELOPMENT
www.eprg.group.cam.ac.uk
4
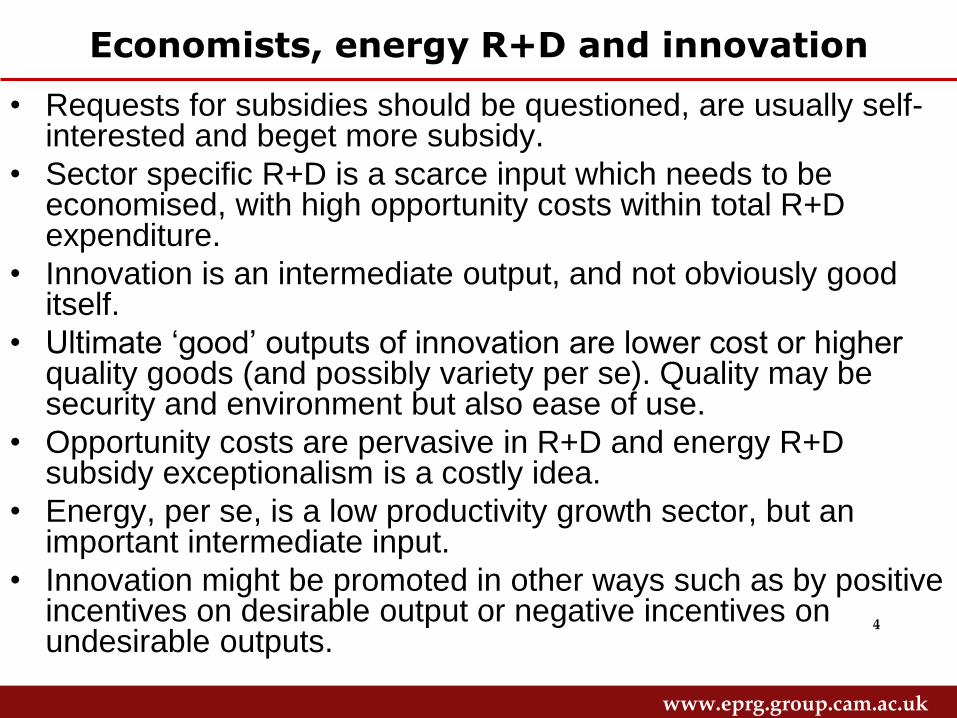
Economists, energy R+D and innovation
• Requests for subsidies should be questioned, are usually self-interested and beget more subsidy.
• Sector specific R+D is a scarce input which needs to be economised, with high opportunity costs within total R+D expenditure.
• Innovation is an intermediate output, and not obviously good itself.
• Ultimate ‘good’ outputs of innovation are lower cost or higher quality goods (and possibly variety per se). Quality may be security and environment but also ease of use.
• Opportunity costs are pervasive in R+D and energy R+D subsidy exceptionalism is a costly idea.
• Energy, per se, is a low productivity growth sector, but an important intermediate input.
• Innovation might be promoted in other ways such as by positive incentives on desirable output or negative incentives on undesirable outputs.
www.eprg.group.cam.ac.uk
5
Economists, energy R+D and innovation
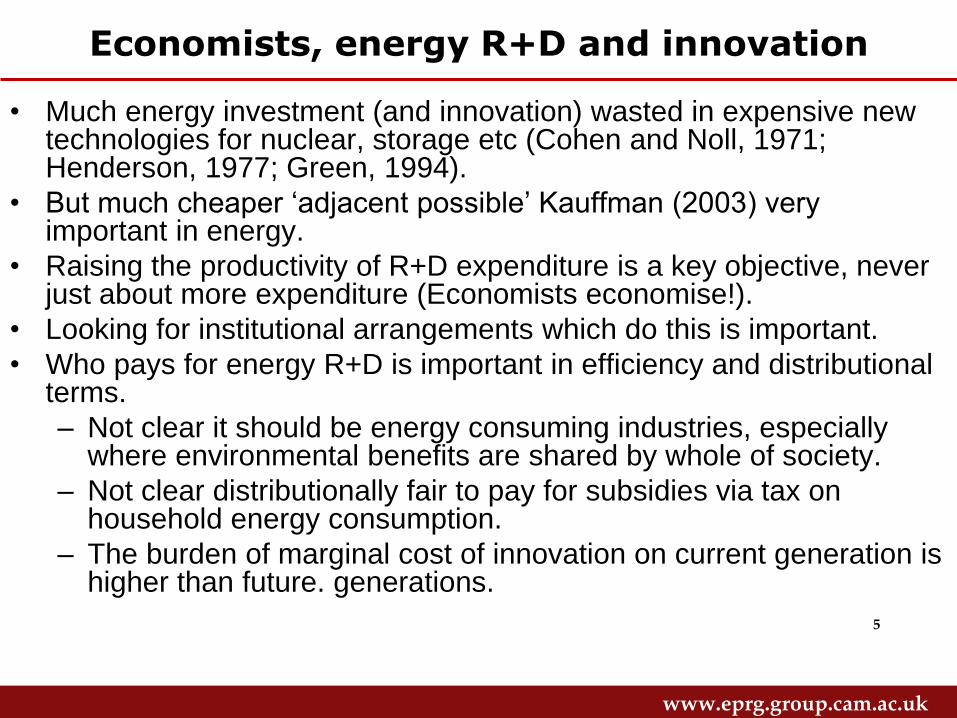
• Much energy investment (and innovation) wasted in expensive new technologies for nuclear, storage etc (Cohen and Noll, 1971; Henderson, 1977; Green, 1994).
• But much cheaper ‘adjacent possible’ Kauffman (2003) very important in energy.
• Raising the productivity of R+D expenditure is a key objective, never just about more expenditure (Economists economise!).
• Looking for institutional arrangements which do this is important.
• Who pays for energy R+D is important in efficiency and distributional terms.
– Not clear it should be energy consuming industries, especially where environmental benefits are shared by whole of society.
– Not clear distributionally fair to pay for subsidies via tax on household energy consumption.
– The burden of marginal cost of innovation on current generation is higher than future. generations.
www.eprg.group.cam.ac.uk
6
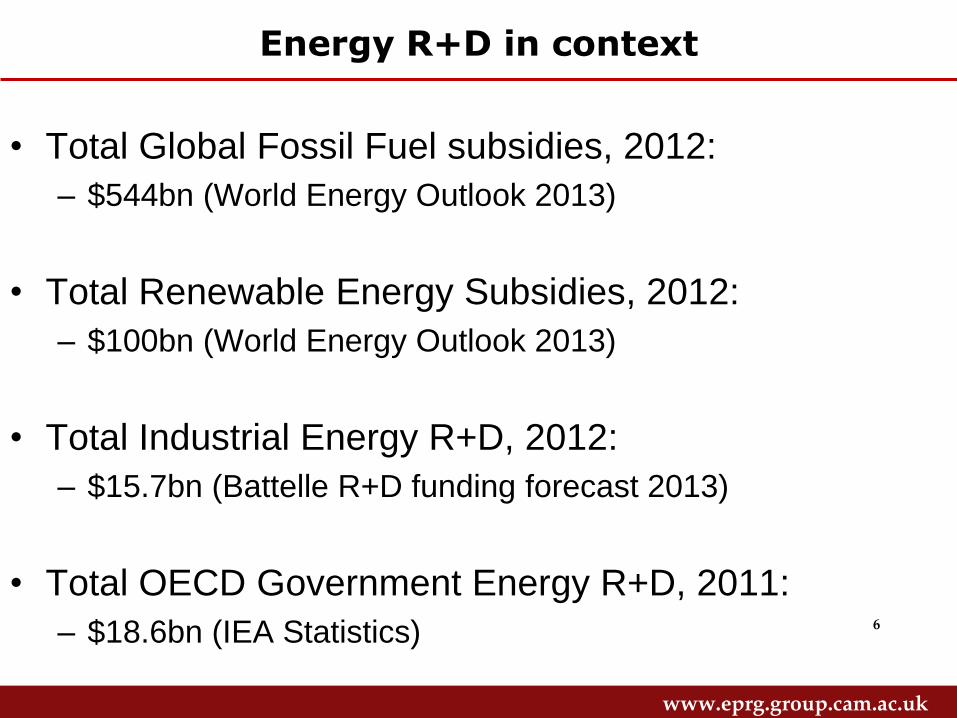
Energy R+D in context
• Total Global Fossil Fuel subsidies, 2012:
– $544bn (World Energy Outlook 2013)
• Total Renewable Energy Subsidies, 2012:
– $100bn (World Energy Outlook 2013)
• Total Industrial Energy R+D, 2012:
– $15.7bn (Battelle R+D funding forecast 2013)
• Total OECD Government Energy R+D, 2011:
– $18.6bn (IEA Statistics)

www.eprg.group.cam.ac.uk
7
R+D, INNOVATION AND PRODUCTIVITY IN THEORY
www.eprg.group.cam.ac.uk
8
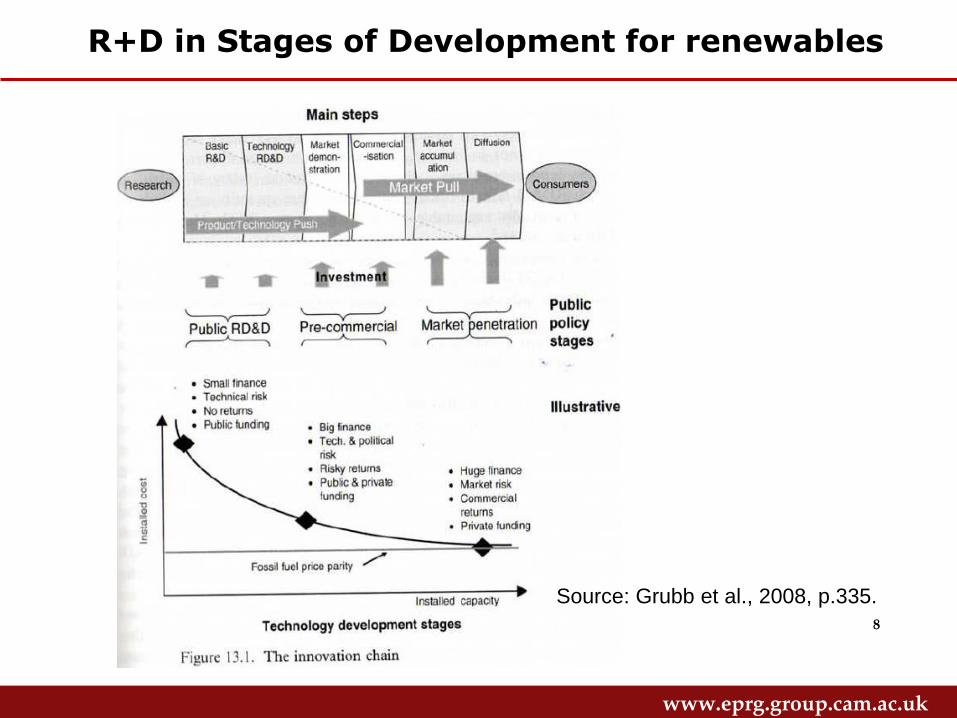
R+D in Stages of Development for renewables
Source: Grubb et al., 2008, p.335.
www.eprg.group.cam.ac.uk
9
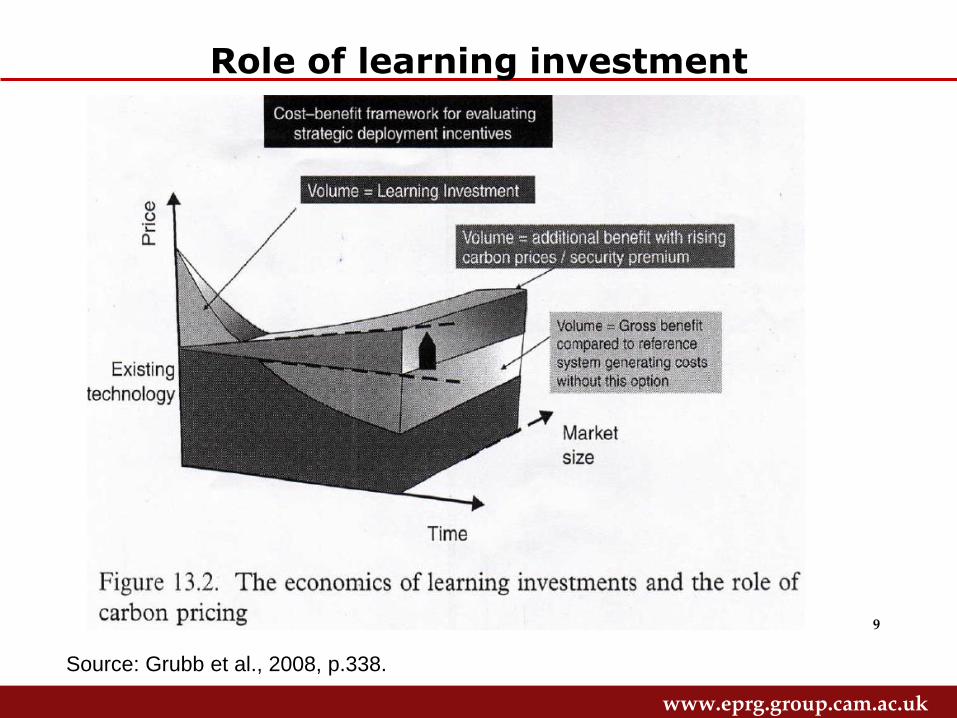
Role of learning investment
Source: Grubb et al., 2008, p.338.
www.eprg.group.cam.ac.uk
10
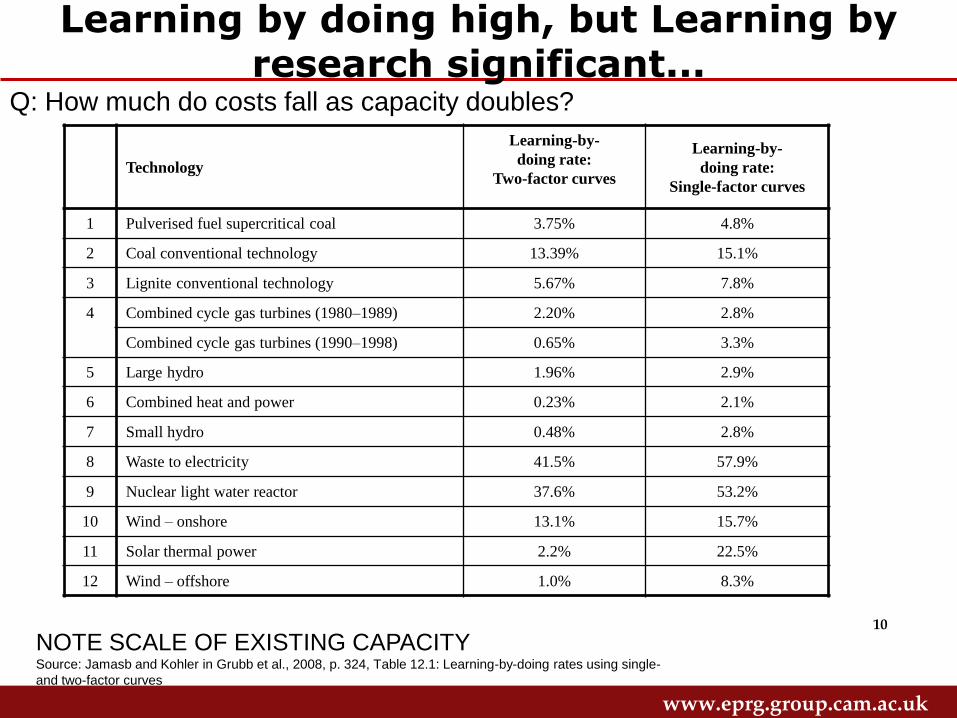
Learning by doing high, but Learning by research significant...
Technology
Learning-by-
doing rate:
Two-factor curves
Learning-by-
doing rate:
Single-factor curves
1 Pulverised fuel supercritical coal 3.75% 4.8%
2 Coal conventional technology 13.39% 15.1%
3 Lignite conventional technology 5.67% 7.8%
4 Combined cycle gas turbines (1980–1989) 2.20% 2.8%
Combined cycle gas turbines (1990–1998) 0.65% 3.3%
5 Large hydro 1.96% 2.9%
6 Combined heat and power 0.23% 2.1%
7 Small hydro 0.48% 2.8%
8 Waste to electricity 41.5% 57.9%
9 Nuclear light water reactor 37.6% 53.2%
10 Wind – onshore 13.1% 15.7%
11 Solar thermal power 2.2% 22.5%
12 Wind – offshore 1.0% 8.3%
NOTE SCALE OF EXISTING CAPACITY Source: Jamasb and Kohler in Grubb et al., 2008, p. 324, Table 12.1: Learning-by-doing rates using single-
and two-factor curves
Q: How much do costs fall as capacity doubles?
www.eprg.group.cam.ac.uk
11
Directed Technical Change (Acemoglu et al, 2012)
• Path dependency in technological innovation.
• Subsidising ‘clean’ inputs vs ‘dirty’ inputs may shift
technical change on to a different pathway.
• This may involve shifting scientists from working on
dirty technologies to clean ones.
• This may be cheaper in the long run than directly
supporting existing clean technologies.
www.eprg.group.cam.ac.uk
12
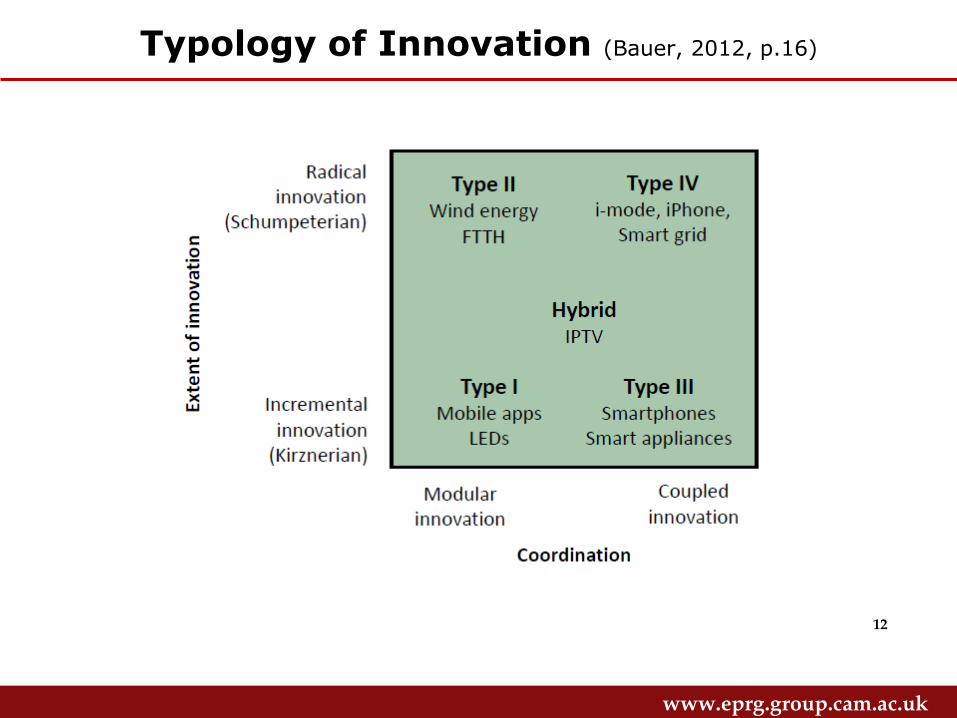
Typology of Innovation (Bauer, 2012, p.16)
www.eprg.group.cam.ac.uk
13
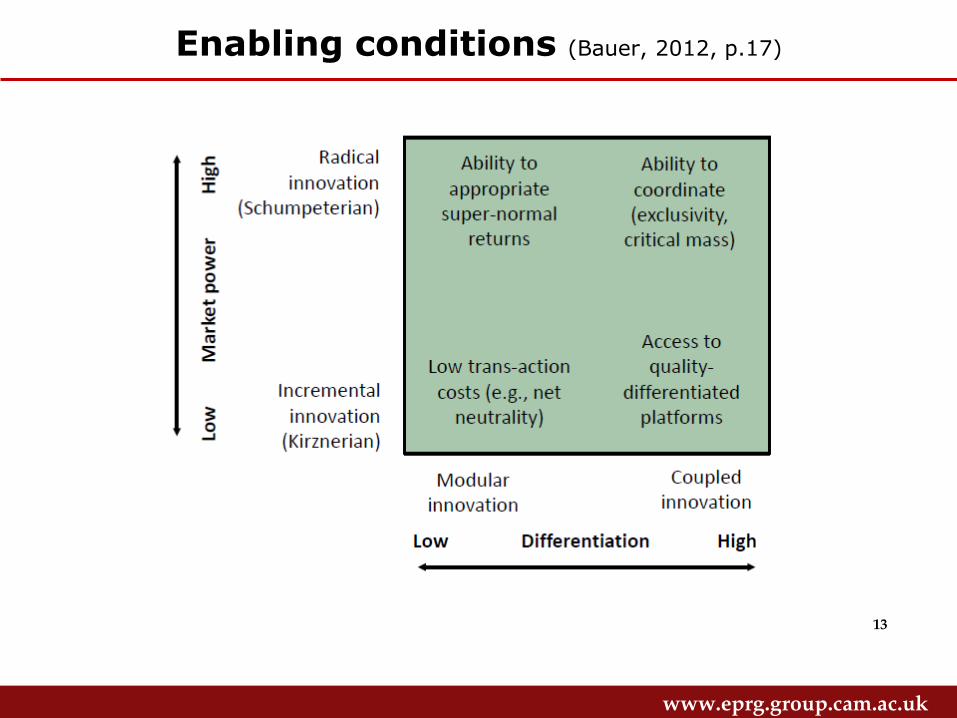
Enabling conditions (Bauer, 2012, p.17)
www.eprg.group.cam.ac.uk
14
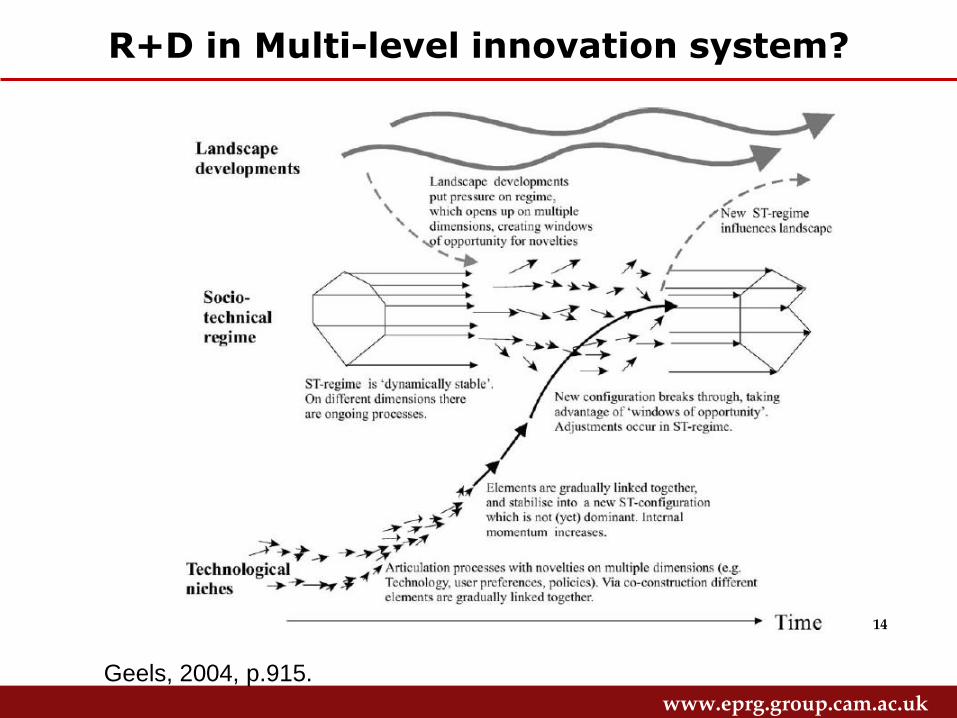
R+D in Multi-level innovation system?
Geels, 2004, p.915.
www.eprg.group.cam.ac.uk
15
Regulation can promote innovation directly
• This relies on induced R+D.
• Examples: CAFÉ standards for US automobiles (of
course don’t quite understand if this is in
comparison with EU) e.g. Lee et al. (2011).
– Clean Air Acts (1970, 1977, 1990)
– National Low Emission Vehicle Program (1997)
• Stringent standards do spur innovation.
www.eprg.group.cam.ac.uk
16
But regulation can limit innovation
• Price regulation seems to limit regulation in the
telecoms sector (Bauer and Shim, 2012).
• Regulation directs innnovation in particular
directions (e.g. renewables).
• This may be away from better sources of
innovation (e.g. tariffs and demand response).
• Government failure is pervasive in energy…
www.eprg.group.cam.ac.uk
17
EMPIRICAL EVIDENCE ON R+D AND ENERGY MARKET REFORM
www.eprg.group.cam.ac.uk
18
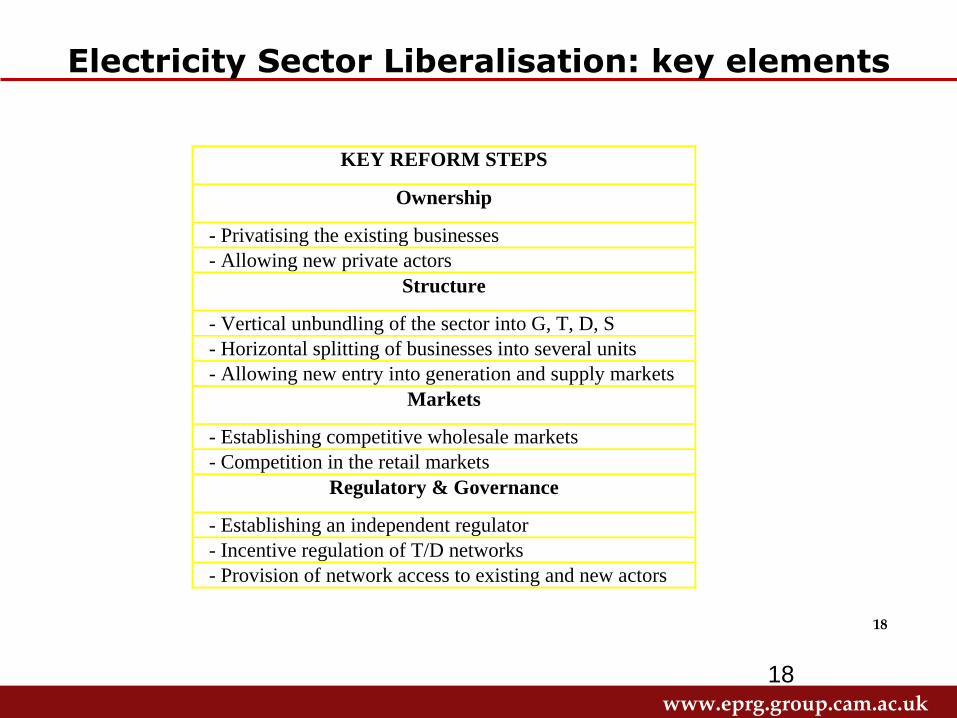
Electricity Sector Liberalisation: key elements
KEY REFORM STEPS
Ownership
- Privatising the existing businesses
- Allowing new private actors
Structure
- Vertical unbundling of the sector into G, T, D, S
- Horizontal splitting of businesses into several units
- Allowing new entry into generation and supply markets
Markets
- Establishing competitive wholesale markets
- Competition in the retail markets
Regulatory & Governance
- Establishing an independent regulator
- Incentive regulation of T/D networks
- Provision of network access to existing and new actors
18
www.eprg.group.cam.ac.uk
19
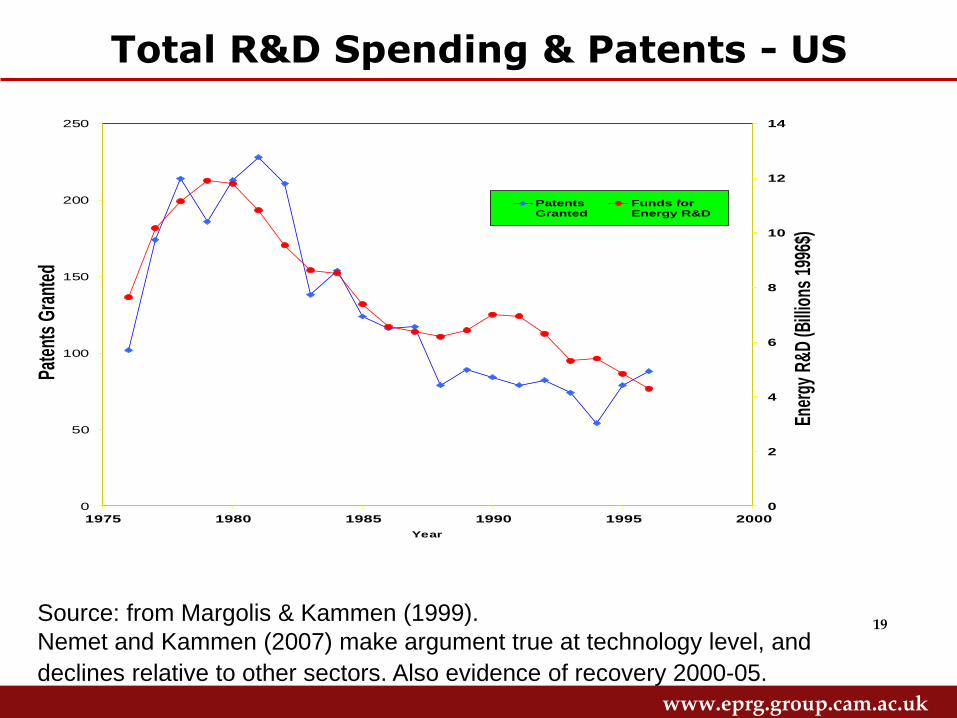
Total R&D Spending & Patents - US
0
2
4
6
8
10
12
14
0
50
100
150
200
250
1975 1980 1985 1990 1995 2000
Ener
gy R
&D
(Bill
ions
199
6$)
Pate
nts
Gra
nted
Year
PatentsGranted
Funds forEnergy R&D
Source: from Margolis & Kammen (1999).
Nemet and Kammen (2007) make argument true at technology level, and
declines relative to other sectors. Also evidence of recovery 2000-05.
www.eprg.group.cam.ac.uk
20
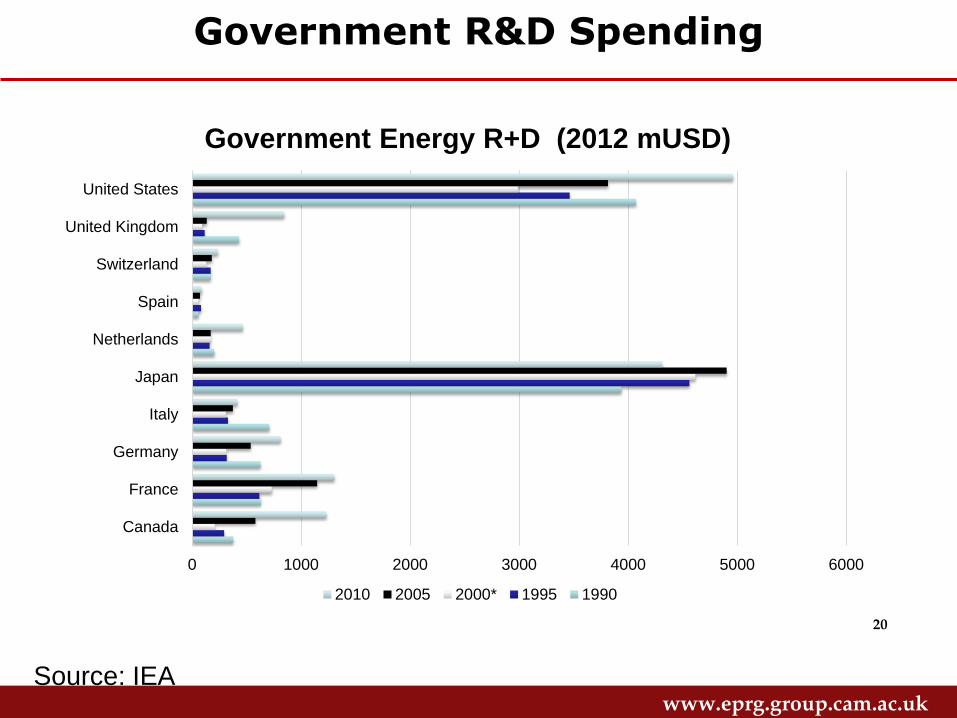
Government R&D Spending
Source: IEA
0 1000 2000 3000 4000 5000 6000
Canada
France
Germany
Italy
Japan
Netherlands
Spain
Switzerland
United Kingdom
United States
Government Energy R+D (2012 mUSD)
2010 2005 2000* 1995 1990
www.eprg.group.cam.ac.uk
21
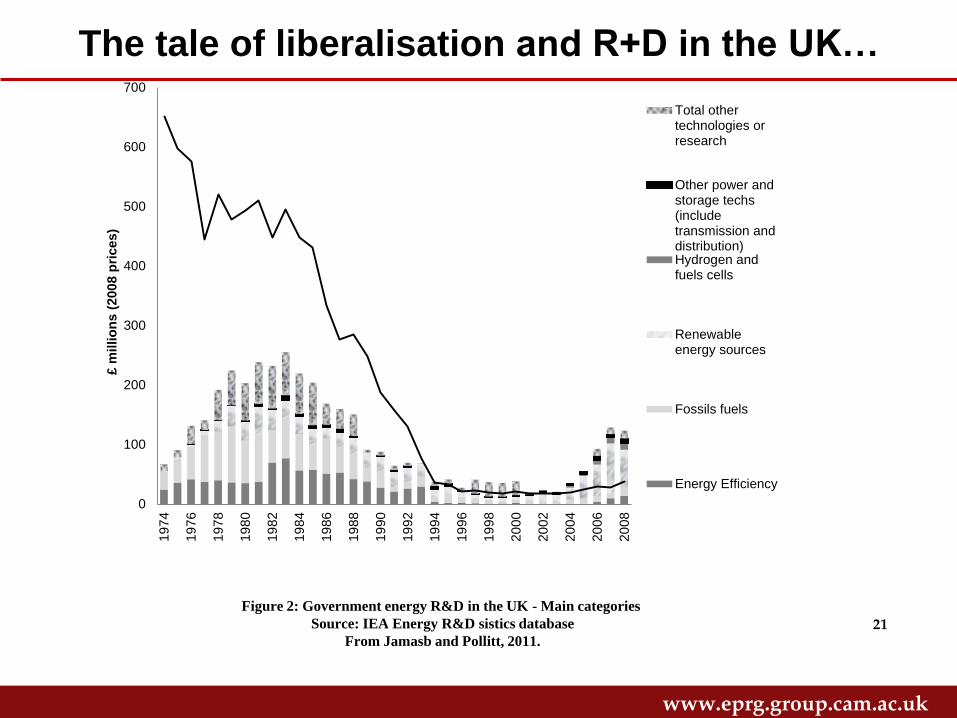
The tale of liberalisation and R+D in the UK…
0
100
200
300
400
500
600
700
19
74
19
76
19
78
19
80
19
82
19
84
19
86
19
88
19
90
19
92
19
94
19
96
19
98
20
00
20
02
20
04
20
06
20
08
£ m
illio
ns (
2008 p
rices)
Total othertechnologies orresearch
Other power andstorage techs(includetransmission anddistribution)Hydrogen andfuels cells
Renewableenergy sources
Fossils fuels
Energy Efficiency
Figure 2: Government energy R&D in the UK - Main categories
Source: IEA Energy R&D sistics database
From Jamasb and Pollitt, 2011.
www.eprg.group.cam.ac.uk
22
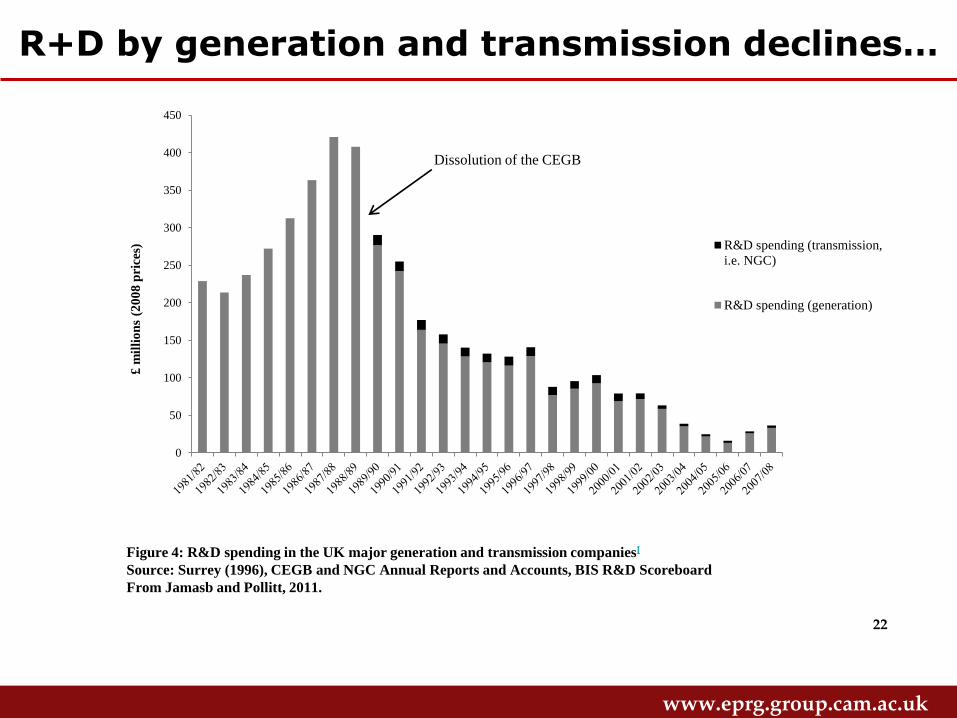
R+D by generation and transmission declines…
0
50
100
150
200
250
300
350
400
450
£ m
illi
on
s (2
00
8 p
rice
s) R&D spending (transmission,
i.e. NGC)
R&D spending (generation)
Dissolution of the CEGB
Figure 4: R&D spending in the UK major generation and transmission companies[
Source: Surrey (1996), CEGB and NGC Annual Reports and Accounts, BIS R&D Scoreboard
From Jamasb and Pollitt, 2011.
www.eprg.group.cam.ac.uk
23
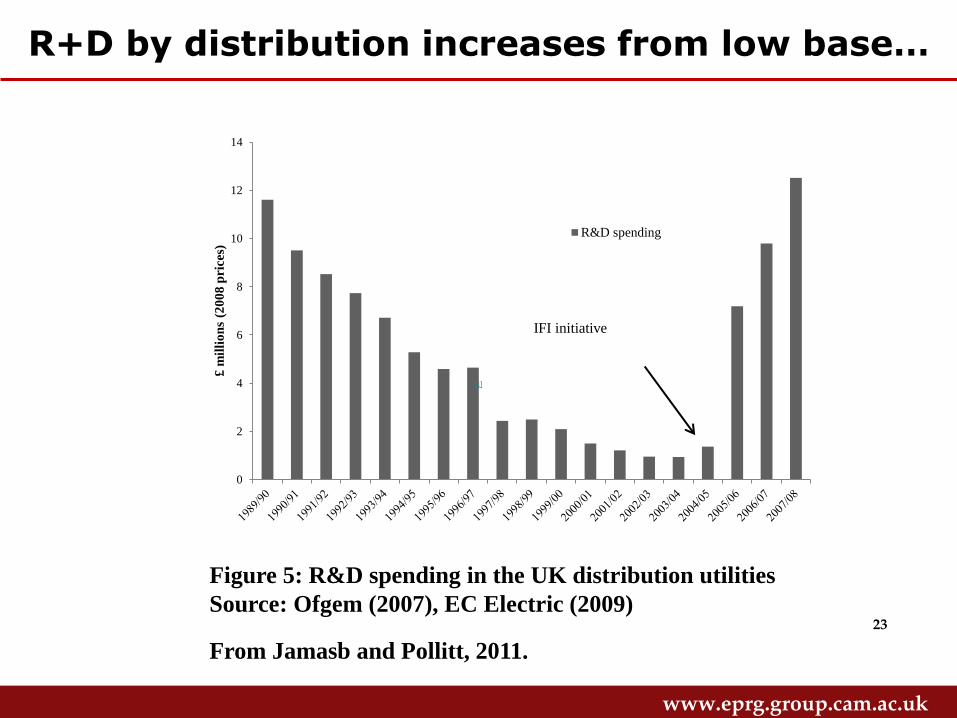
R+D by distribution increases from low base…
0
2
4
6
8
10
12
14
£ m
illi
on
s (2
00
8 p
ric
es)
R&D spending
IFI initiative
[i]
Figure 5: R&D spending in the UK distribution utilities
Source: Ofgem (2007), EC Electric (2009)
From Jamasb and Pollitt, 2011.
www.eprg.group.cam.ac.uk
24
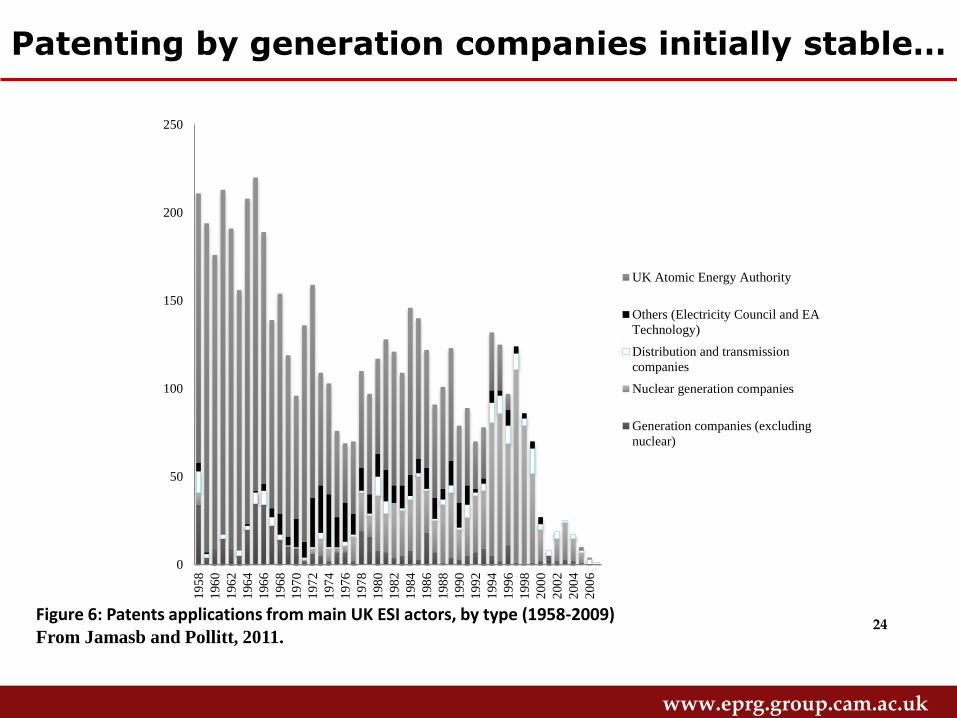
Patenting by generation companies initially stable…
0
50
100
150
200
250
195
8
196
0
196
2
196
4
196
6
196
8
197
0
197
2
197
4
197
6
197
8
198
0
198
2
198
4
198
6
198
8
199
0
199
2
199
4
199
6
199
8
200
0
200
2
200
4
200
6
UK Atomic Energy Authority
Others (Electricity Council and EA
Technology)
Distribution and transmission
companies
Nuclear generation companies
Generation companies (excluding
nuclear)
Figure 6: Patents applications from main UK ESI actors, by type (1958-2009) From Jamasb and Pollitt, 2011.
www.eprg.group.cam.ac.uk
25
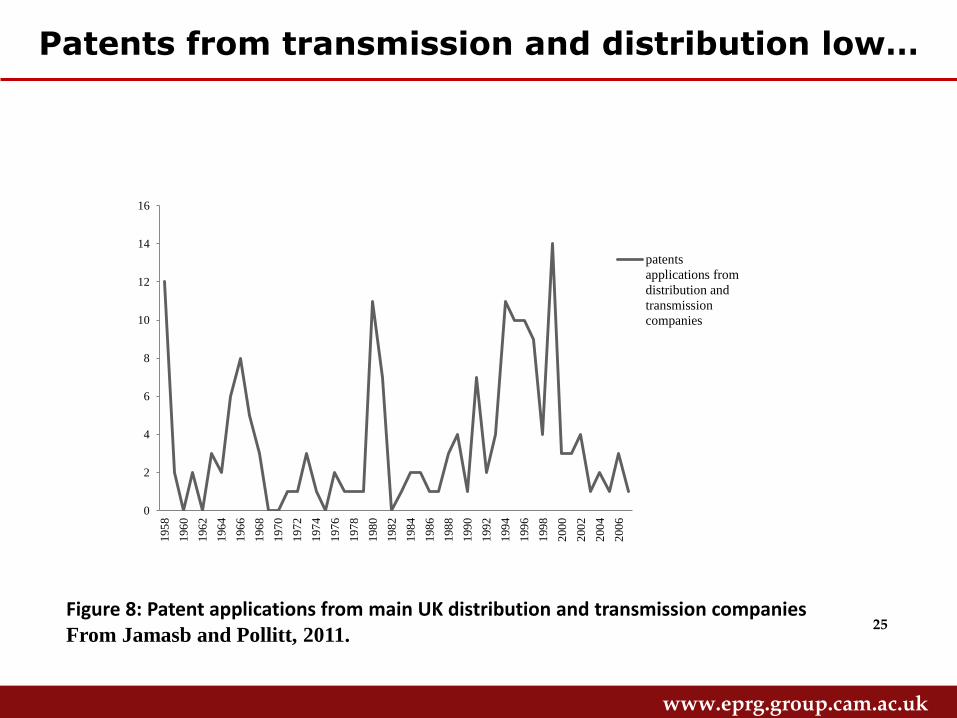
Patents from transmission and distribution low…
0
2
4
6
8
10
12
14
16
195
8
196
0
196
2
196
4
196
6
196
8
197
0
197
2
197
4
197
6
197
8
198
0
198
2
198
4
198
6
198
8
199
0
199
2
199
4
199
6
199
8
200
0
200
2
200
4
200
6
patents
applications from
distribution and
transmission
companies
Figure 8: Patent applications from main UK distribution and transmission companies From Jamasb and Pollitt, 2011.
www.eprg.group.cam.ac.uk
26
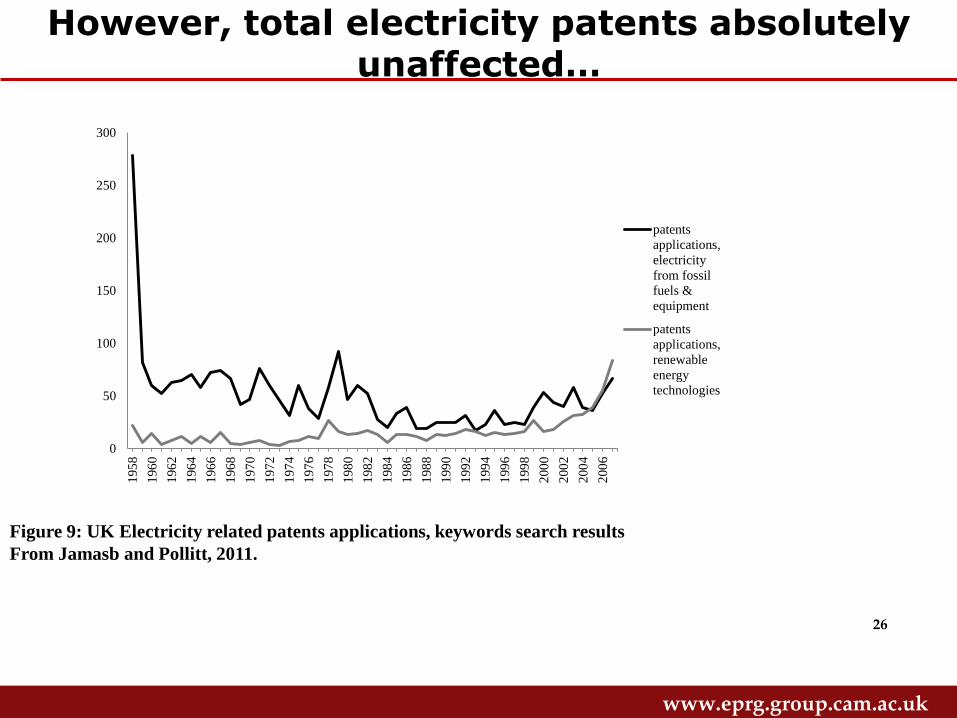
However, total electricity patents absolutely unaffected…
0
50
100
150
200
250
3001
95
8
196
0
196
2
196
4
196
6
196
8
197
0
197
2
197
4
197
6
197
8
198
0
198
2
198
4
198
6
198
8
199
0
199
2
199
4
199
6
199
8
200
0
200
2
200
4
200
6
patents
applications,
electricity
from fossil
fuels &
equipment
patents
applications,
renewable
energy
technologies
Figure 9: UK Electricity related patents applications, keywords search results
From Jamasb and Pollitt, 2011.
www.eprg.group.cam.ac.uk
27
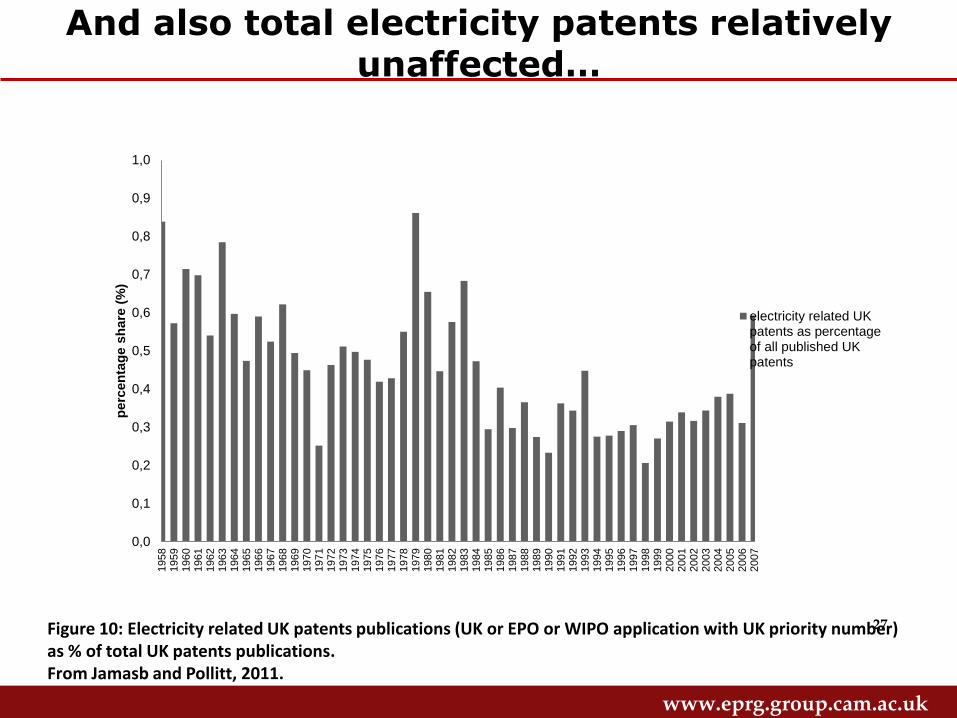
And also total electricity patents relatively unaffected…
0,0
0,1
0,2
0,3
0,4
0,5
0,6
0,7
0,8
0,9
1,01958
1959
1960
1961
1962
1963
1964
1965
1966
1967
1968
1969
1970
1971
1972
1973
1974
1975
1976
1977
1978
1979
1980
1981
1982
1983
1984
1985
1986
1987
1988
1989
1990
1991
1992
1993
1994
1995
1996
1997
1998
1999
2000
2001
2002
2003
2004
2005
2006
2007
perc
en
tag
e s
hare
(%
)
electricity related UKpatents as percentageof all published UKpatents
Figure 10: Electricity related UK patents publications (UK or EPO or WIPO application with UK priority number) as % of total UK patents publications. From Jamasb and Pollitt, 2011.
www.eprg.group.cam.ac.uk
28
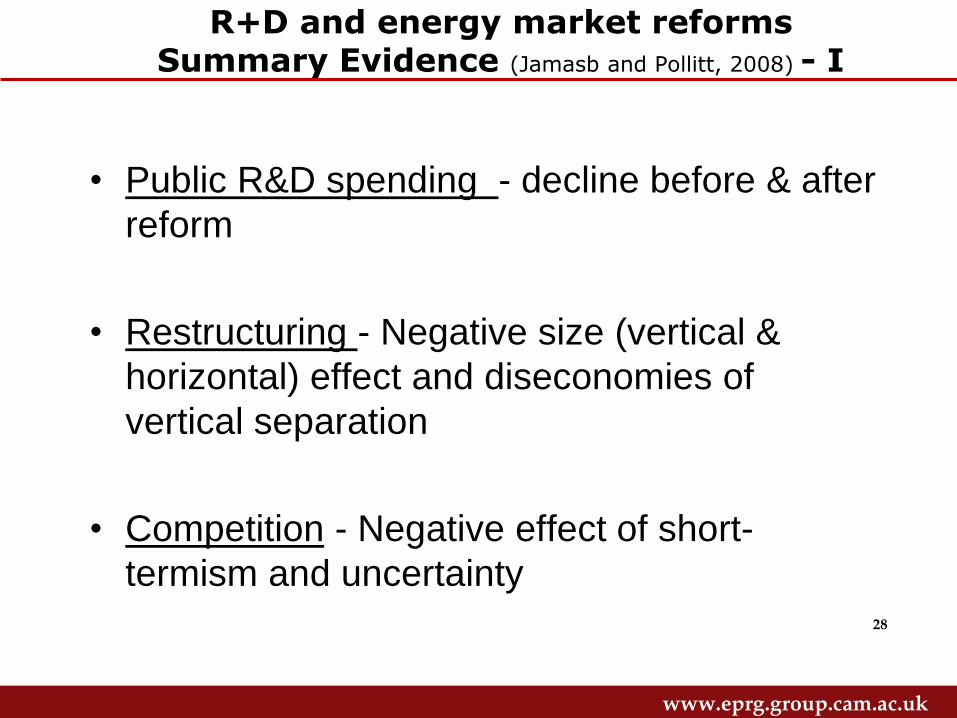
R+D and energy market reforms Summary Evidence (Jamasb and Pollitt, 2008) - I
• Public R&D spending - decline before & after
reform
• Restructuring - Negative size (vertical &
horizontal) effect and diseconomies of
vertical separation
• Competition - Negative effect of short-
termism and uncertainty
www.eprg.group.cam.ac.uk
29
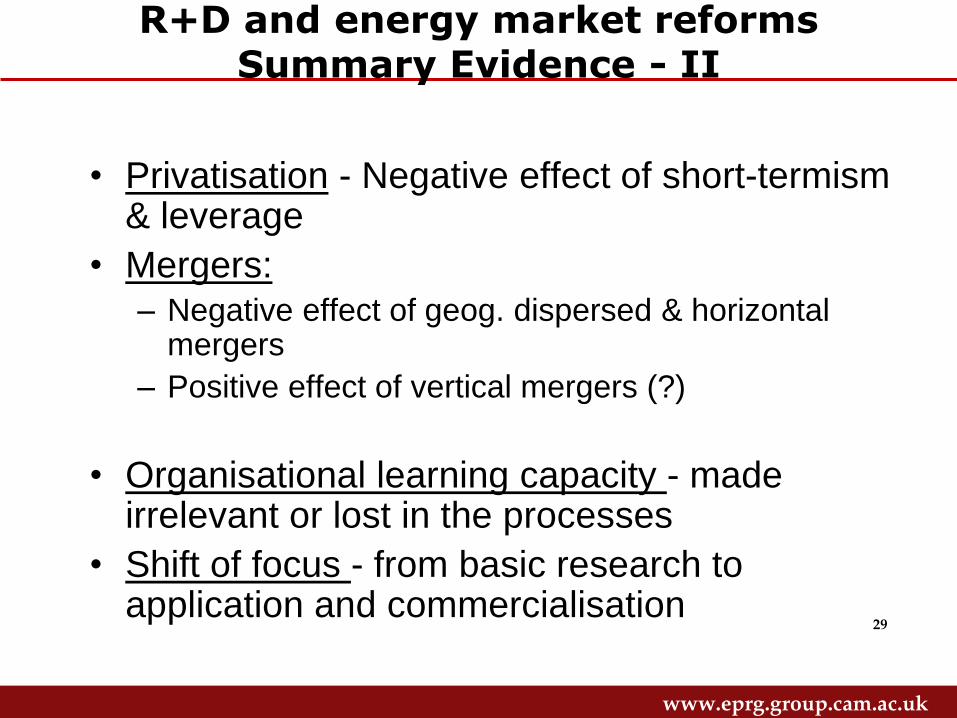
R+D and energy market reforms Summary Evidence - II
• Privatisation - Negative effect of short-termism & leverage
• Mergers: – Negative effect of geog. dispersed & horizontal
mergers
– Positive effect of vertical mergers (?)
• Organisational learning capacity - made irrelevant or lost in the processes
• Shift of focus - from basic research to application and commercialisation
www.eprg.group.cam.ac.uk
30
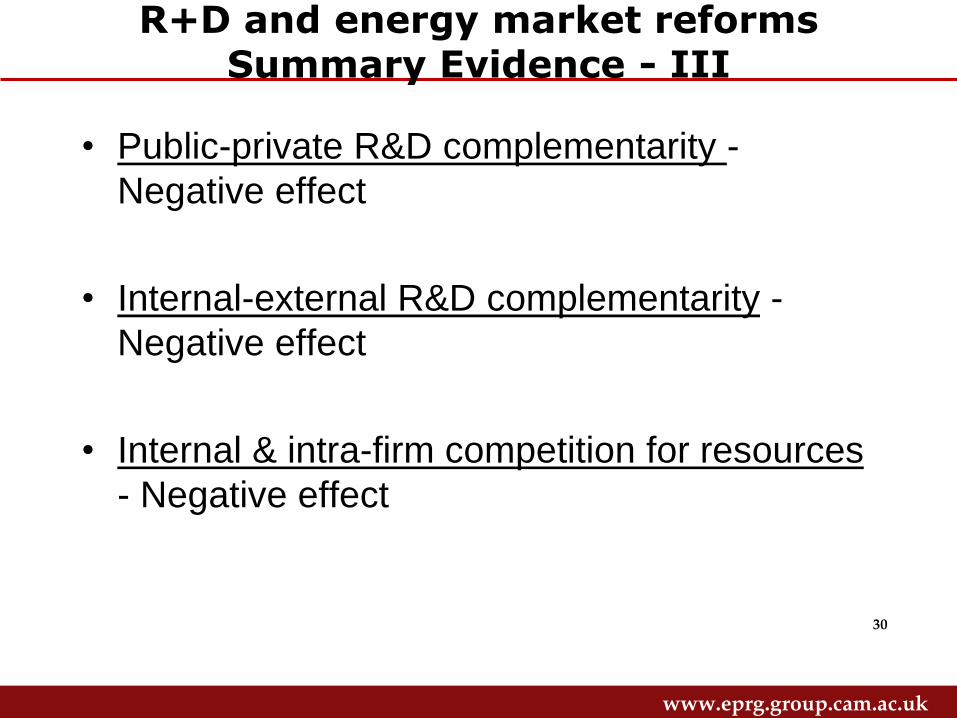
R+D and energy market reforms Summary Evidence - III
• Public-private R&D complementarity -
Negative effect
• Internal-external R&D complementarity -
Negative effect
• Internal & intra-firm competition for resources
- Negative effect
www.eprg.group.cam.ac.uk
31
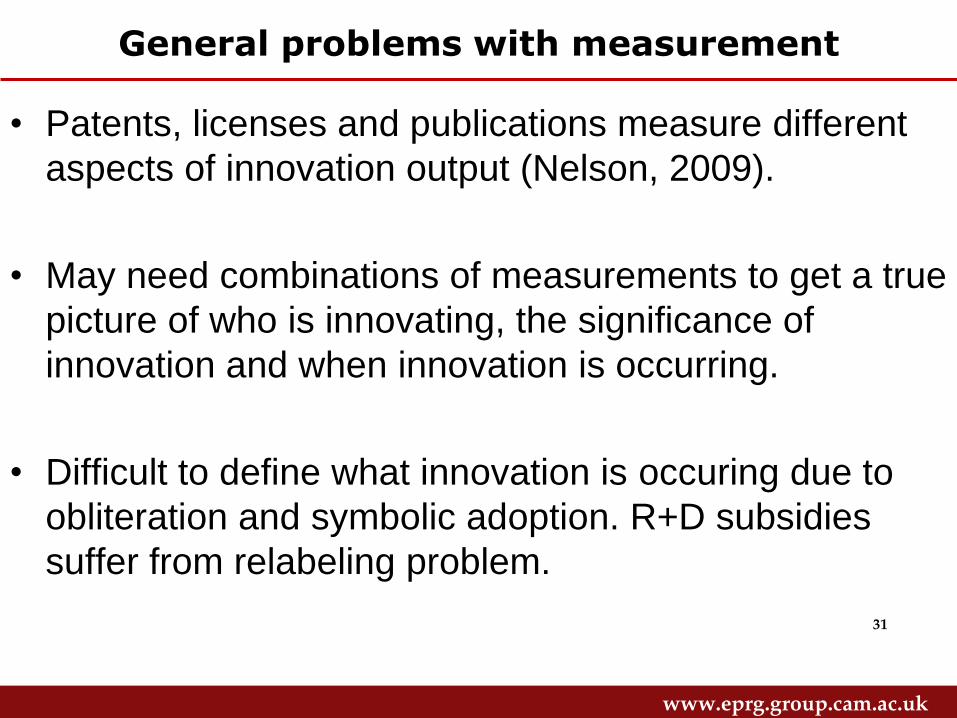
General problems with measurement
• Patents, licenses and publications measure different
aspects of innovation output (Nelson, 2009).
• May need combinations of measurements to get a true
picture of who is innovating, the significance of
innovation and when innovation is occurring.
• Difficult to define what innovation is occuring due to
obliteration and symbolic adoption. R+D subsidies
suffer from relabeling problem.
www.eprg.group.cam.ac.uk
32
HISTORICAL CONTEXT OF ENERGY INNOVATION
www.eprg.group.cam.ac.uk
33
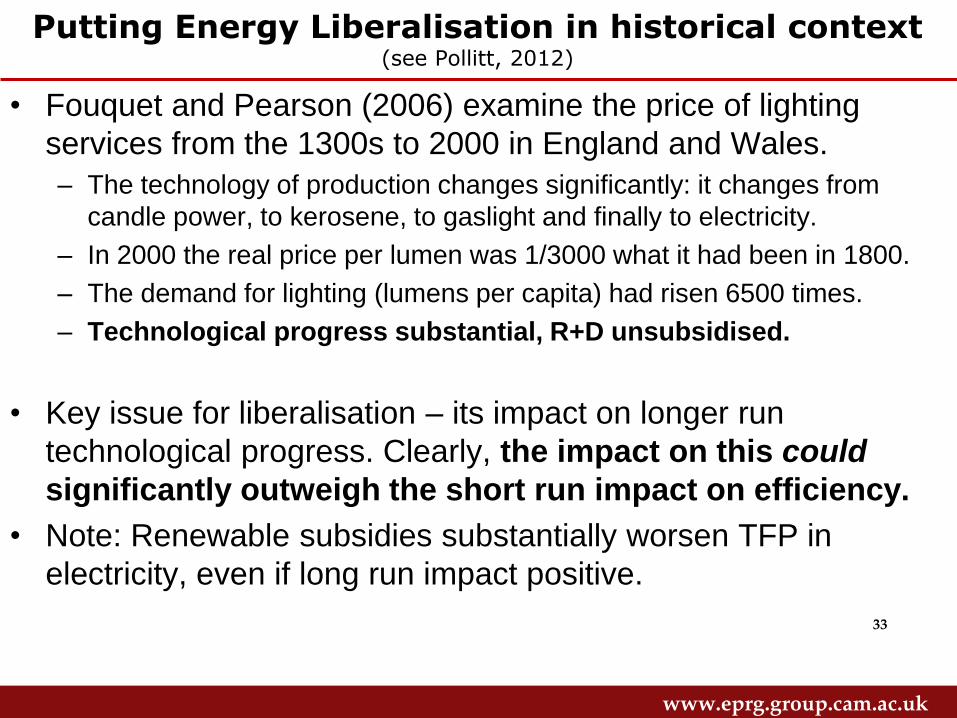
Putting Energy Liberalisation in historical context (see Pollitt, 2012)
• Fouquet and Pearson (2006) examine the price of lighting
services from the 1300s to 2000 in England and Wales.
– The technology of production changes significantly: it changes from
candle power, to kerosene, to gaslight and finally to electricity.
– In 2000 the real price per lumen was 1/3000 what it had been in 1800.
– The demand for lighting (lumens per capita) had risen 6500 times.
– Technological progress substantial, R+D unsubsidised.
• Key issue for liberalisation – its impact on longer run
technological progress. Clearly, the impact on this could
significantly outweigh the short run impact on efficiency.
• Note: Renewable subsidies substantially worsen TFP in
electricity, even if long run impact positive.
www.eprg.group.cam.ac.uk
34
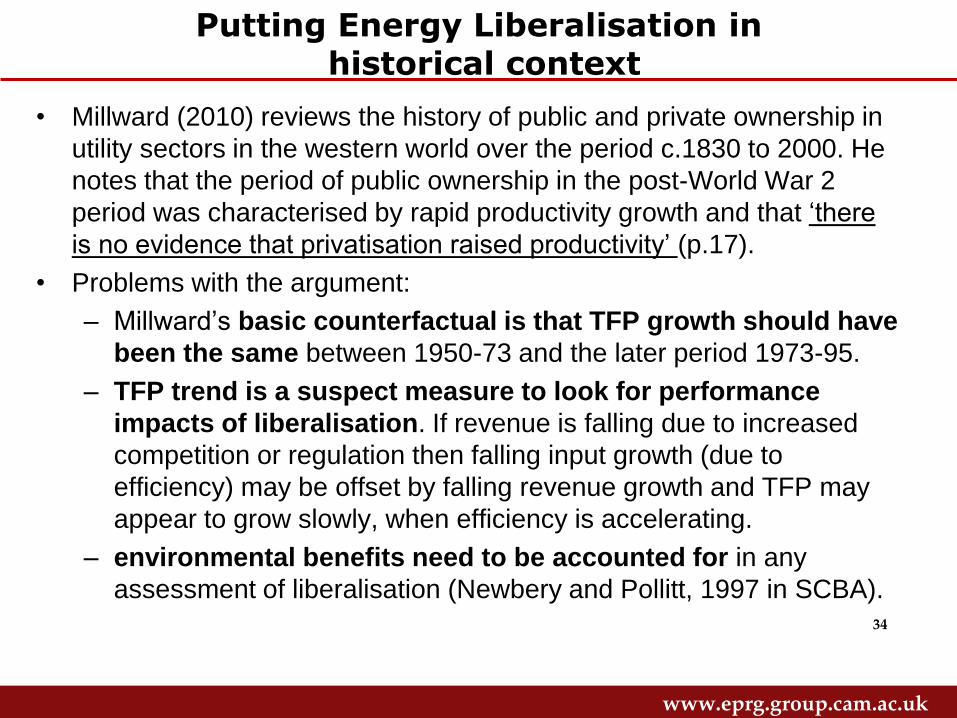
Putting Energy Liberalisation in historical context
• Millward (2010) reviews the history of public and private ownership in
utility sectors in the western world over the period c.1830 to 2000. He
notes that the period of public ownership in the post-World War 2
period was characterised by rapid productivity growth and that ‘there
is no evidence that privatisation raised productivity’ (p.17).
• Problems with the argument:
– Millward’s basic counterfactual is that TFP growth should have
been the same between 1950-73 and the later period 1973-95.
– TFP trend is a suspect measure to look for performance
impacts of liberalisation. If revenue is falling due to increased
competition or regulation then falling input growth (due to
efficiency) may be offset by falling revenue growth and TFP may
appear to grow slowly, when efficiency is accelerating.
– environmental benefits need to be accounted for in any
assessment of liberalisation (Newbery and Pollitt, 1997 in SCBA).

www.eprg.group.cam.ac.uk
35
WHAT TO DO ABOUT SUPPORTING ENERGY R+D?
www.eprg.group.cam.ac.uk
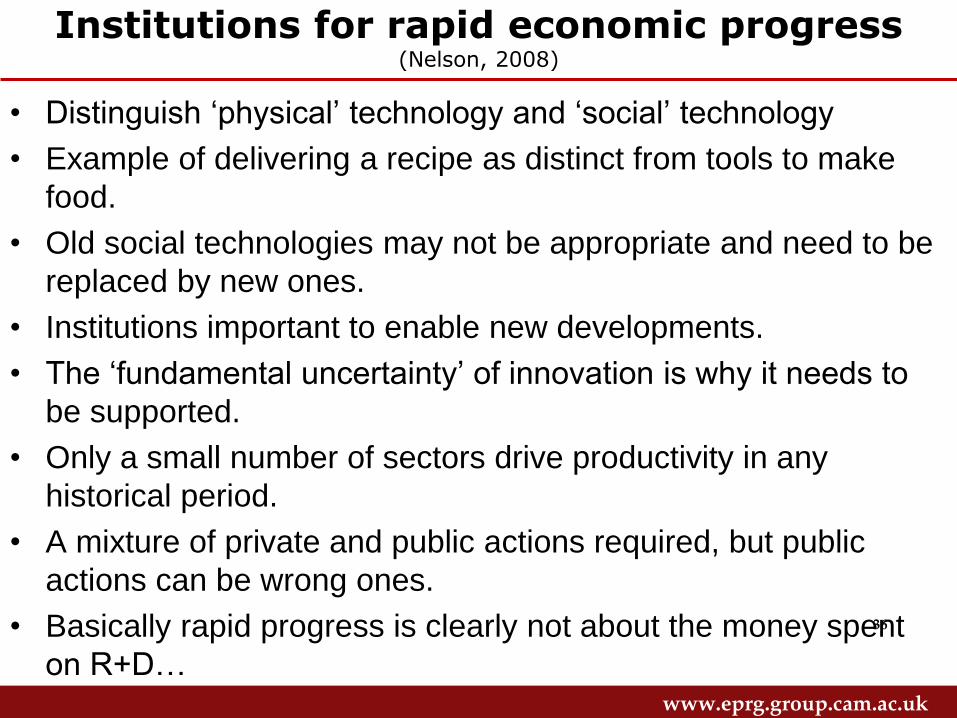
36
Institutions for rapid economic progress (Nelson, 2008)
• Distinguish ‘physical’ technology and ‘social’ technology
• Example of delivering a recipe as distinct from tools to make
food.
• Old social technologies may not be appropriate and need to be
replaced by new ones.
• Institutions important to enable new developments.
• The ‘fundamental uncertainty’ of innovation is why it needs to
be supported.
• Only a small number of sectors drive productivity in any
historical period.
• A mixture of private and public actions required, but public
actions can be wrong ones.
• Basically rapid progress is clearly not about the money spent
on R+D…
www.eprg.group.cam.ac.uk
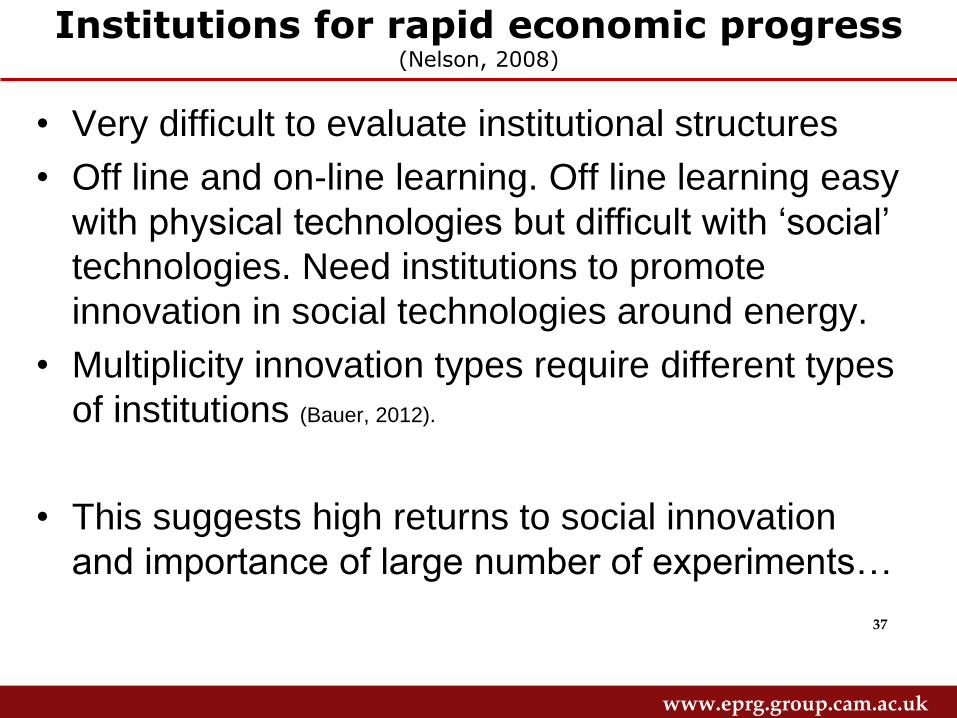
37
Institutions for rapid economic progress (Nelson, 2008)
• Very difficult to evaluate institutional structures
• Off line and on-line learning. Off line learning easy
with physical technologies but difficult with ‘social’
technologies. Need institutions to promote
innovation in social technologies around energy.
• Multiplicity innovation types require different types
of institutions (Bauer, 2012).
• This suggests high returns to social innovation
and importance of large number of experiments…
www.eprg.group.cam.ac.uk
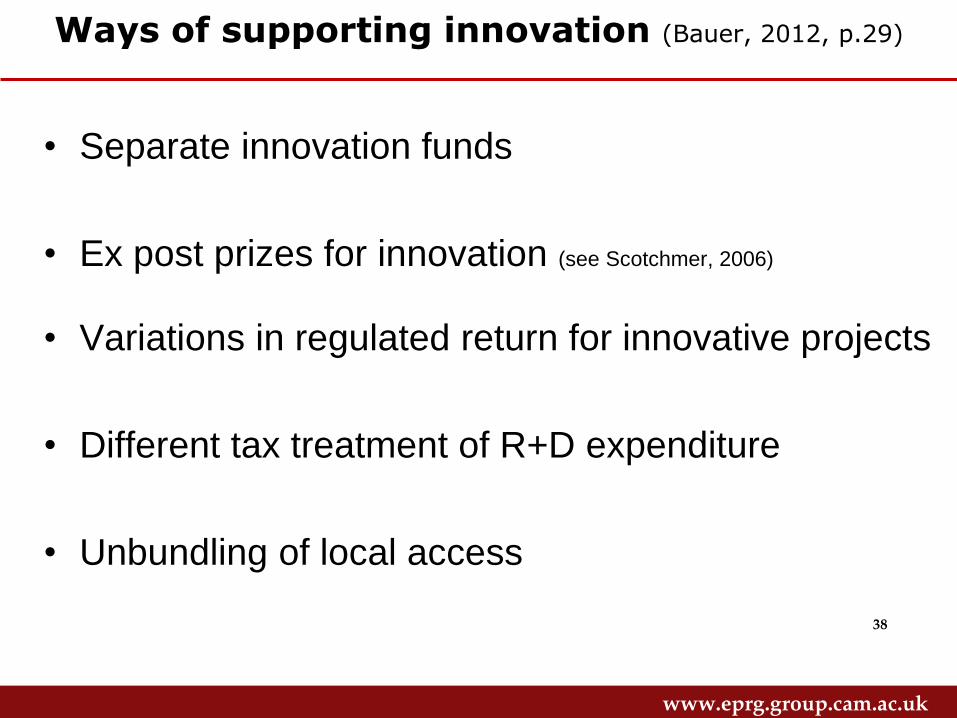
38
Ways of supporting innovation (Bauer, 2012, p.29)
• Separate innovation funds
• Ex post prizes for innovation (see Scotchmer, 2006)
• Variations in regulated return for innovative projects
• Different tax treatment of R+D expenditure
• Unbundling of local access
www.eprg.group.cam.ac.uk
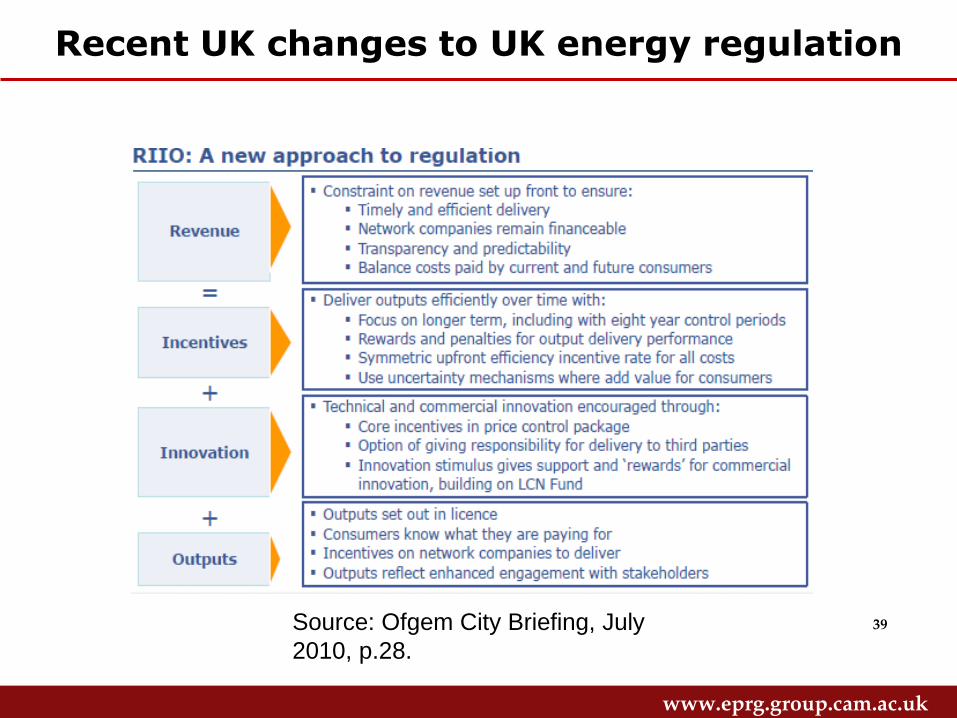
39
Recent UK changes to UK energy regulation
Source: Ofgem City Briefing, July
2010, p.28.
www.eprg.group.cam.ac.uk
40
Institution for social innovation: Low carbon networks fund
• 2010-2015 price control
• ‘up to £500m to support projects sponsored by the Distribution
Network Operators (DNOs) to try out new technology, operating
and commercial arrangements’
• ‘The aim of the projects is to help all DNOs understand how they
can provide security of supply at value for money as Britain moves
to a low carbon economy.’
• First Tier allows DNOs to recover a proportion of expenditure
incurred on small scale projects.
• Second Tier annual competition evaluated by panel of experts of up
to £64 million to help fund a small number of flagship projects.
• We will be monitoring the learning that emerges from these
projects in order to understand its impact on the current regulatory
framework.
www.eprg.group.cam.ac.uk
41
Low carbon networks fund effects
• Setting up of ‘Future Networks’ units
• Collaborative Tier 2 projects, including suppliers,
academics, OEMs and software solutions providers.
• Examples:
– Low Carbon London
• http://innovation.ukpowernetworks.co.uk/innovation/en/Projects/ti
er-2-projects/Low-Carbon-London-%28LCL%29/
– Customer Led Network Revolution
• http://www.networkrevolution.co.uk/
– Flexible Plug and Play
• http://innovation.ukpowernetworks.co.uk/innovation/en/Projects/ti
er-2-projects/Flexible-Plug-and-Play-%28FPP%29/

www.eprg.group.cam.ac.uk
42
CONCLUSIONS AND FUTURE DIRECTIONS FOR RESEARCH
www.eprg.group.cam.ac.uk
43
Concluding thoughts
• Directed technical change is important and subsidised
R+D is one way to achieve this.
• R+D in energy did decline, but partly recovered,
however this in itself is not the issue.
• R+D in energy does, probably, require support in the
face of price regulation and unbundling.
• R+D in energy needs to pay attention to ‘social
technology’ given relative innovation in Mbits vs MWhs
and path dependency of existing systems.
• In economics, it is never about the size of subsidy.
www.eprg.group.cam.ac.uk
44
Innovation in what?
• In governance and payment arrangements in
energy?
• In the use of information from smart grids and
smart meters?
• In policy making in the face of rising complexity of
regulatory decision making.
www.eprg.group.cam.ac.uk
45
Some social science research gaps on energy R+D?
• Measurement of innovative outputs in energy, and link
between innovation and productivity.
• Identification of institutions of energy R+D appropriate
to particular countries.
• Promotion of innovation collaboration and competition
at same time between energy companies across
supply chain.
• In the EU, how best to coordinate public energy R+D
across countries.
• How energy R+D subsidies distort overall R+D and
the co-benefits of subsidised R+D for society?
• Distribution of payments for energy R+D.

www.eprg.group.cam.ac.uk
46
Bibliography
• Acemoglu, D., Aghion, P., Bursztyn, L. and Hemous, D. (2012), ‘The Environment and Directed Technical Change’, American Economic Review, 102 (1): 131-166.
• Bauer, J.M. (2012), Designing Regulation to Support Innovation: Experiences and Future Challenges, CRNI Conference November 30, 2012.
• Bauer, J.M. and Shim, W. (2012), Regulation and Innovation in Telecommunications, Quello Center Working Paper 01-2012.
• Cohen, L.R. and Noll, R.G. (1971), The Technology Pork Barrel, Washington D.C.: Brookings Institute.
• Fouquet, R. and Pearson, P.J.G. (2006), Seven Centuries of Energy Services: The Price and Use of Light in the United Kingdom (1300-2000), Energy Journal, 27(1):139-177.
• Geels, F.W. (2004), ‘From sectoral systems of innovation to socio-technical systems: Insights about dynamics and change from sociology and institutional theory’, Research Policy, 33 (6-7) : 897-920.
• Green, R. (1994), ‘The Cost of Nuclear Power Compared with Alternaties to the Magnox Programme’, Oxford Economic Papers, Vol. 47, No. 3 (Jul., 1995), pp. 513-524.
• Grubb, M., Jamasb, T. and Pollitt, M. (2008) (eds.), Delivering a Low Carbon Electricity System, Cambridge: CUP.
• Henderson, P.D. (1977), ‘Two British Errors: Their Probable Size and Some Possible Lessons’, Oxford Economic Papers, Vol. 29, No. 2 (Jul., 1977), pp. 159-205.
• Jamasb, T. and Kohler, J. (2008), ‘Learning Curves for energy technologies: a critical assessment’, in Grubb et al., pp.314-332.
• Jamasb, T.J. and Pollitt, M.G. (2008), ‘Liberalisation and R&D in Network Industries: The Case of the Electricity Industry’, Research Policy 37 (6-7), pp.995-1008.
• Jamasb, T. and Pollitt, M. (2011), ‘Electricity Sector Liberalisation and Innovation: An Analysis of the UK Patenting Activities’, Research Policy, Vol.40, No.2, pp.309-324.
• Kauffman, S.A. (1993), The Origins of Order: Self Organization and Selection in Evolution, New York: Oxford University Press.
• Lee, J., Veloso, F.M., Hounshell, D.A. (2011), ‘Linking induced technological change and environmental regulation: Evidence from patenting in the U.S. auto industry’, Research Policy, 40: 1240-1252.
• Margolis, R.M. and Kammen, D.M. (1999), ‘Underinvestment: The Energy Technology and R+D policy challenge’, Science, Vol.285, 30 July, pp.690-2.
• Millward, R. (2010), Public Enterprise in the Modern Western World: An Historical Analysis, Milan European Economy Workshop, University of Milan, Italy, Working Paper 2010-26.
• Nelson, A.J. (2009), ‘Measuring knowledge spillovers: What patents, licenses and publications reveal about innovation’, Research Policy, 38: 994-1005.
• Nelson, R.R. (2008), ‘What enables rapid economic progress: What are the needed institutions?’, Research Policy, 37: 1-11.
• Nemet, G.F. and Kammen, D.M. (2007), ‘U.S. energy research and development: Declining investment, increasing need, and the feasibility of expansion’, Energy Policy, 35(1): 746-755.
• Newbery, D. and Pollitt, M. (1997), ‘Restructuring and Privatisation of the CEGB: was it worth it?’, Journal of Industrial Economics, Vol.45(3): 269-304.
• Pollitt, M. (2012), ‘The Role of Policy in Energy Transitions: Lessons from the Energy Liberalisation Era’, Energy Policy, 50, Nov: 128-137.
• Scotchmer, S. (2006), Innovation and Incentives, Cambridge MA: MIT Press.