Embed Size (px)
Citation preview

Metrorail and Metrobus: Planning for the FuturePlanning for the Future
Presented to the Virginia General AssemblyVirginia General AssemblySJ 122 Study Committee
bybyTom Harrington, Director of Long Range PlanningWashington Metropolitan Area Transit Authority
December 4, 2008
BackgroundBackground
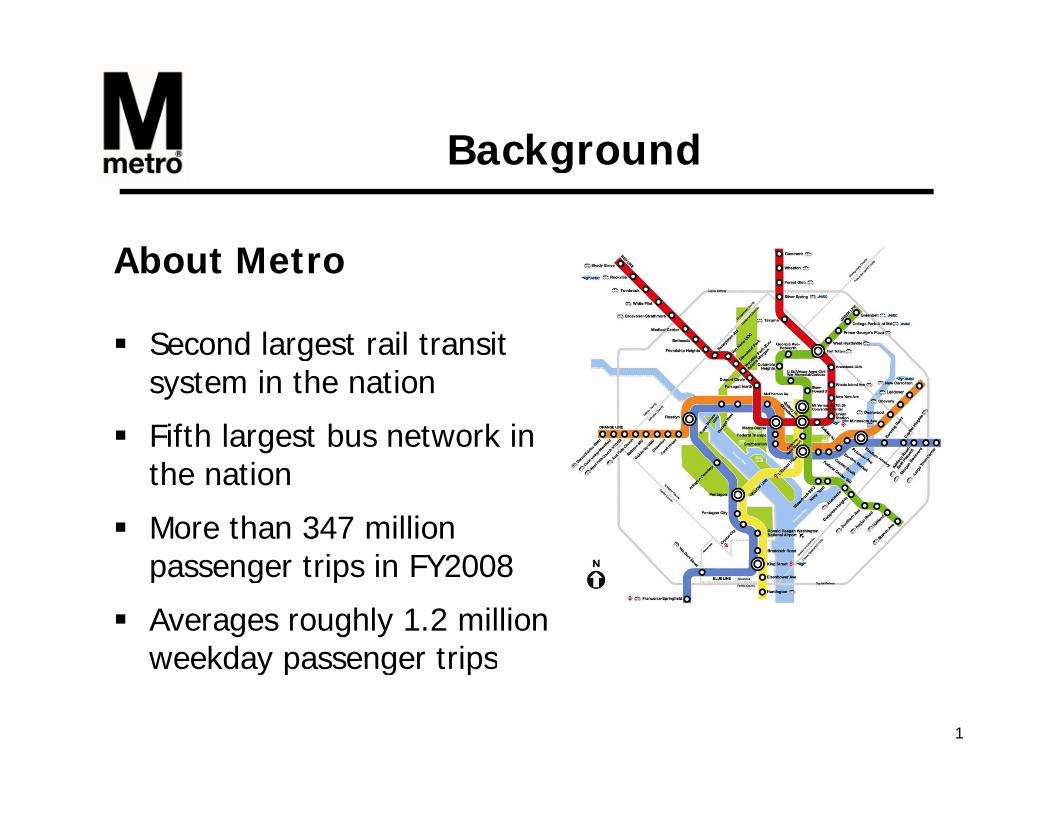
About MetroAbout Metro
Second largest rail transit gsystem in the nation
Fifth largest bus network in the nation
More than 347 million passenger trips in FY2008passenger trips in FY2008
Averages roughly 1.2 million weekday passenger trips
1
weekday passenger trips

WMATA Compact Jurisdictionsp
• Metro serves a• Metro serves a geographic area covering 1,500 square miles and severalmiles and several political jurisdictions
• Service area population f 3 5 illiof over 3.5 million
• Metro has no dedicated source of funding; g;funding comes from a variety of federal, state and local sources.
2

Metrorail Ridership by Jurisdiction of Residenceby Jurisdiction of Residence
Weekday Trips
May2007
Percent of System Total
System Total 717,800 100.0%
Compact Jurisdictions 633,100 88.2%
District of Columbia 192,500 27%Maryland Compact 249,900 35%y p ,
Virginia Compact 190,700 27%
Other Regional Areas 57,700 8%
Oth M l d 38 500 5%Other Maryland 38,500 5%
Other Virginia 19,300 3%
Outside the Region 27,000 4%
3

Ridership Growth Trends
Average Weekly Daily Ridership
MetroRail
800
1,000
Average Weekly Daily Ridership
22% Growth Projected 2010 - 2020
MetroBus
400
600
(1,0
00s)
9 % Growth Projected 2010 - 2020
-
200
2000 2010 2020
• Metrorail ridership is expected to grow from about 800,000 trips daily in 2008 to about 950,000 in 2020.
• Metrobus ridership is expected to grow from about 475,000 trips daily in 2008 to about 550,000 in 2020.

Metro Planning Approach g pp
Maximize capacity of existing p y gsystem
Balance system maintenance needs with system expansionneeds with system expansion
Develop an integrated, multimodal transit system:
M t b (L l)– Metrobus (Local)– MetroExtra (Rapid) – Bus Rapid Transit (BRT)Bus Rapid Transit (BRT)– Light Rail / Streetcar– Metrorail
5
– Commuter Rail

Rail System Capacity
If we do not expand the fleet after 2009:
y p y
Line 2005 2010 2015 2020 2025 2030RedBlue (Rosslyn)
p
Blue (Rosslyn)Orange/Dulles RailYellow/Blue (14th Bridge)GreenGreen
If we expand the fleet for 100% 8‐car train service:Line 2005 2010 2015 2020 2025 2030
Congested (<100 people per car) Highly Congested (100-120 people car)
RedBlue (Rosslyn)Orange/Dulles Rail
6
Highly Congested (100 120 people car) Exceeds Capacity (> 120 people per ca
gYellow/Blue (14th Bridge)Green

System Capacity ChallengesSystem Capacity Challenges
Deployment of 8-car trains will likely handle systemDeployment of 8 car trains will likely handle system capacity needs thru 2025
Highest priority stations for capacity improvement are largely in the Core
System extensions require expansion of core capacitycapacity
7

Station Access Challenges
• Demand for parking will likely continue to outpace
Station Access Challenges
• Demand for parking will likely continue to outpace WMATA’s ability to provide it - at least 36,000 station parking spaces would need to be added by 2030
• Parking could be provided by both WMATA and the private sector, AND/OR• Intensified transit-oriented development at• Intensified, transit oriented development at
stations could reduce the demand for parking• Satellite parking served by frequent, feeder bus
may prove to be most cost effective way to servemay prove to be most cost-effective way to serve outer suburbs
8

Maintaining System PerformanceMaintaining System Performance
Bus mid‐life rehab & replacements
Railcar rehab & replacement
Rail system rehab
Rehab rail maintenance Replace obsolete bus IT Software security and
6
Rehab rail maintenance facilities
Replace obsolete bus garages
IT – Software, security and data centers
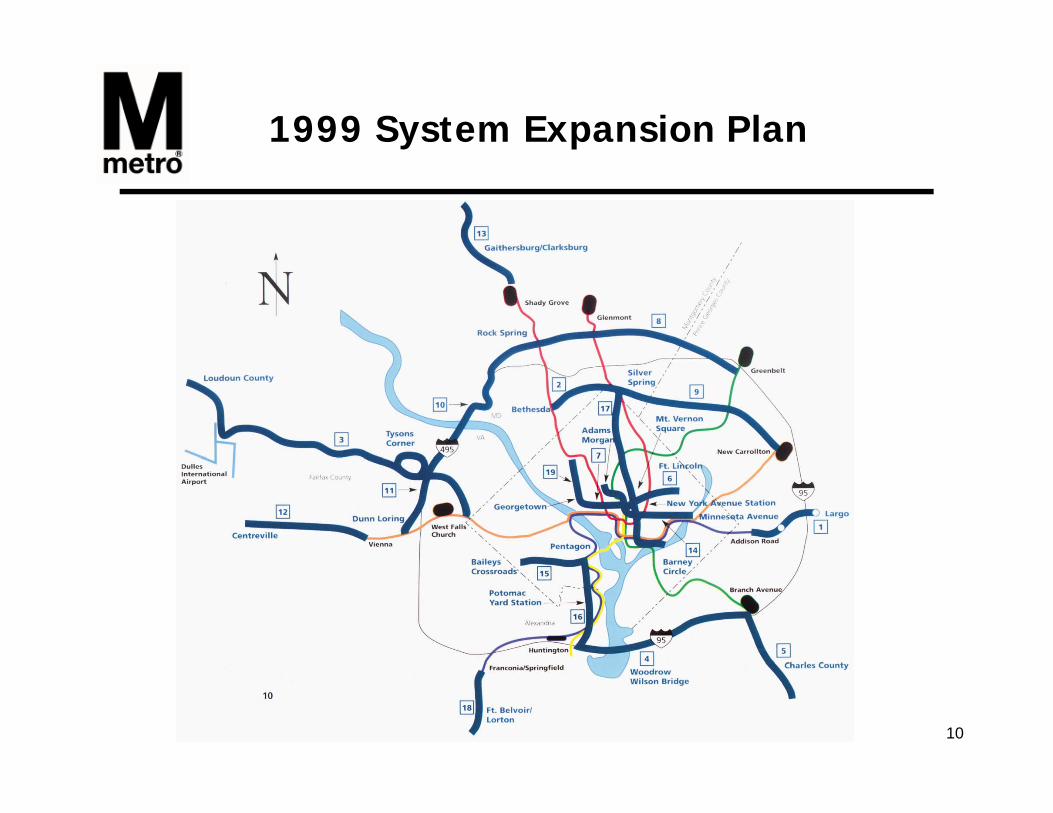
1999 System Expansion Plan
10

Dulles Corridor Extension
11

Options for Serving the I-95 d I 66 C id
• Potential options:
and I-66 Corridors
• Potential options:• Metrorail Extensions of Orange, Blue, or Yellow lines• VRE Expansion – add additional tracks or spurs
LRT / BRT C ti t Vi F i S i fi ld• LRT / BRT Connections to Vienna, Franconia-Springfield, or Huntington
• I-95 HOV/HOT lanes – express bus Considerations:• Considerations:• Capital and operating costs• Funding sources, especially federal funds• Support for land use• Travel time savings• Travel markets
12

Fort Belvoir Fixed Guideway T it St dTransit Study
Connect Franconia Connect Franconia-Springfield Metro with growing Ft. Belvoir center and EPGand EPG
Alternative Alignment Options Heavy Rail Extension (4.5
miles 2 stations)miles, 2 stations) Light Rail Transit (7.4 miles,
8 stations)HOV R f I 95 t HOV Ramps from I-95 to Fairfax County Pkwy
$400-500 Million cost estimate (2005 $)
13
estimate (2005 $)
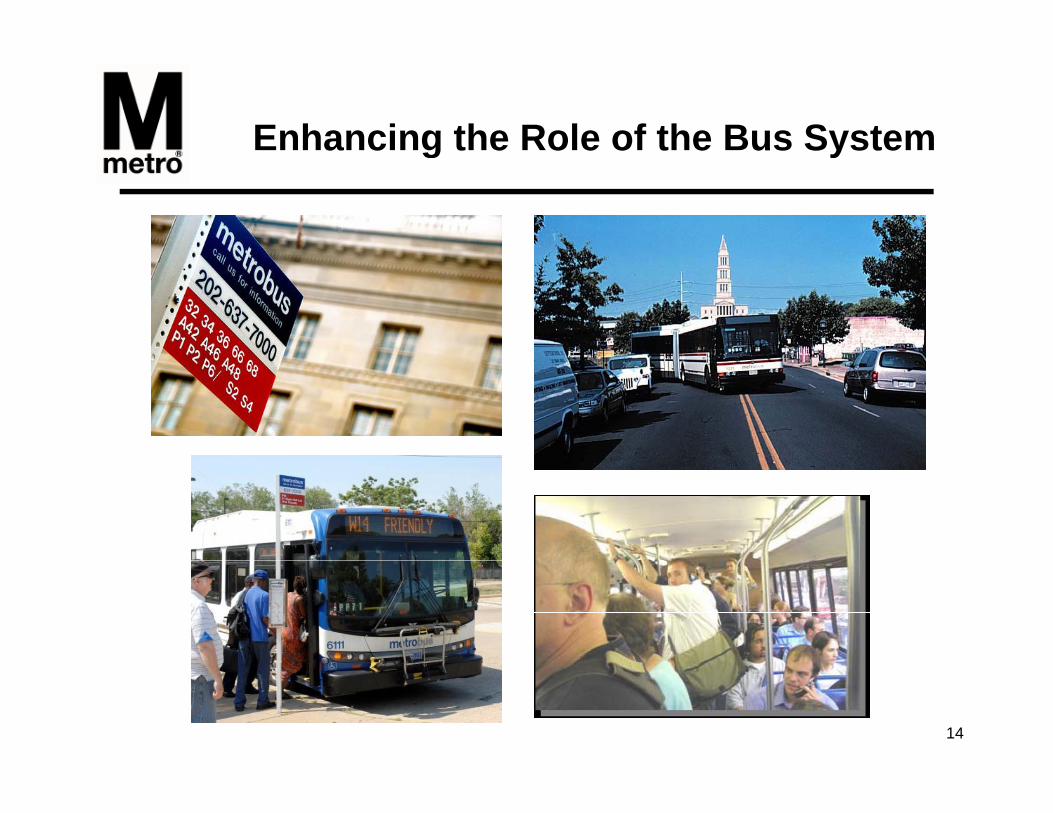
Enhancing the Role of the Bus Systema c g t e o e o t e us Syste
14

Metrobus Priority Corridor Network Planet obus o ty Co do et o a
1. Columbia Pike (Pike Ride)
2. Richmond Highway Express (REX)
3. Georgia Ave./7th St.
4. Crystal City–Potomac Yard
5. Southern Ave. Metro – National Harbor
6. Wisconsin Ave./Pennsylvania Ave.
7. University Blvd./East-West Highwayy g y
8. Sixteenth St. (DC)
9. Leesburg Pike
10. Veirs Mill Rd.
11. New Hampshire Ave.
12 H St /Benning Rd12. H St./Benning Rd.
13. Georgia Ave. (MD)
14. Greenbelt-Twinbrook
15. East-West Highway (Prince George’s)
16. Anacostia-Congress Heights
1 i l i k / k S17. Little River Tpke./Duke St.
18. Rhode Island Ave. Metro to Laurel
19. Mass Ave./U St./Florida Ave./8th St./MLK Ave.
20. Rhode Island Ave.
21. Eastover-Addison Road Metro
22. Colesville Rd./Columbia Pike - MD US 29
23. Fourteenth St. (DC)
24. North Capitol St.
15

What is a Priority Corridor?y
16

What is Meant by “D di t d” “P i iti d” Ri ht f W ?“Dedicated” or “Prioritized” Right-of-Way?
17

Practical Challenges to Confrontact ca C a e ges to Co o t
C it l f di f b Capital funding for buses, garages, and other facilities
Operating funds for increased serviceOperating funds for increased service
Define situations that justify transit prioritization and tools highway p g ydepartments will use
Change perceptions and culture– Bus network an equal partner to rail network – Net benefits of prioritizing transit widely understood– Drivers today seeing themselves using faster transit tomorrow– Road owners as transit providers too
18
Road owners as transit providers too – Person throughput, not vehicle throughput

Capital Improvement Needs:FY 2011 – FY 2020
Customer Focus
FY 2011 FY 2020
Metro’s total capital
Performance Focus
$700 Million (6%)
Metro s total capital needs for FY 2011- FY 2020 are $11.3 billion,
hl $1 1 billi $7,130 Million(63%)
Demand Focus$3,500 Million
or roughly $1.1 billion per year
(31%)
Capital Needs in 2008 dollars: $9 2 billionCapital Needs in 2008 dollars: $9.2 billion
19

Metro’s Next Steps for FundingMetro s Next Steps for Funding
Prioritize Metro’s capital dneeds
Work with federal and jurisdiction partners tojurisdiction partners to secure dedicated funding
‐ Enact dedicated funding l i l ti i h j i di tilegislation in each jurisdiction
‐ Coordinate efforts of jurisdiction partners to amend the Compactthe Compact
‐ Secure federal appropriations
20

For more information…
www.wmata.com
21
About Metro / Planning & Development