Embed Size (px)
Citation preview
Presented to:
By:
Date:
International Aircraft Systems Fire Protection Forum
Matthew E. Karp
May 14, 2019
Methods for Characterizing Theatrical
Smoke for Smoke Detection Certification

Overview
– Section 1 Background
– Section 2 Methods and test equipment
– Section 3 Potential parameters
– Section 4 Simulating smoldering fires
– Section 5 Recommendations
– Section 6 Future testing
2
Test Apparatus
Section 1
Background
• Federal Aviation Administration (FAA) regulations require that a commercial
aircraft cargo compartment smoke detection system must provide visual
indication to the flight crew within one minute after the start of a fire 1.
• Further FAA guidance states that the smoke detection certification test is
designed to demonstrate that the smoke detection system will detect a
smoldering fire that produces a small amount of smoke 2.
• In an attempt to eliminate the frequency of false alarms, the FAA issued a
Technical Standard Order to adopt the Minimum Performance Standards of
smoke detector equipment, which includes criteria for resisting alarms from
nuisance sources such as water vapor, insecticide aerosols, dust and light
3.
3
1 Title 14 Code of Federal Regulations (CFR) Part 25.858, 2/10/1998
2 Federal Aviation Administration Advisory Circular 25-9A
3 TSO C1e, 8/19/2014

Section 2
Methods and Test Equipment
• Testing is conducted in an altitude chamber with
steady state conditions
• Theatrical smoke generators produce a non
hazardous smoke
• Heater plate smolders foam and wood
• Lasers and photodiodes measure light obscuration
• Dual wavelength, blue and infrared,
electromagnetic radiation scattering measurement
(EMRSM) characterize particle size
– Data is verified with scanning mobility particle
sizer (SMPS)
• Vane anemometers characterize smoke transport
4
Test Apparatus

Altitude Chamber
• 240cm x 180cm x 180cm height
• Controls
– Temperature
• As low as: -38C
– Pressure
• As low as: 2psia
• Tested range
– Temperature
• 10C – 30C
5
Altitude Chamber
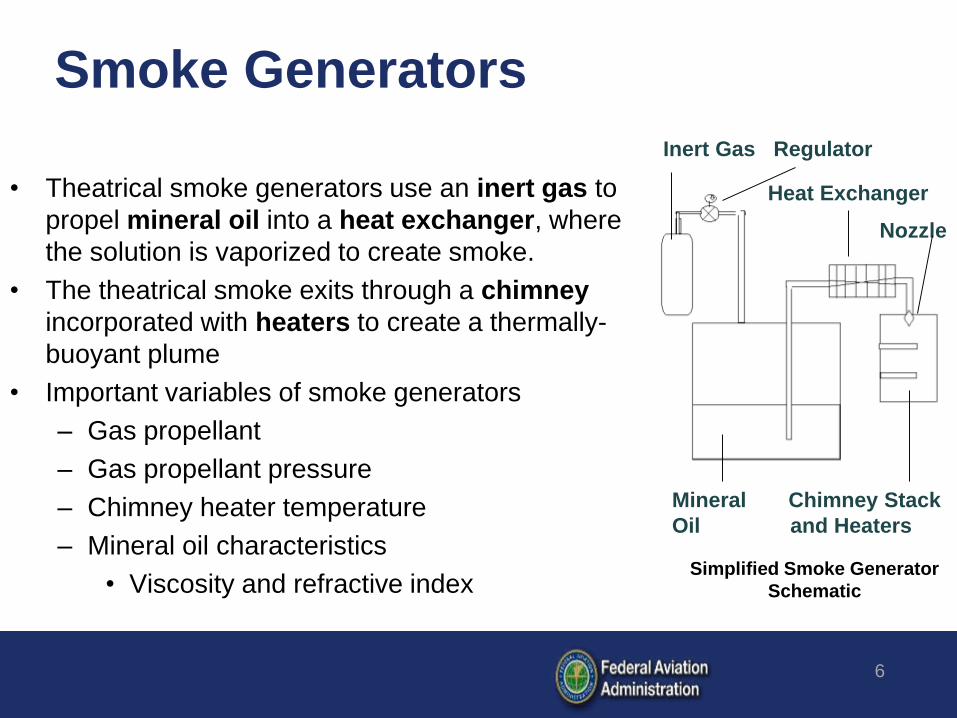
Smoke Generators
• Theatrical smoke generators use an inert gas to
propel mineral oil into a heat exchanger, where
the solution is vaporized to create smoke.
• The theatrical smoke exits through a chimney
incorporated with heaters to create a thermally-
buoyant plume
• Important variables of smoke generators
– Gas propellant
– Gas propellant pressure
– Chimney heater temperature
– Mineral oil characteristics
• Viscosity and refractive index
6
Simplified Smoke Generator
Schematic
Inert Gas Regulator
Mineral Chimney Stack
Oil and Heaters
Heat Exchanger
Nozzle

• Three major aircraft manufacturers’ smoke
generators and settings are tested and compared
• One manufacturer uses the Siemens Cerberus
• Two manufacturers use the Aviator 440
• One manufacturer uses nitrogen as the
propellant gas
• Two manufacturers use carbon dioxide as the
propellant gas
– The setups will be annotated as
• MFR 1a, 1b and 1c
• MFR 2a and 2b
• MFR 3
Aircraft Manufacturers’ Setups
Concept Siemens
Aviator Cerberus
8
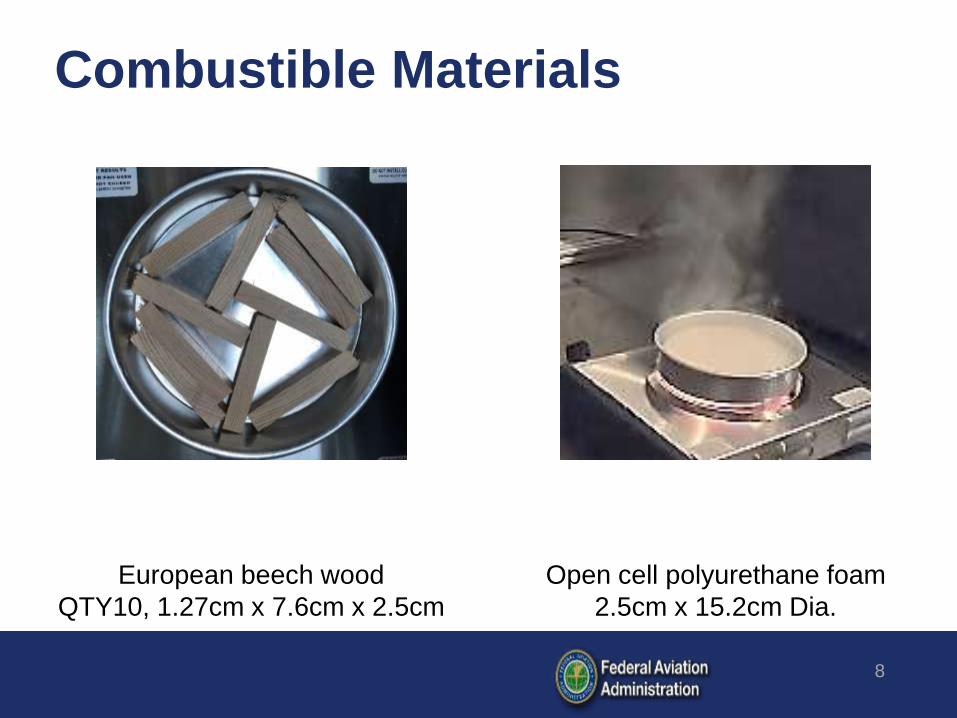
Open cell polyurethane foam
2.5cm x 15.2cm Dia.
European beech wood
QTY10, 1.27cm x 7.6cm x 2.5cm
Combustible Materials
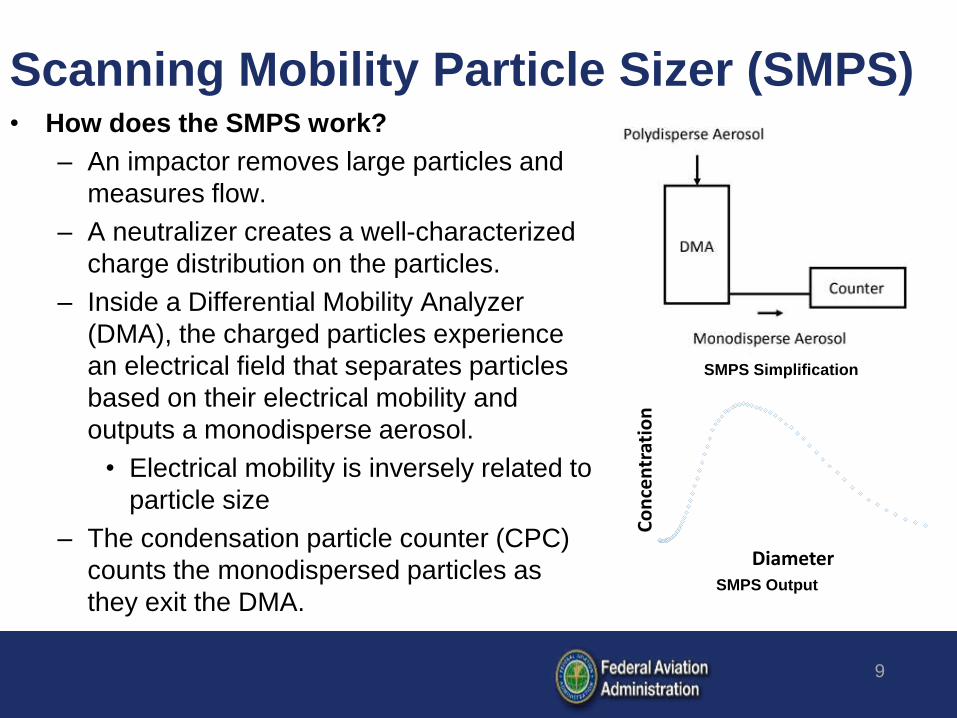
Scanning Mobility Particle Sizer (SMPS)• How does the SMPS work?
– An impactor removes large particles and
measures flow.
– A neutralizer creates a well-characterized
charge distribution on the particles.
– Inside a Differential Mobility Analyzer
(DMA), the charged particles experience
an electrical field that separates particles
based on their electrical mobility and
outputs a monodisperse aerosol.
• Electrical mobility is inversely related to
particle size
– The condensation particle counter (CPC)
counts the monodispersed particles as
they exit the DMA.
9
Co
nce
ntr
atio
n
DiameterSMPS Output
SMPS Simplification
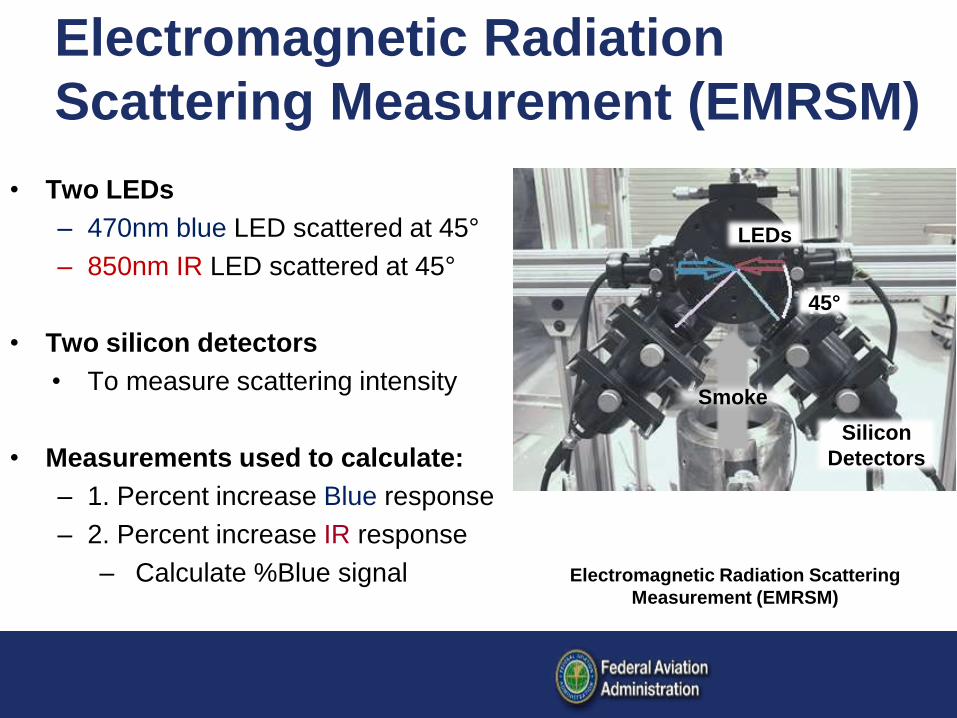
Electromagnetic Radiation
Scattering Measurement (EMRSM)
• Two LEDs
– 470nm blue LED scattered at 45°
– 850nm IR LED scattered at 45°
• Two silicon detectors
• To measure scattering intensity
• Measurements used to calculate:
– 1. Percent increase Blue response
– 2. Percent increase IR response
– Calculate %Blue signal
LEDs
Silicon
Detectors
45°
Smoke
Electromagnetic Radiation Scattering
Measurement (EMRSM)
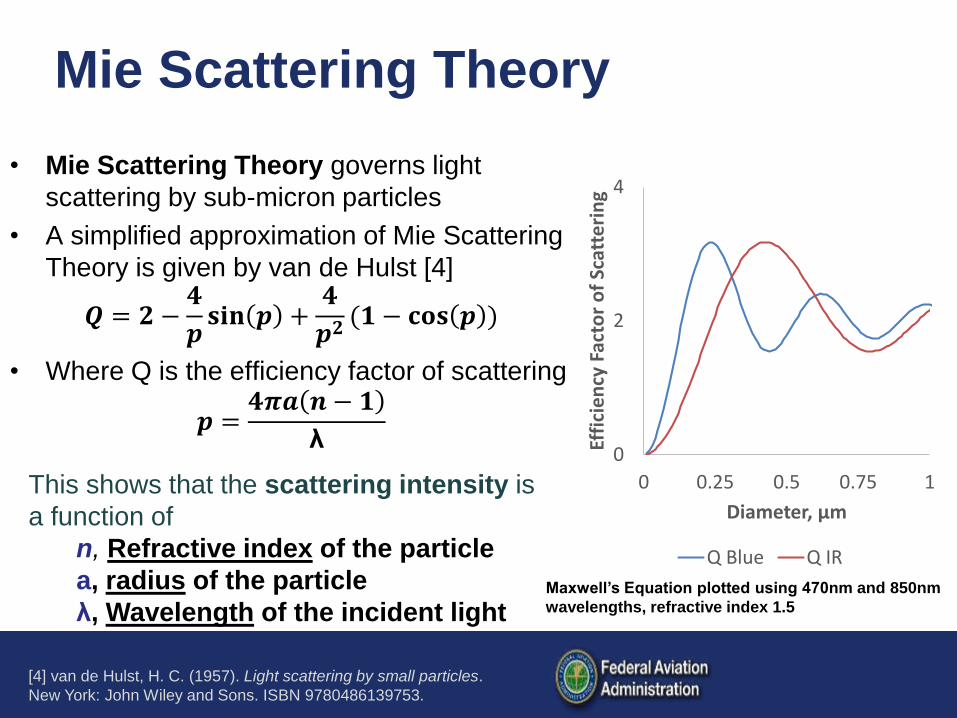
Mie Scattering Theory
• Mie Scattering Theory governs light
scattering by sub-micron particles
• A simplified approximation of Mie Scattering
Theory is given by van de Hulst [4]
𝑸 = 𝟐 −𝟒
𝒑𝐬𝐢𝐧 𝒑 +
𝟒
𝒑𝟐(𝟏 − 𝐜𝐨𝐬 𝒑 )
• Where Q is the efficiency factor of scattering
𝒑 =𝟒𝝅𝒂 𝒏 − 𝟏
λ0
2
4
0 0.25 0.5 0.75 1
Effi
cie
ncy
Fac
tor
of
Scat
teri
ng
Diameter, µm
Q Blue Q IR
This shows that the scattering intensity is
a function of
n, Refractive index of the particle
a, radius of the particle
λ, Wavelength of the incident lightMaxwell’s Equation plotted using 470nm and 850nm
wavelengths, refractive index 1.5
[4] van de Hulst, H. C. (1957). Light scattering by small particles.
New York: John Wiley and Sons. ISBN 9780486139753.
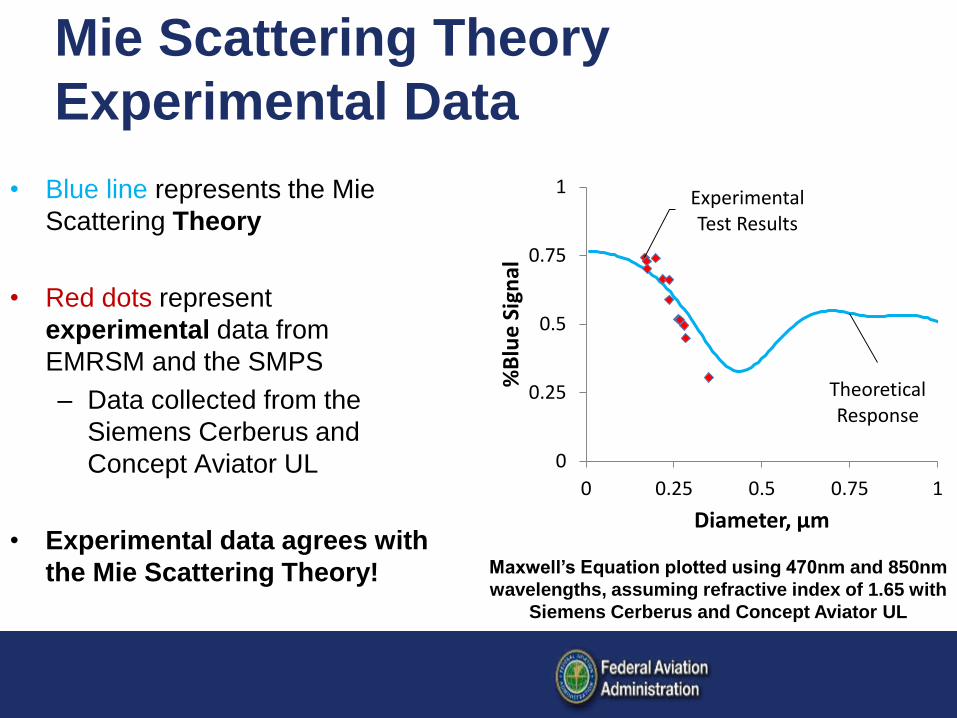
Mie Scattering Theory
Experimental Data
• Blue line represents the Mie
Scattering Theory
• Red dots represent
experimental data from
EMRSM and the SMPS
– Data collected from the
Siemens Cerberus and
Concept Aviator UL
• Experimental data agrees with
the Mie Scattering Theory! Maxwell’s Equation plotted using 470nm and 850nm
wavelengths, assuming refractive index of 1.65 with
Siemens Cerberus and Concept Aviator UL
Theoretical Response
Experimental Test Results
0
0.25
0.5
0.75
1
0 0.25 0.5 0.75 1%
Blu
e S
ign
alDiameter, µm
Mie Scattering Theory
Potential Issues
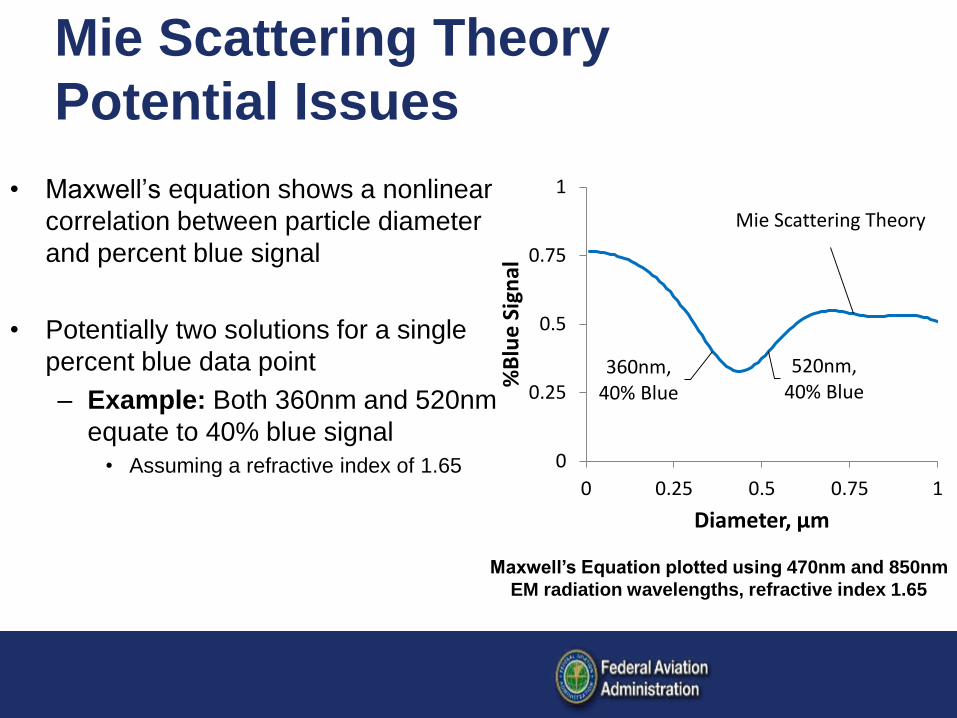
• Maxwell’s equation shows a nonlinear
correlation between particle diameter
and percent blue signal
• Potentially two solutions for a single
percent blue data point
– Example: Both 360nm and 520nm
equate to 40% blue signal
• Assuming a refractive index of 1.65
360nm, 40% Blue
520nm, 40% Blue
Mie Scattering Theory
0
0.25
0.5
0.75
1
0 0.25 0.5 0.75 1%
Blu
e S
ign
alDiameter, µm
Maxwell’s Equation plotted using 470nm and 850nm
EM radiation wavelengths, refractive index 1.65
Mie Scattering Theory
Potential Issues
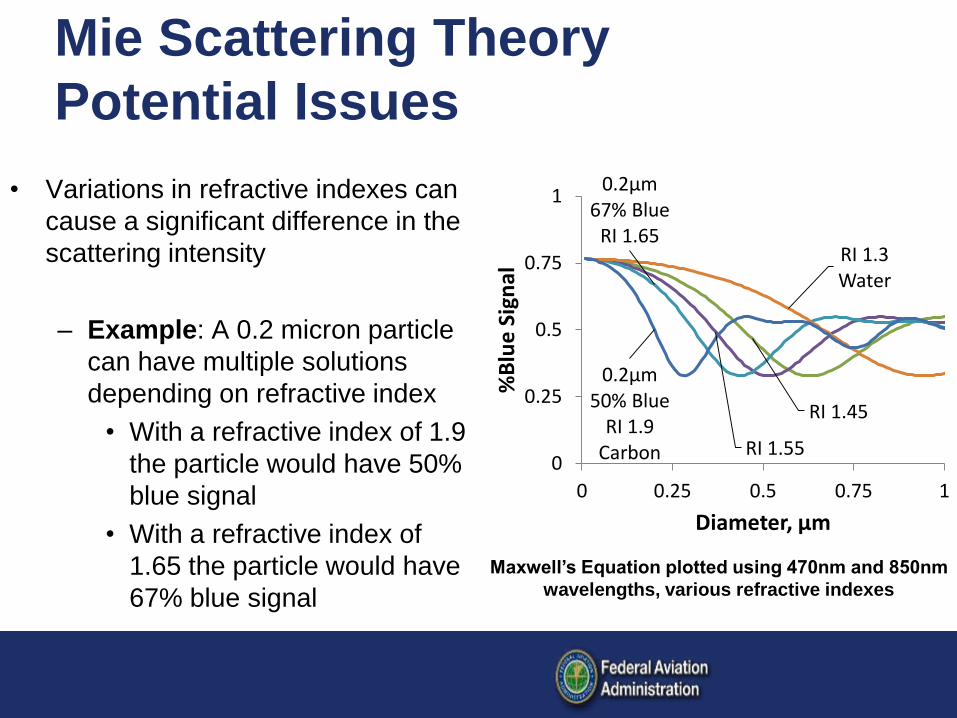
• Variations in refractive indexes can
cause a significant difference in the
scattering intensity
– Example: A 0.2 micron particle
can have multiple solutions
depending on refractive index
• With a refractive index of 1.9
the particle would have 50%
blue signal
• With a refractive index of
1.65 the particle would have
67% blue signal
RI 1.45
RI 1.55
0.2µm67% Blue
RI 1.65RI 1.3Water
0.2µm50% Blue
RI 1.9Carbon0
0.25
0.5
0.75
1
0 0.25 0.5 0.75 1%
Blu
e S
ign
alDiameter, µm
Maxwell’s Equation plotted using 470nm and 850nm
wavelengths, various refractive indexes
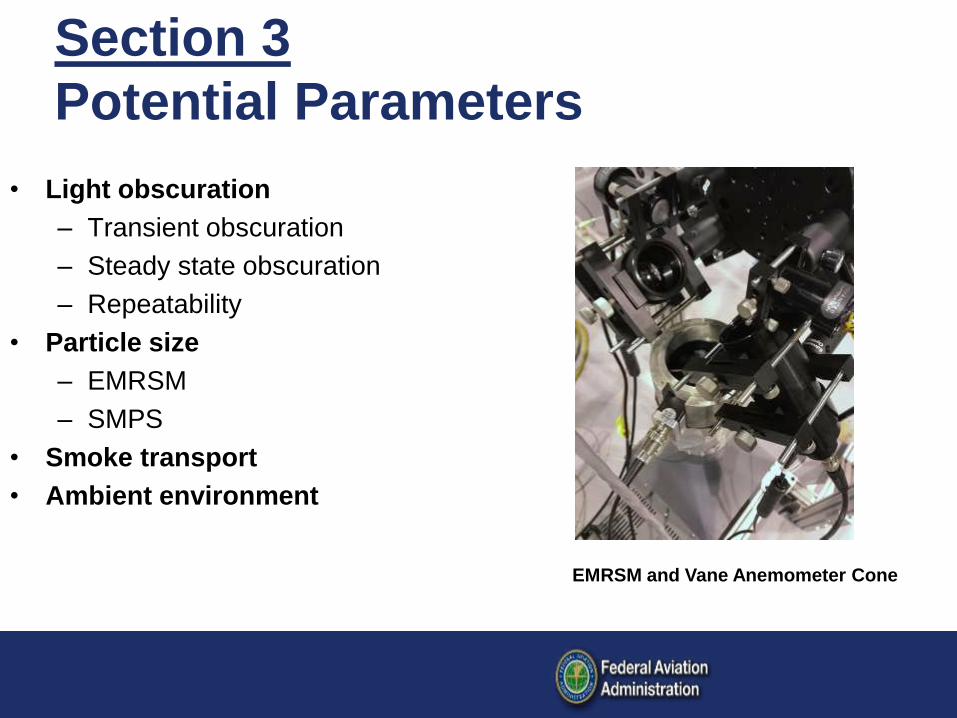
• Light obscuration
– Transient obscuration
– Steady state obscuration
– Repeatability
• Particle size
– EMRSM
– SMPS
• Smoke transport
• Ambient environment
EMRSM and Vane Anemometer Cone
Section 3
Potential Parameters
Smoldering Foam
Smoldering Wood
0 50 100 150
0
10
20
30
40
50
60
70
80
90
100
0
20
40
60
80
0 30 60 90 120 150
Ob
scu
rati
on
, %/f
t
Time, sMFR 1a MFR 1c MFR 2a
MFR 2b MFR 3 MFR 1b
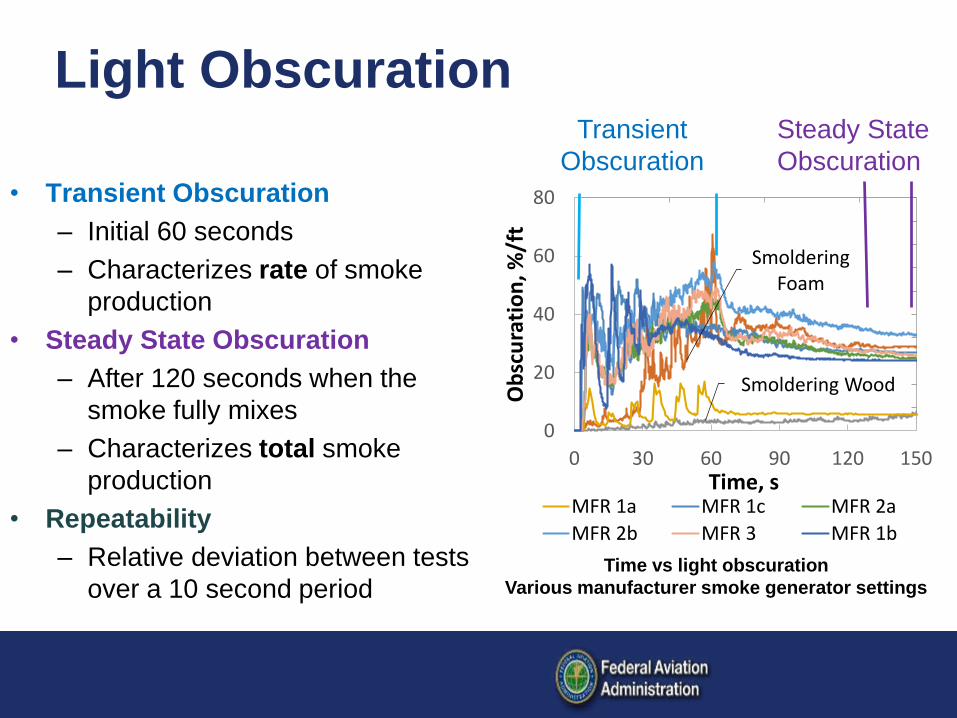
Time vs light obscuration
Various manufacturer smoke generator settings
Light ObscurationTransient
Obscuration
Steady State
Obscuration
• Transient Obscuration
– Initial 60 seconds
– Characterizes rate of smoke
production
• Steady State Obscuration
– After 120 seconds when the
smoke fully mixes
– Characterizes total smoke
production
• Repeatability
– Relative deviation between tests
over a 10 second period

Transient Obscuration
Time vs light obscuration
Used to determine transient light obscuration
• The data points represent the time to surpass the marked light obscuration threshold
• The steeper the curve, the more rapid the smoke production rate
• The highest point on the curve represents the maximum light obscuration reached
• The smoke production rate varies by setup
• Smoldering foam emits smoke at a much slower rate then the tested setups
MFR 1b
MFR 2bMFR 3
Smoldering Foam
MFR 1a
MFR 1c
MFR 2a
0 10 20 30 40 50 60
0
20
40
60
80
100
120
0
20
40
60
80
100
0 20 40 60
Ob
scu
rati
on
, %/f
tTime, s

Steady State Obscuration
Time vs light obscuration
Used to determine steady state light obscuration
• The data represents the total
smoke production
• The average steady state
obscuration is 32 %/ft with a
standard deviation of 9 %/ft
– This shows that there is a large
variation between setups
6
23
25
29
30
32
49
MFR 1a
MFR 2a
MFR 3
Smoldering Foam
MFR 1b
MFR 2b
MFR 1c
Steady State Obscuration, %/ft
Repeatability
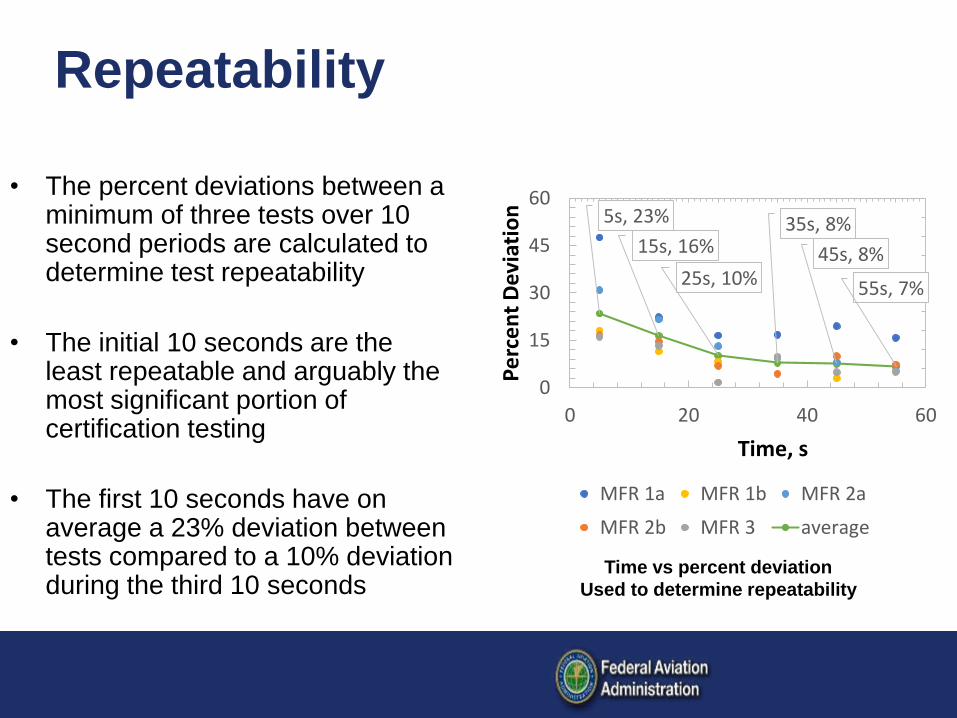
• The percent deviations between a minimum of three tests over 10 second periods are calculated to determine test repeatability
• The initial 10 seconds are the least repeatable and arguably the most significant portion of certification testing
• The first 10 seconds have on average a 23% deviation between tests compared to a 10% deviation during the third 10 seconds
Time vs percent deviation
Used to determine repeatability
5s, 23%
15s, 16%
25s, 10%
35s, 8%
45s, 8%
55s, 7%
0 5 10 15 20 25 30 35 40 45 50 55 60
0
5
10
15
20
25
30
35
40
45
50
0
15
30
45
60
0 20 40 60
Pe
rce
nt
Dev
iati
on
Time, s
MFR 1a MFR 1b MFR 2a
MFR 2b MFR 3 average

Particle Size - SMPS
• The average particle diameter
ranges from 175 to 250 nm
depending on the setup
– This is similar to the average
particle size of smoldering
beech wood and smoldering
foam – 163 and 181 nm
respectively
• MFR 1 has higher particle
concentrations then MFR 2 and
MFR 3Diameter vs concentration
SMPS data output of various smoke sources
Smoldering Beech Wood
Smoldering Foam
0.00E+00
5.00E+06
1.00E+07
1.50E+07
2.00E+07
0 250 500 750N
orm
aliz
ed
Co
nce
ntr
atio
n,
dW
/dlo
gDp
Diameter, nm
MFR 1a MFR 1b MFR 1cMFR 2a MFR 2b MFR 3
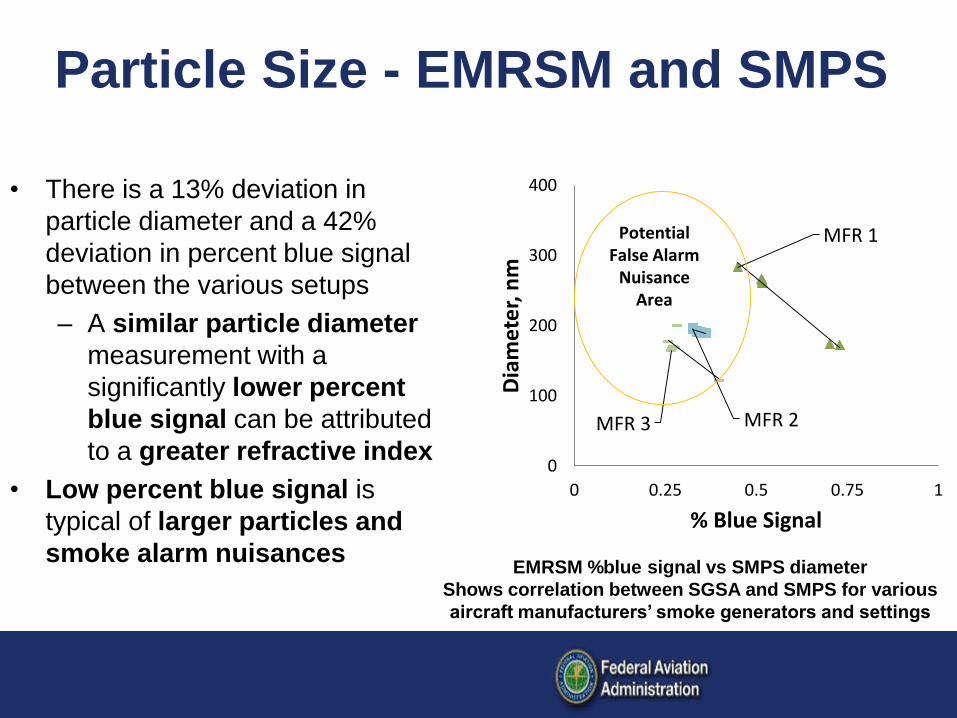
Particle Size - EMRSM and SMPS
• There is a 13% deviation in
particle diameter and a 42%
deviation in percent blue signal
between the various setups
– A similar particle diameter
measurement with a
significantly lower percent
blue signal can be attributed
to a greater refractive index
• Low percent blue signal is
typical of larger particles and
smoke alarm nuisancesEMRSM %blue signal vs SMPS diameter
Shows correlation between SGSA and SMPS for various
aircraft manufacturers’ smoke generators and settings
MFR 1
MFR 2MFR 3
0
100
200
300
400
0 0.25 0.5 0.75 1D
iam
ete
r, n
m% Blue Signal
Potential False Alarm
Nuisance Area
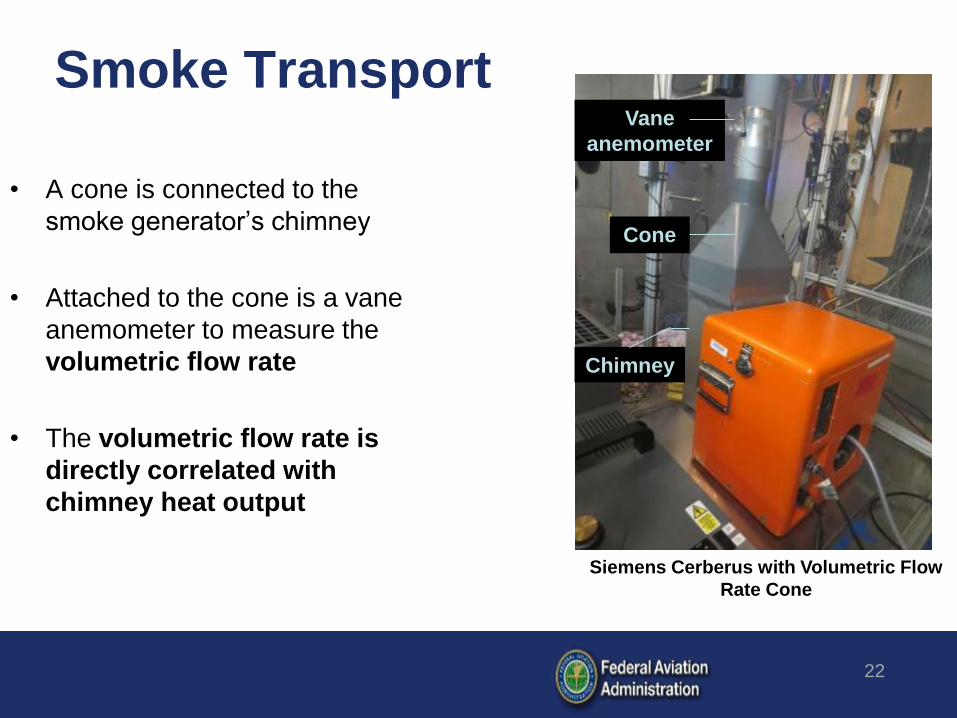
Smoke Transport
• A cone is connected to the
smoke generator’s chimney
• Attached to the cone is a vane
anemometer to measure the
volumetric flow rate
• The volumetric flow rate is
directly correlated with
chimney heat output
22
Siemens Cerberus with Volumetric Flow
Rate Cone
Vane
anemometer
Cone
Chimney
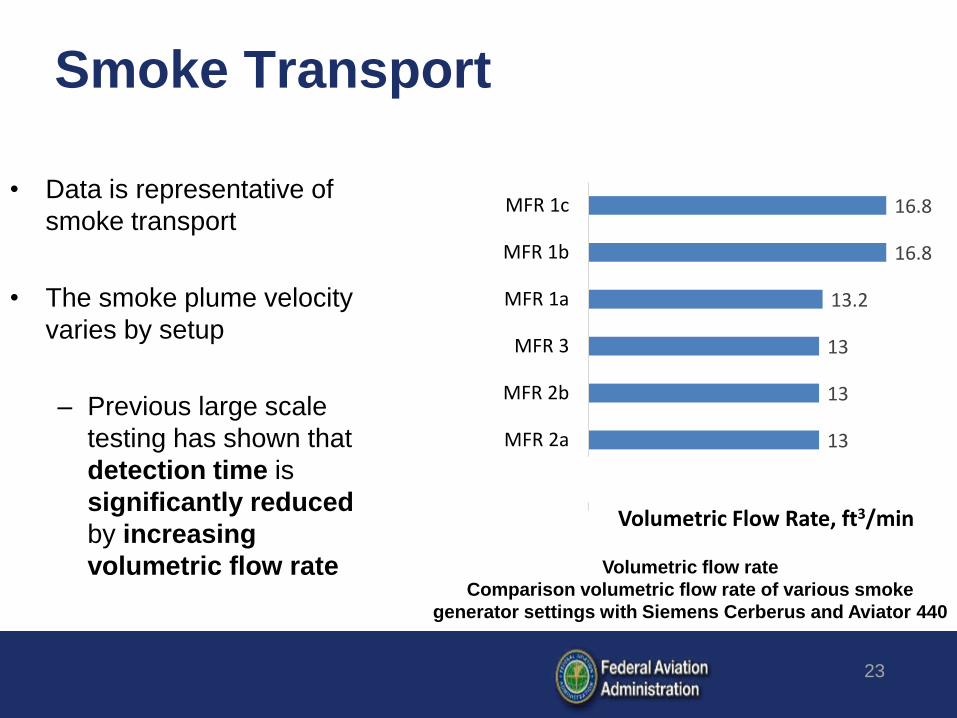
6.7
13
13
13
13.2
16.8
16.8
Custom 1
MFR 2a
MFR 2b
MFR 3
MFR 1a
MFR 1b
MFR 1c
Volumetric Flow Rate, ft3/min
Smoke Transport
23
• Data is representative of
smoke transport
• The smoke plume velocity
varies by setup
– Previous large scale
testing has shown that
detection time is
significantly reduced
by increasing
volumetric flow rate Volumetric flow rate
Comparison volumetric flow rate of various smoke
generator settings with Siemens Cerberus and Aviator 440
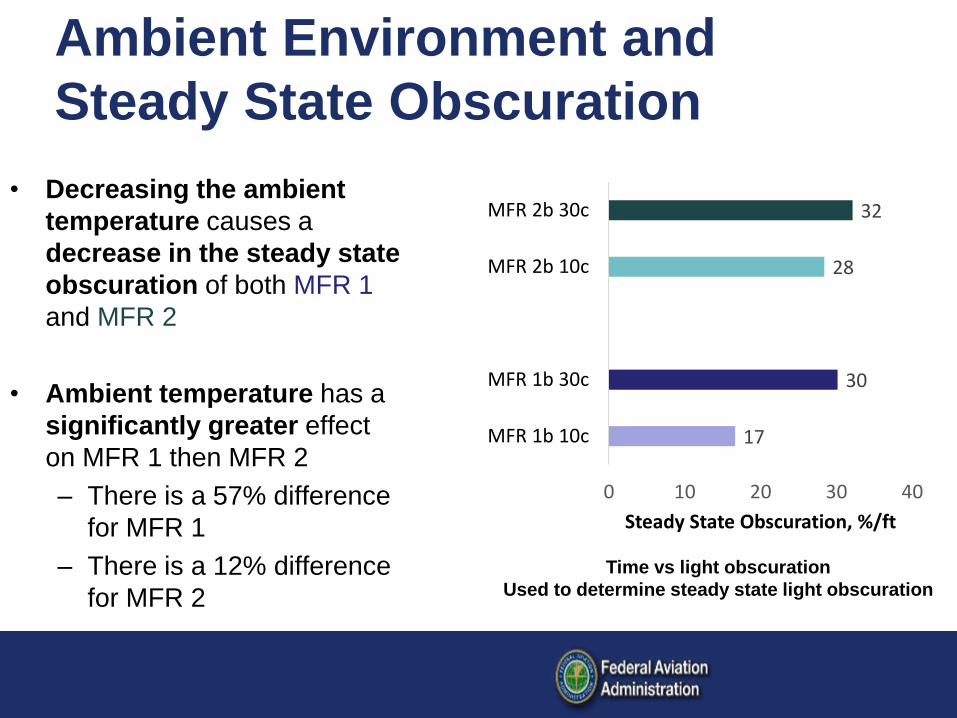
Ambient Environment and
Steady State Obscuration
Time vs light obscuration
Used to determine steady state light obscuration
• Decreasing the ambient
temperature causes a
decrease in the steady state
obscuration of both MFR 1
and MFR 2
• Ambient temperature has a
significantly greater effect
on MFR 1 then MFR 2
– There is a 57% difference
for MFR 1
– There is a 12% difference
for MFR 2
17
30
28
32
0 10 20 30 40
MFR 1b 10c
MFR 1b 30c
MFR 2b 10c
MFR 2b 30c
Steady State Obscuration, %/ft
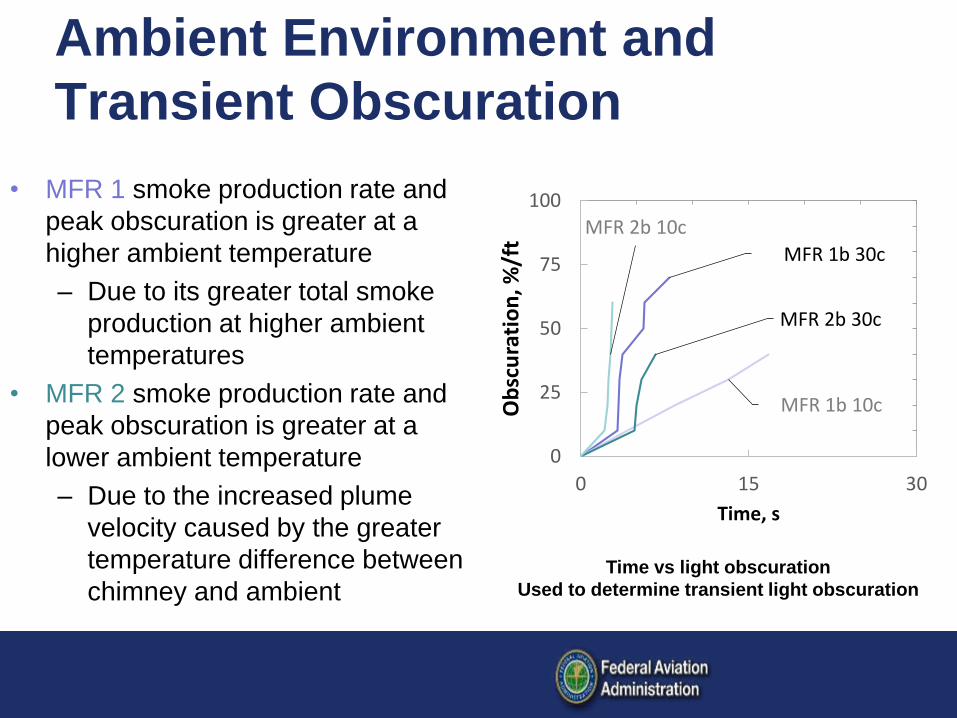
Ambient Environment and
Transient Obscuration
Time vs light obscuration
Used to determine transient light obscuration
• MFR 1 smoke production rate and
peak obscuration is greater at a
higher ambient temperature
– Due to its greater total smoke
production at higher ambient
temperatures
• MFR 2 smoke production rate and
peak obscuration is greater at a
lower ambient temperature
– Due to the increased plume
velocity caused by the greater
temperature difference between
chimney and ambient
MFR 1b 30c
MFR 1b 10c
MFR 2b 30c
MFR 2b 10c
0 10 20 30 40 50 60
0
10
20
30
40
50
60
70
80
90
100
0
25
50
75
100
0 15 30
Ob
scu
rati
on
, %/f
tTime, s

• Strategies for simulating
smoldering smoke are
assessed
– Increasing smoke
production with time
– Using less chimney
heat
Time: 15 seconds
Time: 45 seconds
Section 4
Simulating Smoldering Smoke
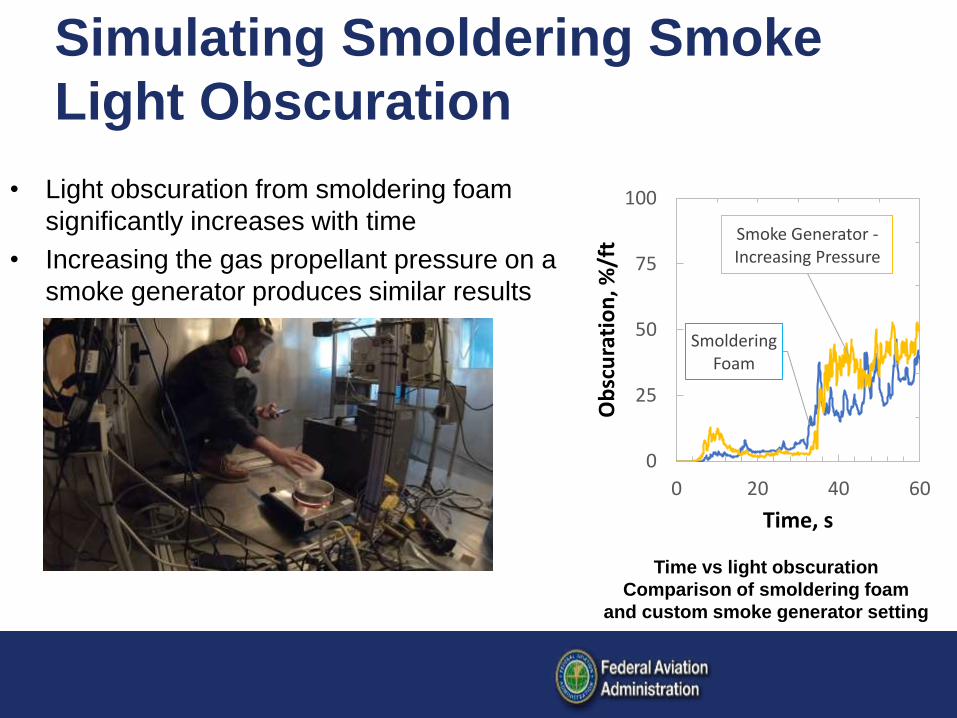
Simulating Smoldering Smoke
Light Obscuration
Time vs light obscuration
Comparison of smoldering foam
and custom smoke generator setting
• Light obscuration from smoldering foam
significantly increases with time
• Increasing the gas propellant pressure on a
smoke generator produces similar results
Smoldering Foam
Smoke Generator -Increasing Pressure
0 10 20 30 40 50 60
0
20
40
60
80
100
120
0
25
50
75
100
0 20 40 60
Ob
scu
rati
on
, %/f
t
Time, s
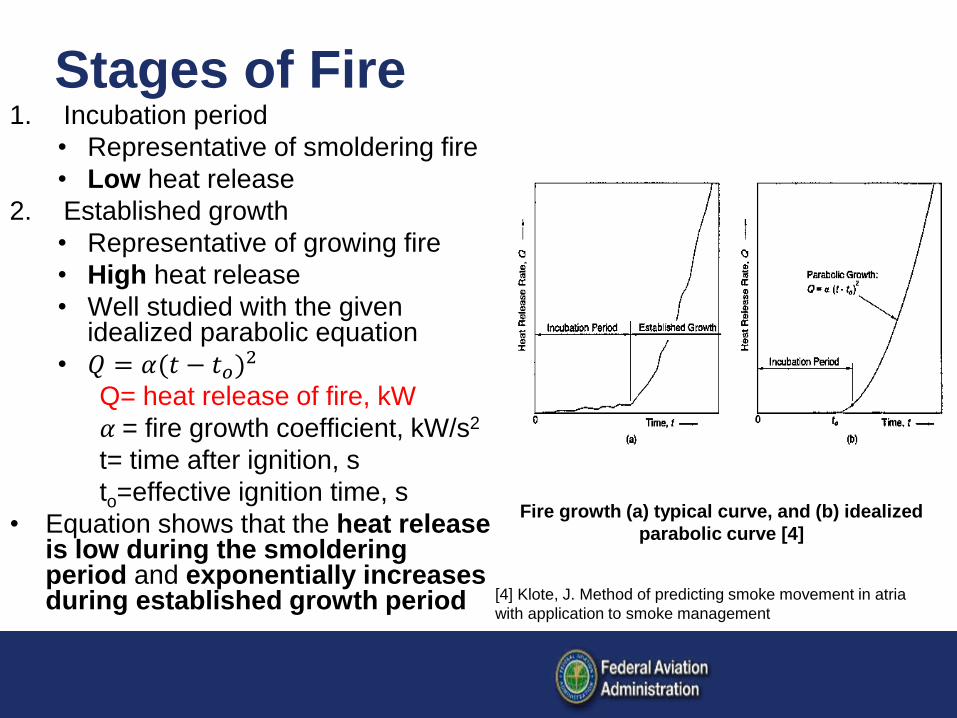
Stages of Fire
Fire growth (a) typical curve, and (b) idealized
parabolic curve [4]
1. Incubation period
• Representative of smoldering fire
• Low heat release
2. Established growth
• Representative of growing fire
• High heat release
• Well studied with the given idealized parabolic equation
• 𝑄 = 𝛼(𝑡 − 𝑡𝑜)2
Q= heat release of fire, kW
𝛼 = fire growth coefficient, kW/s2
t= time after ignition, s
to=effective ignition time, s
• Equation shows that the heat release is low during the smoldering period and exponentially increases during established growth period [4] Klote, J. Method of predicting smoke movement in atria
with application to smoke management

Simulating Real Fires
Temperature
• Encircled in green
– The common smoke
generator setups best
simulate the temperature
increase from a flaming
fire
• Encircled in red
– A custom low chimney
heat smoke generator
setting best simulates the
temperature increase
from a smoldering fire
29
Flaming Paper
Smoldering PaperCustom Setting 1
Custom Equivalent MFR 2MFR 3
Custom Equivalent,MFR 1bMFR 1c
0
10
20
30
40
50
60
0 60 120 180
Tem
pe
ratu
re R
ise
, F
Time, s
Time vs temperature rise
Comparison of temperature increase of various
smoke sources and smoke generator heater
settings. Full scale testing in cargo compartment.
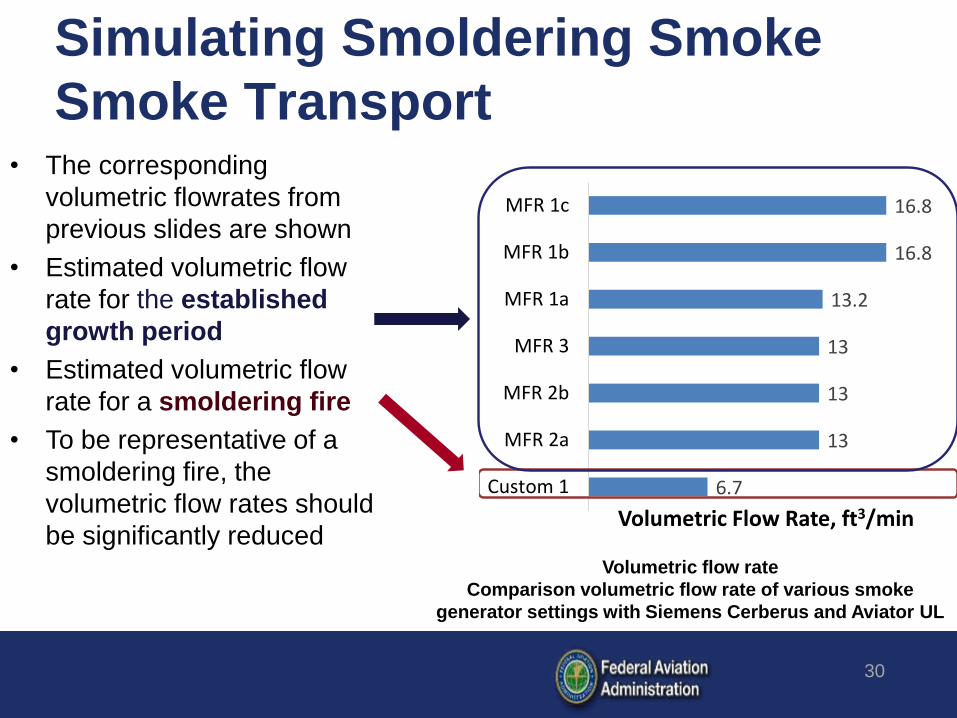
6.7
13
13
13
13.2
16.8
16.8
Custom 1
MFR 2a
MFR 2b
MFR 3
MFR 1a
MFR 1b
MFR 1c
Volumetric Flow Rate, ft3/min
Simulating Smoldering Smoke
Smoke Transport
30
• The corresponding
volumetric flowrates from
previous slides are shown
• Estimated volumetric flow
rate for the established
growth period
• Estimated volumetric flow
rate for a smoldering fire
• To be representative of a
smoldering fire, the
volumetric flow rates should
be significantly reducedVolumetric flow rate
Comparison volumetric flow rate of various smoke
generator settings with Siemens Cerberus and Aviator UL
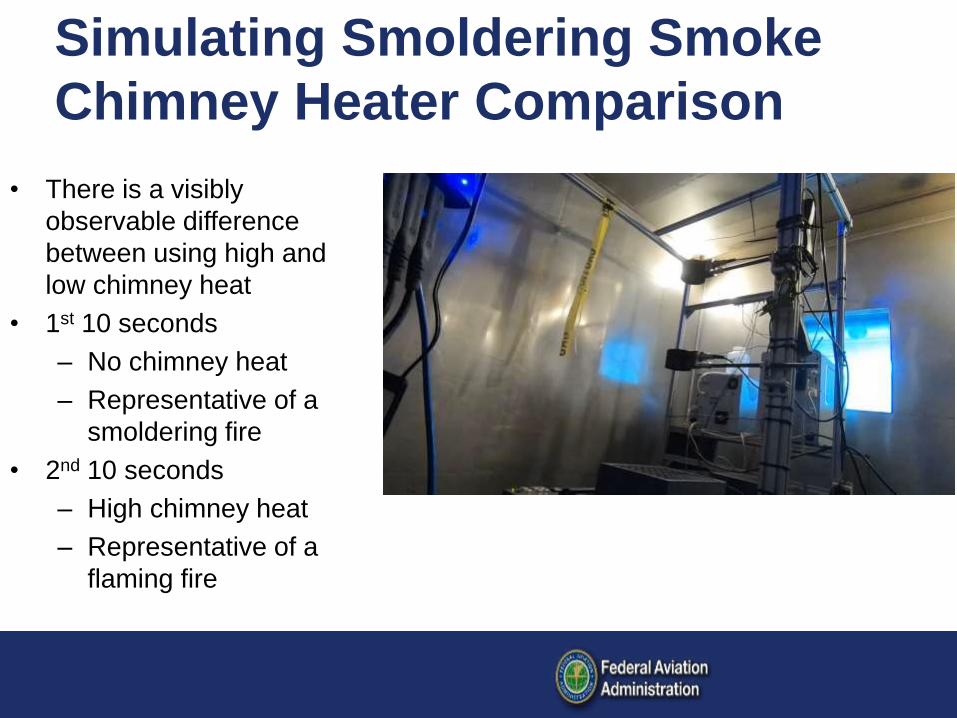
Simulating Smoldering Smoke
Chimney Heater Comparison
• There is a visibly
observable difference
between using high and
low chimney heat
• 1st 10 seconds
– No chimney heat
– Representative of a
smoldering fire
• 2nd 10 seconds
– High chimney heat
– Representative of a
flaming fire
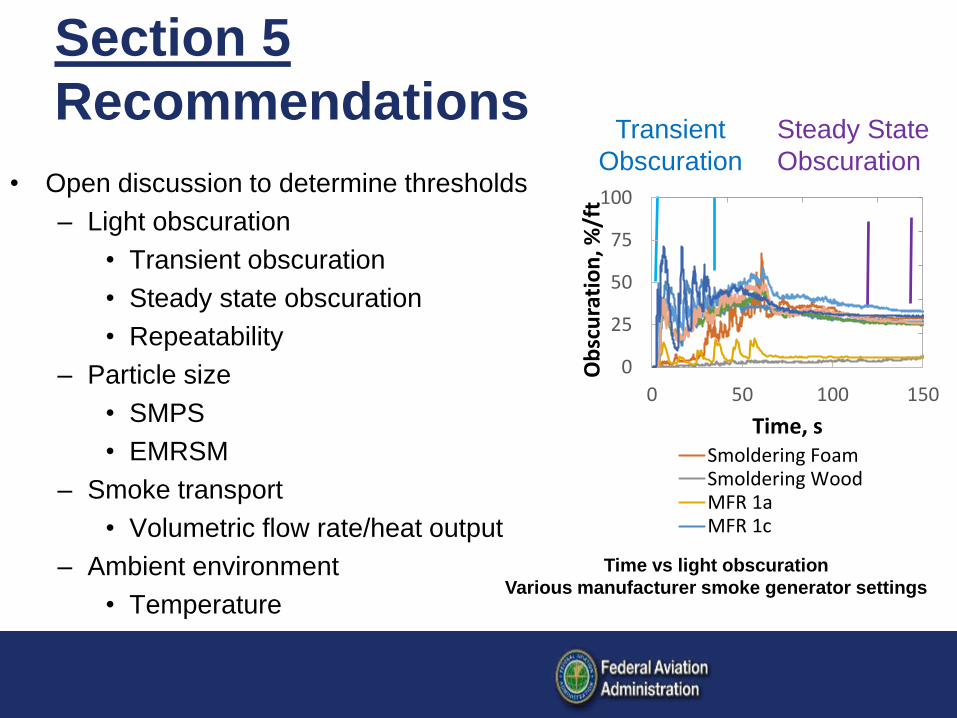
• Open discussion to determine thresholds
– Light obscuration
• Transient obscuration
• Steady state obscuration
• Repeatability
– Particle size
• SMPS
• EMRSM
– Smoke transport
• Volumetric flow rate/heat output
– Ambient environment
• Temperature
Time vs light obscuration
Various manufacturer smoke generator settings
Section 5
RecommendationsTransient
Obscuration
Steady State
Obscuration0 50 100 150
0
20
40
60
80
100
0
25
50
75
100
0 50 100 150
Ob
scu
rati
on
, %/f
t
Time, sSmoldering FoamSmoldering WoodMFR 1aMFR 1c
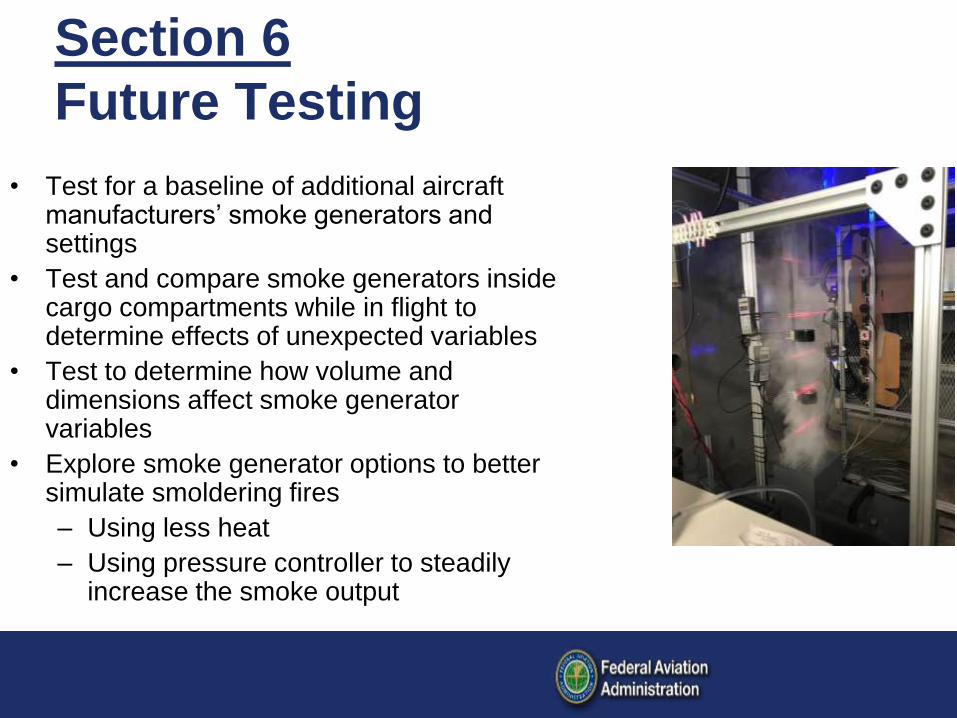
• Test for a baseline of additional aircraft manufacturers’ smoke generators and settings
• Test and compare smoke generators inside cargo compartments while in flight to determine effects of unexpected variables
• Test to determine how volume and dimensions affect smoke generator variables
• Explore smoke generator options to better simulate smoldering fires
– Using less heat
– Using pressure controller to steadily increase the smoke output
Section 6
Future Testing
Contact Information
- Matthew Karp
- Research Engineer
- FAA ANG-E211 Systems Fire Protection
- Phone: 609-485-4538
- Email: [email protected]
-
34

Test Apparatus
• Blue and IR electromagnetic radiation scattering
measurement (EMRSM)
– 3” below ceiling
• SMPS
– 3” below ceiling
• 5 Thermocouples
– 0”, 5”, 11”, 23” and 35” above smoke generator
• 2 Anemometers
– 10” and 20” above smoke generator
• 6 Obscuration Meters
– 6”, 12”, 18”, 24”, 36” and 40” above smoke
generator
35
Thermocouples,
anemometers, EMERSM and
obscuration meters

Ambient Environment and
Particle Size
• Decreasing the ambient
temperature slightly
increases percent blue
signal and particle diameter
36
SGSA %blue signal vs SMPS diameter
Shows correlation between SGSA and SMPS for various
aircraft manufacturers’ smoke generators and settings
MFR 1b 30c
MFR 1b 10c
MFR 2b 30c
MFR 2b 10c
Smoldering Beech Wood
0
100
200
300
400
0 0.25 0.5 0.75 1G
eo
me
tric
al M
ean
Dia
me
ter,
n
m% Blue Signal
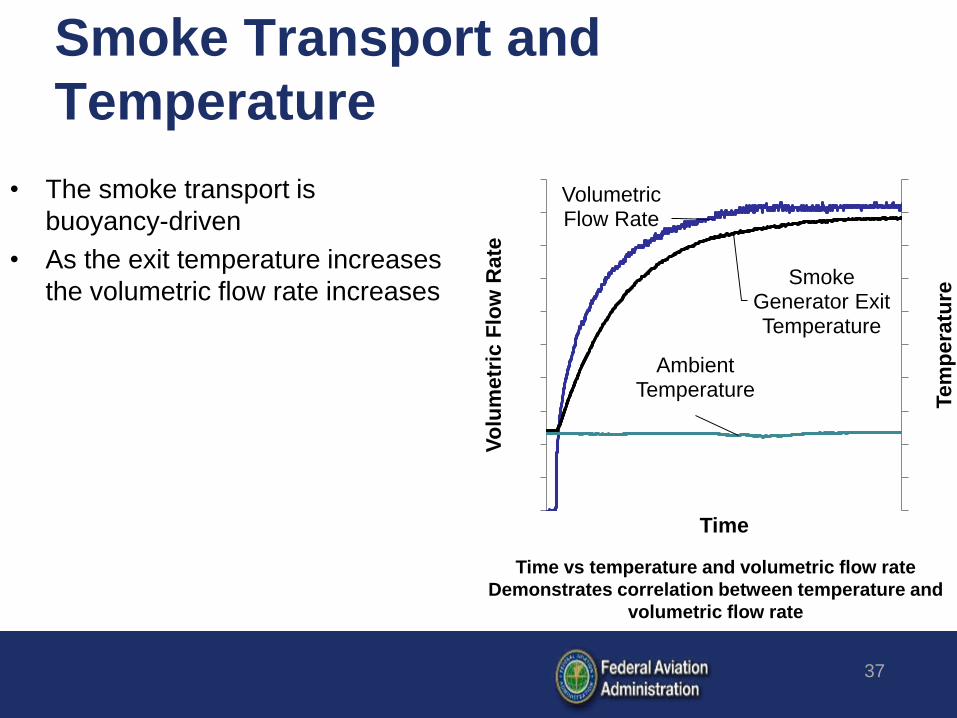
Smoke Transport and
Temperature
• The smoke transport is
buoyancy-driven
• As the exit temperature increases
the volumetric flow rate increases
37
Volumetric Flow Rate
Smoke Generator Exit Temperature
Ambient Temperature
0
10
20
30
40
50
60
70
80
90
100
0
200
400
600
800
1000
1200
1400
1600
1800
2000
Te
mp
era
ture
Vo
lum
etr
ic F
low
Rate
Time
Time vs temperature and volumetric flow rate
Demonstrates correlation between temperature and
volumetric flow rate
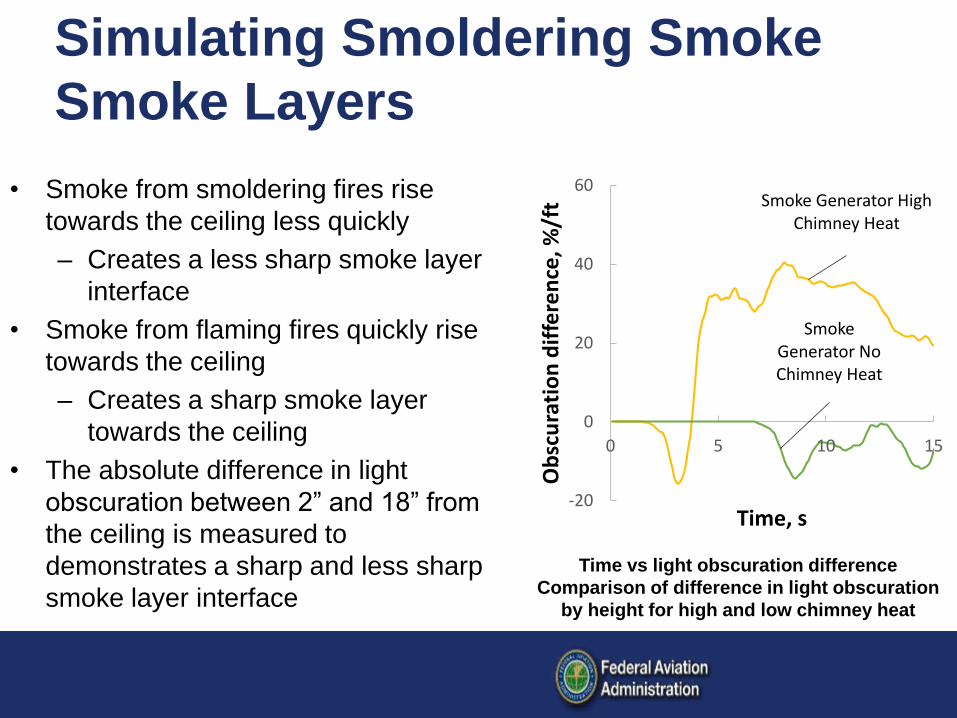
Simulating Smoldering Smoke
Smoke Layers
Time vs light obscuration difference
Comparison of difference in light obscuration
by height for high and low chimney heat
• Smoke from smoldering fires rise
towards the ceiling less quickly
– Creates a less sharp smoke layer
interface
• Smoke from flaming fires quickly rise
towards the ceiling
– Creates a sharp smoke layer
towards the ceiling
• The absolute difference in light
obscuration between 2” and 18” from
the ceiling is measured to
demonstrates a sharp and less sharp
smoke layer interface
Smoke Generator High Chimney Heat
Smoke Generator No Chimney Heat
-20
0
20
40
60
0 5 10 15
Ob
scu
rati
on
dif
fere
nce
, %/f
t
Time, s