Embed Size (px)
Citation preview
Emergency Department
Patient Experience of Care
Survey
Methodology May 2017
HQCA AND BACKGROUND 2
1.0 HQCA AND BACKGROUND
The Health Quality Council of Alberta (HQCA) is an independent organization legislated under the Health
Quality Council of Alberta Act, with a mandate to survey Albertans on their experience and satisfaction
with patient safety and health service quality.
The HQCA first completed an emergency department survey and report in 2007, which was the product
of a collaboration between the Alberta health regions at the time, the Ministry of Health, and other
stakeholders, including a working group comprised of emergency department medical professionals,
managers, and academics. The survey was repeated in 2009. The 2007 and 2009 emergency department
patient experience surveys were each conducted over a single two-week period (once in each year), and
reports are available on the HQCA website (www.hqca.ca).i
In 2010, the HQCA made a significant change to its process for conducting emergency department
patient experience surveys. In consultation with Alberta Health Services (AHS), the HQCA shifted to
sampling emergency department patients every two weeks beginning in June 2010.ii This bi-weekly
surveying continued until July 2013.
The purpose of the change to more frequent sampling in 2010 was to better monitor variation and
detect changes in emergency department patient experience over time in Alberta’s urban or regional
emergency departments.iii This enabled the HQCA to provide emergency department stakeholders
(particularly those at the site level) with relevant information that they could use to inform their patient
experience, quality of care, and patient safety improvement efforts.
The HQCA completed the administration of this survey in July 2013. At that time, the HQCA sought to
transition this work to AHS; however, this transition did not materialize. In April 2016, the HQCA
launched its most-recent iteration of the emergency department patient experience survey, reinitiating
the bi-weekly sampling and surveying established in 2010-2013.
Prior to the April 2016 launch of the current emergency department patient experience survey, the
HQCA reviewed alternative emergency department patient experience surveys, and compared them
with the instrument used by the HQCA since 2007. In consultation with emergency department
stakeholders, including Alberta Health, AHS, Covenant Health, Alberta Medical Association, academia,
and patients, the HQCA chose to replace the previous survey instrument with a questionnaire based on
the Emergency Department Patient Experience of Care (EDPEC) Survey developed by the RAND
Corporation.iv
As a result of this shift in survey instruments and survey content, a valid comparison of the results
cannot be made between the current results and those produced in either 2007, 2009, or from 2010-
2013. However, as in previous surveys, the HQCA’s current instrument is focused on patient experience
i These reports can be retrieved from the HQCA website, at http://hqca.ca/surveys/emergency-department-patient-experience/. ii As a result of the change in survey methodology, a valid comparison of the patient experience results for 2010-2013 with the 2007 and 2009 point-in-time results is not possible because of the broader time frame and different sampling frequency employed for this survey. iii Additionally, monitoring results over the calendar year allows for the identification of seasonal variability, which was impossible with the point-in-time approach used in the 2007 and 2009 surveys. iv The EDPEC Survey has not been made public by the RAND Corporation yet. As such, the HQCA is using this tool with the written permission of the RAND Corporation.
HQCA AND BACKGROUND 3
of emergency department care in Alberta’s busiest urban and regional hospital emergency departments.
The 16 sites included in the current survey are:
Alberta Children’s Hospital (Calgary)
Chinook Regional Hospital (Lethbridge)
Foothills Medical Centre (Calgary)
Grey Nun's Community Hospital (Edmonton)
Medicine Hat Regional Hospital
Misericordia Community Hospital (Edmonton)
Northern Lights Regional Health Centre (Fort McMurray)
Peter Lougheed Centre (Calgary)
Queen Elizabeth II Hospital (Grande Prairie)
Red Deer Regional Hospital
Rockyview General Hospital (Calgary)
Royal Alexandra Hospital (Edmonton)
South Health Campus (Calgary) – not surveyed in 2007, 2009, or from 2010-2013
Stollery Children’s Hospital (Edmonton)
Sturgeon Community Hospital (St. Albert) – not surveyed in 2007 or 2009
University of Alberta Hospital (Edmonton)
1.1 An ongoing focus on emergency department care
In undertaking the 2007, 2009, and 2010-2013 surveys, the HQCA recognized the following points that
are equally applicable to the current (2016+) survey:
The emergency department is the “canary in the coalmine”. Many of the challenges facing
emergency departments in Alberta, including crowding issues, are health system issues where
the causes of problems and their solutions extend beyond the emergency department itself. In
this context, improving the experience of patients, and their quality of care, needs to include
strategies at broader hospital, AHS zone, and health system levels.
Emergency department facilities are diverse in terms of the type and volume of services they
provide to the community, their size, patient population, and the causes and degree of pressures
they experience. However, it is recognized that facilities may not be able to influence all of the
factors that impact their performance from a patient experience perspective.
Beginning with the 2010-2013 report (and continuing with the current survey), the HQCA recognized
that provincial aggregate results have their limitations. Primarily, provincial aggregate results assume
that patients presenting to different sites all enter the same provincial emergency department care
delivery system, and this is not the case. As mentioned above, emergency department facilities are
extremely diverse; this extends to the programs and initiatives they implement as well as to how
patients rate the care they receive. By aggregating results from all sites into a provincial patient
experience score, important between-site differences are masked along with valuable actionable
information at the site level. Recognizing that patients presenting to different sites do not all enter an
identical care delivery system led the HQCA to focus on patient experience at the site level.
HQCA AND BACKGROUND 4
1.2 Purpose of the current survey
The purpose of the current (2016+) survey is to monitor variation in emergency department patient
experience over time at the 16 busiest emergency department sites in Alberta. These are the sites with
the greatest crowding pressures, longest wait times, and historically the poorest patient experience in
the province.v Additionally, this work aims to:
Provide actionable information about patient experience over time that will assist care
providers at both the provincial and site levels to improve the quality of emergency department
patient care.
Provide stakeholders (including the public) with site-specific patient experience results in
conjunction with results from other sites to encourage comparison for the purpose of shared
learning.vi The HQCA believes that comparison has the potential to aid in the identification of
weak or strong aspects of emergency department care delivery. This may encourage discussion
regarding practices employed by the higher-performing sites and facilitate learning from best
practices.
Stimulate conversations about patient experience in emergency departments. The HQCA
believes in the power of information. The acronym FOCUS, from the HQCA’s FOCUS on
Emergency Departments initiative, stands for Fostering Open Conversations that Unleash
Solutions. This is the ultimate goal of this survey and the larger FOCUS initiative.
Encourage and model transparency about Albertans’ healthcare system through quarterly
public reporting of patient experience results on a user-friendly and interactive website. Public
reporting fosters trust among the public the system serves, and evidence indicates that when
quality measures are publically reported, the results tend to improve over time.
v The HQCA’s 2007 Emergency Department Patient Experience Survey (which can be accessed at: http://hqca.ca/surveys/emergency-department-patient-experience/emergency-department-patient-experience-survey/) found that patients generally reported more positive patient experience at rural emergency department sites, compared to larger urban and regional sites. vi The HQCA’s reporting initiative for this survey – an interactive web-based platform called FOCUS on Emergency Departments – has, in consultation with emergency department stakeholders, grouped sites into peer groupings so that similar hospitals (based on size, volume, services, proximity to large urban/metropolitan centres) are fairly compared.
SURVEY METHODOLOGY 5
2.0 SURVEY METHODOLOGY
2.1 Selection of survey tool, validation, and testing
Prior to the April 2016 launch of the current emergency department patient experience survey, the
HQCA, in consultation with emergency department stakeholders, reviewed the relevant literature,
previously developed emergency department survey tools, and survey material from both the public and
private domain. As a result, several well validated survey tools were identified as options. The
Emergency Department Patient Experience of Care (EDPEC) Survey tool, developed by the RAND
Corporation, was ultimately selected based on multiple criteria. The decision to use this instrument
reflects a number of benefits associated with this survey tool. These benefits include:
The EDPEC is a new evolution of emergency department patient experience surveys. A
significant aspect of the RAND Corporation’s development of this instrument involved an initial
review of existing emergency department patient experience surveys, including the HQCA’s
previous survey tool. The information gathered from this extensive review informed the
creation of the EDPEC.
The EDPEC has been extensively validated. The RAND Corporation’s survey development
process has involved extensive testing and validation of the survey tool in the United States.vii
This validation work continues.viii The HQCA’s EDPEC questionnaire was also validated in
Alberta prior to use.
The EDPEC will be used in other jurisdictions. The RAND Corporation is developing the
EDPEC Survey under contract by the Centers for Medicare & Medicaid Services (CMS) in the
United States. CMS has implemented a number of Consumer Assessment of Healthcare Providers
and Systems (CAHPS) surveys to assess patient experience in a number of different healthcare
service sectors. The intent of this contractual relationship is to develop a survey that follows
CAHPS principles and addresses patients’ experiences with emergency department services.
This product will likely be considered for endorsement as a CAHPS instrument once complete.ix
As a CAHPS instrument, this survey would be used extensively in the United States. In Canada,
the HQCA has been in correspondence with health quality organizations in both British
Columbia and Ontario about the use of this survey instrument. Currently, Ontario has
implemented the EDPEC survey, while British Columbia plans to begin surveying with this tool
in 2017. The EDPEC’s use in these jurisdictions will allow for both inter-provincial and
international comparisons.
This survey instrument, developed by the RAND Corporation for CMS, was used as the core set of
questions for the HQCA survey with written permission from the RAND Corporation. Building on the
EDPEC Survey, the HQCA retained additional items from the HQCA’s previous emergency department
patient experience survey to reflect the unique Alberta context. In addition, the EQ-5D (a five-item
vii For more information about the circumstances driving the development of this survey, see bullet titled “The EDPEC will be used in other jurisdictions” below. viii Because the validation period has not been closed by the RAND Corporation, the EDPEC Survey is not yet publically available. Therefore, the HQCA is using this instrument with written permission from the RAND Corporation. One of the principles of CAHPS is that all tools will be made available publically, so in the future this could become unnecessary. ix For more information about survey development, please visit: http://www.rand.org/content/dam/rand/pubs/research_reports/RR700/RR761/RAND_RR761.pdf.
SURVEY METHODOLOGY 6
health related quality of life measure) was included with permission of the EuroQol Foundation.x In
total, the HQCA employs four different survey versions, including:
An instrument for adult (16 years of age or older) patients who were discharged to the
community from the emergency department.
An instrument for adult (16 years of age or older) patients who were admitted to the hospital as
inpatients from the emergency department.
An instrument for a parent or guardian of pediatric (12 years of age or younger) patients who
were discharged to the community from the emergency department.
An instrument for a parent or guardian of pediatric (12 years of age or younger) patients who
were admitted to the hospital as inpatients from the emergency department.xi
The EDPEC’s core survey questions underwent several rounds of field testing and validation work,
which included psychometric testing, from 2012 to 2016, as part of the survey development work by the
RAND Corporation. In February and March of 2016, a pilot test involving 1,125 emergency department
patients was conducted. The pilot test conducted by the HQCA involved adults and children who visited
one of Alberta’s 16 busiest emergency departments during February and March of 2016.xii The pilot test
helped to uncover challenges in conducting the survey and to establish the survey methodology.
The full survey was launched in April 2016. Following five months of data collection, in August 2016,
further evaluation of psychometric properties, validity, and reliability at the patient level were
conducted. Additionally, evaluation of structure and validity of possible composite indicators
(components/factors) was conducted.xiii
2.2 Privacy impact assessment
As a custodian under the Health Information Act of Alberta, the HQCA submitted a privacy impact
assessment (PIA) to conduct this survey and related data matching and analysis. The PIA was initially
submitted to and was accepted by the Office of the Information and Privacy Commissioner (OIPC) of
Alberta in 2007. In 2016, the HQCA submitted an amendment to this original PIA, outlining the HQCA’s
new emergency department patient experience survey instrument and the decision to shift from point-
in-time (cross-sectional) surveying to bi-weekly (semi-continuous) surveying. This amendment was also
accepted by the OIPC.
2.3 RFP and selection of survey vendor
The HQCA had previously selected and engaged the services of Prairie Research Associates Incorporated
(PRA), a national research firm, to conduct the 2007, 2009, and 2010-2013 emergency department
patient experience surveys. In 2015, the HQCA put out an open call for proposals to conduct the current
(2016+) survey. Eight proposals were received and reviewed by the HQCA on a number of standardized
criteria, resulting in the selection of PRA to conduct the current version of the HQCA’s emergency
department patient experience survey.
x For more information about the EQ-5D and the EuroQol Foundation, please visit http://www.euroqol.org/home.html. xi Copies of the HQCA’s four emergency department survey versions are provided in Appendix IV. xii Surveys for the pediatric population (12 years of age or younger) were conducted with a parent or guardian of patients at the Alberta Children’s Hospital and the Stollery Children’s Hospital. The survey instrument for this population was field-tested along with the adult version and was modified to facilitate responses from a third party rather than the actual patient. xiii More information regarding the calculation of these composite indicators is provided in Appendix I.
SURVEY METHODOLOGY 7
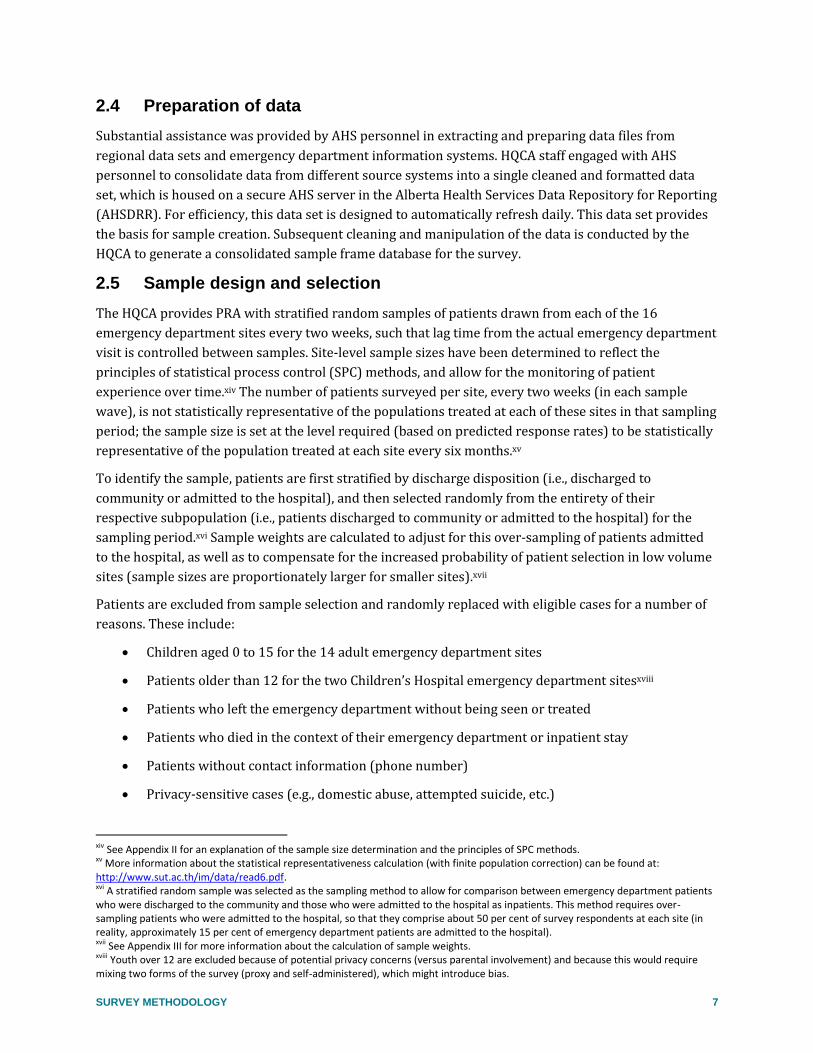
2.4 Preparation of data
Substantial assistance was provided by AHS personnel in extracting and preparing data files from
regional data sets and emergency department information systems. HQCA staff engaged with AHS
personnel to consolidate data from different source systems into a single cleaned and formatted data
set, which is housed on a secure AHS server in the Alberta Health Services Data Repository for Reporting
(AHSDRR). For efficiency, this data set is designed to automatically refresh daily. This data set provides
the basis for sample creation. Subsequent cleaning and manipulation of the data is conducted by the
HQCA to generate a consolidated sample frame database for the survey.
2.5 Sample design and selection
The HQCA provides PRA with stratified random samples of patients drawn from each of the 16
emergency department sites every two weeks, such that lag time from the actual emergency department
visit is controlled between samples. Site-level sample sizes have been determined to reflect the
principles of statistical process control (SPC) methods, and allow for the monitoring of patient
experience over time.xiv The number of patients surveyed per site, every two weeks (in each sample
wave), is not statistically representative of the populations treated at each of these sites in that sampling
period; the sample size is set at the level required (based on predicted response rates) to be statistically
representative of the population treated at each site every six months.xv
To identify the sample, patients are first stratified by discharge disposition (i.e., discharged to
community or admitted to the hospital), and then selected randomly from the entirety of their
respective subpopulation (i.e., patients discharged to community or admitted to the hospital) for the
sampling period.xvi Sample weights are calculated to adjust for this over-sampling of patients admitted
to the hospital, as well as to compensate for the increased probability of patient selection in low volume
sites (sample sizes are proportionately larger for smaller sites).xvii
Patients are excluded from sample selection and randomly replaced with eligible cases for a number of
reasons. These include:
Children aged 0 to 15 for the 14 adult emergency department sites
Patients older than 12 for the two Children’s Hospital emergency department sitesxviii
Patients who left the emergency department without being seen or treated
Patients who died in the context of their emergency department or inpatient stay
Patients without contact information (phone number)
Privacy-sensitive cases (e.g., domestic abuse, attempted suicide, etc.)
xiv See Appendix II for an explanation of the sample size determination and the principles of SPC methods. xv More information about the statistical representativeness calculation (with finite population correction) can be found at: http://www.sut.ac.th/im/data/read6.pdf. xvi A stratified random sample was selected as the sampling method to allow for comparison between emergency department patients who were discharged to the community and those who were admitted to the hospital as inpatients. This method requires over-sampling patients who were admitted to the hospital, so that they comprise about 50 per cent of survey respondents at each site (in reality, approximately 15 per cent of emergency department patients are admitted to the hospital). xvii See Appendix III for more information about the calculation of sample weights. xviii Youth over 12 are excluded because of potential privacy concerns (versus parental involvement) and because this would require mixing two forms of the survey (proxy and self-administered), which might introduce bias.
SURVEY METHODOLOGY 8
Duplicate visits and respondent selection within the past year
As with the 2010-2013 survey, since April of 2016 PRA has been provided with samples of patients who
visited each of the 16 sites every two weeks.xix
2.6 Survey process
The HQCA’s current (2016+) emergency department patient experience survey is conducted exclusively
by telephone. A computer-assisted telephone interviewing (CATI) system (Voxco) is used to administer
the survey. The CATI system allows for skip patterns to be programmed into the survey, tracks call
outcomes for each telephone number dialed, and eases the management of interview scheduling and
callbacks.
When a respondent is reached, interviewers ask if the respondent is willing and able to complete the
survey at that time. If they are unable to complete the survey at that time, interviewers schedule a time
to re-contact the participant to conduct the survey at a time that is convenient for them (either day or
night). Telephone numbers for which there is no answer are called at different times of the day. This
ensures that shift workers and others who are not home during the evening have an opportunity to be
contacted. Up to nine call attempts are made in an attempt to reach potential respondents. When a final
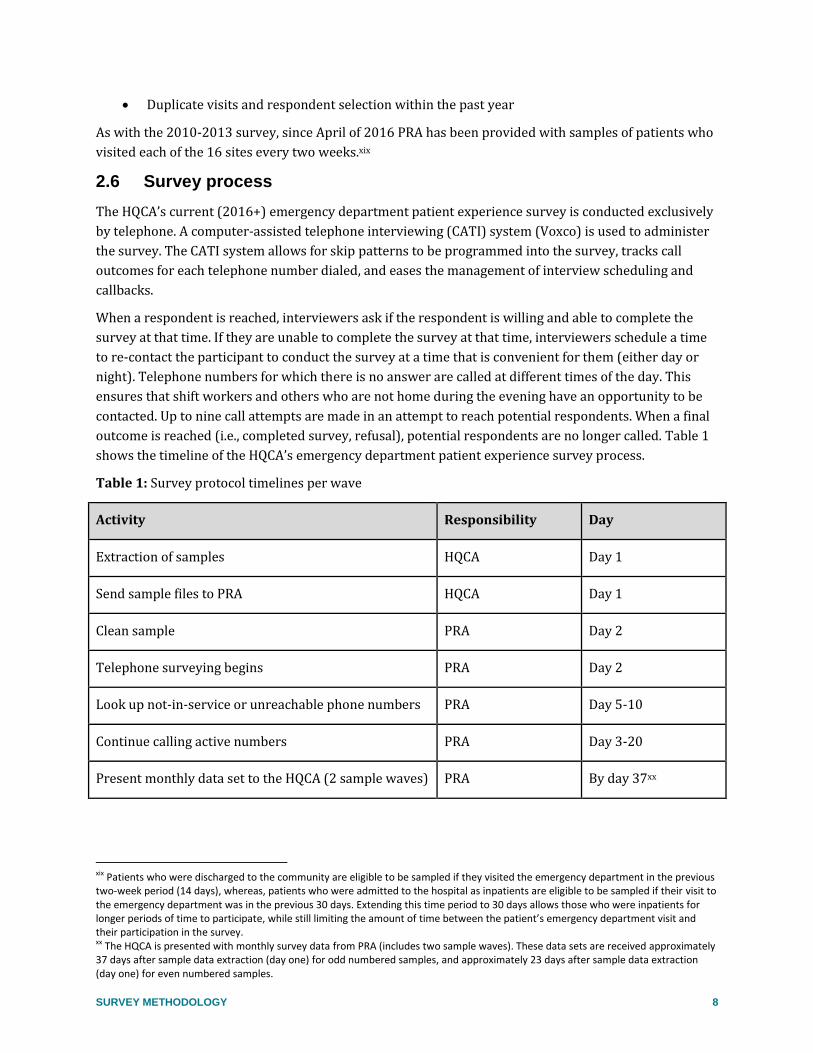
outcome is reached (i.e., completed survey, refusal), potential respondents are no longer called. Table 1
shows the timeline of the HQCA’s emergency department patient experience survey process.
Table 1: Survey protocol timelines per wave
Activity Responsibility Day
Extraction of samples HQCA Day 1
Send sample files to PRA HQCA Day 1
Clean sample PRA Day 2
Telephone surveying begins PRA Day 2
Look up not-in-service or unreachable phone numbers PRA Day 5-10
Continue calling active numbers PRA Day 3-20
Present monthly data set to the HQCA (2 sample waves) PRA By day 37xx
xix Patients who were discharged to the community are eligible to be sampled if they visited the emergency department in the previous two-week period (14 days), whereas, patients who were admitted to the hospital as inpatients are eligible to be sampled if their visit to the emergency department was in the previous 30 days. Extending this time period to 30 days allows those who were inpatients for longer periods of time to participate, while still limiting the amount of time between the patient’s emergency department visit and their participation in the survey. xx The HQCA is presented with monthly survey data from PRA (includes two sample waves). These data sets are received approximately 37 days after sample data extraction (day one) for odd numbered samples, and approximately 23 days after sample data extraction (day one) for even numbered samples.
SURVEY METHODOLOGY 9
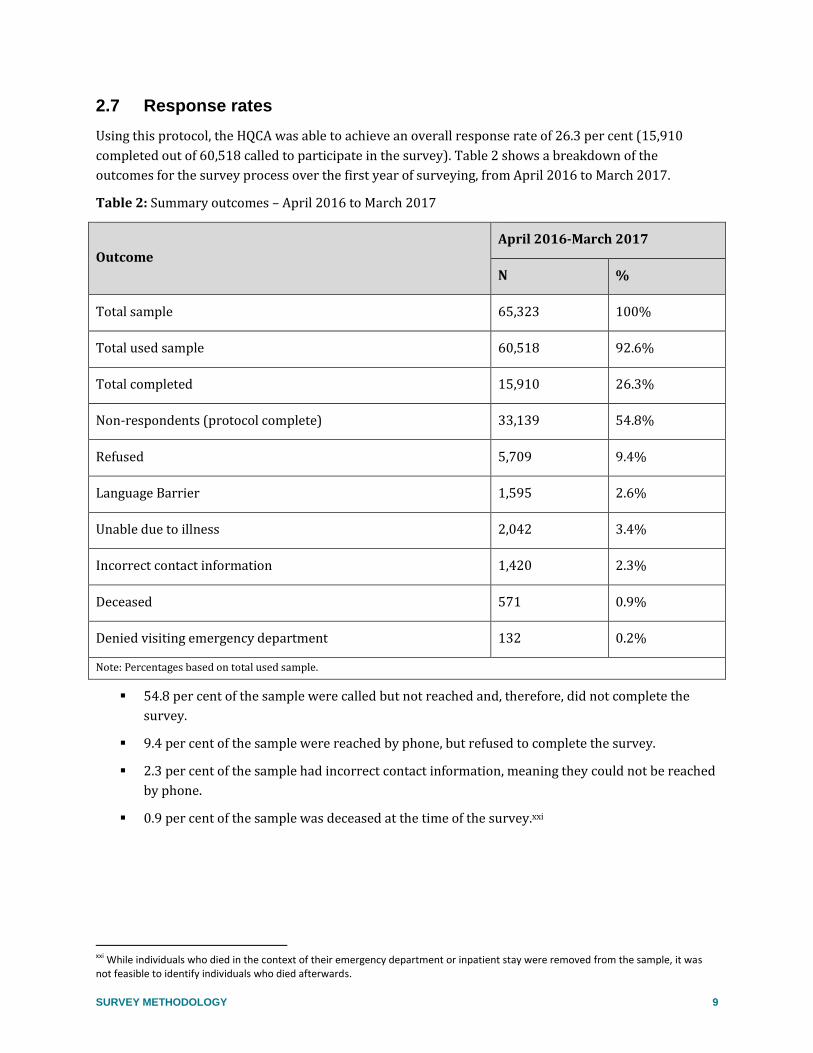
2.7 Response rates
Using this protocol, the HQCA was able to achieve an overall response rate of 26.3 per cent (15,910
completed out of 60,518 called to participate in the survey). Table 2 shows a breakdown of the
outcomes for the survey process over the first year of surveying, from April 2016 to March 2017.
Table 2: Summary outcomes – April 2016 to March 2017
Outcome
April 2016-March 2017
N %
Total sample 65,323 100%
Total used sample 60,518 92.6%
Total completed 15,910 26.3%
Non-respondents (protocol complete) 33,139 54.8%
Refused 5,709 9.4%
Language Barrier 1,595 2.6%
Unable due to illness 2,042 3.4%
Incorrect contact information 1,420 2.3%
Deceased 571 0.9%
Denied visiting emergency department 132 0.2%
Note: Percentages based on total used sample.
54.8 per cent of the sample were called but not reached and, therefore, did not complete the
survey.
9.4 per cent of the sample were reached by phone, but refused to complete the survey.
2.3 per cent of the sample had incorrect contact information, meaning they could not be reached
by phone.
0.9 per cent of the sample was deceased at the time of the survey.xxi
xxi While individuals who died in the context of their emergency department or inpatient stay were removed from the sample, it was not feasible to identify individuals who died afterwards.
SURVEY METHODOLOGY 10
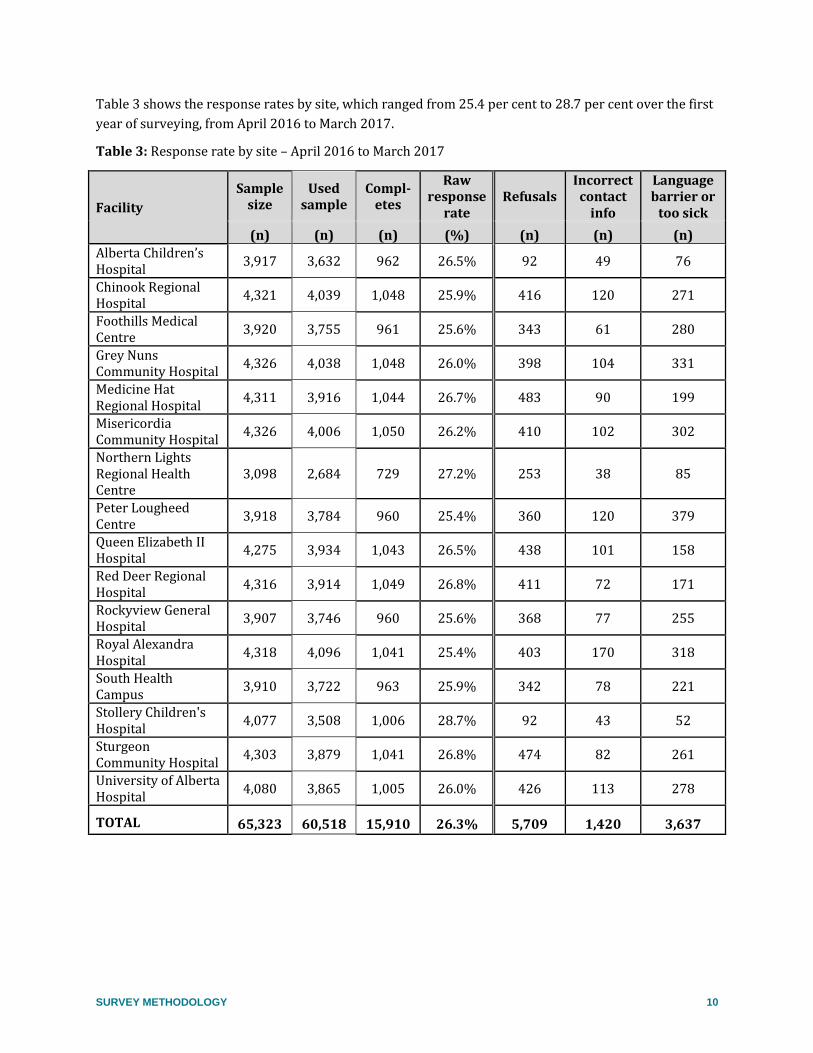
Table 3 shows the response rates by site, which ranged from 25.4 per cent to 28.7 per cent over the first
year of surveying, from April 2016 to March 2017.
Table 3: Response rate by site – April 2016 to March 2017
Facility
Sample size
Used sample
Compl-etes
Raw response
rate Refusals
Incorrect contact
info
Language barrier or
too sick
(n) (n) (n) (%) (n) (n) (n)
Alberta Children’s Hospital
3,917 3,632 962 26.5% 92 49 76
Chinook Regional Hospital
4,321 4,039 1,048 25.9% 416 120 271
Foothills Medical Centre
3,920 3,755 961 25.6% 343 61 280
Grey Nuns Community Hospital
4,326 4,038 1,048 26.0% 398 104 331
Medicine Hat Regional Hospital
4,311 3,916 1,044 26.7% 483 90 199
Misericordia Community Hospital
4,326 4,006 1,050 26.2% 410 102 302
Northern Lights Regional Health Centre
3,098 2,684 729 27.2% 253 38 85
Peter Lougheed Centre
3,918 3,784 960 25.4% 360 120 379
Queen Elizabeth II Hospital
4,275 3,934 1,043 26.5% 438 101 158
Red Deer Regional Hospital
4,316 3,914 1,049 26.8% 411 72 171
Rockyview General Hospital
3,907 3,746 960 25.6% 368 77 255
Royal Alexandra Hospital
4,318 4,096 1,041 25.4% 403 170 318
South Health Campus
3,910 3,722 963 25.9% 342 78 221
Stollery Children's Hospital
4,077 3,508 1,006 28.7% 92 43 52
Sturgeon Community Hospital
4,303 3,879 1,041 26.8% 474 82 261
University of Alberta Hospital
4,080 3,865 1,005 26.0% 426 113 278
TOTAL 65,323 60,518 15,910 26.3% 5,709 1,420 3,637
SURVEY METHODOLOGY 11
2.8 Definition of compared groups
The patients from the 16 emergency department sites that participated in this survey should not be
considered representative of the entire population of emergency patients in the province of Alberta. In
fact, many smaller rural sites have not been included in this survey. The HQCA used the following
criteria to identify the emergency departments that would participate in the survey:
The site needed to have at least 50,000 emergency department visits per year, and
The site needed to be attached to a hospital that offers acute care services (the emergency
department needs to have the ability to admit patients to the hospital, without having to transfer
them to another facility).
In general, the 16 large urban or regional hospital emergency departments surveyed are faced with
different and often more severe challenges than smaller rural emergency departments. This survey
focuses on sites that routinely deal with the greatest crowding pressures, longest wait times, and
historically the poorest patient experience.xxii
While it is possible to perform provincial-level analyses (an aggregate of the 16 sites surveyed) using the
data collected from this survey, the HQCA has avoided such reporting. The fundamental flaw of
provincial-aggregate results is that they assume patients presenting to different sites all enter the same
provincial emergency department care delivery system; and this is not the case. Emergency department
facilities are diverse regarding the programs and initiatives they implement to improve care. Thus, site-
level results are the source of actionable information in terms of improvement opportunities.
Furthermore, the HQCA encourages the comparison of sites for the purpose of shared learning. To
facilitate this, the HQCA’s reporting initiative for this survey – an interactive web-based platform called
FOCUS on Emergency Departments – has, in consultation with emergency department stakeholders,
grouped sites into peer groupings so that similar hospitals (based on size, volume, services, proximity to
large urban/metropolitan centres) are fairly compared. Emergency department sites are assigned to one
of the following four peer groups:
Large urban with trauma: Hospitals considered trauma centres have medical staff and
resources dedicated to the care of major trauma patients. They provide advanced healthcare
services (e.g., burn unit, neurosurgery, cardiac ICU, transplant services). In Alberta, these are the
University of Alberta Hospital and the Royal Alexandra Hospital in Edmonton, and the Foothills
Medical Centre in Calgary.
Large urban: Includes non-trauma hospitals located in Calgary and Edmonton that provide a
full range of acute care services. In Calgary, these hospitals have specialized services not located
at the trauma centre. The large urban sites include the Grey Nuns Community Hospital and the
Misericordia Community Hospital in Edmonton, and the Peter Lougheed Centre, the Rockyview
General Hospital, and the South Health Campus in Calgary.
Medium urban: Includes regional hospitals that serve southern, northern, and central Alberta
with intensive care units, as well as acute care services, obstetrics, surgery, mental health, and
geriatrics. These hospitals also offer early stabilization of major trauma patients and transfers to
xxii Based on the HQCA’s 2007 emergency department survey results, patient experience tends to be more positive at the smaller rural emergency department sites.
SURVEY METHODOLOGY 12
trauma centres. The medium urban sites include the Chinook Regional Hospital (Lethbridge),
the Medicine Hat Regional Hospital, the Northern Lights Regional Health Centre (Fort
MacMurray), the Queen Elizabeth II Hospital (Grande Prairie), the Red Deer Regional Hospital,
and the Sturgeon Community Hospital (St. Albert).
Children’s: Hospitals for patients from birth to 18 years of age, with care delivered by
multidisciplinary clinical trauma teams. These hospitals account for the unique needs of children
and their families, including anatomic, physiologic, and psychologic differences, maintaining a
setting of family-centered care. These include the Alberta Children’s Hospital in Calgary and the
Stollery Children’s Hospital in Edmonton.
APPENDIX I 13
APPENDIX I: PRINCIPLE COMPONENTS ANALYSIS, COMPOSITES, AND
RELIABILITY
Principle components analysis
To examine the potential for composite variables and to examine the structure of the data, correlation
and a principle components analysis were conducted on the data set using Stata and SPSS. Principle
components analysis uses correlation and covariance between individual variables to identify sets of
variables that share common underlying “themes”. In this case, the principle components analysis was
conducted on items which target emergency department quality issues as opposed to the context of the
emergency department visit.
The principle components analysis utilized a number of different approaches. Different assumptions
regarding missing data were also tried, with similar results to those presented in Table 4. The most
effective and logically consistent results came from the use of pair-wise deletion of missing data as
opposed to list-wise deletion or substitution (or imputation) of the mean.
Varimax (orthogonal) and promax (oblique) rotation were applied (to ‘align’ related variables in 3-
dimensional space) with similar results. The various models were set to extract components with
eigenvalues greater than one, consistently resulting in similar five-component solutions. No components
consisted of a single survey question; therefore, it was seen to be unnecessary to force the number of
components to be extracted by the models.
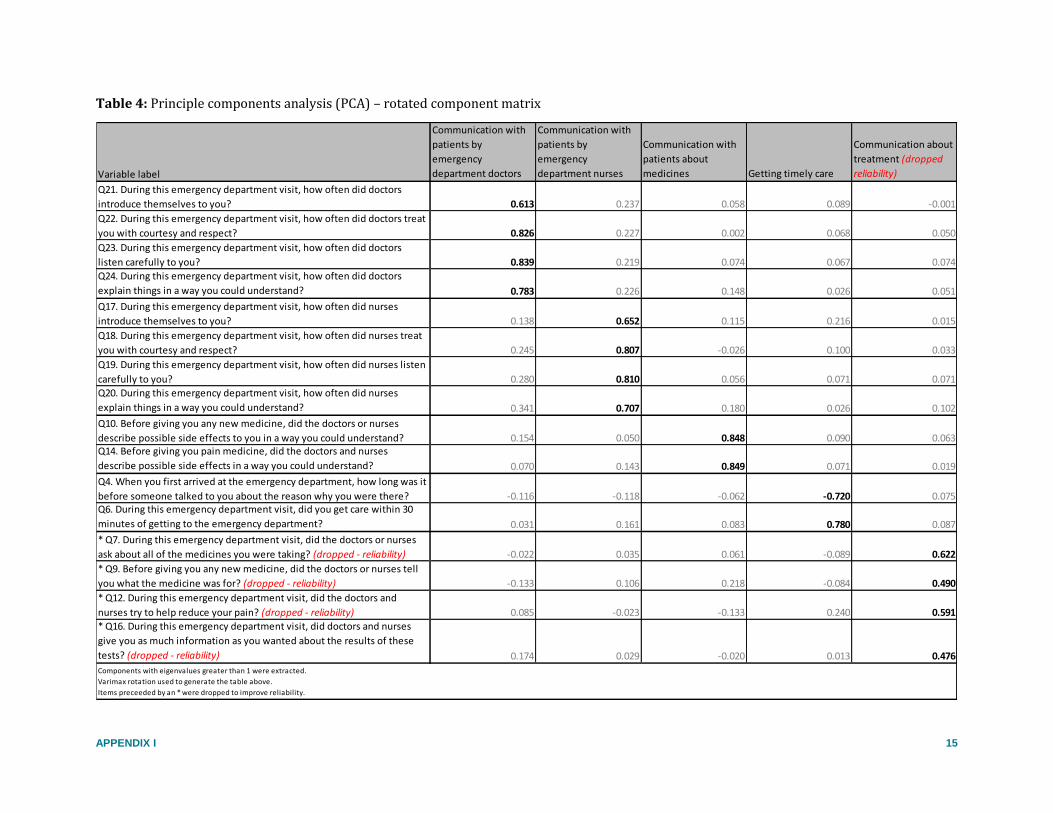
The final model resulted in a five-component solution and used varimax (orthogonal) rotation.
Component item membership is logically consistent, and similar in different study groups.xxiii A
summary of the final principle components analysis results (based on the rotated component matrix)
are presented in Table 4.
An extremely consistent and logical component structure emerged regardless of intentional variation in
methods, suggesting that the survey questions have good construct validity, cover a diversity of patient
issues, and represent discrete themes. This appears to reflect the high quality of validation work
undertaken by the RAND Corporation in the development of the original Emergency Department Patient
Experience of Care (EDPEC) survey instrument.
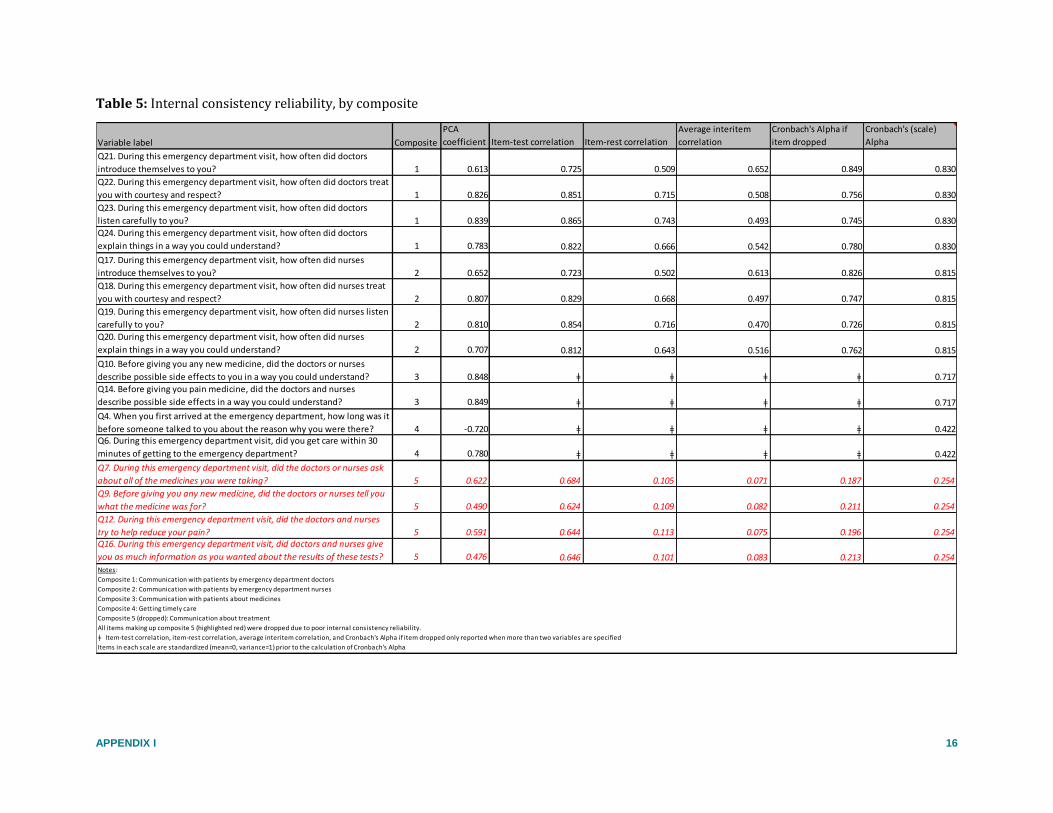
Internal consistency reliability
Following the principle components analysis, the items that correlated strongly with a particular
component were analyzed to determine the internal consistency reliability of each potential multi-item
composite scale using Cronbach’s alphaxxiv and standardized Cronbach’s alpha.xxv Alphas are expected to
be lower if items within the scale reflect more than one underlying dimension. As shown in Table 5,
alphas for tested scales are high in most cases, with the exception of the ‘communication about
treatment’ composite at 0.25. The items which make up this composite were dropped due to this poor
internal consistency reliability score (alpha), suggesting that the items did not fit optimally within the
same scale. Among the four remaining composites, the alphas range from 0.83 for the ‘communication
xxiii Preliminary principle components analysis models were run separately for admitted and discharged emergency department patients. xxiv Cronbach’s alpha is a frequently used measure of internal consistency reliability for scales. Specifically, it is a measure of squared correlation between observed scores and true scores. xxv Raw alpha is based on item correlation and standardized alpha is based on covariance.
APPENDIX I 14
with patients by emergency department doctors’ composite to 0.42 for the ‘getting timely care’
composite. In general, the higher the alpha, the more reliable the measure; all composites other than the
‘getting timely care’ composite and the dropped ‘communication about treatment’ composite exceed the
‘acceptable’ alpha of 0.70 suggested by Nunnally.1
Regarding the ‘communication with patients by emergency department doctors’ composite and the
‘communication with patients by emergency department nurses’ composite, one item in each scale was
retained despite minimal predicted improvements in their alphas if dropped. This was due to theoretical
arguments for their inclusion in the composite scale and the inconsequential predicted improvement of
the alpha.
APPENDIX I 15
Table 4: Principle components analysis (PCA) – rotated component matrix
Variable label
Communication with
patients by
emergency
department doctors
Communication with
patients by
emergency
department nurses
Communication with
patients about
medicines Getting timely care
Communication about
treatment (dropped
reliability)
Q21. During this emergency department visit, how often did doctors
introduce themselves to you? 0.613 0.237 0.058 0.089 -0.001
Q22. During this emergency department visit, how often did doctors treat
you with courtesy and respect? 0.826 0.227 0.002 0.068 0.050
Q23. During this emergency department visit, how often did doctors
listen carefully to you? 0.839 0.219 0.074 0.067 0.074
Q24. During this emergency department visit, how often did doctors
explain things in a way you could understand? 0.783 0.226 0.148 0.026 0.051
Q17. During this emergency department visit, how often did nurses
introduce themselves to you? 0.138 0.652 0.115 0.216 0.015
Q18. During this emergency department visit, how often did nurses treat
you with courtesy and respect? 0.245 0.807 -0.026 0.100 0.033
Q19. During this emergency department visit, how often did nurses listen
carefully to you? 0.280 0.810 0.056 0.071 0.071
Q20. During this emergency department visit, how often did nurses
explain things in a way you could understand? 0.341 0.707 0.180 0.026 0.102
Q10. Before giving you any new medicine, did the doctors or nurses
describe possible side effects to you in a way you could understand? 0.154 0.050 0.848 0.090 0.063Q14. Before giving you pain medicine, did the doctors and nurses
describe possible side effects in a way you could understand? 0.070 0.143 0.849 0.071 0.019
Q4. When you first arrived at the emergency department, how long was it
before someone talked to you about the reason why you were there? -0.116 -0.118 -0.062 -0.720 0.075Q6. During this emergency department visit, did you get care within 30
minutes of getting to the emergency department? 0.031 0.161 0.083 0.780 0.087
* Q7. During this emergency department visit, did the doctors or nurses
ask about all of the medicines you were taking? (dropped - reliability) -0.022 0.035 0.061 -0.089 0.622
* Q9. Before giving you any new medicine, did the doctors or nurses tell
you what the medicine was for? (dropped - reliability) -0.133 0.106 0.218 -0.084 0.490
* Q12. During this emergency department visit, did the doctors and
nurses try to help reduce your pain? (dropped - reliability) 0.085 -0.023 -0.133 0.240 0.591
* Q16. During this emergency department visit, did doctors and nurses
give you as much information as you wanted about the results of these
tests? (dropped - reliability) 0.174 0.029 -0.020 0.013 0.476
Components with eigenvalues greater than 1 were extracted.
Varimax rotation used to generate the table above.
Items preceeded by an * were dropped to improve reliability.
APPENDIX I 16
Table 5: Internal consistency reliability, by composite
Variable label Composite
PCA
coefficient Item-test correlation Item-rest correlation
Average interitem
correlation
Cronbach's Alpha if
item dropped
Cronbach's (scale)
Alpha
Q21. During this emergency department visit, how often did doctors
introduce themselves to you? 1 0.613 0.725 0.509 0.652 0.849 0.830
Q22. During this emergency department visit, how often did doctors treat
you with courtesy and respect? 1 0.826 0.851 0.715 0.508 0.756 0.830
Q23. During this emergency department visit, how often did doctors
listen carefully to you? 1 0.839 0.865 0.743 0.493 0.745 0.830
Q24. During this emergency department visit, how often did doctors
explain things in a way you could understand? 1 0.783 0.822 0.666 0.542 0.780 0.830
Q17. During this emergency department visit, how often did nurses
introduce themselves to you? 2 0.652 0.723 0.502 0.613 0.826 0.815
Q18. During this emergency department visit, how often did nurses treat
you with courtesy and respect? 2 0.807 0.829 0.668 0.497 0.747 0.815
Q19. During this emergency department visit, how often did nurses listen
carefully to you? 2 0.810 0.854 0.716 0.470 0.726 0.815
Q20. During this emergency department visit, how often did nurses
explain things in a way you could understand? 2 0.707 0.812 0.643 0.516 0.762 0.815
Q10. Before giving you any new medicine, did the doctors or nurses
describe possible side effects to you in a way you could understand? 3 0.848 ǂ ǂ ǂ ǂ 0.717
Q14. Before giving you pain medicine, did the doctors and nurses
describe possible side effects in a way you could understand? 3 0.849 ǂ ǂ ǂ ǂ 0.717
Q4. When you first arrived at the emergency department, how long was it
before someone talked to you about the reason why you were there? 4 -0.720 ǂ ǂ ǂ ǂ 0.422Q6. During this emergency department visit, did you get care within 30
minutes of getting to the emergency department? 4 0.780 ǂ ǂ ǂ ǂ 0.422
Q7. During this emergency department visit, did the doctors or nurses ask
about all of the medicines you were taking? 5 0.622 0.684 0.105 0.071 0.187 0.254
Q9. Before giving you any new medicine, did the doctors or nurses tell you
what the medicine was for? 5 0.490 0.624 0.109 0.082 0.211 0.254
Q12. During this emergency department visit, did the doctors and nurses
try to help reduce your pain? 5 0.591 0.644 0.113 0.075 0.196 0.254Q16. During this emergency department visit, did doctors and nurses give
you as much information as you wanted about the results of these tests? 5 0.476 0.646 0.101 0.083 0.213 0.254Notes:
Composite 1: Communication with patients by emergency department doctors
Composite 2: Communication with patients by emergency department nurses
Composite 3: Communication with patients about medicines
Composite 4: Getting timely care
Composite 5 (dropped): Communication about treatment
All items making up composite 5 (highlighted red) were dropped due to poor internal consistency reliability.
ǂ Item-test correlation, item-rest correlation, average interitem correlation, and Cronbach's Alpha if item dropped only reported when more than two variables are specified
Items in each scale are standardized (mean=0, variance=1) prior to the calculation of Cronbach's Alpha
APPENDIX I 17
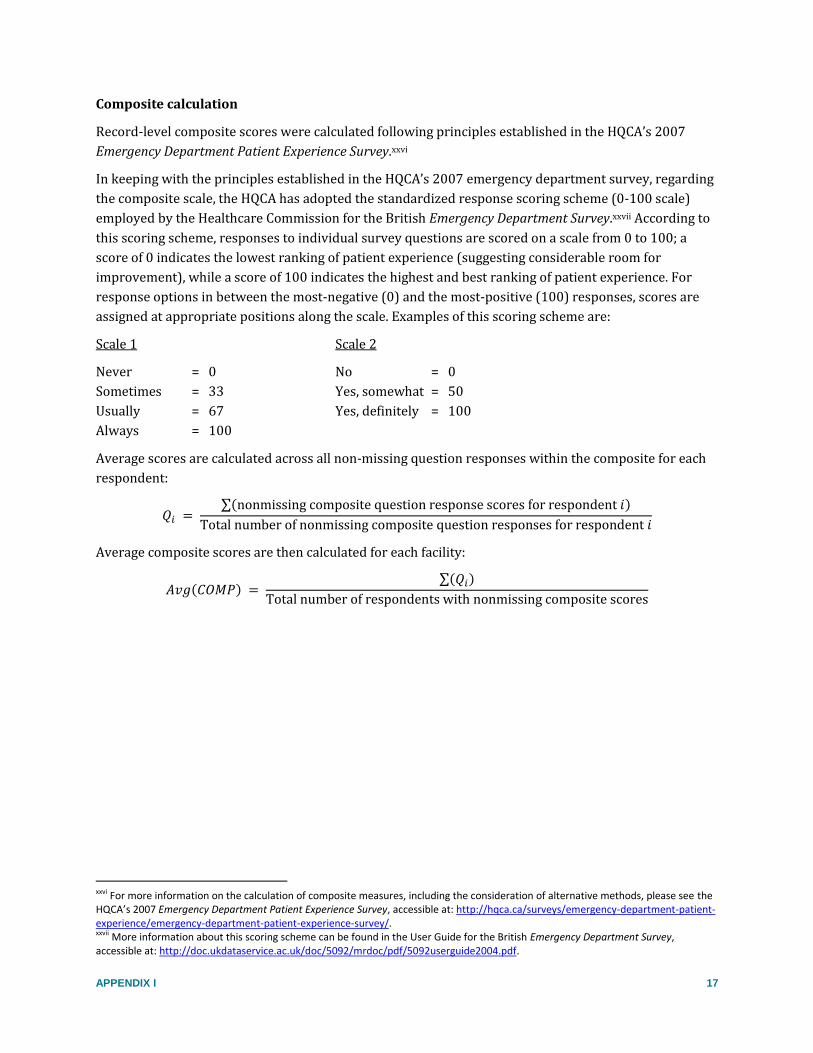
Composite calculation
Record-level composite scores were calculated following principles established in the HQCA’s 2007
Emergency Department Patient Experience Survey.xxvi
In keeping with the principles established in the HQCA’s 2007 emergency department survey, regarding
the composite scale, the HQCA has adopted the standardized response scoring scheme (0-100 scale)
employed by the Healthcare Commission for the British Emergency Department Survey.xxvii According to
this scoring scheme, responses to individual survey questions are scored on a scale from 0 to 100; a
score of 0 indicates the lowest ranking of patient experience (suggesting considerable room for
improvement), while a score of 100 indicates the highest and best ranking of patient experience. For
response options in between the most-negative (0) and the most-positive (100) responses, scores are
assigned at appropriate positions along the scale. Examples of this scoring scheme are:
Scale 1 Scale 2
Never = 0 No = 0
Sometimes = 33 Yes, somewhat = 50
Usually = 67 Yes, definitely = 100
Always = 100
Average scores are calculated across all non-missing question responses within the composite for each
respondent:
𝑄𝑖 = ∑(nonmissing composite question response scores for respondent 𝑖)
Total number of nonmissing composite question responses for respondent 𝑖
Average composite scores are then calculated for each facility:
𝐴𝑣𝑔(𝐶𝑂𝑀𝑃) = ∑(𝑄𝑖)
Total number of respondents with nonmissing composite scores
xxvi For more information on the calculation of composite measures, including the consideration of alternative methods, please see the HQCA’s 2007 Emergency Department Patient Experience Survey, accessible at: http://hqca.ca/surveys/emergency-department-patient-experience/emergency-department-patient-experience-survey/. xxvii More information about this scoring scheme can be found in the User Guide for the British Emergency Department Survey, accessible at: http://doc.ukdataservice.ac.uk/doc/5092/mrdoc/pdf/5092userguide2004.pdf.
APPENDIX II 18
APPENDIX II: SAMPLE SIZE AND THE PRINCIPLES OF STATISTICAL
PROCESS CONTROL (SPC) METHODS
Determining appropriate sample sizes for improvement projects is less well-defined than traditional
research projects, primarily because data is often collected over time.2 As a result, there is no “industry
consensus” regarding how to determine appropriate sample size.
Donald J. Wheeler proposes the following questions about sample sizes:3
Are the data collected in a manner that will allow the charts to detect process changes that are large
enough to be of interest?
Do the data give us the appropriate information needed to take action on our process?
Additional considerations for determining sample size include, but are not limited to, the following:2
project objectives
data type
expected rate of meaningful change in the data
availability of data
availability of resources to collect the data
project importance/visibility
The most desirable methodological solution from the point of view of detecting process shifts for
improvement projects would be to take large samples very frequently; however, this is not economically
feasible.4 Sample size issues in improvement efforts are often a balance between resources and the clarity
of the results desired.2 That is, the sample size determination depends on how many respondents are
needed to observe changes in the data (non-random variation), without being so expensive that the project
is unsustainable.
This issue of appropriately allocating sampling effort often results in the following choice: take smaller
samples at shorter intervals or take larger samples at longer intervals. Industry practice favours smaller,
more frequent samples because it allows for quicker corrective action when a process shift occurs.4
Similarly, healthcare providers and quality improvement personnel benefit from more frequent reporting
because it enables iterative improvement (causes of positive changes can be reinforced, while causes of
negative changes could lead to corrective action). These benefits support the HQCA’s decision to survey
fewer patients than is required for the sample to be statistically representative of the population treated at
each site for a given sampling period.
Many applications of SPC methods use sample sizes as small as five or 10 observations to monitor the
quality of a process.2,4 The HQCA’s previous work with emergency department patient experience surveys
and the application of SPC methods to historical data suggests that a sample size of 30 to 50 emergency
department patients per site, per month, is sufficient to detect meaningful (non-random) changes in patient
experience.xxviii For this iteration of the HQCA’s emergency department survey, the sample size has been
xxviii For more information on the HQCA’s previous application of SPC methods to the analysis of emergency department patient experience data, please see the HQCA’s Urban and Regional Emergency Department Patient Experience Report (2010-2013), accessible at: http://hqca.ca/surveys/emergency-department-patient-experience/.

APPENDIX II 19
increased to between 80 and 100 patients per site, per month. This change should result in process shifts
being detected more efficiently than in the HQCA’s previous application of these methods.
APPENDIX III 20
APPENDIX III: CALCULATION OF SAMPLE WEIGHTS
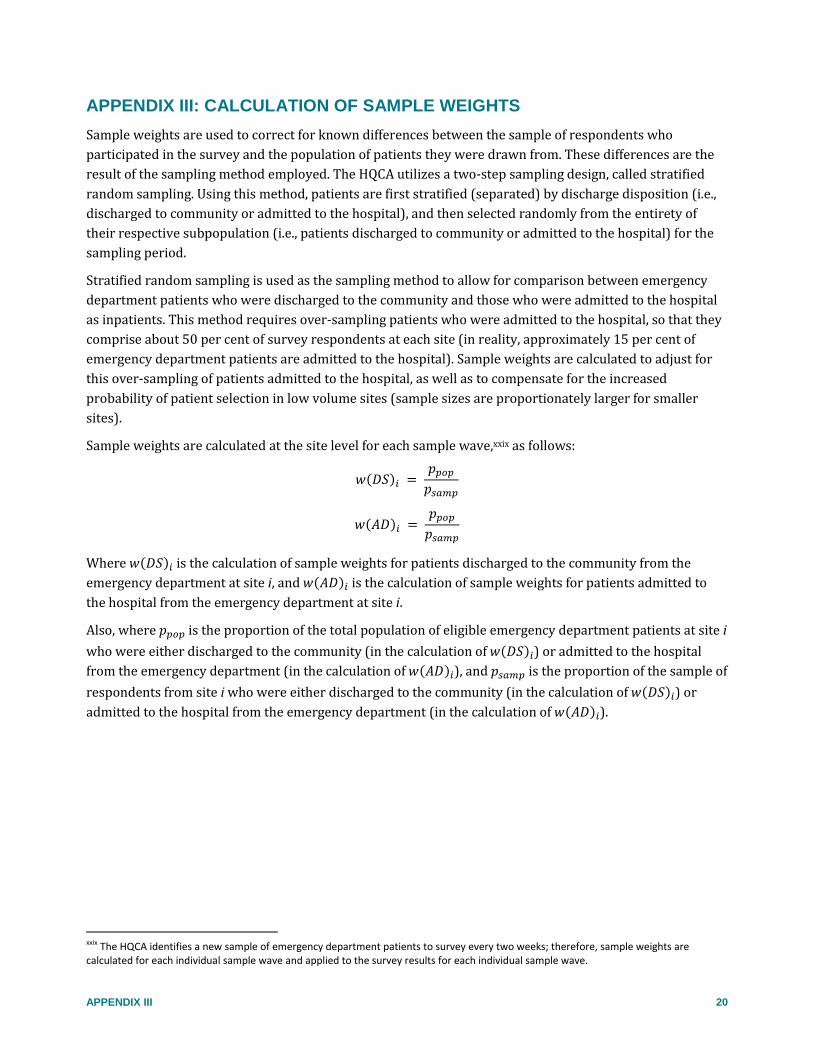
Sample weights are used to correct for known differences between the sample of respondents who
participated in the survey and the population of patients they were drawn from. These differences are the
result of the sampling method employed. The HQCA utilizes a two-step sampling design, called stratified
random sampling. Using this method, patients are first stratified (separated) by discharge disposition (i.e.,
discharged to community or admitted to the hospital), and then selected randomly from the entirety of
their respective subpopulation (i.e., patients discharged to community or admitted to the hospital) for the
sampling period.
Stratified random sampling is used as the sampling method to allow for comparison between emergency
department patients who were discharged to the community and those who were admitted to the hospital
as inpatients. This method requires over-sampling patients who were admitted to the hospital, so that they
comprise about 50 per cent of survey respondents at each site (in reality, approximately 15 per cent of
emergency department patients are admitted to the hospital). Sample weights are calculated to adjust for
this over-sampling of patients admitted to the hospital, as well as to compensate for the increased
probability of patient selection in low volume sites (sample sizes are proportionately larger for smaller
sites).
Sample weights are calculated at the site level for each sample wave,xxix as follows:
𝑤(𝐷𝑆)𝑖 = 𝑝𝑝𝑜𝑝
𝑝𝑠𝑎𝑚𝑝
𝑤(𝐴𝐷)𝑖 = 𝑝𝑝𝑜𝑝
𝑝𝑠𝑎𝑚𝑝
Where 𝑤(𝐷𝑆)𝑖 is the calculation of sample weights for patients discharged to the community from the
emergency department at site i, and 𝑤(𝐴𝐷)𝑖 is the calculation of sample weights for patients admitted to
the hospital from the emergency department at site i.
Also, where 𝑝𝑝𝑜𝑝 is the proportion of the total population of eligible emergency department patients at site i
who were either discharged to the community (in the calculation of 𝑤(𝐷𝑆)𝑖) or admitted to the hospital
from the emergency department (in the calculation of 𝑤(𝐴𝐷)𝑖), and 𝑝𝑠𝑎𝑚𝑝 is the proportion of the sample of
respondents from site i who were either discharged to the community (in the calculation of 𝑤(𝐷𝑆)𝑖) or
admitted to the hospital from the emergency department (in the calculation of 𝑤(𝐴𝐷)𝑖).
xxix The HQCA identifies a new sample of emergency department patients to survey every two weeks; therefore, sample weights are calculated for each individual sample wave and applied to the survey results for each individual sample wave.
APPENDIX IV 21
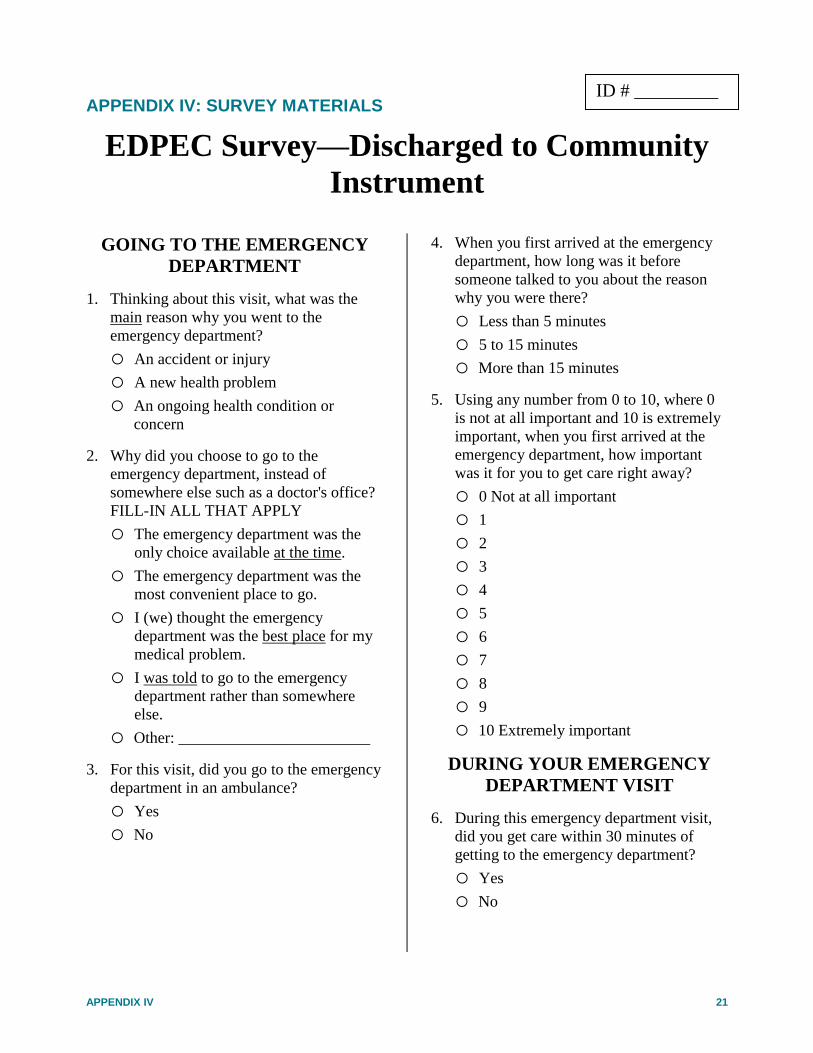
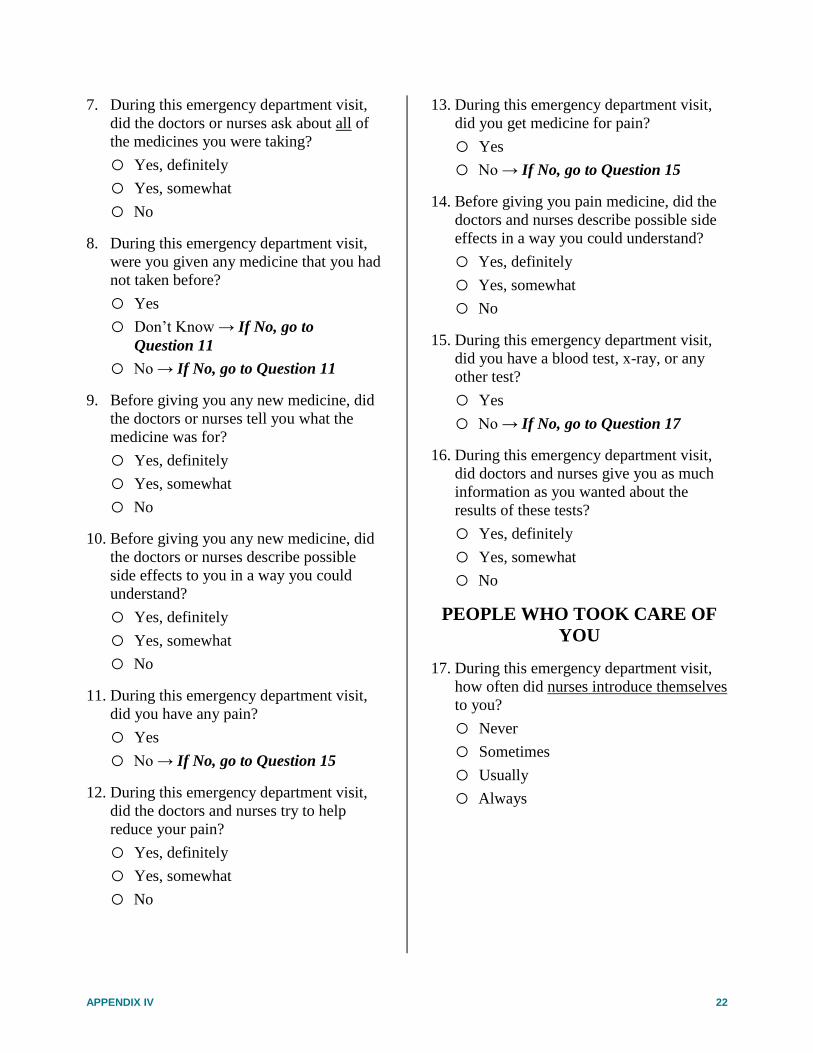
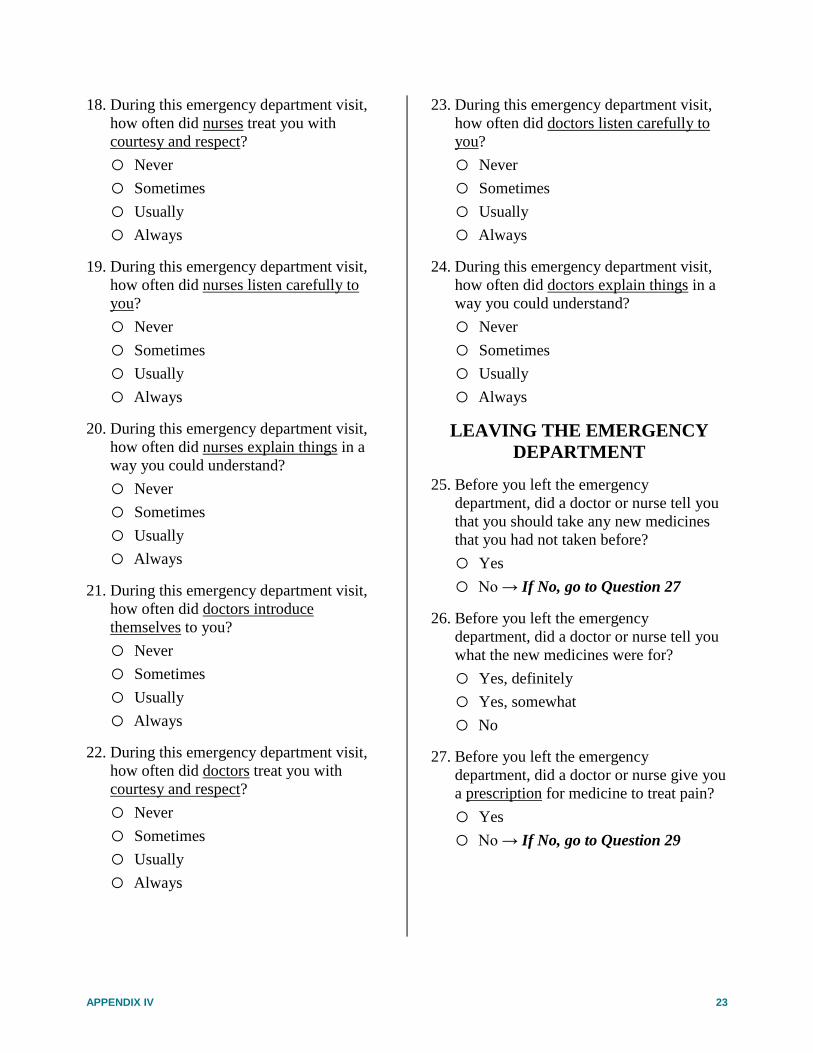
APPENDIX IV: SURVEY MATERIALS
EDPEC Survey—Discharged to Community
Instrument
GOING TO THE EMERGENCY
DEPARTMENT
1. Thinking about this visit, what was the
main reason why you went to the
emergency department?
o An accident or injury
o A new health problem
o An ongoing health condition or
concern
2. Why did you choose to go to the
emergency department, instead of
somewhere else such as a doctor's office?
FILL-IN ALL THAT APPLY
o The emergency department was the
only choice available at the time.
o The emergency department was the
most convenient place to go.
o I (we) thought the emergency
department was the best place for my
medical problem.
o I was told to go to the emergency
department rather than somewhere
else.
o Other: ________________________
3. For this visit, did you go to the emergency
department in an ambulance?
o Yes
o No
4. When you first arrived at the emergency
department, how long was it before
someone talked to you about the reason
why you were there?
o Less than 5 minutes
o 5 to 15 minutes
o More than 15 minutes
5. Using any number from 0 to 10, where 0
is not at all important and 10 is extremely
important, when you first arrived at the
emergency department, how important
was it for you to get care right away?
o 0 Not at all important
o 1
o 2
o 3
o 4
o 5
o 6
o 7
o 8
o 9
o 10 Extremely important
DURING YOUR EMERGENCY
DEPARTMENT VISIT
6. During this emergency department visit,
did you get care within 30 minutes of
getting to the emergency department?
o Yes
o No
ID # _________
APPENDIX IV 22
7. During this emergency department visit,
did the doctors or nurses ask about all of
the medicines you were taking?
o Yes, definitely
o Yes, somewhat
o No
8. During this emergency department visit,
were you given any medicine that you had
not taken before?
o Yes
o Don’t Know → If No, go to
Question 11
o No → If No, go to Question 11
9. Before giving you any new medicine, did
the doctors or nurses tell you what the
medicine was for?
o Yes, definitely
o Yes, somewhat
o No
10. Before giving you any new medicine, did
the doctors or nurses describe possible
side effects to you in a way you could
understand?
o Yes, definitely
o Yes, somewhat
o No
11. During this emergency department visit,
did you have any pain?
o Yes
o No → If No, go to Question 15
12. During this emergency department visit,
did the doctors and nurses try to help
reduce your pain?
o Yes, definitely
o Yes, somewhat
o No
13. During this emergency department visit,
did you get medicine for pain?
o Yes
o No → If No, go to Question 15
14. Before giving you pain medicine, did the
doctors and nurses describe possible side
effects in a way you could understand?
o Yes, definitely
o Yes, somewhat
o No
15. During this emergency department visit,
did you have a blood test, x-ray, or any
other test?
o Yes
o No → If No, go to Question 17
16. During this emergency department visit,
did doctors and nurses give you as much
information as you wanted about the
results of these tests?
o Yes, definitely
o Yes, somewhat
o No
PEOPLE WHO TOOK CARE OF
YOU
17. During this emergency department visit,
how often did nurses introduce themselves
to you?
o Never
o Sometimes
o Usually
o Always
APPENDIX IV 23
18. During this emergency department visit,
how often did nurses treat you with
courtesy and respect?
o Never
o Sometimes
o Usually
o Always
19. During this emergency department visit,
how often did nurses listen carefully to
you?
o Never
o Sometimes
o Usually
o Always
20. During this emergency department visit,
how often did nurses explain things in a
way you could understand?
o Never
o Sometimes
o Usually
o Always
21. During this emergency department visit,
how often did doctors introduce
themselves to you?
o Never
o Sometimes
o Usually
o Always
22. During this emergency department visit,
how often did doctors treat you with
courtesy and respect?
o Never
o Sometimes
o Usually
o Always
23. During this emergency department visit,
how often did doctors listen carefully to
you?
o Never
o Sometimes
o Usually
o Always
24. During this emergency department visit,
how often did doctors explain things in a
way you could understand?
o Never
o Sometimes
o Usually
o Always
LEAVING THE EMERGENCY
DEPARTMENT
25. Before you left the emergency
department, did a doctor or nurse tell you
that you should take any new medicines
that you had not taken before?
o Yes
o No → If No, go to Question 27
26. Before you left the emergency
department, did a doctor or nurse tell you
what the new medicines were for?
o Yes, definitely
o Yes, somewhat
o No
27. Before you left the emergency
department, did a doctor or nurse give you
a prescription for medicine to treat pain?
o Yes
o No → If No, go to Question 29
APPENDIX IV 24
28. Before giving you the prescription for
pain medicine, did a doctor or nurse
describe possible side effects in a way you
could understand?
o Yes
o No
29. Before you left the emergency
department, did someone discuss with you
whether you needed follow-up care?
o Yes
o No → If No, go to Question 31
30. Before you left the emergency
department, did someone ask if you would
be able to get this follow-up care?
o Yes
o No
31. Before you left the emergency
department, did someone talk with you
about how to treat pain after you got
home?
o Yes
o No
o I did not need to treat pain after I got
home from the emergency department
OVERALL EXPERIENCE
32. Using any number from 0 to 10, where 0
is the worst care possible and 10 is the
best care possible, what number would
you use to rate your care during this
emergency department visit?
o 0 Worst care possible
o 1
o 2
o 3
o 4
o 5
o 6
o 7
o 8
o 9
o 10 Best care possible
33. Would you recommend this emergency
department to your friends and family?
o Definitely no
o Probably no
o Probably yes
o Definitely yes
YOUR HEALTH CARE
34. In the last 6 months, how many times
have you visited any emergency
department to get care for yourself? Please
include the emergency department visit
you have been answering questions about
in this survey.
o 1 time
o 2 times
o 3 times
o 4 times
o 5 to 9 times
o 10 or more times
APPENDIX IV 25
35. Not counting the emergency department,
is there a doctor’s office, clinic, or other
place you usually go if you need a check-
up, want advice about a health problem, or
get sick or hurt?
o Yes
o No → If No, go to Question 37
36. How many times in the last 6 months did
you visit that doctor’s office, clinic, or
other place to get care or advice about
your health?
o None
o 1 time
o 2 times
o 3 times
o 4 times
o 5 to 9 times
o 10 or more times
ABOUT YOU
37. In general, how would you rate your
overall health?
o Excellent
o Very good
o Good
o Fair
o Poor
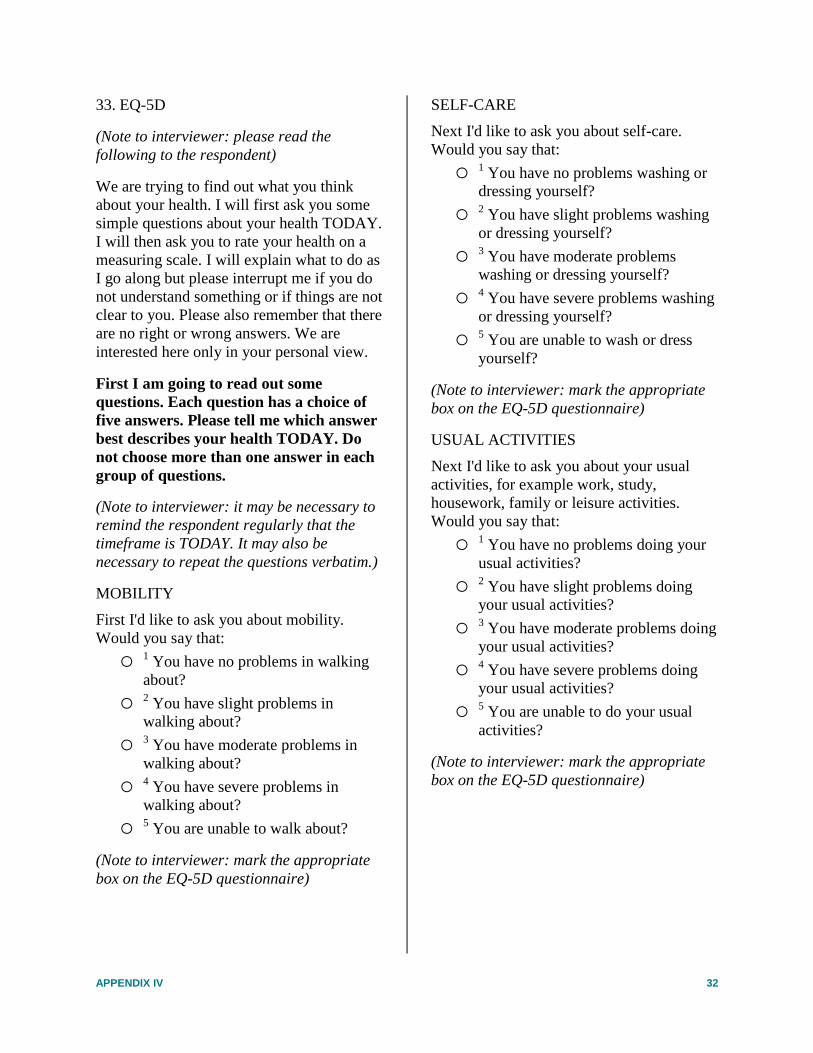
38. EQ-5D
(Note to interviewer: please read the
following to the respondent)
We are trying to find out what you think
about your health. I will first ask you some
simple questions about your health TODAY. I
will then ask you to rate your health on a
measuring scale. I will explain what to do as I
go along but please interrupt me if you do not
understand something or if things are not
clear to you. Please also remember that there
are no right or wrong answers. We are
interested here only in your personal view.
First I am going to read out some
questions. Each question has a choice of
five answers. Please tell me which answer
best describes your health TODAY. Do not
choose more than one answer in each
group of questions.
(Note to interviewer: it may be necessary to
remind the respondent regularly that the
timeframe is TODAY. It may also be
necessary to repeat the questions verbatim.)
MOBILITY
First I'd like to ask you about mobility. Would
you say that:
o 1 You have no problems in walking
about?
o 2 You have slight problems in walking
about?
o 3 You have moderate problems in
walking about?
o 4 You have severe problems in
walking about?
o 5 You are unable to walk about?
(Note to interviewer: mark the appropriate
box on the EQ-5D questionnaire)
APPENDIX IV 26
SELF-CARE
Next I'd like to ask you about self-care.
Would you say that:
o 1 You have no problems washing or
dressing yourself?
o 2 You have slight problems washing or
dressing yourself?
o 3 You have moderate problems
washing or dressing yourself?
o 4 You have severe problems washing
or dressing yourself?
o 5 You are unable to wash or dress
yourself?
(Note to interviewer: mark the appropriate
box on the EQ-5D questionnaire)
USUAL ACTIVITIES
Next I'd like to ask you about your usual
activities, for example work, study,
housework, family or leisure activities. Would
you say that:
o 1 You have no problems doing your
usual activities?
o 2 You have slight problems doing your
usual activities?
o 3 You have moderate problems doing
your usual activities?
o 4 You have severe problems doing
your usual activities?
o 5 You are unable to do your usual
activities?
(Note to interviewer: mark the appropriate
box on the EQ-5D questionnaire)
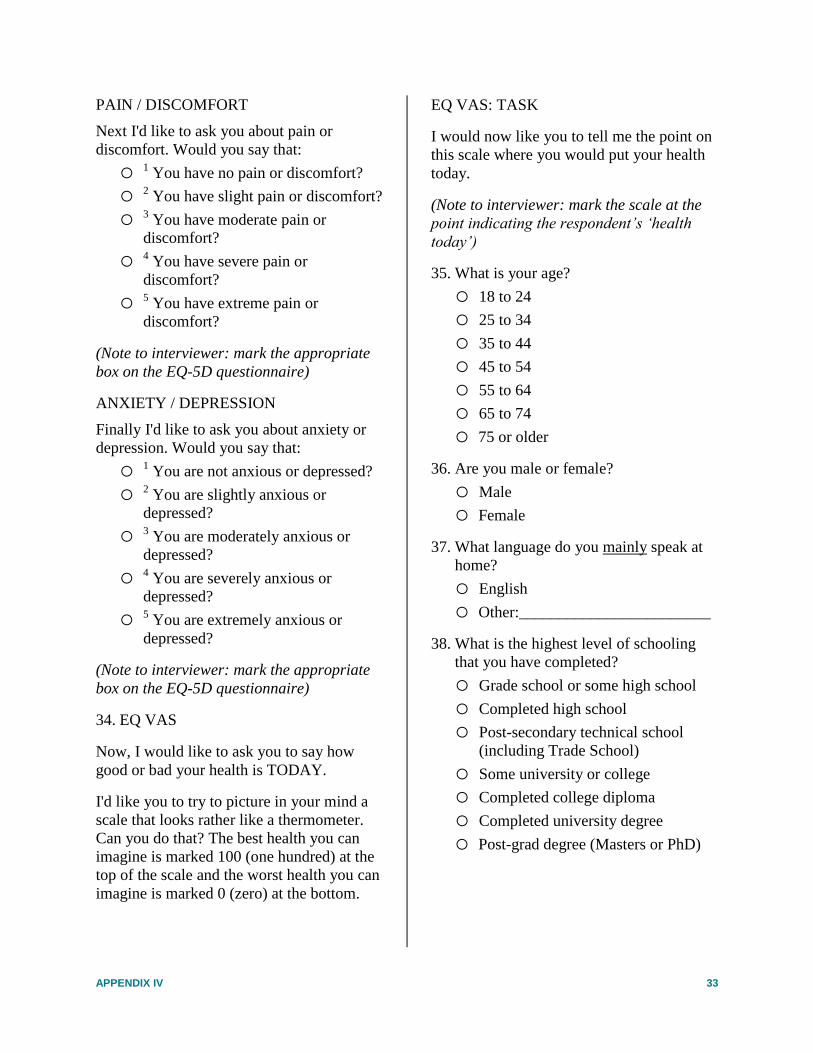
PAIN / DISCOMFORT
Next I'd like to ask you about pain or
discomfort. Would you say that:
o 1 You have no pain or discomfort?
o 2 You have slight pain or discomfort?
o 3 You have moderate pain or
discomfort?
o 4 You have severe pain or discomfort?
o 5 You have extreme pain or
discomfort?
(Note to interviewer: mark the appropriate
box on the EQ-5D questionnaire)
ANXIETY / DEPRESSION
Finally I'd like to ask you about anxiety or
depression. Would you say that:
o 1 You are not anxious or depressed?
o 2 You are slightly anxious or
depressed?
o 3 You are moderately anxious or
depressed?
o 4 You are severely anxious or
depressed?
o 5 You are extremely anxious or
depressed?
(Note to interviewer: mark the appropriate
box on the EQ-5D questionnaire)
39. EQ VAS
Now, I would like to ask you to say how good
or bad your health is TODAY.
I'd like you to try to picture in your mind a
scale that looks rather like a thermometer.
Can you do that? The best health you can
imagine is marked 100 (one hundred) at the
top of the scale and the worst health you can
imagine is marked 0 (zero) at the bottom.
APPENDIX IV 27
EQ VAS: TASK
I would now like you to tell me the point on
this scale where you would put your health
today.
(Note to interviewer: mark the scale at the
point indicating the respondent’s ‘health
today’)
40. What is your age?
o 18 to 24
o 25 to 34
o 35 to 44
o 45 to 54
o 55 to 64
o 65 to 74
o 75 or older
41. Are you male or female?
o Male
o Female
42. What language do you mainly speak at
home?
o English
o Other:________________________
43. What is the highest level of schooling that
you have completed?
o Grade school or some high school
o Completed high school
o Post-secondary technical school
(including Trade School)
o Some university or college
o Completed college diploma
o Completed university degree
o Post-grad degree (Masters or PhD)
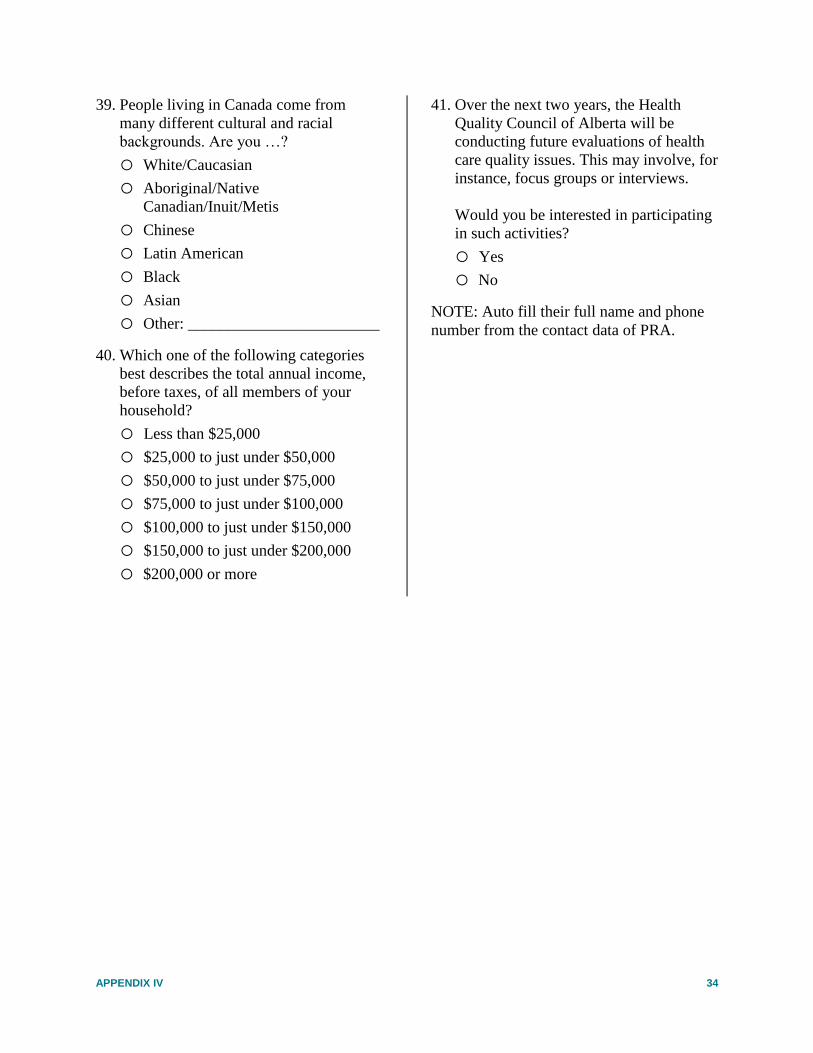
44. People living in Canada come from many
different cultural and racial backgrounds.
Are you …?
o White/Caucasian
o Aboriginal/Native
Canadian/Inuit/Metis
o Chinese
o Latin American
o Black
o Asian
o Other: ________________________
45. Which one of the following categories
best describes the total annual income,
before taxes, of all members of your
household?
o Less than $25,000
o $25,000 to just under $50,000
o $50,000 to just under $75,000
o $75,000 to just under $100,000
o $100,000 to just under $150,000
o $150,000 to just under $200,000
o $200,000 or more
46. Over the next two years, the Health
Quality Council of Alberta will be
conducting future evaluations of health
care quality issues. This may involve, for
instance, focus groups or interviews.
Would you be interested in participating
in such activities?
o Yes
o No
NOTE: Auto fill their full name and phone
number from the contact data of PRA.
APPENDIX IV 28
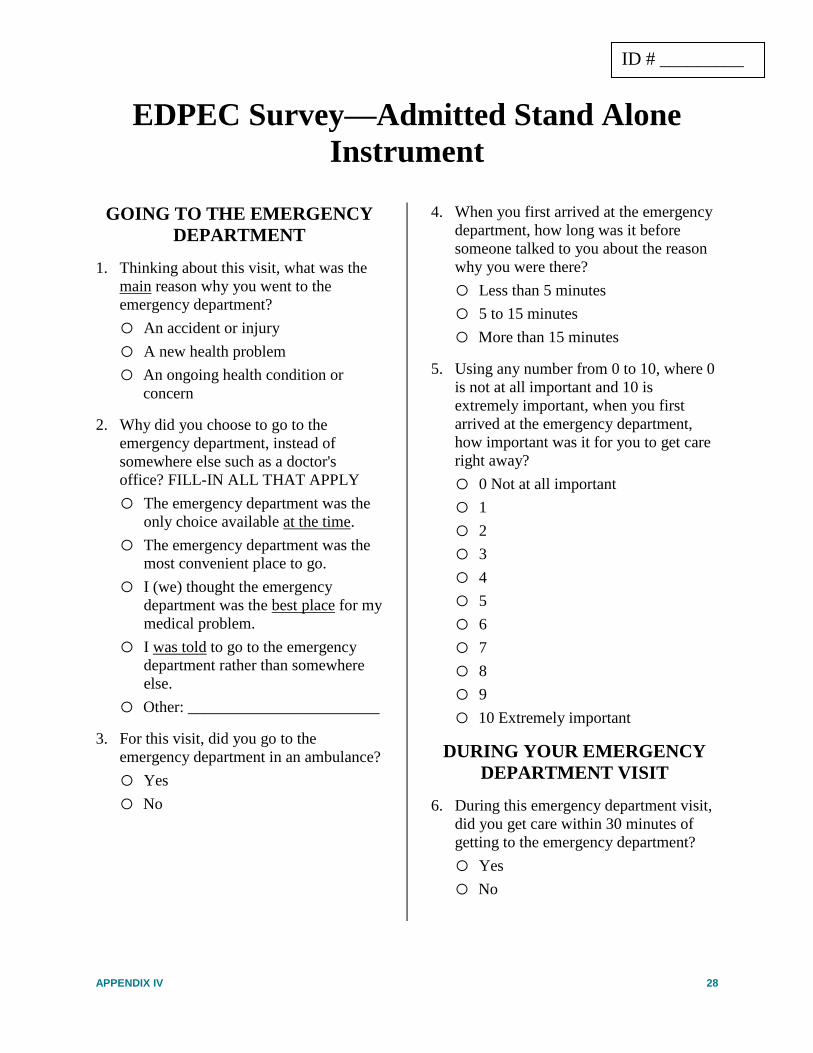
EDPEC Survey—Admitted Stand Alone
Instrument
GOING TO THE EMERGENCY
DEPARTMENT
1. Thinking about this visit, what was the
main reason why you went to the
emergency department?
o An accident or injury
o A new health problem
o An ongoing health condition or
concern
2. Why did you choose to go to the
emergency department, instead of
somewhere else such as a doctor's
office? FILL-IN ALL THAT APPLY
o The emergency department was the
only choice available at the time.
o The emergency department was the
most convenient place to go.
o I (we) thought the emergency
department was the best place for my
medical problem.
o I was told to go to the emergency
department rather than somewhere
else.
o Other: ________________________
3. For this visit, did you go to the
emergency department in an ambulance?
o Yes
o No
4. When you first arrived at the emergency
department, how long was it before
someone talked to you about the reason
why you were there?
o Less than 5 minutes
o 5 to 15 minutes
o More than 15 minutes
5. Using any number from 0 to 10, where 0
is not at all important and 10 is
extremely important, when you first
arrived at the emergency department,
how important was it for you to get care
right away?
o 0 Not at all important
o 1
o 2
o 3
o 4
o 5
o 6
o 7
o 8
o 9
o 10 Extremely important
DURING YOUR EMERGENCY
DEPARTMENT VISIT
6. During this emergency department visit,
did you get care within 30 minutes of
getting to the emergency department?
o Yes
o No
ID # _________
APPENDIX IV 29
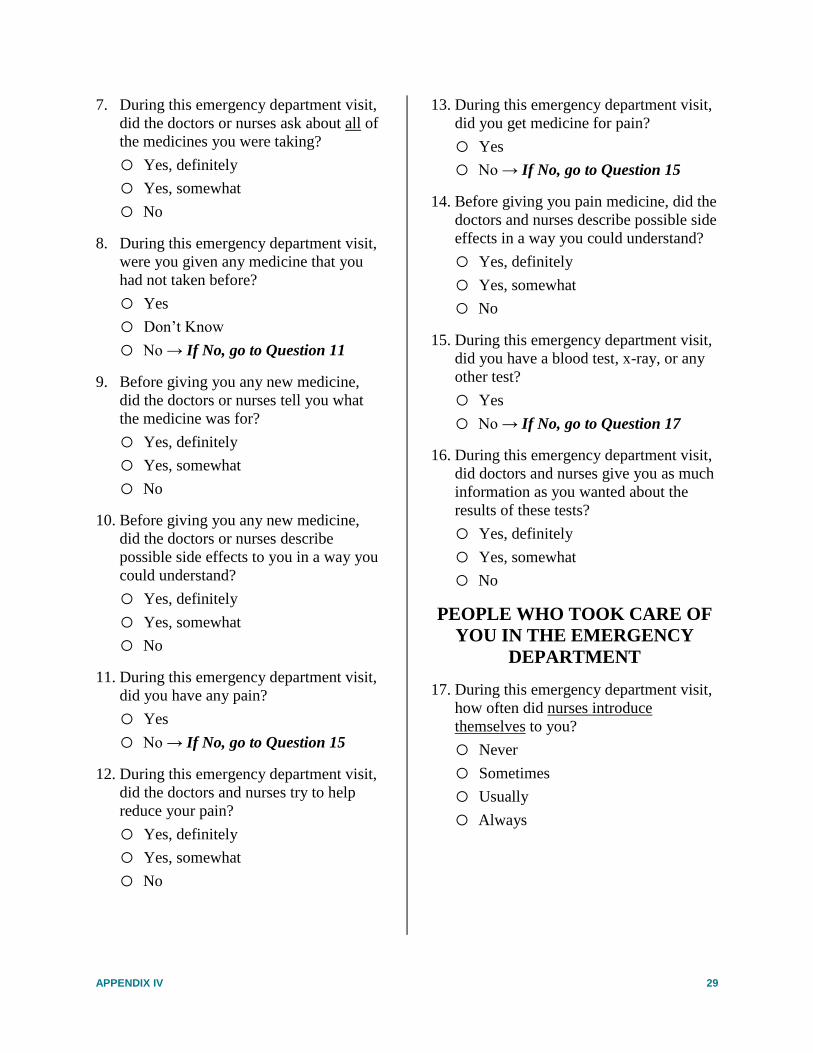
7. During this emergency department visit,
did the doctors or nurses ask about all of
the medicines you were taking?
o Yes, definitely
o Yes, somewhat
o No
8. During this emergency department visit,
were you given any medicine that you
had not taken before?
o Yes
o Don’t Know
o No → If No, go to Question 11
9. Before giving you any new medicine,
did the doctors or nurses tell you what
the medicine was for?
o Yes, definitely
o Yes, somewhat
o No
10. Before giving you any new medicine,
did the doctors or nurses describe
possible side effects to you in a way you
could understand?
o Yes, definitely
o Yes, somewhat
o No
11. During this emergency department visit,
did you have any pain?
o Yes
o No → If No, go to Question 15
12. During this emergency department visit,
did the doctors and nurses try to help
reduce your pain?
o Yes, definitely
o Yes, somewhat
o No
13. During this emergency department visit,
did you get medicine for pain?
o Yes
o No → If No, go to Question 15
14. Before giving you pain medicine, did the
doctors and nurses describe possible side
effects in a way you could understand?
o Yes, definitely
o Yes, somewhat
o No
15. During this emergency department visit,
did you have a blood test, x-ray, or any
other test?
o Yes
o No → If No, go to Question 17
16. During this emergency department visit,
did doctors and nurses give you as much
information as you wanted about the
results of these tests?
o Yes, definitely
o Yes, somewhat
o No
PEOPLE WHO TOOK CARE OF
YOU IN THE EMERGENCY
DEPARTMENT
17. During this emergency department visit,
how often did nurses introduce
themselves to you?
o Never
o Sometimes
o Usually
o Always
APPENDIX IV 30
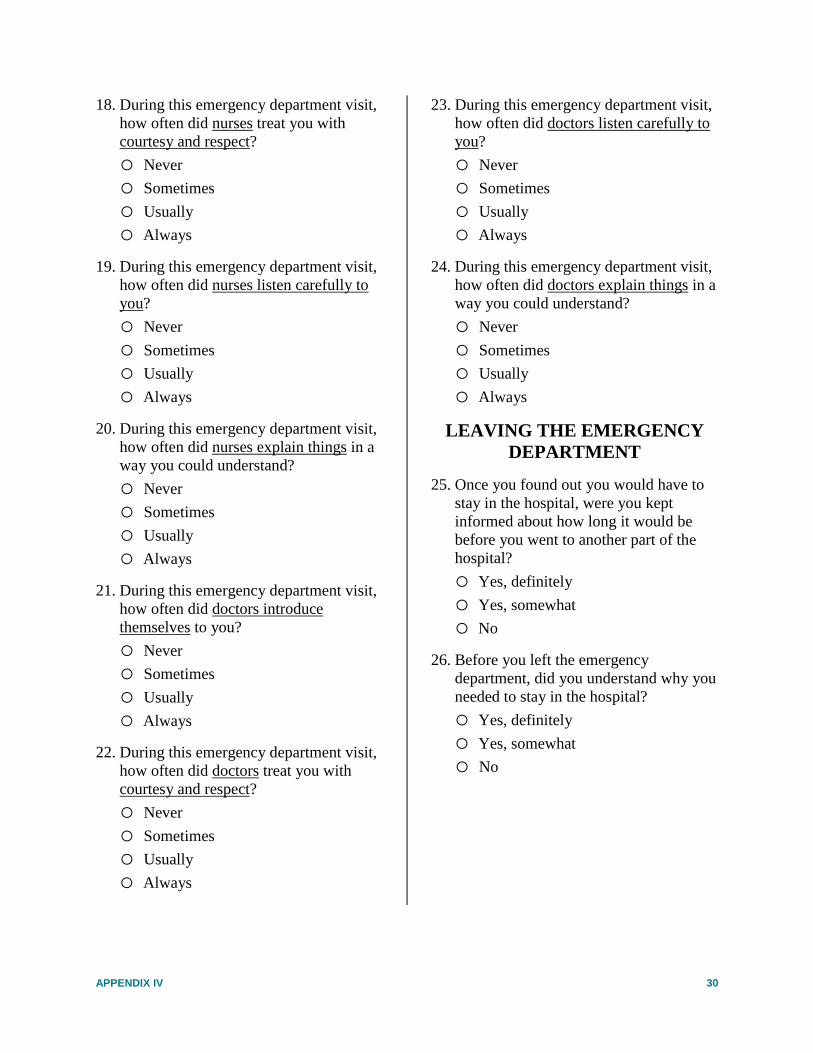
18. During this emergency department visit,
how often did nurses treat you with
courtesy and respect?
o Never
o Sometimes
o Usually
o Always
19. During this emergency department visit,
how often did nurses listen carefully to
you?
o Never
o Sometimes
o Usually
o Always
20. During this emergency department visit,
how often did nurses explain things in a
way you could understand?
o Never
o Sometimes
o Usually
o Always
21. During this emergency department visit,
how often did doctors introduce
themselves to you?
o Never
o Sometimes
o Usually
o Always
22. During this emergency department visit,
how often did doctors treat you with
courtesy and respect?
o Never
o Sometimes
o Usually
o Always
23. During this emergency department visit,
how often did doctors listen carefully to
you?
o Never
o Sometimes
o Usually
o Always
24. During this emergency department visit,
how often did doctors explain things in a
way you could understand?
o Never
o Sometimes
o Usually
o Always
LEAVING THE EMERGENCY
DEPARTMENT
25. Once you found out you would have to
stay in the hospital, were you kept
informed about how long it would be
before you went to another part of the
hospital?
o Yes, definitely
o Yes, somewhat
o No
26. Before you left the emergency
department, did you understand why you
needed to stay in the hospital?
o Yes, definitely
o Yes, somewhat
o No
APPENDIX IV 31
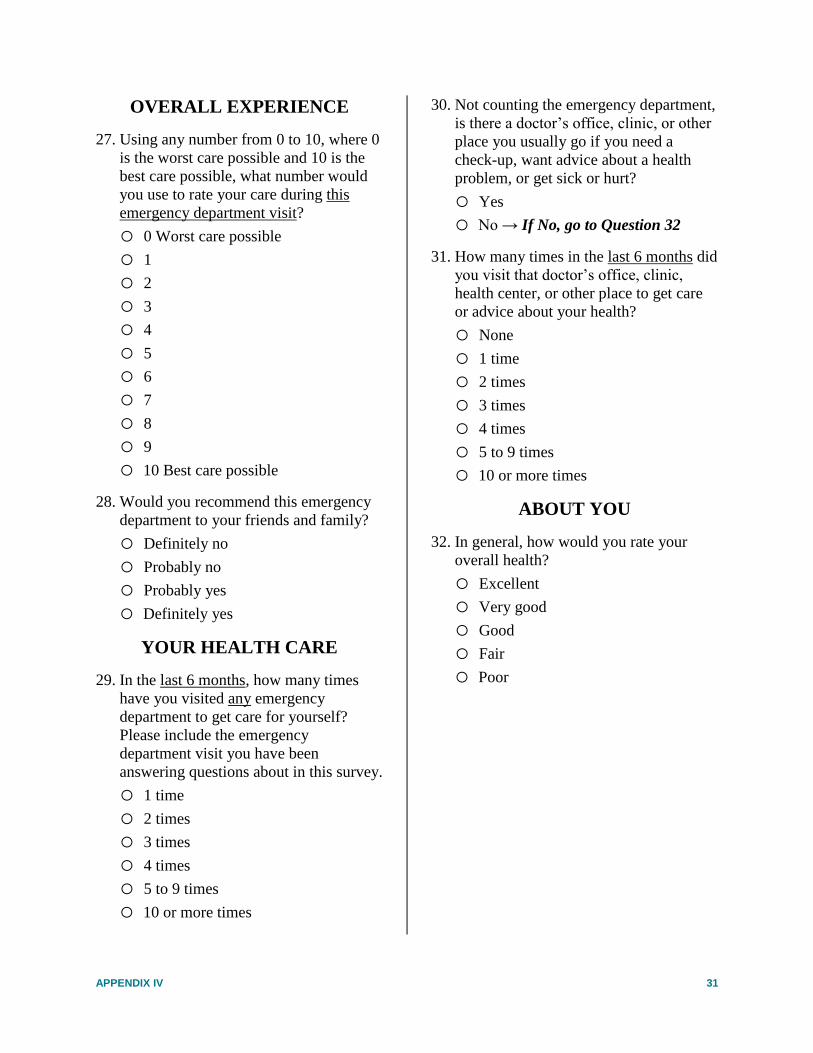
OVERALL EXPERIENCE
27. Using any number from 0 to 10, where 0
is the worst care possible and 10 is the
best care possible, what number would
you use to rate your care during this
emergency department visit?
o 0 Worst care possible
o 1
o 2
o 3
o 4
o 5
o 6
o 7
o 8
o 9
o 10 Best care possible
28. Would you recommend this emergency
department to your friends and family?
o Definitely no
o Probably no
o Probably yes
o Definitely yes
YOUR HEALTH CARE
29. In the last 6 months, how many times
have you visited any emergency
department to get care for yourself?
Please include the emergency
department visit you have been
answering questions about in this survey.
o 1 time
o 2 times
o 3 times
o 4 times
o 5 to 9 times
o 10 or more times
30. Not counting the emergency department,
is there a doctor’s office, clinic, or other
place you usually go if you need a
check-up, want advice about a health
problem, or get sick or hurt?
o Yes
o No → If No, go to Question 32
31. How many times in the last 6 months did
you visit that doctor’s office, clinic,
health center, or other place to get care
or advice about your health?
o None
o 1 time
o 2 times
o 3 times
o 4 times
o 5 to 9 times
o 10 or more times
ABOUT YOU
32. In general, how would you rate your
overall health?
o Excellent
o Very good
o Good
o Fair
o Poor
APPENDIX IV 32
33. EQ-5D
(Note to interviewer: please read the
following to the respondent)
We are trying to find out what you think
about your health. I will first ask you some
simple questions about your health TODAY.
I will then ask you to rate your health on a
measuring scale. I will explain what to do as
I go along but please interrupt me if you do
not understand something or if things are not
clear to you. Please also remember that there
are no right or wrong answers. We are
interested here only in your personal view.
First I am going to read out some
questions. Each question has a choice of
five answers. Please tell me which answer
best describes your health TODAY. Do
not choose more than one answer in each
group of questions.
(Note to interviewer: it may be necessary to
remind the respondent regularly that the
timeframe is TODAY. It may also be
necessary to repeat the questions verbatim.)
MOBILITY
First I'd like to ask you about mobility.
Would you say that:
o 1 You have no problems in walking
about?
o 2 You have slight problems in
walking about?
o 3 You have moderate problems in
walking about?
o 4 You have severe problems in
walking about?
o 5 You are unable to walk about?
(Note to interviewer: mark the appropriate
box on the EQ-5D questionnaire)
SELF-CARE
Next I'd like to ask you about self-care.
Would you say that:
o 1 You have no problems washing or
dressing yourself?
o 2 You have slight problems washing
or dressing yourself?
o 3 You have moderate problems
washing or dressing yourself?
o 4 You have severe problems washing
or dressing yourself?
o 5 You are unable to wash or dress
yourself?
(Note to interviewer: mark the appropriate
box on the EQ-5D questionnaire)
USUAL ACTIVITIES
Next I'd like to ask you about your usual
activities, for example work, study,
housework, family or leisure activities.
Would you say that:
o 1 You have no problems doing your
usual activities?
o 2 You have slight problems doing
your usual activities?
o 3 You have moderate problems doing
your usual activities?
o 4 You have severe problems doing
your usual activities?
o 5 You are unable to do your usual
activities?
(Note to interviewer: mark the appropriate
box on the EQ-5D questionnaire)
APPENDIX IV 33
PAIN / DISCOMFORT
Next I'd like to ask you about pain or
discomfort. Would you say that:
o 1 You have no pain or discomfort?
o 2 You have slight pain or discomfort?
o 3 You have moderate pain or
discomfort?
o 4 You have severe pain or
discomfort?
o 5 You have extreme pain or
discomfort?
(Note to interviewer: mark the appropriate
box on the EQ-5D questionnaire)
ANXIETY / DEPRESSION
Finally I'd like to ask you about anxiety or
depression. Would you say that:
o 1 You are not anxious or depressed?
o 2 You are slightly anxious or
depressed?
o 3 You are moderately anxious or
depressed?
o 4 You are severely anxious or
depressed?
o 5 You are extremely anxious or
depressed?
(Note to interviewer: mark the appropriate
box on the EQ-5D questionnaire)
34. EQ VAS
Now, I would like to ask you to say how
good or bad your health is TODAY.
I'd like you to try to picture in your mind a
scale that looks rather like a thermometer.
Can you do that? The best health you can
imagine is marked 100 (one hundred) at the
top of the scale and the worst health you can
imagine is marked 0 (zero) at the bottom.
EQ VAS: TASK
I would now like you to tell me the point on
this scale where you would put your health
today.
(Note to interviewer: mark the scale at the
point indicating the respondent’s ‘health
today’)
35. What is your age?
o 18 to 24
o 25 to 34
o 35 to 44
o 45 to 54
o 55 to 64
o 65 to 74
o 75 or older
36. Are you male or female?
o Male
o Female
37. What language do you mainly speak at
home?
o English
o Other:________________________
38. What is the highest level of schooling
that you have completed?
o Grade school or some high school
o Completed high school
o Post-secondary technical school
(including Trade School)
o Some university or college
o Completed college diploma
o Completed university degree
o Post-grad degree (Masters or PhD)
APPENDIX IV 34
39. People living in Canada come from
many different cultural and racial
backgrounds. Are you …?
o White/Caucasian
o Aboriginal/Native
Canadian/Inuit/Metis
o Chinese
o Latin American
o Black
o Asian
o Other: ________________________
40. Which one of the following categories
best describes the total annual income,
before taxes, of all members of your
household?
o Less than $25,000
o $25,000 to just under $50,000
o $50,000 to just under $75,000
o $75,000 to just under $100,000
o $100,000 to just under $150,000
o $150,000 to just under $200,000
o $200,000 or more
41. Over the next two years, the Health
Quality Council of Alberta will be
conducting future evaluations of health
care quality issues. This may involve, for
instance, focus groups or interviews.
Would you be interested in participating
in such activities?
o Yes
o No
NOTE: Auto fill their full name and phone
number from the contact data of PRA.
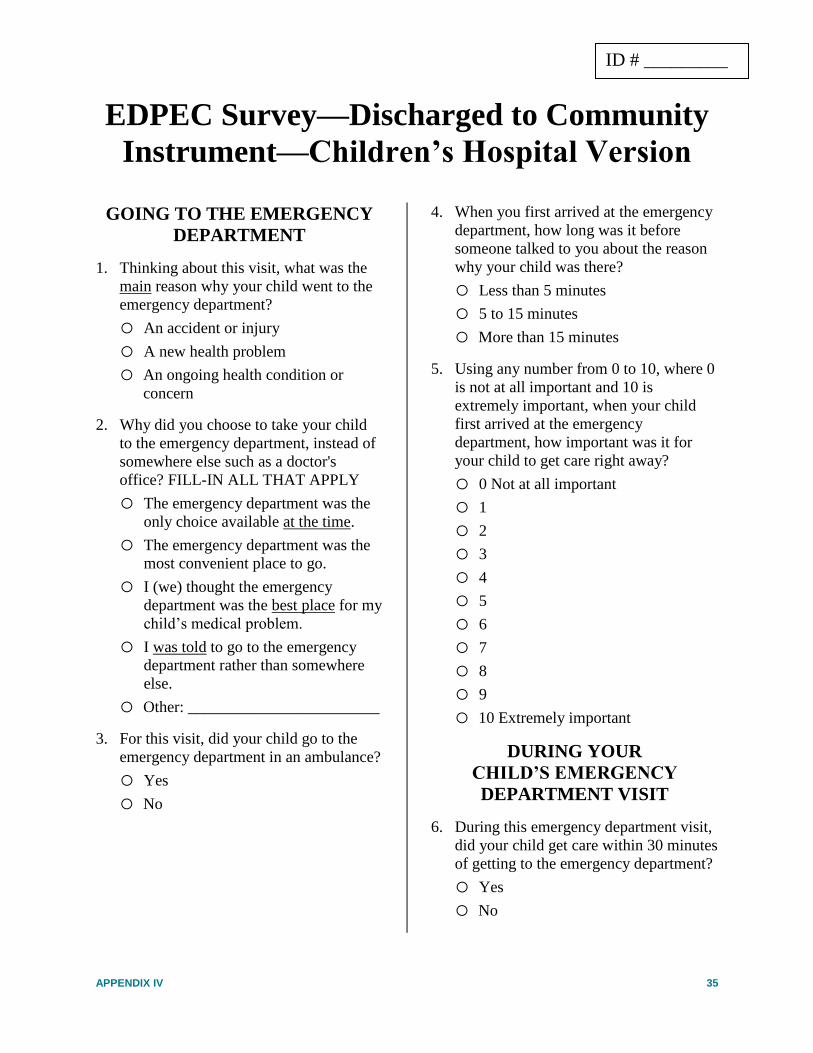
APPENDIX IV 35
EDPEC Survey—Discharged to Community
Instrument—Children’s Hospital Version
GOING TO THE EMERGENCY
DEPARTMENT
1. Thinking about this visit, what was the
main reason why your child went to the
emergency department?
o An accident or injury
o A new health problem
o An ongoing health condition or
concern
2. Why did you choose to take your child
to the emergency department, instead of
somewhere else such as a doctor's
office? FILL-IN ALL THAT APPLY
o The emergency department was the
only choice available at the time.
o The emergency department was the
most convenient place to go.
o I (we) thought the emergency
department was the best place for my
child’s medical problem.
o I was told to go to the emergency
department rather than somewhere
else.
o Other: ________________________
3. For this visit, did your child go to the
emergency department in an ambulance?
o Yes
o No
4. When you first arrived at the emergency
department, how long was it before
someone talked to you about the reason
why your child was there?
o Less than 5 minutes
o 5 to 15 minutes
o More than 15 minutes
5. Using any number from 0 to 10, where 0
is not at all important and 10 is
extremely important, when your child
first arrived at the emergency
department, how important was it for
your child to get care right away?
o 0 Not at all important
o 1
o 2
o 3
o 4
o 5
o 6
o 7
o 8
o 9
o 10 Extremely important
DURING YOUR
CHILD’S EMERGENCY
DEPARTMENT VISIT
6. During this emergency department visit,
did your child get care within 30 minutes
of getting to the emergency department?
o Yes
o No
ID # _________
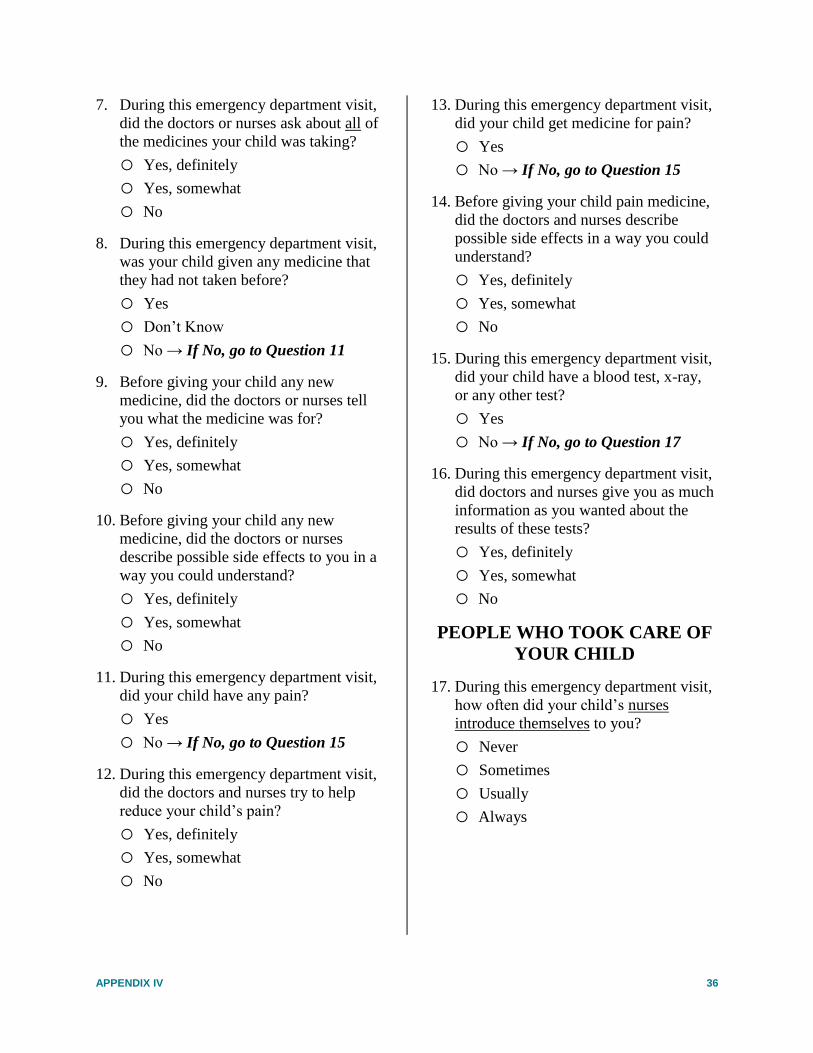
APPENDIX IV 36
7. During this emergency department visit,
did the doctors or nurses ask about all of
the medicines your child was taking?
o Yes, definitely
o Yes, somewhat
o No
8. During this emergency department visit,
was your child given any medicine that
they had not taken before?
o Yes
o Don’t Know
o No → If No, go to Question 11
9. Before giving your child any new
medicine, did the doctors or nurses tell
you what the medicine was for?
o Yes, definitely
o Yes, somewhat
o No
10. Before giving your child any new
medicine, did the doctors or nurses
describe possible side effects to you in a
way you could understand?
o Yes, definitely
o Yes, somewhat
o No
11. During this emergency department visit,
did your child have any pain?
o Yes
o No → If No, go to Question 15
12. During this emergency department visit,
did the doctors and nurses try to help
reduce your child’s pain?
o Yes, definitely
o Yes, somewhat
o No
13. During this emergency department visit,
did your child get medicine for pain?
o Yes
o No → If No, go to Question 15
14. Before giving your child pain medicine,
did the doctors and nurses describe
possible side effects in a way you could
understand?
o Yes, definitely
o Yes, somewhat
o No
15. During this emergency department visit,
did your child have a blood test, x-ray,
or any other test?
o Yes
o No → If No, go to Question 17
16. During this emergency department visit,
did doctors and nurses give you as much
information as you wanted about the
results of these tests?
o Yes, definitely
o Yes, somewhat
o No
PEOPLE WHO TOOK CARE OF
YOUR CHILD
17. During this emergency department visit,
how often did your child’s nurses
introduce themselves to you?
o Never
o Sometimes
o Usually
o Always
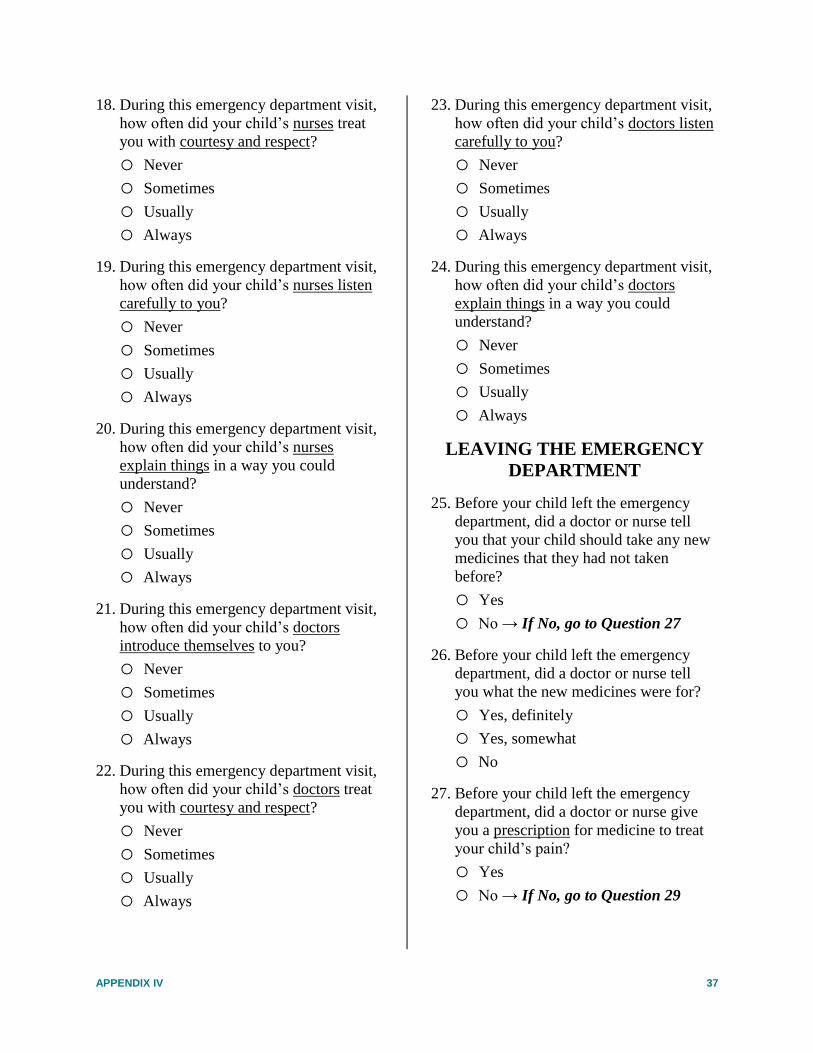
APPENDIX IV 37
18. During this emergency department visit,
how often did your child’s nurses treat
you with courtesy and respect?
o Never
o Sometimes
o Usually
o Always
19. During this emergency department visit,
how often did your child’s nurses listen
carefully to you?
o Never
o Sometimes
o Usually
o Always
20. During this emergency department visit,
how often did your child’s nurses
explain things in a way you could
understand?
o Never
o Sometimes
o Usually
o Always
21. During this emergency department visit,
how often did your child’s doctors
introduce themselves to you?
o Never
o Sometimes
o Usually
o Always
22. During this emergency department visit,
how often did your child’s doctors treat
you with courtesy and respect?
o Never
o Sometimes
o Usually
o Always
23. During this emergency department visit,
how often did your child’s doctors listen
carefully to you?
o Never
o Sometimes
o Usually
o Always
24. During this emergency department visit,
how often did your child’s doctors
explain things in a way you could
understand?
o Never
o Sometimes
o Usually
o Always
LEAVING THE EMERGENCY
DEPARTMENT
25. Before your child left the emergency
department, did a doctor or nurse tell
you that your child should take any new
medicines that they had not taken
before?
o Yes
o No → If No, go to Question 27
26. Before your child left the emergency
department, did a doctor or nurse tell
you what the new medicines were for?
o Yes, definitely
o Yes, somewhat
o No
27. Before your child left the emergency
department, did a doctor or nurse give
you a prescription for medicine to treat
your child’s pain?
o Yes
o No → If No, go to Question 29

APPENDIX IV 38
28. Before giving you the prescription for
your child’s pain medicine, did a doctor
or nurse describe possible side effects in
a way you could understand?
o Yes
o No
29. Before your child left the emergency
department, did someone discuss with
you whether your child needed follow-
up care?
o Yes
o No → If No, go to Question 31
30. Before your child left the emergency
department, did someone ask if you
would be able to get this follow-up care?
o Yes
o No
31. Before your child left the emergency
department, did someone talk with you
about how to treat your child’s pain after
you got home?
o Yes
o No
o I did not need to treat my child’s
pain after we got home from the
emergency department
OVERALL EXPERIENCE
32. Using any number from 0 to 10, where 0
is the worst care possible and 10 is the
best care possible, what number would
you use to rate your child’s care during
this emergency department visit?
o 0 Worst care possible
o 1
o 2
o 3
o 4
o 5
o 6
o 7
o 8
o 9
o 10 Best care possible
33. Would you recommend this emergency
department to your friends and family?
o Definitely no
o Probably no
o Probably yes
o Definitely yes
ABOUT YOUR CHILD’S
HEALTH
34. In the last 6 months, how many times
has your child visited any emergency
department to get care for themselves?
Please include the emergency
department visit you have been
answering questions about in this survey.
o 1 time
o 2 times
o 3 times
o 4 times
o 5 to 9 times
o 10 or more times
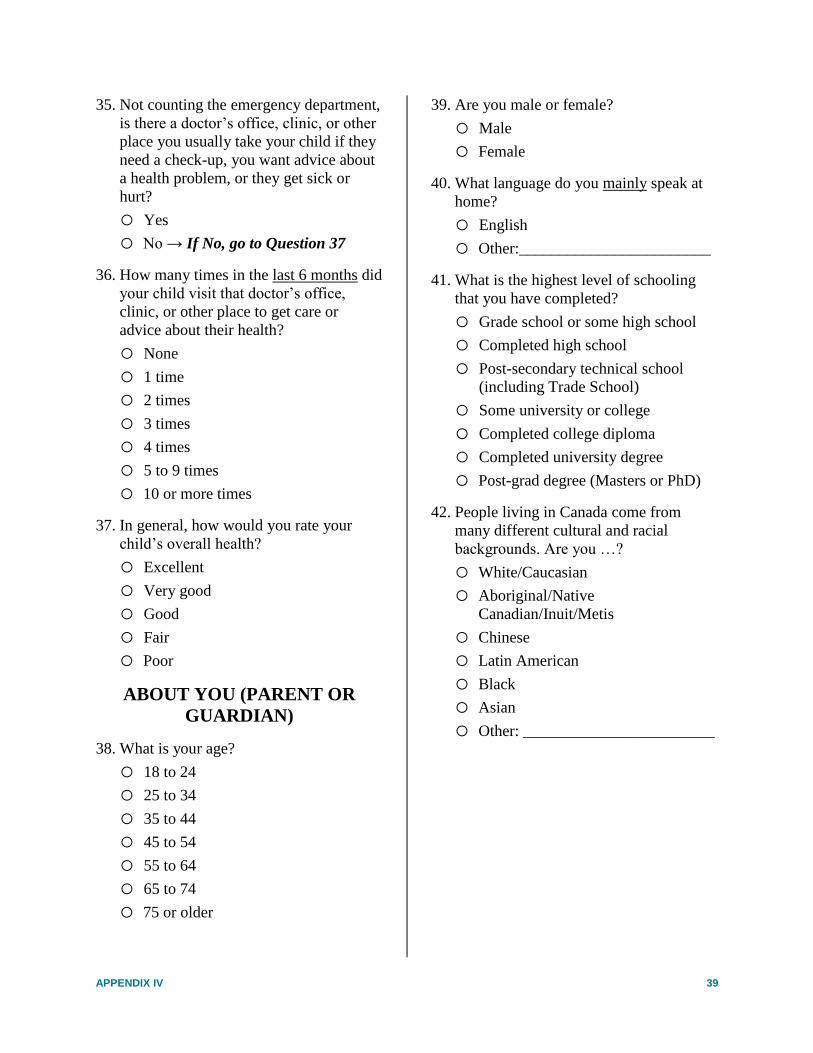
APPENDIX IV 39
35. Not counting the emergency department,
is there a doctor’s office, clinic, or other
place you usually take your child if they
need a check-up, you want advice about
a health problem, or they get sick or
hurt?
o Yes
o No → If No, go to Question 37
36. How many times in the last 6 months did
your child visit that doctor’s office,
clinic, or other place to get care or
advice about their health?
o None
o 1 time
o 2 times
o 3 times
o 4 times
o 5 to 9 times
o 10 or more times
37. In general, how would you rate your
child’s overall health?
o Excellent
o Very good
o Good
o Fair
o Poor
ABOUT YOU (PARENT OR
GUARDIAN)
38. What is your age?
o 18 to 24
o 25 to 34
o 35 to 44
o 45 to 54
o 55 to 64
o 65 to 74
o 75 or older
39. Are you male or female?
o Male
o Female
40. What language do you mainly speak at
home?
o English
o Other:________________________
41. What is the highest level of schooling
that you have completed?
o Grade school or some high school
o Completed high school
o Post-secondary technical school
(including Trade School)
o Some university or college
o Completed college diploma
o Completed university degree
o Post-grad degree (Masters or PhD)
42. People living in Canada come from
many different cultural and racial
backgrounds. Are you …?
o White/Caucasian
o Aboriginal/Native
Canadian/Inuit/Metis
o Chinese
o Latin American
o Black
o Asian
o Other: ________________________
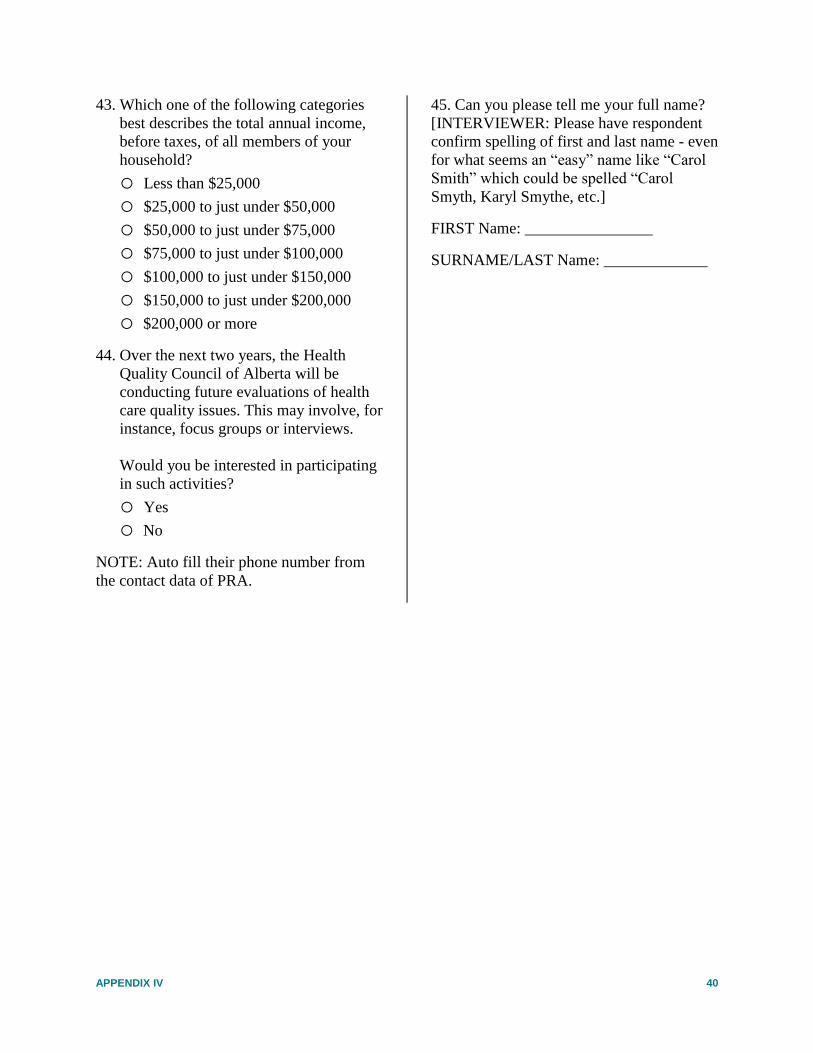
APPENDIX IV 40
43. Which one of the following categories
best describes the total annual income,
before taxes, of all members of your
household?
o Less than $25,000
o $25,000 to just under $50,000
o $50,000 to just under $75,000
o $75,000 to just under $100,000
o $100,000 to just under $150,000
o $150,000 to just under $200,000
o $200,000 or more
44. Over the next two years, the Health
Quality Council of Alberta will be
conducting future evaluations of health
care quality issues. This may involve, for
instance, focus groups or interviews.
Would you be interested in participating
in such activities?
o Yes
o No
NOTE: Auto fill their phone number from
the contact data of PRA.
45. Can you please tell me your full name?
[INTERVIEWER: Please have respondent
confirm spelling of first and last name - even
for what seems an “easy” name like “Carol
Smith” which could be spelled “Carol
Smyth, Karyl Smythe, etc.]
FIRST Name: ________________
SURNAME/LAST Name: _____________

APPENDIX IV 41
EDPEC Survey—Admitted Stand Alone
Instrument—Children’s Hospital Version
GOING TO THE EMERGENCY
DEPARTMENT
1. Thinking about this visit, what was the
main reason why your child went to the
emergency department?
o An accident or injury
o A new health problem
o An ongoing health condition or
concern
2. Why did you choose to take your child
to the emergency department, instead of
somewhere else such as a doctor's
office? FILL-IN ALL THAT APPLY
o The emergency department was the
only choice available at the time.
o The emergency department was the
most convenient place to go.
o I (we) thought the emergency
department was the best place for my
child’s medical problem.
o I was told to go to the emergency
department rather than somewhere
else.
o Other: ________________________
3. For this visit, did your child go to the
emergency department in an ambulance?
o Yes
o No
4. When you first arrived at the emergency
department, how long was it before
someone talked to you about the reason
why your child was there?
o Less than 5 minutes
o 5 to 15 minutes
o More than 15 minutes
5. Using any number from 0 to 10, where 0
is not at all important and 10 is
extremely important, when your child
first arrived at the emergency
department, how important was it for
your child to get care right away?
o 0 Not at all important
o 1
o 2
o 3
o 4
o 5
o 6
o 7
o 8
o 9
o 10 Extremely important
DURING YOUR
CHILD’S EMERGENCY
DEPARTMENT VISIT
6. During this emergency department visit,
did your child get care within 30 minutes
of getting to the emergency department?
o Yes
o No
ID # _________

APPENDIX IV 42
7. During this emergency department visit,
did the doctors or nurses ask about all of
the medicines your child was taking?
o Yes, definitely
o Yes, somewhat
o No
8. During this emergency department visit,
was your child given any medicine that
they had not taken before?
o Yes
o Don’t Know
o No → If No, go to Question 11
9. Before giving your child any new
medicine, did the doctors or nurses tell
you what the medicine was for?
o Yes, definitely
o Yes, somewhat
o No
10. Before giving your child any new
medicine, did the doctors or nurses
describe possible side effects to you in a
way you could understand?
o Yes, definitely
o Yes, somewhat
o No
11. During this emergency department visit,
did your child have any pain?
o Yes
o No → If No, go to Question 15
12. During this emergency department visit,
did the doctors and nurses try to help
reduce your child’s pain?
o Yes, definitely
o Yes, somewhat
o No
13. During this emergency department visit,
did your child get medicine for pain?
o Yes
o No → If No, go to Question 15
14. Before giving your child pain medicine,
did the doctors and nurses describe
possible side effects in a way you could
understand?
o Yes, definitely
o Yes, somewhat
o No
15. During this emergency department visit,
did your child have a blood test, x-ray,
or any other test?
o Yes
o No → If No, go to Question 17
16. During this emergency department visit,
did doctors and nurses give you as much
information as you wanted about the
results of these tests?
o Yes, definitely
o Yes, somewhat
o No
PEOPLE WHO TOOK CARE OF
YOUR CHILD IN THE
EMERGENCY DEPARTMENT
17. During this emergency department visit,
how often did your child’s nurses
introduce themselves to you?
o Never
o Sometimes
o Usually
o Always
APPENDIX IV 43
18. During this emergency department visit,
how often did your child’s nurses treat
you with courtesy and respect?
o Never
o Sometimes
o Usually
o Always
19. During this emergency department visit,
how often did your child’s nurses listen
carefully to you?
o Never
o Sometimes
o Usually
o Always
20. During this emergency department visit,
how often did your child’s nurses
explain things in a way you could
understand?
o Never
o Sometimes
o Usually
o Always
21. During this emergency department visit,
how often did your child’s doctors
introduce themselves to you?
o Never
o Sometimes
o Usually
o Always
22. During this emergency department visit,
how often did your child’s doctors treat
you with courtesy and respect?
o Never
o Sometimes
o Usually
o Always
23. During this emergency department visit,
how often did your child’s doctors listen
carefully to you?
o Never
o Sometimes
o Usually
o Always
24. During this emergency department visit,
how often did your child’s doctors
explain things in a way you could
understand?
o Never
o Sometimes
o Usually
o Always
LEAVING THE EMERGENCY
DEPARTMENT
25. Once you found out your child would
have to stay in the hospital, were you
kept informed about how long it would
be before your child went to another part
of the hospital?
o Yes, definitely
o Yes, somewhat
o No
26. Before your child left the emergency
department, did you understand why
your child needed to stay in the hospital?
o Yes, definitely
o Yes, somewhat
o No
APPENDIX IV 44
OVERALL EXPERIENCE
27. Using any number from 0 to 10, where 0
is the worst care possible and 10 is the
best care possible, what number would
you use to rate your child’s care during
this emergency department visit?
o 0 Worst care possible
o 1
o 2
o 3
o 4
o 5
o 6
o 7
o 8
o 9
o 10 Best care possible
28. Would you recommend this emergency
department to your friends and family?
o Definitely no
o Probably no
o Probably yes
o Definitely yes
ABOUT YOUR CHILD’S
HEALTH
29. In the last 6 months, how many times
has your child visited any emergency
department to get care for themselves?
Please include the emergency
department visit you have been
answering questions about in this survey.
o 1 time
o 2 times
o 3 times
o 4 times
o 5 to 9 times
o 10 or more times
30. Not counting the emergency department,
is there a doctor’s office, clinic, or other
place you usually take your child if they
need a check-up, you want advice about
a health problem, or they get sick or
hurt?
o Yes
o No → If No, go to Question 32
31. How many times in the last 6 months did
your child visit that doctor’s office,
clinic, or other place to get care or
advice about their health?
o None
o 1 time
o 2 times
o 3 times
o 4 times
o 5 to 9 times
o 10 or more times
32. In general, how would you rate your
child’s overall health?
o Excellent
o Very good
o Good
o Fair
o Poor
ABOUT YOU (PARENT OR
GUARDIAN)
33. What is your age?
o 18 to 24
o 25 to 34
o 35 to 44
o 45 to 54
o 55 to 64
o 65 to 74
o 75 or older
APPENDIX IV 45
34. Are you male or female?
o Male
o Female
35. What language do you mainly speak at
home?
o English
o Other:________________________
36. What is the highest level of schooling
that you have completed?
o Grade school or some high school
o Completed high school
o Post-secondary technical school
(including Trade School)
o Some university or college
o Completed college diploma
o Completed university degree
o Post-grad degree (Masters or PhD)
37. People living in Canada come from
many different cultural and racial
backgrounds. Are you …?
o White/Caucasian
o Aboriginal/Native
Canadian/Inuit/Metis
o Chinese
o Latin American
o Black
o Asian
o Other: ________________________
38. Which one of the following categories
best describes the total annual income,
before taxes, of all members of your
household?
o Less than $25,000
o $25,000 to just under $50,000
o $50,000 to just under $75,000
o $75,000 to just under $100,000
o $100,000 to just under $150,000
o $150,000 to just under $200,000
o $200,000 or more
39. Over the next two years, the Health
Quality Council of Alberta will be
conducting future evaluations of health
care quality issues. This may involve, for
instance, focus groups or interviews.
Would you be interested in participating
in such activities?
o Yes
o No
NOTE: Auto fill their phone number from
the contact data of PRA.
40. Can you please tell me your full name?
[INTERVIEWER: Please have respondent
confirm spelling of first and last name - even
for what seems an “easy” name like “Carol
Smith” which could be spelled “Carol
Smyth, Karyl Smythe, etc.]
FIRST Name: ________________
SURNAME/LAST Name: _____________
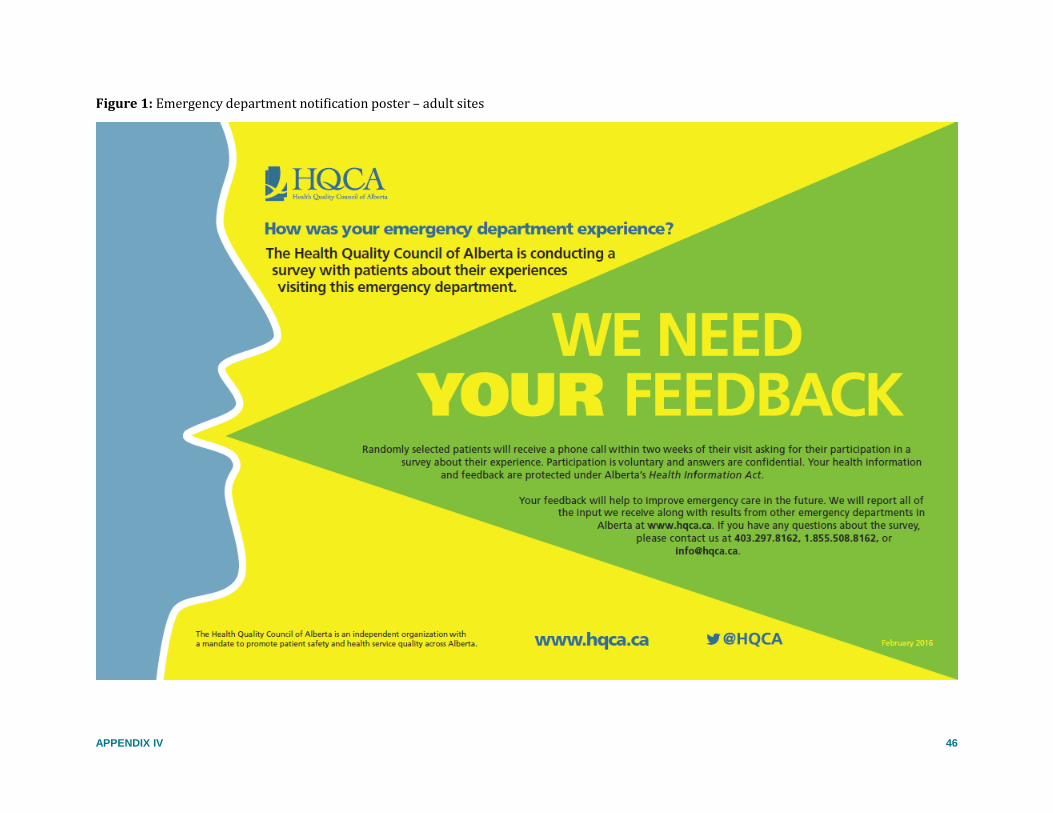
APPENDIX IV 46
Figure 1: Emergency department notification poster – adult sites

APPENDIX IV 47
Figure 2: Emergency department notification poster – pediatric sites
REFERENCES 48
REFERENCES
1 Nunnally, J.C. (1978). Psychometric theory (2nd ed.). New York: McGraw-Hill.
2 Provost L.P., Murray S.K. The Health Care Data Guide: Learning From Data for Improvement. San Francisco, CA: Jossey-Bass; 2011.
3 Wheeler D.J. Rational Sampling. Accessed from: http://www.qualitydigest.com/inside/statistics-column/070115-rational-sampling.html.
4 Montgomery D.C. Introduction to Statistical Quality Control. 6th ed. Hoboken, NJ: John Wiley & Sons; 2009.