Embed Size (px)
Citation preview

Methodology for groundwater recharge assessment in carbonateaquifers: application to pilot sites in southern SpainB. Andreo & J. Vías & J. J. Durán & P. Jiménez &
J. A. López-Geta & F. Carrasco
Abstract Aquifer recharge can be determined by conven-tional methods such as hydrodynamic or hydrologicbalance calculations, or numerical, hydrochemical or iso-topic models. Such methods are usually developed withrespect to detrital aquifers and are then used on carbonateaquifers without taking into consideration their hydro-geological particularities. Moreover, such methods are notalways easy to apply, sometimes requiring data that arenot available. Neither do they enable determination of thespatial distribution of the recharge. For eight regions insouthern Spain, the APLIS method has been used toestimate the mean annual recharge in carbonate aquifers,expressed as a percentage of precipitation, based on thevariables altitude, slope, lithology, infiltration landform,and soil type. The aquifers are representative of a broadrange of climatic and geologic conditions. Maps of theabove variables have been drawn for each aquifer, using ageographic information system; thus they can be super-imposed to obtain the mean value and spatial distributionof the recharge. The recharge values for the eight aquifersare similar to those previously calculated by conventionalmethods and confirmed by discharge values, whichcorroborates the validity of the method.
Résumé L’alimentation des aquifères peut êtredéterminée par des méthodes conventionnelles tellesque les calculs de balances hyrologiques ou hydro-dynamiques, ou les modèles numériques, hydrochimiques
ou isotopiques. De telles méthodes sont habituellementdéveloppées en aquifères détritiques mais sont égalementutilisées pour des aquifères carbonatés sans prendre encompte leurs spécificités hydrogéologiques. De tellesméthodes peuvent de surcroît être difficilement applica-bles, car des données essentielles sont parfois man-quantes. Elles ne permettent pas non plus de déterminerla distribution spatiale de l’alimentation. Sur huit régionsdu Sud de l’Espagne, la méthode APLIS a été utiliséepour estimer l’alimentation moyenne annuelle d’aquifèrescarbonatés, exprimée en pourcentage des précipitations,en utilisant les variables suivantes : altitude, pente,lithologie, modelé d’infiltration et type de sol. Lesaquifères sont représentatifs d’un large éventail deconditions climatiques et géologiques. Pour chaqueparamètre sus-cité, des cartes ont été établies par aquifèreen utilisant un système d’information géographique, afinde pouvoir les superposer et aboutir à la moyenne et ladistribution de l’alimentation. Les valeurs d’alimentationpour les huit aquifères sont comparables à cellesobtenues par les méthodes conventionnelles et confir-mées par les valeurs de flux sortants, ce qui corrobore lavalidité de la méthode.
Resumen La recarga de los acuíferos puede ser determi-nada por métodos convencionales de tipo hidrodinámico,balance hidrológico o numéricos y por técnicas hidroquí-micas e isotópicas. Tales métodos han sido desarrolladosen acuíferos detríticos y después han sido aplicados enacuíferos carbonatados sin tener en consideración lasparticularidades hidrogeológicas de éstos. Además, dichosmétodos no son siempre fáciles de aplicar, algunas vecesrequieren datos que no están disponibles. Tampocopermiten determinar la distribución espacial de la recarga.En ocho áreas del Sur de España se ha aplicado el métodoAPLIS para estimar la recarga media anual en acuíferoscarbonatados, expresada como porcentaje de la precipita-ción, a partir de las variables altitud, pendiente, litologíaformas de infiltración y tipo de suelo. Los acuíferosson representativos de un amplio rango de condicionesclimáticas y geológicas. Se han realizado los mapas de lasvariables anteriores mediante Sistemas de InformaciónGeográfica y se han superpuesto para obtener el valormedio y la distribución espacial de la recarga. Los valoresde recarga obtenidos son similares a los calculadospreviamente por métodos convencionales y confirmados
Received: 7 November 2006 /Accepted: 4 January 2008Published online: 31 January 2008
* Springer-Verlag 2008
B. Andreo ()) : J. Vías : P. Jiménez : F. CarrascoHydrogeology Group of the University of Malaga (GHUMA),Faculty of Sciences, Department of Geology,University of Malaga, 29071 Málaga, Spaine-mail: [email protected].: +34-952-132004Fax: +34-952-132000
J. J. Durán : J. A. López-GetaDepartment of Hydrogeology and Groundwater,Spanish Geological Survey (IGME),Ríos Rosas, 21003 Madrid, Spain
Hydrogeology Journal (2008) 16: 911–925 DOI 10.1007/s10040-008-0274-5

con los valores de descarga, lo cual corrobora la validezdel método.
Keywords APLISmethod . Carbonate rocks .Groundwater recharge/water budget . Geographicalinformation systems . Spain
Introduction
Recharge is the downward flow of water reaching thewater table and the groundwater reservoir. For a suffi-ciently long period of years, and in aquifers not subjectedto pumped extractions, the mean annual value of therecharge is equivalent to the rate of discharge. Thus,groundwater recharge over an area is normally equal toinfiltration excess. There are three mechanisms of recharge(Lerner et al. 1990): direct recharge by percolationthrough the unsaturated zone, indirect recharge throughthe beds of surface-water courses, and localised orconcentrated recharge at points. The aquifer recharge canbe expressed as an annual mean volume, which isnormally termed the mean annual resources or entry, oras a percentage of precipitation, this being termed the rateof recharge or effective infiltration.
Aquifer recharge is a question that is addressed, ingeneral, in most manuals of hydrogeology, and in a morespecific way, in several books (Lerner et al. 1990; Sharma1990; Custodio et al. 1997) that include detailed informa-tion on the estimation of recharge under various climaticand hydrologic circumstances. One important reference isVol. 10(1) of Hydrogeology Journal, entitled GroundwaterRecharge, which examines fundamental aspects of re-charge, the application of methods to quantify it, and theuse of modelling.
Groundwater recharge can be measured by means ofdiverse methods, none of which are free from uncertainty(Scanlon et al. 2002; Flint et al. 2002). Direct determina-tion, using lysimeters and seepage meters, is of local valueand not always representative of the aquifer as a whole.There also exist Darcian approaches based on fieldmeasurement and numeric methods, using the groundwa-ter flow equation under conditions of partial or totalsaturation. Under partial saturation a steady-state regime isassumed, which functions better for the flow within thesaturated zone, while conditions of total saturation can beused to address situations of a time variant regime, butrequire a greater amount of data (Samper 1997). Numer-ical models, when they are reasonably valid, can be of usein calculating the magnitude of the recharge, taking thelatter as one of the parameters in the calibration of theflow model (Samper 1998; Sanford 2002), althoughgreater difficulties are encountered in determining theevolution of the recharge over time and its spatialdistribution.
Methods based on the use of natural tracers, whetherchemical (chloride balance) or isotopic (18O, 2H, 3H and14C), or whether using artificial tracers (organic andinorganic colorants), constitute an alternative to hydrody-
namic methods (Allison et al. 1985; Wood and Sanford,1995; Murphy et al. 1996; Scanlon et al. 2002). Thechloride balance method (Schoeller 1962) is very widelyutilised when there is no other source of chloride thanrainfall, because of the conservative nature of this ion, andits simple, inexpensive analysis. However, hydrochemicaland isotopic methods do require representative samples ofrainfall and groundwater.
Another possibility of estimating recharge is providedby balance methods (Blavoux et al. 1992; Samper 1998;Scanlon et al. 2002; Jocson et al. 2002). These are basedon the fact that water entry should be equal to the amountdischarged plus or minus the variation in the volume ofwater that is stored. In practice, only some of the com-ponents in the groundwater balance equation can bemeasured directly (e.g. precipitation), while the rest (i.e.potential and real evapotranspiration, and effective rain-fall) must be estimated indirectly using semi-empiricalformulae such as those proposed by Thornthwaite (1948),Coutagne (1954) and Turc (1954), among others. Themethod suggested by Kessler (1967), on the other hand,only requires pluviometric data, and is based on thehypothesis that in warm-climate regions, recharge occursduring two periods, namely the first and the last fourmonths of the year. To calculate groundwater recharge bymeans of balance methods, specific software has beendeveloped, enabling the user to simulate the groundwaterflow within an aquifer; examples of such programsinclude BALAN (Samper and García Vera 1992; Samper1997) and BALDOS 10 (Manzano et al. 1997). Otherauthors (Sophocleous 1992; Fayer et al. 1996; Civita andDe Maio 2001) have combined these techniques withgeographic information systems (GIS) to obtain the spatialdistribution of the recharge. Balancemethods present severaladvantages such as the availability of data (pluviometry,piezometric levels, yields, etc.), their straightforwardimplementation and relatively low cost, the fact that allpossible inputs and outputs of water are taken intoconsideration and their applicability to all types ofrecharge and aquifer media. However, they also havedisadvantages, arising from the fact that the terms in thebalance normally include errors of measurement, ofinterpretation and of estimation, as well as those derivedfrom the use of techniques that may not be the mostappropriate.
Many studies have been done on the recharge overextended areas using field data using different methods(numerical models, chemical and isotopic techniques,direct measure of flow rate). A literature review onregional recharge assessment permits identification of someinternational examples: Leaney and Herczeg (1995),Sukhija et al. (1996), Birkle et al. (1998), Rangarajanand Athavale (2000); Nolan et al. (2006), Anuraga et al.(2006). Recent advances on distributed methods ofrecharge calculation have been done by Heathcote et al.(2004) and Hughes et al. (2006) to estimate the rechargeand runoff components at regional scale. Brito et al.(2006) identified maximum infiltration by means of GIS.Zagana et al. (2007) described the groundwater recharge
912
Hydrogeology Journal (2008) 16: 911–925 DOI 10.1007/s10040-008-0274-5

in three hydro-climatic environments in the easternMediterranean region. The assessment of recharge andits spatial distribution over large areas are key questionsfor groundwater management, particularly where ground-water is the only fresh water available. More relevantresearch at international level is necessary to developmethods adapted to different climatic and geologicconditions.
Most of the methods described above have beendeveloped in detrital aquifers or in sedimentary basinsfilled by unlithified deposits, despite the fact that asignificant proportion of the world’s aquifers are carbon-ate. In Europe, carbonate terrains occupy 35% of the landsurface, and in some countries, karst groundwater con-tributes 50% to the total drinking water supply. In general,recharge in carbonate aquifers is estimated by means ofmethods adapted and derived from those used for detritalaquifers. However, carbonate aquifers have specific char-acteristics (forms of preferential infiltration includingpoint recharge via swallow hole, flow concentration inthe epikarst, thin soil, thicker unsaturated zone,) and ahydrogeologic functioning that is typical of heterogeneousmaterials. In such aquifers, in addition to diffuse forms ofrecharge, it may be concentrated via perennial, ephemeralor intermittent sinking streams. Moreover, recharge maybe autogenic or allogenic, depending on whether it isderived from rainfall over carbonate outcrops or fromadjacent materials that are relatively impermeable. Allthese considerations serve to explain the need for specificresearch into recharge in carbonate aquifers.
The fundamental aim of this study is to develop amethod to (1) estimate the rate of autogenic recharge intocarbonate aquifers on the basis of a combination ofgeological, geographic, morphologic and edaphologic
variables; (2) determine the spatial distribution of thisrecharge into the aquifers. In accordance with Lerner et al.(1990), a further objective is that the method, as well asestablishing the magnitude of the recharge and taking intoaccount the mechanisms by which it is produced, shouldnot use hard-to-determine parameters and should bepractical and simple to implement. In this work, therecharge is expressed as percentage of rainfall and re-charge is a key factor in water resources assessment andmanagement. The multiplication of this percentage bythe rainfall (mm/year) gives the recharge expressed asmm/year.
Methodology
To achieve the above goals, eight aquifers in southernSpain have been selected (Fig. 1) which are representativeof a wide range of climatic and geological characteristics.The mean rate of annual recharge (expressed as a per-centage of precipitation) for these aquifers is well known;in most cases, it is calculated using various methods andcompared with the real discharge measured. Thus, for agiven period of time, the mean recharge (entry) value isequal to that of the discharge plus or minus the variationin the volume of water stored within the aquifer. Then, thelayers of information corresponding to variables thatinfluence recharge have been introduced into a GIS; thesedata were subjected to multivariate analysis to determinewhich of them were the most influential. Using the mostsignificant variables, a system of ratings and scores wasdeveloped which, when appropriately combined andapplied, using the GIS, enables one to estimate the rateof recharge and its spatial distribution.
Fig. 1 Geographical locationof the eight aquifers consideredin this study
913
Hydrogeology Journal (2008) 16: 911–925 DOI 10.1007/s10040-008-0274-5

A completely new review of the general characteristicsof each aquifer was carried out, with particular referenceto physical characteristics of different type (climatic,topographic, lithologic, geomorphologic and pedologic)that influence recharge, taking into account recent studiesmade in every case. In a first step, a wide group of variableshave been considered and after successive analysis theybeen progressively reduced, resulting in only the reallyimportant variables for groundwater recharge assessment.
Once the aquifers had been characterised, data for themean rate of annual recharge into them have been derived,using conventional techniques. Thus, Thornthwaite’smethod was used for all the aquifers, with field capacitiesof both 25 and 50 mm. In several aquifers, recharge valueswere obtained using the chloride balance (Schoeller 1962)and Kessler’s method (1967). It should be noted thatdifferent results are obtained for the same aquifer depend-ing on the method that is utilised. For this reason, therecharge values were compared with those obtained fordischarge from the aquifer.
After characterising the aquifers and estimating therecharge into them, the layers of information corre-sponding to the variables that influence recharge and thatare usually available in the databases maintained by publicauthorities were entered into a GIS; these variables areprecipitation, altitude, slope, lithology, areas of preferen-tial infiltration and soil types. Precipitation was estimatedby mapping isohyets, plotted at 100 mm intervals. Thealtitude map was derived from the digital elevation model(DEM) produced by the Andalusian Cartographic Insti-tute, using a cell size of 100 m. The map of slopes wascreated on the basis of the DEM, in ArcGIS 8.2, plotting atriangulated irregular network corresponding to homoge-neous areas of the different slope intervals. Lithologicalmapping was digitised in Autocad 14, on the basis of thenational geological map (scale 1:50,000) produced by theSpanish Geological Survey; ArcGIS 8.2 and ArcView 3.2were then used to produce the information layer. The areasof preferential infiltration were derived from geomorpho-logical mapping, when available; otherwise, they can bemapped over aerial and/or land-based photographs evenby remote sensing (Rielp 2006). If these materials are notavailable, zones of exokarstic forms, where the preferen-tial infiltration occurs, can be assessed by superimpositionin ArcView 3.2 of the maps of the slope and lithology(areas of low slope made up by limestone are normallykarstified and preferential infiltration occurs). Finally, themap of soil types was obtained from the System ofEnvironmental Information on Andalusia (Sinamb-A); thiswas georeferenced in Autocad 14. ArcGIS 8.2 andArcView 3.2 were then used to create the correspondinginformation layer for this variable.
From the information layers generated with the GIS, aseries of geographic, geologic and climatic parameterswas obtained; statistical analysis of these revealed whichvariables play the most significant roles in the recharge ofdifferent aquifers. Subsequently, a scoring system wasdeveloped to create maps of these variables within a GIS(ArcGIS) and various combinatory procedures were
applied to these maps to produce a single calculationalgorithm enabling one to determine the known rechargevalue and the spatial distribution of this recharge withinthe whole group of aquifers.
General characteristics of the pilot aquifers
In the Betic Cordillera, in southern Spain, there are alarge number of carbonate massifs that are susceptibleto karstification, although not all of them present thesame reactions to dissolution processes for the subse-quent development of karstic systems. Morphostructuraland bioclimatic diversity and recent geological historyhave created widely varying karstic and hydrogeologicgeomorphologies.
In carrying out the present study, various carbonateaquifers from the Betic Cordillera were selected. Fromwest to east, these are as follows (Fig. 1): Sierra de lasCabras (province of Cádiz), Sierra de Líbar (Cádiz andMálaga), Sierra de las Nieves (Málaga), Sierra Blanca andSierra Mijas (Málaga), Sierra Gorda de Loja (Granada),Sierra de Cabra and Rute-Horconera (Córdoba), Sierra deCazorla (Jaén) and Sierra de María (Almería). Theseaquifers are representative of a wide range of geological,climatic, topographic, geomorphologic and edaphologiccharacteristics (Table 1).
As concerns the climatic context, in Andalusia, precip-itation diminishes from west to east, by almost one orderof magnitude (from approximately 2,000 mm in someareas of the province of Cádiz to 200 mm in Almería).Therefore, for the purposes of the present study, aquifersthat are representative of a wide range of mean annualprecipitations were selected, from 1,300 mm in Sierra deLíbar to less than 500 mm in Sierra de María.
Sierra de las Cabras aquifer is formed by dolostonesand limestones of Jurassic age. The geological structure isan anticline that conditions the mountainous relief. Thekarst features—both exokarstic and endokarstic—are veryscarce. The recharge of the aquifer occurs in a diffuse way,and discharge of the aquifer occurs by one spring thatresponds smoothly to the precipitation due to the diffuseflow behaviour of the aquifer.
Sierra de Líbar aquifer is formed of Jurassic dolostonesand limestones, and Cretaceous marls and marly-limestones.The geological structure comprises a major anticline foldand a central minor syncline occupied by Cretaceousmarls. The lithological and geological structures deter-mine the existence of a relief characterised by steepslopes at the borders and a plateau in the central sector,where there are abundant karstic landforms. Mostdischarge is by four springs located on the southernborder. The available data suggest that these springsrespond rapidly to precipitation, with sharp changes inflow, due to the karstic behaviour of the aquifer.
Sierra de las Nieves is an important relief of the Malagaprovince (S Spain) where outcrop dolostones and lime-stones of Triassic and Jurassic age, which are permeable byfracturation and karstification. In fact, the karst features are
914
Hydrogeology Journal (2008) 16: 911–925 DOI 10.1007/s10040-008-0274-5

abundant in this aquifer. The drainage of the aquifer takesplace at its southern edge, through several springs; responseto precipitation is very rapid such as occurs in karsticaquifers with conduit flow behaviour.
Sierras Blanca and Mijas constitute a very abrupt relief.From a geological standpoint, this aquifer is formed ofTriassic marbles, overlying Palaeozoic metapelites (Andreo1997). The geological structure of these marbles is formedby isoclinal folds, which have subsequently been affectedby faults that provoke hydrogeological divides. Karsticmorphologies are very scarce, with just karren and somesmall caves. From a hydrogeological standpoint, thegroundwater flow is from the centre to the borders, wherethe main points of natural discharge are located. Hydro-graph analysis of these springs shows that western SierraBlanca is a conduit flow system while the rest has a diffuseflow behaviour (Andreo 1997).
The aquifer of Sierra Gorda is very extensive withabrupt relief made up by Jurassic dolostone and limestone.In the high part of the mountain the slope decreases andkarst features (mainly dolines) are developed. The maindischarge area is located in the northern edge of theaquifer.
Sierras de Cabra and Rute-Horconera are large carbon-ate outcrops in the central part of Andalusia constituted bydolostones and limestones of Jurassic age. These rocks areaffected by folds and overthrusting structures whichdivide the massifs into several aquifers. The recharge ofthe aquifers is mainly diffuse; only locally is it concen-trated through swallow holes or from rivers that cross thecarbonate outcrops. Discharge of these aquifers occurs bysprings located in their border, for which responses are notvery sharp to the rainfall infiltration. In fact, the degree ofkarstification seems lower than in Sierra de Libar or Sierrade las Nieves.
Sierra de Cazorla is an abrupt massif formed byJurassic and Cretacic dolostones which have been de-formed by reversed faults. The major karst features arepoorly developed at the surface and the recharge predom-inantly occurs diffusely. The springs respond smoothly tothe infiltration of precipitation because of the diffuse flowbehaviour of the aquifer.
Sierra de María is also formed by Jurassic dolostonesand limestones involved in a folded structure, which hasbeen affected by fractures. This provokes hydrogeologicaldivides within the area and groundwater flow occursslowly toward the spring located in the borders of theaquifer. Both recharge and discharge occur in a diffuseway, in accordance with the diffuse flow behaviour of thisaquifer.
With respect to the topography (although they could allbe mountain aquifers, with a varied range of altitudes andslopes, as corresponds to an Alpine cordillera that hasbeen strongly affected by neotectonics), both aquifers witha particularly abrupt topography (Sierra de María andSierra de Cazorla) and others with a less rugged relief(Sierra de las Cabras) were considered. Additionally,aquifers featuring relatively steep slopes and more or lessflat at the top (i.e. a plateau-type relief) such as Sierra deLíbar and Sierra de las Nieves, were also taken intoaccount.
In general, the soil is relatively thin, and the vegetationis scant in the carbonate massifs of southern Spain.Nevertheless, several of the aquifers included in this studypresent large areas where the soil attains a certainthickness and where vegetation has developed, even ifthe latter originated from reforestation (for example, Sierrade María, Sierra de Cabra-Rute-Horconera, Sierra deCazorla and Sierra de Mijas). In other aquifers (Sierra deLíbar and Sierra Gorda), there is virtually no soil or
Table 1 Climatic, geologic, geomorphologic and pedologic variables of the aquifers considered in principal component analysis
AquifersCabras Líbar Nieves Blanca-
MijasCabra-Rute-Hor
Gorda Cazorla María
Surface (km2) 34 89 129 173 196 334 823 70Temperature (°C) 17.3 15.8 15.0 18.3 15.7 13.1 14.6 12.0Evapotranspiration (mm) 925 850 875 925 850 825 850 850
Precipitation isohyets Mean precipitation (mm) 964 1,299 1,004 712 800 861 740 484Total volumeprecipitated (hm3)
33 116 129 123 118 287 609 34
Altitude hypsometriccurve
Amplitude of the relief(m)
571 930 1,528 1,131 1,091 1,145 1,918 976
Mean altitude (m) 362 949 1,140 620 956 594 1,136 1,51625th percentile (m) 241 749 832 360 724 565 788 1,29675th percentile (m) 508 1,148 1,455 885 1,188 626 1,484 1,747
Slope Gradient < 8% (%) 22 20 20 14 21 37 19 11Gradient > 46% (%) 19 21 20 22 13 7 15 29
Lithology Calcareous rocks (%) 80 77 53 50 54 76 28 42Dolomitic rocks (%) 11 4 45 48 15 11 56 52
Preferentialinfiltration
Surface (%) 7 46 12 7 2 29 5 1
Soil Leptosol (%) 26 80 66 65 15 80 6 58Recharge Mean recharge rate (%) 33 55 55 45 45 50 33 33
Total volume precipitated the total account or volume of rainwater precipitated over the aquifer, expressed as hm3 (1 hm3 =106 m3 )
915
Hydrogeology Journal (2008) 16: 911–925 DOI 10.1007/s10040-008-0274-5

vegetation above the carbonate outcrops. Thus, the selectedaquifers are representative of a wide range of the geo-logical, climatic, topographic, geomorphologic and pedo-logic characteristics that are to be found in karst areas.
Mean annual recharge
For each of the selected aquifers, prior information wasavailable on the recharge rate, determined by variousconventional techniques and, in general, confirmed bydischarge data (Table 1).
In Sierra de las Cabras, various attempts to estimaterecharge were done, using balance methods taking intoaccount water entry mainly derived from precipitation,and discharge at the spring that constitutes the aquifer’sprincipal point of discharge. The calculations wererepeated for three periods of unequal duration (Jiménezet al. 2001): a historical period (1862–1978) for whichmonthly data are available for the flow volume from thespring; a recent, but shorter period (1985–1995) for whichcorresponding daily data are available; and finally, theperiod from 17 June 1996 to 17 November 1999 for whichpiezometric data are available. Over the first two periods,which were sufficiently long and representative for reli-able conclusions to be drawn, entry into the system(resources) would have been about one third of totalprecipitation and would be equivalent to the dischargefrom the spring that drains the system. For the thirdperiod, a similar mean annual rate of recharge wasobtained, which corroborates the view that the rechargerate must be about one third of the rainfall onto thepermeable surface of Sierra de las Cabras.
The mean annual recharge rate in Sierra de Líbar wascalculated by the Spanish Geological Survey (IGME,unpublished report, 1984), by the application of Kessler’smethod and Thornthwaite’s balance; the results obtainedwere, respectively, 55 and 59% of precipitation. In thereport produced by the General Directorate for WaterManagement (DGOH 1998), part of the EnvironmentMinistry, recharge was evaluated at 53% of precipitation.A mean recharge rate of 54% has been calculated on thebasis of recent data on the chloride content in rainfall andin the water drained by the Benaoján spring. Therefore,from all the data compiled, the mean rate of recharge intoSierra de Líbar should be of the order of 55%.
For the aquifer of Sierra de las Nieves, the mean annualrate of recharge has been calculated by different methods,including balance, hydrochemistry (chloride) and Kess-ler’s method (Liñán 2003). The balance methods that havebeen implemented take into account the water drained bysprings and the water entering as a result of precipitation,after having first discounted evapotranspiration, as calcu-lated by the methods of Turc, Coutagne and Thornthwaite(with field capacities both 25 and 50 mm for the lastmethod), although the water entry values differ greatlyfrom those for discharge. However, Kessler’s method leadone to obtain recharge rates of 51% and a chloride balanceof 55%; the latter value is in better agreement with the
geological and hydrogeological observations made in thefield.
For Sierra de Blanca and Sierra de Mijas, the meanannual rate of recharge was calculated using the samemethods as for Sierra de las Nieves (Andreo et al. 2000);additionally, Thornthwaite’s method was applied with dailydata for precipitation and temperature. The methods thatgave overall results most consistent with hydrogeologicalobservations were the chloride balance and Thornthwaite’smethod (daily data; field capacity of 50 mm). The meanannual recharge rate calculated was 45%.
López Chicano (1992) applied the above-mentionedmethods in a study of Sierra Gorda. The recharge valuefound, corroborated by the visible discharge from springs,was of the order of 50%. In Sierra de Cabra and Sierra deRute-Horconera, entries to the system correspond exclu-sively to infiltration from the precipitation onto the surfaceof the aquifer (Bouamama et al. 1996). ITGE (1998),using balance methods, evaluated the recharge at 45%.
In a study of Sierra de Cazorla, Rubio-Campos et al.(2001) used a recharge rate deduced from data for precipi-tation and flow volume from springs (IGME-Universidad deGranada, unpublished report, 253 pp, 1990). The meanannual rate of recharge thus calculated was 33%.
Finally, in Sierra de María, the recharge rate wascalculated by Moreno et al. (1983) using Kessler’s methodand hydrogeological balance methods, among which evapo-transpiration values were obtained by various procedures(those described by Thornthwaite, Coutagne and Turc).The recharge rate thus found is about one third ofprecipitation, and is coherent with corresponding ratesfound by other methods and with recent data obtained bythe chloride balance method. The results obtained for theeight aquifers reveal that the mean annual recharge ratesin carbonate aquifers of the Betic Cordillera are approx-imately 33–55% of the precipitation onto the aquifersurface.
Analysis of the variables that influence recharge
On the basis of the maps or information layers generatedby the GIS concerning physical characteristics of differenttype (climatic, topographic, lithologic, geomorphologicand pedologic) that influence recharge, firstly, a wide list ofgeographic, geologic and climatic variables was obtained(Table 1). Thus, as an initial approach, the followingparameters were extracted from the corresponding GISinformation layers (Durán et al. 2004): from the map ofisohyets, the mean precipitation and the total volumeprecipitated; from the hypsometric map, the amplitude ofthe relief, the mean altitude and the 25th and 75thpercentiles of the hypsometric curve; from the slopesmap, the proportion of the surface with gradients <8% and>46%; from the lithological map, the proportion of thesurface taken up by calcareous and dolomitic rocks; fromthe geomorphologic map, the proportion of the surfacetaken up by materials of preferential infiltration; from themap of soil types, the proportion of the surface taken up
916
Hydrogeology Journal (2008) 16: 911–925 DOI 10.1007/s10040-008-0274-5

by carbonate rocks, or that is devoid of soil or where thelatter is poorly developed (leptosol). Other parameterswere also used, including the total surface area of theaquifers, the temperature and potential evapotranspiration,as well as the mean recharge rate that had previously beenobtained for each system by means of conventionaltechniques.
Applying the data corresponding to each of the aboveparameters, several principal component analyses (PCA)were carried out. PCA is a technique used to reducemultidimensional data sets to lower dimensions for anal-ysis (Dillon and Goldstein, 1984). This methodology hasbeen used as a statistical tool to discriminate whichvariables are more important in a group of samples andto discriminate groups or families of statistical units thatcould have, potentially, a relationship. In the present work,PCA has been used to determine which parameters aremost influential in aquifer recharge, and which families orgroups of aquifers may be identified as being related interms of aquifer recharge. PCA is mathematically definedas an orthogonal linear transformation that transforms thedata to a new coordinate system such that the greatestvariance by any projection of the data comes to lie on thefirst coordinate (called the first principal factor), thesecond greatest variance on the second coordinate, andso on (Dunteman, 1989). Only the first two principalfactors have been taken into account in this investigationbecause they explain most of the variance. In this case, anacceptable level of variance should be higher than 60%.
An initial PCA was performed using the set ofvariables and aquifers shown in Fig. 2a. The two axes orprincipal factors of this initial PCA explain 65.1% of thevariance. Factor I (40.9%) is characterised by the oppo-sition between the percentage of calcareous rocks and aset of variables that, to a large degree, provide the sametype of information (aquifer relief); these include theamplitude of the relief, the mean altitude and the 25th and75th percentiles of the hypsometric curve. The second axis(24.2%) is defined by the slope, the proportion of thesurface taken up by preferential infiltration landforms andby temperature and evapotranspiration (these latter twovariables being in very close proximity in the Fig. 2a).The right panel of Fig. 2 shows the observation plans. Inthe observations plan of Fig. 2a, on the left, aquifers witha high rate of recharge (Sierra de Líbar and Sierra Gorda)can be distinguished; on the right are aquifers with a lowrate of recharge (Sierra de Cazorla and Sierra María) andthose with an intermediate rate (Sierra Blanca, SierraMijas and Sierra Rute-Horconera). The aquifers in Sierrade las Nieves (where the recharge rate is high) and,especially, those of Sierra de las Cabras (where it is low)do not fit well into the above characterisation. In any case,in this initial PCA, a great many variables are redundantand are superimposed in the diagram, while others do notseem to play any predominant role in the context of thisstudy. Therefore, a second PCA was carried out, fromwhich the latter variables were eliminated. Thus, meanprecipitation and the total volume of rainwater coincide inthe same point (Fig. 2a); physically they can be interpreted
in the same way, so only mean precipitation is preservedfor the next PCA. All the variables from the hypsometricmap are close in Fig. 2a; they give similar information onthe role of the altitude of the recharge (the higher is thealtitude the higher is the recharge), consequently onlythe mean altitude is considered in the second analysis. Thetemperature was also excluded in the second PCA since itis very close to the evapotranspiration in Fig. 2a, and theyrepresent physically the same negative effect in therecharge.
In the second PCA (Fig. 2b), the first two factorsaccount for 67.4% of the variance. Axis I (43.9%) rep-resents the recharge, and is determined by the oppositionof the following variables: mean precipitation, percentageof calcareous rocks, percentage of area with karstic formsfor preferential infiltration, percentage of surface withslopes <8%, percentage of recharge and leptosols, versuspercentage of dolostones and areas of steepest slope. AxisII (23.5%) is defined by the mean altitude and thepotential evapotranspiration. In plan I–II of the statisticalunits, the three groups of aquifers highlighted by the firstPCA can be distinguished, although Sierra de las Nievesand Sierra de las Cabras aquifers maintain a position thatis somewhat incongruent. From the recharge obtained byseveral methods, it can be deduced that their positionswithin the plan I–II of the statistical units should bedisplaced towards the negative and positive parts, respec-tively, of axis I.
The two PCAs described above include, as anothervariable, the previously determined rate of recharge. Athird PCA was performed, without the latter variable, totest whether it plays any significant role in the resultsobtained. In this PCA, the two main axes account for71.2% of the variance (Fig. 2c). Axis I (46.1%), onceagain, is defined by the opposition of the followingvariables: mean precipitation, percentage of limestone,percentage of infiltration karstic forms and percentage ofthe surface with slopes <8%, versus the percentage ofdolostones and, to a lesser degree, the mean altitude.Therefore, it seems clear that axis I constitutes therecharge factor. Axis II (25.1%), as in the second PCA,is defined by evapotranspiration. In plan I–II of thestatistical units, the three groups of aquifer systemsdescribed above can be distinguished. However, theposition of Sierra de las Cabras is similar to that occupiedby Sierra de las Nieves, which suggests there should be asimilar behaviour pattern in terms of recharge; none theless, this hypothesis is not consistent with the rechargecharacterisation obtained previously, by various conven-tional methods, for each of these systems. The position ofthe Sierra de las Cabras aquifer in the diagrams is causedby the relatively high precipitation in this area and by itslow altitude.
A fourth and final PCA, with the same variables as inthe previous one, but excluding the evapotranspirationvariable, leads to the same results as in the third PCA,with no significant loss of variance (the first axes accountfor 68.4%), while approaching the position of Sierra de lasNieves to that of the other aquifers with high recharge
917
Hydrogeology Journal (2008) 16: 911–925 DOI 10.1007/s10040-008-0274-5

rates in the graph of statistical units, and that of Sierra delas Cabras towards the aquifers with lower recharge rates(Fig. 2d). This means that evapotranspiration is not a keyvariable for groundwater recharge of the pilot aquifers.Evapotranspiration has been considered as a variable forthe PCA analysis because it is a relevant component in thebalance of aquifers. Figures of PCA show evapotranspi-ration (ETP) is on axis II but not in axis I, in the opposite
extreme to recharge rate (as expected). It seems that incarbonate aquifers the recharge is more influenced byother variables rather than the evapotranspiration. Besides,the aim of this work is not to determine the evapotrans-piration but to assess the recharge. Consequently, evapo-transpiration has not been considered.
On the basis of the multivariate analysis carried out onthe data from the eight aquifers in question, it can be
-2
-1.5
-1
-0.5
0
0.5
1
1.5
2
-2 -1.5 -1 -0.5 0 0.5 1 1.5 2
Factor I
Fac
tor
II
CABRA-RUTE-HORCONERA
(45%)
MARIA (33%)
BLAN CA-MIJAS(43%)
CAZORLA (30%)GORDA(55%)
CABRAS (33%)
LIBAR`
`(55%)
NIEVES(55%)
-2
-1.5
-1
-0.5
0
0.5
1
1.5
2
-2 -1.5 -1 -0.5 0 0.5 1 1.5 2
Factor I
Fac
tor
II
CABRA-RUTE-HORCON ERA (45%)
MARIA(33%)
BLANCA-MIJAS(43%)
CAZORLA(30%)
GORDA(55%)
CABRAS(33%)
LIBAR (55%)`NIEVES
(55%)
-2
-1.5
-1
-0.5
0
0.5
1
1.5
2
-2 -1.5 -1 -0.5 0 0.5 1 1.5 2
Factor I
Fac
tor
II
CABRA-RUTE-HORCONERA (45%)
MARIA(33%)
BLANCA-MIJAS(43%)
CAZORLA (30%)GORDA (55%)
CABRAS ( 33%)
LIBAR (55%)`
`
N IEVES (55%)
-2
-1.5
-1
-0.5
0
0.5
1
1.5
2
-2 -1.5 -1 -0.5 0 0.5 1 1.5 2
Factor I
Fac
tor
II
CABRA-RUTE-HORCONERA (45%)
MARIA(33%)
BLANCA-MIJAS (43%)
CAZORLA (30%)GORD A (55%)
CABRAS(33%)
LIBAR (55%)`
NIEVES(55%)
-1-0.8-0.6-0.4-0.2
00.20.40.60.8
1
-1 -0.5 0 0.5 1
Factor I (43.9%)
Fact
or I
I (2
3.5%
)
Slope < 8%
PreferentialInfiltration
Rechargerate
Mean Precipitation
Calcareousrocks
Dolomiticrocks
ETP
Slope > 46%
Mean Altitude
Leptosol
b
-1-0.8-0.6
-0.4-0.2
00.20.4
0.60.8
1
-1 -0.5 0 0.5 1Factor I (40.9%)
Fact
or I
I (2
4.2%
)
Slope<8%
PreferentialInfiltration
Rechargerate Total Volume
Mean Precipitation
Calcareousrocks
Dolomiticrocks
Temperature
ETP
Slope>46%
Surface
Amplitude of the Relief Mean Al titudeLeptosol
25th
perc.
75th percentile
a
-1
-0.8
-0.6
-0.4
-0.2
0
0.2
0.4
0.60.8
1
-1 -0.5 0 0.5 1
Factor I (46.1% )
Fact
or I
I (2
5.1%
)
Slope < 8%
PreferentialInfiltration
Mean Precipitation
Calcareousrocks
Dolomiticrocks
ETP
Slope > 46%
Mean Altitude
Leptosol
c
-1-0.8-0.6-0.4-0.2
0
0.20.4
0.60.8
1
-1 -0.5 0 0.5 1Factor I (49.7% )
Fac
tor
II (
18.7
% )
Slope < 8%
PreferentialInfiltration
Mean Precipitation
Calcareousrocks
Dolomiticrocks
Slope > 46%
Mean Altitude
Leptosol
d
Fig. 2 Principal componentanalysis: a performed with allthe data from Table 1; b withoutthe reiterative variables and withlower statistical significance; cwithout the % recharge; d with-out ETP. The right panel showsthe observation plans
918
Hydrogeology Journal (2008) 16: 911–925 DOI 10.1007/s10040-008-0274-5

concluded that recharge is mainly influenced by thefollowing variables: precipitation, altitude, slope, litholo-gy, forms of infiltration or preferential absorption, and soiltype. This statement is consistent with results obtained inrecent investigations (Nolan et al. 2006). Recharge, thus,tends to be higher where precipitation is abundant andwhere there are extensive limestone outcrops, because insuch terrain there are abundant exokarstic preferentialinfiltration landforms, especially if the slope is slight(<8%). All these variables are readily available, or can bestraightforwardly deduced from the information providedin the databases of diverse public bodies, and can be used,after being entered into a GIS, to estimate recharge rates.
Methodological proposal for calculating rechargeinto carbonate aquifers: the APLIS method
From the known recharge values for the pilot aquifers andfrom the information layers (maps) corresponding to theintrinsic variables that influence recharge, a system ofratings and scores was developed (Table 2) to create a mapfor each variable within a GIS (ArcGIS). This approach issimilar to others used in groundwater protection ofcarbonate aquifers such as EPIK (Doerfliger et al. 1999),PI (Goldscheider 2005) or COP (Vías et al. 2006).Different procedures were applied, combining these infor-mation layers, to obtain a single calculation algorithm thatenables one to determine the mean recharge value(expressed as a percentage of precipitation) and a zoningscheme for this recharge within each of the aquifers. Asthe aim of this work was to derive an algorithm tocalculate the recharge rate, expressed as a percentage ofprecipitation, the information layer corresponding to thelatter variable was not taken into consideration. Thus, themean annual recharge is always proportional to precipita-tion, and so the constant of proportionality for eachaquifer was sought, as a function of its intrinsic variables,namely the altitude, slope, lithology, preferential infiltra-tion landforms and soil type. The method is termedAPLIS, after the Spanish initials for these variables(Andreo et al. 2004a, b).
Scoring of the variables to create the informationlayers in the GISTen categories were established for each variable, when-ever possible, such that each one corresponded to a scoreranging from 1 to 10, following an arithmetic progression,so that they may be easily compared with the percentagevalues of recharge. A value of 1 represents a minimalcoincidence with aquifer recharge, and a value of 10expresses maximum influence on recharge.
The values for altitude (Table 2) were divided intoclasses with one-by-one arithmetic progression, so that thehigher the altitude, the greater the precipitation and thegreater the aquifer recharge. The altitude values weregrouped into intervals of 300 m; above an altitude of
2,700 m above sea level, the differences in recharge wereinappreciable.
The scores assigned to the slope parameter (Table 2)decreased by one unit with increasing slope, i.e. thegreater the slope, the lower the recharge into the aquifer.The slope values were grouped in irregular intervals inaccordance with the classification used in the System ofEnvironmental Information on Andalusia (Sinamb-A). Asthe version of Sinamb-A used has nine classes orcategories of slope, the score of 6 was removed from theslope section of Table 2. Above a slope of 100%, rechargewas assumed to be minimal and invariable.
Scores were allocated to the diverse types of lithologyon the basis of hydrogeologic criteria (Table 2). As theAPLIS method is mainly intended for estimating therecharge into carbonate aquifers, scores of 5–10 were
Table 2 Ratings for the variables: altitude, slope, lithology, infil-tration landforms, soil types
Variable Rating
Altitude (m)≤ 300 1(300–600] 2(600–900] 3(900–1,200] 4(1,200–1,500] 5(1,500–1,800] 6(1,800–2,100] 7(2,100–2,400] 8(2,400–2,700] 9> 2,700 10
Slope (%)≤ 3 10(3–8] 9(8–16] 8(16–21] 7(21–31] 5(31–46] 4(46–76] 3(76–100] 2> 100 1
LithologyLimestones and dolostones karstified 10 or 9Limestones and dolostones fracturated,slighted karstified
8 or 7
Limestones and dolostones fissured 6 or 5Gravels and sands 4Conglomerates 3Plutonic and metamorphic rocks 2Shales, silts, clays 1
Infiltration landformsMany infiltration landforms 10Scarce infiltration landforms 1
SoilLeptosols 10Arenosols and xerosols 9Calcareous regosols and fluvisols 8Euthric regosols and solonchaks 7Cambisols 6Euthric cambisols 5Histosols and luvisols 4Chromic luvisols 3Planosols 2Vertisols 1
The data range expressed as, for example “(300–600]”, means thatthe value of 300 is not included in this class whilst 600 is included
919
Hydrogeology Journal (2008) 16: 911–925 DOI 10.1007/s10040-008-0274-5

attributed, depending on the degree of fissuring andkarstification. Thus, the higher the degree of fissuringand karstification, the higher the recharge into the aquifer.
Only two different scores were assigned to the variablereflecting the zones of preferential infiltration (Table 2): avalue of 10 for zones where there were areas of prefer-ential infiltration, and otherwise a value of 1. Only thesetwo extreme classes were differentiated because suffi-ciently detailed geomorphologic maps of all the aquifersare not available. Nevertheless, from aerial photographsand field surveys, it is relatively straightforward to identifyareas where there is a predominance of preferentialinfiltration features.
In the case of soil types, the different classes weregrouped depending on the general characteristics ofpredominant thickness and texture, in accordance withSinamb-A. Thus, in soils that are not highly evolved, as isthe case of leptosols (Table 2), where the soil coverage isgenerally scant and the texture very coarse, rechargevalues are maximum (and a score of 10 is allocated); onthe other hand, where soils are thick and clayey (vertisols),recharge is minimal (a score of 1 is allocated).
Algorithm for the recharge calculationAfter the PCA analysis, the main variables influencing therecharge in the eight carbonate aquifers selected as pilotsites are known. A scoring of these variables has beendeveloped and now it is necessary to define how tocombine them to calculate the recharge. The aim is to finda single algorithm that permits calculation of the rechargerate previously obtained, for all the aquifers, using con-ventional techniques, as well as to map the spatialdistribution of the recharge in these aquifers.
The mathematical expression should be an addition orsuperposition of layers corresponding to each variable,since the recharge is the result of the sum of the physicalcharacteristics of the aquifers. However, these variables donot have the same weight or importance in the recharge.Thus, the information layers corresponding to each variable,produced in accordance with the system of ranges andscores described above, were combined using variousmathematical procedures (IGME-GHUMA, unpublishedreport, 2003; Andreo et al. 2004a, b) in order to deducethe weight of each variable.
Various multicriteria methods were applied, includingregression analysis (linear fit by least squares), the idealpoint analysis, and the weighted linear sum method, toelucidate the weights. Table 3 summarises the resultsobtained after the application of various possible combi-nations of layers, including altitude (A), slope (P), lithol-ogy (L), preferential infiltration landforms (I) and soil type(S) even rainfall (Pr). The regression analysis involves thecorrelation between the physical parameters of theaquifers and the recharge rates previously deduced byconventional methods but the weights calculated are notcoherent with the recharge rates previously known. Thesame occurs with the ideal point analysis, which is basedon the deviation of each variable with a theoretical idealpoint, taking into account a variant of the Euclideandistance. Several mathematical expressions have beenchecked (for example 1, 2 and 3) considering the variableswith more influence on the recharge (R).
R ¼ A þ P þ L þ Pr þ I þ Sð Þ=0:6 ð1Þ
R ¼ Aþ P þ 2 � Lþ 2 � Pr þ 3 � I þ Sð Þ=1 ð2Þ
R ¼ A þ 2P þ 5 � L þ 3 � Pr þ 4 � I þ Sð Þ=0:16ð3Þ
None of these algorithms result in estimation of thevalues of recharge similar to the previously calculatedrecharge values for the eight aquifers (Table 3). The bestadjustment occurs in the aquifers of higher recharge rate(Sierra de las Nieves, Sierra Gorda and Sierras de Cabra-Rute-Horconera).
The only expression that produces the recharge ratevalues closest to those previously calculated by conven-tional techniques is the following:
R ¼ A þ P þ 3 � L þ 2 � I þ Sð Þ=0:9 ð4ÞThis is the so-called APLIS index of recharge, where
A = altitude, P = slope, L = lithology, I = infiltration
Table 3 Values of the recharge rate, as a percentage of precipitation, obtained from different approaches
Method aquifer Recharge Weighted linear sum Ideal point analysis Regression analysisAPLIS method Test (1) Test (2) Test (3)
Cabras 33 36.0 48.5 45.6 51.9 33.3 45.6Líbar 55 51.9 59.8 60.2 63.8 40.2 54.2Nieves 55 54.0 54.9 50.2 56.7 38.2 49.9Blanca and Mijas 43 42.9 48.7 44.2 50.6 31.9 42.4Gorda 55 53.1 56.8 51.0 56.5 38.1 49.7Cabra, Rute and Horconera 45 38.7 48.4 43.5 49.0 34.2 44.0Cazorla 30 31.6 46.9 42.3 47.6 32.6 43.0María 33 38.2 50.4 43.4 48.2 34.9 42.8
920
Hydrogeology Journal (2008) 16: 911–925 DOI 10.1007/s10040-008-0274-5

landforms, S = soil type. The weight of each variable inthe above expression is intended to represent its impor-tance in determining the recharge rate, in accordance withthe results obtained from the prior analysis of the variablesthat influence recharge (Durán et al. 2004). Thus, thelithology variable has three times as much influence asthose of altitude, slope and soil type, while the variable“areas of preferential infiltration” is twice as important. Bydividing by 0.9, recharge rates are obtained that rangefrom a minimum of 8.88% to a maximum of 88.8% of therain that falls onto the surface of the aquifer. In otherwords, there is always some degree of recharge, but thisnever reaches 100% of the precipitation. The mean valueof the recharge rate (R) in each aquifer was obtained as themean of the values of R corresponding to each of thespatial units in the recharge map. The mean rate of annualrecharge represented is grouped into five regular intervals,each of which is assigned a recharge class (Table 4)—verylow, low, moderate, high and very high.
The mathematical expression of the APLIS method isthe only one that enables one to obtain recharge rates thatare coherent with those previously determined by conven-tional methods, for all the aquifers. The APLIS index wasspecifically developed in the eight pilot aquifers andconsequently the results are coherent with the referencevalues of recharge. Nevertheless the method has beensuccessfully applied in other independent carbonateaquifers from southern Spain (Marín et al. 2007), westernSpain (IGME, unpublished report, 2005) and easternSpain (Andreo et al. 2007), even in Majorca and Menorcainlands (IGME-GHUMA, unpublished data, 2007).
Therefore, the APLIS method provides a way ofcalculating long-term average recharge. The only way toestimate the time variant calculation of recharge for anaquifer is to apply the recharge rate (a constant) to theannual precipitation, which is a simplification, particularlyin the short term, because the recharge process can beinfluenced by several factors such as the degree ofsaturation of the soil and unsaturated zone or the rainfallintensity. However, the APLIS method permits mappingof the spatial distribution of the autogenic recharge in theaquifers; the allogenic recharge is not considered in thepresent version of the method. Autogenic recharge overthe carbonate rocks includes: direct recharge, localised orconcentrated recharge via swallow holes and even indirectrecharge from the bed of superficial water courses.
Application of the APLIS method to aquifersin southern Spain
Calculation of the recharge rateTable 3 shows the values of the mean rate of annualrecharge, as calculated by the APLIS method, togetherwith the reference values previously determined by con-ventional techniques. In the pilot aquifers, the differencesbetween the values calculated by the APLIS method andthe reference values are never more than 3%, except forthe aquifers of Sierra de María, Sierra de Cabra and Sierrade Rute-Horconera, where the differences reach 5%.
In general, the recharge rate calculated by the APLISmethod is slightly higher than the reference values wherethese are known to be low (such as Sierra de las Cabrasand Sierra de María). On the other hand, in aquifers wherethe known recharge rate is high (as in Sierra de Líbar,Sierra Gorda and Sierra de las Nieves), the valuesobtained with the APLIS method are somewhat lowerthan those previously calculated using conventionaltechniques, although they are always greater than 50%of the precipitation.
Spatial distribution of the rechargeAs well as calculating the recharge rate, the APLISmethod enables us to obtain maps of recharge spatialdistribution (Fig. 3), by the superimposition of the infor-mation layers in a GIS, namely in version 8.2 of ArcGIS.The tools used for this were the intersection of informa-tion layers (the “intersect” command in ArcGIS) and thecreation of homogeneous areas via the elimination offrontiers between polygons with equal rates of recharge(the “dissolve” command in ArcGIS). The recharge ratewas calculated in ArcView 3.2, as this enables quick andeffective management of databases and performance ofcalculations.
In Sierra de las Cabras (Fig. 3), recharge rates arepredominantly low, while those categorised as high arefound at the south of San José del Valle, where thereare zones of preferential infiltration. The surface of theaquifer that has a moderate-type recharge is influenced bythe presence of fissured limestone outcrops where theslope is slight. The area classed as Very Low recharge isvery similar to the high recharge zone, and is characterisedby the presence of materials of low permeability (clays,marls and marly limestones).
In Sierra de Líbar (Fig. 3), there is a predominance ofthe moderate recharge type, but what is most outstandingis the presence of zones of high or very high recharge, dueto the high degree of karstification of the carbonatematerials, which present abundant infiltration forms, ofall types (dolines, poljes, karrenfield). The sectors whererecharge is classed as low and very Low are those wherethere are outcrops of low-permeability materials (marlsand marly limestones) above which soils have developed.
Sierra de las Nieves (Fig. 3) has very similar character-istics to those of Sierra de Líbar; thus, zones of High andVery High recharge can be found over karstified carbonate
Table 4 Recharge rates by the APLIS method
Intervals of recharge values (%) APLIS method Recharge class
≤ 20 Very low(20–40] Low(40–60] Moderate(60–80] High> 80 Very high
The data range expressed as, for example “(20–40]”, means thatvalue of 20 is not included in this class whilst 40 is included
921
Hydrogeology Journal (2008) 16: 911–925 DOI 10.1007/s10040-008-0274-5
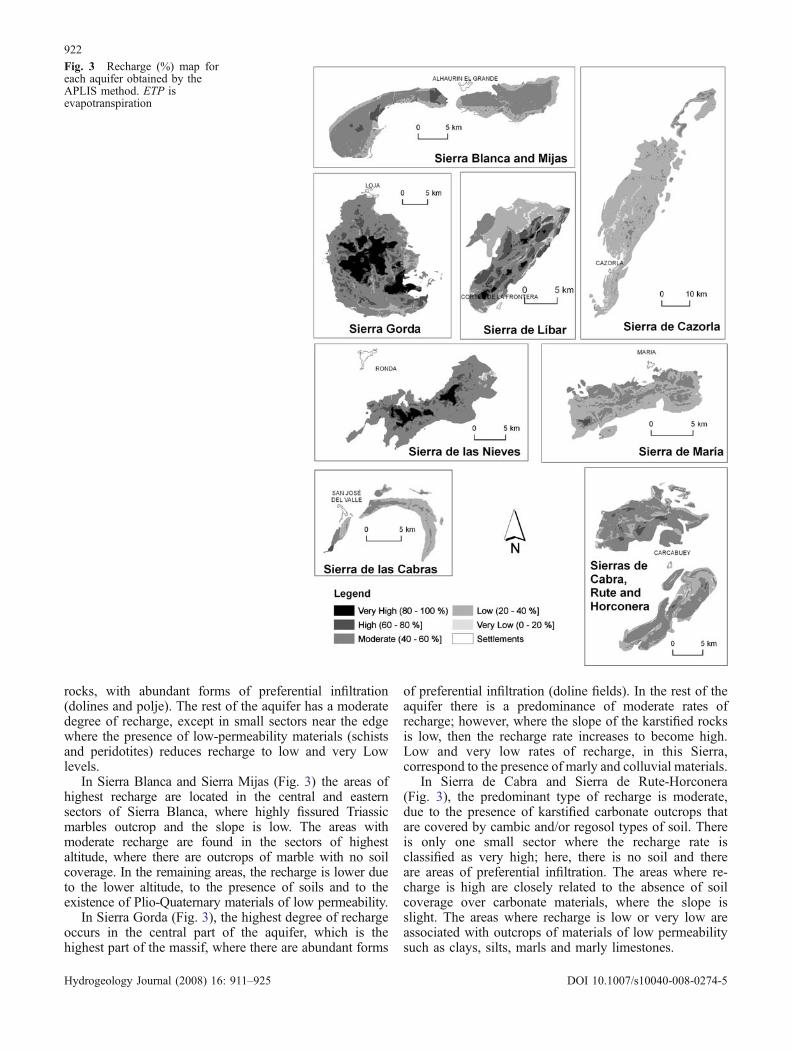
rocks, with abundant forms of preferential infiltration(dolines and polje). The rest of the aquifer has a moderatedegree of recharge, except in small sectors near the edgewhere the presence of low-permeability materials (schistsand peridotites) reduces recharge to low and very Lowlevels.
In Sierra Blanca and Sierra Mijas (Fig. 3) the areas ofhighest recharge are located in the central and easternsectors of Sierra Blanca, where highly fissured Triassicmarbles outcrop and the slope is low. The areas withmoderate recharge are found in the sectors of highestaltitude, where there are outcrops of marble with no soilcoverage. In the remaining areas, the recharge is lower dueto the lower altitude, to the presence of soils and to theexistence of Plio-Quaternary materials of low permeability.
In Sierra Gorda (Fig. 3), the highest degree of rechargeoccurs in the central part of the aquifer, which is thehighest part of the massif, where there are abundant forms
of preferential infiltration (doline fields). In the rest of theaquifer there is a predominance of moderate rates ofrecharge; however, where the slope of the karstified rocksis low, then the recharge rate increases to become high.Low and very low rates of recharge, in this Sierra,correspond to the presence of marly and colluvial materials.
In Sierra de Cabra and Sierra de Rute-Horconera(Fig. 3), the predominant type of recharge is moderate,due to the presence of karstified carbonate outcrops thatare covered by cambic and/or regosol types of soil. Thereis only one small sector where the recharge rate isclassified as very high; here, there is no soil and thereare areas of preferential infiltration. The areas where re-charge is high are closely related to the absence of soilcoverage over carbonate materials, where the slope isslight. The areas where recharge is low or very low areassociated with outcrops of materials of low permeabilitysuch as clays, silts, marls and marly limestones.
Fig. 3 Recharge (%) map foreach aquifer obtained by theAPLIS method. ETP isevapotranspiration
922
Hydrogeology Journal (2008) 16: 911–925 DOI 10.1007/s10040-008-0274-5
Sierra de Cazorla (Fig. 3) is the system that presentsthe lowest rate of recharge, due to the presence of fissureddolomitic rocks; this means that the predominant type ofrecharge is low. The moderate class of recharge is found atrelatively high altitudes, where the slope is slight, withincarbonate outcrops. The very low class is associated withoutcrops of low-permeability marly materials.
In Sierra de María (Fig. 3) recharge is mainly low ormoderate. In the latter areas there are carbonate outcropsthat have no soil coverage and are not greatly karstified;these areas are mainly in the northern part of the Sierra.The areas with high recharge rates are located in thewestern part of the Sierra, where the slope is slight andwhere there may be infiltration through forms of prefer-ential infiltration. There is one small sector where rechargeis classified as very low, and where there are marlylimestones with cambic soils.
To sum up, most of the aquifers examined in this studypresent a mean annual rate of recharge classified asmoderate; the exceptions to this are the aquifers in Sierrade Cazorla, Sierra de las Cabras and Sierra de María,where the predominant recharge type is low. It can also beseen that the highest rates of recharge (those classed asvery high) are only found in aquifers where the mean rateof recharge exceeds 50% and where the highest degree ofkarstification occurs (Sierra de Líbar, Sierra de las Nievesand Sierra Gorda).
Conclusions
Recharge into carbonate aquifers, in the sense of theamount of water (generally, rainfall) that enters themduring a given period of time, can be determined bydiverse methods. Among such approaches is that of thehydrologic balance, in which evapotranspiration is deter-mined by applying empirical formulas such as those ofTurc, Coutagne or Thornthwaite, and recharge is made tocoincide with effective rainfall. Also commonly imple-mented are methods based on the use of natural tracers(isotopic and chemical) or of artificial ones; in this respect,particular note of the chloride balance was taken, which isone of the most widely used methods for estimatingrecharge in carbonate aquifers. Other methods used todetermine recharge are based on the distribution ofprecipitation in time (Kessler’s method), while others arenumerical, by which recharge is considered to be one ofthe calibration parameters of the model. Most suchmethods are mainly intended for use in detrital aquifersand do not take into account the particular hydrogeolog-ical characteristics of carbonate aquifers. They are notalways easy to apply, and neither do they enable one toidentify the spatial distribution of the recharge; moreover,they require information that is not always available, andin these cases, indirect estimations must be made.
The APLIS method proposed here makes it possible toestimate the mean annual recharge within carbonateaquifers, expressed as a percentage of precipitation, froma combination of certain intrinsic variables of such aquifers,
i.e. the altitude, slope, lithology, infiltration landforms andsoil types. The method was developed from studiescarried out in eight carbonate aquifers in southern Spain,representative of a wide range of climatic and geologiccharacteristics.
For each aquifer, a map or information layer was createdfor each one of the above variables, using, basically, thefollowing computational tools: Autocad 14, ArcGIS 8.2and ArcView 3.2. All the information layers were storedin a geographic information system, which enabled theselayers to be superimposed and thus obtain the meanrecharge rate for the whole of the aquifer, and also a mapof the spatial distribution of this recharge. Equation (4) isused in the APLIS method to estimate the recharge rate:
The recharge values obtained by this method, for theeight aquifers, are similar to those calculated previouslyby other methods, in which the recharge rate obtained wascompared with the measured discharge. The method hasbeen successfully applied in other Spanish aquifers and atinternational level. Thus, the validity of the proposedmethod is corroborated. The differences between the refer-ence values (those calculated previously) and thoseobtained by the APLIS method do not exceed 5%. Inaquifers where the recharge rate is low, the APLIS methodproduces values that are slightly higher than the referenceones, while in aquifers where recharge is greater, theAPLIS method leads to values that are somewhat lowerthan the reference ones. In other words, the proposedmethod reveals a slight tendency to understate the regionalvariations between recharge rates.
Unlike other methods used for estimating recharge, theAPLIS method makes it possible to establish the spatialdistribution of the recharge rate within aquifers, accordingto their particular characteristics. This aspect is funda-mental for the appropriate management and protection ofgroundwater, both as concerns quantity and quality. TheAPLIS method is a tool that has been designed for usewith databases that are readily available from variouspublic authorities.
Acknowledgements This report was produced in the framework ofthe Associate Unit “Advanced Hydrogeologic Studies” between theHydrogeology and Groundwater Directorate of IGME and theHydrogeology Group at the University of Málaga. It is a contri-bution to projects CGL 2005-05427 of DGICYT, IGCP-513 ofUNESCO and P06-RNM 2161 of the Junta de Andalucía and toGroups RNM 308 and HUM 778 of Junta de Andalucía. Thecomments of two anonymous reviewers and editorial revision fromSue Duncan have improved the original version of this article.
References
Allison GB, Stone WJ, Hughes MW (1985) Recharge in karst anddune elements of a semi-arid landscape as indicated by naturalisotopes and chlorides. J Hydrol 76:1–25
Andreo B (1997) Hydrogeology of carbonate aquifers in the SierrasBlanca and Mijas (Betic Cordillera, southern Spain) (inSpanish), Servicio de Publicaciones de la Universidad deMálaga, Spain, 489 pp
923
Hydrogeology Journal (2008) 16: 911–925 DOI 10.1007/s10040-008-0274-5

Andreo B, Carrasco F, Durán JJ, Fernández del Río G, Linares L,López-Geta JA, Mayorga R, Vadillo I (2000) Hydrogeologicalinvestigations for groundwater exploitation in the Sierras Blancaand Mijas (Málaga, southern Spain). Hydrogéologie 3:19–33
Andreo B, Vías J, López-Geta JA, Carrasco F, Durán JJ, Jiménez P(2004a) Methodological proposal for estimating recharge incarbonate aquifers (in Spanish). Bol Geol Miner 115(2):177–186
Andreo B, Durán JJ, Vías JM, López Geta JA, Carrasco F, JiménezP (2004b) Methods for estimating recharge in carbonateaquifers: implementation in aquifers in the Betic Cordillera.In: Andreo B, Durán JJ (eds) Investigations in Spanish karstsystems (in Spanish). pp 185–203
Andreo B, Vías JM, Mejías M, Ballesteros BJ, Marín AI (2007)Estimation of the recharge by APLIS method in the Jurassicaquifer of El Maestrazgo (Castellón, NE Spain). II InternationalSymposium on Coastal Aquifers, Almería, Spain, October 2007
Anuraga TS, Ruiz L, Mohan Kumar MS, Sekhar M, Leijnse A (2006)Estimating groundwater recharge using land use and soil data: acase study in South India. Agric Water Manage 84(1–2):65–76
Birkle P, Torres Rodríguez V, González Partida E (1998) The waterbalance for the basin of the valley of Mexico and implicationsfor future water consumption. Hydrogeol J 6(4):500–517
Blavoux B, Mudry J, Puig JM (1992) Budget, functioning andprotection of Fontaine de Vaucluse system (south-east France)(in French). Geodinamica Acta 5(3):153–172
Bouamama M, López Chicano M, Pulido Bosch A (1996) Seasonalhydrogeochemical behaviour pattern of the principal karsticsprings in the southern part of Córdoba province (Natural Park ofSub-Betic Sierras) (in Spanish). IV Simposio del Agua enAndalucía, vol 2, Almería, Spain, December 1996, pp 37–47
Brito MG, Costa CN, Almeida JA, Vendas D, Verdial P.H (2006)Characterization of maximum infiltration areas using GIS tools.Eng Geol 85(1–2):14–18
Civita M, De Maio M (2001) Average groundwater recharge incarbonate aquifers: a GIS processed numerical model. 7thConference on Limestone Hydrology and Fissured Media,Besançon, France, September 2001, pp 93–100
Coutagne A (1954) Study of some regional hydrometereologicalcorrelations and their algebraic interpretation (in French).
Custodio E, Llamas MR, Samper J (eds) (1997) Evaluating rechargein aquifers, under hydrologic planning. IAH Spanish Chapterand ITGE, Madrid
DGOH (1998) The hydrogeologic units in Sierra de Líbar and Sierade Grazalema (in Spanish). Secretaría de Estado de Aguas yCostas, Ministerio de Medio Ambiente, Madrid, 52 pp
Dillon R, Goldstein M (1984) Multivariate analyses: methods andapplications. Wiley, New York
Doerfliger N, Jeannin PY, Zwahlen F (1999) Water vulnerabilityassessment in karst environments: a new method of definingprotection areas using a multi-attribute approach and GIS tools(EPIK method). Environ Geol 39(2):165–176
Dunteman, GH (1989) Principal components analysis. Sage, ThousandOaks, CA, USA
Durán JJ, Andreo B, Vías J, López-Geta JA, Carrasco F, Jiménez P(2004) Classification of carbonate aquifers in the Betic Cordillerain accordance with recharge rates (in Spanish). Bol Geol Miner115(2):199–210
Fayer MJ, Gee GW, Rockhold ML, Freshley MD, Walters TB(1996) Estimating recharge rates for a groundwater model usingGIS. J Environ Qual 25:510–518
Flint AL, Flint LE, Kwicklis EM, Fabryka-Martin JT, BodvarssonGS (2002) Estimating recharge at Yucca Mountain, Nevada,USA: comparison of methods. Hydrogeol J 10(1):180–204
Goldscheider N (2005) Karst groundwater vulnerability mapping:application of a new method in the Swabian Alb, Germany.Hydrogeol J 13:555–564
Heathcote JA, Lewis RT, Soley RWN (2004) Rainfall routing torunoff and recharge for regional groundwater resource models.Q J Eng Geol Hydrogeol 37(2):113–130
Hughes AG,Mansour MM, Robins NS, Peach DW (2006) Numericalmodelling of runoff recharge in a catchment in the West Bank. InMODFLOW and More: Managing Ground-Water Sytsems,
Conference Proceedings, vol 1, Colorado School of Mines,Golden, CO, May 2006, pp 385–389
ITGE (1998) Hydrogeologic Atlas of Andalusia (in Spanish).Instituto Tecnológico y Geominero de España, Madrid, 216 pp
Jiménez P, Andreo B, Durán JJ, Carrasco F, López-Geta JA, VadilloI, Vázquez M (2001) Hydrodynamic study of the spring at ElTempul (Sierra de las Cabras, Cádiz, southern Spain) (inSpanish). Bol Geol Miner 2:85–101
Jocson JMU, Jenson JW, Contractor DN (2002) Recharge andaquifer response: northern Guam Lens Aquifer, Guam MarianaIslands. J Hydrol 260:231–254
Kessler H (1967) Water balance investigations in the karst regionsof Hungary. Act Coll Dubrovnik, AIHS-UNESCO, Paris
Leaney FW, Herczeg AL (1995) Regional recharge to a karstaquifer estimated from chemical and isotopic composition ofdiffuse and localised recharge. J Hydrol 164:363–387
Lerner DN, Issar AS, Simmers I (1990) Groundwater recharge: aguide to understanding and estimating natural recharge. Inter-national Contributions to Hydrogeology 8. Heise, Hannover
Liñán C (2003) The hydrogeology of carbonate aquifers in theYunquera-Nieves Unit (province of Málaga). PhD Thesis,University of Granada, 317 pp
López-Chicano M (1992) Contribution to understanding thekarstic hydrogeologic system of Sierra Gorda (provinces ofGranada and Málaga) (in Spanish). PhD Thesis, University ofGranada, Spain
Manzano M, Cardoso G, Tore C., Custodio E (1997) Application ofthe BALAN Programme in order to determine recharge inAnoia (province of Barcelona) and in Sierra de la Tramuntana(Majorca). In: Custodio E, Llamas MR, Samper J (eds) Aquiferrecharge in hydrological planning (in Spanish). IAH-GE eITGE, Madrid, pp 339–346
Marín A, Andreo B, Rielp D, Vias JM, Mudarra M (2007) Usingthe APLIS method to determine the spatial distribution of therecharge rate in the Alta Cadena karst aquifer (southern Spain).XXXV IAH Congress, Lisbon, September 2007
Moreno CI, Pulido Bosch A, Fernández Rubio R (1983) Thehydrogeology of Sierra de María and Sierra Maimón (provinceof Almería) (in Spanish). Bol Geol Miner 44:321–338
Murphy EM, Ginn TR, Phillips JL (1996) Geochemical estimates ofpalaeorecharge in the Pasco Basin: evolution of the chloridemass balance technique. Water Resour Res 32(9):2853–2868
Nolan BT, Healy RV, Taber PE, Perkins K, Hitt KJ, Wolock DM(2006) Factors influencing ground-water recharge in the easternUnited States. J Hydrol 332(1–2):187–205. DOI 10.1016/j.hydrol.2006.06.029
Rangarajan R, Athavale RN (2000) Annual replenishable ground-water potential of India: an estimate based on injected tritiumstudies. J Hydrol 234:38–53
Rielp D (2006) Potential of digital orthophotos and automaticclassification approaches for detailed karstmorphological map-ping in Mediterranean carbonate mountain ranges: a pilot studyin Andalusia, Spain. Diploma Thesis, Karlsruhe University,Germany, 135 pp
Rubio-Campos JC, González Ramón A, Pozo Gómez M, LupianiMoreno E, Luque Espinar JA, Gollonet J (2001) New data onthe hydrogeology of the sub-unit of Beas de Segura (inSpanish). Unit 05.01 Sierra de Cazorla. V Simposio sobre elAgua en Andalucía, Almería, Spain 2:187–195
Samper J (1997) Evaluation of recharge, using numeric models ofaquifer flow. In: Custodio E, Llamas MR, Samper J (eds)Aquifer recharge in hydrological planning (in Spansish). IAH-GE e ITGE, Madrid, pp 153–180
Samper J (1998) Evaluation of recharge from rainfall using waterbalances: utilization, calibration and uncertainties (in Spanish).Bol Geol Miner 109:347–370
Samper J, García Vera JL (1992) BALAN v.10: Program forcalculating water balances and salt balances in the soil (inSpanish). Departamento de Ingeniería del Terreno. UniversidadPolitécnica de Cataluña
Sanford W (2002) Recharge and groundwater models: an overview.Hydrogeol J 10(1):110–120
924
Hydrogeology Journal (2008) 16: 911–925 DOI 10.1007/s10040-008-0274-5

Scanlon BR, Healy RW, Cook PG (2002) Choosing appropriatetechniques for quantifying groundwater recharge. Hydrogeol J10:18–39
Schoeller H (1962) Groundwaters (in French). Masson, ParisSharma ML (Ed) (1990) Groundwater Recharge. Balkema, Rotter-
dam, The NetherlandsSophocleous M (1992) Groundwater recharge estimation and
regionalization: The Great Bend Prairie of central Kansas andits recharge statistics. J Hydrol 137:113–140
Sukhija BS, Nagabhushanam P, Reddy DV (1996) Groundwaterrecharge in semi-arid regions of India: an overview of resultsobtained using tracers. Hydrogeol J 4(3):50–71
Thornthwaite CW (1948) An approach towards a rational classifi-cation of climate. Geogr Rev 38:55–94
Turc L (1954) The soil balance: relations between rainfall, evaporationand flow (in French). Geogr Rev 38:36–44
Vías JM, Andreo B, Perles MJ, Carrasco F, Vadillo I, Jiménez P(2006) Proposed method for groundwater vulnerability map-ping in carbonate (karstic) aquifers: the COP method: applica-tion in two pilot sites in southern Spain. Hydrogeol J 14(6):912–925
Wood WW, Sanford WE (1995) Chemical and isotopic methods forquantifying groundwater recharge in a regional, semiaridenvironment. Ground Water 33:458–468
Zagana E, Kuells Ch, Udluft P, Constantinou C (2007) Methodsof groundwater recharge estimation in eastern Mediterranean:a water balance model application in Greece, Cyprus andJordan. Hydrol Process 21(18):2405–2414
925
Hydrogeology Journal (2008) 16: 911–925 DOI 10.1007/s10040-008-0274-5