Embed Size (px)
Citation preview

METHODOLOGICAL ADVANCES I N T H E VALIDATIOK OF IKVENTORY ITEMS, SCALES, PROFILES AND INTERPRETATIONS
FREDERICK C. THORNE
Brandon, Vermont
Factor analytic research is still in its infancy-theoret ically, methodologically, and interpretively. Definitive research has not yet been done on problems of (a) item design and selection of items suitable for factor analysis; (b) identifi- cation of highly significant marker items; (c) tracings of item response distri- butions across scales, populations, occasions and other relevant variables; (d) determination of the number of items with different loadings necessary to ob- tain valid scale scores for psychological state measurements; (e) questions about the validity of summating factorially heterogeneous lowly correlated items in arriving at scale scores; ( f ) the use of clinical judgment to evaluate the possibly differing significances of the same item responses across populations and occasions; i.e., does the same factored item response have the same signif- icance across scales?; (g) how to interpret scales with factorially mixed item compositions; (h) clinical judgment decisions in evaluating and interpreting scale meanings; and (i) the comparison of the results of analyzing data by different scaling methods. This study makes a start toward clarifying these methodological issues by analyzing the results of applying different methods of scale construction that utilized 146,000 item responses made by 730 Ss on the Personal Health Survey, a 200-item inventory designed to measure organ system functioning that contributes to physical and mental health.
This paper reports on a series of methodological refinements used in developing a systematic rationale for the construction, standardization and interpretation of the Personal Health Survey (PHS), a 200-item questionnaire designed to screen pathological functioning in the psychophysiological support systems that underlie physical and mental health. The I’HS is one of the subtests of the Integration Level Test Series (ILTS), which measures an hierarchy of levels of factors that organize integration. The PHS was chosen as the subject for this methodological investigation because medical science has evolved a large mass of factual information that con- cerns organic and functional disease and/or disorder, tvhich can be utilized for clinical validation of PHS results. Clinical medicine has differentiated between specific and nonspecific symptoms and signs. Specific symptoms and signs relate to primary etiological factors that dircctly cause a disease or disorder. I’athognomonic symptoms and signs are specifically indicative of a disease or disorder. Nonspecific symptoms and signs include a large number of secondary physical and psychological reactions that can occur in many conditions and havc little or no localizing signif- icance. Ideally, an inventory should consist of pathognomonic items specifically indicative of primary etiological factors.
Historically, the earliest widely used inventories, such as the Woodworth (1918) Personal Data Sheet, the Bernreuter Personality Inventory (Bernreuter, 1935), the Bell Adjustment Inventory (Bell, 1938), and the Minnesota Multiphasic Inventory (Hathaway & McKinley, 1961), consisted largely of symptoni checklists and empirical items that utilized cut-off scores and profiles to measure deductively postulated psychological traits and personality structures. Although these early empirical inventories appeared to have some face or construct validity, their fac- torial composition was unknown, and they had little predictive validity. They mere supcrscded by inventories such as the Guilford-Zimmerman Temperament Survey (Guilford & Zimmerman, 1949) and the Cattell 16I’F Qucstionnairc (Cattell, Saunders, & Stice, 1950), which utilized factor analyzed items and scales. However, in spite of more sophisticated statistical techniques, there still remained niang questions about test design and interpretations.
Thorne (1967) proposed a system of integrative psychology that postulates that all raw behaviors occur only in the form of changing psychological states, so that thc primary purpose of so-called personality inventories is to measure clinically significant psychological states. Thus, instead of preoccupation with hypothetical
283

Methodological Advances 284
traits and personality structures, a more valid approach is to study the psycho- logical states that underlie critical behavior episodes. This is what the Integration Level Test Series (Thorne, 1965) attempts to measure, namely the different hier- archical levels of factors that organize clinically significant integrations. This re- quires the construction of items and scales that measure changing mental status with new methods of test design, construction and interpretation.
This methodological study investigated the behavior of 146,000 inventory item responses derived from the 200 items of the Personal Health Survey (PHS) given by 730 Ss composed of five subgroups of greatly differing demographic char- acteristics. Most early factorial studies placed too much weight on intuitive-deduc- tive interpretation of items and scales while they paid little or no attention to methodological statistical issues. There are many questionable assumptions with regard to scale construction, scoring and interpretation that might be clarified by operational studies of item characteristics that traced the contributions of items to scales.
GRAND RESEARCH DESIGN FOR THE STUDY OF PSYCHOLOGICAL STATES Thorne (1976a) outlined a grand research design for validating his system of
integrative psychology. Thorne (1961a, 1967) utilized the Integration Level Test Series (Thorne, 1965) to measure objectively eight domains of psychological states hitherto not intensively investigated or related to each other. Thorne (1976b) also outlined a new system of psychopathology based on the clinical implications of psychological state integrative disorders.
Given the whole bundle of Integration Level Test Series studies as a coordinated series of methodological investigations of the various domains of psychological state measurements as a whole, it was a tremendous task to analyze and interpret over 600,000 individual test item responses from nine diverse population samples ( N = 2713) used by us in standardizing the eight ILTS subtests, which involve a total of 1600 single test items. In addition, cooperative researchers supplied us with many other samples of data that have not been reported here because their results tended to replicate what already was established.
Needless to state, the factor analytic data from studies of all the eight ILTS subtests on the nine populations provided a tremendous amount of data and results, which had to be analyzed meaningfully. Interpretive problems were complicated by the fact that in the whole series of subtest studies, no two groups ever showed the same factorial structure because there was great heterogeneity of item repre- sentation across the factored scales from various groups, and by the fact that subgroup factorial patterns rarely agreed with overall factorial characteristics.
There were large group differences between factor item composition, different patterns of factor emergence between the samples, different representations of items and item loadings across groups and the appearance of unique factors in special groups. In addition, the factorial patterns had to be related to base rate percents of responding in different subgroups, and the results of constructing scales by different methods had to be compared and rationalized. Item responses limited t o one group had to be analyzed and compared, as well as clinically important items that operated apparently as one-item factors.
Perhaps most important, the statistical mass of factorial data had to be related to basic science clinical knowledge to understand their meanings. Also, i t soon became apparent that the statistical findings could not be interpreted alone, but instead required expert inductive clinical judgments as to their meanings. Pilot studies indicated that, interpretively at least, the different items and factorial patterns were acting almost as projective stimuli in that they are interpretable from many different theoretical viewpoints, and the judgments of the different clinicians obviously express their theoretical biases. So, rather than define factors in terms of subjective, intuitive clinical judgments, it became necessary to define factors by operationally citing the highest loaded items and allowing the readers to make their own judgments.

A!lethodological Advances 285
The PHS data were selected for this methodological investigation for two rcasons. First, much more factual information was available from the fields of clinical medicine, clinical psychology, and clinical psychiatry concerning psycho- physiological and organic etiology and patterns of disorder that underlie physical and mental health which could bc used to evaluate the results than with the other ILTS test domains. Second, sufficient data had by now accumulated from all the eight lLTS subtests to provide an overview of the patterns of results obtainable across many domains by use of these measurement methods. This methodological paper could not have been written in 1965 when the lLTS was first devised because the issues raised and the refinements suggested required more than 10 years of work to develop.
RESEARCH DESIGN RATIONALE Based on the assumption that inventory responses and scores reflect the
mental status of the testee a t the time he took the test, the basic methods of this study consisted of thc following stcps:
A pool of obvious-direct inventory items were collected that pur- ported to measure the primary and secondary symptoms and signs of normal and abnormal functionings of the major organ systems. From this pool, an expcrt clinician selected 200 items judged to be most typical of normal and pathological functioning to form the Personal Health Survey (PHS). Twelve cmpirical scales consisting of from 10 to 20 items were constructed purportedly dealing \+ith general health, general development, gastrointestinal system, cardiovascular system, central nervous system, neuromuscular system, mis- cellaneous systems, anxiety-fear states, anger-frustration states, schizophreni- city, affective psychoses and character disorders. These constitute what will bc referred to as “empirical scales.”
The PHS was factor analyzed with a principal components method with varimax rotation producing orthogonal factors on an overall population of 730 Ss and on each of five subgroups of imprisoned felons, hospitalized alcoholics, unmarried mothers, collegc students and “schizophrenics” institu- tionalized in a state hospital.
Marker items were identified by tabulating those items that appeared in the overall and subgroup factor analyses x i th high loadings. The distribution of these marker items was traced across populations and occasions. Obtained factors were defined in terms of their marker item composition, modified by clinical judgments that concerned internally consistent meanings.
The validity of the empirical scales was investigated by comparing their item composition with that of factor analyzed scales. This is acconiplished by constructing scatter diagrams with empiric scales/items on the Y axis and factored scales/items on the X axis. These diagrams were inspected to discover the incidence of items across scales and the clustering of items.
Tracing the appearance of all the 200 items across the overall popu- lation and subgroup populations to discover base rate percents of item re- sponses and their factor loadings. Items that did not appear on any factored scale or on only one factored scale were tabulated.
The data were inspected to discover the order of appearance and per- cents of variance explained by each factor, and differences in the size of loadings of identical items across factors.
Factored scales were constructed by different methods based on (a) base rates of item responding; (b) size of item loadings, particularly utilizing highest loaded items from scales across groups; (c) single items appearing only in one subgroup factor; and (d) constructing special factored scales for each
1.
2 .
3.
4.
5.
6.
7.

286 Journal of Clinical Psychology, Apr i l , 1978, Vol. 34, N o . 2.
new population studied to be compared 11 ith overall population factored scales. The results from different methods of scale construction were compared to determine the most valid measures.
Statistical factors were defined and named in operational terms by citing the most highly loaded items themselves instead of projecting deductive interpretations based on preconceived theories.
Clinical judgment nas utilized to validate statistical findings and to resolve apparent inconsistencies in the factorial data.
The results of various methods of item selection and scale construction I\ ere assessed to interpret \\hat has been measured clinically.
Inductive methods were utilized to formulate psychodynamic theo- ries that explicated individual subgroup findings on the assumption that overall population findings do not necessarily predict subgroup findings.
Specific and/or pathognomonic itcms were identified for scale con- struction and diagnostic purposes.
In our factor analytic studies, onlj the five main factors extracted from each population on each of the eight ILTS subtests are reported, primarily because most of the variance was contained in thc five main factors. In each factored scale across all the subtests only the 20 highest loaded items are reported, most items ni th loadings over .40. In the operational studies of item distributions across scales and factors from overall and subgroup populations, only the single highest loaded items, or the 5 highest loaded, or the 10 highest loaded items are investigated in order to discover the added increments of information contributed by longer scales.
Because the purpose of the I’HS subtest is to measure subjective complaints about pathological states or conditions of organ SJ stem functioning, and because subgroup S may be considered the only subgroup that involves a relatively representative population, the main comparisons will be made between subgroup 8 and the other four subgroups rombincd because they are considered to be non- psychotic and within the range of psychiatric normality even though they involve a \vide range of integration patterns, home of nhich are maladaptive enough to result in institutionalization. Acrois all of our ILTS studies, the factored scales have represented only small percents of the variance and therefore the factors are considered to be genuine and valid independent of any interpretations assigned thereto.
8.
9.
10.
11.
12.
VALIDITY AND RELIABILITY OF ITEJI RESPOSSES The most direct nirthod of preliniinary validation of the meaningfulness of
item responses is simply t o interrogate the S as to nhy a particular T or F response was made to individual itenis which seem to be potentially significant or inconsis- tent. The response is considered valid if it appears clinically logical and significant. The posttest interrogation method is discussed in Thorne (1975). Social desirability, acquiescence and other sets can be detected quickly. Nore ideally, groups with knou-n psychological attributes can be tested with the PHS to discover whether the test actually is measuring such linown attributes.
This study started out by rejecting all deductive interpretations that concerned the dynamics and meanings of item responses. The attempt to apply preconceived theories deductively is regarded as more reflective of clinician biases that are being applied projectively than of any valid relationships.
Instead, items and scales are defined operationally. Factors are defined by citing the constituent items in order of size of factor loadings. Factors are listed in order of appearance and magnitude of percents of variance explained. Inductive methods based on item characteristics and distributions are used to forinulate interpretations and meanings.

Methodological Advances 287
It early became apparent in working with lLTS subtest research data that it was basically necessary to decide whether the patterns of the data reflected trait or state etiological factors. Thorne (1961, 1967) earlier had postulated that psychol- ogical trait and personality structure were merely theoretical abstractions that were invalid or irrelevant predictively and did not truly reflect the reality of the data. Instead, Thorne postulated that raw behaviors occur only in the form of psychological states, which must be dealt with as such.
If the researcher adopts the trait-structure viewpoint, then he looks for con- stancies, regards variability as error variance, and makes predictions on the basis of trait or structure theory (which usually turn out to be invalid).
If the researcher adopts psychological state theory, then he expects to find constant change, regards variance as reflecting genuine moment-to-moment changes in integrative patterns, and does not attempt to predict one-of-a-kind events except when psychological state patterns can be demonstrated to be constant enough so that their central tendencies may be treated as traits. In the whole bundle of ILTS research studies, no factorial results suggestive of traits have appeared. Instead, the heterogeneity of item representation across scales, groups, and occasions supports state theory.
It is sometimes taken for granted that when a scale has been factored, the meaning of the items should be self-evident. This has not been the case in our lLTS research. Few if any factors, particularly across groups, have been self-evident in meaning. RIixed factored scales have been the rule; these might be given different interpretations according to which cluster of items was given the most emphasis.
Actually, i t required clinical judgment with the ILTS to differentiate primary syndromes that defined the nature of the condition from secondary personality reactions such as affective instability, autonomic lability, psychosomatic symptoms, and miscellaneous symptoms that kept turning up regularly and were considered as nonspecific and nonlocalizing diagnostically.
In addition to differentiating the factor itenis and clinical judgments as to their specificity, it was necessary also to consider factor loadings of each item, percents of base rates responding, and construct validity in terms of soine d3nainic theory. These problems are dealt with in succeeding sections. Ultimately, i t will take large-scale replication studies across many relevant populations to determine predictive validity. Factorial formulations must be consistent with other infor- mation empirically derived from special populations.
MARKER ITEM VALIDATION AND TEST APPLICATIONS RIarker items are used to trace the incidence of a measurement variable across
tests and groups, i.e., identical items are placed in different tests of scales to deter- mine the homogeneity of factors that are being measured.
Theoretically, it should be possible to construct tests that consist only of identified marker items, so the question arises as to n hat constitutes a marker item. It is obvious that items that clinically never appear on any factored scale of any overall population or subgroup populations probably are not measuring any- thing of clinical significance. The only exception might be single pathognomonic items of rare conditions that do not appear frequently enough to appear factorially so that clinical judgment is required to retain such an item in spite of low incidence of positive responding. It is also obvious that any item should have differentiating significance because items that have wide distribution across populations and factored scales, but do not differentiate among groups, only refer to general charac- teristics of humanness. It appears, then, that ideally a marker item should be a specific or pathognomonic indicator of clinically important conditions with rates of positive responding comparable to population base rates of the condition and with high differentiating power among clinical groups.
In the construction of the Integration Level Test Series subtests, an attempt first was made to construct empirical scales that consisted of items judged clinically

288 Journal of ClCnical Psychology, A p r i l , 1978, Vol. 34, No. 2.
significant by an expert judge from which hopefully some specific or pathognomonic items could be identified statistically. This method makes the assumption that there are valid clinical syndromes, such as organic psychosis, that present specific symptom patterns that theoretically can be objectified and measured. Although the ILTS subtests were constructed on the basis of hypotheses derived from integrative psychology (Thorne, 1967), no preconceived assumptions were made about what diseases, disorders, reactions or syndromes would be uncovered. It was only after items had been traced across populations and scales, and after the data from several different types of scales had been compared, that final decisions were made as to what constituted the best marker items for overall and subgroup scales. Evidence relevant to the eventual selection of marker items is presented in succeeding sections and will not be repeated here.
DISTRIBUTIONS OF ITEMS IN FACTORED SCALES The factor analytic results from the pooled populations of 730 8s will be
presented under the label of overall factors. The subgroups were labeled Code Group 2 = 74 incarcerated felons, Group 3 = 47 hospitalized alcoholics, Group 6 = 172 unmarried mothers, Group 7 = 51 college students, and Group 8 = 386 hos- pitalized “schizophrenics.” In most of the analyses, the Group 8 schizophrenics will be compared with the other nonpsychotic groups.
An analysis was made of the distribution of the 200 original items across the 3 overall scales and the 25 subgroup scales (5 scales for each subgroup) with the following results :
Of the 200 PHS items, only 94 appeared in the overall factored scales (Pishkin & Thorne, 1978) because only five main factors that consisted of the 20 highest loaded items were tabulated. Seven of the 94 items appeared on t,wo overall scales.
T o analyze the representation of each item that appeared in the factored scales across the 25 subgroup factors scales, one item ( # 119) appeared in 8 subgroup factors; one item ( # 147) appeared in 7 subgroup factors; 6 items ( # 12, 49, 87, 109, 179, 200) appeared in 6 subgroup factors; 12 items ( # 13, 16, 19, 23, 54, 76, 95, 159, 174, 178, 195, 196) appeared in 3 subgroup factors; 10 items (#34, 53, 73, 78, 117, 137, 157, 161, 165, 198) appeared in 4 subgroup factors; 30 items (#4 , 6, 9, 10, 18, 28, 33, 47, 56, 57, 59, 66, 67, 79, 86, 96, 106, 110, 118, 123, 130, 134, 142, 146, 158, 167, 170, 175, 182, 199) appeared in 3 subgroup factors; 18 items ( # a , 29, 57, 58, 80, 88, 89, 100, 101, 104, 120, 132, 150, 160, 164, 180, 191, 192) appeared in 2 subgroup factors; 12 items (#5,8, 20, 46, 64, 74, 112, 126, 135, 140, 162, 184) appeared in only 1 subgroup factor; and items #7, 30, 92 and 190 from the factored scales did not appear in any subgroup scale with loadings high enough to be included.
The items listed above with the highest and lowest incidence of appearance in the subgroup factors were inspected, and all were judged clinically nonspecific. AS would be expected, items that appeared across 3 or more subgroup factors tended to be more clinically significant.
Of the remaining items that did not appear in any overall factored scale, 93 items appeared only in subgroup factors as follows:
One item (#64) appeared in 6 subgroup factors. Four items ( # 133, 136, 149, 156) appeared in 5 subgroup factors. Ten items (#27, 65, 85, 90, 108, 121, 168, 169, 188, 193) appeared in 4
Fifteen items (#23, 41, 43, 69, 70, 77, 103, 115, 116, 125, 139, 152, 153, subgroup factors.
173, 181) appeared in 3 subgroup factors.

Methodological Advances 289
Thirty-two items (#14, 15, 17, 25, 26, 32, 36, 50, 55, 62, 63, 84, 91, 97, 99, 102, 105, 107, 122, 124, 127, 129, 131, 145, 151, 163, 166, 170, 183, 186, 194, 197) appeared in 2 subgroup factors.
Thirty-one items (#1 , 3, 24, 31, 35, 37, 45, 60, 61, 68, 71, 72, 75, 83, 93, 94, 98, 111, 113, 128, 138, 141, 143, 148, 154, 155, 171, 177, 185, 187, 189) appeared in only 1 subgroup factor.
These findings indicate wide variability in the generality of items across groups and factors. Ninety-four overall items appear in subgroup factors, but in addition 93 non-overall items also appear in subgroup factors. This indicates that overall population characteristics do not always apply to subgroups that may show indivi- dual response patterns. The conclusion is that subgroups should be factored sepa- rately to discover how they compare with general population characteristics.
Thirteen items ( # 11, 21, 38, 39, 40, 42, 48, 52, 81, 82, 114, 144, 176) did not appear in any overall or subgroup factor. Five of these items refer to growth char- acteristics for which no statistical factors turned up in our results, and the other items refer to potentially significant symptoms. The finding that large numbers of items considered clinically significant on empiric grounds did not appear on any overall factors or subgroup factors indicates the importance of doing more diag- nostically than just getting overall population factor scores. Important clinical data will be overlooked unless the individual test protocols are inspected for addi- tional clues.
OPERATIONAL ANALYSES OF ITEM CONTRIBUTIONS TO SCALES AND FACTORS Several types of statistical analyses were devised to discover exactly what
each of the 200 PHS items contributes to scales and factors across overall popula- tions and subgroups.
1. Comparison of item composition of empirical and factored scales. A scatter diagram was constructed with each of the 200 items on the Y axis and the numbers of the overall and subgroup factors on the X axis. This made possible identification of the appearance of any of the 200 empirical items in any of the overall or subgroup factored scales. A second scatter diagram was constructed with the numbers of the items that appear in the 12 empirical scales on the Y axis and the numbers of the items in each of the factored scales on the X axis. This permitted inspection of the diagrams to discover how closely the factored scale items duplicated the empirical scale items. The results of these analyses are presented in Thorne (1978) and indi- cated that (a) a very variable representation of each of the 200 empirical items occurred across factored scales, and (b) in no case did all the items of the 12 empirical scales appear on any factored scale. Nothing that resembled traits or personality structures emerged.
2. Comparison of factored scale item contributions across overall population and subgroups. To test the representation of overall factored scale items across subgroup factors and scales, a scatter diagram was constructed with the overall factored scale items on the Y axis and the subgroup factored items on the X axis. This traces the distribution of factored scale items across groups to get some idea of the com- parability of factors and scales across groups.
In a research design that extracted five main factors from each of five subgroups (25 factors) with each factor consisting of the 20 highest loaded items (500 items) for comparison with the 100 factored (20 items from each of five overall factors) items from overall scales I - V, a total of 291 items out of a possible 500 items from the overall factors appeared in the subgroup factors. The mean number of overall items represented in each subgroup factor was 1.78 items, range 0 - 8 items. The range of 0 - 8 is explained by the fact that a few overaII items were represented on more than one factor of a subgroup. These findings indicate that slightly less

290 Journal of Clinical Psychology, April , 1978, Vol. 34, No. 2.
than 60% of the overall factor items were distributed irregularly across subgroup factors.
For example, out of a possible 100 opportunities to appear (5 scales of 20 items each) in a subgroup factoring, the 20 highest loaded items of overall factor I contributed 14 items to the five subgroup 2 factors, 8 items to subgroup 3 factors, 12 items to subgroup 6 factors, 8 items to subgroup 7 factors, and 8 items to sub- group 8 factors. This means that no constant patterns that suggested traits or personality structures emerged. Instead, the small mean contribution of overall factor items to subgroup factors, the large ranges, and the irregular distribution across subgroup factors indicate high variability and change, which supports the premise that changing psychological states are being measured. These findings indicate that the overall factors and items provide only a generalized characteri- zation of total populations and that subgroup factor patterns may vary greatly from the overall patterns.
In order to investigate the contribution of PHS items that did not appear in the five overall factors (non-overall items), it was found that 44 non-overall items appeared in subgroup 2 scales, 34 appeared on subgroup 3 scales, 39 appeared on group 6 scales, 36 on group 7 scales, and 51 appeared on group 8 scales. These findings indicate that factors and items derived from overall (pooled) populations do not necessarily apply to subgroup populations and that much potential infor- mation is lost when non-loaded items are not included in scales more suitable for subpopulations.
3. Studies of item clustering. Although statistical methods of factor and cluster analyses presumably provide more refined methods of studying item cluster patterns, scatter diagrams with, say, the highest loaded 5 or 10 overall factor items on the Y axis and the items of the five factors of the five subgroups in the X axis can be inspected to provide a graphic representation of item clustering. The data cited in a previous section on the distribution of items across factored scales, together with findings from the inspection of the scatter diagrams, indicate that no consistent cluster patterns of overall items across subgroup factors are occurring. While a few small clusters of items from group to group are noted, item compositions and the order of appearance of items and the size of item loadings in different subgroups all tend to vary widely. This indicates heterogeneity of subgroup factor deter- mination and supports psychological state theory rather than trait or structure theory.
4. Single items that appear in only one subgroup factor. From inspection of the scatter diagram that shows the representation of each of the 200 PHS items across the overall population and the five subgroups, it was discovered that 43 PHS items appeared singly in only one subgroup factored scale of 20 items.
In subgroup 2, items # 8 (queer thoughts), #24 (allergic skin reactions), and #68 (has had visions) appeared in Factor I. Items # 1 (stutter and stam- mer), # 126 (bandlike headaches), and # 185 (back troubles) appeared in Factor 11. Item #141 (embarrassed about height) appeared in Factor 111. Item #62 (stabbing pains in head) appeared in Factor IV. Item #I55 (too thin) appeared in Factor V.
In subgroup 3, item #154 (poor appetite) appeared in scale 11. Items # 140 (many jobs), # 20 (stealing), and # 171 (poor heredity) appeared in factor 111.
In subgroup 6, items # 5 (urinary frequency) and #46 (body aches and pains) appeared in factor 11. Items #8 (queer thoughts) and #143 (cerebral hemorrhage) appeared in factor 111. Item # 187 (good disposition) appeared in factor V.
In subgroup 7, items # 74 (choosy eater) and # 75 (asthma) appeared in factor I. Items #98 (schizophrenia), #111 (thyroid trouble), and #135 (sex

Methodological Advances 291
organs not working right) appeared on factor 11. Item #148 (trouble with father) appeared on scale 111. Items #94 (diarrhea) and #113 (encephalitis) appeared on scale IV.
In subgroup 8, items #31 (blushes easily), #93 (sweats too much), # 113 (encephalitis), and # 184 (butterflies in stomach) appeared in factor I. Items #37 (emotionally stable), #71 (shy as child) and #lS9 (excitable relatives) appeared in factor 11. Items #72 (sleep walking) and # 162 (disin- tegrates under pressure) appeared in factor 111. Items # 3 (high blood pressure), #35 (gets over anger easily) and #83 (cold extremities) appear on factor IV. Items #SO (no guilt), #61 (stabbing pains in head), #138 (mother difficult), and #177 (enjoys quarrels) appeared in factor V.
Clinical evaluation of these single items as to specificity and pathognomonicity indicates that few appear to be specific and differentiating as might have been expected. Most are general nonspecific symptoms with little predictive value for specific conditions.
The significance of single items that appear on only one factor will be dis- cussed more fully in later sections. Briefly, i t is important to discover whether such items might be specific or pathognomonic to one factor. If pathognomonic, they might constitute a highly significant scale.
Clustering of overall factored scale i tems across subgroups. A factored scale is a cluster of highly loaded items that supposedly reflect the common effects of an underlying factor. A standard methodological approach is to factor analyze the item responses of a large overall population and then factor analyze the constituent subpopulations to discover the degrees of homogeneity of response tendencies across subgroups. If the subgroup populations are homogeneous, then the sub- group population factors should emerge in the same order and with the same item representation as the overall factors.
One method to estimate the homogeneity of factors across populations is to trace the appearance of clusters of homogeneous items across subgroup factors. The subgroup factor clusters of subgroups can be compared with the overall population factors or with each other. If the subgroup scales are homogeneous with the overall factored scales, then clusters of the same items should appear regularly in the same order across subgroup factors. If the factors are heterogeneous across populations, then clusters either should appear irregularly or not a t all, with the exception that the same factors may appear in different orders depending on item loadings across groups. Exhibit 1 shows the clusters identified.
The question arises as to how many items constitute a cluster. In Exhibit 1, the highest number of items per cluster was 5 for subgroup 2, 9 for subgroup 3, 10 for subgroup 6, 8 for subgroup 7 and 5 for subgroup 8. When 4 items was used as the cut-off point for a criterion of comparability of factors across subgroups, subgroup 2 had 5 clusters with 4 or more items out of a possible 25, subgroup 3 had 8 clusters, subgroup 6 had 9 clusters, subgroup 7 had 6 clusters and subgroup 8 had 5 clusters.
The distribution of Overall Factor Items can be observed by looking down the lines below, starting a t the top where the overall factors are listed. The distribution of the subgroup factored scale items is given across the sheet beyond the factor numbers. Wide discrepancies are noted immediately on inspection.
Exhibit 1 confirms the pattern of large variability of overall factored items across subgroup factors. Using very liberal criteria of 4 item clusters as suggesting comparability of overall and subgroup factors, we find the following :
Overall factor I was represented in Subgroup 2 by Factor I1 and Factor 111; in Subgroup 3 by Factor 11; in Subgroup 6 by Factor 11; in Subgroup 7 by Factor I ; in Subgroup 8 by Factor IV.
5.

292 Journal of Clinical Psychology, Apri l , 197’8, Vol. 84, No. 1.
EXHIBIT 1 DISTRIBUTIONS OF CLUSTERS OF OVERALL FACTOR ITEMS ACROSS SUBGROUP FACTORS
Subgroup Overall factors factors I I1 111 IV V
Subgroup 2 Factor I
I1
111
I V
V
Subgroup 3 Factor I
I1
111
IY
V
Subgroup 6 Factor I
I1
I11
I Y
V
Subgroup 7 Factor I
I1
111
I Y
v
Subgroup 8 Factor I
I1
111
I V
V
104, 4, 47 73, 126
86, 76 109, 119, 106
146
7
109,47, 119
89, 53, 109
106 119, 73
53, 146 104
2
134, 46, 47 119, 86, 109, 2
109, 89,53
119
73, 53, 134 74, 119
106
134
96
7, 119
86, 112
7, 104
109, 146, 73 119,96
164, 10
191
130, 120, 140 150, 80, 20
190, 100, 157 100
150, 29, 123 10, 160
110
123, 57
9
164
130, 120, 10
118
110, 100
118, 157
29
180, 123
117, 87, 19 9
110, 118
160 130, 80, 29
10, 159
49, 78, 87 59, 8 147
67, 117
6 192, 67, 19
147
79. 69. 137 76, 19, 9, 6
66
49,87 76, 167
49, 67 147
49, 78, 67 87, 59, 137 76, 167, 19
147 117, 57,87
22
76, 66 .14
79, 87, 137
49, 78, 117 57, 19, 9
147
76, 147
49, 78 192, 66, 6
57 137
179, 196, 34
174
12, 56
22, 54, 13 182
95, 175
28, 179, 9 196, 199
22, 54, 174 12, 175, 13
170
64
39
179, 196 172, 182
95, 177, 5
174, 172 34, 179
95, 196, 12
54, 12, 13 56
196, 12, 13 56
122, 54 175
28, 95, 179 9, 182
184, 174, 12
28, 179, 9
95, 162
22, 54, 172 13, 34 199
159, 198, 195 158, 16
178, 200, 33
200, 88 18, 165, 182
16, 76
159, 76
178, 198, 142 33, 161, 18
101, 158 161
178, 186, 172 76
159, 198, 142 172, 51
178, 161, 165
18, 101, 195 16
142, 195
200, 159, 161 165, 195, 135
132,88 178, 200, 159 165, 195, 16
76
182
158, 76
51
198, 33
172
16

Methodological Advances 293
Overall factor I1 was represented in Subgroup 3 by Factor I11 and Factor V; in Subgroup 7 by Factor 11; in Subgroup 8 by Factor I1 and Factor V.
Overall factor I11 was represented in Subgroup 2 by Factor I and Factor V; in Subgroup 3 by Factor I and Factor 111; in Subgroup 6 by Factor I ; in Subgroup 7 by Factor V; in Subgroup 8 by Factor 111.
Overall factor IV was represented in Subgroup 2 by Factor IV; in Sub- group 3 by Factor I and Factor 11; in Subgroup 6 by Factor I, Factor 111, and Factor V; in Subgroup 7 by Factor I.
Overall factor V was represented in Subgroup 2 by Factor I ; in Subgroup 3 by Factor IV; in Subgroup 6 by Factor I, Factor 111, and Factor V; in Sub- group 7 by Factor I1 and Factor 111.
INTERPRETING FACTORIAL FINDINGS Factor analytic methods have many pitfalls, of which not the least is confusing
results. A common finding across factorial studies is that the results are rarely exactly comparable. I n factor analyzing the item composition of personality in- ventories, i t often is found that item contents do not appear consistent, factorial composition is not pure, more than one factor may seem to be represented by separate clusters of items in the same factor, and the highest loaded items may appear to be unrelated to what purportedly is being measured. When the item content of factors is not clear, ambiguities may stimulate projective interpretations. Finally, there is the common error of deductively projecting preconceived theories on the data.
Exhibit 1 provides examples of common interpretive problems. Inspection of the scatter diagram of clusters reveals that 3 subgroup factors had 0 clusters with 4 items, 12 factors had 1 cluster, 9 factors had 2 clusters, and 1 factor had 3 clusters of overall factor items. This means that identifying comparable factors can be quite difficult across subgroups when only 0-3 identical items are available upon which to base comparisons.
When two or more clusters of items from the overall factored scales appeared in the subgroup factors, i t became necessary to use clinical judgment to decide the weights and meanings of the clusters. It is important to keep in mind that most symptom syndromes include both specific and nonspecific items, so the initial clinical judgment relates to whether the item is specific or nonspecific. Specific signs/symptoms are assigned primary diagnostic significance. Nonspecific signs/ symptoms that indicate secondary personality reactions are assigned lesser diag- nostic weightings depending on their intensity.
In interpreting the factorial findings in our ILTS standardization studies, the following interpretive steps and rules have been utilized :
1. Factor analyze the protocol data to identify statistically factors that consist of the 20 highest loaded items derived from pooled overall populations. This provides evidence on the general behavior domains under study.
2. Factor analyze separate populations to discover the individual char- acteristics of each subgroup.
3. Determine the comparability of different factors by constructing scatter diagrams that trace the representation of specific factor items across groups, and consider loadings.
4. From scatter diagrams that relate overall to subgroup factors, identify clusters of items that appear in subgroups. By comparing the item content of clusters, comparable factors can be identified.
5. Where two or more clusters of overall items appear in subgroup factors, trace the representation of marker items across subgroup factors.

294 Journal of Clinical Psychology, April , 1978, Vol. 34, No. 2.
6. Differentiate between primary, specific, localizing signs/symptoms and secondary personality reactive, “wear and tear” signs/symptoms. Assign the highest diagnostic significance to primary, specific signs/symptoms.
7. Formulate diagnostic-interpretive hypotheses inductively. 8. Determine the base rates of responding T or F to any item to provide
information as to the unusualness or abnormality of the response. 9. Evaluate the content of item responses to identify mental set responding,
such as social desirability or acquiescence sets. 10. Formulate a final diagnosis/interpretation that relates the finding
to accepted clinical concepts. Beware of examiner bias in applying preconceived concepts projectively .
COMPARISON OF DIFFERENT METHODS OF SCALE CONSTRUCTION Historically, the earliest inventories simply consisted of checklists of symptoms
and signs constructed with different levels of clinical sophistication. In our studies of the PHS, the first step was to construct 12 scales related to physiological organ system functioning and the principal psychopathological syndromes. The empirical scales with pertinent data are cited in Thorne (1978).
Early factorially constructed inventories simply listed scales that consisted of lists of the highest loaded items that appeared in each factor and that were inter- preted intuitively by deductive methods. The difficulty was that different factorial methods were used and interpreted largely in terms of the author’s theoretical biases. Pishkin and Thorne (1978) cite such factorially derived factors, but defined them by item contents and inductive interpretations.
This study develops some alternate methods of scale construction to be com- pared as to results with empirical and factored scales. Because the data reveal most highly significant differences between the schizophrenic population of sub- group 8 as compared with all the other subgroups 2, 3, 6 and 7, we will study the comparability of various types of “schizophrenicity” scales. The term “schizo- phrenicity” is used because of doubt as to whether schizophrenia is a valid classifi- cation of mental disease.
Item Response Frequency Scale Table 1 presents a scale based on the 27 items with the highest percents of
responding T(rue) by subgroup 8 (institutionalized schizophrenics). The items of this scale all have high clinical face validity. When one compares the base rate data for the five clinical subgroups presented in the tabular materials in Pishkin and Thorne (1978), it is found that subgroup 8 shows the highest rates of patholog- ical responding on 93 of the 100 items of overall factored scales I-V.
The items in Table 1 were obtained from the five factored scales of subgroup 8; they are those with the highest percents of responding True. Items that had high percents, but were judged nonspecific or too generalized, were omitted as secondary reactions.
It should be noted that 16 of the 20 items of the empirical schizophrenia scale appear in Table 1. This is considered to be strong evidence of the validity of clinical judgment in constructing the empirical scale, and it also validates the method of scale construction that utilizes highest percents of responding True to such items. These results emphasize the necessity of utilizing more than one criterion in reaching clinical decisions because inclusion in Table 1 of too many nonspecific items would have confused the issues.
I n order t o test the validity of using the overall factored scales as indices of schizophrenicity, a tabulation was made of the items in Table 1 that appeared in any of the overaI1 factored scales. Five items (#18, 88, 158, 178 198) appeared in overall Factor V, 4 items (#6 , 8, 58, 78) appeared in overall Factor 111, and 1

Methodological Advances
TABLE 1 SCHIZOPHRENICITY SCALE BASED ON ITEMS WITH HIGHEST PERCENTS OF RESPONDING TRUE
BY SUBGROUP 8 (SCHIZOPHRENICS)
295
Item # Item content % T responses
128 78
107 178 158 36 49
138 169 200
188
179 27
168 6
58 199 33
182 8
18 118 192 59
137 108 198
I have been treated by a psychiatrist. Sometimes I lose interest in life for long periods. I don’t tolerate frustration very well. Something is the matter with my mind. Something has happened to the organs in my body, I feel most comfortable when I am alone. I often feel people are against me. My mother is very difficult to get along with. I have to take tranquilizers to quiet down my emotions. Sometimes I think I would feel safer if I were in a hospital or
institution where I would be protected from my own impulses. If people don’t stop bothering me, I am going to take matters into
my own hands. I get uncontrollable mood swings. Being in a crowd makes me feel nervous. I can’t keep disturbing thoughts out of my mind. Often my mind is flooded with fearful feelings. I often think people are talking about me. I would like to see a psychiatrist. I worry a lot about getting a disease like cancer or going insane. I fear that I might have a nervous breakdown. Sometimes I get very queer thoughts. I have heard voices speaking to me when nobody was around. I have been in a mental hospital. Sometimes I fear that I might lose control of myself. I have felt so depressed I felt like committing suicide. Several times in my life I have been mad enough to kill somebody. A close relative of mine is schizophrenic. Somebody is trying to influence my mind.
97% 91 89 88 88 87 87 87 86
81
77 76 73 73 71 70 66 62 62 62 60 57 52 51 45 41 36
item ( # 118) appeared in overall Factor 11. These findings show that overall factors contain a much lower representation of specific items, with the 10 items scattered over three factored scales, with many of the most specific items not included, and resulting in factorial findings more difficult to interpret. Obviously, it is more valid to factor analyze each subgroup separately in order to differentiate the most specific items more exactly.
This schizophrenicity scale based simply on the base rates of responding T(rue) to items judged clinically as specific t o schizophrenicity actually appears t o be more economical and valid than other scales to be reported that use more compli- cated methods of construction. Actually, the original empirically constructed schizophrenicity scale turned out to be more internally consistent than factored scales because clinical judgment had eliminated nonspecific items when the scale was constructed.

296 J o u r n a l of Clinical Psychology, A p r i l , 1978, Vol. 34, No. 2.
TABLE 2 SCHIZOPHRENICITY SCALE BASED ON THE FIVE HIGHEST LOADED ITEMS FROM THE OVERALL
FACTOR ANALYSIS AND THE FIVE CODED GROUP 8 FACTOR ANALYSES
Item # Item Loading
Overall factored Scale I 89 Most of the time I don’t feel good.
I1 130 I have been arrested. I11 49 I often feel that people are against me. IV 22 Occasionally, my heart seems to skip beats. V 178 Something is the matter with my mind.
52 70 55 45 46
Code VIII Group Factor I
Factor I1
Factor I11
Factor IV
Factor V
43 93 12
191 112
179 69 87
169 127
182 192
6 33
110
45 26 73
54 34
130 137
157 177 152
My heart beats too fast when I am nervous. I sweat too much. My nerves feel shaky most of the time. I have had more than my share of accidents. When I get a headache, my whole head feels bad.
I get uncontrollable mood swings. I am cheerful and happy most of the time. I am grumpy and irritable most of the time. I have to take tranquilizers to quiet down my emotions. Once I get angry, it takes me a long time to get over it.
I feel that I might have a mental breakdown. Sometimes I fear I might lose control of myself. Often my mind is flooded with fearful feelings. I worry a lot about getting a disease like cancer or
I never did get along well in school.
I find myself sighing a lot (taking in deep breaths). I lose my patience too easily. I often get cardiac pains (oppressive feelings in the
Sometimes my heart seems to pound too hard. When I get anxious and fearful my whole body
doesn’t work right.
I have been arrested. Several times in my life I have been mad enough to kill somebody. I vent my frustrations by swearing and cursing. I kind of enjoy a good quarrel. I am a very light sleeper.
going insane.
chest over my heart).
75 74 68 65 61
81 79 74 70 69
86 76 74
65 63
84 81
81 78
73
83
76 73 71 70

Methodological Advances 297
Highest Loaded Item Scales Theoretically, the highest loaded items should be the most specific; possibly
they might approach pathognomonicity. Theoretically, it should be possible to construct scales that consist of the single highest loaded items, the first 5 highest loaded items, or even the first 10 highest loaded items. It requires research with any test or population to derive the optimum number of highest loaded items for best predictive purposes.
Theoretically, there should be a greater probability for the highest loaded overall items to appear on more than one subgroup factor scale, so a tabulation was made in Table 2 of the distribution of the single highest loaded items of the overall population as compared with the five subgroups 2, 3, 6, 7 and 8. Only one item ( # 130) from the highest loaded overall group factor items appeared only once on subgroup 8, Factor V. Also, Table 2 shows that not one of the 25 highest loaded items of the first five main factors of the five subgroups was duplicated even once. Even though most loadings in Table 2 are very high and thereby probably quite meaningful, the results indicate high variability (heterogeneity) of subgroup factors.
Essentially the same results were obtained by tabulating and analyzing the distributions of the second most highly loaded items from all scales. Only two items (#22, 49) appeared on two subgroup factors.
The five subgroup 8 factors are difficult to interpret clinically. From Table 2, Factor I might be autonomic instability, Factor I1 indicates affective instability, Factor I11 suggests fears of insanity and/or nervous breakdown, Factor IV sug- gests nonspecific anxiety, Factor V suggests anger-hostility-aggression. But none of these factors is very specific, with low predictive power.
In order to compare the validity of scales based on the highest percents of True responding with scales based on the highest loaded items, the item contents of Table 1 and 2 were compared, and also the items of the five subgroup 8 factors in Table 2 were compared with the five highest loaded items of the overall factored scale. Two items ( # 89, 178) from overall scales 111 and V appeared in Table 1. Of the subgroup 8 factor scales comparisons with Table 1, Factor I had 0 common items, Factor I1 had 2 common items ( # 169, 179), Factor 111 had 4 common items ( # 182, 192, 6, 33), Factor I V had 0 common items, Factor V had 1 common item ( # 137). These findings indicate that the most highly loaded items do not coincide exactly with the highest percent items, that where items in Tables 1 and 2 do coin- cide, the percents of T responding tend to be numerically higher than the loadings, and that the highest item loading scale is not as valid and efficient as the highest percent responding True scale. Some of the subgroup 8 factors have zero or only .one highest percent items.
These findings appear to indicate that longer scales tend to have higher validity and reliability only when the items added are specific. The addition of nonspecific items only weakens observed relationships and makes interpretations more difficult. Thus, many of the most highly loaded items were judged to be nonspecific and nondifferentiating, so that mere addition of such highly loaded items did not make a more valid and reliable scale. The addition of specific items tends to round out the picture of the syndrome (factor), while the addition of nonspecific items only adds static.
When items are pathognomonic or nearly so statistically, one item such as “I am homosexual” may be more valid and certainly more economic than a scale of lower loaded items.
SCALES BASED ON SINGLE ITEMS THAT APPEAR ON ONLY ONE SCALE Studies of the distribution of the 200 PHS items across all factored scales
revealed many items that appear only on one factored scale. For example, 3 out of 100 overall population items appeared also only in subgroup 8 factors, and 14 items appeared only in subgroup 8 factors. Because these items were highly specific

298 Journal of Clinical Psychology, April, 1978, Vol. $4, No. 8.
to Group 8, i t was conceived that they might be pathognomonic items specifically related to schizophrenicity. Table 3 presents the 17 items with loadings and factor representations. The 3 items in common with overall factored scale items have lower loadings than the 17 items that appear solely in subgroup 8 factors.
Clinical evaluation of the significance of the items in Table 3 indicates the importance of evaluating specificity and/or pathognomonicity rather than depend- ing on loadings or event response percentages. In general, this is a “mixed” group of relatively nonspecific symptoms of low predictive power. Subgroup 8 presents an heterogeneous group of general disorder symptoms, which indicate, if anything, poor integration or even disintegration. None of the more accepted symptoms of schizophrenicity is present.
I n addition to scales of single items that appear only in the factored scales of only one subgroup, i t is necessary to consider specific or pathognomonic items that appear as single item factors or do not appear a t all in factoring, but which may be very important clinically. For example, such a single item as “I am homosexual” must be regarded as very significant clinically although it does not appear on any factored scale. This is why when an ILTS test is scored, the test sheet first should be scrutinized for very specific single items responses that can stand alone for screening purposes and that indicate the need for further investigation of the area under study. This is the reason why it is advised that the clinician should scrutinize the test sheets first t o identify single item responses that require further investi- gation.
TABLE 3
SCHIZOPHRENICITY ITEMS REPRESENTED ONLY IN SUBGROUP 8 FACTORS
Item # Item Factor Loading
3 35 37 45 60 61 71 72 83 93
128 138 177 189
112 162 184
I have been told I have high blood pressure. IV I get mad easily but I get over it rapidly. IV Nothing much ever gets me upset emotionally. I1 - I find myself sighing a lot (taking deep breaths). IV I don’t feel guilty about the things I have done. V As a child, I was not too attractive. V As a child, I was painfully shy. I1 I have walked in my sleep. 111 My hands and feet get cold easily. IV I sweat too much. I I have been treated by a psychiatrist. I My mother was very difficult to get along with. V I kind of enjoy a good quarrel. V Many of my relatives are very emotionally excitable people. I1
3 items from Subgroup 8 also appearing on Overall Factors: When I get a headache, my whole head feels bad. I tend to go to pieces under pressure. I get“butterflies” in my stomach when I get nervous.
OAI OA IV OA I V
71 51
-61 84 43 48 52 47 48 74 46 65 71 68
41 36 42
Table 3 indicates that scale construction based on single items responded to by only one subgroup produces entirely different results than highest percents and highest loaded item scales. Table 3 shows only one item ( # 128) that appears in Table 1. The rest of the items are nonspecific and refer t o secondary personality reactions to the S’s condition. While this method may be good for studying non-

Methodological Advances 299
specific items, it apparently has no validity for specific and/or pathognomonic items.
The reader should compare the item contents of the scales presented in Tables 1, 2 and 3 with the items of the overall and subgroup factored scales presented in Thorne and Pishkin (1978) and Pishkin and Thorne (1978). Such comparisons reveal that much depends on the nature of the scales used. Even when scales are operationally defined by citing the items thereon, the results from the different scales are not comparable. Such discrepancies are increased if different judges apply their own idiosyncratic intuitive interpretations. In the ILTS studies, we have abandoned completely the method of inviting judges to interpret factors clinically; we preferred instead to cite component items operationally.
EVALUATING SPECIFICITY vs. NONSPECIFICITY AND PATHOGNOMONICITY The factorial results reported above emphasize the importance of evaluating
the meaning of factored items and scales with reference to clinical specificity and even pathognomonicity. Pathognomonic means distinctively characteristic of a particular condition/disease/disorder. Specificity refers to specific localizing signs and symptoms that are characteristic of a syndrome, but not necessarily pathog- nomonic. Pathognomonic refers to a primary etiologic agent without which a con- dition could not occour. Specificity also can include typical general signs, symptoms and secondary reactions commonly present, but not distinctive. Many sign and symptoms are general and nonspecific because they also may appear in a variety of conditions.
Unfortunately, the scicnce of psychopathology is not as far advanced as physical pathology in clinical medicine, and very few pathognomonic signs and symptoms have been identified in psychopathology. Thorne (1955) made a start toward the objectification of diagnostic processes and outlined some approaches to specificity and pathognomonicity. Thorne (1976) outlined a new system of psycho- pathology based on integrative disorders. However, the field of clinical psychology largely abandoned the field of psychodiagnosis after the proclamation of Carl R. Rogers that diagnosis was unnecessary. However, scientific interest in diagnosis is growing rapidly.
The results of this study indicate that clinical judgment must be used ultimately to assess the specificity or nonspecificity of factored item meanings. Such indices as inclusion in a factored scale, high loadings, high base rates of T or F responding, and scale specificity of items cannot be taken a t face value, but must be judged and interpreted clinically. The data cited above indicate that factor analysis alone does not differentiate the clinical significance of items.
When one compares all the scales that resulted from the different methods of scale construction using the expertly constructed empirical scale (Thorne, 1965) as a criterion, it is evident that the schizophrenicity scale based on items with the highest percents of responding True by subgroup 8 contained the largest number of items considered specific and/or pathognomonic for iischizophrenia” and also that this scale was purest or most homogeneous as to factor content. This schizophreni- city scale contains many marker items that should be considered as danger signals that indicate the need for further investigation and, of all the scales constructed, appears to be most valuable clinically.
One approach to evaluating pathognomonicity is to use clinical judgment to evaluate how specific an item is or whether it involves nonspecific general symptoms and signs that have no particular diagnostic significance. Accordingly, the 26 items presented in Table 3 that only the schizophrenics of subgroup 8 answered True were evaluated clinically as to specificity:
None of these items is regarded as specific to schizophrenicity. Items 3, 73, 77 and 83 refer to cardiovascular lability. Items 63 and 184 to
gastrointestinal symptoms.
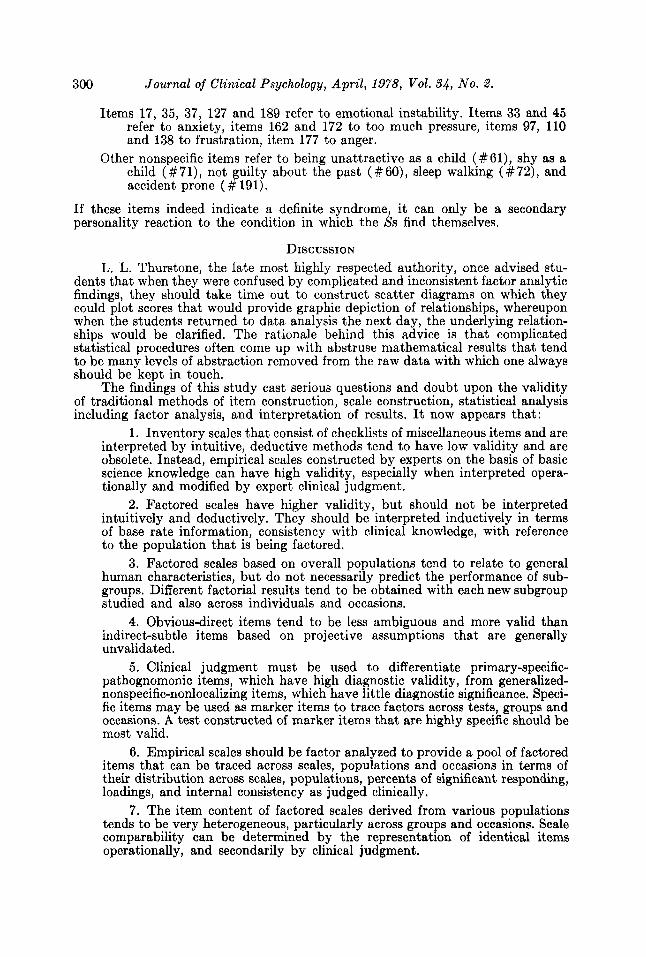
300 Journal of Clinical Psychology, Apri l , 1978, Vol. 34, No. 2.
Items 17, 35, 37, 127 and 189 refer to emotional instability. Items 33 and 45 refer to anxiety, items 162 and 172 to too much pressure, items 97, 110 and 138 to frustration, item 177 to anger.
Other nonspecific items refer to being unattractive as a child (#61), shy as a child (#71), not guilty about the past (#60), sleep walking (#72), and accident prone ( # 191).
If these items indeed indicate a definite syndrome, it can only be a secondary personality reaction to the condition in which the Ss find themselves.
DISCUSSION L. L. Thurstone, the late most highly respected authority, once advised stu-
dents that when they were confused by complicated and inconsistent factor analytic findings, they should take time out to construct scatter diagrams on which they could plot scores that would provide graphic depiction of relationships, whereupon when the students returned to data analysis the next day, the underlying relation- ships would be clarified. The rationale behind this advice is that complicated statistical procedures often come up with abstruse mathematical results that tend to be many levels of abstraction removed from the raw data with which one always should be kept in touch.
The findings of this study cast serious questions and doubt upon the validity of traditional methods of item construction, scale construction, statistical analysis including factor analysis, and interpretation of results. It now appears that:
1. Inventory scales that consist of checklists of miscellaneous items and are interpreted by intuitive, deductive methods tend to have low validity and are obsolete. Instead, empirical scales constructed by experts on the basis of basic science knowledge can have high validity, especially when interpreted opera- tionally and modified by expert clinical judgment.
2. Factored scales have higher validity, but should not be interpreted intuitively and deductively. They should be interpreted inductively in terms of base rate information, consistency with clinical knowledge, with reference to the population that is being factored.
3. Factored scales based on overall populations tend to relate to general human characteristics, but do not necessarily predict the performance of sub- groups. Different factorial results tend to be obtained with each new subgroup studied and also across individuals and occasions.
4. Obvious-direct items tend to be less ambiguous and more valid than indirect-subtle items based on projective assumptions that are generally unvalidated.
5. Clinical judgment must be used to differentiate primary-specific- pathognomonic items, which have high diagnostic validity, from generalized- nonspecific-nonlocalizing items, which have little diagnostic significance. Speci- fic items may be used as marker items to trace factors across tests, groups and occasions. A test constructed of marker items that are highly specific should be most valid.
6. Empirical scales should be factor analyzed to provide a pool of factored items that can be traced across scales, populations and occasions in terms of their distribution across scales, populations, percents of significant responding, loadings, and internal consistency as judged clinically.
7. The item content of factored scales derived from various populations tends to be very heterogeneous, particularly across groups and occasions. Scale comparability can be determined by the representation of identical items operationally, and secondarily by clinical judgment.

Methodological Advances 301
8. Scales that utilize factored items can be constructed in differing ways with differing results. In this study, an empirical scale constructed expertly had high factorial validity. Scales based on the percents of True responding to factored items also had almost identical item representation with the empiric scales. ScaIes based on highest load items had lesser item representation with the empirical scales. Scales based on single items responded to by only one subgroup consisted only of nonspecific items.
9. Methods of item tracing modified by expert clinical judgment provide the most valid indices of what a scale is all about.
10. The results in general support an interpretation in terms of integrative state psychology rather than psychological trait and personality structure theory, since no such traits or structures appeared with the present methodology.
These methods have a much wider generality than to inventory construction alone. All diagnostic symptoms and signs could be translated into inventory items and analyzed by factor analysis and item tracing methods. The results of such an investigation would have revolutionary implications.
REFERENCES BELL, H. M. BERNREUTER, R. G. The Personality Inventory. Manual. Stanford, Calif. : Stanford University
Press, 1935. CATTELL, R. B., SAUNDERS, D. R. & STICE, G. The Sizteen Personality Factor Questionnaire. Urbana,
111. : University of Illinois InhitUte of Personality Ability Testing, 1950. GUILFORD, J. P., & ZIMMERMAN, W. S. The Guilford-Zimmerman Temperament Survey. Beverly
Hills, Calif. : Sheridan Supply, 1949. HATHAWAY, S. R., & MCKINLEY, J. C. Minnesota Multiphasic Personality Inventory: Manual.
New York: Psychological Corporation, 1951. PISHKIN, V., & THORNE, F. C. Factored scales for the Personal Health Survey with schizophrenics,
alcoholics, felons, unmarried mothers and college students. Journal of Clinical Psychology, 1978, 34, 000-000.
THORNE, F. C. Principles of psychological examining. Brandon, Vt. : Journal of Clinical Psychology, 1955.
THORNE, F. C. THORNE, F. C. THORNE, F. C. THORNE, F. C.
THORNE, F. C.
THORNE, F. C. THORNE, F. C., & PISHKIN, V.
WOODWORTH, R. S.
The Adjustment Inventory. Stanford, Calif. : Stanford University Press, 1934.
Personality. Brandon, Vt. : Clinical Psychology, 1961. The Integration Level Test Series. Brandon, Vt.: Clinical Psychology, 1965. Integralive psychology. Brandon, Vt. : Clinical Psychology, 1967. A grand research design for the investigation of psychological states. Journal of
A new system of psychopathology for psychological states. Journal of Clinical Clinical Psychology, 1976, 38, 209-224. (a)
Psychology, 1976, 32, 751-761. (b) The Personal Health Survey. Journal of Clinical Psychology, 1978, 34, 262-268.
The factorial structure of the Personal Health Survey in normals and schizophrenics. Journal of Clinical Psychology, 1978, 34, 276-282.
Personal Data Sheet. Chicago: Stoelting, 1918.