Embed Size (px)
Citation preview
METHOD FOR THE DETERMINATION
OF EXTRACTABLE PETROLEUM HYDROCARBONS (EPH)
Massachusetts Department of Environmental Protection Division of Environmental Analysis (Senator William X. Wall Experiment Station) Office of Research and Standards Bureau of Waste Site Cleanup Commonwealth of Massachusetts Executive Office of Environmental Affairs Ellen Roy Herzfelder Secretary Department of Environmental Protection Robert W. Golledge Commissioner
May 2004 Revision 1.1

METHOD FOR THE DETERMINATION OF EXTRACTABLE PETROLEUM HYDROCARBONS (EPH)
TABLE OF CONTENTS
Section Topic Page
1.0 Scope & Application 1
2.0 Summary of Method 3
3.0 Definitions 4
4.0 Interferences 7
5.0 Health and Safety Issues 8
6.0 Apparatus and Materials 8
7.0 Reagents and Standards 9
8.0 Sample Collection, Preservation, and Handling 11
9.0 Sample Analysis of Extractable Petroleum Hydrocarbons (EPH) 13
9.1 Overview of Sample Extraction Procedures 13
9.2 Silica Gel Cleanup and Fractionation 16
9.3 Final Sample Extract Concentration 17
9.4 Determination of Percent (%) Moisture 18
9.5 Analytical Conditions 18
9.6 Retention Time Windows 18
9.7 Calibration 19
9.8 GC Analysis 21
9.9 Calculations 23
9.10
Determination of Target PAH Analytes and EPH Aliphatic and Aromatic Range Concentrations by Gas Chromatography/Mass Spectrometry (GC/MS)
24
10.0 Quality Control 26
11.0 Data Production and Reporting 31
12.0 Reporting Limits 35
13.0 Method Performance 35
14.0 References 35
APPENDIX 1 - Single Laboratory Accuracy, Precision, and Method Detection Limit Data 36-40
APPENDIX 2 – Chromatograms 41-45
APPENDIX 3 - Required EPH and TPH Data Report Information 46-49
APPENDIX 4 – EPH Calibration and Analysis Using Linear Regression 50-53
APPENDIX 5 – Initial Demonstration of Laboratory Capability (IDLC) for MADEP EPH Method 54-60
DISCLAIMER Mention of trade names or commercial products does not constitute endorsement by the Massachusetts Department of Environmental Protection (MADEP). Trade names and commercial products specified within this method are based upon their use in validation studies conducted by MADEP. Equipment and materials cited in this method may be replaced by similar products, as long as adequate data exist or have been produced documenting equivalent or superior performance.
____________________________________________________________________________ Extractable Petroleum Hydrocarbons Revision 1.1 MADEP-EPH-04 Page 1 May 2004
METHOD FOR THE DETERMINATION OF EXTRACTABLE PETROLEUM HYDROCARBONS
MASSACHUSETTS DEPARTMENT OF ENVIRONMENTAL PROTECTION 1.0 SCOPE & APPLICATION
1.1 This method is designed to measure the collective concentrations of extractable aliphatic and aromatic petroleum hydrocarbons in water and soil/sediment matrices. Extractable aliphatic hydrocarbons are collectively quantitated within two ranges: C9 through C18 and C19 through C36. Extractable aromatic hydrocarbons are collectively quantitated within the C11 through C22 range. These aliphatic and aromatic hydrocarbon ranges correspond to a boiling point range between approximately 150 °C and 265 °C.
1.2 This method is based on a solvent extraction, silica gel solid-phase extraction (SPE)/fractionation process, and
gas chromatography (GC) analysis using a flame ionization detector (FID). This procedure should be used by, or under the supervision of, analysts experienced in extractable organics analysis. Analysts should be skilled in the interpretation of gas chromatograms and their use as a quantitative tool.
1.3 This method is designed to complement and support the toxicological approach developed by the Massachusetts
Department of Environmental Protection to evaluate human health hazards that may result from exposure to petroleum hydrocarbons (MADEP, 1994 and MADEP, 2003). It is intended to produce data in a format suitable for evaluation by that approach and that may be compared to reporting and cleanup standards promulgated in the Massachusetts Contingency Plan (310 CMR 40.0000).
1.4 This method is also able to measure the individual concentrations of Target Polynuclear Aromatic Hydrocarbons
(PAH) Analytes, including Diesel PAH Analytes, in water and soil/sediment matrices. The use of this method to quantify these analytes is optional, and the Reporting Limits for some of these PAH compounds in water are greater than the notification and/or cleanup standards specified in the Massachusetts Contingency Plan for sites located in groundwater resource area categorized as RCGW-1 in 310 CMR 40.0362(1)(a). In cases where it is necessary to demonstrate compliance with these standards, the use of a gas chromatography/mass spectrometry (GC/MS) method in the selective ion monitoring (SIM) mode and/or high performance liquid chromatography (HPLC) methodology may be necessary.
1.5 The fractionation step described in this method can be eliminated to allow for a determination of a Total
Petroleum Hydrocarbon (TPH), and/or to obtain qualitative “fingerprinting” information. While TPH provides little information on the chemical constituents, toxicity, or environmental fate of petroleum mixtures, it may be a cost-effective screening tool in cases where relatively low concentrations of contamination are suspected.
1.6 Petroleum products suitable for evaluation by this method include kerosene, fuel oil #2, fuel oil #4, fuel oil #6,
diesel fuel, jet fuel, and certain lubricating oils. This method, in and of itself, is not suitable for the evaluation of gasoline, mineral spirits, petroleum naphthas, or other petroleum products which contain a significant percentage of hydrocarbons lighter than C9. This method, in and of itself, is also not suitable for the evaluation of petroleum products which contain a significant percentage of hydrocarbons heavier than C36.
1.7 The Reporting Limit (RL) of this method for each of the collective aliphatic and aromatic fractional ranges is
approximately 20 mg/kg in soil/sediment, and approximately 100 µg/L in water. The RL of this method for TPH is approximately 10 mg/kg in soil and approximately 100 µg/L in water. The RL of this method for the Target PAH Analytes is compound-specific, and ranges from approximately 0.2 to 1.0 mg/kg in soil/sediment, and 2 to 5 µg/L in water.
1.8 This method includes a data adjustment step to subtract the concentration of Target PAH Analytes from the
concentration of C11 through C22 Aromatic Hydrocarbons. This data adjustment may be made by the laboratory or the data user .
1.9 Data reports produced using this method must contain all of the required EPH/TPH data information
provided in Appendix 3. The format of these data reports is left to the discretion of individual laboratories. 1.10 Like all GC procedures, this method is subject to a "false positive" bias in the reporting of Target PAH
Analytes, in that non-targeted hydrocarbon compounds eluting or co-eluting within a specified retention time window may be falsely identified and/or quantified as a Target or Diesel PAH Analyte. In addition, this
____________________________________________________________________________ Extractable Petroleum Hydrocarbons Revision 1.1 MADEP-EPH-04 Page 2 May 2004
method is subject to a “false negative” bias in the reporting of Target PAH Analytes, in that the ability to identify Target PAH Analytes at low concentrations may be inhibited if a large unresolved complex mixture is present. While cleanup procedures specified in this method to segregate aliphatic and aromatic fractions will serve to mitigate these concerns, confirmatory analysis by dissimilar columns, GC/MS analysis, or other suitable technique is recommended in cases where a Target PAH Analyte reported by this method approaches or exceeds an applicable reporting or cleanup standard, and/or where coelution of a non-targeted hydrocarbon compound is suspected.
1.11 The first draft of this method was evaluated by two interlaboratory “Round Robin” testing programs. In the
final evaluation effort, participating laboratories were provided (single-blind) sand samples spiked with a #2 fuel oil, and a “real world” groundwater sample contaminated by a highly weathered fuel oil. Laboratory proficiency was evaluated using a Z-score approach. Data received from 23 laboratories performing the method without significant modifications are summarized below:
Data from Proficient Laboratories
Matrix # Labs Proficient
% Labs Proficient
Fraction %RSD % Labs within +/- 40% mean value
C9-C18 Aliphatics 23 95 soil 19 83 C19-C36 Aliphatics 30 89
C11-C22 Aromatics 19 100 Total All Fractions
(TPH) 17 100
C9-C18 Aliphatics 84 22 water 20 87 C19-C36 Aliphatics 192 94
C11-C22 Aromatics 47 72 Total All Fractions
(TPH) 35 83
Laboratory and method performance on the water sample were adversely impacted by the relatively low concentrations of the aliphatic fractions (due to the low solubilities of these hydrocarbons in “real world” samples), and by breakthrough of naphthalenes into the aliphatic extract during fractionation. Improvements incorporated into this final method are expected to mitigate problems of this nature and significantly improve overall method performance.
1.12 This method is one way to quantify collective concentrations of extractable aliphatic and aromatic petroleum
hydrocarbons within specified carbon-number-ranges. It has been designed in a manner that attempts to strike a reasonable balance between analytical method performance and utility. In this manner, assumptions and biases have been incorporated into the method to help ensure protective, though not overly conservative data.
As an example, the Department recognizes that branched alkanes have lower boiling points than their n-alkane counterpart, while many of the cycloalkane constituents of diesel range volatile organics have higher boiling points than their n-alkane counterpart. As a consequence:
(1) Depending upon the specific chromatographic column used, most branched C9 alkanes are expected to elute before n-nonane, the beginning marker compound for the C9 through C18 aliphatic hydrocarbon range, and will not be counted in this range;
(2) Depending upon the specific chromatographic column used, most branched C19 alkanes are expected to elute before n-nonadecane, the beginning marker compound for the C19 through C36 aliphatic hydrocarbon range, and will be conservatively counted in the more toxic C9 through C18 aliphatic hydrocarbon range; and
(3) Depending upon the specific chromatographic column used, most cycloalkanes within the C9 through C18
and C19 through C36 aliphatic hydrocarbon ranges will be counted within their proper range.
Based on the nature of petroleum releases encountered in the environment, the collective concentrations of the extractable aliphatic ranges as measured by the EPH Method are considered to be suitable for the evaluation of the risks posed by these releases, consistent with the toxicological approach developed by the Department to evaluate human health hazards that may result from exposure to petroleum hydrocarbons (MADEP, 1994 and MADEP, 2003).
____________________________________________________________________________ Extractable Petroleum Hydrocarbons Revision 1.1 MADEP-EPH-04 Page 3 May 2004
1.13 There may be better, more accurate, and/or less conservative ways to produce this data. MADEP encourages
methodological innovations that (a) better achieve method and/or data quality objectives, (b) increase analytical precision and accuracy, (c) reduce analytical uncertainties and expenses, and/or (d) reduce the use of toxic solvents and generation of hazardous wastes. All significant modifications to this method, however, must be disclosed and described on the data report form, as detailed in Section 11.3 and on the MADEP MCP Analytical Method Report Certification Form (See Appendix 3, Question D). Laboratories who make such modifications, and or develop and utilize alternative approaches and methods, are further required to demonstrate:
That such modifications or methodologies adequately quantify the petroleum hydrocarbon target ranges, as defined in Sections 3.4 through 3.6 of this document, ensuring that any methodological uncertainties or biases are addressed in a manner that ensures protective (i.e., conservative) results and data (e.g., over, not under-quantification of the more toxic ranges);
That such modifications and/or methodologies employ and document initial and continuing Quality
Assurance/Quality Control procedures consistent with similar approaches detailed in the MADEP Compendium of Analytical Methods; and
That such methods and procedures are fully documented in a detailed Standard Operating
Procedure.
1.14 Additional information and details on the MADEP VPH/EPH approach, and the results of interlaboratory “Round Robin” evaluations of this method, are available on the World Wide Web at http://www.magnet.state.ma.us/dep/bwsc/pubs.htm.
1.15 This method is intended to be used in conjunction with the current version of WSC-CAM-IV B, “Quality
Assurance and Quality Control Requirements for the Method For The Determination of Extractable Petroleum Hydrocarbons (EPH)”. WSC-CAM-IV B was developed by the Department to complement the MADEP EPH Method and to provide more detailed guidance regarding compliance with the quality control requirements and performance standards of the EPH Method.
2.0 SUMMARY OF METHOD
2.1 A sample submitted for EPH analysis is extracted with methylene chloride, dried over sodium sulfate, solvent exchanged into hexane, and concentrated in a Kuderna-Danish apparatus. Sample cleanup and separation into aliphatic and aromatic fractions is accomplished using commercially available silica gel cartridges or prepared silica gel columns. The two individual fraction extracts produced are re-concentrated to a final volume of 1 mL (i.e., an aliphatic extract and an aromatic extract). The concentrated extracts are then separately analyzed by a capillary column gas chromatograph equipped with a flame ionization detector. The resultant chromatogram of aliphatic compounds is collectively integrated within the C9 through C18 and C19 through C36 ranges. The resultant chromatogram of aromatic compounds is collectively integrated within the C11 through C22 range, and is (optionally) used to identify and quantitate individual concentrations of Target PAH Analytes.
2.2 Average calibration factors or response factors determined using an aliphatic hydrocarbon standard mixture
are used to calculate the collective concentrations of C9 through C18 and C19 through C36 aliphatic hydrocarbons. An average calibration factor or response factor determined using a PAH standard mixture is used to calculate a collective C11 through C22 aromatic hydrocarbon concentration. Calibration factors or response factors determined for individual components of the PAH standard mixture are also used to calculate individual concentrations of Target PAH Analytes.
2.3 This method is suitable for the analysis of waters, soils, sediments, wastes, sludges, and non-aqueous phase liquids (NAPL). However, it should be noted that the method was validated only for soil and water matrices.
2.4 This method is based on (1) USEPA Methods 8000B, 8100, 3510C, 3520C, 3540C, 3541, 3545A, 3546, 3580 A and 3630C, SW-846, "Test Methods for Evaluating Solid Waste"; (2) Draft "Method for Determination of Diesel Range Organics", EPA UST Workgroup, November, 1990; and (3) "Method for Determining Diesel Range Organics", Wisconsin Department of Natural Resources, PUBL-SW-141, 1992.
____________________________________________________________________________ Extractable Petroleum Hydrocarbons Revision 1.1 MADEP-EPH-04 Page 4 May 2004
3.0 DEFINITIONS
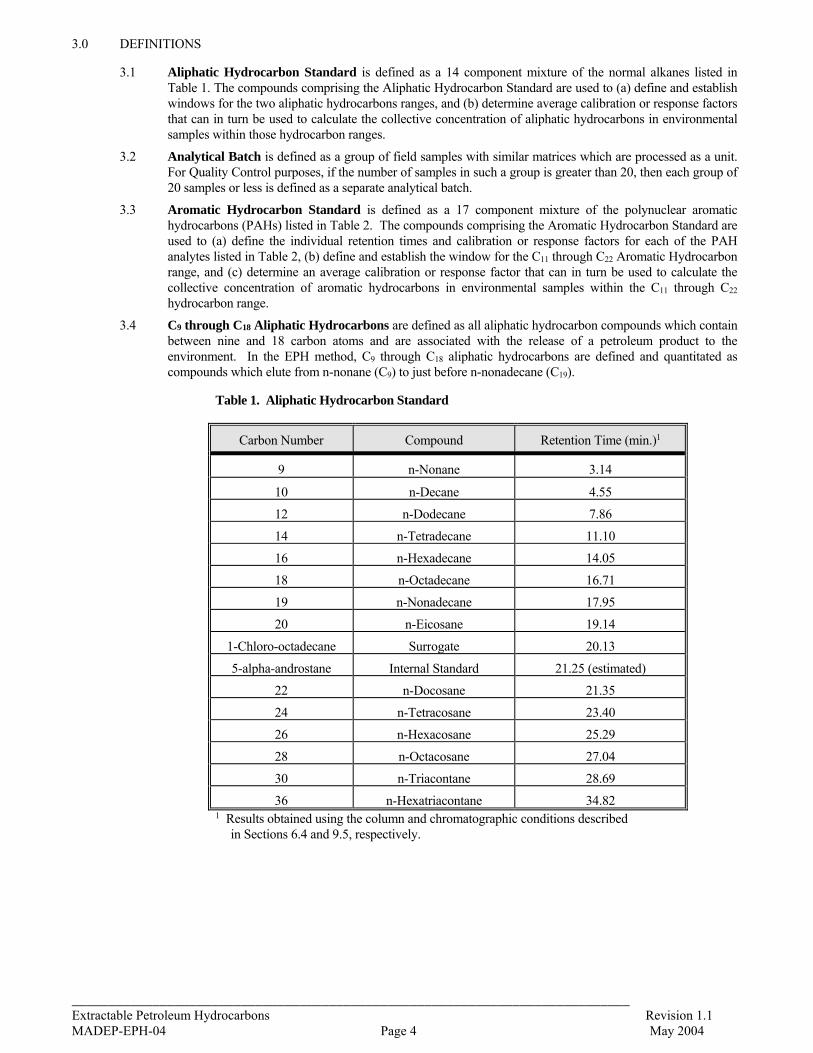
3.1 Aliphatic Hydrocarbon Standard is defined as a 14 component mixture of the normal alkanes listed in Table 1. The compounds comprising the Aliphatic Hydrocarbon Standard are used to (a) define and establish windows for the two aliphatic hydrocarbons ranges, and (b) determine average calibration or response factors that can in turn be used to calculate the collective concentration of aliphatic hydrocarbons in environmental samples within those hydrocarbon ranges.
3.2 Analytical Batch is defined as a group of field samples with similar matrices which are processed as a unit. For Quality Control purposes, if the number of samples in such a group is greater than 20, then each group of 20 samples or less is defined as a separate analytical batch.
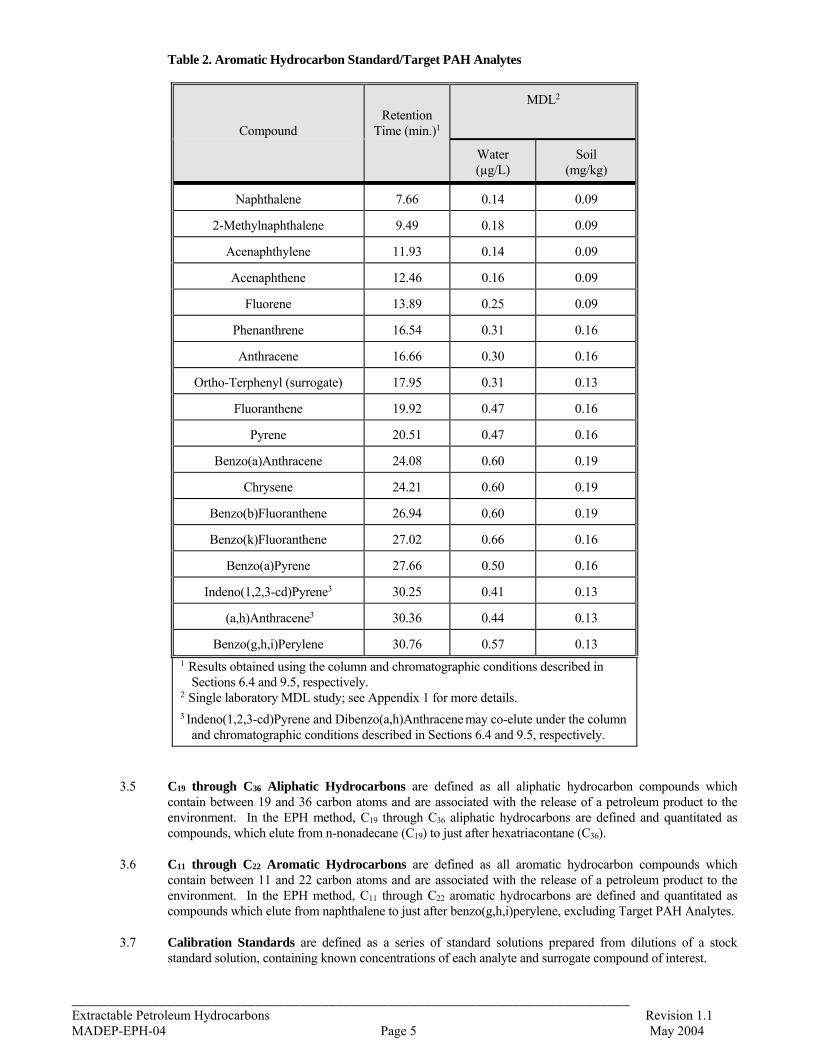
3.3 Aromatic Hydrocarbon Standard is defined as a 17 component mixture of the polynuclear aromatic hydrocarbons (PAHs) listed in Table 2. The compounds comprising the Aromatic Hydrocarbon Standard are used to (a) define the individual retention times and calibration or response factors for each of the PAH analytes listed in Table 2, (b) define and establish the window for the C11 through C22 Aromatic Hydrocarbon range, and (c) determine an average calibration or response factor that can in turn be used to calculate the collective concentration of aromatic hydrocarbons in environmental samples within the C11 through C22 hydrocarbon range.
3.4 C9 through C18 Aliphatic Hydrocarbons are defined as all aliphatic hydrocarbon compounds which contain between nine and 18 carbon atoms and are associated with the release of a petroleum product to the environment. In the EPH method, C9 through C18 aliphatic hydrocarbons are defined and quantitated as compounds which elute from n-nonane (C9) to just before n-nonadecane (C19).
Table 1. Aliphatic Hydrocarbon Standard
Carbon Number Compound Retention Time (min.)1
9 n-Nonane 3.14
10 n-Decane 4.55
12 n-Dodecane 7.86
14 n-Tetradecane 11.10
16 n-Hexadecane 14.05
18 n-Octadecane 16.71
19 n-Nonadecane 17.95
20 n-Eicosane 19.14
1-Chloro-octadecane Surrogate 20.13
5-alpha-androstane Internal Standard 21.25 (estimated)
22 n-Docosane 21.35
24 n-Tetracosane 23.40
26 n-Hexacosane 25.29
28 n-Octacosane 27.04
30 n-Triacontane 28.69
36 n-Hexatriacontane 34.82 1 Results obtained using the column and chromatographic conditions described
in Sections 6.4 and 9.5, respectively.
____________________________________________________________________________ Extractable Petroleum Hydrocarbons Revision 1.1 MADEP-EPH-04 Page 5 May 2004
Table 2. Aromatic Hydrocarbon Standard/Target PAH Analytes
Compound
Retention
Time (min.)1
MDL2
Water (µg/L)
Soil (mg/kg)
Naphthalene 7.66 0.14 0.09
2-Methylnaphthalene 9.49 0.18 0.09
Acenaphthylene 11.93 0.14 0.09
Acenaphthene 12.46 0.16 0.09
Fluorene 13.89 0.25 0.09
Phenanthrene 16.54 0.31 0.16
Anthracene 16.66 0.30 0.16
Ortho-Terphenyl (surrogate) 17.95 0.31 0.13
Fluoranthene 19.92 0.47 0.16
Pyrene 20.51 0.47 0.16
Benzo(a)Anthracene 24.08 0.60 0.19
Chrysene 24.21 0.60 0.19
Benzo(b)Fluoranthene 26.94 0.60 0.19
Benzo(k)Fluoranthene 27.02 0.66 0.16
Benzo(a)Pyrene 27.66 0.50 0.16
Indeno(1,2,3-cd)Pyrene3 30.25 0.41 0.13
(a,h)Anthracene3 30.36 0.44 0.13
Benzo(g,h,i)Perylene 30.76 0.57 0.13 1 Results obtained using the column and chromatographic conditions described in
Sections 6.4 and 9.5, respectively. 2 Single laboratory MDL study; see Appendix 1 for more details. 3 Indeno(1,2,3-cd)Pyrene and Dibenzo(a,h)Anthracene may co-elute under the column
and chromatographic conditions described in Sections 6.4 and 9.5, respectively.
3.5 C19 through C36 Aliphatic Hydrocarbons are defined as all aliphatic hydrocarbon compounds which contain between 19 and 36 carbon atoms and are associated with the release of a petroleum product to the environment. In the EPH method, C19 through C36 aliphatic hydrocarbons are defined and quantitated as compounds, which elute from n-nonadecane (C19) to just after hexatriacontane (C36).
3.6 C11 through C22 Aromatic Hydrocarbons are defined as all aromatic hydrocarbon compounds which
contain between 11 and 22 carbon atoms and are associated with the release of a petroleum product to the environment. In the EPH method, C11 through C22 aromatic hydrocarbons are defined and quantitated as compounds which elute from naphthalene to just after benzo(g,h,i)perylene, excluding Target PAH Analytes.
3.7 Calibration Standards are defined as a series of standard solutions prepared from dilutions of a stock
standard solution, containing known concentrations of each analyte and surrogate compound of interest.
____________________________________________________________________________ Extractable Petroleum Hydrocarbons Revision 1.1 MADEP-EPH-04 Page 6 May 2004
3.8 Continuing Calibration Standard is defined as a calibration standard used to periodically check the calibration state of an instrument. The continuing calibration standard is prepared from the same stock standard solution as calibration standards, and is generally one of the mid-level range calibration standard dilutions.
3.9 Diesel PAH Analytes are defined as naphthalene, 2-methylnaphthalene, phenanthrene, and
acenaphthene, and are a subset of Target PAH Analytes. For most sites known to be contaminated by a release of diesel and/or #2 fuel oil only, Diesel PAH Analytes will be the only Target PAH Analytes of interest.
3.10 Extractable Petroleum Hydrocarbons (EPH) are defined as collective fractions of hydrocarbon
compounds eluting from n-nonane to n-hexatriacontane, excluding Target PAH Analytes. EPH is comprised of C9 through C18 Aliphatic Hydrocarbons, C19 through C36 Aliphatic Hydrocarbons, and C11 through C22 Aromatic Hydrocarbons.
3.11 Field Duplicates are defined as two separate samples collected at the same time and place under identical
circumstances and managed the same throughout field and laboratory procedures. Analyses of field duplicates give a measure of the precision associated with sample collection, preservation and storage, as well as laboratory procedures.
3.12 Fractionation Surrogate Standards are compounds that are added to sample extracts immediately prior to
fractionation at known concentrations to evaluate fractionation efficiency. 3.13 Initial Calibration Verification (ICV) Standard is defined as a mid-range standard prepared from a
separate source than used for the initial and continuing calibration standards. The analysis of an ICV must be performed when a separate source standard is not used for the preparation of the laboratory control sample and matrix spike sample.
3.14 Internal Standard (IS) is a compound added to every calibration standard, blank, matrix spike, sample (for
VOAs), sample extract (for semi-volatiles) at a known concentration, prior to analysis. ISs are used as the basis for quantitation of the method’s target analytes.
3.15 Laboratory Control Sample (LCS) is defined as a reagent water blank (when associated with aqueous
samples) or clean sand blank (when associated with soil/sediment samples) fortified with a matrix spiking solution. The LCS is prepared and analyzed in the same manner as the samples and its purpose is to determine the bias of the analytical method.
3.16 Laboratory Control Sample Duplicate (LCSD) is defined as a reagent water blank (when associated with
aqueous samples) or clean sand blank (when associated with soil/sediment samples) fortified with a matrix spiking solution separately prepared, processed and analyzed in the same manner as the LCS. The analysis of LCS duplicates gives a measure of the precision associated with laboratory procedures, but not with sample collection, preservation, or storage procedures.
3.17 Laboratory Method Blank is defined as an aliquot of reagent water (when associated with aqueous
samples) or clean sand (when associated with soil/sediment samples) spiked with a surrogate standard. The laboratory method blank is prepared and analyzed in the same manner as a sample, exposed to all glassware, solvents, reagents, and equipment. A laboratory method blank is prepared and analyzed with every batch of samples, to determine if method analytes or other interferences are present in the laboratory environment, reagents, or equipment.
3.18 Matrix Duplicates are defined as split samples prepared and analyzed separately with identical procedures.
For soil/sediment samples, matrix duplicate samples are taken from the same sampling container. For aqueous samples, a separate container is used for the matrix duplicate sample. The analysis of matrix duplicates gives a measure of the precision associated with laboratory procedures, but not with sample collection, preservation, or storage procedures.
3.19 Matrix Spike (MS) Sample is defined as an environmental sample which has been spiked with a matrix
spiking solution containing known concentrations of method analytes. The purpose of the MS sample is to determine whether the sample matrix contributes bias to the analytical results. The background concentrations of the analytes in the sample matrix must be determined through the separate analyses of an
____________________________________________________________________________ Extractable Petroleum Hydrocarbons Revision 1.1 MADEP-EPH-04 Page 7 May 2004
unspiked sample aliquot. The measured values in the MS sample must be corrected for background concentrations when calculating recoveries of spiked analytes.
3.20 Matrix Spiking Solution is defined as a solution prepared from a separate source than used for the
calibration standards, containing known concentrations of method analytes. 3.21 System Solvent Blank is defined as an aliquot of a method solvent (e.g., hexane or methylene chloride,
pesticide-grade or better) that is directly injected into the GC system. The System Solvent Blank provides one way of determining the level of noise and baseline rise attributable solely to the analytical system, in the absence of any other analytes or non-analytical related contaminants.
3.22 Surrogate Standards are compounds spiked into all samples, blanks, LCSs, and matrix spikes to monitor the
efficacy of sample extraction, chromatographic, and calibration systems.
3.23 Target PAH Analytes are defined as the 17 polynuclear aromatic hydrocarbon (PAH) compounds listed in Table 2.
3.24 Total Petroleum Hydrocarbons (TPH) are defined as the collective concentration of all hydrocarbon
compounds eluting from n-nonane to n-hexatriacontane, excluding Target PAH Analytes. TPH is equivalent to the summation of C9 through C18 Aliphatic Hydrocarbons, C19 through C36 Aliphatic Hydrocarbons, and C11 through C22 Aromatic Hydrocarbons.
3.25 Unadjusted C11 through C22 Aromatic Hydrocarbons are defined as all aromatic hydrocarbon compounds
eluting from naphthalene through benzo(g,h,i)perylene.
3.26 Unadjusted TPH is defined as the collective concentration of all hydrocarbon compounds eluting from n-nonane to n-hexatriacontane, including the Target PAH Analytes.
3.27 All other terms are as defined in the most current version of SW-846, "Test Method for Evaluating Solid
Waste", USEPA. 4.0 INTERFERENCES
4.1 Method interferences are reduced by washing all glassware with hot soapy water and then rinsing with warm tap water, acetone, and methylene chloride.
4.2 High purity reagents must be used to minimize interference problems.
4.3 Cross-contamination can occur whenever a low-concentration sample is analyzed immediately after a high-
concentration sample. To reduce carryover, the sample syringe must be rinsed between samples with solvent. Whenever an unusually concentrated sample is encountered, it must be followed by the analysis of a system solvent blank to check for cross-contamination. However, due to the potential for samples to be analyzed using an autosampler, the ability to perform this blank analysis may not always be possible. If the sample analyzed immediately after the unusually concentrated sample is free from contamination, then the assumption can be made that carryover or cross-contamination is not an issue. However, if this sample did detect analytes which were present in the unusually concentrated sample, reanalysis is required for all samples analyzed after this highly concentrated sample which detected similar analytes.
4.4 Matrix interferences may be caused by contaminants that are coextracted from the sample. The extent of matrix
interference will vary considerably from one source to another depending upon the nature and complexity of the site being sampled. A silica gel SPE cleanup procedure is used to overcome many of these interferences, but some samples may require additional and more rigorous cleanup procedures which are beyond the scope of this method.
4.5 Other organic contaminants commingled with petroleum product releases, including chlorinated hydrocarbons,
phenols, and phthalate esters, will be quantitated as Total and Extractable Petroleum Hydrocarbons. If necessary and/or desirable, additional sample cleanup and/or analytical procedures may be employed to minimize or document the presence of such compounds.
4.6 The leaching of plasticizers and other compounds have been observed from commercially available silica gel
cartridges used to fractionate EPH sample extracts. Concerns of this nature must be continuously monitored and
____________________________________________________________________________ Extractable Petroleum Hydrocarbons Revision 1.1 MADEP-EPH-04 Page 8 May 2004
documented by analysis of Laboratory Method Blanks. Section 9.2 provides a procedure to eliminate or minimize this contamination.
4.7 Because of their weakly polar nature, naphthalene and substituted naphthalenes readily mobilize into the aliphatic extract if excessive amounts of hexane are used to elute the silica gel cartridge/column. Because these compounds constitute a significant percentage of the water-soluble fraction of fuel oils, this occurrence is especially problematic in the analysis of water samples. For this reason, the method requires the evaluation of the aliphatic fraction for the presence of naphthalene and 2-methylnaphthalene in the LCS/LCSD pair on a batch basis. The fractionation surrogate, 2-Bromonaphthalene, is used to monitor sample-specific fractionation efficiency.
5.0 HEALTH AND SAFETY ISSUES The toxicity and carcinogenicity of each reagent used in this method has not been precisely defined. However, each
chemical compound should be treated as a potential health hazard. From this viewpoint, exposure to these chemicals must be reduced to the lowest possible level by whatever means available. The laboratory is responsible for maintaining a current file of Occupational Safety and Health Administration (OSHA) regulations regarding the safe handling of the chemicals specified in this method. A reference file of material safety data sheets (MSDS) should also be made available to all personnel involved in the chemical analysis.
6.0 APPARATUS AND MATERIALS
6.1 The following is a partial list of glassware used for this method:
6.1.1 1-L amber glass bottles 6.1.2 4 oz. (120 mL) amber wide-mouth glass jars
6.1.3 Vials:
10.4.4.6 autosampler: 2-mL glass vials with Teflon-lined rubber crimp caps 10.4.4.6 10-mL vials with Teflon-lined caps
6.1.4 Glass funnels 6.1.5 2-L Separatory funnels with Teflon stopcock (aqueous liquid-liquid extraction only)
6.1.6 Kuderna-Danish apparatus including 10-mL graduated concentrator tube, 500-mL Evaporative
flask, & 3-ball Snyder column
6.1.7 250-mL Erlenmeyer flasks
6.1.8 25-mL graduated cylinder
6.1.9 1-Liter graduated cylinder
6.1.10 100-mL beakers
6.1.11 Class “A” volumetric flasks: 10, 25, 50 and 100-mL
6.1.12 Class “A” volumetric pipets: 1, 5 or 10-mL
6.2 An analytical balance capable of accurately weighing 0.0001 g must be used for weighing standards. A top-loading balance capable of weighing to the nearest 0.1 g must be used for weighing soil/sediment samples.
6.3 An air or nitrogen blowdown apparatus, or equivalent sample concentration apparatus, is required to concentrate
extracts.
6.4 Gas Chromatographic System
6.4.1 Gas Chromatograph: An analytical system incorporating a temperature-programmable oven with the ability to accommodate a capillary column. The following components are also required:

____________________________________________________________________________ Extractable Petroleum Hydrocarbons Revision 1.1 MADEP-EPH-04 Page 9 May 2004
6.4.1.1 Detector: A Flame Ionization Detector (FID) is required. 6.4.1.2 Column: The analytical column must adequately resolve the n-C9 to n-C36 aliphatic
hydrocarbon standard compounds and the Target PAH Analytes listed in Tables 1 and 2, respectively. The recommended analytical column is an RTX-5 capillary column (30-m x 0.32-mm i.d., 0.25-µm film thickness [Restek Corp. or equivalent]).
6.4.1.3 Data Station: The data station must be capable of storing and reintegrating
chromatographic data and must be capable of determining peak areas using a forced baseline projection.
6.4.1.4 Autosampler: An autosampler capable of making 1 to 4 µL injections is recommended.
6.5 Water bath: heated with a concentric ring cover, capable of temperature control (± 2°C). The bath should be
used in a hood.
6.6 Disposable pipets: Pasteur
6.7 Microsyringes: 10-µL, 100-µL, 250-µL, 500-µL, 1000-µL
6.8 Boiling Chips
6.9 Soxhlet, Soxtec or alternative extraction apparatus
6.10 Drying oven
6.11 Dessicator 7.0 REAGENTS AND STANDARDS
7.1 Reagents
7.1.1 Reagent Water: organic free water (ASTM Type I reagent grade water). 7.1.2 Solvents: hexane, methylene chloride, and acetone; pesticide-grade or better. Store away from other
solvents.
7.1.3 Sodium sulfate: (ACS) granular, anhydrous. Purify by heating at 400°C for 4 hours in a shallow tray.
7.1.4 Ottawa and/or masonry sand: free of extractable petroleum hydrocarbons.
7.1.5 Silica Gel (5 - 10 grams), either prepared and packed by the laboratory, or purchased in 5 g/20-mL cartridges from a commercial vendor. Silica gel prepared and packed by the laboratory should be activated at 130ºC for at least 16 hours, and heated to 150-160ºC for several hours before use. Refer to Section 9.2.2 for guidance on the use of silica gel.
NOTE: Leaching of plasticizers and other compounds have been observed from commercially prepared silica gel cartridges, and must be monitored and documented by analyses of Laboratory Method Blanks. Refer to Section 9.2 for a procedure to eliminate or minimize this contamination. NOTE: Silica gel is hygroscopic. Unused cartridges readily absorb moisture from ambient air if not properly sealed. To preclude moisture adsorption, which adversely effects cartridge performance, unused cartridges must be stored in a properly-maintained dessicator prior to use.
7.2 Stock Standard Solutions
Prepare stock standard solutions at approximately 1000 ng/µL, or purchase as certified solutions.
7.2.1 Aromatic Hydrocarbon Standard: The Aromatic Hydrocarbon Standard consists of the 17 PAH compounds listed in Table 2, a surrogate compound (i.e., ortho-terphenyl) and fractionation surrogate compounds. Prepare stock standard solutions by accurately weighing approximately
____________________________________________________________________________ Extractable Petroleum Hydrocarbons Revision 1.1 MADEP-EPH-04 Page 10 May 2004
0.0100 g of pure material. Dissolve the material in methylene chloride and dilute to volume in a 10-mL volumetric flask.
7.2.2 Aliphatic Hydrocarbon Standard: The Aliphatic Hydrocarbon Standard consists of the 14 normal alkanes listed in Table 1, naphthalene, 2-methylnaphthalene, and a surrogate compound (i.e., 1-chloro-octadecane). Prepare stock standard solutions by accurately weighing approximately 0.0100 g of pure material. Dissolve the material in hexane and dilute to volume in a 10-mL volumetric flask.
7.2.3 Stock standard solutions must be replaced after 6 months, or sooner if comparison with check
standards indicates a problem. 7.2.3 Calibration standards are prepared by serial dilution of the stock standard as described in Section
9.7.2.1
7.3 Petroleum Reference Spiking Solution
7.3.1 The Petroleum Reference Spiking Solution consists of an API or commercial diesel fuel standard. Prepare stock standard solutions by accurately weighing approximately 0.02500 g of neat product. Dissolve neat product in acetone and dilute to volume in a 10-mL volumetric flask. An appropriately diluted aliquot of the stock solution may be used to evaluate method performance.
7.4 Surrogate Standards
7.4.1 Surrogate standards are used to monitor the efficiency of sample extraction, chromatographic, and
calibration systems. 7.4.2 The recommended surrogate standards are chloro-octadecane (COD, available from Restek
Corporation, Bellefonte, PA) and ortho-terphenyl (OTP, available from EM Sciences, Gibbstown, NJ). Alternatively, 5-alpha-androstane may also be used as an aliphatic fraction surrogate without qualification.
7.4.3 The surrogate standard COD is prepared by accurately weighing approximately 0.0100 g of pure
material in a 10-mL volumetric flask. Dissolve the material in hexane.
7.4.4 The surrogate standard OTP is prepared by accurately weighing approximately 0.0100 g of pure material in a 10-mL volumetric flask. Dissolve the material in methylene chloride.
7.4.5 Surrogate Spiking Solution: The recommended surrogate spiking solution is comprised of a mixture
of the COD and OTP surrogate standards. Prepare a surrogate spiking solution which contains the surrogate standards at a concentration of 40 ng/µL in acetone or methanol. Each sample, blank, and matrix spike is fortified with 1.0 mL of the surrogate spiking solution. The use of higher concentrations are permissible and advisable when spiking highly contaminated samples.
7.5 Fractionation Surrogate Standards
7.5.1 The fractionation surrogate standards are added to the sample (hexane) extract just prior to
fractionation. The purpose of the fractionation surrogate standards is to monitor the efficiency of the fractionation process, and ensure that unacceptable quantities of naphthalene and substituted naphthalenes are not being eluted into the aliphatic extract.
7.5.2 The recommended fractionation surrogate standard is 2-Bromonaphthalene. Other alternative
fractionation surrogate compounds, including 2-Fluorobiphenyl are permissible, provided that a demonstration is made that such compounds exhibit polarities/fractionation properties similar to naphthalene.
7.5.3 The fractionation surrogate standards are prepared by accurately weighing approximately 0.0100
g of pure material in a 10-mL volumetric flask. Dissolve the material in Methylene Chloride. 7.5.4 Fractionation Surrogate Spiking Solution: is comprised of 2-Bromonaphthalene and 2-
Fluorobiphenyl (optional) prepared in hexane at concentrations of 40 ng/µL. An aliquot of 1 mL of the fractionation surrogate spiking solution is added to the 1 mL EPH sample extract prepared
____________________________________________________________________________ Extractable Petroleum Hydrocarbons Revision 1.1 MADEP-EPH-04 Page 11 May 2004
in accordance with the provisions of Sections 9.1.1 and 9.1.2. Alternative concentrations/volumes of the fractionation surrogate spiking solution are permissible.
7.6 Internal Standards (ISs)
7.6.1 Internal standards are compounds with similar physical and chemical properties, and chromatographic compatibility with an analytical method’s target analytes. ISs are added to all samples, both for analysis and quality control, at a known concentration and carried through the entire analytical process (extraction and analysis). Internal standards are used as the basis for quantification of target analyte compounds (and ranges) for the applied analytical method. For the EPH Method, ISs are only utilized when GC/MS is utilized for quantification.
7.6.2 The recommended internal standard for the EPH Method is 5-alpha-androstane (EM Sciences,
Gibbstown, NJ) when a modified SW-846 8270C is used to quantify the Target PAH Analytes and the fractionated aliphatic and/or aromatic range concentrations using GC/MS. Alternatively, 1-Chloro-octadecane (COD) may also be used as an internal standard for GC/MS analysis.
7.6.3 The internal standard is prepared by accurately weighing approximately 0.0500 grams of pure
material in a 10-mL volumetric flask. Dissolve the material in methylene chloride or hexane.
7.6.4 An aliquot of 10 µL of the internal standard stock standard is added to the 1 mL EPH sample extract prepared in accordance with Section 9.3. Alternative concentrations/volumes of the internal standard spiking solution are permissible.
7.7 Matrix Spiking Solution
7.7.1 Analytes from each hydrocarbon group (i.e., aromatic and aliphatic hydrocarbons) are used in a
matrix spiking solution, which is prepared using a separate source from the calibration standards. 7.7.2 The spiking solution, consisting of all normal alkanes in Table 1 and all PAHs in Table 2, is
prepared in methanol or acetone at concentrations between 50 - 150 ng/µL (The concentration should be between the mid and upper level of calibration).
7.7.3 The samples selected as the matrix spike are fortified with 1.0 mL of the matrix spiking solution.
Analytical Note: The Matrix Spiking Solution should always be brought to room temperature before
use to avoid dissolution of the highest boiling (marginal solubility) hydrocarbon standards.
7.8 Fractionation Check Solution
7.8.1 The Fractionation Check Solution is used to monitor the fractionation efficiency of the silica gel
cartridge/column, and establish the optimum hexane volume required to efficiently elute aliphatic hydrocarbons while not allowing significant aromatic hydrocarbon breakthrough.
7.8.2 Prepare a Fractionation Check Solution in hexane containing 200 ng/µL of the Aliphatic
Hydrocarbon standard (C9-C36 alkanes) and 200 ng/µL of the Aromatic Hydrocarbon standard (Target PAH Analytes). The final solution will contain 14 alkanes and 17 PAHs at concentrations of 200 ng/µL each. Alternative concentrations are permissible.
8.0 SAMPLE COLLECTION, PRESERVATION, AND HANDLING
8.1 Aqueous Samples
8.1.1 It is good practice to instruct field personnel to collect aqueous samples in duplicate. Samples must be collected in 1 liter amber glass bottles with Teflon-lined screw caps.
8.1.2 Aqueous samples must be preserved at the time of sampling by the addition of a suitable acid to
reduce the pH of the sample to less than 2.0. This may be accomplished by the addition of 5 mL of 1:1 HCl to a 1 liter sample. The uses of alternative acids are permissible. Following collection and addition of acid, the sample must be cooled to 4± 2° C.
____________________________________________________________________________ Extractable Petroleum Hydrocarbons Revision 1.1 MADEP-EPH-04 Page 12 May 2004
8.1.3 A chain of custody form must accompany all sample bottles and must document the date and time of
sample collection and preservation method used. The laboratory must determine the pH of all water samples as soon as possible after sample receipt and prior to sample extraction. Any sample found to contain a pH above 2 must be so noted on the laboratory/data report sheet and the pH must be adjusted as soon as possible.
8.1.4 Any sample received by the laboratory that is not packed in ice or cooled to 4± 2° C must be so
noted on the laboratory/data report sheet. The temperature of the cooler must be recorded by the laboratory upon receipt.
8.1.5 Aqueous samples must be extracted within 14 days of collection, and analyzed within 40 days of extraction.
8.2 Soil/Sediment Samples
8.2.1 Soil and sediment samples are collected in 4 oz. (120 mL) amber wide-mouth glass jars with Teflon-
lined screw caps. 8.2.2 Soil and sediment samples must be cooled to 4 ± 2° C immediately after collection.
8.2.3 A chain of custody form must accompany all sample bottles and must document the date and time of
sample collection and preservation method used.
8.2.4 Any sample received by the laboratory that is not packed in ice or cooled to 4±2° C must be so noted on the laboratory/data report sheet. The temperature of the cooler must be recorded by the laboratory upon receipt.
8.2.5 Soil and sediment samples must be extracted within 14 days of collection, and analyzed within 40
days of extraction.
8.2.6 Alternatively, samples may be frozen (- 10°C) in the field or in the laboratory. Samples frozen in the laboratory must be preserved at 4 ± 2° C from the time of sampling and frozen within 48 hours.
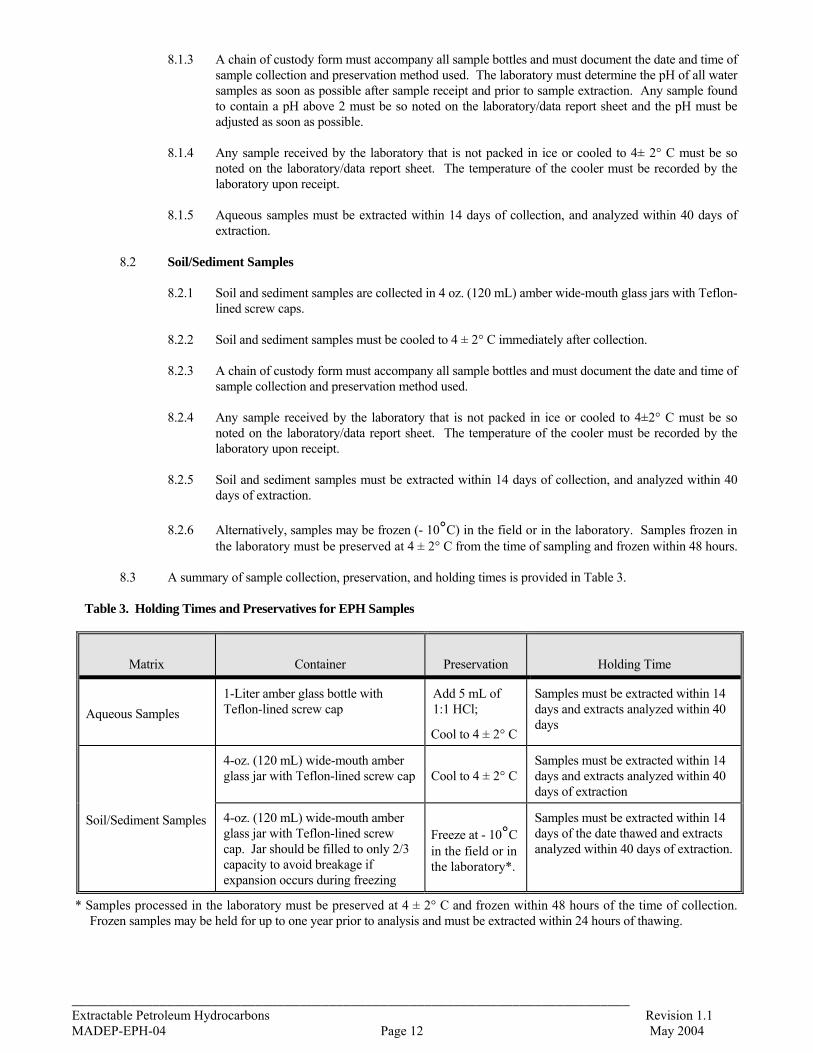
8.3 A summary of sample collection, preservation, and holding times is provided in Table 3. Table 3. Holding Times and Preservatives for EPH Samples
Matrix
Container
Preservation
Holding Time
Aqueous Samples
1-Liter amber glass bottle with Teflon-lined screw cap
Add 5 mL of 1:1 HCl;
Cool to 4 ± 2° C
Samples must be extracted within 14 days and extracts analyzed within 40 days
Soil/Sediment Samples
4-oz. (120 mL) wide-mouth amber glass jar with Teflon-lined screw cap Cool to 4 ± 2° C
Samples must be extracted within 14 days and extracts analyzed within 40 days of extraction
4-oz. (120 mL) wide-mouth amber glass jar with Teflon-lined screw cap. Jar should be filled to only 2/3 capacity to avoid breakage if expansion occurs during freezing
Freeze at - 10°C in the field or in the laboratory*.
Samples must be extracted within 14 days of the date thawed and extracts analyzed within 40 days of extraction.
* Samples processed in the laboratory must be preserved at 4 ± 2° C and frozen within 48 hours of the time of collection. Frozen samples may be held for up to one year prior to analysis and must be extracted within 24 hours of thawing.

____________________________________________________________________________ Extractable Petroleum Hydrocarbons Revision 1.1 MADEP-EPH-04 Page 13 May 2004
9.0 SAMPLE ANALYSIS OF EXTRACTABLE PETROLEUM HYDROCARBONS (EPH)
9.1 Overview of Sample Extraction Procedures
Samples are extracted using methylene chloride and solvent-exchanged into hexane. EPH extraction may be accomplished manually or by automated methods. In this Section a detailed description of manual separatory funnel liquid-liquid extraction for aqueous samples (SW-846 Method 3510) and the Soxhlet extraction procedure (SW-846 Method 3540) for soils and/or sediments are presented to demonstrate general extraction concepts for petroleum products. The applicable SW-846 Method should be consulted for specific details for the other approved EPH extraction procedures NOTE: For optimum performance, the sample volumes/weights, solvent volumes, and final extract volumes cited in Sections 9.1.1 and 9.1.2 are recommended. Alternate volumes can be used as long as comparable reporting limits are achieved. The complete list of approved EPH extraction procedures for water and soil/sediment samples is presented in Table 4. Alternative extraction procedures other than those listed are acceptable, provided that the laboratory can document acceptable matrix- and petroleum product-specific performance. However, use of an alternative extraction procedure is considered a “significant modification” of the EPH method pursuant to Section 11.3.1.1 and as such would preclude obtaining “presumptive certainty” status for any analytical data produced using an alternative EPH extraction procedure Table 4 - Approved EPH Extraction Methods
SW-846 Method Matrix Description
3510C Aqueous Separatory Funnel liquid-Liquid Extraction 3520C Aqueous Continuous Liquid-Liquid Extraction 3511 Aqueous Organic Compounds in Water by Microextraction
3540C Soil/Sediment Soxhlet Extraction 3541 Soil/Sediment Automated Soxhlet Extraction
3545A Soil/Sediment Pressurized Fluid Extraction (PFE) 3546 Soil/Sediment Microwave Extraction 3570 Soil/Sediment Microscale Solvent Extraction (MSE)
3550C Contaminated Solids 1 Ultrasonic Extraction 3580A NAPL Solvent Dilution
1. Sonication may only be used for the extraction of highly contaminated (free product) non-soil/sediments (debris). Any other use of ultrasonic extraction is considered a “significant modification” of the EPH Method.
9.1.1 Water Extraction by Separatory Funnel Liquid-Liquid Extraction
9.1.1.1 Mark the meniscus on the 1 liter sample bottle (for later volume determination) and
transfer the contents to a 2-liter separatory funnel. For blanks and quality control samples, pour 1 liter of reagent water into the separatory funnel. For all samples, blanks, LCSs, LCSDs and matrix spikes add 1.0 mL of the concentrated surrogate spiking solution (see Section 7.4) directly to the separatory funnel. For samples selected for spiking, also add 1.0 mL of the matrix spiking solution.
9.1.1.2 Check the pH of the sample with wide-range pH paper. Note the pH in the laboratory
notebook. The pH of the sample must be adjusted to pH <2.
9.1.1.3 Add 60 mL methylene chloride to the sample bottle to rinse the inner walls of the container, then add this solvent to the separatory funnel.
9.1.1.4 Seal and shake the separatory funnel vigorously for at least three (3) minutes with periodic
venting to release excess pressure.
NOTE: Methylene chloride creates excessive pressure very rapidly; therefore, venting should be done immediately after the separatory funnel has been sealed and shaken once.
____________________________________________________________________________ Extractable Petroleum Hydrocarbons Revision 1.1 MADEP-EPH-04 Page 14 May 2004
9.1.1.5 Allow the organic layer to separate from the water phase for a minimum of 5 minutes. If
the emulsion interface between layers is more than one-third the size of the solvent layer, the analyst must employ mechanical techniques to complete the phase separation. The optimum technique depends upon the sample and may include stirring, filtration of the emulsion through glass wool, centrifugation, or other physical methods. Collect the solvent extract in an Erlenmeyer flask.
9.1.1.6 Repeat the extraction two more times using additional 60 mL portions of solvent.
Combine the three solvent extracts in a 250-mL Erlenmeyer flask. (Steps 9.1.1.3 to 9.1.1.5)
9.1.1.7 For sample volume determination add water to the sample bottle to the level of the
meniscus previously marked and transfer this water to a graduated cylinder.
9.1.1.8 Assemble a Kuderna-Danish (K-D) concentrator by attaching a 10-mL concentrator tube to a 500-mL evaporation flask.
9.1.1.9 Dry the extract by passing it through a glass powder funnel containing anhydrous sodium
sulfate or other suitable drying agent. Collect the dried extract in a K-D concentrator. Rinse the Erlenmeyer flask, which contained the solvent extract, with 20 to 30 mL of methylene chloride and add it to the funnel to complete the quantitative transfer.
9.1.1.10 Add one or two clean boiling chips to the K-D flask and attach a three ball Snyder column.
Pre-wet the Snyder column by adding about 1 mL of methylene chloride to the top of the column. Place the K-D apparatus on a hot water bath (80-90°C) so that the concentrator tube is partially immersed in the hot water and the entire lower rounded surface of the flask is bathed with hot vapor. Adjust the vertical position of the apparatus and the water temperature as required to complete the concentration in 10 to 20 minutes. At the proper rate of distillation, the balls of the column will actively chatter, but the chambers will not flood. When the apparent volume of liquid reaches 1 mL, remove the K-D apparatus from the water bath and allow it to drain and cool for at least 10 minutes.
9.1.1.11 Exchange the methylene chloride with hexane by adding 50 mL of hexane to the top of the
Snyder column. Concentrate the extract to less than 10 mL, as described in Section 9.1.1.10, raising the temperature of the water bath, if necessary, to maintain proper distillation.
9.1.1.12 Remove the Snyder column and evaporation flask from the 10-mL concentrator tube.
Place the concentrator tube containing the hexane extract onto an air blowdown apparatus. Adjust the extract volume to 1 mL under a gentle stream of nitrogen or air. If the extract is highly colored, forms a precipitate, or stops evaporating, the final volume should be higher. If a TPH analysis is to be conducted, without fractionation, proceed to Section 9.3.3
Analytical Note: Due caution must be exercised during blowdown to avoid losses of the more
volatile (C9 through C12) EPH components. The fractionation extract (or any extract) volume should never be reduced below 1 mL in this or any other step to minimize volatilization losses.
9.1.1.13 Add 1 mL of the concentrated fractionation surrogate (see Section 7.5) spiking solution
to the 1 mL hexane extract. Alternatively, add 20-50 ng each of the fractionation surrogate standards using a microliter syringe (up to 10 uL volume). The concentrated matrix spiking solution ( see Section 7.7) should also be added at this time, as required. Analytical Note: If the latter alternative is exercised, only a single extract will be
available for fractionation unless the spiked extract is further diluted. Such dilution may not be advisable for samples with EPH target analytes or ranges at or near the method’s reporting limit.
____________________________________________________________________________ Extractable Petroleum Hydrocarbons Revision 1.1 MADEP-EPH-04 Page 15 May 2004
9.1.1.14 Record the sample preparation information for the extraction and concentration steps. At a minimum, record the date, sample laboratory number, sample volume, volume and concentration of added surrogates and matrix spike solutions, final extract volume, and any deviations or problems associated with the extraction of the samples.
9.1.1.15 The 2 mL extract (1 mL extract + 1 mL fractionation surrogate) is now ready to be cleaned
and fractionated using either commercially-available or self-packed silica gel SPE cartridges. If cleanup will not be performed immediately, transfer the extract to a Teflon-lined screw-cap vial, label, and refrigerate.
9.1.1.16 For cleanup and fractionation, refer to Section 9.2.
9.1.2. Soil and/or Sediment Extraction using Soxhlet Extraction
9.1.2.1 Blend 10 g of the solid sample with 10 g anhydrous sodium sulfate and place in an extraction thimble. The extraction thimble must drain freely for the duration of the extraction period. Add 1.0 mL of the surrogate spiking solution (see Section 7.4) to all samples, blanks, LCSs, LCSDs and matrix spikes. Thoroughly mix the surrogate spiking solution into the sample. For samples selected for spiking, add 1.0 mL of the matrix spiking solution. Thoroughly mix the matrix spiking solution(s) into the sample.
9.1.2.2 Place 300 mL of methylene chloride into a 500-mL round-bottom flask containing one or two clean
boiling chips. Attach the flask to the extractor and extract the sample for 16-24 hr. Volume of methylene chloride should be adjusted to accommodate the size of the round-bottom flask utilized.
9.1.2.3 Allow the extract to cool after the extraction is completed.
9.1.2.4 Assemble a Kuderna-Danish (K-D) concentrator by attaching a 10-mL concentrator tube to a 500-mL
evaporation flask.
9.1.2.5 Dry the extract by passing it through a glass powder funnel containing anhydrous sodium sulfate or other suitable drying agent. Collect the dried extract in the K-D concentrator. Wash the extractor flask and sodium sulfate column with 100 to 125 mL of methylene chloride to complete the quantitative transfer.
9.1.2.6 Add one or two clean boiling chips to the flask and attach a three-ball Snyder column. Pre-wet the
Snyder column by adding about 1 mL of methylene chloride to the top of the column. Place the K-D apparatus on a hot water bath (80-90°C) so that the concentrator tube is partially immersed in the hot water and the entire lower rounded surface of the flask is bathed with hot vapor. Adjust the vertical position of the apparatus and the water temperature, as required, to complete the concentration in 10 to 20 min. At the proper rate of distillation, the balls of the column will actively chatter, but the chambers will not flood. When the apparent volume of liquid reaches 1 mL, remove the K-D apparatus from the water bath and allow it to drain and cool for at least 10 minutes.
9.1.2.7 Exchange the methylene chloride with hexane by adding 50 mL of hexane to the top of the Snyder
column. Concentrate the extract to less than 10 mL, as described in Section 9.1.2.6, raising the temperature of the water bath, if necessary, to maintain proper distillation.
9.1.2.11 Remove the Snyder column and evaporation flask from the 10-mL concentrator tube. Place the
concentrator tube containing the hexane extract onto an air blowdown apparatus. Adjust the extract volume to 1 mL under a gentle stream of nitrogen or air. If the extract is highly colored, forms a precipitate, or stops evaporating, the final volume should be higher. If a TPH analysis is to be conducted, without fractionation, proceed to Section 9.3.3.
Analytical Note: Due caution must be exercised during blowdown to avoid losses of the more volatile (C9 through C12) EPH components. The fractionation extract (or any extract) volume should never be reduced below 1 mL in this or any other step to minimize volatilization losses.
9.1.2.9 Add 1 mL concentrated fractionation surrogate (see Section 7.5) spiking solution to the 1 mL hexane
extract. Alternatively, add 20-50 ng each of the fractionation surrogate standards using a microliter
____________________________________________________________________________ Extractable Petroleum Hydrocarbons Revision 1.1 MADEP-EPH-04 Page 16 May 2004
syringe (up to 10 uL volume). The concentrated matrix spiking solution should also be added at this time, as required. Analytical Note: If the latter alternative is exercised, only a single extract will be available for
fractionation unless the spiked extract is further diluted. Such dilution may not be advisable for samples with EPH target analytes or ranges at or near the method’s reporting limit.
9.1.2.10 Record the sample preparation information for the extraction and concentration steps. At a minimum,
record the date, sample laboratory number, sample weight, volume and concentration of added surrogates and matrix spike solutions, extraction start and stop times, final extract volume and any deviations or problems associated with the extraction of the samples.
9.1.2.11 The 2 mL extract (1 mL extract + 1 mL fractionation surrogate) is now ready to be cleaned and
fractionated using silica gel SPE. If cleanup will not be performed immediately, transfer the extract to a Teflon-lined screw-cap vial, label, and refrigerate.
9.1.2.12 For cleanup and fractionation, refer to Section 9.2.
9.2 Silica Gel Cleanups and Fractionation
NOTE: The Silica Gel Cleanup and Fractionation step is a critical and highly sensitive procedure. Small changes in the volumes of eluting solvents, fractionation equipment, and/or fractionation techniques can significantly impact the proportion of hydrocarbons segregated in either the aliphatic or aromatic fractions. Considerable care and attention is required to ensure satisfactory results.
9.2.1 Each sample fractionation requires 1 mL of sample extract. Because 2 mL of sample extract are available,
two fractionations may be undertaken for each sample. Refractionation would be necessary if problems are experienced during the initial fractionation effort, if unacceptable breakthrough is noted for naphthalene and 2-methylnaphthalene in the LCS and/or LCSD, and/or if unacceptable recoveries are noted for the fractionation surrogate standard. The extra volume of sample extract is also provided to facilitate initial (unfractionated) TPH screening of a sample, to obtain a GC/FID “fingerprint”, and/or to determine whether sufficient total hydrocarbons are present to warrant fractionation and comparison to risk-based cleanup standards.
9.2.2 Silica gel is a regenerative adsorbent of amorphous silica with weakly acidic properties. It is produced
from sodium silicate and sulfuric acid. Silica gel can be used for column chromatography and is used for separating analytes from interfering compounds of a different chemical polarity. Silica gel is also used to separate petroleum distillates into aliphatic and aromatic fractions.
A 5 g/20 mL Solid Phase Extraction (SPE) silica gel cartridge is commercially available. Alternatively, the use of self-packed columns of activated silica gel may also be used. The use of activated silica gel for general column chromatographic applications is described in detail SW-846 Method 3630C To ensure satisfactory fractionation, silica gel/cartridges must not be overloaded. It is recommended that loading be limited to no more than 5 mg total hydrocarbons/gram silica gel; for a 1 mL extract fractionated on a 5 gram silica gel cartridge, this would equate to a hydrocarbon extract loading of no greater than 25,000 µg/mL. It should be noted that overloading the column may result in a premature breakthrough of the C11-C22 aromatic hydrocarbon range. If overloading is encountered, the sample must be re-fractionated at a dilution appropriate for the column’s maximum loading capacity. Unsealed silica gel/cartridges must be stored in a properly-maintained dessicator to avoid inadvertent adsorption of ambient moisture. Silica gel that has been exposed to moisture may perform erratically resulting in poor performance manifested by naphthalene/2-methylnaphthalene and fractionation surrogate breakthrough.
Analytical Note: Air-drying of the cartridges may adversely affect silica gel performance and is not advised.
____________________________________________________________________________ Extractable Petroleum Hydrocarbons Revision 1.1 MADEP-EPH-04 Page 17 May 2004
9.2.3 If concerns exist over the presence of contaminants in the silica gel/cartridge, pre-rinse the column with
30 mL of methylene chloride. 9.2.3.1 Rinse the column with 30 mL of hexane, or 60 mL if pre-rinsed with methylene chloride
per Section 9.2.3. Let the hexane flow through the column until the head of the liquid in the column is just above the column frit. Close the stopcock to stop solvent flow. Discard the collected hexane.
9.2.3.2 Load 1.0 mL of the combined sample extract and fractionation surrogate solution onto the
column. Open the stopcock, and start collecting elutant immediately in a 25-mL volumetric flask labeled “aliphatics”.
9.2.3.3 Just prior to exposure of the column frit to the air, elute the column with an additional 19
mL of hexane, so that a total of approximately 20 mL of hexane is passed through the column.
It is essential that “plug flow” of the sample extract be achieved through the silica gel cartridge/column. Hexane should be added in 1-2 mL increments or dropwise using a pipet, with additions occurring when the level of solvent drops to the point just prior to exposing the column frit to air. The use of a stopcock is mandatory. Care must be taken to ensure that the silica gel is uniformly packed in the column. The analyst must be cognizant of any channeling, streaking, or changes in the silica gel matrix during fractionation; if any of these occur, the procedure must be repeated with another 1 mL volume of sample extract.
The amount of hexane used during fractionation is critical. Excessive hexane - as little
as 0.5 mL - can cause significant elution of lighter aromatics into the aliphatic fraction. Insufficient hexane will cause low recoveries of the aliphatic fraction. The volume of the hexane fractionation elutriate should not exceed 20 mL.
9.2.3.4 The Fractionation Check Solution described in Section 7.8 must be used to evaluate each
new lot of silica gel /cartridges to re-establish the optimum volume of hexane elutriate. See Appendix 5, Section 5.0 for optimization specifications.
It is not uncommon to encounter inconsistent cartridge weights, mesh sizes and/or variable
fractionation performance within the same lot of silica gel cartridges. It may be advisable to perform additional intra-lot fractionation performance checks particularly for larger lot sizes (500) of silica gel cartridges.
9.2.3.5 Following recovery of the aliphatic fraction, elute the column with 20 mL of methylene
chloride and collect the eluant in a 25 mL volumetric flask. Label this fraction "aromatics".
9. 3 Final Sample Extract Concentration
9.3.1 Transfer the contents of the 25.0 mL “aliphatics” (in hexane) and “aromatics” (in methylene
chloride) volumetric flasks into separate labeled graduated concentrator tubes. Concentrate each of the extracts to a final volume of 1 mL under a gentle stream of air or nitrogen.
Analytical Note: Due caution must be exercised during blowdown to avoid losses of the more volatile (C9
through C12) EPH components. The fractionation extract (or any extract) volume should never be reduced below 1 mL in this or any other step to minimize volatilization losses.
9.3.2 Transfer the final 1 mL extracts from each concentrator tube to labeled two-mL glass autosampler
vials with Teflon-lined rubber crimp caps. If appropriate, add an internal standard at the appropriate concentration.
9.3.3 Proceed with the analysis in accordance with Analyze all laboratory method blanks and QC samples under the same conditions as that used for samples.
9.4 Determination of Percent Moisture
____________________________________________________________________________ Extractable Petroleum Hydrocarbons Revision 1.1 MADEP-EPH-04 Page 18 May 2004
9.4.1 Soil and sediment results must be reported on a dry-weight basis.
9.4.2 Transfer 5 to 10 g of sample into a tared ( ± 0.1 g) crucible and determine “wet weight”. This
sample must be obtained from a vial or container that does not contain methanol. Dry this 5 to 10 g sample overnight at 105°C. Allow crucible to cool in a dessicator and reweigh (± 0.1 g). Re-desiccate and verify “dry weight”. Calculate the percent moisture of the sample using the equations provided in Section 9.9.4 (Equation 9). Refer to ASTM Method D2216, Determination of Moisture Content of Soils and Sediments, for more detailed analytical and equipment specifications.
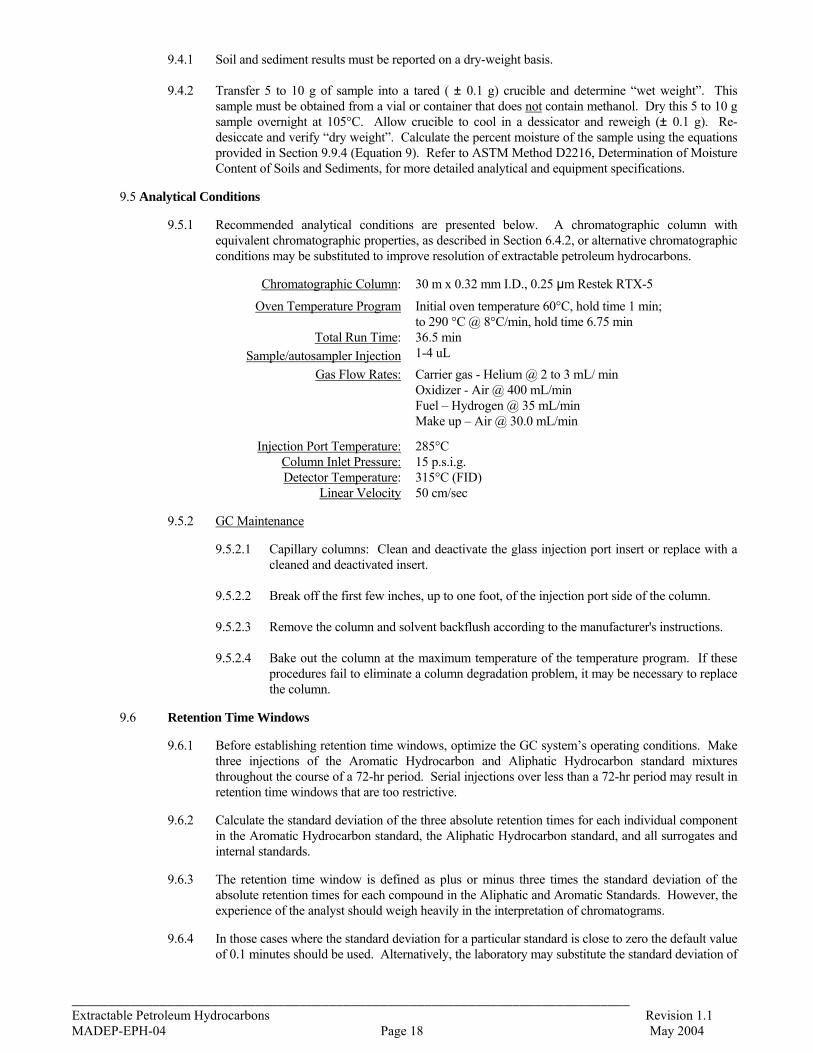
9.5 Analytical Conditions
9.5.1 Recommended analytical conditions are presented below. A chromatographic column with equivalent chromatographic properties, as described in Section 6.4.2, or alternative chromatographic conditions may be substituted to improve resolution of extractable petroleum hydrocarbons.
Chromatographic Column: 30 m x 0.32 mm I.D., 0.25 µm Restek RTX-5
Oven Temperature Program Initial oven temperature 60°C, hold time 1 min; to 290 °C @ 8°C/min, hold time 6.75 min
Total Run Time: 36.5 min
Sample/autosampler Injection 1-4 uL
Gas Flow Rates: Carrier gas - Helium @ 2 to 3 mL/ min Oxidizer - Air @ 400 mL/min Fuel – Hydrogen @ 35 mL/min Make up – Air @ 30.0 mL/min
Injection Port Temperature: 285°C Column Inlet Pressure: 15 p.s.i.g. Detector Temperature: 315°C (FID)
Linear Velocity 50 cm/sec
9.5.2 GC Maintenance
9.5.2.1 Capillary columns: Clean and deactivate the glass injection port insert or replace with a cleaned and deactivated insert.
9.5.2.2 Break off the first few inches, up to one foot, of the injection port side of the column.
9.5.2.3 Remove the column and solvent backflush according to the manufacturer's instructions.
9.5.2.4 Bake out the column at the maximum temperature of the temperature program. If these
procedures fail to eliminate a column degradation problem, it may be necessary to replace the column.
9.6 Retention Time Windows
9.6.1 Before establishing retention time windows, optimize the GC system’s operating conditions. Make three injections of the Aromatic Hydrocarbon and Aliphatic Hydrocarbon standard mixtures throughout the course of a 72-hr period. Serial injections over less than a 72-hr period may result in retention time windows that are too restrictive.
9.6.2 Calculate the standard deviation of the three absolute retention times for each individual component in the Aromatic Hydrocarbon standard, the Aliphatic Hydrocarbon standard, and all surrogates and internal standards.
9.6.3 The retention time window is defined as plus or minus three times the standard deviation of the absolute retention times for each compound in the Aliphatic and Aromatic Standards. However, the experience of the analyst should weigh heavily in the interpretation of chromatograms.
9.6.4 In those cases where the standard deviation for a particular standard is close to zero the default value of 0.1 minutes should be used. Alternatively, the laboratory may substitute the standard deviation of
____________________________________________________________________________ Extractable Petroleum Hydrocarbons Revision 1.1 MADEP-EPH-04 Page 19 May 2004
a closely eluting structurally similar compound to develop a representative statistically-derived retention time window.
9.6.5 The laboratory must calculate retention time windows for each compound in the Aliphatic and Aromatic Standards on each GC column and whenever a new GC column is installed. These data must be retained by the laboratory.
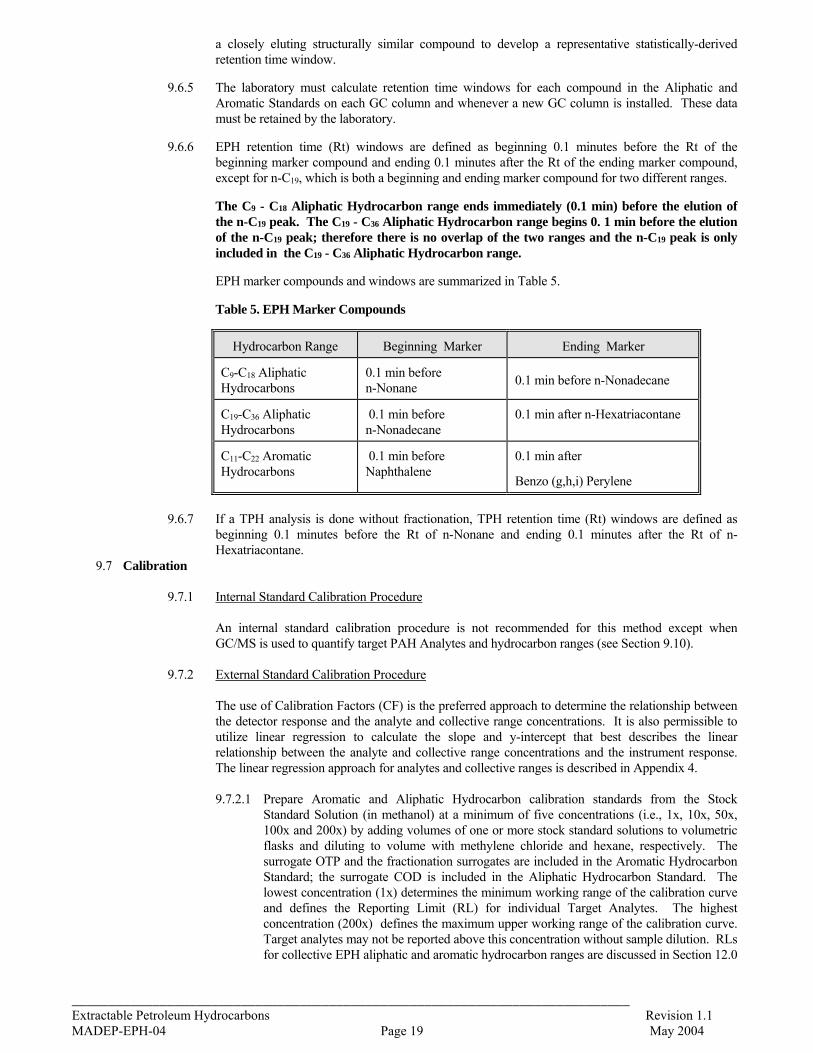
9.6.6 EPH retention time (Rt) windows are defined as beginning 0.1 minutes before the Rt of the beginning marker compound and ending 0.1 minutes after the Rt of the ending marker compound, except for n-C19, which is both a beginning and ending marker compound for two different ranges.
The C9 - C18 Aliphatic Hydrocarbon range ends immediately (0.1 min) before the elution of the n-C19 peak. The C19 - C36 Aliphatic Hydrocarbon range begins 0. 1 min before the elution of the n-C19 peak; therefore there is no overlap of the two ranges and the n-C19 peak is only included in the C19 - C36 Aliphatic Hydrocarbon range.
EPH marker compounds and windows are summarized in Table 5.
Table 5. EPH Marker Compounds
Hydrocarbon Range Beginning Marker Ending Marker
C9-C18 Aliphatic Hydrocarbons
0.1 min before n-Nonane
0.1 min before n-Nonadecane
C19-C36 Aliphatic Hydrocarbons
0.1 min before n-Nonadecane
0.1 min after n-Hexatriacontane
C11-C22 Aromatic Hydrocarbons
0.1 min before Naphthalene
0.1 min after
Benzo (g,h,i) Perylene
9.6.7 If a TPH analysis is done without fractionation, TPH retention time (Rt) windows are defined as
beginning 0.1 minutes before the Rt of n-Nonane and ending 0.1 minutes after the Rt of n-Hexatriacontane.
9.7 Calibration
9.7.1 Internal Standard Calibration Procedure An internal standard calibration procedure is not recommended for this method except when
GC/MS is used to quantify target PAH Analytes and hydrocarbon ranges (see Section 9.10).
9.7.2 External Standard Calibration Procedure
The use of Calibration Factors (CF) is the preferred approach to determine the relationship between the detector response and the analyte and collective range concentrations. It is also permissible to utilize linear regression to calculate the slope and y-intercept that best describes the linear relationship between the analyte and collective range concentrations and the instrument response. The linear regression approach for analytes and collective ranges is described in Appendix 4.
9.7.2.1 Prepare Aromatic and Aliphatic Hydrocarbon calibration standards from the Stock
Standard Solution (in methanol) at a minimum of five concentrations (i.e., 1x, 10x, 50x, 100x and 200x) by adding volumes of one or more stock standard solutions to volumetric flasks and diluting to volume with methylene chloride and hexane, respectively. The surrogate OTP and the fractionation surrogates are included in the Aromatic Hydrocarbon Standard; the surrogate COD is included in the Aliphatic Hydrocarbon Standard. The lowest concentration (1x) determines the minimum working range of the calibration curve and defines the Reporting Limit (RL) for individual Target Analytes. The highest concentration (200x) defines the maximum upper working range of the calibration curve. Target analytes may not be reported above this concentration without sample dilution. RLs for collective EPH aliphatic and aromatic hydrocarbon ranges are discussed in Section 12.0
____________________________________________________________________________ Extractable Petroleum Hydrocarbons Revision 1.1 MADEP-EPH-04 Page 20 May 2004
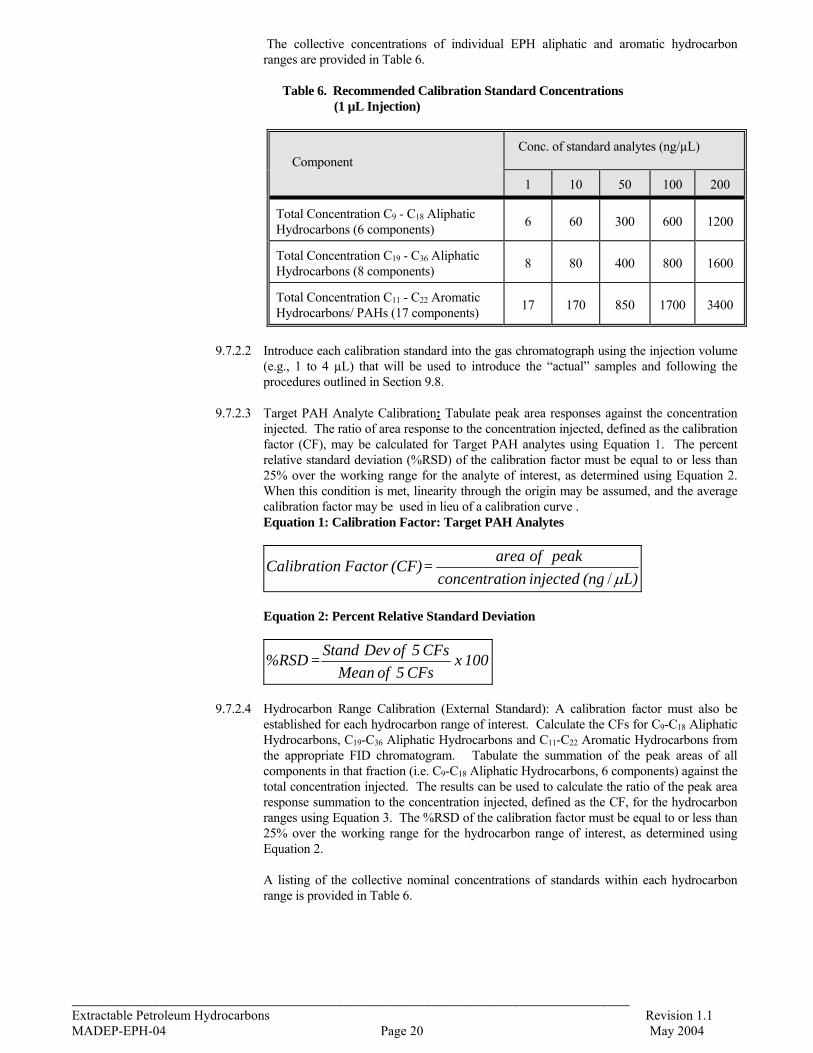
The collective concentrations of individual EPH aliphatic and aromatic hydrocarbon ranges are provided in Table 6.
Table 6. Recommended Calibration Standard Concentrations (1 µL Injection)
Component
Conc. of standard analytes (ng/µL)
1 10 50 100 200
Total Concentration C9 - C18 Aliphatic Hydrocarbons (6 components)
6 60 300 600 1200
Total Concentration C19 - C36 Aliphatic Hydrocarbons (8 components)
8 80 400 800 1600
Total Concentration C11 - C22 Aromatic Hydrocarbons/ PAHs (17 components)
17 170 850 1700 3400
9.7.2.2 Introduce each calibration standard into the gas chromatograph using the injection volume
(e.g., 1 to 4 µL) that will be used to introduce the “actual” samples and following the procedures outlined in Section 9.8.
9.7.2.3 Target PAH Analyte Calibration: Tabulate peak area responses against the concentration
injected. The ratio of area response to the concentration injected, defined as the calibration factor (CF), may be calculated for Target PAH analytes using Equation 1. The percent relative standard deviation (%RSD) of the calibration factor must be equal to or less than 25% over the working range for the analyte of interest, as determined using Equation 2. When this condition is met, linearity through the origin may be assumed, and the average calibration factor may be used in lieu of a calibration curve . Equation 1: Calibration Factor: Target PAH Analytes
L)(ng injected ionconcentrat
peakofarea = (CF) Factor nCalibratio
/
Equation 2: Percent Relative Standard Deviation
100 x CFs 5 of Mean
CFs 5 of Dev Stand= %RSD
9.7.2.4 Hydrocarbon Range Calibration (External Standard): A calibration factor must also be
established for each hydrocarbon range of interest. Calculate the CFs for C9-C18 Aliphatic Hydrocarbons, C19-C36 Aliphatic Hydrocarbons and C11-C22 Aromatic Hydrocarbons from the appropriate FID chromatogram. Tabulate the summation of the peak areas of all components in that fraction (i.e. C9-C18 Aliphatic Hydrocarbons, 6 components) against the total concentration injected. The results can be used to calculate the ratio of the peak area response summation to the concentration injected, defined as the CF, for the hydrocarbon ranges using Equation 3. The %RSD of the calibration factor must be equal to or less than 25% over the working range for the hydrocarbon range of interest, as determined using Equation 2.
A listing of the collective nominal concentrations of standards within each hydrocarbon range is provided in Table 6.
____________________________________________________________________________ Extractable Petroleum Hydrocarbons Revision 1.1 MADEP-EPH-04 Page 21 May 2004
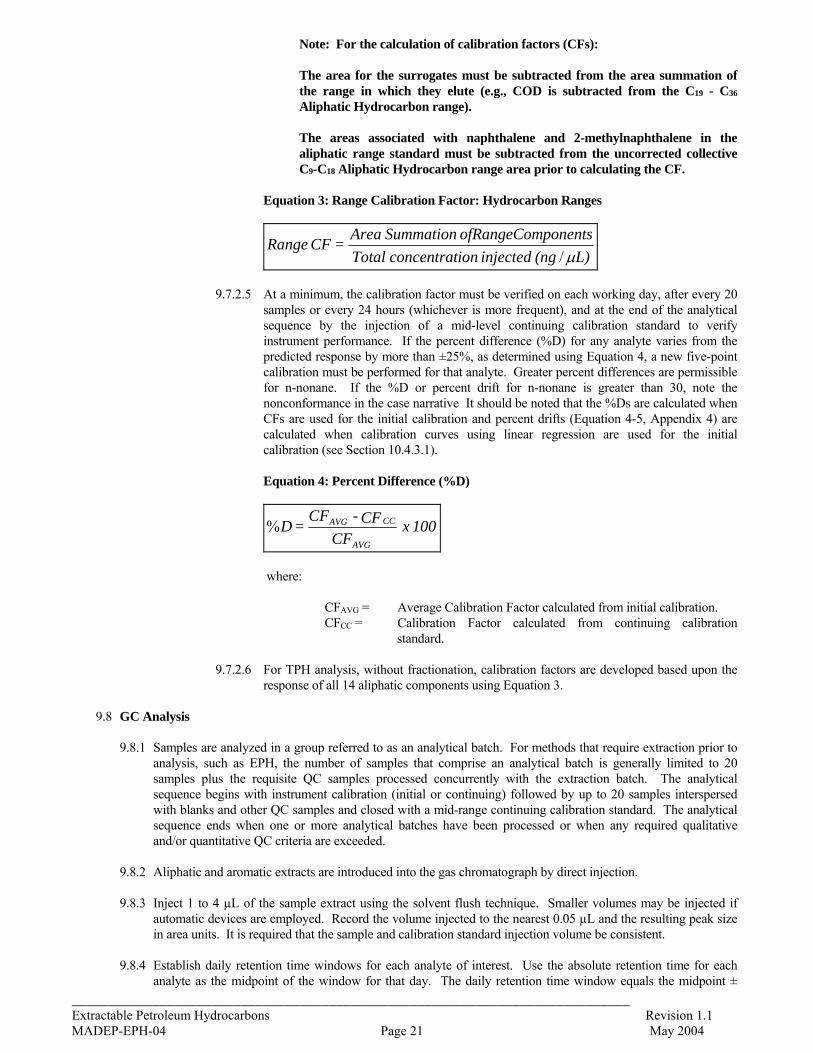
Note: For the calculation of calibration factors (CFs):
The area for the surrogates must be subtracted from the area summation of the range in which they elute (e.g., COD is subtracted from the C19 - C36 Aliphatic Hydrocarbon range). The areas associated with naphthalene and 2-methylnaphthalene in the aliphatic range standard must be subtracted from the uncorrected collective C9-C18 Aliphatic Hydrocarbon range area prior to calculating the CF.
Equation 3: Range Calibration Factor: Hydrocarbon Ranges
L)(ng injected ionconcentrat Total
ponentsofRangeCom SummationArea = CF Range
/
9.7.2.5 At a minimum, the calibration factor must be verified on each working day, after every 20
samples or every 24 hours (whichever is more frequent), and at the end of the analytical sequence by the injection of a mid-level continuing calibration standard to verify instrument performance. If the percent difference (%D) for any analyte varies from the predicted response by more than ±25%, as determined using Equation 4, a new five-point calibration must be performed for that analyte. Greater percent differences are permissible for n-nonane. If the %D or percent drift for n-nonane is greater than 30, note the nonconformance in the case narrative It should be noted that the %Ds are calculated when CFs are used for the initial calibration and percent drifts (Equation 4-5, Appendix 4) are calculated when calibration curves using linear regression are used for the initial calibration (see Section 10.4.3.1).
Equation 4: Percent Difference (%D)
100 x CF
CF - CF = D
AVG
CCAVG%
where: CFAVG = Average Calibration Factor calculated from initial calibration. CFCC = Calibration Factor calculated from continuing calibration
standard.
9.7.2.6 For TPH analysis, without fractionation, calibration factors are developed based upon the response of all 14 aliphatic components using Equation 3.
9.8 GC Analysis
9.8.1 Samples are analyzed in a group referred to as an analytical batch. For methods that require extraction prior to
analysis, such as EPH, the number of samples that comprise an analytical batch is generally limited to 20 samples plus the requisite QC samples processed concurrently with the extraction batch. The analytical sequence begins with instrument calibration (initial or continuing) followed by up to 20 samples interspersed with blanks and other QC samples and closed with a mid-range continuing calibration standard. The analytical sequence ends when one or more analytical batches have been processed or when any required qualitative and/or quantitative QC criteria are exceeded.
9.8.2 Aliphatic and aromatic extracts are introduced into the gas chromatograph by direct injection.
9.8.3 Inject 1 to 4 µL of the sample extract using the solvent flush technique. Smaller volumes may be injected if
automatic devices are employed. Record the volume injected to the nearest 0.05 µL and the resulting peak size in area units. It is required that the sample and calibration standard injection volume be consistent.
9.8.4 Establish daily retention time windows for each analyte of interest. Use the absolute retention time for each
analyte as the midpoint of the window for that day. The daily retention time window equals the midpoint ±

____________________________________________________________________________ Extractable Petroleum Hydrocarbons Revision 1.1 MADEP-EPH-04 Page 22 May 2004
three times the standard deviation determined in Section 9.6. Alternatively, the default value of 0.1 minutes may be used for the daily retention time window.
9.8.4.1 Tentative identification of a Target PAH Analytes occurs when a peak from a sample chromatogram falls
within the daily retention time window. Confirmation on a second GC column or by GC/MS analysis may be necessary, if warranted by project’s data quality objectives.
9.8.4.2 Validation of GC system qualitative performance must be accomplished by the analysis of mid-level
standards within the analysis sequence. If the retention times of the Target PAH Analytes fall outside their daily retention time window in the standards, the system is out of control. In such cases, the cause of the non-conformance must be identified and corrected.
9.8.5 Aliphatic and aromatic ranges of interest are determined by the collective integration of all peaks that elute
between specified range “marker” compounds. Due to the variability in software approaches and applications to collective peak area integration, it is recommended that a manual verification be initially performed to document accurate integration.
9.8.6 When quantifying on a peak area basis by external calibration, collective peak area integration for the
fractional ranges, or TPH, must be from baseline (i.e. must include the unresolved complex mixture "hump" areas). For the integration of individual Target PAH Analytes, surrogate compounds, and internal standards, a valley-to-valley approach should typically be used, though this approach may be modified on a case-by-case basis by an experienced analyst. In any case, the unresolved complex mixture “hump” areas must not be included in the integration of individual Target PAH Analytes, surrogate compounds, and internal standards.
9.8.7 Baseline correction using a system solvent blank is only permissible for the calculation of aliphatic and aromatic
hydrocarbon range concentrations when conducted in accordance with the procedures and requirements specified in Section 11.2.5.
9.8.8 If the Target or Diesel PAH Analytes are to be quantitated using this method, and the response for an individual
analyte exceeds the highest calibration concentration, dilute the extract and reanalyze. The samples must be diluted so that all peaks fall within the calibration range of the detector and are bracketed by upper and lower calibration standards.
9.8.9 For non-target analytes eluting in the aliphatic, aromatic or TPH fractions, the upper linear range of the system
should be defined by peak height measurement, based upon the maximum peak height documented for an aliphatic or aromatic standard within the fraction that is shown to be within the linear range of the detector.
9.8.10 Analytical conditions that require sample dilution include;
1. The concentration of one or more of the target analytes exceed the concentration of their respective highest calibration standard,
2. Any non-target peak eluting within any aliphatic or aromatic range exceeds twice the peak height documented for the highest range-specific calibration standard, or
3. Anytime a saturated chromatographic peak (flat-topped peak) is encountered When sample extracts are diluted, the Reporting Limit (RL) for each target analyte and/or range must be adjusted (increased) in direct proportion to the Dilution Factor (DF). Where:
And the revised RL for the diluted sample, RLd:
RLd = DF X Lowest Calibration Standard for Target PAH Analyte (or hydrocarbon range)
It should be understood that samples with elevated RLs as a result of a dilution may not be able to satisfy “MCP program” reporting limits in some cases if the RLd is greater than the applicable MCP standard or criterion to which the concentration is being compared. Such increases in RLs are the unavoidable but
DF = Sample Extract Volume (mL) + Diluent Volume (mL)
Sample Extract Volume (mL)

____________________________________________________________________________ Extractable Petroleum Hydrocarbons Revision 1.1 MADEP-EPH-04 Page 23 May 2004
acceptable consequence of sample extract dilution that enable quantification of target analytes which exceed the calibration range. All dilutions must be fully documented in the analytical report.
Analytical Note: Over dilution is an unacceptable laboratory practice. The target post-dilution concentration for the highest concentration target analyte should be at least 60 - 80% (must be at least 50%) of its highest calibration standard. This will avoid unnecessarily high reporting limits for other target analytes, which did not require dilution.
9.9 Calculations
9.9.1 External Standard Calibration
The concentration of Target PAH Analytes and hydrocarbon ranges in a sample may be determined by calculating the concentration of the analyte or hydrocarbon range injected, from the peak area response, using the calibration factor determined in Section 9.7.2. If linear regression is used for calibration, refer to Appendix 4 for sample concentration calculations.
9.9.2 Aqueous Samples (External standard):
The concentration of a specific analyte or hydrocarbon range in an aqueous sample may be calculated using Equations 5 and 6, respectively.
Equation 5: Aqueous Samples (Target PAH Analytes: External Standard)
)(
)(
s
tx
V(CF)
V(D))A( = g/L)( Analyte Conc
Equation 6: Aqueous Samples (Hydrocarbon Ranges and TPH: External Standard)
)(
)(
s
tx
VCF) (Range
V(D))A( = g/L)(TPHor Range HC Conc
where:
Ax = Response for the analyte, hydrocarbon range, or TPH in the sample. Units must be in area counts for Target PAH Analytes and must be an area count summation for the hydrocarbon ranges and TPH.
D = Dilution factor*; dimensionless. CF = Average Calibration Factor for Target PAH Analyte, determined
in Section 9.7.2.3 Range CF = Average Calibration Factor for hydrocarbon range or TPH,
determined in Section 9.7.2.4 or 9.7.2.5 respectively. Vt = Volume of total extract, µL (fractionation + surrogate volume) Vs = Volume of sample extracted, mL.
Non-aqueous samples (External Standard):
The concentration of a specific analyte or hydrocarbon range in a non-aqueous sample may be
calculated using Equations 7 and 8, respectively. Equation 7: Non-Aqueous Samples (Target PAH Analytes: External Standard)
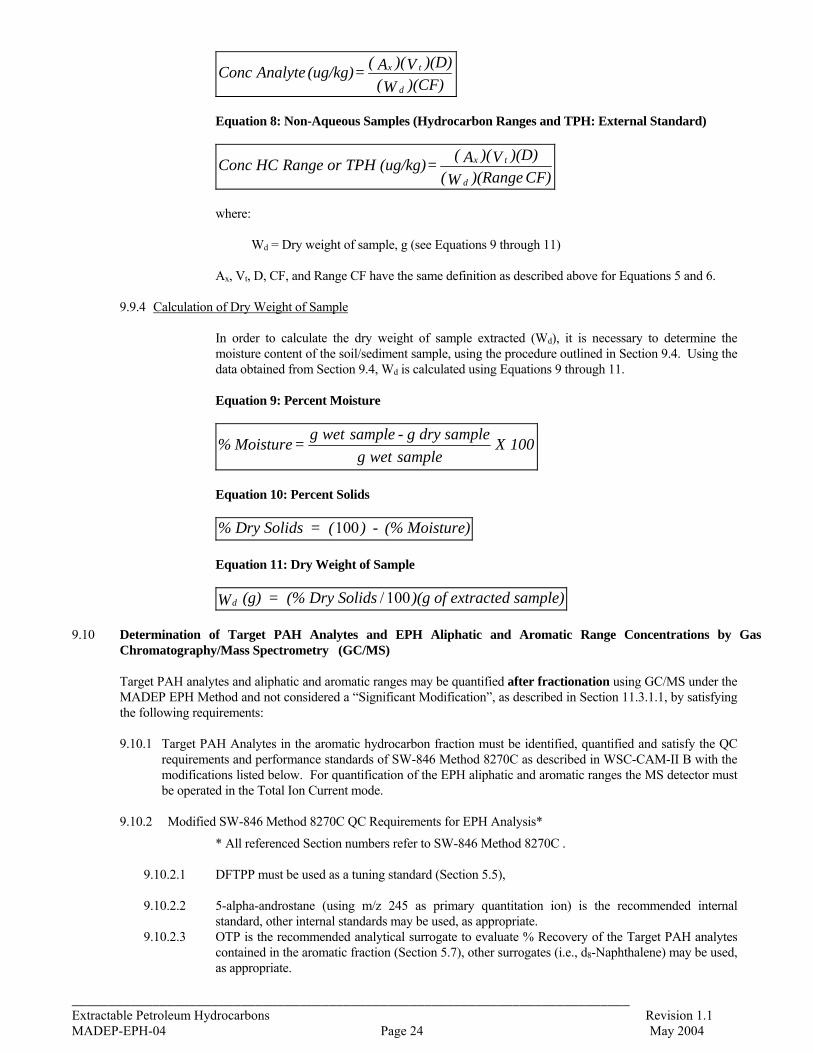
____________________________________________________________________________ Extractable Petroleum Hydrocarbons Revision 1.1 MADEP-EPH-04 Page 24 May 2004
)(CF)W(
)(D)V)(A( = (ug/kg) Analyte Conc
d
tx
Equation 8: Non-Aqueous Samples (Hydrocarbon Ranges and TPH: External Standard)
CF) )(RangeW(
)(D)V)(A( = (ug/kg) TPHorRange HC Conc
d
tx
where: Wd = Dry weight of sample, g (see Equations 9 through 11)
Ax, Vt, D, CF, and Range CF have the same definition as described above for Equations 5 and 6.
9.9.4 Calculation of Dry Weight of Sample
In order to calculate the dry weight of sample extracted (Wd), it is necessary to determine the moisture content of the soil/sediment sample, using the procedure outlined in Section 9.4. Using the data obtained from Section 9.4, Wd is calculated using Equations 9 through 11.
Equation 9: Percent Moisture
100 X sample wetg
dry sample g-sample wetg = Moisture%
Equation 10: Percent Solids
% Dry Solids = ( ) - (% Moisture)100
Equation 11: Dry Weight of Sample
dW (g) = (% Dry Solids )(g of extracted sample)/ 100
9.10 Determination of Target PAH Analytes and EPH Aliphatic and Aromatic Range Concentrations by Gas
Chromatography/Mass Spectrometry (GC/MS)
Target PAH analytes and aliphatic and aromatic ranges may be quantified after fractionation using GC/MS under the MADEP EPH Method and not considered a “Significant Modification”, as described in Section 11.3.1.1, by satisfying the following requirements:
9.10.1 Target PAH Analytes in the aromatic hydrocarbon fraction must be identified, quantified and satisfy the QC
requirements and performance standards of SW-846 Method 8270C as described in WSC-CAM-II B with the modifications listed below. For quantification of the EPH aliphatic and aromatic ranges the MS detector must be operated in the Total Ion Current mode.
9.10.2 Modified SW-846 Method 8270C QC Requirements for EPH Analysis*
* All referenced Section numbers refer to SW-846 Method 8270C .
9.10.2.1 DFTPP must be used as a tuning standard (Section 5.5), 9.10.2.2 5-alpha-androstane (using m/z 245 as primary quantitation ion) is the recommended internal
standard, other internal standards may be used, as appropriate. 9.10.2.3 OTP is the recommended analytical surrogate to evaluate % Recovery of the Target PAH analytes
contained in the aromatic fraction (Section 5.7), other surrogates (i.e., d8-Naphthalene) may be used, as appropriate.
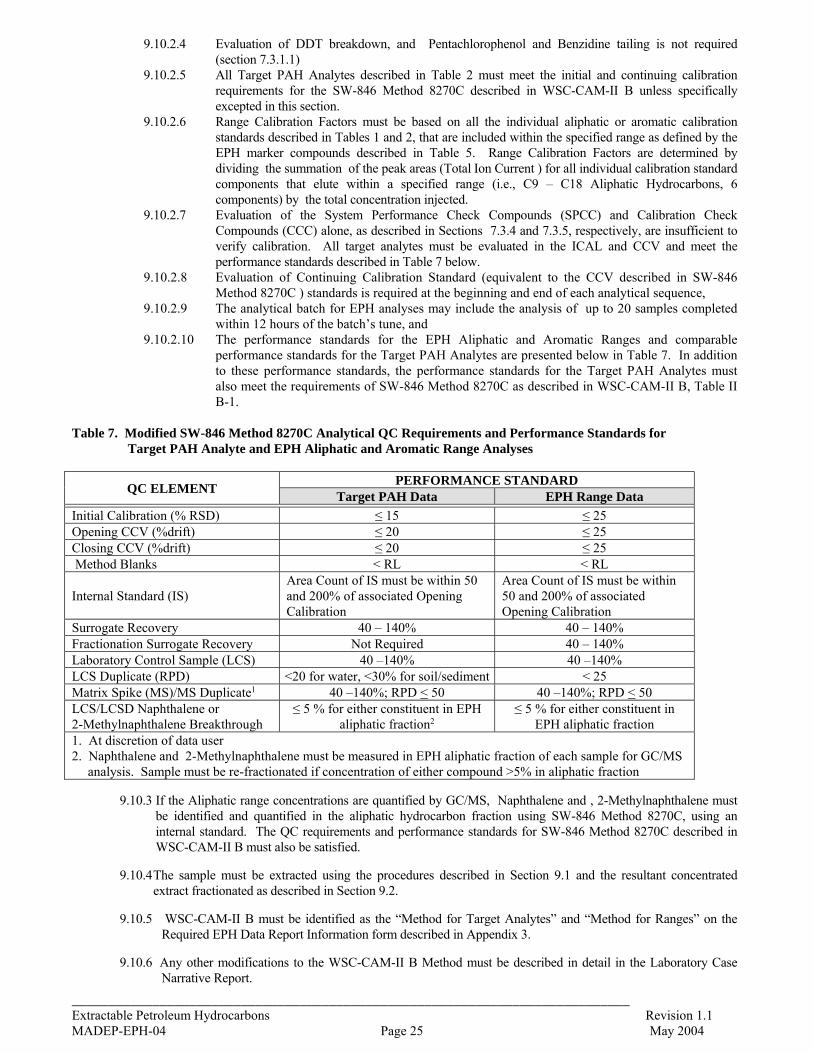
____________________________________________________________________________ Extractable Petroleum Hydrocarbons Revision 1.1 MADEP-EPH-04 Page 25 May 2004
9.10.2.4 Evaluation of DDT breakdown, and Pentachlorophenol and Benzidine tailing is not required (section 7.3.1.1)
9.10.2.5 All Target PAH Analytes described in Table 2 must meet the initial and continuing calibration requirements for the SW-846 Method 8270C described in WSC-CAM-II B unless specifically excepted in this section.
9.10.2.6 Range Calibration Factors must be based on all the individual aliphatic or aromatic calibration standards described in Tables 1 and 2, that are included within the specified range as defined by the EPH marker compounds described in Table 5. Range Calibration Factors are determined by dividing the summation of the peak areas (Total Ion Current ) for all individual calibration standard components that elute within a specified range (i.e., C9 – C18 Aliphatic Hydrocarbons, 6 components) by the total concentration injected.
9.10.2.7 Evaluation of the System Performance Check Compounds (SPCC) and Calibration Check Compounds (CCC) alone, as described in Sections 7.3.4 and 7.3.5, respectively, are insufficient to verify calibration. All target analytes must be evaluated in the ICAL and CCV and meet the performance standards described in Table 7 below.
9.10.2.8 Evaluation of Continuing Calibration Standard (equivalent to the CCV described in SW-846 Method 8270C ) standards is required at the beginning and end of each analytical sequence,
9.10.2.9 The analytical batch for EPH analyses may include the analysis of up to 20 samples completed within 12 hours of the batch’s tune, and
9.10.2.10 The performance standards for the EPH Aliphatic and Aromatic Ranges and comparable performance standards for the Target PAH Analytes are presented below in Table 7. In addition to these performance standards, the performance standards for the Target PAH Analytes must also meet the requirements of SW-846 Method 8270C as described in WSC-CAM-II B, Table II B-1.
Table 7. Modified SW-846 Method 8270C Analytical QC Requirements and Performance Standards for
Target PAH Analyte and EPH Aliphatic and Aromatic Range Analyses
QC ELEMENT PERFORMANCE STANDARD
Target PAH Data EPH Range Data
Initial Calibration (% RSD) ≤ 15 ≤ 25 Opening CCV (%drift) ≤ 20 ≤ 25 Closing CCV (%drift) ≤ 20 ≤ 25 Method Blanks < RL < RL
Internal Standard (IS) Area Count of IS must be within 50 and 200% of associated Opening Calibration
Area Count of IS must be within 50 and 200% of associated Opening Calibration
Surrogate Recovery 40 – 140% 40 – 140% Fractionation Surrogate Recovery Not Required 40 – 140% Laboratory Control Sample (LCS) 40 –140% 40 –140% LCS Duplicate (RPD) <20 for water, <30% for soil/sediment < 25 Matrix Spike (MS)/MS Duplicate1 40 –140%; RPD < 50 40 –140%; RPD < 50 LCS/LCSD Naphthalene or 2-Methylnaphthalene Breakthrough
≤ 5 % for either constituent in EPH aliphatic fraction2
≤ 5 % for either constituent in EPH aliphatic fraction
1. At discretion of data user 2. Naphthalene and 2-Methylnaphthalene must be measured in EPH aliphatic fraction of each sample for GC/MS
analysis. Sample must be re-fractionated if concentration of either compound >5% in aliphatic fraction
9.10.3 If the Aliphatic range concentrations are quantified by GC/MS, Naphthalene and , 2-Methylnaphthalene must be identified and quantified in the aliphatic hydrocarbon fraction using SW-846 Method 8270C, using an internal standard. The QC requirements and performance standards for SW-846 Method 8270C described in WSC-CAM-II B must also be satisfied.
9.10.4 The sample must be extracted using the procedures described in Section 9.1 and the resultant concentrated extract fractionated as described in Section 9.2.
9.10.5 WSC-CAM-II B must be identified as the “Method for Target Analytes” and “Method for Ranges” on the Required EPH Data Report Information form described in Appendix 3.
9.10.6 Any other modifications to the WSC-CAM-II B Method must be described in detail in the Laboratory Case Narrative Report.
____________________________________________________________________________ Extractable Petroleum Hydrocarbons Revision 1.1 MADEP-EPH-04 Page 26 May 2004
10.0 QUALITY CONTROL
10.1 General Requirements and Recommendations
10.1.1 Each laboratory that uses this method is required to operate a formal quality control program. The minimum requirements of this program consist of an initial demonstration of laboratory capability (IDLC) and an ongoing analysis of spiked samples to evaluate and document the quality of data. The initial demonstration of laboratory capability should be repeated whenever new staff are trained or significant changes in instrumentation or the method (i.e., new extraction method, etc.) are made. The laboratory must maintain records to document data quality. Ongoing data quality checks are compared with established performance criteria to determine if the results of analyses meet the performance standards for the method. When results of sample spikes indicate atypical method performance, a quality control check standard must be analyzed to confirm that the analytical system was in-control when the measurements were performed.
10.1.2 A system solvent blank must be run after all highly contaminated samples to minimize the potential
for sample carryover. For purposes of this analytical requirement, any sample with an on-column concentration greater than the highest calibration standard is considered “highly contaminated” (see Section 4.4).
10.1. 3 Batch Analytical Quality Control Samples
10.1.3.1 At a minimum, for each analytical batch (up to 20 samples) or every 24 hours, whichever
come first, a beginning and ending Continuing Calibration Standard must be analyzed. For analytical batches with more than 10 samples, the analysis of an additional mid-range Continuing Calibration Standard should also be considered. However, it should be noted that the analysis of the Continuing Calibration Standard is required prior to sample analysis, after every 20 samples or every 24 hours, whichever come first, and at the end of an analytical sequence, at a minimum.
10.1.3.2 At a minimum, for each analytical batch (up to 20 samples of similar matrix), a Laboratory
Method Blank, a Laboratory Control Sample (LCS), and a LCS Duplicate must also be analyzed and results analyzed as part of the laboratory’s continuing quality control program. The blank and quality control samples fortified with known concentrations and volumes of analytical standards should be carried through the complete sample preparation and measurement processes.
10.1.3.3 It should be noted that field QC samples (field blanks, duplicates, matrix spikes and matrix
spike duplicates) are run on pre-identified field samples at the request of the data user. Coordination with the laboratory is required to assure that adequate sample volume is available.
10.1. 4 The recommended analytical sequence is as follows:
(1) Analytical Batch Opening Initial Calibration or mid-range Continuing Calibration
Standard [REQUIRED] (2) Initial Calibration Verification [REQUIRED*],
* only if separate-source standard not used for LCS] (3) Extraction Batch Laboratory Control Sample [REQUIRED] (4) Extraction Batch Laboratory Control Sample Duplicate [REQUIRED] (5) Extraction Batch Laboratory Method Blank [REQUIRED] (6) Up to 20 Samples (7) Matrix Duplicate sample [As requested by data user] (8) Matrix Spike/MS Duplicate [As requested by data user] (9) Optional mid-range Continuing Calibration Standard (consider after 10 samples)
(10) Closing mid-range Continuing Calibration Standard a after 20 samples and at end of analytical batch [REQUIRED]
____________________________________________________________________________ Extractable Petroleum Hydrocarbons Revision 1.1 MADEP-EPH-04 Page 27 May 2004
a. May be used as Analytical Batch Opening Continuing Calibration for the next analytical batch if batches are processed continuously.
10.1. 5 It is recommended that surrogate standard recoveries be monitored and documented on a
continuing basis. At a minimum, when surrogate recovery from a sample, blank, or QC sample is less than 40% or more than 140%, check calculations to locate possible errors, check the fortifying solution for degradation, and check for changes in instrument performance. If the cause cannot be determined, re-extract and re-analyze the sample if the recovery of one surrogate is <40% or the recoveries of both surrogates are outside the acceptance limits. The laboratory may first reanalyze the archived portion (prior to fractionation) to see if the surrogate recoveries were possibly affected by fractionation. If surrogate recoveries are acceptable in the archived portion, refractionation and reanalysis of the archived extract must be performed. Reextraction and reanalysis are not required if one of the following exceptions applies:
(1) Obvious interference is present on the chromatogram (e.g., unresolved complex mixture); and (2) If the surrogate exhibits high recovery and associated target analytes or hydrocarbon ranges are
not detected in sample.
Analysis of the sample on dilution may diminish matrix-related surrogate recovery problems. This approach can be used as long as the reporting limits to evaluate applicable MCP standards can still be achieved with the dilution. If not, reanalysis without dilution must be performed.
10.2 Minimum Instrument QC
10.2.1 The instrument must be able to achieve adequate separation and resolution of peaks and analytes of interest.
10.1..1 The n-nonane (n-C9) peak must be adequately resolved from the solvent front
of the chromatographic run. 10.1..2 The surrogates COD and OTP must be adequately resolved from any individual
components in the Aliphatic Hydrocarbon and Aromatic Hydrocarbon standards.
10.1..3 All peaks of interest in the Aliphatic Hydrocarbon standard must be adequately
resolved to baseline. In the Aromatic Hydrocarbon standard, baseline separation is expected for Phenanthrene and Anthracene. Benzo(a)Anthracene, Chrysene, Benzo(b)Fluoranthene, Benzo(k)fluoranthene, Dibenzo(a,h)Anthracene, and Indeno(1,2,3-cd)Pyrene are not expected to be chromatographically separated to baseline and may be reported as an un-resolved mixture, unless adequate resolution is obtained .
For the purposes of this method, adequate resolution is assumed to be achieved
if the height of the valley between two peaks is less than 25% of the average height of the two peaks.
10.2.2 Retention time windows must be re-established for Target EPH Analytes each time a new GC
column is installed, and must be verified and/or adjusted on a daily basis. (See Sections 9.6 and 9.8.4).
10.2.3 Calibration curves, calibration factors, or response factors must be developed based upon the analysis of calibration standards prepared at a minimum of 5 concentration levels. The linearity of calibration or response factors may be assumed if the %RSD over the working range of the curve is less than or equal to 25%. Alternatively, if linear regression analysis is used for quantitation (i.e., calibration curve), the correlation coefficient (r) must be at least 0.99. (See Section 9.7).
10.2.4 In order to demonstrate the absence of aliphatic mass discrimination, the response ratio of C28 to C20 must be at least 0.85. If <0.85, this nonconformance must be noted in the laboratory case narrative. The chromatograms of Continuing Calibration Standards for aromatics must be reviewed to ensure that there are no obvious signs of mass discrimination.
____________________________________________________________________________ Extractable Petroleum Hydrocarbons Revision 1.1 MADEP-EPH-04 Page 28 May 2004
10.2.5 Due care must be exercised to assure that the peaks for naphthalene and n-dodecane in the aliphatic hydrocarbon fraction are adequately resolved to allow for an accurate determination of the naphthalene concentration in the LCS/LCSD pair.
10.3 Initial and Periodic Method QC Demonstrations
The QC procedures described in Appendix 5 and described in SW-846 Method 8000B, Section 8.4 must be
conducted, successfully completed and documented as an initial demonstration of laboratory capability, prior to the analysis of any samples by the EPH Method. Subsequent to this initial demonstration, additional evaluations of this nature should be conducted on a periodic basis, in response to changes in instrumentation or operations, training new analysts and/or in response to confirmed or suspected systems, method, or operational problems. Elements of the Initial Demonstration of Laboratory Capability include:
10.3.1 Demonstration of Acceptable System Background, see Appendix 5, Section 2.0 (Optional)
10.3.2 Initial Demonstration of Accuracy (IDA), see Appendix 5, Section 3.0
10.3.3 Initial Demonstration of Precision (IDP), see Appendix 5, Section 4.0,
10.3. 4 Initial Demonstration of Fractionation Efficiency, see Appendix 5, Section 5.0, and
10.3.5 Method Detection Limit (MDL), see Appendix 5, Section 6.0 (Optional)
10.4 Ongoing Method QC Demonstrations
10.4.1 Each sample, blank, LCS, LCSD, MS, and Matrix Duplicate must be fortified with the surrogate
spiking solution. Required surrogate recovery is 40% to 140%. At a minimum, when surrogate recovery from a sample, blank, or QC sample is less than 40% or more than 140%, check calculations to locate possible errors, check the fortifying solution for degradation, and check for changes in instrument performance. If the cause cannot be determined, reextract and reanalyze the sample if the recovery of one surrogate is <40% or the recoveries of both surrogates are outside the acceptance limits. The laboratory may first reanalyze the archived portion (prior to fractionation) to see if the surrogate recoveries were possibly affected by fractionation. If surrogate recoveries are acceptable in the archived portion, refractionation and reanalysis of the archived extract must be performed. Re-extraction and reanalysis are not required if one of the following exceptions applies:
(1) Obvious interference is present on the chromatogram (e.g., unresolved complex mixture); and (2) If the surrogate exhibits high recovery and associated target analytes or hydrocarbon ranges are not
detected in sample.
Analysis of the sample on dilution may diminish matrix-related surrogate recovery problems. This approach can be used as long as the reporting limits to evaluate applicable MCP standards can still be achieved with the dilution. If not, reanalysis without dilution must be performed.
10.4.2 Each sample (field and QC sample) must be evaluated for potential breakthrough on a sample-
specific basis by evaluating the % recovery of the fractionation surrogate (2-bromonaphthalene) and on a batch basis by quantifying naphthalene and 2-methylnaphthalene in both the aliphatic and aromatic fractions of the LCS and LCSD. If either the concentration of naphthalene or 2-methylnaphthalene in the aliphatic fraction exceeds 5% of the total concentration for naphthalene or 2-methylnaphthalene in the LCS or LCSD, fractionation must be repeated on all archived batch extracts. If the fractionation surrogate recovery is outside the 40 – 140% limits, then fractionation must be repeated on the archived extract of the affected sample. NOTE: The total concentration of naphthalene or 2-methylnaphthalene in the LCS/LCSD pair includes the summation of the concentration detected in the aliphatic fraction and the concentration detected in the aromatic fraction.
Analytical Note: Due care must be exercised to assure that the peaks for naphthalene and n-dodecane in
the aliphatic hydrocarbon fraction are adequately resolved to allow for an accurate determination of the naphthalene concentration in the LCS/LCSD pair.
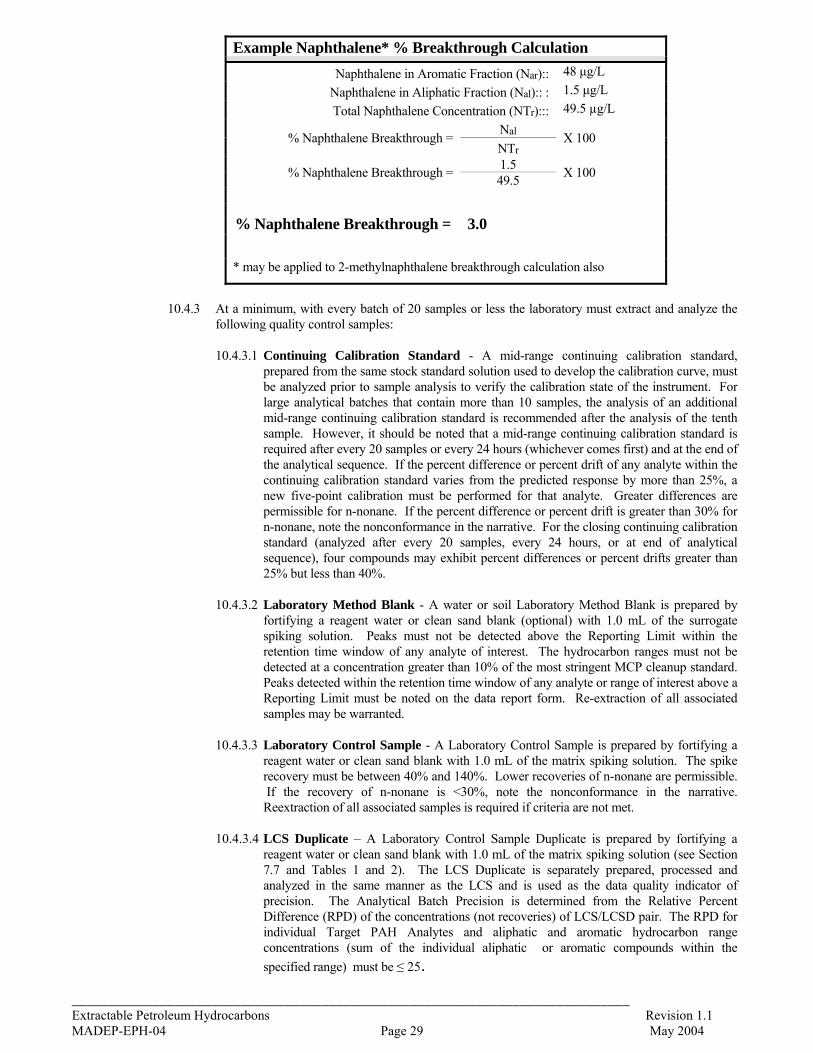
____________________________________________________________________________ Extractable Petroleum Hydrocarbons Revision 1.1 MADEP-EPH-04 Page 29 May 2004
Example Naphthalene* % Breakthrough Calculation
Naphthalene in Aromatic Fraction (Nar):: 48 μg/L
Naphthalene in Aliphatic Fraction (Nal):: : 1.5 μg/L
Total Naphthalene Concentration (NTr)::: 49.5 µg/L
% Naphthalene Breakthrough = Nal
X 100 NTr
% Naphthalene Breakthrough = 1.5
X 100 49.5
% Naphthalene Breakthrough = 3.0
* may be applied to 2-methylnaphthalene breakthrough calculation also
10.4.3 At a minimum, with every batch of 20 samples or less the laboratory must extract and analyze the
following quality control samples:
10.4.3.1 Continuing Calibration Standard - A mid-range continuing calibration standard, prepared from the same stock standard solution used to develop the calibration curve, must be analyzed prior to sample analysis to verify the calibration state of the instrument. For large analytical batches that contain more than 10 samples, the analysis of an additional mid-range continuing calibration standard is recommended after the analysis of the tenth sample. However, it should be noted that a mid-range continuing calibration standard is required after every 20 samples or every 24 hours (whichever comes first) and at the end of the analytical sequence. If the percent difference or percent drift of any analyte within the continuing calibration standard varies from the predicted response by more than 25%, a new five-point calibration must be performed for that analyte. Greater differences are permissible for n-nonane. If the percent difference or percent drift is greater than 30% for n-nonane, note the nonconformance in the narrative. For the closing continuing calibration standard (analyzed after every 20 samples, every 24 hours, or at end of analytical sequence), four compounds may exhibit percent differences or percent drifts greater than 25% but less than 40%.
10.4.3.2 Laboratory Method Blank - A water or soil Laboratory Method Blank is prepared by
fortifying a reagent water or clean sand blank (optional) with 1.0 mL of the surrogate spiking solution. Peaks must not be detected above the Reporting Limit within the retention time window of any analyte of interest. The hydrocarbon ranges must not be detected at a concentration greater than 10% of the most stringent MCP cleanup standard. Peaks detected within the retention time window of any analyte or range of interest above a Reporting Limit must be noted on the data report form. Re-extraction of all associated samples may be warranted.
10.4.3.3 Laboratory Control Sample - A Laboratory Control Sample is prepared by fortifying a
reagent water or clean sand blank with 1.0 mL of the matrix spiking solution. The spike recovery must be between 40% and 140%. Lower recoveries of n-nonane are permissible. If the recovery of n-nonane is <30%, note the nonconformance in the narrative. Reextraction of all associated samples is required if criteria are not met.
10.4.3.4 LCS Duplicate – A Laboratory Control Sample Duplicate is prepared by fortifying a
reagent water or clean sand blank with 1.0 mL of the matrix spiking solution (see Section 7.7 and Tables 1 and 2). The LCS Duplicate is separately prepared, processed and analyzed in the same manner as the LCS and is used as the data quality indicator of precision. The Analytical Batch Precision is determined from the Relative Percent Difference (RPD) of the concentrations (not recoveries) of LCS/LCSD pair. The RPD for individual Target PAH Analytes and aliphatic and aromatic hydrocarbon range concentrations (sum of the individual aliphatic or aromatic compounds within the
specified range) must be ≤ 25.
____________________________________________________________________________ Extractable Petroleum Hydrocarbons Revision 1.1 MADEP-EPH-04 Page 30 May 2004
10.4.3.5 Initial Calibration Verification – An Initial Calibration Verification standard, prepared
from a separate source standard than used for initial and continuing calibrations, must be analyzed prior to sample analysis if a separate source standard is not used for the LCS. The recoveries of all Target Analytes must be between 80-120%. A new five-point calibration must be performed if criteria are not met.
10.4.3.6 System Solvent Blank - If baseline correction will be employed, as specified in Section
11.2.5, a system solvent blank, air blank, and/or system run must be undertaken with every batch, and after the analysis of a sample that is suspected to be highly contaminated. In no case shall baseline correction be used if the instrument baseline drift is more than 25% greater than the average level established by these charts.
10.4.3.7 Fractionation Check Standard – A fractionation check solution is prepared containing
14 alkanes and 17 PAHs at a nominal concentration of 200 ng/ μ l of each constituent. The Fractionation Check Solution must be used to evaluate the fractionation efficiency of each new lot of silica gel / cartridges as described in Appendix 5, Section 5.0, and establish the optimum hexane volume required to efficiently elute aliphatic hydrocarbons while not allowing significant aromatic hydrocarbon breakthrough. For each analyte contained in the fractionation check solution, excluding n-nonane, the Percent Recovery (see Appendix 5, Equation 5-4) must be between 40 and 140%. A 30% Recovery is acceptable for n-nonane.
10.4.4 At the request of the data user, and in consideration of sample matricies and data quality objectives,
matrix spikes and matrix duplicates may be analyzed with every batch of 20 samples or less per matrix.
10.4.4.1 Matrix duplicate - Matrix duplicates are prepared by analyzing one sample in duplicate.
The purpose of the matrix duplicates is to determine the homogeneity of the sample matrix as well as analytical precision. The RPD of detected results in the matrix duplicate samples must not exceed 50 when the results are greater than 5x the reporting limit.
10.4.4.2 Matrix Spike/Matrix Spike Duplicate - The water or soil MS is prepared by fortifying
an actual water or soil sample with 1.0 mL of the matrix spiking solution. The desired spiking level is 50% of the highest calibration standard. However, the total concentration in the MS (including the MS and native concentration in the unspiked sample) should not exceed 75% of the highest calibration standard in order for a proper evaluation to be performed. The purpose of the matrix spike is to determine whether the sample matrix contributes bias to the analytical results. The background concentrations of the analytes in the sample matrix must be determined in a separate unspiked aliquot and the measured values in the matrix spike corrected for background concentrations. The corrected concentrations of each analyte within the matrix spiking solution must be within 40 - 140% of the true value. Lower recoveries of n-nonane are permissible, but must be noted in the narrative if <30%.
10.4.5 If any of the performance standards specified in Section 10.4 are not met, the cause of the non-
conformance must be identified and corrected before any additional samples may be analyzed. Any samples run between the last QC samples that met the criteria and those that are fallen out must be re-extracted and/or re-analyzed. These QC samples include the opening continuing calibration standard, laboratory method blank, LCS, LCSD, and closing continuing calibration standard. If this is not possible, that data must be reported as suspect.
10.4.6 The analyte and hydrocarbon range Reporting Limits should be verified/re-established at least once
per year, or upon a major change in system equipment or operations (see Section 10.1.1).

____________________________________________________________________________ Extractable Petroleum Hydrocarbons Revision 1.1 MADEP-EPH-04 Page 31 May 2004
11.0 DATA PRODUCTION AND REPORTING
11.1 Calibration
Using the external standard calibration procedure (9.7.2) calibrate the GC as follows:
11.1.1 Calculate a CF or linear regression (LR) for each Target PAH Analyte that comprises the Aromatic Hydrocarbon standard. This step is not necessary if the Target or Diesel PAH Analytes will not be individually identified and quantitated by the EPH method (i.e., if unadjusted values only will be reported for the hydrocarbon ranges or TPH or if reporting concentrations of Target PAH Analytes via another method).
11.1.2 Calculate a CF for the surrogates OTP, COD and the Fractionation Surrogates.
11.1.3 Calculate a collective CF or LR for the total concentration of the C9 -C18 Aliphatic Hydrocarbons.
Tabulate the summation of the peak areas of all component standards in that fraction (e.g., C9-C18
Aliphatics, 6 components) against the total concentration injected. Do not include any areal contribution of the internal standard, naphthalene, and 2-methylnaphthalene.
11.1.4 Calculate a CF or LR for naphthalene and 2-methylnaphthalene from the Aliphatic Hydrocarbon
standard. Not required if the same instrument is calibrated, separately, for all aliphatic and aromatic compounds using the same internal standard and resolution of naphthalene from n-C12 is demonstrated..
11.1.5 Calculate a collective CF or LR for the total concentration of the C19 -C36 Aliphatic Hydrocarbons.
Tabulate the summation of the peak areas of all component standards in that fraction (e.g., C19-C36 Aliphatics, 8 components) against the total concentration injected. Do not include the surrogate COD.
11.1.6 Calculate a collective CF or LR for the total concentration of the C11 -C22 Aromatic Hydrocarbons.
Tabulate the summation of the peak areas of all component standards in that fraction (e.g., C11-C22 Aromatics, 17 components) against the total concentration injected. Do not include the surrogate OTP, 2-Bromonaphthalene, or 2-Fluorobiphenyl.
11.1.7 For TPH analyses, without fractionation, calculate a collective CF or LR. Tabulate the summation
of the peak areas of all component standards in the aliphatic fraction (i.e., 14 components) against the total concentration injected. Do not include surrogates or naphthalene and 2-methylnaphthalene in the Aliphatic Hydrocarbon standard.
11.2 Sample Analysis
11.2.1 Aliphatic Fraction
11.2.1.1 Determine the total area count for all peaks eluting 0.1 minutes before the retention time (Rt) for n-C9 and 0.01 minutes before the Rt for n-C19. It is not necessary to identify or quantitate individual aliphatic compounds within this range.
11.2.1.4 Determine the total area count for all peaks eluting 0.01 minutes before the Rt for n-C19
and 0.1 minutes after the Rt for n-C36. It is not necessary to identify or quantitate individual aliphatic compounds within this range.
11.2.1.4 Determine the peak area count for the surrogate standard (COD). Subtract this value
from the collective area count value within the C19 through C36 aliphatic hydrocarbon range.
11.2.1.4 Using the equations contained in Section 9.9, calculate the collective concentrations of C9
through C18 Aliphatic Hydrocarbons, C19 through C36 Aliphatic Hydrocarbons, and the individual concentration of the surrogate COD.
____________________________________________________________________________ Extractable Petroleum Hydrocarbons Revision 1.1 MADEP-EPH-04 Page 32 May 2004
11.2.2 Aromatic Fraction
11.2.2.1 Determine the total area count for all peaks eluting 0.1 minutes before the retention time
(Rt) for naphthalene and 0.1 minutes after the Rt for benzo(g,h,i)perylene. 11.2.2.2 Determine the peak area count for the sample surrogate (OTP) and fractionation
surrogate(s). Subtract these values from the collective area count value.
11.2.2.3 Optionally, determine the peak area count for the Target or Diesel PAH Analytes.
11.2.2.4 Using the equations contained in Section 9.9, calculate the concentrations of Unadjusted C11 through C22 Aromatic Hydrocarbons, the surrogate standard (OTP), fractionation surrogate standard(s) and optionally, the Target or Diesel PAH Analytes.
11.2.3 Total Petroleum Hydrocarbons
11.2.3.1 Determine the total area count for all peaks eluting 0.1 minutes before the retention time
(Rt) for n-C9 and 0.1 minutes after the Rt for n-C36. It is not necessary to identify or quantitate individual aliphatic compounds within this range.
11.2.3.2 Determine the peak area count for any surrogate and internal standards used. Subtract
these values from the collective area count value. 11.2.3.3 Using the equations contained in Section 9.9, calculate the concentration of Unadjusted
TPH. 11.2.3.4 If the concentrations of the Target or Diesel PAH Analytes were determined using a
GC/MS method, subtract the concentration of the Target or Diesel PAH Analytes from the concentration of unadjusted TPH and report concentration of resulting TPH. If the concentration of Target or Diesel PAH Analytes were not determined using a GC/MS method, report a value for Unadjusted TPH, and indicate “Not Determined” for TPH.
11.2.4 Data Adjustments
11.2.4.1 By definition, the collective concentration of the aromatic fraction (and/or TPH) excludes
the individual concentrations of the Target PAH Analytes. Accordingly, a data adjustment step is necessary to adjust the collective range concentration calculated in Sections 11.2.2.4 and 11.2.3.4, to eliminate “double counting” of analytes.
11.2.4.2 The necessary data adjustment step may be taken by the laboratory reporting the
range/TPH concentration data, or by the data user. The extent of data adjustments taken by the laboratory must be noted on the data report form.
11.2.4.3 Subtract the individual concentrations of the Target or Diesel PAH Analytes from the
collective concentration of Unadjusted C11 through C22 Aromatic Hydrocarbons only if the concentrations of the Target or Diesel PAH Analytes are above the reporting limit. If the individual concentrations of Target PAH Analytes have been quantified using another method (e.g., by using an MS detector), note this on the data report form. It should be noted that the reported Target PAH Analyte results must be the results used to adjust the C11-C22 Aromatics results.
11.2.4.4 Subtract the individual concentrations of the Target or Diesel PAH Analytes from the
collective concentration of Unadjusted TPH only if the concentrations of the Target or Diesel PAH Analytes were determined using a GC/MS method.
11.2.4.5 If the individual concentrations of Target PAH Analytes have not been quantitated, report
a value for Unadjusted C11 through C22 Aromatic Hydrocarbons and/or Unadjusted TPH, and indicate “Not Determined” for C11 through C22 Aromatic Hydrocarbons and/or TPH
11.2.4.6 For purposes of compliance with the reporting and cleanup standards specified in the Massachusetts Contingency Plan, the concentration of Unadjusted C11 through C22
____________________________________________________________________________ Extractable Petroleum Hydrocarbons Revision 1.1 MADEP-EPH-04 Page 33 May 2004
Aromatic Hydrocarbons and/or Unadjusted TPH may be conservatively deemed to be equivalent to the concentration of C11 through C22 Aromatic Hydrocarbons and/or TPH.
11.2.5 Baseline Correction for Instrument Noise Level
11.2.5.1 EPH aliphatic and aromatic hydrocarbon range area data determined by the collective
integration of all eluting peaks between the specified EPH range marker compounds (see Table 5) may be corrected by the manual or automatic subtraction of the baseline established by the injection of a System Solvent Blank. Correction in this manner is not recommended or preferred, but is permissible in cases where all reasonable steps have been taken to eliminate or minimize excessive baseline bias associated with analytical system noise.
11.2.5.2 The instrument baseline must be established by the direct injection of a system solvent
blank. The injection of an air blank or activation of a temperature programmed chromatographic run without the injection of any material should be used to verify that the system noise is not attributable to solvent contamination. All system operational elements and parameters must be identical to those of a typical sample run.
If baseline correction is used, the baseline must be re-established for every analytical batch by the analysis of a System Solvent Blank. Baseline correction for EPH aliphatic and aromatic hydrocarbon area data may not be used for any sample for which the area count associated with the baseline correction is greater than 10% of the uncorrected area count for the sample’s corresponding collective range.
11.2.6 Contamination of SPE Cartridges
11.2.6.1 Range integration areas may be affected by peaks identified during the injection of a Laboratory Method Blank, and determined to be attributable to the leaching of plasticizers or other contaminants from silica gel SPE cartridges. In general, this contamination affects the C11-C22 Aromatics. Blank correction is not permissible.
11.2.6.2 The laboratory must report the presence of this contamination in the associated range. Optionally, the laboratory may perform GC/MS analysis of the laboratory method blank extract to demonstrate that the contaminant in question is not a C11-C22 aromatic compound. Analysis of only the method blank is acceptable as long as the associated samples exhibit the same contaminant peak at the same retention time. If demonstrated not to be a C11-C22 aromatic compound, the contaminant does not need to be included in the calculation of the hydrocarbon range concentration. The laboratory must provide a discussion in the case narrative if this approach is used.
11.3 Data Reporting Content
11.3.1 The required content for EPH Method data is presented in Appendix 3. This information provides data users with a succinct and complete summary of pertinent information and data, as well as a clear affirmation that the QC procedures and standards specified in this method were evaluated and achieved. Any significant modification to the MADEP EPH Method, as described in Section 11.3.1.1, and indicated by a negative response to Question D on the MADEP MCP ANALYTICAL METHOD REPORT CERTIFICATION FORM (also included in Appendix 3) precludes the affected data from achieving “Presumptive Certainty” status. If a significant modification to the EPH Method is utilized, an attachment to the analytical report must be included to demonstrate compliance with the method performance requirements of Section 1.12 on a matrix- and petroleum product-specific basis.
While it is permissible to modify the reporting format, all of the data and information specified in Appendix 3 for these reports must be provided in a clear, concise, and succinct manner. 11.3.1.1 “Significant Modifications” to this method shall include, without limitation, all of the
following:
11.3.1.1.1 The use of other than a silica-gel fractionation technique; 11.3.1.1.2 The use of an extraction procedure other than those presented in Table 4;
____________________________________________________________________________ Extractable Petroleum Hydrocarbons Revision 1.1 MADEP-EPH-04 Page 34 May 2004
11.3.1.1.3 The use of solvents other than those recommended in this method or approved extraction methods listed in Table 4.
11.3.1.1.4 The use of a detector other than a Flame Ionization Detector (FID) to quantitate range/TPH concentrations (See Notes 1 and 2 below);
11.3.1.1.5 The use of aliphatic or aromatic surrogate compounds with retention times not within ± 2 minutes of the retention times of the recommended compounds or the use of inappropriate surrogates to represent the aliphatic and aromatic ranges;
11.3.1.1.6 Failure to provide all of the data and information presented in Appendix 3 as well as the required method deliverables discussed in Section 11.3.2.
NOTE 1: Use of a GC/MS detector operated in the Total Ion Current mode to quantify the EPH Method’s aliphatic and aromatic hydrocarbon ranges is not considered a significant modification provided that (1) the sample extract has been fractionated; (2) the GC/MS system was also used to identify and quantify the Target PAH Analytes in the sample’s aromatic fraction; and (3) the QC requirements and performance standards specified in Section 9.10 are satisfied.
NOTE 2: If alternate detectors are used with or without fractionation, other than noted
above, the laboratory must demonstrate that the performance standards listed in Section 1.12 were achieved. Use of an alternate detector, other than noted above, is considered a “significant modification”. Any EPH data produced using a “significant modification” can not achieve presumptive certainty status.
11.3.1.2 Positive affirmation that all required QA/QC procedures and performance standards were
followed and achieved means that all of the required steps and procedures detailed in Section 10.0 have been followed, and that all data obtained from these steps and procedures were within the acceptance limits specified for these steps and procedures.
11.3.2 In addition to sample results, the EPH data report must contain the following items:
Laboratory Method Blank Results Laboratory Control Sample Results LCS Duplicate Sample Results Matrix Spike Results (only if requested by data user) Matrix Duplicate Results (only if requested by data user) Fractionation Check Standard Results Surrogate Spike Recoveries (for all field samples and QC samples), including fractionation and
extraction surrogates Percentage of total naphthalene and 2-methylnaphthalene concentrations detected in the aliphatic
fractions of the LCS and LCS Duplicate (see Section 10.4.2) Results of reanalyses or dilutions must be reported as required in WSC-CAM-IV B, “Quality
Assurance and Quality Control Requirements for the Method for the Determination of Extractable Petroleum Hydrocarbons (EPH), MADEP-EPH-03-1 for the Massachusetts Contingency Plan (MCP)”, Table IV B-2.
Demonstration of compliance with analytical performance standards specified in Section 1.12 on a matrix- and petroleum product-specific basis (only if a “significant modification” is utilized)
11.3.3 General laboratory reporting requirements are outlined in WSC-CAM-VII A, “Quality Assurance
and Quality Control Guidelines for the Acquisition and Reporting of Analytical Data”, Section 2.4. A copy of the required laboratory certification form is also included in Appendix 3 of this method.
____________________________________________________________________________ Extractable Petroleum Hydrocarbons Revision 1.1 MADEP-EPH-04 Page 35 May 2004
12.0 REPORTING LIMITS
The Reporting Limits (RLs) for Target PAH Analytes shall be based upon the concentration of the lowest calibration standard for the analyte of interest. The RL must be greater than or equal to the concentration of the lowest calibration standard. Target PAH Analytes with calculated concentrations below the RL should be reported as < the specific Target Analyte’s RL (i.e., < 2.0 ug/L). For GC/MS analysis only, calculated concentrations of Target PAH Analytes below the RL (lowest calibration standard) may be reported as a “J Value”, or equivalent. The RLs for hydrocarbon ranges shall be based upon the concentration of the lowest calibration standard for an individual analyte within the range of interest. The range RL will be set at 100x the concentration of the lowest calibration standard for the associated analyte. Calculated collective concentrations for EPH aliphatic and aromatic hydrocarbon ranges below the RL should be reported as < Range RL (i.e., < 100 ug/L). Based on the on-column concentration of 1 ηg/µL for the lowest calibration standard for all analytes, the following reporting limits would be generated for the hydrocarbon ranges:
Aqueous Samples: EPH Hydrocarbon range reporting limits would be equivalent to 100 µg/L based on the
extraction of 1 liter of sample, a final fractionation extract volume of 2 mL, and a sample injection volume of 1 µL.
Soil/Sediment Samples: EPH Hydrocarbon range reporting limits would be equivalent to 20 mg/kg (dry weight basis)
based on the extraction of 10 grams of soil, a final fractionation extract volume of 2 mL, and a sample injection volume of 1 µL.
13.0 METHOD PERFORMANCE
Single laboratory accuracy, precision and MDL data for method analytes are provided in Tables 1-1 through 1-4 in Appendix 1. Chromatograms are provided in Appendix 2.
14.0 REFERENCES
1. MADEP and ABB Environmental Services, Inc., "Interim Final Petroleum Report: Development of Health-Based Alternative to the Total Petroleum Hydrocarbon (TPH) Parameter", August, 1994.
2. MADEP, “Final Updated Petroleum Hydrocarbon Fraction Toxicity Values For the VPH/EPH/APH
Methodology”, January 2003. 3. USEPA, "Measurement of Petroleum Hydrocarbons: Report on Activities to Develop a Manual" Prepared by
Midwest Research Institute, Falls Church, VA, under EPA Contract #68-WO-0015, WA No. 4; submitted to USEPA Office of Underground Storage Tanks, Washington, DC; November 20, 1990.
4. USEPA "SW-846 Test Methods for Evaluating Solid Waste", 3rd Edition; Methods 3510C, 3520C, 3540C,
3541, 3545A, 3546, 3580A, 3630C, 8000B, 8100 5. USEPA Federal Register 40 CFR Part 136, Appendix B, "Guidelines Establishing Test Procedures for the
Analysis of Pollutants", July 1992. 6. Wisconsin Department of Natural Resources, "Modified DRO - Method for Determining Diesel Range
Organics", PUBL-SW-141, 1992 7. USEPA, “Guidance on Evaluation, Resolution, and Documentation of Analytical Problems Associated with
Compliance Monitoring”, EPA 821-B-93-001; U.S. Government Printing Office, Washington D.C., June, 1993 8. Massachusetts DEP, “Report on the Results of the Fall 1997 VPH/EPH Round Robin Testing Program”,
December, 1997 9. EPA UST Workgroup, Draft "Method for Determination of Diesel Range Organics", November, 1990 10. ASTM 1990. Standard Method for Laboratory Determination of Water (Moisture) Content of Soil and Rock,
Annual Book of ASTM Standards, D 2216-90 (revision of 2216-63, 2216-80).
Page 36 of 60 Pages
APPENDIX 1 SINGLE LABORATORY ACCURACY, PRECISION, AND METHOD DETECTION LIMIT (MDL) DATA Table 1-1. Single Laboratory Accuracy, Precision, and Method Detection Limits (MDLs) for Alkanes Spiked
Into Reagent Water and Analyzed by the EPH Method Table 1-2. Single Laboratory Accuracy, Precision, and Method Detection Limits (MDLs) for Polynuclear
Aromatic Hydrocarbons (PAHs) Spiked Into Reagent Water and Analyzed by the EPH Method Table 1-3. Single Laboratory Accuracy, Precision, and Method Detection Limits (MDLs) for Alkanes Spiked
Into EPH-Free Sand and Analyzed by the EPH Method Table 1-4. Single Laboratory Accuracy, Precision, and Method Detection Limits (MDLs) for Polynuclear
Aromatic Hydrocarbons (PAHs) Spiked Into EPH-Free Sand and Analyzed by the EPH Method
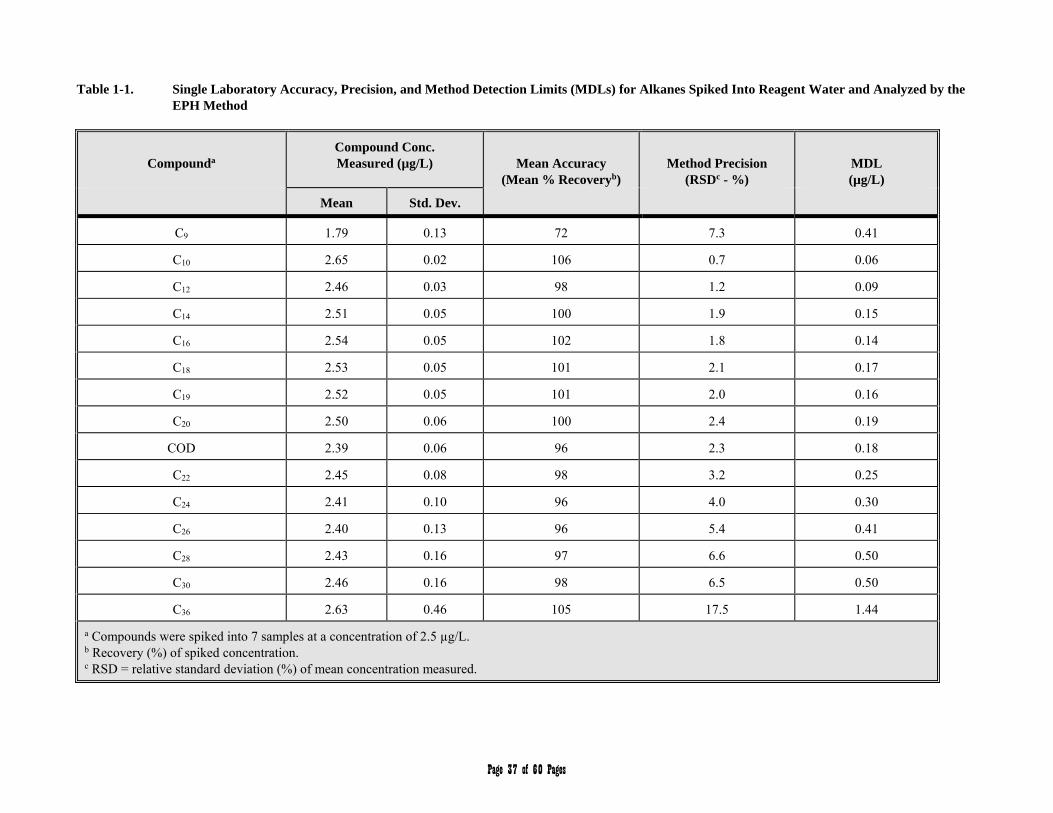
Page 37 of 60 Pages
Table 1-1. Single Laboratory Accuracy, Precision, and Method Detection Limits (MDLs) for Alkanes Spiked Into Reagent Water and Analyzed by the
EPH Method
Compounda
Compound Conc. Measured (µg/L)
Mean Accuracy
(Mean % Recoveryb)
Method Precision
(RSDc - %)
MDL (µg/L)
Mean Std. Dev.
C9 1.79 0.13 72 7.3 0.41
C10 2.65 0.02 106 0.7 0.06
C12 2.46 0.03 98 1.2 0.09
C14 2.51 0.05 100 1.9 0.15
C16 2.54 0.05 102 1.8 0.14
C18 2.53 0.05 101 2.1 0.17
C19 2.52 0.05 101 2.0 0.16
C20 2.50 0.06 100 2.4 0.19
COD 2.39 0.06 96 2.3 0.18
C22 2.45 0.08 98 3.2 0.25
C24 2.41 0.10 96 4.0 0.30
C26 2.40 0.13 96 5.4 0.41
C28 2.43 0.16 97 6.6 0.50
C30 2.46 0.16 98 6.5 0.50
C36 2.63 0.46 105 17.5 1.44
a Compounds were spiked into 7 samples at a concentration of 2.5 µg/L. b Recovery (%) of spiked concentration. c RSD = relative standard deviation (%) of mean concentration measured.
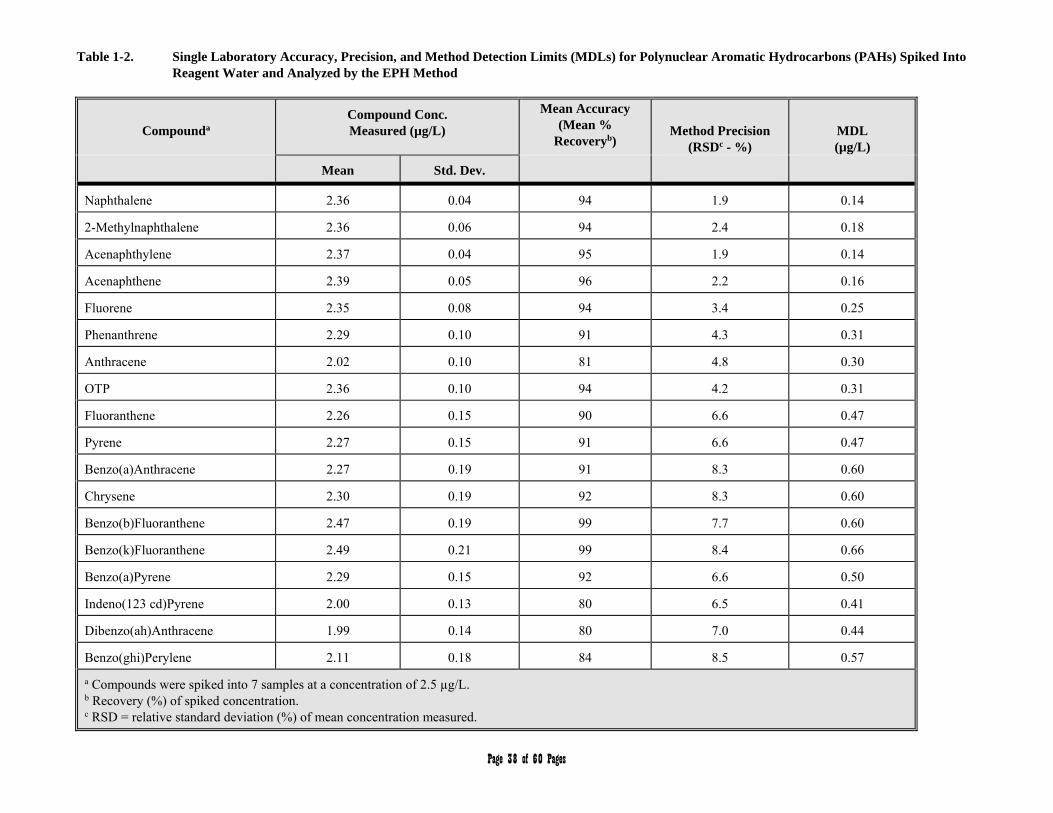
Page 38 of 60 Pages
Table 1-2. Single Laboratory Accuracy, Precision, and Method Detection Limits (MDLs) for Polynuclear Aromatic Hydrocarbons (PAHs) Spiked Into Reagent Water and Analyzed by the EPH Method
Compounda
Compound Conc. Measured (µg/L)
Mean Accuracy (Mean %
Recoveryb)
Method Precision
(RSDc - %)
MDL (µg/L)
Mean Std. Dev.
Naphthalene 2.36 0.04 94 1.9 0.14
2-Methylnaphthalene 2.36 0.06 94 2.4 0.18
Acenaphthylene 2.37 0.04 95 1.9 0.14
Acenaphthene 2.39 0.05 96 2.2 0.16
Fluorene 2.35 0.08 94 3.4 0.25
Phenanthrene 2.29 0.10 91 4.3 0.31
Anthracene 2.02 0.10 81 4.8 0.30
OTP 2.36 0.10 94 4.2 0.31
Fluoranthene 2.26 0.15 90 6.6 0.47
Pyrene 2.27 0.15 91 6.6 0.47
Benzo(a)Anthracene 2.27 0.19 91 8.3 0.60
Chrysene 2.30 0.19 92 8.3 0.60
Benzo(b)Fluoranthene 2.47 0.19 99 7.7 0.60
Benzo(k)Fluoranthene 2.49 0.21 99 8.4 0.66
Benzo(a)Pyrene 2.29 0.15 92 6.6 0.50
Indeno(123 cd)Pyrene 2.00 0.13 80 6.5 0.41
Dibenzo(ah)Anthracene 1.99 0.14 80 7.0 0.44
Benzo(ghi)Perylene 2.11 0.18 84 8.5 0.57
a Compounds were spiked into 7 samples at a concentration of 2.5 µg/L. b Recovery (%) of spiked concentration. c RSD = relative standard deviation (%) of mean concentration measured.
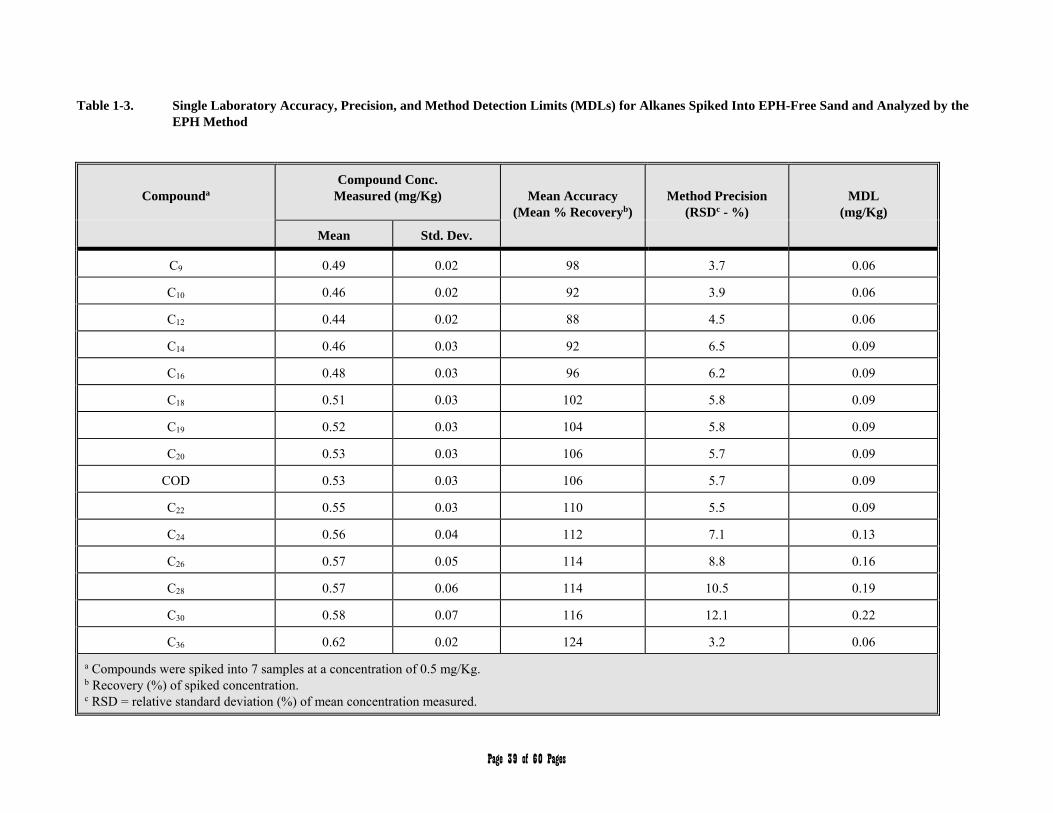
Page 39 of 60 Pages
Table 1-3. Single Laboratory Accuracy, Precision, and Method Detection Limits (MDLs) for Alkanes Spiked Into EPH-Free Sand and Analyzed by the
EPH Method
Compounda
Compound Conc. Measured (mg/Kg)
Mean Accuracy
(Mean % Recoveryb)
Method Precision
(RSDc - %)
MDL
(mg/Kg)
Mean Std. Dev.
C9 0.49 0.02 98 3.7 0.06
C10 0.46 0.02 92 3.9 0.06
C12 0.44 0.02 88 4.5 0.06
C14 0.46 0.03 92 6.5 0.09
C16 0.48 0.03 96 6.2 0.09
C18 0.51 0.03 102 5.8 0.09
C19 0.52 0.03 104 5.8 0.09
C20 0.53 0.03 106 5.7 0.09
COD 0.53 0.03 106 5.7 0.09
C22 0.55 0.03 110 5.5 0.09
C24 0.56 0.04 112 7.1 0.13
C26 0.57 0.05 114 8.8 0.16
C28 0.57 0.06 114 10.5 0.19
C30 0.58 0.07 116 12.1 0.22
C36 0.62 0.02 124 3.2 0.06
a Compounds were spiked into 7 samples at a concentration of 0.5 mg/Kg. b Recovery (%) of spiked concentration. c RSD = relative standard deviation (%) of mean concentration measured.
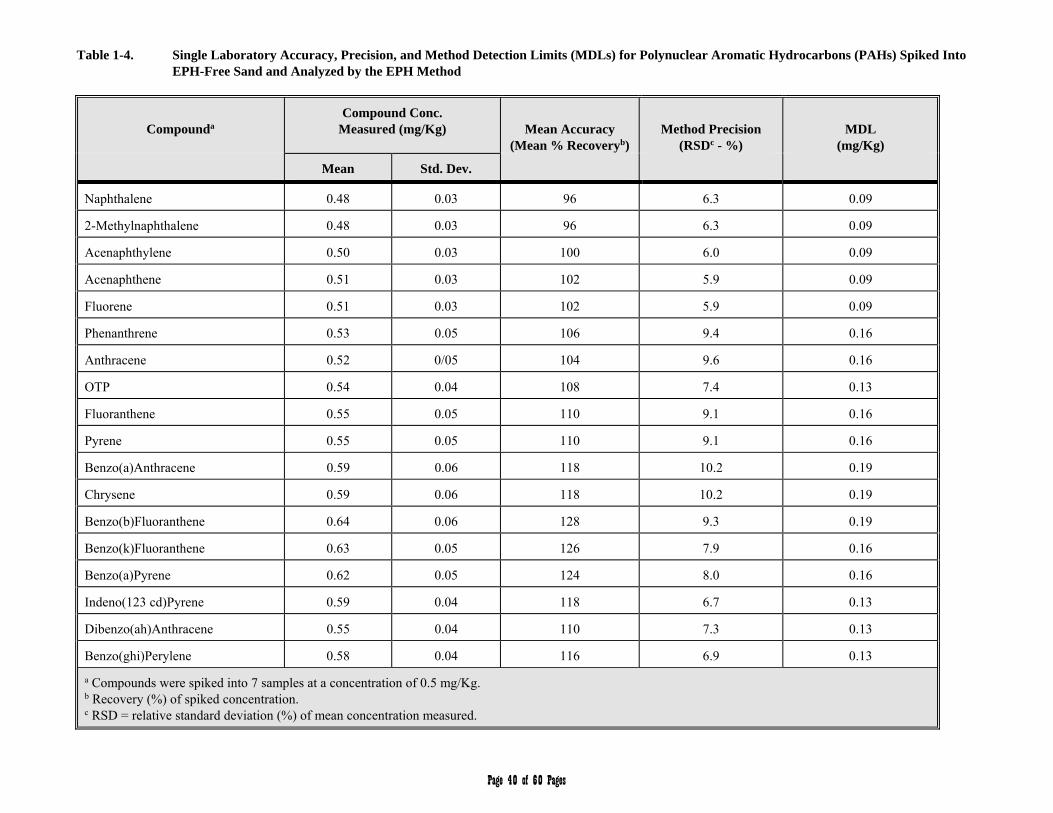
Page 40 of 60 Pages
Table 1-4. Single Laboratory Accuracy, Precision, and Method Detection Limits (MDLs) for Polynuclear Aromatic Hydrocarbons (PAHs) Spiked Into
EPH-Free Sand and Analyzed by the EPH Method
Compounda
Compound Conc. Measured (mg/Kg)
Mean Accuracy
(Mean % Recoveryb)
Method Precision
(RSDc - %)
MDL
(mg/Kg)
Mean Std. Dev.
Naphthalene 0.48 0.03 96 6.3 0.09
2-Methylnaphthalene 0.48 0.03 96 6.3 0.09
Acenaphthylene 0.50 0.03 100 6.0 0.09
Acenaphthene 0.51 0.03 102 5.9 0.09
Fluorene 0.51 0.03 102 5.9 0.09
Phenanthrene 0.53 0.05 106 9.4 0.16
Anthracene 0.52 0/05 104 9.6 0.16
OTP 0.54 0.04 108 7.4 0.13
Fluoranthene 0.55 0.05 110 9.1 0.16
Pyrene 0.55 0.05 110 9.1 0.16
Benzo(a)Anthracene 0.59 0.06 118 10.2 0.19
Chrysene 0.59 0.06 118 10.2 0.19
Benzo(b)Fluoranthene 0.64 0.06 128 9.3 0.19
Benzo(k)Fluoranthene 0.63 0.05 126 7.9 0.16
Benzo(a)Pyrene 0.62 0.05 124 8.0 0.16
Indeno(123 cd)Pyrene 0.59 0.04 118 6.7 0.13
Dibenzo(ah)Anthracene 0.55 0.04 110 7.3 0.13
Benzo(ghi)Perylene 0.58 0.04 116 6.9 0.13
a Compounds were spiked into 7 samples at a concentration of 0.5 mg/Kg. b Recovery (%) of spiked concentration. c RSD = relative standard deviation (%) of mean concentration measured.
Page 41 of 60 Pages
APPENDIX 2 CHROMATOGRAMS Figure 1 Gas Chromatogram (FID) of the EPH Alkane Component Standard (20 µg/L) Figure 2 Gas Chromatogram (FID) of the EPH PAH Component Standard (20 µg/L) Figure 3 Gas Chromatogram (FID) of a Diesel Standard (Aliphatic Fractions) Figure 4 Gas Chromatogram (FID) of a Diesel Standard (Aromatic Fraction)
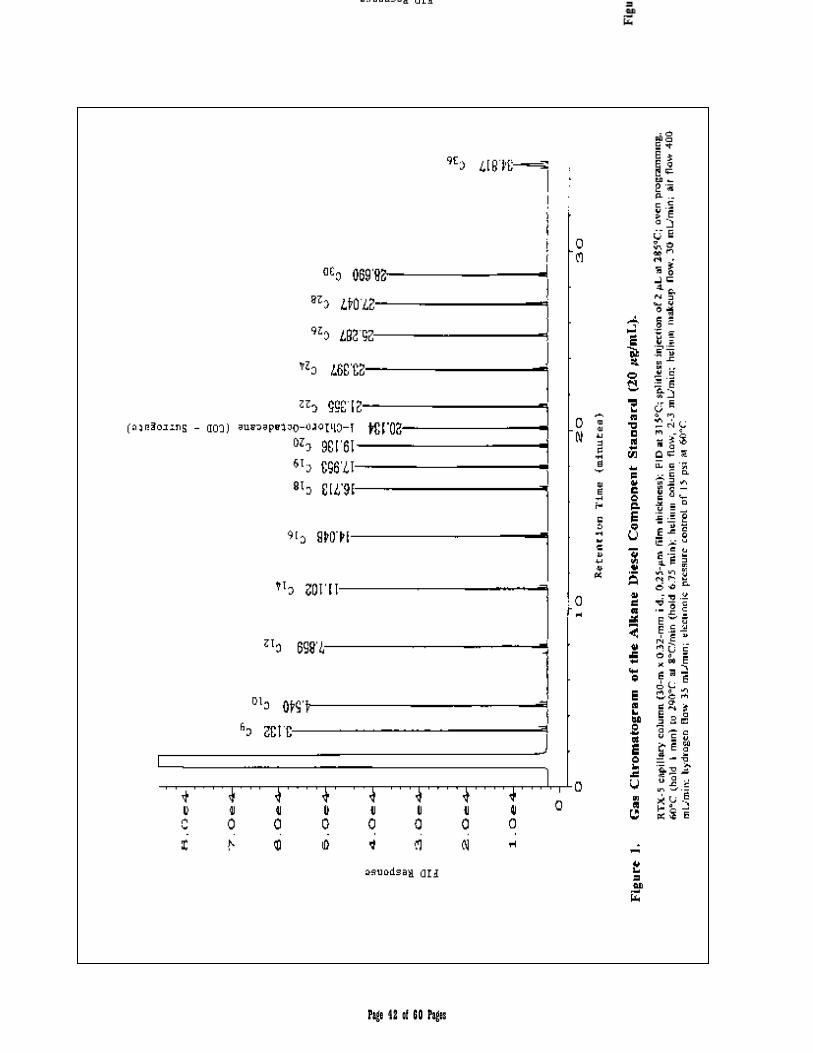
Page 42 of 60 Pages
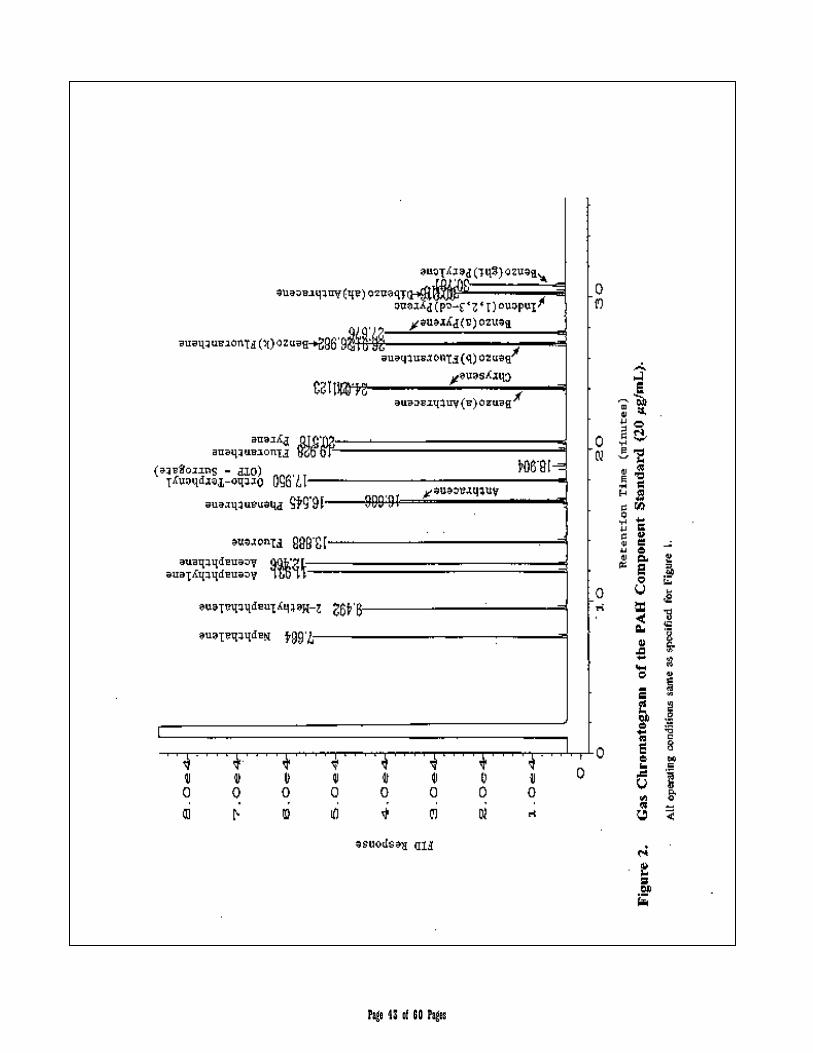
Page 43 of 60 Pages
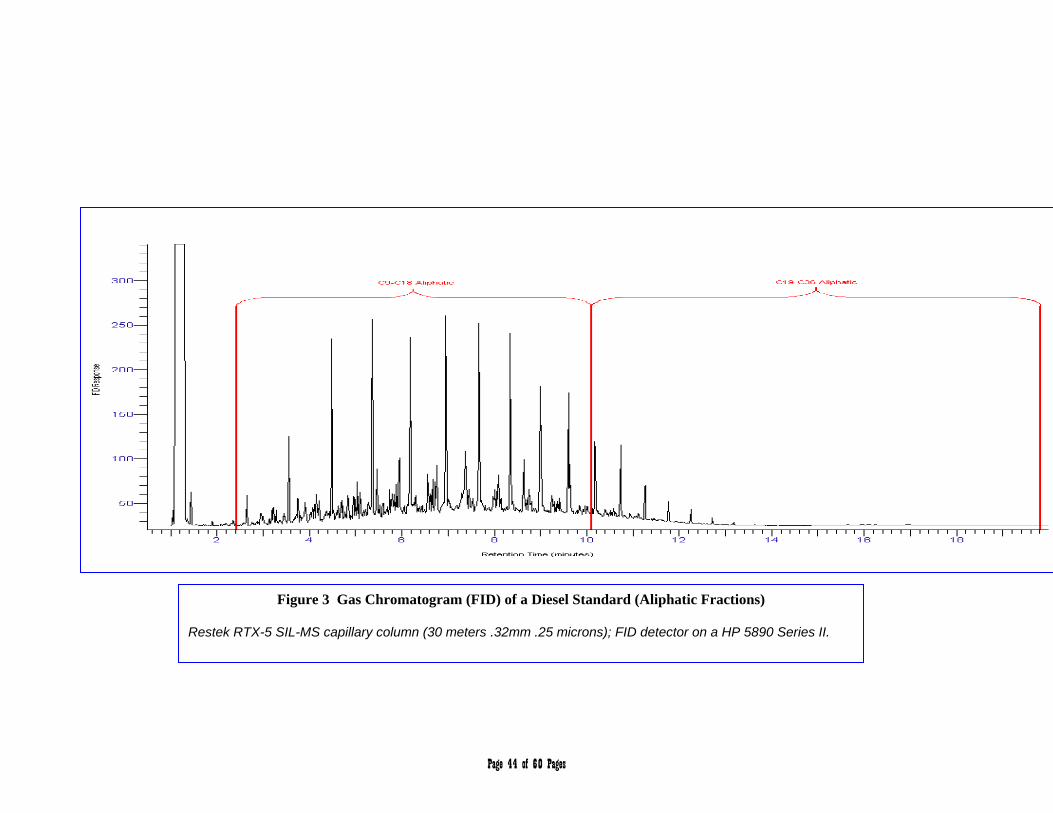
Page 44 of 60 Pages
Figure 3 Gas Chromatogram (FID) of a Diesel Standard (Aliphatic Fractions) Restek RTX-5 SIL-MS capillary column (30 meters .32mm .25 microns); FID detector on a HP 5890 Series II.
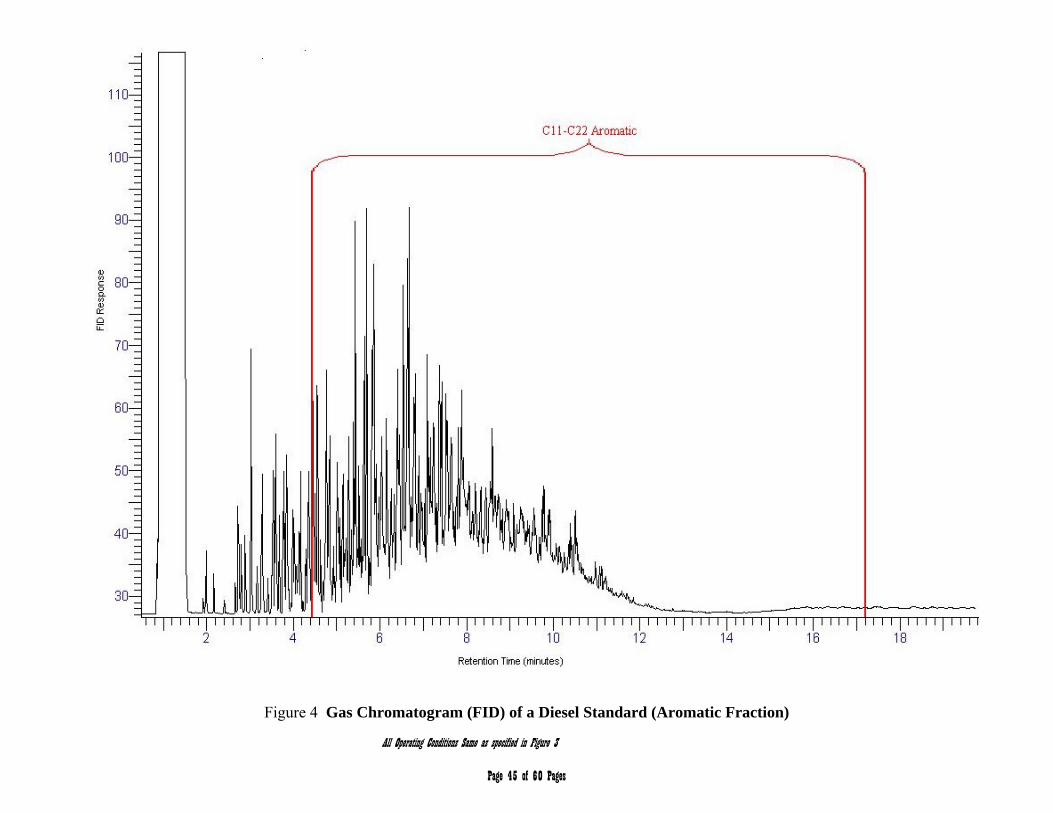
Page 45 of 60 Pages
Figure 4 Gas Chromatogram (FID) of a Diesel Standard (Aromatic Fraction)
All Operating Conditions Same as specified in Figure 3
Page 46 of 60 Pages
APPENDIX 3
REQUIRED EPH and TPH DATA REPORT INFORMATION
Exhibit 1. Required EPH and TPH Data Report Information (2 Pages) Exhibit 2. MADEP MCP ANALYTICAL METHOD REPORT CERTIFICATION FORM
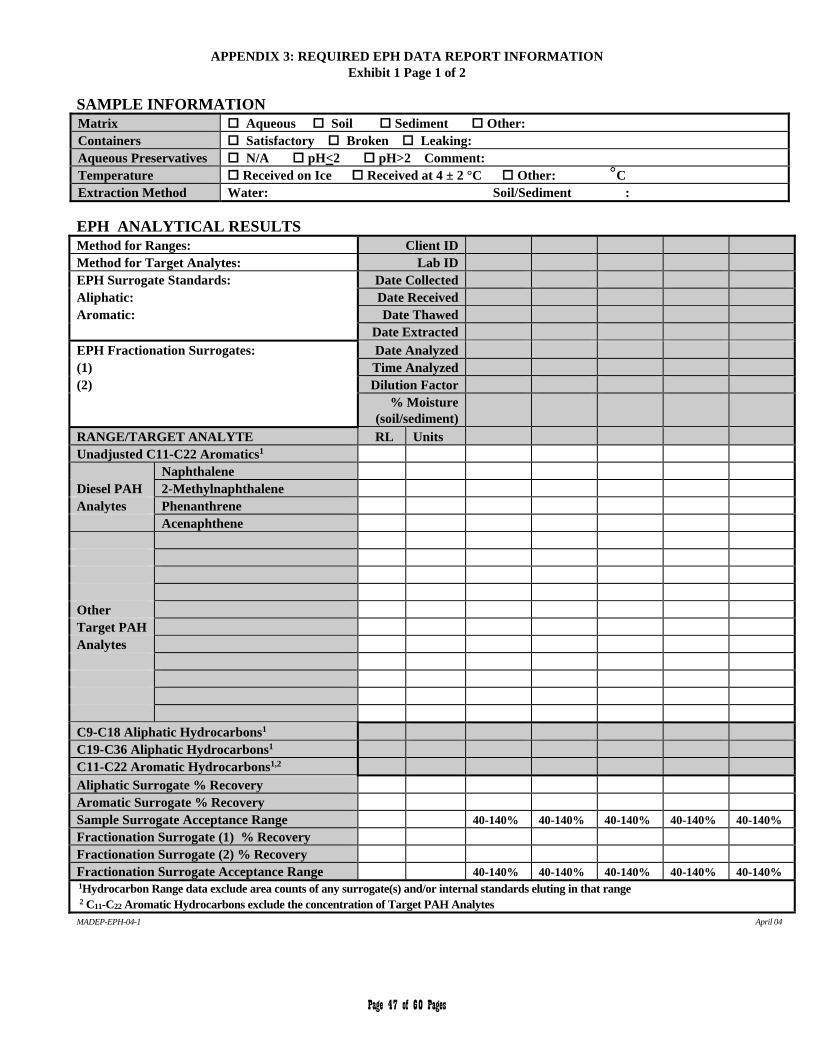
Page 47 of 60 Pages
APPENDIX 3: REQUIRED EPH DATA REPORT INFORMATION Exhibit 1 Page 1 of 2
SAMPLE INFORMATION Matrix Aqueous Soil Sediment Other: Containers Satisfactory Broken Leaking: Aqueous Preservatives N/A pH<2 pH>2 Comment: Temperature Received on Ice Received at 4 ± 2 °C Other: °C Extraction Method Water: Soil/Sediment : EPH ANALYTICAL RESULTS Method for Ranges: Client ID Method for Target Analytes: Lab ID EPH Surrogate Standards: Date Collected Aliphatic: Date Received Aromatic: Date Thawed Date Extracted EPH Fractionation Surrogates: Date Analyzed (1) Time Analyzed (2) Dilution Factor % Moisture
(soil/sediment)
RANGE/TARGET ANALYTE RL Units Unadjusted C11-C22 Aromatics1 Naphthalene Diesel PAH 2-Methylnaphthalene Analytes Phenanthrene Acenaphthene Other Target PAH Analytes C9-C18 Aliphatic Hydrocarbons1 C19-C36 Aliphatic Hydrocarbons1 C11-C22 Aromatic Hydrocarbons1,2 Aliphatic Surrogate % Recovery Aromatic Surrogate % Recovery Sample Surrogate Acceptance Range 40-140% 40-140% 40-140% 40-140% 40-140%
Fractionation Surrogate (1) % Recovery Fractionation Surrogate (2) % Recovery
Fractionation Surrogate Acceptance Range 40-140% 40-140% 40-140% 40-140% 40-140% 1Hydrocarbon Range data exclude area counts of any surrogate(s) and/or internal standards eluting in that range 2 C11-C22 Aromatic Hydrocarbons exclude the concentration of Target PAH Analytes MADEP-EPH-04-1 April 04
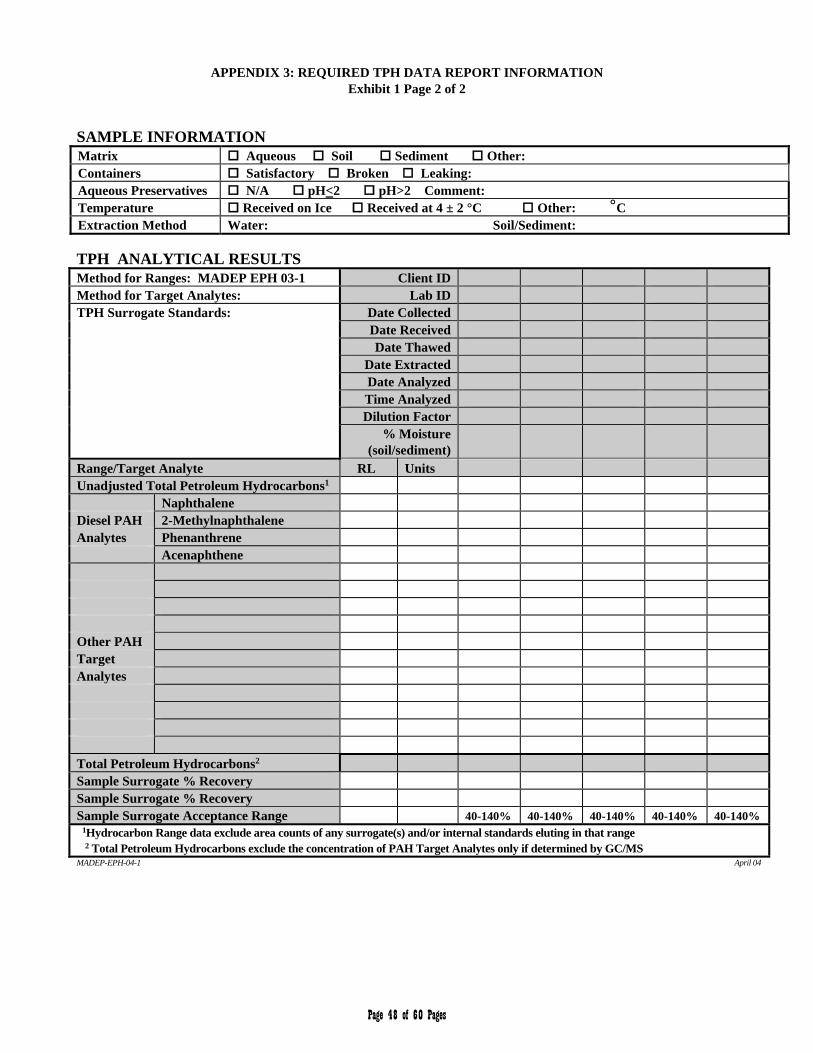
Page 48 of 60 Pages
APPENDIX 3: REQUIRED TPH DATA REPORT INFORMATION
Exhibit 1 Page 2 of 2
SAMPLE INFORMATION Matrix Aqueous Soil Sediment Other: Containers Satisfactory Broken Leaking: Aqueous Preservatives N/A pH<2 pH>2 Comment: Temperature Received on Ice Received at 4 ± 2 °C Other: °C Extraction Method Water: Soil/Sediment: TPH ANALYTICAL RESULTS Method for Ranges: MADEP EPH 03-1 Client ID Method for Target Analytes: Lab ID TPH Surrogate Standards: Date Collected Date Received Date Thawed Date Extracted Date Analyzed Time Analyzed Dilution Factor % Moisture
(soil/sediment)
Range/Target Analyte RL Units Unadjusted Total Petroleum Hydrocarbons1 Naphthalene Diesel PAH 2-Methylnaphthalene Analytes Phenanthrene Acenaphthene Other PAH Target Analytes Total Petroleum Hydrocarbons2 Sample Surrogate % Recovery Sample Surrogate % Recovery Sample Surrogate Acceptance Range 40-140% 40-140% 40-140% 40-140% 40-140% 1Hydrocarbon Range data exclude area counts of any surrogate(s) and/or internal standards eluting in that range 2 Total Petroleum Hydrocarbons exclude the concentration of PAH Target Analytes only if determined by GC/MS MADEP-EPH-04-1 April 04
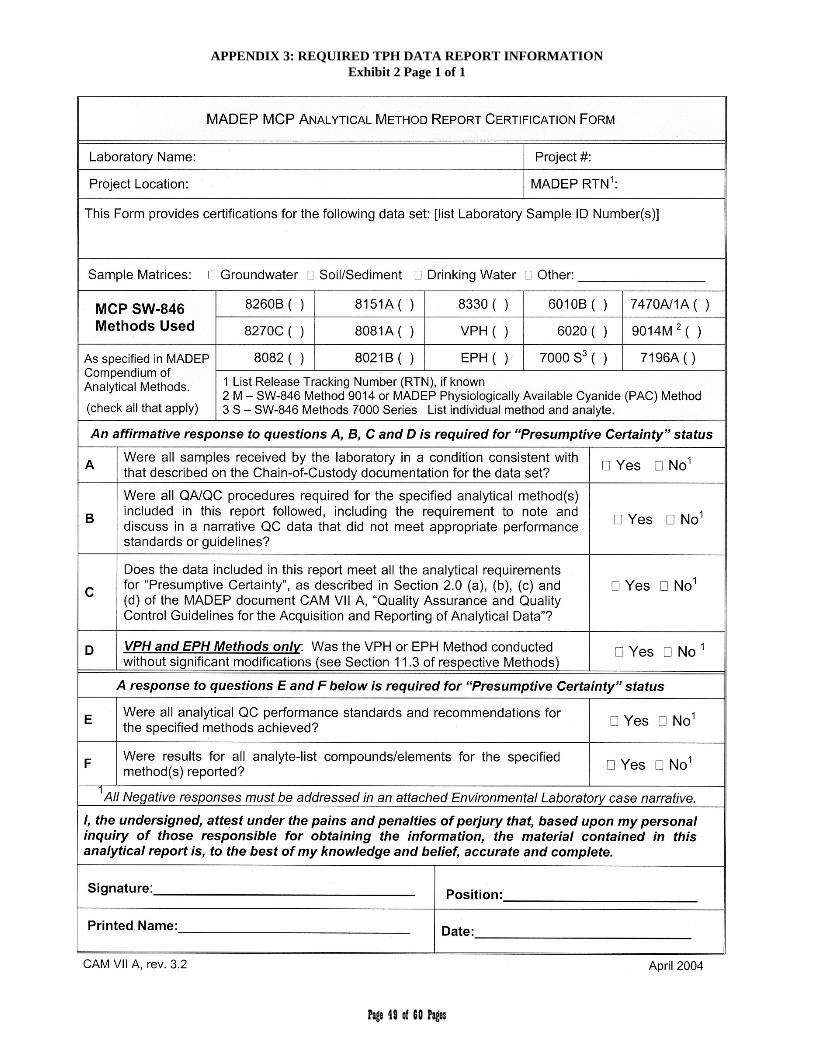
Page 49 of 60 Pages
APPENDIX 3: REQUIRED TPH DATA REPORT INFORMATION Exhibit 2 Page 1 of 1
Page 50 of 60 Pages
APPENDIX 4
EPH Calibration and Analysis Using Linear Regression
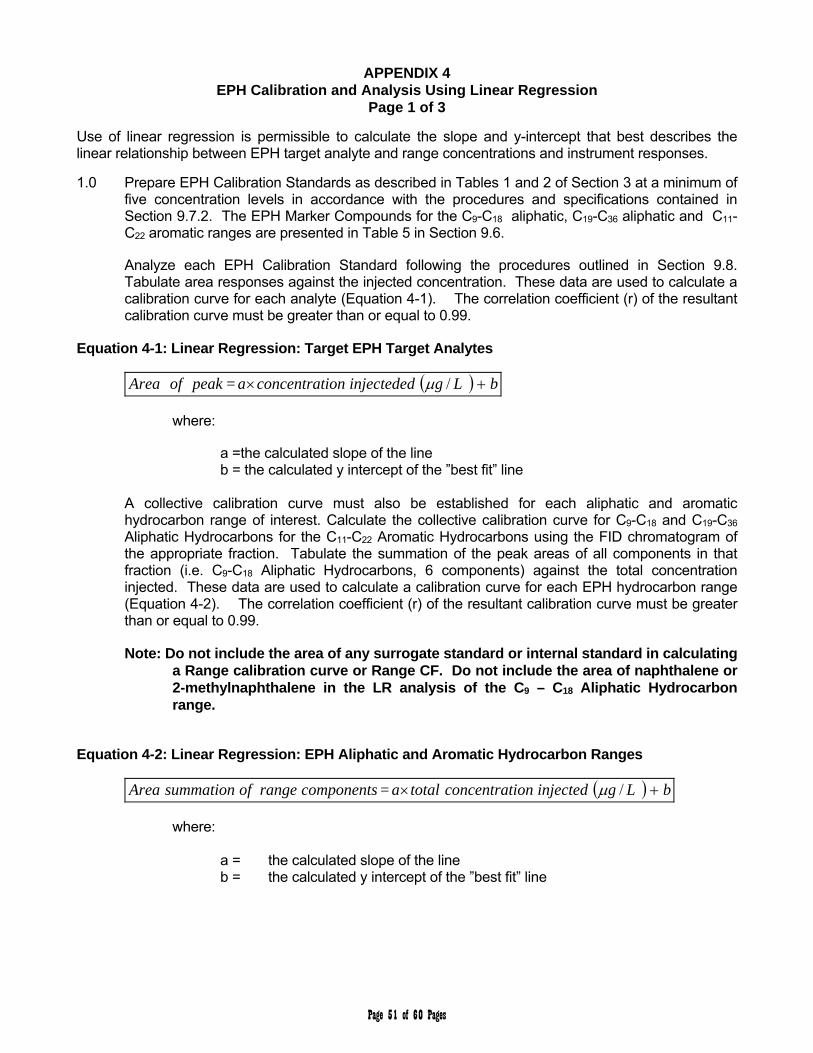
Page 51 of 60 Pages
APPENDIX 4
EPH Calibration and Analysis Using Linear Regression Page 1 of 3
Use of linear regression is permissible to calculate the slope and y-intercept that best describes the linear relationship between EPH target analyte and range concentrations and instrument responses.
1.0 Prepare EPH Calibration Standards as described in Tables 1 and 2 of Section 3 at a minimum of five concentration levels in accordance with the procedures and specifications contained in Section 9.7.2. The EPH Marker Compounds for the C9-C18 aliphatic, C19-C36 aliphatic and C11-C22 aromatic ranges are presented in Table 5 in Section 9.6.
Analyze each EPH Calibration Standard following the procedures outlined in Section 9.8. Tabulate area responses against the injected concentration. These data are used to calculate a calibration curve for each analyte (Equation 4-1). The correlation coefficient (r) of the resultant calibration curve must be greater than or equal to 0.99.
Equation 4-1: Linear Regression: Target EPH Target Analytes
bLginjectededionconcentrata= peakofArea /
where: a =the calculated slope of the line b = the calculated y intercept of the ”best fit” line
A collective calibration curve must also be established for each aliphatic and aromatic hydrocarbon range of interest. Calculate the collective calibration curve for C9-C18 and C19-C36 Aliphatic Hydrocarbons for the C11-C22 Aromatic Hydrocarbons using the FID chromatogram of the appropriate fraction. Tabulate the summation of the peak areas of all components in that fraction (i.e. C9-C18 Aliphatic Hydrocarbons, 6 components) against the total concentration injected. These data are used to calculate a calibration curve for each EPH hydrocarbon range (Equation 4-2). The correlation coefficient (r) of the resultant calibration curve must be greater than or equal to 0.99.
Note: Do not include the area of any surrogate standard or internal standard in calculating
a Range calibration curve or Range CF. Do not include the area of naphthalene or 2-methylnaphthalene in the LR analysis of the C9 – C18 Aliphatic Hydrocarbon range.
Equation 4-2: Linear Regression: EPH Aliphatic and Aromatic Hydrocarbon Ranges
bLginjectedionconcentrattotala= componentsrangeofsummationArea /
where: a = the calculated slope of the line b = the calculated y intercept of the ”best fit” line
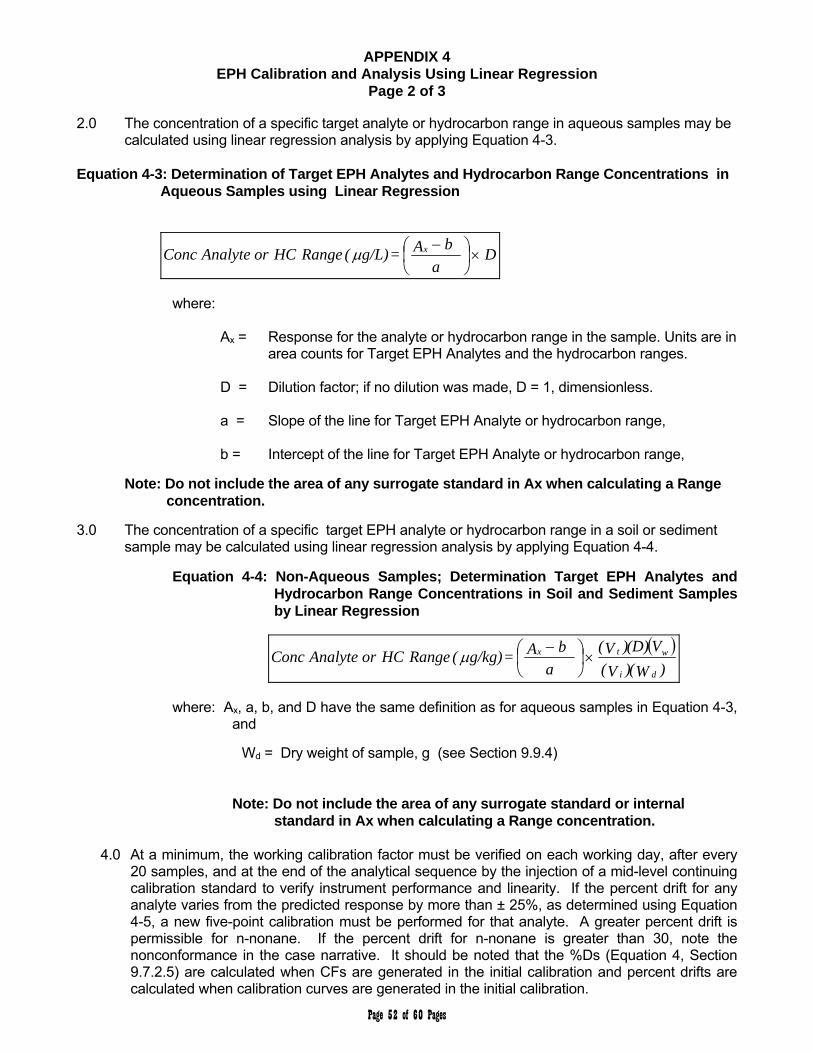
Page 52 of 60 Pages
APPENDIX 4 EPH Calibration and Analysis Using Linear Regression
Page 2 of 3 2.0 The concentration of a specific target analyte or hydrocarbon range in aqueous samples may be
calculated using linear regression analysis by applying Equation 4-3. Equation 4-3: Determination of Target EPH Analytes and Hydrocarbon Range Concentrations in
Aqueous Samples using Linear Regression
Da
bA = g/L)( RangeHCorAnalyte Conc x
where:
Ax = Response for the analyte or hydrocarbon range in the sample. Units are in area counts for Target EPH Analytes and the hydrocarbon ranges.
D = Dilution factor; if no dilution was made, D = 1, dimensionless. a = Slope of the line for Target EPH Analyte or hydrocarbon range,
b = Intercept of the line for Target EPH Analyte or hydrocarbon range,
Note: Do not include the area of any surrogate standard in Ax when calculating a Range concentration.
3.0 The concentration of a specific target EPH analyte or hydrocarbon range in a soil or sediment sample may be calculated using linear regression analysis by applying Equation 4-4.
Equation 4-4: Non-Aqueous Samples; Determination Target EPH Analytes and Hydrocarbon Range Concentrations in Soil and Sediment Samples by Linear Regression
)W()V(
V(D))V(
a
bA = g/kg)( RangeHCorAnalyte Concdi
wtx
where: Ax, a, b, and D have the same definition as for aqueous samples in Equation 4-3,
and
Wd = Dry weight of sample, g (see Section 9.9.4)
Note: Do not include the area of any surrogate standard or internal
standard in Ax when calculating a Range concentration.
4.0 At a minimum, the working calibration factor must be verified on each working day, after every 20 samples, and at the end of the analytical sequence by the injection of a mid-level continuing calibration standard to verify instrument performance and linearity. If the percent drift for any analyte varies from the predicted response by more than ± 25%, as determined using Equation 4-5, a new five-point calibration must be performed for that analyte. A greater percent drift is permissible for n-nonane. If the percent drift for n-nonane is greater than 30, note the nonconformance in the case narrative. It should be noted that the %Ds (Equation 4, Section 9.7.2.5) are calculated when CFs are generated in the initial calibration and percent drifts are calculated when calibration curves are generated in the initial calibration.

Page 53 of 60 Pages
APPENDIX 4 EPH Calibration and Analysis Using Linear Regression
Page 3 of 3
For the closing continuing calibration standard (analyzed after every 20 samples, every 24 hours, or at end of analytical sequence), four compounds may exhibit percent differences or percent drifts greater than 25% but less than 40%.
Equation 4-5: Percent Drift
100 x ionconcentratlTheoretica
ionconcentratlTheoretica - ionconcentratCalculated = Drift%
Page 54 of 60 Pages
APPENDIX 5
INITIAL DEMONSTRATION OF LABORATORY CAPABILITY (IDLC)
for
MADEP EPH Method
1.0 Overview of the Initial Demonstration of Laboratory Capability (IDLC) Approach 2.0 Demonstration of Acceptable System Background 3.0 Initial Demonstration of Accuracy (IDA) 4.0 Initial Demonstration of Precision (IDP) 5.0 Initial Demonstration of Fractionation Efficiency 6.0 Method Detection Limit (MDL) Table 5-1 LOQ Sample Calculation for Seven (7) System Solvent Blanks (SSBs)
– EPH Ranges Table 5-2 Initial Demonstration Of Laboratory Capability QC Requirements
for EPH Analyses
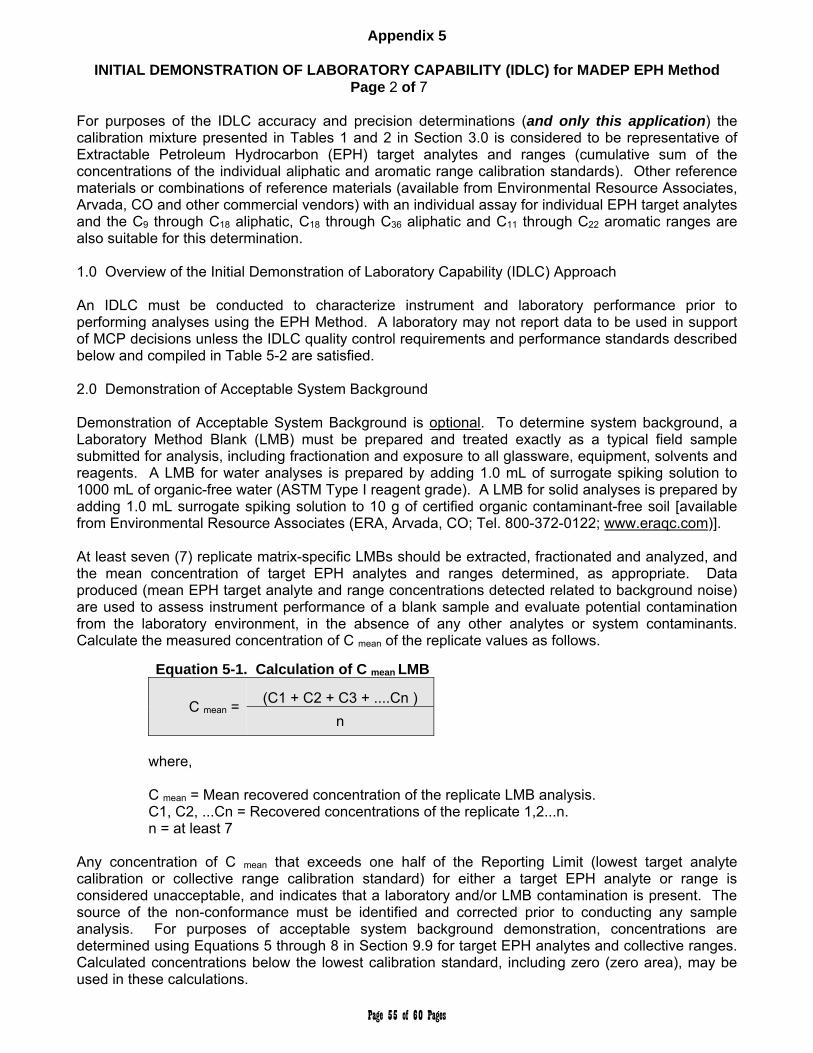
Page 55 of 60 Pages
Appendix 5
INITIAL DEMONSTRATION OF LABORATORY CAPABILITY (IDLC) for MADEP EPH Method Page 2 of 7
For purposes of the IDLC accuracy and precision determinations (and only this application) the calibration mixture presented in Tables 1 and 2 in Section 3.0 is considered to be representative of Extractable Petroleum Hydrocarbon (EPH) target analytes and ranges (cumulative sum of the concentrations of the individual aliphatic and aromatic range calibration standards). Other reference materials or combinations of reference materials (available from Environmental Resource Associates, Arvada, CO and other commercial vendors) with an individual assay for individual EPH target analytes and the C9 through C18 aliphatic, C18 through C36 aliphatic and C11 through C22 aromatic ranges are also suitable for this determination. 1.0 Overview of the Initial Demonstration of Laboratory Capability (IDLC) Approach An IDLC must be conducted to characterize instrument and laboratory performance prior to performing analyses using the EPH Method. A laboratory may not report data to be used in support of MCP decisions unless the IDLC quality control requirements and performance standards described below and compiled in Table 5-2 are satisfied. 2.0 Demonstration of Acceptable System Background Demonstration of Acceptable System Background is optional. To determine system background, a Laboratory Method Blank (LMB) must be prepared and treated exactly as a typical field sample submitted for analysis, including fractionation and exposure to all glassware, equipment, solvents and reagents. A LMB for water analyses is prepared by adding 1.0 mL of surrogate spiking solution to 1000 mL of organic-free water (ASTM Type I reagent grade). A LMB for solid analyses is prepared by adding 1.0 mL surrogate spiking solution to 10 g of certified organic contaminant-free soil [available from Environmental Resource Associates (ERA, Arvada, CO; Tel. 800-372-0122; www.eraqc.com)]. At least seven (7) replicate matrix-specific LMBs should be extracted, fractionated and analyzed, and the mean concentration of target EPH analytes and ranges determined, as appropriate. Data produced (mean EPH target analyte and range concentrations detected related to background noise) are used to assess instrument performance of a blank sample and evaluate potential contamination from the laboratory environment, in the absence of any other analytes or system contaminants. Calculate the measured concentration of C mean of the replicate values as follows.
Equation 5-1. Calculation of C mean LMB
C mean = (C1 + C2 + C3 + ....Cn )
n
where, C mean = Mean recovered concentration of the replicate LMB analysis. C1, C2, ...Cn = Recovered concentrations of the replicate 1,2...n. n = at least 7
Any concentration of C mean that exceeds one half of the Reporting Limit (lowest target analyte calibration or collective range calibration standard) for either a target EPH analyte or range is considered unacceptable, and indicates that a laboratory and/or LMB contamination is present. The source of the non-conformance must be identified and corrected prior to conducting any sample analysis. For purposes of acceptable system background demonstration, concentrations are determined using Equations 5 through 8 in Section 9.9 for target EPH analytes and collective ranges. Calculated concentrations below the lowest calibration standard, including zero (zero area), may be used in these calculations.
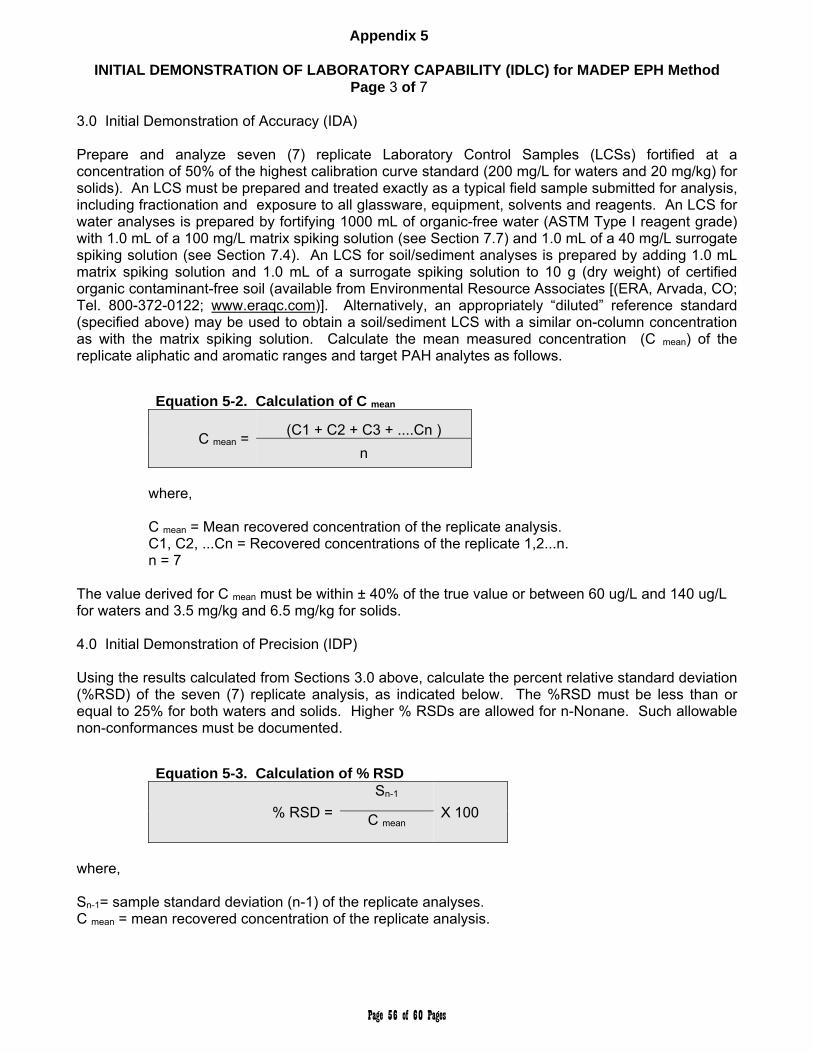
Page 56 of 60 Pages
Appendix 5
INITIAL DEMONSTRATION OF LABORATORY CAPABILITY (IDLC) for MADEP EPH Method Page 3 of 7
3.0 Initial Demonstration of Accuracy (IDA) Prepare and analyze seven (7) replicate Laboratory Control Samples (LCSs) fortified at a concentration of 50% of the highest calibration curve standard (200 mg/L for waters and 20 mg/kg) for solids). An LCS must be prepared and treated exactly as a typical field sample submitted for analysis, including fractionation and exposure to all glassware, equipment, solvents and reagents. An LCS for water analyses is prepared by fortifying 1000 mL of organic-free water (ASTM Type I reagent grade) with 1.0 mL of a 100 mg/L matrix spiking solution (see Section 7.7) and 1.0 mL of a 40 mg/L surrogate spiking solution (see Section 7.4). An LCS for soil/sediment analyses is prepared by adding 1.0 mL matrix spiking solution and 1.0 mL of a surrogate spiking solution to 10 g (dry weight) of certified organic contaminant-free soil (available from Environmental Resource Associates [(ERA, Arvada, CO; Tel. 800-372-0122; www.eraqc.com)]. Alternatively, an appropriately “diluted” reference standard (specified above) may be used to obtain a soil/sediment LCS with a similar on-column concentration as with the matrix spiking solution. Calculate the mean measured concentration (C mean) of the replicate aliphatic and aromatic ranges and target PAH analytes as follows.
Equation 5-2. Calculation of C mean
C mean = (C1 + C2 + C3 + ....Cn )
n
where, C mean = Mean recovered concentration of the replicate analysis. C1, C2, ...Cn = Recovered concentrations of the replicate 1,2...n. n = 7
The value derived for C mean must be within ± 40% of the true value or between 60 ug/L and 140 ug/L for waters and 3.5 mg/kg and 6.5 mg/kg for solids. 4.0 Initial Demonstration of Precision (IDP) Using the results calculated from Sections 3.0 above, calculate the percent relative standard deviation (%RSD) of the seven (7) replicate analysis, as indicated below. The %RSD must be less than or equal to 25% for both waters and solids. Higher % RSDs are allowed for n-Nonane. Such allowable non-conformances must be documented.
Equation 5-3. Calculation of % RSD
% RSD =
Sn-1
X 100 C mean
where, Sn-1= sample standard deviation (n-1) of the replicate analyses. C mean = mean recovered concentration of the replicate analysis.

Page 57 of 60 Pages
Appendix 5
INITIAL DEMONSTRATION OF LABORATORY CAPABILITY (IDLC) for MADEP EPH Method Page 4 of 7
5.0 Initial Demonstration of Fractionation Efficiency
A mixed aliphatic and aromatic hydrocarbon Fractionation Check Solution (FCS) is used to evaluate the separation efficiency of the silica gel cartridge/column and to establish the optimum hexane volume to efficiently elute aliphatic hydrocarbons while not allowing significant aromatic hydrocarbon breakthrough.
The Fractionation Check Solution (FCS) is prepared in hexane with a nominal concentration of 200 ng/µL of each Aliphatic Hydrocarbon standard (C9-C36 alkanes) and 200 ng/µL of each Aromatic Hydrocarbon standard (Target PAH Analytes) as described in Tables 1 and 2 in Section 3.0. The final Fractionation Check Solution will contain 14 alkanes and 17 PAHs each at a nominal concentration of 200 ng/µL. Alternative concentrations are permissible.
5.1 To demonstrate the capability of properly fractionating aliphatic and aromatic hydrocarbons at
least four (4) replicate FCSs (see Section 7.8) should be fractionated (using the fractionation procedures detailed in Section 9.2) and analyzed, and the mean measured concentration (Cx mean) of the individual fractionation check compounds determined (see below).
5.2 For each analyte included in the FCS, excluding n-nonane, the % mean recovery for four (4)
replicate samples, expressed as a percentage of the true value, must be between 40% and 140%. Lower recoveries are permissible for n-nonane. If recovery of n-nonane is <30%, the source of the problem should be found and the fractionation check repeated.
Equation 5-4. Calculation of % Mean Accuracy
% Mean Recovery = Cx mean * – True Concentration
X 100 True Concentration
* Cx mean = C1 + C2 + C3 ……. Cn
n
5.3 Subsequent to the initial demonstration of laboratory capability, it is recommended that a Fractionation Check Solution be analyzed for each new lot of silica gel/cartridges, to re-establish the optimum volume of hexane elution. NOTE: Within the same lot of cartridges, different mesh sizes and cartridge weights could exist. It is advisable to evaluate fractionation efficiency on a more frequent basis for large lots (> 500 units) to ensure consistent performance.
6.0 Method Detection Limit (MDL) The determination of MDL for the MADEP EPH Method is optional. The reporting limit (RL) for the Method is defined as the lowest calibration standard. Determination of the lowest detectable concentration of target EPH analytes and ranges is verified on a continuing basis by analysis of the lowest concentration calibration standard and recovery of method surrogates. The recommended RL concentrations for the EPH Method do not approach the sensitivity limits of the EPH Method for either target analytes or ranges and are more than adequate to meet the most stringent regulatory requirements of the MCP.
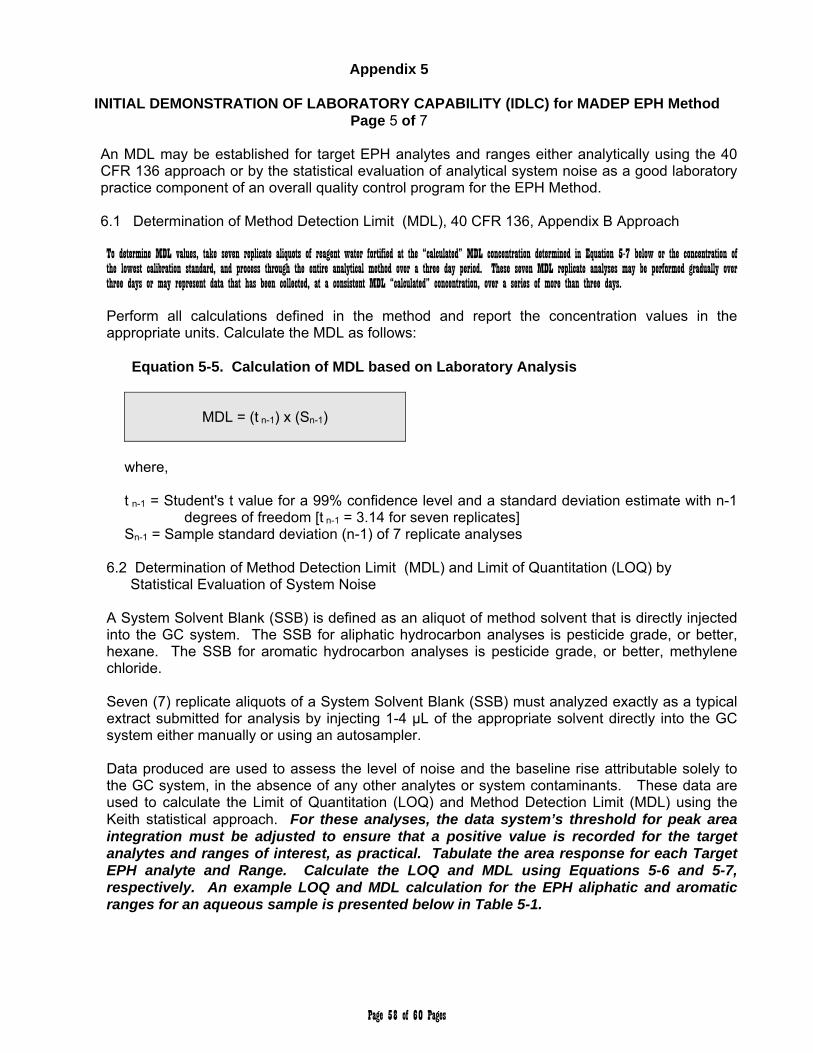
Page 58 of 60 Pages
Appendix 5
INITIAL DEMONSTRATION OF LABORATORY CAPABILITY (IDLC) for MADEP EPH Method Page 5 of 7
An MDL may be established for target EPH analytes and ranges either analytically using the 40 CFR 136 approach or by the statistical evaluation of analytical system noise as a good laboratory practice component of an overall quality control program for the EPH Method.
6.1 Determination of Method Detection Limit (MDL), 40 CFR 136, Appendix B Approach
To determine MDL values, take seven replicate aliquots of reagent water fortified at the “calculated” MDL concentration determined in Equation 5-7 below or the concentration of the lowest calibration standard, and process through the entire analytical method over a three day period. These seven MDL replicate analyses may be performed gradually over three days or may represent data that has been collected, at a consistent MDL “calculated” concentration, over a series of more than three days.
Perform all calculations defined in the method and report the concentration values in the appropriate units. Calculate the MDL as follows:
Equation 5-5. Calculation of MDL based on Laboratory Analysis
MDL = (t n-1) x (Sn-1)
where, t n-1 = Student's t value for a 99% confidence level and a standard deviation estimate with n-1
degrees of freedom [t n-1 = 3.14 for seven replicates] Sn-1 = Sample standard deviation (n-1) of 7 replicate analyses
6.2 Determination of Method Detection Limit (MDL) and Limit of Quantitation (LOQ) by
Statistical Evaluation of System Noise
A System Solvent Blank (SSB) is defined as an aliquot of method solvent that is directly injected into the GC system. The SSB for aliphatic hydrocarbon analyses is pesticide grade, or better, hexane. The SSB for aromatic hydrocarbon analyses is pesticide grade, or better, methylene chloride. Seven (7) replicate aliquots of a System Solvent Blank (SSB) must analyzed exactly as a typical extract submitted for analysis by injecting 1-4 µL of the appropriate solvent directly into the GC system either manually or using an autosampler.
Data produced are used to assess the level of noise and the baseline rise attributable solely to the GC system, in the absence of any other analytes or system contaminants. These data are used to calculate the Limit of Quantitation (LOQ) and Method Detection Limit (MDL) using the Keith statistical approach. For these analyses, the data system’s threshold for peak area integration must be adjusted to ensure that a positive value is recorded for the target analytes and ranges of interest, as practical. Tabulate the area response for each Target EPH analyte and Range. Calculate the LOQ and MDL using Equations 5-6 and 5-7, respectively. An example LOQ and MDL calculation for the EPH aliphatic and aromatic ranges for an aqueous sample is presented below in Table 5-1.
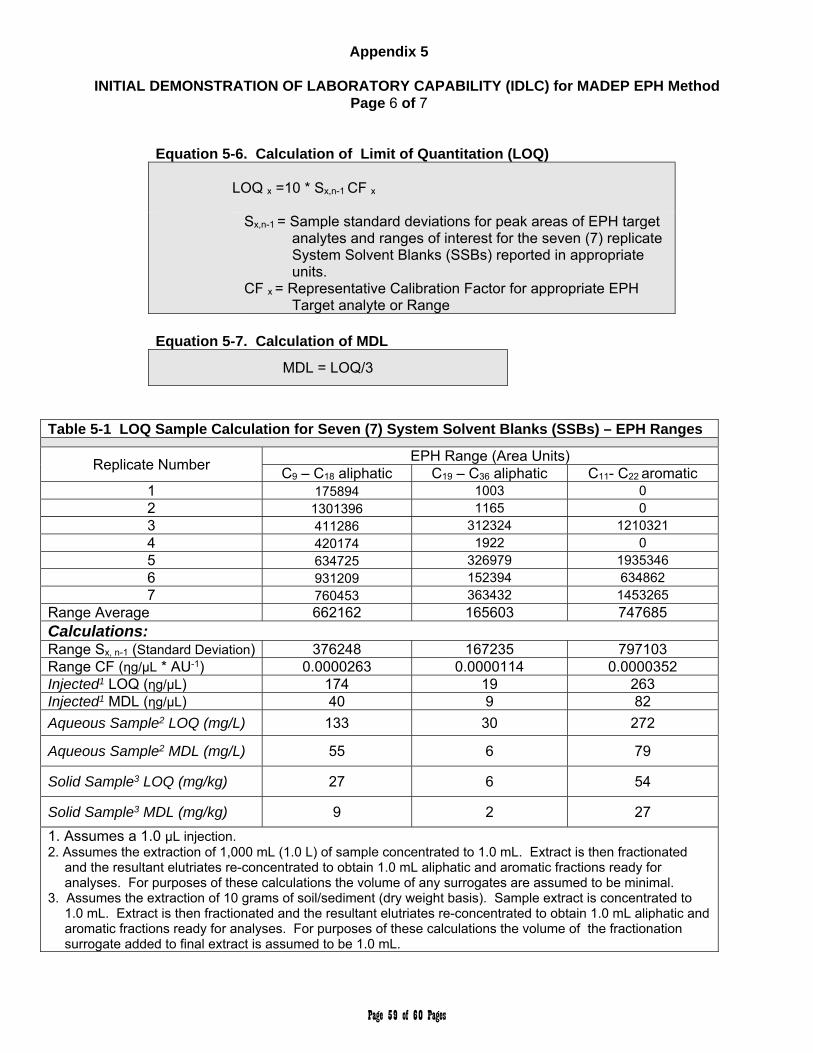
Page 59 of 60 Pages
Appendix 5
INITIAL DEMONSTRATION OF LABORATORY CAPABILITY (IDLC) for MADEP EPH Method
Page 6 of 7
Equation 5-6. Calculation of Limit of Quantitation (LOQ)
LOQ x =10 * Sx,n-1 CF x
Sx,n-1 = Sample standard deviations for peak areas of EPH target
analytes and ranges of interest for the seven (7) replicate System Solvent Blanks (SSBs) reported in appropriate units.
CF x = Representative Calibration Factor for appropriate EPH Target analyte or Range
Equation 5-7. Calculation of MDL
MDL = LOQ/3
Table 5-1 LOQ Sample Calculation for Seven (7) System Solvent Blanks (SSBs) – EPH Ranges
Replicate Number EPH Range (Area Units)
C9 – C18 aliphatic C19 – C36 aliphatic C11- C22 aromatic 1 175894 1003 0 2 1301396 1165 0 3 411286 312324 1210321 4 420174 1922 0 5 634725 326979 1935346 6 931209 152394 634862 7 760453 363432 1453265
Range Average 662162 165603 747685 Calculations: Range Sx, n-1 (Standard Deviation) 376248 167235 797103 Range CF (ηg/µL * AU-1) 0.0000263 0.0000114 0.0000352 Injected1 LOQ (ηg/µL) 174 19 263 Injected1 MDL (ηg/µL) 40 9 82
Aqueous Sample2 LOQ (mg/L) 133 30 272
Aqueous Sample2 MDL (mg/L) 55 6 79
Solid Sample3 LOQ (mg/kg) 27 6 54
Solid Sample3 MDL (mg/kg) 9 2 27
1. Assumes a 1.0 µL injection. 2. Assumes the extraction of 1,000 mL (1.0 L) of sample concentrated to 1.0 mL. Extract is then fractionated
and the resultant elutriates re-concentrated to obtain 1.0 mL aliphatic and aromatic fractions ready for analyses. For purposes of these calculations the volume of any surrogates are assumed to be minimal.
3. Assumes the extraction of 10 grams of soil/sediment (dry weight basis). Sample extract is concentrated to 1.0 mL. Extract is then fractionated and the resultant elutriates re-concentrated to obtain 1.0 mL aliphatic and aromatic fractions ready for analyses. For purposes of these calculations the volume of the fractionation surrogate added to final extract is assumed to be 1.0 mL.
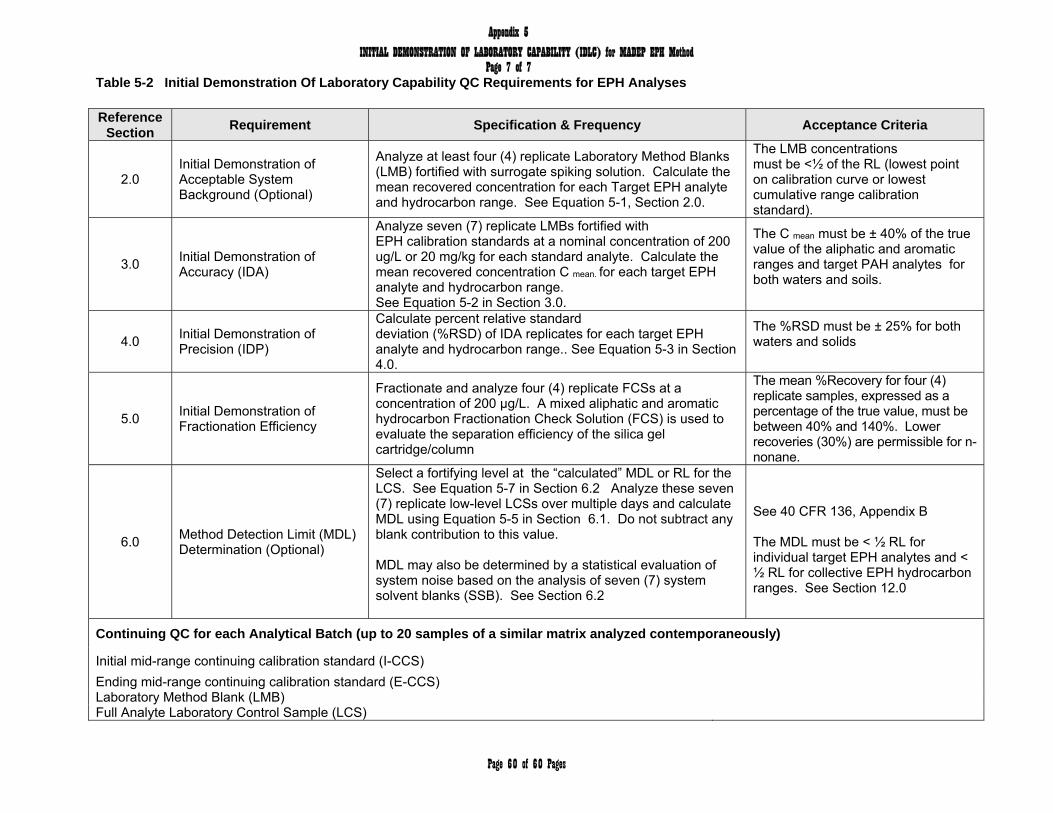
Page 60 of 60 Pages
Appendix 5
INITIAL DEMONSTRATION OF LABORATORY CAPABILITY (IDLC) for MADEP EPH Method Page 7 of 7
Table 5-2 Initial Demonstration Of Laboratory Capability QC Requirements for EPH Analyses
Reference Section
Requirement Specification & Frequency Acceptance Criteria
2.0 Initial Demonstration of Acceptable System Background (Optional)
Analyze at least four (4) replicate Laboratory Method Blanks (LMB) fortified with surrogate spiking solution. Calculate the mean recovered concentration for each Target EPH analyte and hydrocarbon range. See Equation 5-1, Section 2.0.
The LMB concentrations must be <½ of the RL (lowest point on calibration curve or lowest cumulative range calibration standard).
3.0 Initial Demonstration of Accuracy (IDA)
Analyze seven (7) replicate LMBs fortified with EPH calibration standards at a nominal concentration of 200 ug/L or 20 mg/kg for each standard analyte. Calculate the mean recovered concentration C mean. for each target EPH analyte and hydrocarbon range. See Equation 5-2 in Section 3.0.
The C mean must be ± 40% of the true value of the aliphatic and aromatic ranges and target PAH analytes for both waters and soils.
4.0 Initial Demonstration of Precision (IDP)
Calculate percent relative standard deviation (%RSD) of IDA replicates for each target EPH analyte and hydrocarbon range.. See Equation 5-3 in Section 4.0.
The %RSD must be ± 25% for both waters and solids
5.0 Initial Demonstration of Fractionation Efficiency
Fractionate and analyze four (4) replicate FCSs at a concentration of 200 µg/L. A mixed aliphatic and aromatic hydrocarbon Fractionation Check Solution (FCS) is used to evaluate the separation efficiency of the silica gel cartridge/column
The mean %Recovery for four (4) replicate samples, expressed as a percentage of the true value, must be between 40% and 140%. Lower recoveries (30%) are permissible for n-nonane.
6.0 Method Detection Limit (MDL) Determination (Optional)
Select a fortifying level at the “calculated” MDL or RL for the LCS. See Equation 5-7 in Section 6.2 Analyze these seven (7) replicate low-level LCSs over multiple days and calculate MDL using Equation 5-5 in Section 6.1. Do not subtract any blank contribution to this value. MDL may also be determined by a statistical evaluation of system noise based on the analysis of seven (7) system solvent blanks (SSB). See Section 6.2
See 40 CFR 136, Appendix B The MDL must be < ½ RL for individual target EPH analytes and < ½ RL for collective EPH hydrocarbon ranges. See Section 12.0
Continuing QC for each Analytical Batch (up to 20 samples of a similar matrix analyzed contemporaneously)
Initial mid-range continuing calibration standard (I-CCS)
Ending mid-range continuing calibration standard (E-CCS) Laboratory Method Blank (LMB) Full Analyte Laboratory Control Sample (LCS)