Embed Size (px)
Citation preview

General rights Copyright and moral rights for the publications made accessible in the public portal are retained by the authors and/or other copyright owners and it is a condition of accessing publications that users recognise and abide by the legal requirements associated with these rights.
Users may download and print one copy of any publication from the public portal for the purpose of private study or research.
You may not further distribute the material or use it for any profit-making activity or commercial gain
You may freely distribute the URL identifying the publication in the public portal If you believe that this document breaches copyright please contact us providing details, and we will remove access to the work immediately and investigate your claim.
Downloaded from orbit.dtu.dk on: Oct 13, 2019
Methane steam reforming kinetics over Ni-YSZ anodematerials for Solid OxideFuelCells
Mogensen, David
Publication date:2012
Document VersionPublisher's PDF, also known as Version of record
Link back to DTU Orbit
Citation (APA):Mogensen, D. (2012). Methane steam reforming kinetics over Ni-YSZ anodematerials for Solid Oxide FuelCells.Kgs. Lyngby: DTU Chemical Engineering.

David MogensenPh.D. ThesisJanuary 2011
Methane steam reforming kinetics over Ni-YSZ anodematerials for Solid Oxide FuelCells

Methane steam reforming kinetics
over Ni-YSZ anode materials for
Solid Oxide Fuel Cells
David Mogensen
Ph.D thesis
January 2011
Technical University of Denmark
Topsoe Fuel Cell A/S
Risø-DTU
1

2
Copyright©: David Mogensen
January 2011
Address: Center for Energy Resources Engineering
Department of Chemical and
Biochemical Engineering
Technical University of Denmark
Søltofts Plads, Building 229
DK-2800 Kgs. Lyngby
Denmark
Phone: +45 4525 2800
Fax: +45 4525 4588
Web: www.cere.dtu.dk
Print: J&R Frydenberg A/S
København
January 2012
ISBN: 978-87-92481-59-7
Contents
1 Introduction 4
1.1 Motivation for this Thesis . . . . . . . . . . . . . . . . . . . . . . . . . . . . . . . . 5
1.2 Solid Oxide Fuel Cell Technology . . . . . . . . . . . . . . . . . . . . . . . . . . . . 6
1.3 Steam Reforming . . . . . . . . . . . . . . . . . . . . . . . . . . . . . . . . . . . . . 7
2 Experimental Equipment and Methods 8
2.1 Packed Bed Reactor Setups . . . . . . . . . . . . . . . . . . . . . . . . . . . . . . . 8
2.2 Cell and Stack Setup . . . . . . . . . . . . . . . . . . . . . . . . . . . . . . . . . . . 10
2.3 Auxiliary Equipment . . . . . . . . . . . . . . . . . . . . . . . . . . . . . . . . . . . 10
2.4 Reduction Procedure . . . . . . . . . . . . . . . . . . . . . . . . . . . . . . . . . . . 11
2.5 Test Conditions . . . . . . . . . . . . . . . . . . . . . . . . . . . . . . . . . . . . . . 12
2.5.1 Packed Bed Experiments . . . . . . . . . . . . . . . . . . . . . . . . . . . . 12
2.5.2 Stack/Cell Measurements . . . . . . . . . . . . . . . . . . . . . . . . . . . . 13
2.6 Mass Transfer Limitation . . . . . . . . . . . . . . . . . . . . . . . . . . . . . . . . 15
2.7 Data Treatment . . . . . . . . . . . . . . . . . . . . . . . . . . . . . . . . . . . . . . 17
2.7.1 Experimental Uncertainty . . . . . . . . . . . . . . . . . . . . . . . . . . . . 18
3 Experimental Results 21
3.1 Dynamic Catalyst Behavior . . . . . . . . . . . . . . . . . . . . . . . . . . . . . . . 22
3.2 Characterization of Ni-YSZ Model catalyst . . . . . . . . . . . . . . . . . . . . . . 26
3.2.1 Scanning Electron Microscopy (SEM) . . . . . . . . . . . . . . . . . . . . . 26
3.2.2 Transmission Electron Microscopy (TEM) . . . . . . . . . . . . . . . . . . . 29
3.2.3 X-Ray Diffraction . . . . . . . . . . . . . . . . . . . . . . . . . . . . . . . . 34
3.2.4 Discussion . . . . . . . . . . . . . . . . . . . . . . . . . . . . . . . . . . . . . 35
3.3 Packed Bed Measurements . . . . . . . . . . . . . . . . . . . . . . . . . . . . . . . . 37
3.3.1 Model Anode Material . . . . . . . . . . . . . . . . . . . . . . . . . . . . . . 37
3.3.2 Industrial Anode . . . . . . . . . . . . . . . . . . . . . . . . . . . . . . . . . 42
3.3.3 Stack Samples . . . . . . . . . . . . . . . . . . . . . . . . . . . . . . . . . . 46
3.3.4 Temperature Dependence at Non-Steady State . . . . . . . . . . . . . . . . 51
3.4 Stack Measurements . . . . . . . . . . . . . . . . . . . . . . . . . . . . . . . . . . . 52
3

3.4.1 Half Cell . . . . . . . . . . . . . . . . . . . . . . . . . . . . . . . . . . . . . 53
3.4.2 Quarter Cell . . . . . . . . . . . . . . . . . . . . . . . . . . . . . . . . . . . 54
4 Kinetic Expressions 58
4.1 Intrinsic Kinetics . . . . . . . . . . . . . . . . . . . . . . . . . . . . . . . . . . . . . 59
4.2 Prediction of Stack Reforming Rate from Intrinsic Kinetics . . . . . . . . . . . . . 63
5 Modeling 68
5.0.1 Model Setup . . . . . . . . . . . . . . . . . . . . . . . . . . . . . . . . . . . 68
5.0.2 Performance and Results . . . . . . . . . . . . . . . . . . . . . . . . . . . . 71
6 Summary and Conclusion 76
7 Outlook 79
Bibliography 79
Appendices 85
A Equipment 86
A.1 Evaporator tests . . . . . . . . . . . . . . . . . . . . . . . . . . . . . . . . . . . . . 86
A.2 Piping and Instrumentation Diagrams . . . . . . . . . . . . . . . . . . . . . . . . . 89
B Reaction Rate Order Measurements 91
B.1 Reaction Rate Orders in Methane for the Model Anode . . . . . . . . . . . . . . . 91
B.2 Reaction Rate Orders in Methane for the Industrial Anode . . . . . . . . . . . . . 93
B.3 Reaction Rate Orders in Methane for the Stack Samples . . . . . . . . . . . . . . . 95
B.4 Half Cell Stack . . . . . . . . . . . . . . . . . . . . . . . . . . . . . . . . . . . . . . 97
B.4.1 Gas Composition Changes at T = 600oC . . . . . . . . . . . . . . . . . . . 97
B.4.2 Gas Composition Changes at T = 700oC . . . . . . . . . . . . . . . . . . . 98
B.4.3 Gas Composition Changes at T = 800oC . . . . . . . . . . . . . . . . . . . 99
B.5 Quarter Cell Stack . . . . . . . . . . . . . . . . . . . . . . . . . . . . . . . . . . . . 100
C Derivation of Kinetic Expressions 102
D Matlab Code for Simple Stack Reforming Model Calculations 106
E Estimation of Effects Neglected in Model Work 112
E.1 Temperature . . . . . . . . . . . . . . . . . . . . . . . . . . . . . . . . . . . . . . . 112
E.2 Pressure . . . . . . . . . . . . . . . . . . . . . . . . . . . . . . . . . . . . . . . . . . 113
F Heat Capacity 114
4

G Binary Diffusion Coefficients 115
Article I:
Article II:
Article III:
5

Preface
This work is financed by the Technical University of Denmark, Topsøe Fuel Cell A/S, and the
graduate school in Chemical Engineering: MP2T. All parties involved are greatly acknowledged
for financial support, and for providing facilities.
Topsoe Fuel Cell A/S and Haldor Topsøe A/S, are also acknowledged for providing both catalyst
material and stacks. A special thanks to Mikko Pihlatie from Risø-DTU for providing catalyst
samples from his own thesis work.
I am grateful to my supervisors Peter Vang Hendriksen (Risø-DTU) Jens Ulrik Nielsen (Topsoe
Fuel Cell A/S), Kim Dam-Johansen (DTU) and especially Jan-Dierk Grunwaldt (DTU) for their
guidance and discussions.
I would like to thank the CHEC group at KT-DTU, the SOFC group at Risø-DTU, and employees
at Topsoe Fuel Cell, for invaluable assistance in both practical and theoretical issues. In particular
Anders Tiedje (DTU) for his technical assistance and Mads Finn Madsen (Topsoe Fuel Cell A/S)
for his input and interest in the project. Jakob Birkedal Wagner (Center for Electron Nanoscopy
DTU) is thanked for for his aid with electron microscopy measurements. Also a thank you to
Jon Geest Jakobsen (DTU) for proofreading.
Finally, I would like to thank friends, family and colleagues for support, encouragement and
understanding.
1
6
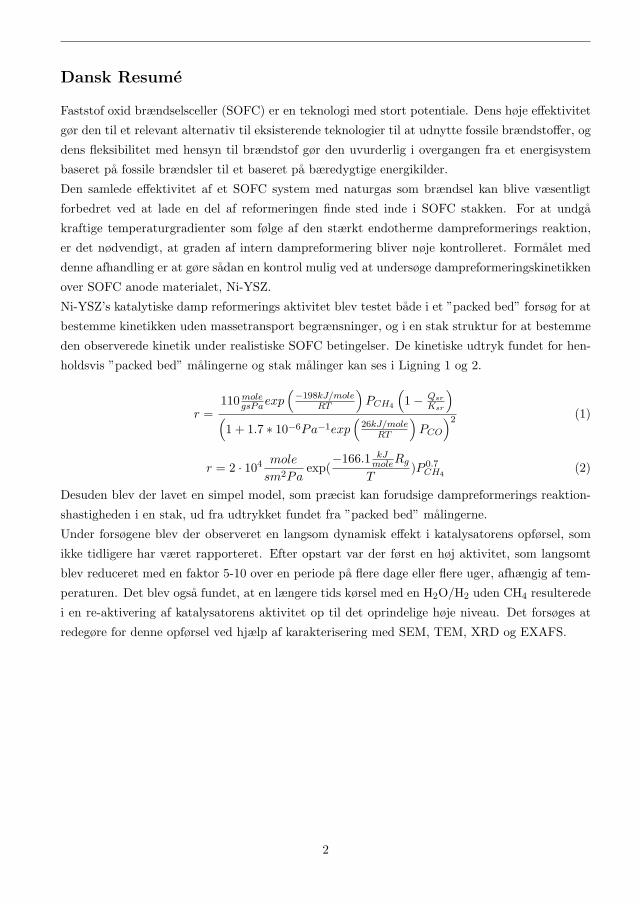
Dansk Resume
Faststof oxid brændselsceller (SOFC) er en teknologi med stort potentiale. Dens høje effektivitet
gør den til et relevant alternativ til eksisterende teknologier til at udnytte fossile brændstoffer, og
dens fleksibilitet med hensyn til brændstof gør den uvurderlig i overgangen fra et energisystem
baseret pa fossile brændsler til et baseret pa bæredygtige energikilder.
Den samlede effektivitet af et SOFC system med naturgas som brændsel kan blive væsentligt
forbedret ved at lade en del af reformeringen finde sted inde i SOFC stakken. For at undga
kraftige temperaturgradienter som følge af den stærkt endotherme dampreformerings reaktion,
er det nødvendigt, at graden af intern dampreformering bliver nøje kontrolleret. Formalet med
denne afhandling er at gøre sadan en kontrol mulig ved at undersøge dampreformeringskinetikken
over SOFC anode materialet, Ni-YSZ.
Ni-YSZ’s katalytiske damp reformerings aktivitet blev testet bade i et ”packed bed” forsøg for at
bestemme kinetikken uden massetransport begrænsninger, og i en stak struktur for at bestemme
den observerede kinetik under realistiske SOFC betingelser. De kinetiske udtryk fundet for hen-
holdsvis ”packed bed” malingerne og stak malinger kan ses i Ligning 1 og 2.
r =110 mole
gsPaexp(−198kJ/mole
RT
)PCH4
(1 − Qsr
Ksr
)(1 + 1.7 ∗ 10−6Pa−1exp
(26kJ/mole
RT
)PCO
)2 (1)
r = 2 · 104 mole
sm2Paexp(
−166.1 kJmoleRg
T)P 0.7
CH4(2)
Desuden blev der lavet en simpel model, som præcist kan forudsige dampreformerings reaktion-
shastigheden i en stak, ud fra udtrykket fundet fra ”packed bed” malingerne.
Under forsøgene blev der observeret en langsom dynamisk effekt i katalysatorens opførsel, som
ikke tidligere har været rapporteret. Efter opstart var der først en høj aktivitet, som langsomt
blev reduceret med en faktor 5-10 over en periode pa flere dage eller flere uger, afhængig af tem-
peraturen. Det blev ogsa fundet, at en længere tids kørsel med en H2O/H2 uden CH4 resulterede
i en re-aktivering af katalysatorens aktivitet op til det oprindelige høje niveau. Det forsøges at
redegøre for denne opførsel ved hjælp af karakterisering med SEM, TEM, XRD og EXAFS.
2
7
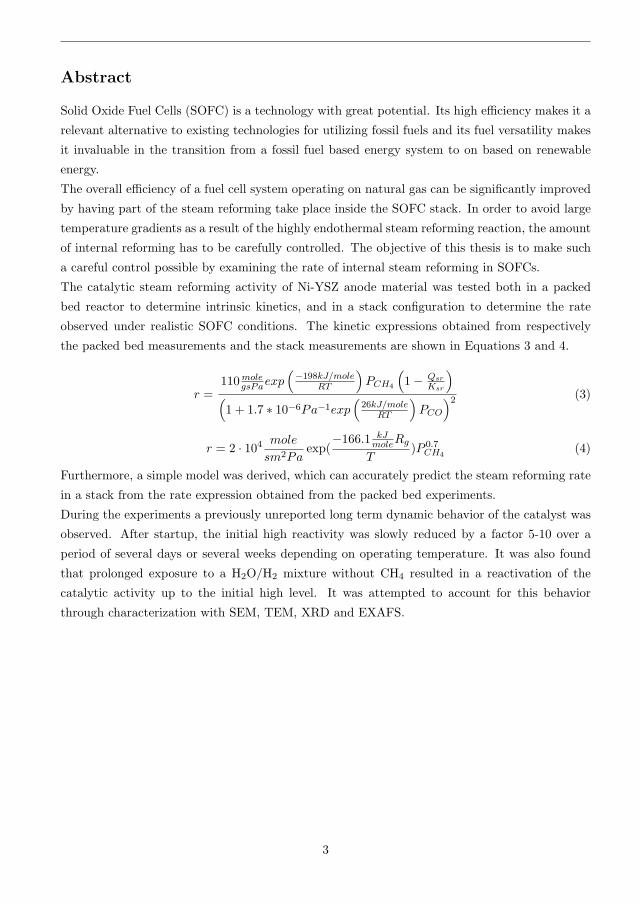
Abstract
Solid Oxide Fuel Cells (SOFC) is a technology with great potential. Its high efficiency makes it a
relevant alternative to existing technologies for utilizing fossil fuels and its fuel versatility makes
it invaluable in the transition from a fossil fuel based energy system to on based on renewable
energy.
The overall efficiency of a fuel cell system operating on natural gas can be significantly improved
by having part of the steam reforming take place inside the SOFC stack. In order to avoid large
temperature gradients as a result of the highly endothermal steam reforming reaction, the amount
of internal reforming has to be carefully controlled. The objective of this thesis is to make such
a careful control possible by examining the rate of internal steam reforming in SOFCs.
The catalytic steam reforming activity of Ni-YSZ anode material was tested both in a packed
bed reactor to determine intrinsic kinetics, and in a stack configuration to determine the rate
observed under realistic SOFC conditions. The kinetic expressions obtained from respectively
the packed bed measurements and the stack measurements are shown in Equations 3 and 4.
r =110 mole
gsPaexp(−198kJ/mole
RT
)PCH4
(1 − Qsr
Ksr
)(1 + 1.7 ∗ 10−6Pa−1exp
(26kJ/mole
RT
)PCO
)2 (3)
r = 2 · 104 mole
sm2Paexp(
−166.1 kJmoleRg
T)P 0.7
CH4(4)
Furthermore, a simple model was derived, which can accurately predict the steam reforming rate
in a stack from the rate expression obtained from the packed bed experiments.
During the experiments a previously unreported long term dynamic behavior of the catalyst was
observed. After startup, the initial high reactivity was slowly reduced by a factor 5-10 over a
period of several days or several weeks depending on operating temperature. It was also found
that prolonged exposure to a H2O/H2 mixture without CH4 resulted in a reactivation of the
catalytic activity up to the initial high level. It was attempted to account for this behavior
through characterization with SEM, TEM, XRD and EXAFS.
3
8

Chapter 1
Introduction
During the last decades there has been an increasing awareness of global warming indicated by
long term global temperature measurements [2]. Even though there is widespread consencus
in the scientific world that global warming is man made [37], it is still uncertain if the world
community can or will make the necessary changes to obtain sufficient decreases in the emissions
of greenhouse gases. There is, however, also a much more tangible problem regarding fossil fuels,
namely the fact that fossil fuel reserves are limited, and we are rapidly approaching that limit.
Worldwide fossil fuel reserves have recently been estimated to last for another 35 years for oil,
37 years for gas, and 107 years for coal [67]. Furthermore, worldwide crude oil production is
estimated to peak in 2014 [48], with following increase in prices, long before reserves run out. For
these reasons it is vital to gradually build up the usage of renewable energy sources, such as solar,
wind, water, and geothermal energy. Nuclear energy is also a viable alternative to fossil fuels,
but is also dependent on a limited fuel source, so it will only be a postponement of the supply
problem. Energy from biomass is one of the intensely studied research topics at the moment, but
in a system without fossil fuels, biomass will probably be needed as a carbon source for products
presently made from oil, such as plastics, paint and medicine. A common problem for most of
these energy sources is that they have very limited flexibility in the production and because of this
a renewable energy system will be dependent on a storage and conversion as well as production.
Many different energy carriers have been suggested for this purpose, e.g. electricity, hydrogen,
dimethylether, alcohols, ammonia, and synthetic diesel. In such a system, fuel cells would be a
suitable technology for direct electrochemical energy conversion with high efficiencies for a wide
variety of fuels.
The fuel cell principle was invented by William Robert Grove in 1838 and because it is not
limited by the Carnot cycle, like heat engines, it has always been viewed as a technology with
great potential because of the high theoretical maximum efficiency [22]. It has, however, proven
difficult to utilize the great potential of fuel cell technology and progress in the field has for long
periods been slow. In the beginning of the 1960’s the use of alkaline fuel cells in the Apollo
project re-ignited the interest in fuel cells and since then it has been a subject of many research
4
9

campaigns.
There are many types of fuel cells and they are normally divided into high temperature and low
temperature cells. Among the low temperature fuel cells, Polymer Electrolyte Membrane (PEM)
cells have received most attention recently, while Solid Oxide Fuel Cells (SOFC) are the most
promising of the high temperature fuel cells. These two types of fuel cells are suited for different
types of applications. PEM is best suited for small mobile applications, such as cell phones,
mp3 players and laptops. SOFC are best suited for stationary applications such as central or
distributed power power production where it is possible to utilize the high gas outlet temperature
to recover waste heat either for district heating or further power production.
1.1 Motivation for this Thesis
One of the major challenges in the transition from fossil fuel to fuels produced from renewable
energy is the question of what comes first, fuel supply infrastructure, or the applications that
use the fuel. This transition can be eased by promoting SOFC systems that can operate on both
natural gas, which is readily available now, and on fuels produced from renewable energy sources,
if the possibility should arise later.
There are many different materials being used for SOFCs, but this thesis work will only consider
cells with Lanthanum Strontium Manganese (LSM) cathode, YSZ electrolyte and Ni-YSZ anode.
Since Ni is a highly active steam reforming catalysts, is is possible to incorporate the steam
reforming inside the SOFC stack. The possible advantages of this is that the waste heat from
the electrochemical reactions can be used to to drive the highly endothermic steam reforming.
This will also reduce the need for cooling of the cell, which is normally achieved through a
high cathode gas flow. Furthermore, internal steam reforming can, if controlled properly, result
in lower temperature, and concentration gradients by gradually removing heat and producing
hydrogen through the cell.
The overall aim of this work is to increase the understanding of internal steam reforming in
SOFC’s to a point where the theoretical knowledge can be used to optimize design and operation
of SOFC systems.
A literature review of internal steam reforming in SOFCs has been published as a part of this
thesis [43]. One of the important facts is that with present SOFC technology and operating
temperatures, the steam reforming reaction is much faster than the electrochemical reactions. The
result of this is that internal steam reforming causes rapid cooling at the anode inlet, resulting in
large temperature gradients, reduced performance and even, in some cases, physical destruction
of the cell due to mechanical stress caused by the large temperature gradient.
Another major conclusions was that a large amount of modeling has been published on the
subject, but the model works are based on a very small number of experimental studies of the
catalytic activity of Ni-YSZ with respect to steam reforming. The few experimental studies are in
5
10

great disagreement, with rates varying by an order of magnitude, different reaction mechanisms
and values for the activation energy in the range 58-228 kJ/mol.
Because of this, it was decided that the focus of this thesis should be to obtain a reliable rate
expression for catalytic steam reforming over Ni-YSZ anode material. This was done both in a
packed bed, to obtain the intrinsic kinetics and in a stack configuration to obtain the rate under
realistic SOFC conditions. During the experimental work a number of previously unreported
long-term dynamic effects were discovered, which can explain many of the disagreements in the
rate expressions reported in literature, these are described in detail in Section 3.1.
1.2 Solid Oxide Fuel Cell Technology
The basic operating principle of a fuel cell is similar to that of a battery, i.e. it works by producing
electricity directly from a fuel via electrochemical reactions. The big difference between batteries
and fuel cells is that in a battery there is a limited amount of fuel and in a fuel cell, the fuel is
supplied continuously as illustrated in Figure 1.1(a). Thus making it possible to run a fuel cell
uninterrupted as long as it does not break down.
(a) Operating principle of an SOFC [4].
+
-
(b) Fuel cell stack [1].
Figure 1.1: Illustrations of the basic operating principle of an SOFC as well as the stacking of
fuel cells.
The dominant electrochemical reactions taking place in an SOFC is the oxidation of hydrogen
via the two half-cell reactions shown in Reactions 1.1 and 1.2.
Anode H2 + O2− → H2O + 2e− (1.1)
Cathode12O2 + 2e− → O2− (1.2)
6
11

When carbon species are present at the anode, Reaction 1.3 will also be taking place at the anode.
Anode CO + O2− → CO2 + 2e− (1.3)
The maximum voltage that these reactions can provide is 1.1 V, and this will decrease significantly
with increasing current. A voltage of this size is not usable for any large scale application, so in
order to increase the voltage, single cells are connected in series by stacking them as illustrated
in Figure 1.1(b).
1.3 Steam Reforming
The conversion of hydrocarbons to CO, CO2 and H2 is known as steam reforming. The process
is widely used in industry with the major uses being production of ammonia and methanol. It
is also by far the largest source of hydrogen for various purposes [62]. In a SOFC system fueled
with hydrocarbons, it is necessary to pre-reform the fuel to an extent where methane is the only
remaining hydrocarbon, since higher hydrocarbons would cause carbon deposition in the SOFC
stack. Because of this, only steam reforming of methane will be considered in this thesis.
The overall reaction for methane steam reforming is shown in Reaction 1.4 and this reaction
is always accompanied by the water gas shift reaction as shown in Reaction 1.5. The steam
reforming reaction is highly endothermic with a reaction enthalpy of 206 kJ/mol at 25 oC and
the water gas shift reaction is slightly exothermic with a reaction enthalpy of -41 kJ/mol at 25oC.
Steam reforming: CH4 + H2O � 3H2 + CO (1.4)
Water gas shift: CO + H2O � CO2 + H2 (1.5)
Many different metals are active steam reforming catalysts, but the most commonly used in
industrial catalysts is nickel, because it is relatively cheap and has a high activity. Even though
nickel is also the catalytic material in SOFC anodes, there are still large differences between
traditional steam reforming catalysts and Ni-YSZ for SOFCs. The traditional catalyst typically
uses alumina magnesium spinel as support material, and has a Ni content around 5% and Ni
Particle sizes around 5-10 nm. SOFC anodes use YSZ as support material, have a Ni content
around 40 vol% and the typical Ni particle size is ≈ 1μm. These differences mean that the
research performed on traditional steam reforming catalysts, cannot necessarily by transferred
directly to Ni-YSZ. Furthermore, there are still widespread disagreements on the kinetics of steam
reforming on traditional catalysts, in spite of the extensive research in the field. A review paper
on this subject has been published as a part of this thesis work, see Article I [43].
7
12

Chapter 2
Experimental Equipment and
Methods
The focus of the experimental work has been to determine the reaction kinetics of the steam
reforming reaction over Ni-YSZ anode material. In order to determine both the intrinsic kinet-
ics and the kinetics under realistic conditions, both the intrinsic kinetics over crushed catalyst
material in a packed bed reactor and the kinetics in an actual SOFC cell were investigated. The
experimental equipment used to perform the measurements is described in this chapter, along
with the standard procedures used during experiments.
2.1 Packed Bed Reactor Setups
Two different, but almost identical, fixed bed setups were used for determination of reaction
kinetics, hereafter referred to as 137-4A and 137-5B. The quartz reactor used in these setups is
illustrated in Figure 2.1, and a complete flowsheet of the setup can be seen in Appendix A.2.
The quartz reactor has a diameter of 2.8 cm, the catalyst bed has a diameter of 1.8 cm and the
typical bed height is around 2 cm. The catalyst bed is placed on a porous quartz frit where
the holes have a diameter of 100-160 μm. In order to avoid particles getting stuck in the frit,
a layer of around 0.5 cm quartz wool was placed between the frit and the bed. The distance
from the thermocouple to the bottom of the bed is 2-2.5 cm. The bed has approximately 4g of
particle material, primarily consisting of inert alumina, the amount of catalyst used is around
0.1g at high temperatures (700-800oC) and 0.4g at low temperatures (600-700oC). The catalyst
materials were supplied by Topsøe Fuel Cell A/S and Risø DTU.
To ensure that the reacting gas has the desired temperature, the primary inlet gas enters at the
bottom and flows through 112 times the oven height, in order to preheat it before it comes in
contact with the catalyst. The secondary inlet is mixed with the primary inlet just above the
catalyst bed, which means that the effect of CO and CO2 on the reaction rate can be investigated
8
13

Figure 2.1: Quartz reactor used for kinetic measurements on crushed catalysts [35].
at conditions where the water gas shift reaction is not at equilibrium. The inlets contains the
following gases.
primary inlet: CH4, H2O, N2 and CO2
secondary inlet: H2 and CO
CO and CO2 are only added in the experiments that investigate the influence of these species.
A small amount of hydrogen is added through the secondary inlet in all experiments, both to
maintain a reducing environment and to avoid having a dead volume in the secondary inlet tube.
The water is delivered by leading nitrogen through a heated bubble flask which is kept at 80oC,
and variations in water partial pressure are achieved by varying the amount of nitrogen going
through the bubble flask. In order to avoid unwanted condensation, the gas line was traced and
kept above 100oC. The bubble flask must be manually refilled daily in order to keep the water
flow steady. An extra heated water tank is added to the system in order to avoid a drop in
temperature when refilling the bubble flask.
9
14
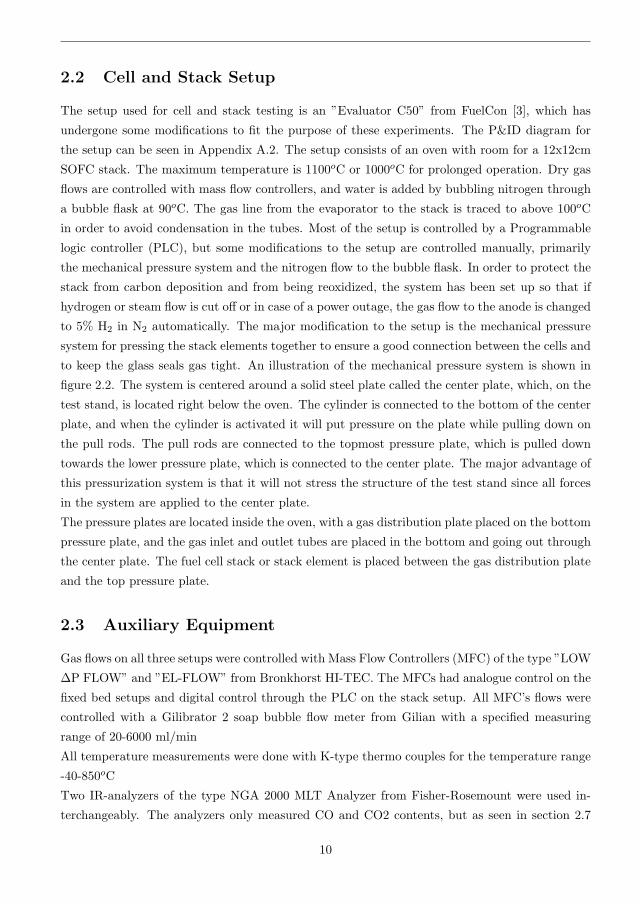
2.2 Cell and Stack Setup
The setup used for cell and stack testing is an ”Evaluator C50” from FuelCon [3], which has
undergone some modifications to fit the purpose of these experiments. The P&ID diagram for
the setup can be seen in Appendix A.2. The setup consists of an oven with room for a 12x12cm
SOFC stack. The maximum temperature is 1100oC or 1000oC for prolonged operation. Dry gas
flows are controlled with mass flow controllers, and water is added by bubbling nitrogen through
a bubble flask at 90oC. The gas line from the evaporator to the stack is traced to above 100oC
in order to avoid condensation in the tubes. Most of the setup is controlled by a Programmable
logic controller (PLC), but some modifications to the setup are controlled manually, primarily
the mechanical pressure system and the nitrogen flow to the bubble flask. In order to protect the
stack from carbon deposition and from being reoxidized, the system has been set up so that if
hydrogen or steam flow is cut off or in case of a power outage, the gas flow to the anode is changed
to 5% H2 in N2 automatically. The major modification to the setup is the mechanical pressure
system for pressing the stack elements together to ensure a good connection between the cells and
to keep the glass seals gas tight. An illustration of the mechanical pressure system is shown in
figure 2.2. The system is centered around a solid steel plate called the center plate, which, on the
test stand, is located right below the oven. The cylinder is connected to the bottom of the center
plate, and when the cylinder is activated it will put pressure on the plate while pulling down on
the pull rods. The pull rods are connected to the topmost pressure plate, which is pulled down
towards the lower pressure plate, which is connected to the center plate. The major advantage of
this pressurization system is that it will not stress the structure of the test stand since all forces
in the system are applied to the center plate.
The pressure plates are located inside the oven, with a gas distribution plate placed on the bottom
pressure plate, and the gas inlet and outlet tubes are placed in the bottom and going out through
the center plate. The fuel cell stack or stack element is placed between the gas distribution plate
and the top pressure plate.
2.3 Auxiliary Equipment
Gas flows on all three setups were controlled with Mass Flow Controllers (MFC) of the type ”LOW
ΔP FLOW” and ”EL-FLOW” from Bronkhorst HI-TEC. The MFCs had analogue control on the
fixed bed setups and digital control through the PLC on the stack setup. All MFC’s flows were
controlled with a Gilibrator 2 soap bubble flow meter from Gilian with a specified measuring
range of 20-6000 ml/min
All temperature measurements were done with K-type thermo couples for the temperature range
-40-850oC
Two IR-analyzers of the type NGA 2000 MLT Analyzer from Fisher-Rosemount were used in-
terchangeably. The analyzers only measured CO and CO2 contents, but as seen in section 2.7
10
15

Figure 2.2: Illustration of mechanical pressure system.
all contents relevant to steam reforming can be calculated from the measurement of these two
components when inlet flows of all gases are known. The analyzers have a measurement error of
1% of the given measuring limit.
Both fixed bed setups included a HygroFlex humidity sensor from ROTRONIC, but tests indi-
cated that these did not give trustworthy measurements, so they were primarily used to indicate
whether or not the water supply was stable. Instead a calibration curve was made for each
evaporator, these can be seen in Appendix A.1
2.4 Reduction Procedure
The same reduction procedure was used as pre-treatment for both the packed bed experiments
and the cell/stack experiments: First, the sample was heated to 860oC in N2, the cell/stack
heating was limited to 1 oC/min, while there was no restriction on the heating ramp in the
packed bed setup. At 860oC the gas was changed to 20% H2 in N2 for at least 4 hours, after
which the sample was cooled to the test temperature and measurements were started.
11
16

2.5 Test Conditions
In order to achieve a complete understanding of the steam reforming kinetics over Ni-YSZ anode
material, two different types of experiments were conducted.
Packed bed experiments were performed with crushed anode material diluted in a bed of inert
material. The purpose of these experiments was to determine the intrinsic kinetics of the catalyzed
steam reforming under conditions where mass transport limitations are negligible.
Measurements of the kinetics over an SOFC cell were performed in order to investigate the ob-
served kinetics for the catalyst in an SOFC structure and with realistic mass transport limitations.
Because of the slow approach to steady state in the tests, as described in Section 3.1, there was
not enough time to wait for steady state for all measurements. Instead, the majority of the rate
order determination measurements were made by waiting for steady state at the standard gas
composition, and then rapidly going through all gas composition changes. This was done two
times for each gas species in each measurement series, first starting with the lowest concentration
and then increasing it. Second starting with the highest concentration and decreasing it.
2.5.1 Packed Bed Experiments
The packed bed experiments were designed to measure the intrinsic kinetics of the catalyst. A
rule of thumb for such experiments is that the diameter of the bed should be at least 10 times the
particle diameter [19] and the length of the bed should be at least 50 times the particle diameter.
In these experiments particle sizes were dp = 63-300 μm, most often particles in the larger part
of the range is used in order to minimize pressure drop over the bed. The bed diameter was db
= 18mm and the bed height was hb = 17-21mm, giving:
db
dp> 60 &
hb
dp> 55 (2.1)
In principle, the bed height should also be 10 times the diameter, but that would require more
sample, which in results the reactor pressure becoming higher than what is allowed by the quartz
connections. So this compromise was used instead. The ranges of the total flow, temperature
and pressure in the experiments were: Ftot = 1.4-2.2 Nl/min, T = 600-800oC, P = 1.1-1.25 atm.
In order to keep the degree of conversion low (below 15%) the catalyst is diluted 10-40 times,
depending on operating temperature.
The gases used in the experiments, on both setups, and their purities are shown in Table 2.1.
The standard flow in the experiments was 2 Nl/min and Table 2.2 shows the standard gas
composition as well as the range in which each gas is varied.
In order to ensure that only the activity of the catalyst is measured, a blind test was made
where the reactor was loaded with quartz wool and the alumina powder used to dilute the
catalyst material. The inert material was treated according to the standard procedure, including
reduction procedure, and no activity was observed.
12
17

Table 2.1: Gases used during experiments.
Gas Purity
CH4 N3.5
CH4 N5.5
H2 N5
N2 N5
CO N3.7
CO2 N4
4.50% CO, 19.0% CO2, 9.51% O2, balance N2+−2% rel.
3940 ppm CO, 3750 ppm CO2, 9.48% O2, balance N2+−2% rel.
10% H2, balance N2 unknown
5% H2, balance N2+−2% rel.
Table 2.2: Overview of the gas composition at standard conditions and the range each gas is
varied in.Gas Standard Range
kPa kPa
CH4 16 8-20
H2O 33 24-39
H2 8 8-24
CO 0 0-8
CO2 0 0-8
Furthermore, a test was made on a classical industrial steam reforming catalyst, with alumina
support material. This was done to test if the observed dynamic effects was caused by the setup
or the catalyst material. The tests with the industrial steam reforming catalyst showed very
little dynamic behavior, and stability was achieved within 10 minutes after any change in test
conditions.
2.5.2 Stack/Cell Measurements
The first attempt of measuring the steam reforming kinetics was made on a 5-cell SOFC 12cmx12cm
standard stack from Topsøe Fuel Cell A/S. It was found that the methane was completely con-
verted, even at the highest flows that the setup could deliver.
Therefore, a special stack was made, also by Topsøe Fuel Cell A/S, with only a single crossflow
cell. Half of the cell was cut away so that half of the cathode flow channels were removed, and
the length of the anode flow channels were halfed, as illustrated in Figure 2.3. A cell, where three
quarters of the cell was removed, was also used, in order to reduce the degree of conversion even
13
18

further. This means that the anode and cathode gasses are mixed at the outlet of the anode
channels. Furthermore, four thermocouples were placed in the gas distribution plates close to the
flow channels, in order to monitor the temperature gradient. One at each corner of the fuel inlet
side and one at the corner with fuel outlet and air inlet, and finally one at the fuel outlet and
halfway through the air channel. The cathode side was only fed with nitrogen, both in order to
avoid mixing of air with the anode gas, and to avoid electrochemical reactions in the cell. It is
desired to avoid the electrochemical reactions because it is easier to study the steam reforming
reaction when no other reactions are taking place.
Figure 2.3: Illustration of the orientation of the halfcell with respect to flow directions.
The majority of the rate measurements on this cell were performed at flows that are much higher
than what is used during optimal operation of an SOFC, Ftot ≈ 2 Nl/min. This was done in
order to decrease the degree of conversion of methane. The pressure and temperature were, T =
600-700oC, P = 1.1-1.25 atm.
Table 2.3 shows the standard gas composition as well as the range each gas species is varied in.
Table 2.3: Overview of the gas composition at standard conditions and the range each gas is
varied in.Gas Standard range
kPa kPa
CH4 12 12-30
H2O 56 45-70
H2 7 7-18
CO 0 0-6
CO2 0 0-9
14
19

2.6 Mass Transfer Limitation
When measuring intrinsic catalytic activity, it is vital to avoid having mass transfer limitations
in the measurement since this will give a lower activity than the true value for the catalyst. It
is especially important to be aware of this when measuring steam reforming kinetics since this
reaction is exceptionally fast at relevant conditions [40, 50, 70].
There are two types of mass transfer limitations, internal and external, and a control has been
made on both of them to ensure that non of them has a significant influence on the observed
kinetics. The tests were conducted at the highest temperature used, so they are valid for all
measurements. If there is significant internal mass transfer limitation, then the center of the
catalyst particles will not be used fully in the reaction, since the reactant concentration will be
lower here than in the bulk of the gas. Therefore, a decrease in particle size will show higher
activity since a larger part of the catalyst is used. Figure 2.4 shows the measured reaction rate
at similar conditions for two different particle sizes. Sample 1 and 3 did not reach steady state,
which means that values here are lower than what would have been measured at steady state.
Sample 2 and 4 both reached steady state, and the measured rates are very close, showing that
there is no mass transfer limitation for these measurements. It should however be noted that
particles are not spherical, as shown by the SEM images in Section 3.2.1. This means that the
term particle radius is somewhat simplified, since some of the particles will have only one side
with a length corresponding to the particle radius.
Average Particle Radius [μm]
Rea
ctio
nR
ate[ 10−
5m
ol
gc
at
s
]
10
8
6
4
2
00 50 100 150
ExtrapolationSample 2Sample 1Sample 3Sample 4
PCH4 = 6.58− 6.79kPaPH2O = 9.05− 9.48kPaPH2
= 5.19 − 5.74kPaPtot = 105kPaT = 775◦CBalance N2.
Figure 2.4: Measured reaction rate at two different particle sizes
External mass transfer limitation occurs when diffusion through the gas film surrounding the
catalyst particle results in a large concentration gradient. An increase in total flow rate will
decrease the gas film thickness and, thereby, decrease the effect of external mass transfer. Figure
15
20

2.5 shows the rate constant at different flow rates, corresponding to a change in the Sherwood
number from 3.6 to 4.4. It is seen that the measured rate constant is not significantly affected by
changing the total flow rate, meaning that there is no significant external mass transfer limitation
in the measurements.
Total flow[
Nlmin
]
k[ 10−
8m
ol
gc
at
Pa
s
]
10
8
6
4
2
00.5 1.0 1.5 2.0 2.5
Figure 2.5: Average value of the rate constant measured at different total inlet flows. All measure-
ments were performed on the same sample at T = 775oC and for different methane concentrations.
16
21

2.7 Data Treatment
Since the available gas analyzers can only measure CO and CO2 concentrations, it is necessary
to calculate the remaining gas concentrations from a mass balance in order to determine the
conversion and the reaction rate. The advantage of using this type of mass balance is that it
is not necessary to assume that the water gas shift reaction is at equilibrium. In order to do
this, a stoichiometric table is set up as shown below, including both the steam reforming reaction
(Reaction 2.2) and the water gas shift reaction (Reaction 2.3).
CH4 + H2O � CO + 3H2 (2.2)
CO + H2O � CO2 + H2 (2.3)
Table 2.4: Stoichiometric table for the combined steam reforming (SR) and water gas shift (WGS)
reactionsGas Fin SR WGS Fout
CH4 FCH4,0 -FCH4,0 X1 - FCH4,0(1-X1)
H2O FH2O,0 -FCH4,0 X1 -(FCO,0+FCH4,0X1)X2 FH2O,0 - FCH4,0X1 -(FCO,0+FCH4,0X1)X2
H2 FH2,0 +3FCH4,0 X1 +(FCO,0+FCH4,0X1)X2 FH2,0 + 3FCH4,0X1 +(FCO,0+FCH4,0X1)X2
CO FCO,0 +FCH4,0 X1 -(FCO,0+FCH4,0X1)X2 FCO,0 + FCH4,0X1 -(FCO,0+FCH4,0X1)X2
CO2 FCO2,0 - +(FCO,0+FCH4,0X1)X2 FCO2,0 + (FCO,0+FCH4,0X1)X2
Ftot,0 +2FCH4,0 X1 - Ftot,0 +2FCH4,0 X1
X1 is the degree of conversion of the steam reforming reaction, with respect to CH4, and X2 is
the degree of conversion of the water gas shift reaction with respect to CO. Change 1 and change
2 are the changes in molar flows of the different species in the steam reforming reaction and the
water gas shift reaction respectively. From this stoichiometric table it is possible to find both X1
and X2 as described in the Algorithm shown in Figure 2.6. The partial pressures of the outlet
gasses(Pi) can then be found as seen in Equation 2.4.
Pi =Fi
Ftot∗ Preac (2.4)
F is the molar flow, i denotes a specific gas, and tot denotes the sum of all gasses. Preac is the
measured reactor pressure. These partial pressures are used when determining the reaction rate’s
dependence of the different gasses. The sum of CO and CO2 in the outlet, Pprod, in Equation
2.5 can be used to calculate the degree of conversion of the steam reforming, X1, and afterwards
either PCO or PCO2 can be used to find X2. This is done by the two small loops in Figure 2.6.
Pprod = PCO + PCO2 (2.5)
17
22

Unfortunately the partial pressures of CO and CO2 are measured after the water in the gas has
been removed, where the total molar flow is not independent of X2, see (Equation 2.6) and,
furthermore, the total pressure at the analyzer is ambient pressure, which is lower than the
reactor pressure.
Ftot,anal = Ftot,0 − FH2O,0 + 3FCH4,0X1 + (FCO,0 + FCH4,0X1)X2 (2.6)
Pi,anal =Fi,anal
Ftot,anal∗ Patm (2.7)
This means that Pprod is not only dependent on X1 but also X2 and therefore an additional loop
is needed around the two small loops in the algorithm, in order to obtain consistent results.
This algorithm has been implemented in matlab and the bisectional method was used for obtaining
new values of X1 and X2 in the loops.
2.7.1 Experimental Uncertainty
Following is an evaluation of the uncertainties in the experimental setups. All uncertainties are
given as a relative error.
Gas analysis: 1 % of range, evaluated for each experiment, normally between 1 and 4 %. The
error on the gas analysis is the same on an entire measurement series, so it should have a
very low impact on measured rate orders.
Gas inlet flows: 2%
Water inlet flow: 7% (does not influence the estimation of the reaction rate)
Temperature: 1% for the thermocouples. They are, however, not placed directly where the
reaction takes place, so the measurement may also be influenced by temperature gradients.
Catalyst weight: 1%
Anode area: 2%
This results in a total estimated uncertainty on the reaction rate of 4-7 % in the packed bed
setups, and 5-8 % for the stack setup.
In order to test the accuracy of the method used where only CO and CO2 in the outlet are
measured and the other gas concentrations are calculated from a mass balance, a gas sample
was sent to Haldor Topsøe A/S for analysis of all species with a gas chromatograph (GC). The
comparison between the gas concentrations measured on the GC and calculated from a mass
balance is shown in Table 2.5. Furthermore, it is shown that the gas sample for the GC contained
0.2% O2 indicating that 1% air has slipped in during sampling. In column 4 in the table this
18
23

Figure 2.6: Algorithm for calculating outlet partial pressures, degree of conversion and reaction
rate in both the packed bed and stack experiments.
19
24

has been subtracted and the concentrations normalized. The deviance given in the table is with
respect to this adjusted value. The estimated uncertainty for the outlet gasses in this experiment
is 5% and the uncertainty of the GC measurements is 3%, The deviance between the found values
is well within these estimated uncertainties. On this background, the calculated outlet values are
used from here on, but it should be kept in mind that all outlet concentrations other than CO
and CO2 are calculated values.
Table 2.5: Test of the precision of outlet gas estimation from mass balance and IR gas analysis,
by comparison with gas chromatograph measurement.
Gas Species Mass balance GC measurement GC measurement deviance
corrected for air
vol % vol % vol % %
CH4 4.89 4.73 4.78 2.32
H2 38.92 36.9 37.3 2.65
CO 6.83 6.67 6.74 1.34
CO2 3.81 3.74 3.78 0.79
N2 45.5 47.5 47.2 -3.74
O2 - 0.20 - -
20
25

Chapter 3
Experimental Results
In order to achieve a good understanding of the steam reforming kinetics in a SOFC with Ni-
YSZ anode material, the reactivity of the catalyst is measured both in a packed bed and in stack
configuration. Tests are conducted at temperatures between 600oC and 800oC and the inlet con-
centration of CH4, H2O, H2, CO and CO2 are varied in order to determine the dependency on
each species. Below is listed the different samples that have been tested in the two setups:
Packed bed
Model anode material: A Ni-YSZ material similar to a real SOFC anode, this is the most
thoroughly tested in this thesis. The model anode material was produced and by Mikko
Pihlatie from Risøe-DTU for use in his thesis work [53–57].
Industrial anode material: A crushed Ni-YSZ anode from a cell supplied by Topsoe Fuel Cell.
Preparation and exact composition are disclosed to open literature.
New stack sample: Ni-YSZ anode from a stack that has been subjected to a short term test,
supplied by Topsoe Fuel Cell. Principally identical with the industrial anode material.
Old stack sample: Ni-YSZ anode material from a stack that has been subjected to a long term
test, supplied by Topsoe Fuel Cell. Principally identical with the industrial anode material.
Traditional steam reforming catalyst A traditional Ni on alumina steam reforming catalyst,
supplied by Haldor Topsøe.
Stack Measurements
Preparation and exact composition of all stacks is disclosed to open literature.
5-cell stack A typical small SOFC stack from Topsøe Fuel Cell.
Half-cell stack A single cell stack, with half the cell cut away, see 2.5.2.
21
26

Quarter-cell stack A single cell stack, with 3/4 of the cell cut away, similarly to the half-cell
stack.
In the packed bed experiments the crushed catalyst is diluted in alumina in order to decrease
the conversion while maintaining a bed size sufficiently large to ensure a uniform flow. Such a
dilution is not possible for the stack measurements, so degree of conversion is instead decreased
by reducing the cell area, i.e. using half-cell and quarter-cell stacks.
3.1 Dynamic Catalyst Behavior
During this project it was found that this catalyst has an exceptionally slow dynamic behavior.
This may help explain the lack of consensus on the reaction rate of steam reforming over Ni-YSZ
anode material found in the litterature [43].
At low methane concentrations an initial rapid activation of the catalyst was followed by a short
deactivation period, as would be expected, see Figure 3.1. However, after a few hours of apparent
steady state, the catalyst was slowly reactivated over a period of several days as shown in Figure
3.2.
Time [hour]
Mol
arfr
acti
on[p
pm
]
100
200
300
400
500
600
700
00 1 2 3 4
Figure 3.1: First 4 hours of Ap-
proach to steady state after startup
over crushed anode material in the
packed bed reactor at T = 750oC
and low methane concentration (≈ 7.3
kPa).
Figure 3.2: The same experiment as in Figure
3.1, on a longer time scale.
In his thesis, J.G. Jakobsen [32] reported a similar behavior for steam reforming over 5% Rhodium
on a MgAlO4 support although this occured significantly faster and was seen at 500-600oC during
a temperature cycle instead of stable operation.
22
27

Figure 3.3 shows two startups similar to that in Figures 3.1 and 3.2, but at high methane con-
centration. Here it is seen that there is a long deactivation period (just under a week at low
temperature) and no subsequent reactivation was observed.
0 50 100 150 2000
0.5
1
1.5
2
2.5
3
3.5
4
4.5
[]
time [hr]
PCH4
= 14.6 kPaP
H2O = 30.2 kPa
PH2
= 7.38 kPaT = 638oC
sumCOCO2
0 20 40 60 80 1000
0.5
1
1.5
2
2.5
3
3.5
4
[]
time [hr]
PCH4
= 14.6 kPaP
H2O = 30.4 kPa
PH2
= 7.42 kPaT = 738oC
sumCOCO2
Figure 3.3: Approach to steady state after startup over crushed anode material in the packed bed
reactor at two different temperatures and high methane concentration.
After a change in the inlet hydrogen concentration or temperature, a slow approach to steady
state was observed. Figure 3.4 shows the effect of gas concentration changes on the outlet
concentration of CO and CO2 on a packed bed setup. For all gases except hydrogen, a new steady
state is achieved rapidly after a concentration change. After a change in temperature hydrogen
concentration it takes several hours, or even days to achieve a new steady state, depending on
temperature.
Time [min]
Mol
arfr
acti
on[p
pm
]
Reproducibility Increased hydrogen flow
Increasing PCH4Increasing PH2O
00 50 100 150 200
1000
2000
3000
4000
5000
6000
COCO2
Catalyst Sample 3T = 775◦CPCH4 = 3.45− 9.87kPaPH2O = 5.69 − 20.5kPaPH2
= 4.63 − 5.46kPaPtot = 105− 106kPaBalance N2.
Figure 3.4: Variation of gas concentrations over crushed industrial anode in a packed bed.
Similar tests were made with a traditional steam reforming catalyst and no long term dynamic
23
28

effect was observed. Figure 3.5 shows the outlet concentration of CO and CO2 at the start up of
a traditional steam reforming catalyst in a packed bed at low methane concentration (6.5 kPa)
and low temperature (≈640oC). First of all, this shows that the observed dynamic effects are an
actual property of the catalyst, not an effect from the setup or experimental method. Secondly it
means that the dynamic effect is either caused by the support material, Yttria stabilized Zirconia,
or by the fact that the Ni particles are 2-3 orders of magnitude larger in SOFC anode material
than in traditional steam reforming catalysts.
0 5 10 150
1
2
3
4
5
6
Time [hr]
Con
cent
ratio
n [m
ole%
]
CO2CO
Figure 3.5: Outlet concentration of CO and CO2 from start up of an industrial steam reforming
catalyst in a packed bed at PCH4=6.5 kPa and T≈640oC).
Furthermore, during measurements on the half-cell stack it was found that a shut down of the
setup reactivates the catalyst. Figure 3.6 shows the start up of a 1/2 cell stack. The deviation
around 150 hours on the plot is a shutdown of the stack for approximately 2 weeks (the time-
line is distorted for a better overview) after which the activity increases slightly. During the
measurements on the stack, an alarm triggered an emergency shut down of the setup, meaning
that the stack was cooled to 68oC in a gas flow consisting of 2% H2 46% N2 and 52% H2O.
The stack was immidiately reheated in 5% H2 in N2, whereafter the startup sequeence shown in
Figure 3.7 was measured with the same conditions as in Figure 3.6. This shows that cooling the
stack in an water rich gas resulted in a complete reactivation of the catalytic properties of the
anode material. Hydrogen was also present during the shutdown, so the cell was not subjected
to oxidising environment. Later tests showed that a shutdown with no water in the gas did not
reactivate the catalytic properties.
This reactivation was tested further in the packed bed experiments. It was found that a shutdown
without water in the gas, did not reactivate the catalytic properties. Figure 3.8 shows a test to
reactivate the catalytic properties at constant temperature by passing a water rich gas (including
H2) through the catalyst bed. It is seen that one hour exposure to a water rich gas did not have
any effect, but 16 hours exposure resulted in more than a doubling of the catalytic activity. This
24
29

Figure 3.6: Startup curve for a half-cell
stack at T = 600oC, PCH4 = 20 kPa, PH2O
= 59 kPa, PH2 = 4 kPa, PN2 = 36 kPa.
0 50 100 150 200 250 300 350 4000
1
2
3
4
5
6
7
8
conc
entra
tion
[mol
e%]
CO2CO
Figure 3.7: Startup of the same cell as in
3.6 under similar conditions, after a shut
down in a water rich environment.
behavior will be discussed further on the basis of the observations made in Section 3.2.
0 10 20 30 40 50 60 700
1
2
3
4
5
6
7
8
Time [min]
Con
cent
ratio
n [m
ole%
]
start1 hour without CH416 hours without CH4
Figure 3.8: A test of the reactivation of catalytic activity of Ni-YSZ in the packed bed reactor
with crushed anode material. T = 790oC, PCH4 =15 kPa, PH2O = 30 kPa, PH2 = 7 kPa. The
three plots show the sum of CO and CO2 in the outlet for the catalyst after rate determina-
tion experiments, and after respectively 1 hour and 16 hours with no methane in a water rich
environment.
25
30

3.2 Characterization of Ni-YSZ Model catalyst
The model Ni-YSZ catalyst material was provided by Risø-DTU as a part of the thesis work
by Mikko Pihlatie [53–57]. It was produced like an industrial SOFC anode, and have similar Ni
content, porosity, and particle sizes. The majority of the kinetic measurements was performed
on the model Ni-YSZ catalyst, and the catalyst has been characterized using several techniques
such as SEM, TEM, XRD, EXAFS, IET, TGA and Dilatometry [54–57]. The preparation of the
model anode material is described in [56], where it is designated ”Sample E”. The results of some
of these characterization techniques are not directly relevant to the work in this thesis and are
therefore not included.
Before reduction of NiO to Ni the catalyst has a density = 4.2-4.4 g/cm3, porosity of 31-34%
v/v and a NiO content of 51 % w/w. After reduction, the density is 3.9-4 g/cm3, porosity is
approximately 44-46 % v/v and the Ni content is 42 % w/w.
3.2.1 Scanning Electron Microscopy (SEM)
One of the reasons for the large changes in catalytic activity of the Ni-YSZ material was caused
by sintering and other structural changes. In order to test this theory, three samples of the model
Ni-YSZ catalyst were prepared for analysis with Scanning Electron Microscopy (SEM). The first
sample was reduced. The second sample was reduced, and then run at standard gas conditions
at 800oC until the activity was stable. The third sample was reduced, stabilized as the second
sample and then subject to a gas consisting of N2, H2 and H2O at 800oC for 16 hours in order
to achieve the reactivation observed in section 3.1.
Figure 3.9 is an overview picture of the reduced and stabilized sample. It clearly shows that the
rigidity of the sample results in non-spherical particles when crushed. It was later observed that
reducing the sample made it significantly less rigid. The fibrous material is residue of the quartz
wool used to separate the particles from the quartz frit in the reactor.
An example of a SEM image using backscattered electrons (BSE) is shown in Figure 3.10 corre-
sponding to Figure 3.11(c) and 3.11(d). The images illustrate that it was difficult to distinguish
between Ni and YSZ particles, especially since the topography of the sample also influences the
gray levels in the SEM BSE image.
Figure 3.11 shows representative SEM pictures of all three samples at two degrees of magnifi-
cation. Comparing the images of the only reduced sample, Figure 3.11(a) and 3.11(b) with the
images of sample that has been reduced and run to steady state, Figure 3.11(c) and 3.11(d). It
seems that some degree of sintering is taking place during the stabilization period, which was
expected from the decrease in catalytic activity. More surprisingly, the images in Figure 3.11(e)
and 3.11(f) indicate that particle size has actually decreased again by reactivation in H2/H2O
after stability has been reached. Since it is not possible to distinguish between Ni and YSZ parti-
cles, it is however difficult to say anything conclusive from the SEM images. So it was decided to
26
31

Figure 3.9: Overview picture of the reduced and stabilized sample
Figure 3.10: BSE SEM pictures of of the model Ni-YSZ anode material after reduction and
operation to steady state at 800oC under standard gas conditions corresponding to Figure 3.11(c)
and 3.11(d).
perform Transmission Electron Microscopy (TEM) as well, since it can give a more detailed view
of the catalyst and has the possibility of determining local compositions by Energy-dispersive
X-ray spectroscopy (EDX).
27
32

(a) Reduced (b) Reduced
(c) Reduced and run to steady state (d) Reduced and run to steady state
(e) Reactivated in H2O/H2 (f) Reactivated in H2O/H2
Figure 3.11: SEM pictures using secondary electrons, of three samples of the model Ni-YSZ anode materialwhich have been subjected to; a-b) reduction c-d) reduction and run to steady state at 800oC under standardgas conditions e-f) reduction, run to steady state at 800oC under standard gas conditions, run in H2O/H2
(no methane) for 16 hours. 28
33

3.2.2 Transmission Electron Microscopy (TEM)
Before examining the samples with Transmission Electron Microscopy (TEM), they were crushed
even further in order to decrease the particles to a size were TEM can be used effectively. The
same three samples that were examined with SEM were also examined with TEM. Furthermore,
an unreduced sample of the model catalyst was examined.
(a) 1) 10.3% Ni, 89.7% Zr (b) 2) 90.0% Ni, 5.2% Zr, 4.8% Al 3) 9.3% Ni,
4.5% Y, 86.2% Zr
(c) zoom on the NiO particle (2) (d) zoom on the YSZ particle (3)
Figure 3.12: TEM images of an unreduced sample of the model anode material.
In addition to the images, dark field imaging was used to ease the observation of small crystals.
Some of the particles were also tested with Energy-dispersive X-ray spectroscopy (EDX), in order
to distinguish between Ni (or NiO) and YSZ particles. The areas where EDX was performed are
marked on the TEM images with white numbered circles, and the measured compositions are
29
34

given in the figure text as % mole/mole. The sample holder is made of copper and carbon, so these
two materials are removed from the composition. Oxygen is also removed from the composition
because it is not quantified correctly by the EDX. In a few of the EDX measurements Al was also
observed, for example Figure 3.12(b), this is most likely a residue of the the quartz wool used to
separate the samles from the glass frit in the tubular reactor.
Normally, TEM images can be used to determine particle size distribution of the catalytically
active material, but for this catalyst there is a huge span in the size of the Ni particles, i.e. 2-3
orders of magnitude. This means that if a particle size distribution was to be measured with
TEM it would require huge amounts of data in order to achieve statistical precision.
TEM images taken on the unreduced sample are shown in Figure 3.12. Notice the structural
difference between the NiO particle in Figure 3.12(c) and the YSZ particle in Figure 3.12(d).
The YSZ particle seems to have clearly defined edges, whereas the surface of the NiO particle is
more erratic.
Figure 3.13 shows images taken on the reduced model anode material. Both the dark field imaging
in Figure 3.13(c) and 3.13(d) as well as the zoom in Figure 3.13(b) show a cluster of particles
in the size 5-10 nm. Unfortunately EDX measurements could not be performed on such small
sample areas, but it is assumed that the nano particles are residue left behind when a Ni/NiO
particle is reduced in size during reduction. This has been described previously by King et al.
[38] and has very recently been shown with in-situ TEM by Jeangros et. al [34]. Such clusters of
nano particles were observed on several of the larger particles in the sample and they are most
likely the cause for the high initial reactivity of the catalyst.
The sample that has been run to stability under standard conditions has clear signs of sintering
compared to the only reduced sample. Both the dark field imaging in Figures 3.14(c) and 3.14(d)
and the image in Figure 3.14(b) show that there are still nm scale particles present. There are,
however, fewer of them and instead intermediate sized particles are observed. Furthermore, some
large Ni particles were observed in this sample, for example the 2 μm Ni particle in Figure 3.14(a)
(EDX measurement 7). Particles of this size were not observed in the only-reduced sample.
So after the initial reduction in activity of the model anode material, the Ni particle size spans
from 5 nm to 2 μm, i.e. almost 3 orders of magnitude. The images further indicate that it is no
longer only nm particles and μm particles, there are also Ni particles in all sizes in between.
Figure 3.15 shows representative TEM images of the last sample, which, after the initial deacti-
vation, has been subjected to a gas mixture of 7.6% H2, 31.5% H2O and balance N2 at a total
pressure of 1.1 bar for 24 hours. This procedure has previously been seen to completely recover
the activity of the catalyst, see Section 3.1.
The TEM images for this sample indicate a reorganization of the catalyst structure, especially
the YSZ particles. An example of this is seen in Figure 3.15(a), where EDX measurement 8 shows
that the transparent material making up the overall structure of the particle is pure Zr, while
EDX measurement 11 apparently shows a 300 nm Ni particle almost completely covered by Zr.
30
35

(a) 10) 7.2% Y, 92.8% Zr 11) 6.61% Y, 93.4%
Zr 12) 17.6% Ni, 5.5% Y 76.9% Zr 13) 34.1%
Ni, 3.8% Y, 62.1% Zr.
(b) Zoom of particle 11 in Figure 3.13(a).
(c) dark field imaging of particle 11 in Figure
3.13(a).
(d) Dark field image of reduced Ni-YSZ particle.
Figure 3.13: TEM images of a reduced sample of the model anode material.
Since the images are only two dimensional it is, however, just as likely that the Ni particle lies
on top of the YSZ material.
There were also observed large Ni particles (0.2-0.5 μm) that did not appear to be in close contact
with Zr. Furthermore, they did not appear to be agglomerates of smaller crystals. No particles
larger than 0.5 μm were observed, which can either be a coincidence or an indication that some
degree of re-dispersion has taken place. Furthermore, a few clusters of 5-10 nm sized particles
were observed as seen in Figure 3.15(b) and the dark field image in Figure 3.15(c), which could
be residue from the re-dispersion of a large particle. This looks very similar to the clusters seen in
31
36

(a) TEM image of deactivated Ni-YSZ particle. (b) Zoom of the top part of EDX measurement
7 in Figure 3.14(a).
(c) dark field image of the particle in Figure
3.14(a).
(d) dark field image of deactivated Ni-YSZ par-
ticle.
Figure 3.14: TEM images of a sample of the model anode material that has been reduced and run tostability under standard gas conditions at 800oC.
the freshly reduced sample in Figure 3.13, but they were not nearly as abundant in this sample.
Possible mechanisms that could induce such a re-dispersion is discussed in section 3.2.4. Even
though some particles with a size of a few nm were observed they not appear to be as abundant
as in the only-reduced sample, so it is not likely that this is the sole explanation for the regained
catalytic activity. There is, however, also observed what appears to be flat Ni particles, as seen
in the dark field image in Figure 3.15(d). It is plausible that such a change in the shape of the
Ni particles can result in an increased number of step sites, which has been reported to be highly
active [28, 65].
32
37
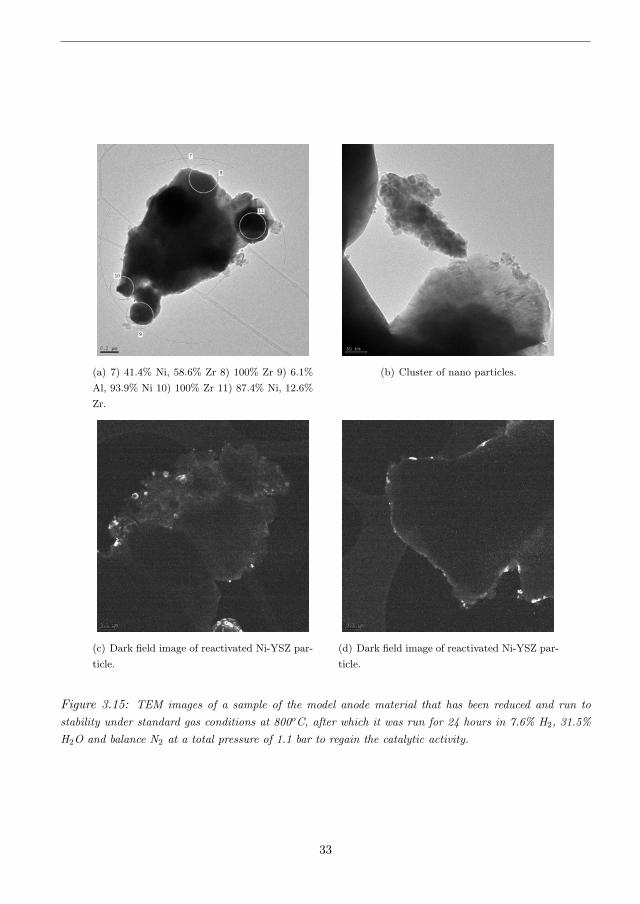
(a) 7) 41.4% Ni, 58.6% Zr 8) 100% Zr 9) 6.1%
Al, 93.9% Ni 10) 100% Zr 11) 87.4% Ni, 12.6%
Zr.
(b) Cluster of nano particles.
(c) Dark field image of reactivated Ni-YSZ par-
ticle.
(d) Dark field image of reactivated Ni-YSZ par-
ticle.
Figure 3.15: TEM images of a sample of the model anode material that has been reduced and run tostability under standard gas conditions at 800oC, after which it was run for 24 hours in 7.6% H2, 31.5%H2O and balance N2 at a total pressure of 1.1 bar to regain the catalytic activity.
33
38

3.2.3 X-Ray Diffraction
In light of the observations made during TEM measurements it was decided to test the same
four samples with X-Ray Diffraction (XRD) hoping to find further evidence of restructuring of
the YSZ support material. Furthermore, XRD measurements can give an average crystallite size,
which can perhaps shed some further light on the suspected re-dispersion of the Ni particles.
Figure 3.16 shows an XRD pattern for the just reduced sample. First of all no Ni reflections
were observed in the unreduced sample, and no NiO peaks were observed in the reduced samples,
indicating that no undesired reduction or oxidation have taken place.
Figure 3.16: XRD pattern on the just reduced sample
The peak width observed in the XRD patterns can be influenced by a number of things. The
major contributors are the crystallite size in the sample, and the instrument itself and if it is
assumed that these two are the only contributions, then the peak width can be used to estimate
the crystallite size. This was done by using the Scherrer formula, as seen in Equation 3.1.
τ =Kλ
β cos(θ)(3.1)
τ is the mean crystallite size, K is the shape factor, which is set to 0.9, λ is the x-ray wavelength,
theta is the Bragg angle, and β is the line broadening at half the maximum intensity in radians
minus the instrumental broadening as determined by calibration. There were large differences in
the results depending on which peak was chosen, as seen in table 3.1, which shows the average
crystallite size calculated from each of the four major peaks in a XRD diagram of Ni in the
sample that has only been reduced. This is not surprising since this technique is only suitable
for crystallite sizes up to 100 nm, which is further confirmed by the fact that the instrumental
broadening corresponds to approximately two thirds of the Ni particle peak width. It should
also be kept in mind that this method has a tendency to underestimate the crystallite size, since
all unaccounted influences will result in a wider peak, and thereby a lowering of the estimated
34
39

Table 3.1: Volume based average crystallite size determined from the different major Ni peaks of
the just reduced samplepeak No. 2θ Crystallite size [nm]
1 44 166
2 51 149
3 76 243
4 93 273
avg 208
crystallite size.
These uncertainties resulted in large variations in the measured average Ni particle size, giving
values between 200 nm and 300 nm for different measurements on the same sample. Because of
these large deviations it was not possible too determine possible differences in the three reduced
samples.
The average crystallite sizes found for YSZ in the different samples are very similar (≈ 50 nm),
so they do not give any information on a possible change in the YSZ structure . The average YSZ
particle sizes found from XRD are, however, much smaller than the YSZ particle sizes observed
in the TEM images, this is probably because the large YSZ particles observed via TEM are
agglomerates of smaller crystals.
3.2.4 Discussion
Apart from the characterization shown here, the samples have also been examined with X-ray
Absorption Spectroscopy, as reported in article II [42]. It was found that the reduced sample
is the one which is most defined and therefore gives the highest average particle size > 5 nm.
The deactivated sample is found to have a slightly lower average particle size and the reactivated
sample has a significantly smaller coordination number. This is partly in contradiction to TEM
and XRD results. This may be due to a large fraction of small particles or a strong disorder
including dissolved oxygen/carbon.
The different long term changes in the catalyst activity that has been reported here are highly
unusual, but not completely unheard of. In his thesis J.G. Jakobsen [32] recently reported
a deactivation followed by reactivation of a steam reforming catalyst consisting of 5% Rh on
MgAl2O4. Although the observation was made during a temperature cycle instead of under
stable conditions at low methane concentration as in this work (see Figure 3.2), J.G. Jakobsen
suggests that the behavior might be caused by a mechanism where the support material covers
the catalytically active material followed by the catalytic material re-emerging from the support.
This theory is at first sight supported by the observation made in the TEM images in this work,
were the YSZ support material apparently covers Ni particles up to several hundred nm in size.
35
40

At closer inspection the is however not conclusive, first of all, the observed Ni particle can just as
well lie on top or below a thin layer of YSZ. Secondly there is the objection that J.G. Jakobsen
suggest the YSZ coverage of Ni as an explanation for temporarily decreased activity, while the
images showing the apparent coverage of Ni in this work was made on a sample with relatively
high activity. Further investigations of this behavior is needed.
Regarding the slow de-activation of the catalyst when operating at higher methane concentration
as shown in Figure 3.3, it is definitely connected with the sintering of nano Ni particles that
are produced when the Ni/NiO particles shrink during reduction. Since the behavior of the
reactivated sample closely resembles that of the freshly reduced sample, the obvious theory is
that the treatment with H2O/H2 without methane, has re-oxidized the nickel, followed by a
re-reduction, which would give rise to new Ni nano particles like for the initial reduction. This
can, however, be dismissed since the H2O/H2 during the re-activation corresponds to a oxygen
partial pressure of 10−13-10−12 atm, depending on temperature, while the partial pressure needed
for oxidation of Ni is in the range 10−4-10−6 atm at the relevant temperatures. This is also
confirmed by the XRD measurements, which showed no sign of NiO in the re-activated sample.
Nano particles may, however, behave differently than expected from larger particles, and may
have surface oxidation under conditions that do not cause bulk oxidation.
Ruckenstein and Hu [63] have also reported dispersion of Ni particles, and from experimental
observations they found the following three step mechanism: ”(1) extension of films from the
crystallites, (2) coalescence of the films surrounding neighboring crystallites, and (3) further
extension of the films.”
There is a striking correspondence between the deactivation time observed for the catalytic steam
reforming activity in this thesis and the initial degredation of the performance of an SOFC stack,
i.e. a slow deactivation over 1-200 hours, depending on conditions [25]. It has recently been shown
by A. Hauch et al. [25, 26] that this initial degradation of the cell performance is caused by some
unidentified impurities settling on the triple phase boundaries. The triple phase boundary is not
important to the catalytic steam reforming activity of the anode material, and therefore such
impurities should not influence the steam reforming activity. The correspondence in deactivation
time is, however, reason to consider possible common causes, which could be either changes in
structure, impurities or a combination.
The observation made in TEM of the re-activated sample, that some YSZ particles had apparently
undergone a drastic change in structure and absorbed or coated large Ni particles, is surprising
but not completely new. It has been reported by Hauch et. al [24] that during a high current
test on a solid oxide electrolysis cell, a dense layer of Ni and YSZ has formed at the electrolyte-
hydrogen electrode interface. Where it appears as if the YSZ electrolyte has changed structure
and absorbed the closest Ni particles completely, the conditions were very different from those
used in the present thesis, but the structural change is also much more pronounced. It has also
been reported recently that during the first few hundred hours of operation of an SOFC stack/cell,
36
41

a loss of Ni percolation is observed [53], which could theoretically also be caused by YSZ covering
some of the Ni particles. It should here be emphasized that this is purely a theoretic possibility
at the moment since no proof exists to confirm this phenomena.
There has not been found a satisfactory explanation for the long term change in catalytic activity
after a change in the H2 inlet flow (see Figure 3.4). It is suspected that the H2 concentration
effects one or more of the possible mechanisms described for explaining the other long term
changes in catalytic activity.
Recently it has been shown by In-situ microscopy that step sites on the Ni catalyst particles are
the most active nucleation sites for both carbon formation and steam reforming [28, 65]. This has
also been backed up by density functional theory calculations [5, 11], which show that the step
sites are approximately 100 times more active than terrace sites. This large difference in activity
opens for another possible explanation for the slow approach to steady state after a change in
temperature or hydrogen concentration, namely that the Ni particles change shape. This will
change the Ni surface area but, more importantly, it could change the number of the highly active
step sites. No observations were made that clearly support or contradict this theory. There was,
however, observed a tendency that the stabilized sample had defined single crystal particles,
while the two samples with higher activity, i.e. the freshly reduced and the sample reactivated in
H2/H2O gas, showed less clearly defined structures with a higher degree of interaction between
Ni and YSZ.
3.3 Packed Bed Measurements
3.3.1 Model Anode Material
In this section the kinetic data measured on the model anode is presented and a power law
expression as shown in equation 3.2 is used to aid in the description of the observed trends.
r = kPαCH4
P βH2OP γ
H2P δ
COP λCO2 (3.2)
The reaction orders, α, β, γ, δ and λ is found from measurements with varying partial pressures
of the different species, all of which are shown in Appendix B.2. The rate for each measurement
is determined under the assumption that the partial pressures are constant through the bed and
is taken as the average if the inlet and the outlet partial pressure. This assumption can be
used since the degree of conversion in the measurements is in the range 5-15%mole/mole and
is below 10%mole/mole for the majority of the measurements. The method used to speed up
the measurements, ie. rapid consecutive changes in gas composition after the initial steady state
has been reached, may result in inaccuracies. It is attempted to counteract this by first varying
each gas by increasing the partial pressure and later with decreasing partial pressures, over the
same interval. In some cases this results in plots similar to Figure 3.20(a) where the two sets of
measurements are easily distinguished.
37
42

Figure 3.17 shows the observed reaction rate as function of changes in the different gas species at
650oC and similar in Figure 3.18 at 700oC. The methane dependency has also been determined
at other temperatures, these are all shown in Appendix B.1.
The most clearcut observations to be made is that methane has an apparent rate order of around
0.9 while the the water partial pressure has no effect on the reaction rate. The observed orders are,
however, not that unambigious. All three species, H2, CO and CO2 apparently have some effect
on the observed rate, which furthermore changes with temperature. For example the reaction
order for CO is measured as -0.14 at 650oC and 0.10 at 700oC. This change with temperature
may be caused by a change in which elementary reaction is rate determining or an increase
in the species adsorbed on the catalyst at lower temperatures or a change in the approach to
equilibrium. For the sake of the power law expression, the rate order is set as a mean of the
observed rates, i.e. 0 for CO. In section 4.1 a more thorough discussion of such effects is made
as a part of trying to obtain an accurate description of the reaction mechanism and a achieve a
suitable kinetic expression.
The resulting power law expression is shown in Equation 3.3.
r = kP 0.9CH4
P−0.2H2
P 0.2CO2 (3.3)
Figure 3.19 shows an Arrhenius plot for the kinetic constant obtained with the power law ex-
pression, giving an activation energy of 185 kJ/mol and a pre-exponential factor of 139 mol/s g
Pa0.9.
Because of the large range in the measured reaction rates a sum of squares is not suitable as
a figure for the deviance between model and experimental data, since it would value the high
temperature measurements much higher than the low temperature measurements. Instead, an
average of the absolute value of the percentage deviation between the model and each data point
is used as calculated from Equation 3.4.
deviation =∣∣∣∣ratemeasured − ratemodel
ratemeasured· 100%
∣∣∣∣ (3.4)
The calculated deviation for the power law expression is 43.7%. The major deviations are in the
measurements with variations in H2, CO and CO2, as expected, because the observed dependen-
cies of these gases change with temperature.
38
43

0 5 10 15 20 25 30 35 400
0.5
1
1.5
2
2.5
3
3.5
4
4.5
5 x 10⁻⁵re
actio
n ra
te [m
ol/s
gca
t]
Partial Pressure [kPa]
PH2O
= 29.9 ± 0.19 kPaP
H2 = 7.82 ± 0.18 kPa
Rate order = 0.906
(a) dependency on CH4
0 5 10 15 20 25 30 35 400
0.5
1
1.5
2
2.5
3
3.5
4
4.5
5 x 10⁻⁵
reac
tion
rate
[mol
/s g
cat]
Partial Pressure [kPa]
PH2
= 7.97 ± 0.077 kPaP
CH4 = 14.4 ± 0.17 kPa
Rate order = −0.0598
(b) dependency on H2O
0 5 10 15 20 25 30 35 400
0.5
1
1.5
2
2.5
3
3.5
4
4.5
5 x 10⁻⁵
reac
tion
rate
[mol
/s g
cat]
Partial Pressure [kPa]
PH2O
= 29.8 ± 0.17 kPaP
CH4 = 14.1 ± 0.034 kPa
Rate order = −0.29
(c) dependency on H2
0 5 10 15 20 25 30 35 400
0.5
1
1.5
2
2.5
3
3.5
4
4.5
5 x 10⁻⁵
reac
tion
rate
[mol
/s g
cat]
Partial Pressure [kPa]
PH2O
= 29.5 ± 0.39 kPaP
H2 = 8.18 ± 0.28 kPa
PCH4
= 14.2 ± 0.027 kPaRate order = −0.144
(d) dependency on CO
0 5 10 15 20 25 30 35 400
0.5
1
1.5
2
2.5
3
3.5
4
4.5
5 x 10⁻⁵
reac
tion
rate
[mol
/s g
cat]
Partial Pressure [kPa]
PH2O
= 29.7 ± 0.15 kPaP
H2 = 8.02 ± 0.097 kPa
PCH4
= 14.1 ± 0.079 kPaRate order = 0.183
(e) dependency on CO2
Figure 3.17: Measured dependencies of the different gas species over the model Ni-YSZ catalyst
at 650oC
39
44

0 5 10 15 20 25 30 35 400
0.5
1
1.5
2
2.5
3
3.5
4
4.5
5 x 10⁻⁵re
actio
n ra
te [m
ol/s
gca
t]
Partial Pressure [kPa]
PH2O
= 29.7 ± 0.58 kPaP
H2 = 8.11 ± 0.87 kPa
Rate order = 0.871
(a) dependency on of CH4
0 5 10 15 20 25 30 35 400
0.5
1
1.5
2
2.5
3
3.5
4
4.5
5 x 10⁻⁵
reac
tion
rate
[mol
/s g
cat]
Partial Pressure [kPa]
PH2
= 7.99 ± 0.052 kPaP
CH4 = 14.3 ± 0.1 kPa
Rate order = −0.0363
(b) dependency on of H2O
0 5 10 15 20 25 30 35 400
0.5
1
1.5
2
2.5
3
3.5
4
4.5
5 x 10⁻⁵
reac
tion
rate
[mol
/s g
cat]
Partial Pressure [kPa]
PH2O
= 29.5 ± 0.21 kPaP
CH4 = 14.1 ± 0.13 kPa
Rate order = −0.13
(c) dependency on H2
0 5 10 15 20 25 30 35 400
0.5
1
1.5
2
2.5
3
3.5
4
4.5
5 x 10⁻⁵
reac
tion
rate
[mol
/s g
cat]
Partial Pressure [kPa]
PH2O
= 29.5 ± 0.53 kPaP
H2 = 8.1 ± 0.44 kPa
PCH4
= 14.4 ± 0.098 kPaRate order = 0.101
(d) dependency on CO
0 5 10 15 20 25 30 35 400
0.5
1
1.5
2
2.5
3
3.5
4
4.5
5 x 10⁻⁵
reac
tion
rate
[mol
/s g
cat]
Partial Pressure [kPa]
PH2O
= 29.7 ± 0.22 kPaP
H2 = 7.94 ± 0.2 kPa
PCH4
= 14.2 ± 0.16 kPaRate order = 0.241
(e) dependency on CO2
Figure 3.18: Measured dependencies of the different gas species over the model Ni-YSZ catalyst
at 700oC
40
45

0.95 1 1.05 1.1 1.15x 10⁻³
−22
−21
−20
−19
−18
−17
−16
−15
1/T [1/K]
ln(k
)
A = 139 mol/s g Pa0.9
Ea = 185kJ/mol
Figure 3.19: Arrhenius plot for measured rate constants on the model anode material with respect
to a power law expression.The reaction constant, k, has the unit molsgcatPa0.9 .
41
46
3.3.2 Industrial Anode
The sample designated as the industrial anode is an anode plate from the production facility at
Topsoe Fuel Cell A/S. The sample has been crushed down to be used for these tubular reactor
measurements. The rate order determination for the different gas species over the industrial
anode is shown in Figure 3.20 at 650oC and in Figure 3.21 at 750oC. The methane rate order has
also been determined at other temperatures, these are all shown in Appendix B.2.
The observed rate orders are very similar to those for the model anode material, and the values
are shown in Equation 3.5. The largest difference is that the observed order for methane is here
0.8 where it was 0.9 for the model anode. Even though the mean of the observed order for H2, CO
and CO2 are the same as for the model anode, the difference in the rates at the two temperatures
is larger. This is most likely just an effect of the larger temperature difference between the two
measurements. Furthermore, a slight dependency on water is observed at 750oC.
r = kP 0.8CH4
P−0.2H2
P 0.2CO2 (3.5)
Figure 3.22 shows Arrhenius plots for the rate constants found for each measurement point for
the obtained power law expression.
The activation energy is found to be 166 kJ/mol, with a pre-exponential factor of 23 mol/s g
Pa0.8. and the average deviation between the kinetic expression and the experimental data is
41.4%.
The difference in measured activation energies is rather large considering that the two Ni-YSZ
materials are very similar in both Ni content, structure and production method. The only
intended difference between the two Ni-YSZ materials is that the YSZ particles in the model
anode material are larger. This is yet another indication that the YSZ support material has a
large influence on the reforming activity of Ni in SOFC anodes.
42
47

0 5 10 15 20 25 30 35 400
0.5
1
1.5
2
2.5
3
3.5
4
4.5
5 x 10⁻⁵re
actio
n ra
te [m
ol/s
gca
t]
Partial Pressure [kPa]
PH2O
= 28.6 ± 1 kPaP
H2 = 8.16 ± 0.25 kPa
Rate order = 0.721
(a) dependency on CH4
0 5 10 15 20 25 30 35 400
0.5
1
1.5
2
2.5
3
3.5
4
4.5
5 x 10⁻⁵
reac
tion
rate
[mol
/s g
cat]
Partial Pressure [kPa]
PH2
= 8.42 ± 0.25 kPaP
CH4 = 13.4 ± 0.69 kPa
Rate order = −0.0349
(b) dependency on H2O
0 5 10 15 20 25 30 35 400
0.5
1
1.5
2
2.5
3
3.5
4
4.5
5 x 10⁻⁵
reac
tion
rate
[mol
/s g
cat]
Partial Pressure [kPa]
PH2O
= 28.5 ± 0.63 kPaP
CH4 = 13.5 ± 0.3 kPa
Rate order = −0.369
(c) dependency on H2
0 5 10 15 20 25 30 35 400
0.5
1
1.5
2
2.5
3
3.5
4
4.5
5 x 10⁻⁵
reac
tion
rate
[mol
/s g
cat]
Partial Pressure [kPa]
PH2O
= 27.4 ± 0.66 kPaP
H2 = 7.82 ± 0.72 kPa
PCH4
= 13.3 ± 0.3 kPaRate order = −0.0474
(d) dependency on CO
0 5 10 15 20 25 30 35 400
0.5
1
1.5
2
2.5
3
3.5
4
4.5
5 x 10⁻⁵
reac
tion
rate
[mol
/s g
cat]
Partial Pressure [kPa]
PH2O
= 27.7 ± 0.65 kPaP
H2 = 7.54 ± 0.5 kPa
PCH4
= 13.2 ± 0.27 kPaRate order = 0.202
(e) dependency on CO2
Figure 3.20: Measured dependencies of the different gas species over crushed industrial Ni-YSZ
anode material at 650oC
43
48

0 5 10 15 20 25 30 35 400
0.5
1
1.5
2
2.5
3
3.5
4
4.5
5 x 10⁻⁴re
actio
n ra
te [m
ol/s
gca
t]
Partial Pressure [kPa]
PH2O
= 28.8 ± 0.67 kPaP
H2 = 9.27 ± 0.84 kPa
Rate order = 0.805
(a) dependency on CH4
0 5 10 15 20 25 30 35 400
0.5
1
1.5
2
2.5
3
3.5
4
4.5
5 x 10⁻⁴
reac
tion
rate
[mol
/s g
cat]
Partial Pressure [kPa]
PH2
= 9.57 ± 0.24 kPaP
CH4 = 13.7 ± 0.35 kPa
Rate order = −0.136
(b) dependency on H2O
0 5 10 15 20 25 30 35 400
0.5
1
1.5
2
2.5
3
3.5
4
4.5
5 x 10⁻⁴
reac
tion
rate
[mol
/s g
cat]
Partial Pressure [kPa]
PH2O
= 28.6 ± 0.19 kPaP
CH4 = 13.6 ± 0.086 kPa
Rate order = 0.0603
(c) dependency on H2
0 5 10 15 20 25 30 35 400
0.5
1
1.5
2
2.5
3
3.5
4
4.5
5 x 10⁻⁴
reac
tion
rate
[mol
/s g
cat]
Partial Pressure [kPa]
PH2O
= 27.9 ± 0.52 kPaP
H2 = 10.3 ± 0.64 kPa
PCH4
= 13.6 ± 0.11 kPaRate order = 0.0665
(d) dependency on CO
0 5 10 15 20 25 30 35 400
0.5
1
1.5
2
2.5
3
3.5
4
4.5
5 x 10⁻⁴
reac
tion
rate
[mol
/s g
cat]
Partial Pressure [kPa]
PH2O
= 28.6 ± 0.21 kPaP
H2 = 9.59 ± 0.27 kPa
PCH4
= 13.6 ± 0.13 kPaRate order = 0.128
(e) dependency on CO2
Figure 3.21: Measured dependencies of the different gas species over crushed industrial Ni-YSZ
anode material at 750oC
44
49

0.9 1 1.1 1.2x 10⁻³
−21
−20
−19
−18
−17
−16
−15
1/T [1/K]
ln(k
)
A = 23.3 mol/s g PaEa = 166kJ/mol
Figure 3.22: Arrhenius plot for measured rate constants on the industrial anode material for the
power law expression. The reaction constant, k, has the unit molsgcatPa0.8 .
45
50
3.3.3 Stack Samples
The measurements in this section are made over two samples from cells that have been in operation
in SOFC stacks, both samples are principally identical to the ”Industrial anode material”, but
have been subjected to different treatments. The first sample is from a relatively new stack,
and the second sample is from an older stack. After the stack tests were completed, a cell from
each stack was taken as sample for the measurements presented here. Before the reforming
rate measurements, the cathode has been removed from the cell with hydrochloric acid and the
remaining anode and electrolyte were crushed.
The sample from the new stack has been subject to a short test program over a few days, first on
hydrogen, and afterwards on methane. The stack has furthermore been through a current cycle
with both hydrogen and methane as fuel. The operating temperature of the stack was approxi-
mately 740oC. Figure 3.23 shows the dependency of the different species, observed over the new
stack anode material. The methane rate order has also been determined at other temperatures,
these are all shown in Appendix B.3.
It is seen from Figure 3.23(d) that the dependency of CO is very high, i.e. 0.84. However,
when it was attempted to fit a rate expression with this CO dependency to the measurements, it
resulted in an activation energy close to zero. This happens because the amount of CO formed
in the reactor increases with temperature, and it illustrates that the high dependency of CO is
only seen in the measurements where CO is added to the inlet, it is not relevant for the other
measurements. The same problem was encountered when trying to fit a Langmuir-Hinshelwood
expression to the measurements, as is described in Section 4. On this basis, it is assumed that
the observed CO dependency is the result of an unknown experimental error. The remaining
measurements are fitted with the power law expression shown in Equation 3.6.
r = kP 0.8CH4
P−0.2H2
(3.6)
Figure 3.24 shows Arrhenius plots for the rate constants found for each measurement point for
the obtained power law expression.
The activation energy is found to be 183 kJ/mol, with a pre-exponential factor of 1.7·10−3 mol/s
g Pa0.6, and the average deviation between the kinetic expression and the experimental data is
14.3%.
The old stack sample is from a stack which has been subjected to a long-term test on simulated
pre-reformed natural gas with O/C = 2 for a duration of 5500 hours with an operating tempera-
ture between 640oC and 820oC. Figure 3.25 shows the dependencies found for the old stack anode
material. Methane rate order at other temperatures are found in Appendix B.3.
A relatively strong dependency is seen for both CO and CO2, and when trying to fit the mea-
surements to a power law expression including these strong dependencies, problems similar to
those described with the new stack material measurements were encountered. The CO and CO2
46
51

0 5 10 15 20 25 30 35 400
0.1
0.2
0.3
0.4
0.5
0.6
0.7
0.8
0.9
1 x 10⁻⁴re
actio
n ra
te [m
ol/s
gca
t]
Partial Pressure [kPa]
PH2O
= 28.4 ± 0.49 kPaP
H2 = 9.3 ± 0.84 kPa
Rate order = 0.789
(a) dependency on CH4
0 5 10 15 20 25 30 35 400
0.1
0.2
0.3
0.4
0.5
0.6
0.7
0.8
0.9
1 x 10⁻⁴
reac
tion
rate
[mol
/s g
cat]
Partial Pressure [kPa]
PH2
= 9.65 ± 0.18 kPaP
CH4 = 13.3 ± 0.57 kPa
Rate order = 0.0197
(b) dependency on H2O
0 5 10 15 20 25 30 35 400
0.1
0.2
0.3
0.4
0.5
0.6
0.7
0.8
0.9
1 x 10⁻⁴
reac
tion
rate
[mol
/s g
cat]
Partial Pressure [kPa]
PH2O
= 28.2 ± 0.17 kPaP
CH4 = 13.5 ± 0.1 kPa
Rate order = −0.227
(c) dependency on H2
0 5 10 15 20 25 30 35 400
0.5
1
1.5
2
2.5
3
3.5
4
4.5
5 x 10⁻⁴
reac
tion
rate
[mol
/s g
cat]
Partial Pressure [kPa]
PH2O
= 25.2 ± 2.2 kPaP
H2 = 13.8 ± 3.4 kPa
PCH4
= 12.2 ± 1.1 kPaRate order = 0.841
(d) dependency on CO, notice the different y-axis
0 5 10 15 20 25 30 35 400
0.1
0.2
0.3
0.4
0.5
0.6
0.7
0.8
0.9
1 x 10⁻⁴
reac
tion
rate
[mol
/s g
cat]
Partial Pressure [kPa]
PH2O
= 28.1 ± 0.12 kPaP
H2 = 9.51 ± 0.19 kPa
PCH4
= 13.3 ± 0.068 kPaRate order = 0.0314
(e) dependency on CO2
Figure 3.23: Measured dependencies of the different gas species on the new stack sample at 700oC.
47
52

0.95 1 1.05 1.1 1.15x 10⁻³
−19
−18
−17
−16
−15
−14
−13
−12
1/T [1/K]
ln(k
)
A = 1670 mol/s g Pa0.6
Ea = 183kJ/mol
Figure 3.24: Arrhenius plot for measured rate constants on new stack anode material for the
power law expression. The reaction constant, k, has the unit molsgcatPa0.6 .
dependency on the old stack material are, however, described rather well by adding an approach
to equilibrium term as described in Section 4. This clearly illustrates an inherent weakness in
power law expressions namely that they are more descriptive than accurate. All measurements,
including those with CO and CO2 variations in the inlet, are fitted by a power law expression
that only describes the CH4 dependency as shown in Equation 3.7.
r = kP 0.8CH4
(3.7)
Figure 3.26 shows Arrhenius plots for the rate constants found for each measurement point with
Equation 3.7.
The activation energy is found to be 164 kJ/mol, with a pre-exponential factor of 15.3 mol/s g
Pa0.8. and the average deviation between the kinetic expression and the experimental data is
16.1%. This relatively low overall error in spite of the poor fit to the measurements with CO and
CO2 variations is an effect of a very good fit to the rest of the data.
48
53

0 5 10 15 20 25 30 35 400
0.1
0.2
0.3
0.4
0.5
0.6
0.7
0.8
0.9
1 x 10⁻⁴re
actio
n ra
te [m
ol/s
gca
t]
Partial Pressure [kPa]
PH2O
= 29.3 ± 0.56 kPaP
H2 = 8.6 ± 0.52 kPa
Rate order = 0.858
(a) dependency on CH4
0 5 10 15 20 25 30 35 400
0.1
0.2
0.3
0.4
0.5
0.6
0.7
0.8
0.9
1 x 10⁻⁴
reac
tion
rate
[mol
/s g
cat]
Partial Pressure [kPa]
PH2
= 8.78 ± 0.16 kPaP
CH4 = 14 ± 0.14 kPa
Rate order = −0.0949
(b) dependency on H2O
0 5 10 15 20 25 30 35 400
0.1
0.2
0.3
0.4
0.5
0.6
0.7
0.8
0.9
1 x 10⁻⁴
reac
tion
rate
[mol
/s g
cat]
Partial Pressure [kPa]
PH2O
= 29 ± 0.13 kPaP
CH4 = 14 ± 0.13 kPa
Rate order = −0.0468
(c) dependency on H2
0 5 10 15 20 25 30 35 400
0.1
0.2
0.3
0.4
0.5
0.6
0.7
0.8
0.9
1 x 10⁻⁴
reac
tion
rate
[mol
/s g
cat]
Partial Pressure [kPa]
PH2O
= 28.2 ± 0.65 kPaP
H2 = 9.64 ± 1 kPa
PCH4
= 14 ± 0.25 kPaRate order = 0.43
(d) dependency on CO
0 5 10 15 200
0.1
0.2
0.3
0.4
0.5
0.6
0.7
0.8
0.9
1 x 10⁻⁴
reac
tion
rate
[mol
/s g
cat]
Partial Pressure [kPa]
PH2O
= 28.8 ± 0.44 kPaP
H2 = 9.12 ± 0.8 kPa
PCH4
= 13.9 ± 0.32 kPaRate order = 0.59
(e) dependency on CO2
Figure 3.25: Measured dependencies of the different gas species on the old stack sample at 700oC.
49
54

0.9 1 1.1 1.2x 10⁻³
−21
−20
−19
−18
−17
−16
−15
1/T [1/K]
ln(k
)
A = 15.3 mol/s g Pa0.8
Ea = 164kJ/mol
Figure 3.26: Arrhenius plot for measured rate constants on old stack anode material for the power
law expression. The reaction constant, k, has the unit molsgcatPa0.8 .
50
55
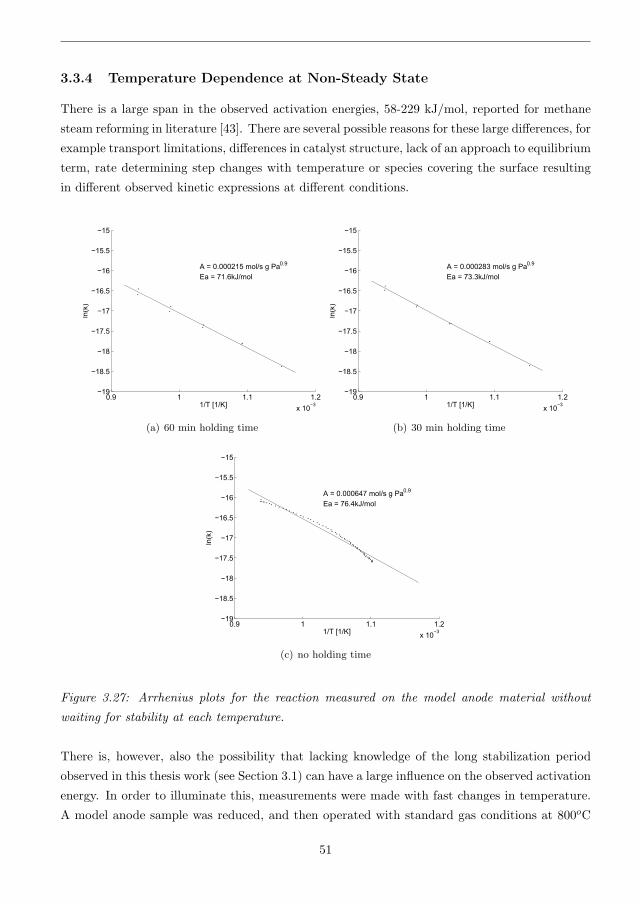
3.3.4 Temperature Dependence at Non-Steady State
There is a large span in the observed activation energies, 58-229 kJ/mol, reported for methane
steam reforming in literature [43]. There are several possible reasons for these large differences, for
example transport limitations, differences in catalyst structure, lack of an approach to equilibrium
term, rate determining step changes with temperature or species covering the surface resulting
in different observed kinetic expressions at different conditions.
0.9 1 1.1 1.2x 10⁻³
−19
−18.5
−18
−17.5
−17
−16.5
−16
−15.5
−15
1/T [1/K]
ln(k
)
A = 0.000215 mol/s g Pa0.9
Ea = 71.6kJ/mol
(a) 60 min holding time
0.9 1 1.1 1.2x 10⁻³
−19
−18.5
−18
−17.5
−17
−16.5
−16
−15.5
−15
1/T [1/K]
ln(k
)
A = 0.000283 mol/s g Pa0.9
Ea = 73.3kJ/mol
(b) 30 min holding time
0.9 1 1.1 1.2x 10⁻³
−19
−18.5
−18
−17.5
−17
−16.5
−16
−15.5
−15
1/T [1/K]
ln(k
)
A = 0.000647 mol/s g Pa0.9
Ea = 76.4kJ/mol
(c) no holding time
Figure 3.27: Arrhenius plots for the reaction measured on the model anode material without
waiting for stability at each temperature.
There is, however, also the possibility that lacking knowledge of the long stabilization period
observed in this thesis work (see Section 3.1) can have a large influence on the observed activation
energy. In order to illuminate this, measurements were made with fast changes in temperature.
A model anode sample was reduced, and then operated with standard gas conditions at 800oC
51
56

until the activity has stabilized. After this, three series of temperature changes were made, with
different holding time at each temperature before the activity measurement was taken. One with
a 60 min waiting period, one with a 30 min waiting period and one where the reactor was cooled
from 800oC to 650oC without pause. After each series, the temperature was kept at 800oC until
stability had been reached again.
Figure 3.27 shows the Arrhenius plot for the three measurement series for the reaction constant
with respect to the power law expression in Equation 3.3.
The observed activation energy of the three measurement series are close to each other because
the approach to steady state is so slow that the change in activity after an hour is not significant.
In the measurement series with no holding time, seen in Figure 3.27(c), a change in the slope
is observed around 1/T = 1.03. This is most likely an effect of the temperature changes being
so fast that the surface coverage of the different species does reach a new steady state at each
temperature. More interesting is the fact that the observed activation energy, i.e. 71-76 kJ/mol
in these fast measurement series is less than half of the 185 kJ/mole, which is obtained when
waiting for stability at each temperature. It is likely that the activation energy found with fast
temperature changes is the actual activation energy of the reaction, and the increased activation
energy found when waiting for stability is caused by reversible structural changes in the catalyst.
This theory should in future work be examined with in-situ TEM or other in-situ characterization
techniques, since it is likely that the catalyst structure will also change during shutdown.
These two different activation energies for the reactivity, combined with the dynamic behavior
described in section 3.1, may very well be the reason for the large variations in the activation
energy values reported in litterature. The measurements made here with fast temperature changes
were made after steady state was achieved at 800oC. If the temperature changes are made while
the approach to steady state is still taking place, then any value can be measured for the activation
energy, depending on the procedure. The measured activation energy will in this case depend on
whether temperature changes are performed by increasing or decreasing temperature, as well as
how fast the temperature changes are made.
3.4 Stack Measurements
The rate of catalytic steam reforming of methane over an industrial SOFC anode is extremely
high. This is because of the combined effect of high operating temperature, a highly active catalyst
material, a high catalyst content and a low flow. Furthermore, the electrochemical reactions in
an SOFC convert hydrogen to water, in other words it removes product from the steam reforming
reaction and adds reactant. In order to avoid this, all measurements were performed without
electrochemical reactions in the cell, by having no oxidant on the cathode side. The result of this
is high degrees of conversion and large temperature gradients which makes it very challenging to
obtain reliable measurements on the steam reforming rate over a real anode structure.
52
57

The high reaction rate and the structure of the anode, also means that the observed rate will
be limited by mass transport effects. The purpose of these stack measurements is to measure
the rate with realistic mass transport and by comparison with the results from the packed bed
measurements the mass transport effect is evaluated in section 4.2.
It was first attempted to measure the steam reforming rate on a 5-cell stack, but complete
conversion was observed. In order to decrease the degree of conversion, a stack with only one half
cell was produced, see Section 2.5.2, and the stack was also operated at high total flow rate, ie.
≈ 2 Nlmincell (normal operation ≈ 0.5 Nl
mincell ). The observed degrees of conversion were, however,
still rather high (0.3-0.8), especially at high temperature, so in order to decrease conversion even
further stacks with one quarter of a cell were also produced.
A further decrease in cell area would have been preferred, but removing part of the cell sig-
nificantly reduced the durability of the cells, and several of the modified cells cracked under
conditions that a normal stack could withstand. Furthermore, it was feared that removing more
than 3/4 of the cell would result in a significant change in the flow pattern of the gas, with respect
to a full cell.
3.4.1 Half Cell
During experiments on this stack there were several practical problems with things such as gas
supply and faulty gas analyzers. The stack was destroyed because of an error in the shutdown
procedure during a blackout. So the amount of data on this cell is very limited. All rate
order determination measurements are shown in Appendix B.4. The measurements have large
uncertainties from the high conversion in the measurements which is between 40 and 98%. This
results in large deviations in the observed reaction orders, the order of water is found in the range
-0.5 to 0.25 and the order of CO2 is in the range 0 to 1.4.
Because of the high experimental uncertainty, the rate expression found from these measurements
should only be considered as an estimation. First of all it is assumed that the reaction is first
order in methane and independent of the other species, Equation 3.8.
r = kPCH4 (3.8)
The Arrhenius plot for the rate constant is shown in Figure 3.28, where EA = 63 kJ/mol and A =
0.0059 mol/s m2 Pa. The activation energy observed in these measurements is much lower than
those measured in the tubular reactor. It is important to keep in mind that the measurements
are possibly unreliable because of the experimental difficulties. This is also illustrated by the
fact that even though there are only measurements at three different temperatures, it is clear
to see that the Arrhenius plot does not give a straight line. The dotted line in Figure 3.28 is
the rate expression measured on the quarter cell stack (see Section 3.4.2). It is seen that there
is a very good correspondence between the measurements on the two stacks, except at 600oC.
This clearly illustrates that the measurements at 600oC are invalid, which was already suspected
53
58

because these measurements were subject to massive complications.
0.9 1 1.1 1.2x 10⁻³
−15
−14.5
−14
−13.5
−13
−12.5
−12
−11.5
−11
1/T [1/K]
ln(k
)
A = 0.0059 mol/s m2 PaEa = 63kJ/mol
Figure 3.28: Arrhenius plot for a half cell stack. The reaction constant, k, has the unit molsm2Pa
,
where m2 refers to the geometric anode area.
The average deviation between the measurements and the expression is 29%. This relatively low
average deviation is an effect of the low amount of measurements. Furthermore, as is indicated
by the plot in Figure 3.28, the high and low temperaure results fit well with the kinetic expression
while the measurements at the intermediate temperature has deviations of 60-95%.
3.4.2 Quarter Cell
The measurements made on the half cell stack showed that a further reduction in cell area would
be advantageous in order to decrease the degree of conversion, especially at high temperatures.
The other possibility of reducing the degree of conversion is to increase the total flow rate. The
flow rate is, however, already 5-10 times higher than what would be used under normal operation
of an SOFC stack. Figures 3.29 and 3.30 show the the influence on the flow rate by varying the
gas composition at respectively 650oC and 750oC .
The observed dependencies are very similar to those seen both for the half cell stack and the
measurements made in the packed bed measurements. i.e. a reaction order a little lower than
one for methane, and close to zero for the other species. Plots showing the measured dependency
of methane at other temperatures can be seen in Appendix B.5. Figure 3.31 shows an Arrhenius
plot for the quarter cell measurements, with the rate constant values obtained for an expression
with a 0.7 order dependency on methane, and no dependency of the other species. This gives the
rate expression seen in Equation 3.9.
r = 2 · 104 mole
sm2Paexp(
−166.1 kJmoleRg
T)P 0.7
CH4(3.9)
54
59

0 5 10 15 20 25 30 35 400
0.5
1
1.5
2
2.5
3
3.5
4
4.5
5 x 10⁻³
reac
tion
rate
[mol
/s m
2 ]
Partial Pressure [kPa]
PH2O
= 51.2 ± 0.41 kPaP
H2 = 6.93 ± 0.35 kPa
Rate order = 0.75
(a) dependency on of CH4
0 10 20 30 40 500
0.5
1
1.5
2
2.5
3
3.5
4
4.5
5 x 10⁻³
reac
tion
rate
[mol
/s m
2 ]
Partial Pressure [kPa]
PH2
= 6.75 ± 0.16 kPaP
CH4 = 12 ± 0.29 kPa
Rate order = −0.0577
(b) dependency on of H2O
0 5 10 15 20 25 30 35 400
0.5
1
1.5
2
2.5
3
3.5
4
4.5
5 x 10⁻³
reac
tion
rate
[mol
/s m
2 ]
Partial Pressure [kPa]
PH2O
= 51.2 ± 0.098 kPaP
CH4 = 12 ± 0.038 kPa
Rate order = −0.207
(c) dependency on H2
0 5 10 15 20 25 30 35 400
0.5
1
1.5
2
2.5
3
3.5
4
4.5
5 x 10⁻³
reac
tion
rate
[mol
/s m
2 ]
Partial Pressure [kPa]
PH2O
= 51.1 ± 0.23 kPaP
H2 = 7.14 ± 0.1 kPa
PCH4
= 11.9 ± 0.063 kPaRate order = −0.0547
(d) dependency on CO2
Figure 3.29: Measured dependencies of the different gas species over the quarter cell stack at
650oC
55
60

0 5 10 15 20 25 30 35 400
0.01
0.02
0.03
0.04
0.05
0.06
0.07re
actio
n ra
te [m
ol/s
m2 ]
Partial Pressure [kPa]
PH2O
= 48.2 ± 2.1 kPaP
H2 = 14 ± 3.1 kPa
Rate order = 0.649
(a) dependency on of CH4
0 10 20 30 40 500
0.01
0.02
0.03
0.04
0.05
0.06
0.07
reac
tion
rate
[mol
/s m
2 ]
Partial Pressure [kPa]
PH2
= 12.9 ± 0.36 kPaP
CH4 = 10.3 ± 0.19 kPa
Rate order = −0.0248
(b) dependency on of H2O
0 5 10 15 20 25 30 35 400
0.01
0.02
0.03
0.04
0.05
0.06
0.07
reac
tion
rate
[mol
/s m
2 ]
Partial Pressure [kPa]
PH2O
= 48.9 ± 0.21 kPaP
CH4 = 10.3 ± 0.086 kPa
Rate order = 0.0104
(c) dependency on H2
0 5 10 15 20 25 30 35 400
0.01
0.02
0.03
0.04
0.05
0.06
0.07re
actio
n ra
te [m
ol/s
m2 ]
Partial Pressure [kPa]
PH2O
= 48.3 ± 0.31 kPaP
H2 = 13.3 ± 0.22 kPa
PCH4
= 10.4 ± 0.14 kPaRate order = −0.0619
(d) dependency on CO
0 5 10 15 20 25 30 35 400
0.01
0.02
0.03
0.04
0.05
0.06
0.07
reac
tion
rate
[mol
/s m
2 ]
Partial Pressure [kPa]
PH2O
= 48.9 ± 0.41 kPaP
H2 = 12.9 ± 0.36 kPa
PCH4
= 10.2 ± 0.091 kPaRate order = −0.0298
(e) dependency on CO2
Figure 3.30: Measured dependencies of the different gas species over the quarter cell stack at
750oC
56
61

0.9 1 1.1 1.2x 10⁻³
−15
−14
−13
−12
−11
−10
−9
−8
1/T [1/K]
ln(k
)
A = 1.99e+004 mol/s m2 Pa0.7
Ea = 166.1kJ/mol
Figure 3.31: Arrhenius plot for measured rate constants on the quarter cell stack.
The average deviation between the model and the measurement points is 20.6%. This is similar
to the deviation for the expression found for the half-cell measurements, but because the number
of measurements on the quater cell is much higher, it has much better credibility.
In Section 4.2, the rate measurements on the quarter cell stack will be compared to rates predicted
from the intrinsic kinetics measured in the tubular reactor combined with an estimate of the mass
transport limitations in the stack.
57
62

Chapter 4
Kinetic Expressions
A great number of elementary reactions are known to take place during catalytic steam reforming
of methane [13, 27]. It is, however, often estimated that the 9 elementary reactions shown below
are sufficient to give a complete understanding of the mechanism [19, 32, 36].
1. CH4 + 2∗ → CH∗3 + H∗
2. CH∗3+∗ � CH∗
2 + H∗
3. CH∗2+∗ � CH∗ + H∗
4. CH∗+∗ � C∗ + H∗
5. H2O + 2∗ � HO∗ + H∗
6. HO∗+∗ � O∗ + H∗
7. C∗ + O∗ � CO∗+∗
8. CO∗ � CO+∗
9. 2H∗ � H2 + 2∗
It is generally agreed, that Reaction 1 is a rate limiting step, but both experimental studies and
Density Functional Theory (DFT) calculations have shown Reaction 7 may also be rate limiting
[10, 36]. Furthermore, the dissociation of water, Reaction 5, has also been proposed as a rate
limiting step [47, 51].
Assuming that the surface is clean from adsorbents and that Reaction 7 is the rate limiting step,
results in the kinetic expression shown in Equation 4.1, see Appendix C for derivation.
r = kPCH4PH2O
P 3H2
(1 − Qsr
Ksr
)θ2∗ (4.1)
58
63
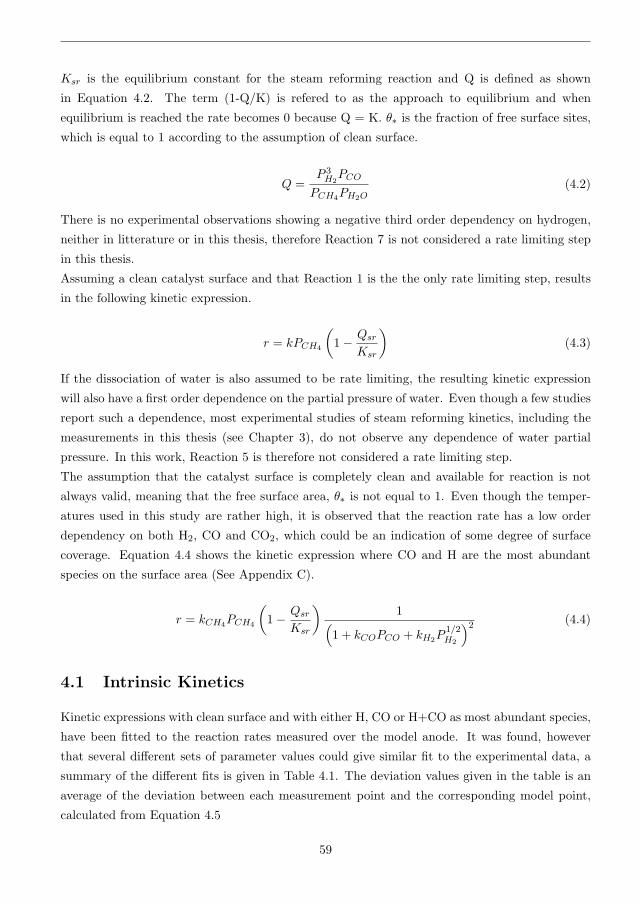
Ksr is the equilibrium constant for the steam reforming reaction and Q is defined as shown
in Equation 4.2. The term (1-Q/K) is refered to as the approach to equilibrium and when
equilibrium is reached the rate becomes 0 because Q = K. θ∗ is the fraction of free surface sites,
which is equal to 1 according to the assumption of clean surface.
Q =P 3
H2PCO
PCH4PH2O(4.2)
There is no experimental observations showing a negative third order dependency on hydrogen,
neither in litterature or in this thesis, therefore Reaction 7 is not considered a rate limiting step
in this thesis.
Assuming a clean catalyst surface and that Reaction 1 is the the only rate limiting step, results
in the following kinetic expression.
r = kPCH4
(1 − Qsr
Ksr
)(4.3)
If the dissociation of water is also assumed to be rate limiting, the resulting kinetic expression
will also have a first order dependence on the partial pressure of water. Even though a few studies
report such a dependence, most experimental studies of steam reforming kinetics, including the
measurements in this thesis (see Chapter 3), do not observe any dependence of water partial
pressure. In this work, Reaction 5 is therefore not considered a rate limiting step.
The assumption that the catalyst surface is completely clean and available for reaction is not
always valid, meaning that the free surface area, θ∗ is not equal to 1. Even though the temper-
atures used in this study are rather high, it is observed that the reaction rate has a low order
dependency on both H2, CO and CO2, which could be an indication of some degree of surface
coverage. Equation 4.4 shows the kinetic expression where CO and H are the most abundant
species on the surface area (See Appendix C).
r = kCH4PCH4
(1 − Qsr
Ksr
)1(
1 + kCOPCO + kH2P1/2H2
)2 (4.4)
4.1 Intrinsic Kinetics
Kinetic expressions with clean surface and with either H, CO or H+CO as most abundant species,
have been fitted to the reaction rates measured over the model anode. It was found, however
that several different sets of parameter values could give similar fit to the experimental data, a
summary of the different fits is given in Table 4.1. The deviation values given in the table is an
average of the deviation between each measurement point and the corresponding model point,
calculated from Equation 4.5
59
64

err =
√(rmeasured − rmodel
rmeasured∗ 100%
)2
; (4.5)
Looking at the power law and clean surface expressions in Table 4.1, it is immediately seen that
the approach to equilibrium term accounts for a large part of the deviations in the power law
expression. Apparently only the CO dependence is not completely described by the clean surface
expression, i.e. a deviation of 58% compared to 16.9% and 19.6% for H2 and CO2 and 18.9%
overall deviation. This indicates that CO covers a significant part of the catalyst surface and the
tests of different kinetic expressions have been focused on this. H2, CO and CO2 were all observed
to effect the reaction rate,. Even though the approach to equilibrium term seems to account for
the dependency on H2 and CO2, expressions with adsorption of both species have been tested,
since the three species are connected through the water gas shift reaction. The expression with
CO2 adsorption is not included in Table 4.1, but gave a fit very similar to that for the expression
with H2 adsorption, i.e. no significant improvement compared to the clean surface expression.
The different parameter fits found for the expression assuming CO as the most abundant surface
species in table 4.1, exemplify an inherent weakness in micro kinetic models. Several different
sets of parameter values were found that gave a good fit to the experimental data, illustrating
that the large number of model parameters enables a fit, event though the assumptions may not
be correct. In litterature, the activation energy of CO adsorption is reported to be around -100
kJ/mol [6, 7, 27]. The first set of parameters for the expression with CO adsorption is an attempt
to find a fit with an adsorption energy in the reported range. It was not possible to obtain even
a decent fit with such high values of EaCO. The best fit was obtained with a small negative or
positive activation energy. Even a fit with EaCO = 0 (i.e. temperature independent) gave a good
fit. It is, however, expected that the activation energy of adsorption of gases is negative, since
adsorption is normally reported to decrease with increasing temperature. An expression with
both CO and H2 adsorption is also tested, and with positive values of EaCO it was possible to
achieve a slightly better fit than for only CO adsorption. Because positive values of activation
energy for adsorption are unrealistic and because only a slight improvement was achieved by the
addition of two extra model parameters, an expression with CO adsorption only is chosen as the
best fit, see Equation 4.6.
r =110 mole
gsPaexp(−198kJ/mole
RT
)PCH4
(1 − Qsr
Ksr
)(1 + 1.7 ∗ 10−6Pa−1exp
(26kJ/mole
RT
)PCO
)2 (4.6)
This expression was also determined fitted to the kinetic measurements for the industrial anode
material, as shown in Equation 4.7, with an overall deviation from experimental data of 19%.
r =100 mole
gsPaexp(−195kJ/mole
RT
)PCH4
(1 − Qsr
Ksr
)(1 + 4.6 ∗ 10−7Pa−1exp
(32kJ/mole
RT
)PCO
)2 (4.7)
60
65

Tab
le4.
1:Su
mm
ary
ofth
edi
ffer
ent
kine
tic
expr
essi
ons
fitte
dto
the
expe
rim
enta
lda
ta,
the
first
six
colu
mns
show
the
valu
esof
the
pre-
expo
nent
ialfa
ctor
and
activa
tion
ener
gyfo
rre
spec
tive
ly,
met
hane
diss
ocia
tion
,C
Oad
sorp
tion
and
H2
diss
ocia
tion
.T
hela
stfiv
e
colu
mns
show
the
aver
age
devi
atio
nbe
twee
nth
eki
netic
expr
essi
onan
dth
eex
peri
men
talda
tafo
r:A
llda
tapo
ints
and
data
with
vary
ing
H2O
cont
ent,
H2
cont
ent,
CO
cont
entan
dC
O2
cont
ent,
resp
ective
ly.
mos
tab
unda
ntPar
amet
erva
lues
Dev
iati
on
spec
ies
AC
H4
Ea C
H4
AC
OE
a CO
AH
2E
a H2
over
all
H2O
H2
CO
CO
2
mol
/gs
Pa
kJ/m
olPa−
1kJ
/mol
Pa−
1/2
kJ/m
ol%
%%
%%
pow
erla
w13
918
5-
--
-43
.720
.739
.511
1.2
97.1
clea
nsu
rfac
e22
720
5-
--
-18
.910
.216
.958
19.6
H90
196
--
1.20
E-0
6-4
618
.611
.718
.155
.619
.5
CO
100
150
4.70
E-0
7-1
00-
-67
.239
54.6
99.7
58.7
CO
100
197
4.60
E-0
7-4
1-
-15
11.1
18.9
2818
.8
CO
110
198
1.70
E-0
6-2
6-
-14
.711
.818
.723
.819
.3
CO
103
197
8.40
E-0
50
--
14.6
1119
.423
.817
.7
CO
110
198
5.50
E-0
418
--
14.4
1219
21.4
19.4
H+
CO
100
196
6.90
E-0
8-5
49.
80E
-06
-32
14.7
9.8
17.4
27.8
18
H+
CO
100
194
1.80
E-0
5-1
03.
70E
-05
-37
14.3
8.5
18.8
27.8
19
H+
CO
100
195
9.10
E-0
50
1.70
E-0
5-3
413
.99.
417
.424
.618
.4
H+
CO
100
195
1.10
E-0
319
7.50
E-0
6-4
013
.59.
216
.823
.118
.4
H+
CO
100
196
1.10
E-0
236
6.00
E-0
6-4
513
.38.
217
.322
.418
.9
61
66

The average deviation for the final expression over the industrial anode is 4 percentage points
higher than that over the model anode. This increase is, however, located in the measurements
with temperature and methane concentration changes, not from the changes in H2, CO and CO2
concentrations.
600 620 640 660 680 700 720 740 760 780 8000
0.005
0.01
yCH4
= 40%, yH2O = 60%
Temperature [oC]
Rat
e [m
ol/s
m2 N
i] BoderKingWeiModel anodeIndustrial anode
600 620 640 660 680 700 720 740 760 780 800
−4
−3
−2yCH
4
= 40%, yH2O = 60%
Temperature [oC]
Log(
Rat
e)
600 620 640 660 680 700 720 740 760 780 8000
0.5
1
1.5x 10⁻³
yCH4
= 10%, yH2O = 35%, yH
2
= 35%, yCO = 10%, yCO2
= 10%
Temperature [oC]
Rat
e [m
ol/s
m2 N
i]
Figure 4.1: Comparison of obtained rate expressions with expressions from literature: Boder [14],
King [38], and Wei [71].
Assuming an average Ni particle size of 250 nm and that all Ni particle are spherical and only have
single point contact with other particles, the Ni surface area of the model anode and industrial
anode material is estimated to be 0.16 m2/g. From this estimate, a comparison is made of
the expressions obtained in thesis with expressions found in literature, see Figure 4.1. A more
thorough comparison of the literature expressions is given in [43]. The rate expression measured
by Wei and Iglesia [71] is measured over a classical steam reforming catalyst, and is included
as a reference. It is seen that the rates obtained in this thesis are in the same range as those
reported in literature, but clearly in the high end of the range, especially at high temperatures.
62
67

Furthermore, it is seen that the rates measured for the industrial anode and the model anode are
almost identical, and in one instance they are in fact completely overlapping.
The packed bed measurements on samples from stacks that have been in use (see Section 3.3.3)
have also been fitted with microkinetic expressions. The resulting expressions are shown in
Equations 4.8 and 4.9, for the new and old stack, respectively.
r = 7.1mole
gsPaexp
(−169kJ/mole
RT
)PCH4
(1 − Qsr
Ksr
)(4.8)
r =1.12 mole
gsPaexp(−159kJ/mole
RT
)PCH4
(1 − Qsr
Ksr
)(1 + 1.1 ∗ 10−8Pa−1exp
(21kJ/mole
RT
)PCO
)2 (4.9)
The measurements on the new stack anode material with variations in CO inlet concentration
showed a strong influence of CO on the rate. It was not possible to obtain a good description
of this behavior with any of the expressions described in this thesis without also getting a sig-
nificantly worse fit to the other measurements on this catalyst sample. Because of this, the CO
variation measurements are discarded, and as a result no CO dependency is present in the rate
expression (Equation 4.8).
On the old stack sample a strong dependency of both CO and CO2 was observed. These are,
however, described reasonably well with the expression in Equation 4.9, even though there is still
a rather large deviation from the measurements with variations in CO2 inlet concentration, i.e.
33%.
Two very interesting observations can be made for the two anode samples that have been subject
to stack operation with current production. The first is that they have similar activity with
respect to steam reforming, meaning that the rate is not significantly changed after 5500 hours of
operation. The second observation is that these two samples have significantly lower activation
energy than the samples that have not been used for current production (Equations 4.6 and4.7).
This indicates that the catalytic activity of Ni-YSZ anode material changes significantly when
first subjected to a current, but remains relatively constant over time afterwards.
4.2 Prediction of Stack Reforming Rate from Intrinsic Kinetics
The rates measured in the stack/cell setup experiments are highly dependent on the configuration
of the stack. This means that the rate expression should only be used for modeling stacks with
the exact same configuration. So in order to obtain a more general description of the steam
reforming rate in a SOFC stack, it has been attempted to make a simple model that can describe
the reforming rate in the stack from the intrinsic reaction rate measured in the tubular reactor
experiments. The thought is to describe the cell via the design equation for a fixed bed reactor.
as shown in Equation 4.10.
63
68

dXCH4
dWcat=
reff
NCH4,in(4.10)
XCH4 is the conversion of methane, Wcat is the catalyst weight, NCH4,in is the molar inlet flow
of methane, and reff is the effective reaction rate described by Equation 4.11.
reff = η ∗ rintrinsic (4.11)
rintrinsic is the rate calculated from the kinetic expression determined over the industrial anode,
see Equation 4.7 and η is the efficiency factor, calculated from Equation 4.12. η describes how
big a fraction of the available catalyst material that is being fully used, i.e. an efficiency factor
= 1 corresponds to full usage of the catalyst [19].
η =Tanh(φ)
φ(4.12)
φ is the Thiele modulus, which is calculated from the expression for a first order reaction on a
slab shaped catalyst:
φ = L
√k
D
L is the anode thickness, k is the rate constant (s−1), and D is the effective diffusion coefficient
(m2s−1) of methane which is set to 10−5. This value has been estimated based on the experience
gained during the model work described in Section 5 and was chosen to represent the diffusion
at high temperatures, since this is where diffusion has the largest influence. The expression used
here for determining η is valid for systems where pore diffusion is dominant, i.e. intermediate
values of φ. At high and low values of φ other estimations should be used. The differential
equation is solved using ode45 on matlab, the full matlab code can be seen in Appendix D.
Figure 4.2 shows a comparison of the values obtained with the model described here, with the
measurement points as well as the expression fitted to the measurements from the quarter cell
stack, see Section 3.4.2. The temperature used in the model is the average of the measurements
from the four thermocouples in the quarter cell stack.
Considering the simplicity of the model, it is surprisingly good at predicting the conversion in
the stack, with an average deviation between model data and measurements of 44.6%. Keep in
mind that the only inputs to the model is the gas composition, the efficiency factor calculated
from the structure of the anode, the temperature, and the rate expression from the fixed bed
measurements. This approach differs from the majority of the modeling work in literature on
two points (1) The study is based on experiments in both a packed bed reactor and a stack, and
the results are then compared via this model (2) The influence mass transport limitation through
the anode is simplified by describing it with an efficiency factor. This approach is a text book
method in catalytic reaction engineering [23], but is normally not used in fuel cell modeling.
64
69

Figure 4.2: Comparison of the measured conversion for the quarter cell stack with both the ex-
pression fitted to the data and the results of the model.
It is seen in Figure 4.2 that the model most often overestimates the degree of conversion, which
indicates a systematic error in the measurements or model. Since the steam reforming rate has
a high activation energy, it will be sensitive to relatively small variations in temperature, so
this parameter is examined closer. As described in Sections 2.1 and 2.5.2, thermocouples are
placed close to the catalyst in both setups. There is, however, a difference in the placement of
the thermocouples in the two setups. In the fixed bed setup, the thermocouple is placed in the
gas channel just after the reaction zone, meaning that an error in the measurement will most
likely give a too low temperature. In the stack setup, the thermocouples are placed in the gas
distribution plate, and since the stack has lower temperature than the oven chamber, due too
cooling both from the gas flow and the steam reforming, any errors in the measurements are
likely to overestimate the temperature. In order to see the effect of such a systematic error in
the measured temperature, the model is compared to the stack data again, this time with the
temperature in the model set 10oC lower than the measurement in the stack, corresponding to a
5oC systematic error in each setup. The result of this is shown in Figure 4.3.
It is seen that the correspondence between measured and predicted values has increased signifi-
cantly, giving an average deviation of just 26.0%, similar to the error of the first order expression
that was fitted directly to the quarter cell stack measurements, see Section 3.4.2.
Figure 4.4 shows a comparison of the measured conversion and the conversion predicted by the
model, both at the measured temperature 4.4(a)-4.4(b) and with a 10o lowered temperature
4.4(c)-4.4(d). With this representation of the deviation between model and measurements, it
seems that the 10o decrease in model temperature does not significantly prove the fit. The
greatly improved average deviation for the model with decreased temperature is a bit misleading
65
70

Figure 4.3: Comparison of the measured conversion for the quarter cell stack with both the ex-
pression fitted to the data and the results of the model, .
since it is the result of an improved fit at the temperatures with many measurements at the
expense of a worse fit at other temperatures.
It can also be seen in Figures 4.4(b) and 4.4(d) that the major deviations are at low conversion
while higher conversions have a better fit. The points with the largest deviance between model
and measurements in Figure 4.4(b) are for measurements with variations in methane concentra-
tion at 600oC (four points underestimated by the model) and 675oC (four pointw overestimated
by model). These deviations does not seem to be systematic, and are therefore ascribed to
experimental uncertainty.
In conclusion, it has been shown that the model presented here can be used to predict the
steam reforming reforming rate over a SOFC anode with reasonable accuracy from an estimated
efficiency factor and and an intrinsic rate expression. Since the model is easily computed, it is
feasible to include it in any type of SOFC model.
66
71
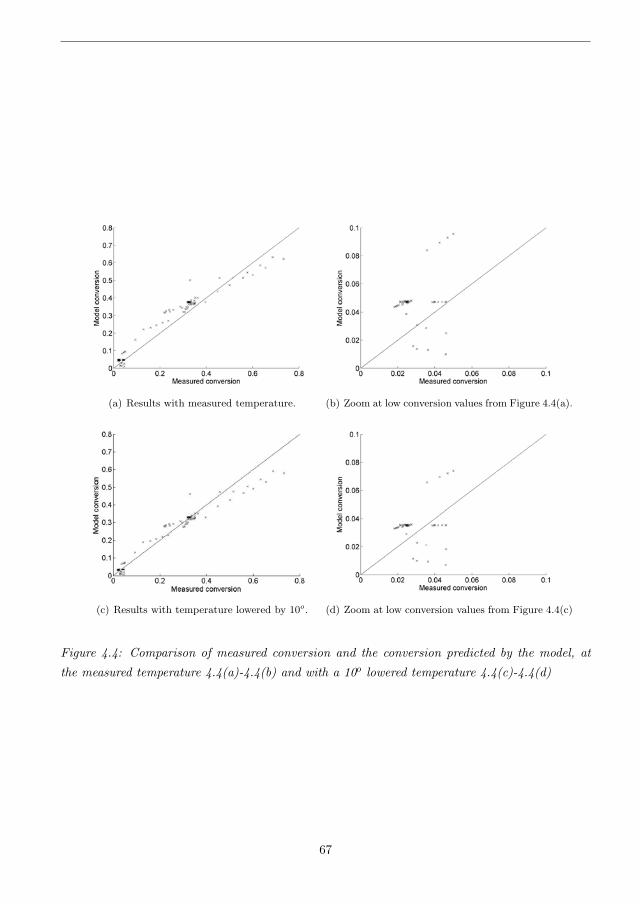
(a) Results with measured temperature. (b) Zoom at low conversion values from Figure 4.4(a).
(c) Results with temperature lowered by 10o. (d) Zoom at low conversion values from Figure 4.4(c)
Figure 4.4: Comparison of measured conversion and the conversion predicted by the model, at
the measured temperature 4.4(a)-4.4(b) and with a 10o lowered temperature 4.4(c)-4.4(d)
67
72
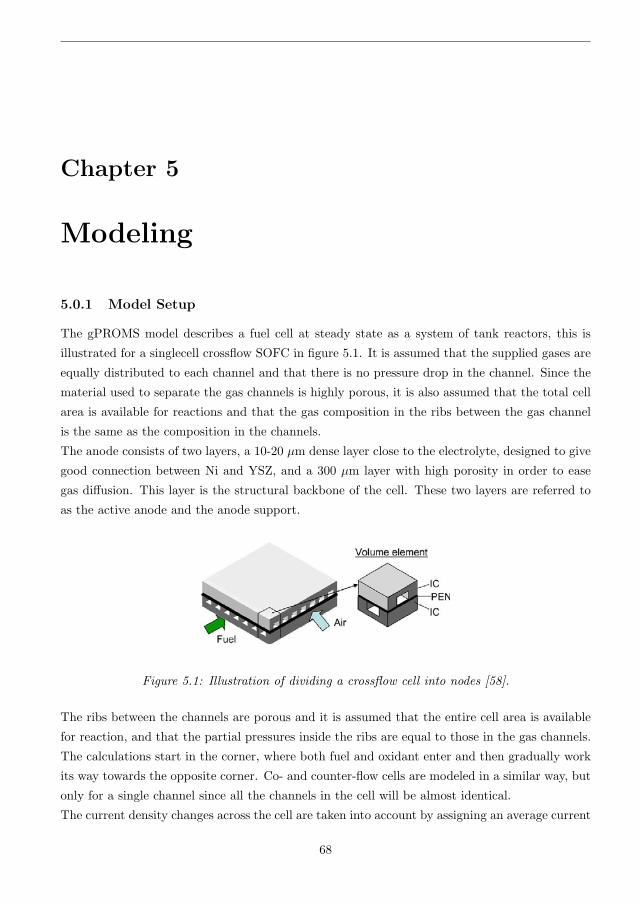
Chapter 5
Modeling
5.0.1 Model Setup
The gPROMS model describes a fuel cell at steady state as a system of tank reactors, this is
illustrated for a singlecell crossflow SOFC in figure 5.1. It is assumed that the supplied gases are
equally distributed to each channel and that there is no pressure drop in the channel. Since the
material used to separate the gas channels is highly porous, it is also assumed that the total cell
area is available for reactions and that the gas composition in the ribs between the gas channel
is the same as the composition in the channels.
The anode consists of two layers, a 10-20 μm dense layer close to the electrolyte, designed to give
good connection between Ni and YSZ, and a 300 μm layer with high porosity in order to ease
gas diffusion. This layer is the structural backbone of the cell. These two layers are referred to
as the active anode and the anode support.
Figure 5.1: Illustration of dividing a crossflow cell into nodes [58].
The ribs between the channels are porous and it is assumed that the entire cell area is available
for reaction, and that the partial pressures inside the ribs are equal to those in the gas channels.
The calculations start in the corner, where both fuel and oxidant enter and then gradually work
its way towards the opposite corner. Co- and counter-flow cells are modeled in a similar way, but
only for a single channel since all the channels in the cell will be almost identical.
The current density changes across the cell are taken into account by assigning an average current
68
73

density (iave) for the cell and then setting up the constraint shown in eq. 5.1.
iaveAtot =∑
inAn (5.1)
It is assumed that the cell voltage is the same for all cell units.
The outlet from each volume element is calculated from the standard equation for a continuously
stirred tank reactor (CSTR), where the reaction rate is substituted with the flux through the
electrode surface, Jsurfi , eq. 5.2.
V =Fi0 − Fi
Jsurfi
(5.2)
The current density for each cell is calculated from Equation 5.3.
U = Urev − i · Rtot (5.3)
Urev is the reversible cell voltage and Rtot is the sum of the ohmic resistance, Rohm, and two
resistances used to describe the electrochemical reaction kinetics, Rcat and Rano
Rohm = k0,m · eEA,mRgT (5.4)
cathode:1
Rcat=
4Fa
RgTkcat
(pO2
p0
)m1
exp(−EA,cat
RgT
)(5.5)
anode:1
Rano=
2Fa
RgTkano
(pH2
p0
)m2
exp(−EA,ano
RgT
)(5.6)
The resistance expressions are based on the impedance data from Barfod et al. [8, 9]. m1 and
m2 are both set to 0.25, and the activation energies used are: EA,m = 1 eV, EA,cat = 1.6 eV and
EA,ano = 1.1 eV.
The reversible cell voltage is calculated from the Nernst equation, using the gas concentrations
at the electrode surface.
Urev = −ΔG
2Fa+
RgT
2Faln
⎡⎣PH2,ano · P
12
O2,cat
PH2O,ano
⎤⎦ (5.7)
These concentrations are found by modeling the gas diffusion through the electrodes with the
dusty gas model which is shown in Equation 5.8. It is assumed that there is no temperature
gradient across the electrodes (perpendicular to the gas flow channels) and that the difference in
total pressure does not influence the diffusion. The validity of these assumptions are evaluated
in Appendix E.
Ji
Deffi,k
+n∑
j=1,j �=i
XjJi − XiJj
Deffij
= − P
RgT
dXi
dz(5.8)
69
74

z is the position in the electrode with z = 0 at the gas channel, Deffi,k is the effective Knudsen
diffusion, and Deffij is the effective binary diffusion coefficient (see Appendix G for further infor-
mation) .The effective diffusion coefficient (Dei ) for each component is defined so that eq. 5.9 is
true.
Ji = − Dei
RgT
dPi
dz(5.9)
Which gives an effective diffusion coefficient (Dei ) as shown in eq. 5.10.
Dei =
⎛⎝∑
j
1
Deffij
(Xj − Jj
JiXi
)+
1
Deffi,k
⎞⎠
−1
(5.10)
For co- and counter-flow Dei is calculated for the average value of the gas concentrations across
the electrode in each unit cell. For crossflow configuration a single value is used for the entire
cell in order to reduce the number of equations.
When the cell is modeled without methane, the molar flux of hydrogen and water on the anode
side and oxygen on the cathode side is found from Faraday’s law, describing the rate of the
electrochemical reactions (rEC) through the current density, as shown below.
rEC =i
Fa= 2JH2 = −2JH2O = −4JO2 (5.11)
Fa is the Faraday constant.
When steam reforming is included in the model, the flux changes through the anode support as
gas species are produced or consumed. The flux change is described by Equation 5.12 derived
from a mass balance at steady state.
dJi
dz=
∑ri|z (5.12)
ri is the reaction rate for the species as shown in Table 5.1. The reaction rate of the electrochem-
ical reaction is used as boundary condition for Equation 5.12.
Table 5.1: Reaction term for the species molar balance in the anode.ri
molm3s CH4 CO CO2 H2 H2O
Anode Support −rSR rSR − rWGS rWGS 3rSR + rWGS −rSR − rWGS
Active Anode 0 0 0 1/2 − rEC 1/2rEC
The steam reforming rate is found from the intrinsic reaction rate expression found in the packed
bed experiments and the rate of the water gas shift reaction is found by assuming that it is at
equilibrium in all points.
The temperature in a cell unit is calculated from an energy balance.
70
75

In + Produced = out + accumulated
In = Q
Produced =∑n
i=1 FiHi|in − ∑ni=1 FiHi|out
out = Pel
accumulated = dEsys
dt = 0
dEsys
dt= 0 = Q − Pel +
n∑i=1
FiHi|in −n∑
i=1
FiHi|out (5.13)
Q is the heat supplied from the surroundings and Pel is the electrical power produced in the cell
unit. This means that Q is heat transferred through the interconnect material as described by
eq. 5.14.
Q =Ak(Tsur − T )
L(5.14)
Tsur is the temperature of the surroundings, which can be either other cells in a stack, or the
oven, depending on the system and the placement of the cell in question. The produced electrical
power, Pel, is calculated as described by eq. 5.15.
Pel = AiU (5.15)
By inserting eq. 5.14 and 5.15 into eq. 5.13, as well as inserting the temperature dependent
expression for the enthalpy, eq. 5.16 is obtained.
2Ak(Tsur − Tout)
L− AiU +
n∑i=1
Fi(ΔHf,i + CpT )|in −n∑
i=1
FiΔHf,i + CpT )|out = 0 (5.16)
The temperature at the gas inlet is assumed to be the temperature of the oven. This assumption
is valid for a small lab test, as the one used for comparison here, but it will not be valid for a
industrial size stack. The heat capacity of the gases is found from eq. 5.17
Cp,i = C1,i + C2,iT + C3,iT2 (5.17)
The values of the constants for each species can be found in appendix F.
5.0.2 Performance and Results
The gPROMS model was developed over several stages, with each step including an additional
effect. Only results from the two last versions of the model will be presented here, ie. with
and without internal steam reforming. For further information on the model work, see [20, 41].
71
76

While adding internal steam reforming to the model another change was also made. Previously,
it was assumed that the first unit cell in each flow direction had the same temperature as the
oven temperature. This assumption was abandoned and replaced with a total energy over the
cell. The effect of this change can be seen in Figure 5.2.
Figure 5.2: Comparison of predicted temperature profiles while respectively assuming that the
temperature of first unit cell in each flow direction has the same temperature as the oven (gray
curves) and calculating the temperature of the first unit cell from an overall energy balance (black
curves) [20].
Since most of the cooling is caused by the air flow, the biggest change is seen for the countercurrent
cell. In this configuration the air at the cathode outlet has been heated significantly from the
inlet temperature, which is in direct conflict with this assumption.
The addition of internal steam reforming significantly increased the number of equations. In the
model for coflow and counterflow where only a single channel was modelled, it was still possible
to solve the equation system. For crossflow it is, however, necessary to model an entire cell so
when reforming was included, the number of equations became to large for gPROMS to solve.
Figure 5.3 show the temperature and current profile for a crossflow cell without steam reforming.
The sharp drop in temperature at the anode inlet is an effect of the assumption that was later
removed as described in Figure 5.2.
Figure 5.4 show the modeled temperature and current profiles for coflow and counterflow cells at
T = 750oC and different S/C ratioes. It is seen that for counterflow, both ends of the channel
are cooled by steam reforming at the anode inlet and the large air flow at the cathode inlet. For
cocurrent flow it is seen that there is a rapid cooling at the anode inlet caused by steam reforming
followed by heating from the electrochemical reactions through the rest of the cell.
The cell potential calculated for the two configurations is 0.498 for cocurrent flow and 0.546
for countercurrent flow, meaning that the countercurrent configuration has better efficiency at
the same conditions. This also means that less waste heat is generated in the countercurrent
configuration, as illustrated by in Figure 5.4 where the cathode outlet temperature is lower for
72
77

1
6
11
1621
2631
36
S1
1100111011201130
1140
1150
1160
1170
1180
1190
1200
tem
per
atu
re (
K)
air flow direction (mm)
fuel flow direction
(mm)
1
12
23
34
S1
0,5
0,7
0,9
1,1
1,3
1,5
1,7
1,9
2,1
2,3
2,5
curr
ent
den
sity
(A
/cm
2)
air flow direction (mm)
fuel flow direction
Figure 5.3: Temperature and current profile in a crossflow cell without internal steam reforming.
0 5 10 15 2710
720
730
740
750
760
770
780
Position in anode gas flow direction (mm)
Tem
pera
ture
(oC
)
S/C = 1
S/C = 1.5
S/C = 2
0 5 10 15 22000
4000
6000
8000
10000
12000
14000
Position in anode gas flow direction (mm)
Cur
rent
dens
ity(A
/m2)
S/C = 1
S/C = 1.5
S/C = 2
Figure 5.4: Temperature and current profiles in coflow and counterflow cells with internal steam
reforming at T = 750oC for different S/C ratios with an average current density set to 10,000
A/m2. Grey lines represent countercurrent flow and black lines represent cocurrent flow.
73
78

countercurrent than for cocurrent flow.
In conclusion, the model gives a good representation of the effects taking place in a SOFC with
internal steam reforming but further refinement of the model is needed in order to give an accurate
representation of a real cell. Severe problems have, however, been encountered during the final
work on this model in gPROMS. The difficulties occur because of the way gPROMS handles
differential and integral problems. When making a numerical differentiation with for example 10
sections, gPROMS takes all equations and variables in the differential problem and solves them
separately in each section of the differentiation, i.e. 10 equations in 10 sections give a total of
100 variables and equations. When such a problem is expanded to 20 equations, 10 sections
through the anode, 10 sections through the cathode, and 100 sections in each of the two flow
directions (cross flow cell), the result is an equation system with 4 million variables and equations.
gPROMS will attempt to solve this as if all equations and variables are completely independent.
This also makes trouble-shooting exceedingly difficult, when an error message states that the
system contains 4,000,001 independent variables and only 4,000,000 independent equations and
then provides a list of all equations and variables.
Even though it was attempted to reduce the number of equations generated, the final system
could only be solved with starting values very close to the result. Because of this, it is not
recommended to use gPROMS for models involving differential or integral equations in multiple
dimensions. The model presented here may still be viable to use for stack modeling, but it will
need to be implemented in another program, which is better suited for computational heavy
models. In literature, the issue of accuracy versus computational requirements is addressed by
three different overall approaches, depending on the intended use of the model [43]:
Micro Models (electrode models) describe in great detail the catalytic, electrochemical and
gas phase reactions in the porous electrodes, often taking into account mass and heat
transfer effects as well as electrical conduction. This type of model will normally be 1-
dimensional and describes the performance of a cell in a single point with known bulk
concentrations, this can be used to determine key issues for material research and micro
structural optimization. [27, 68, 69]
Cell/stack Models examine the changes in composition and temperature in the gas channels of
an SOFC and they will often have a simplified description of the electrodes and electrolyte
in order to avoid excessive computations. These models are 2- or 3-dimensional and can
be used to evaluate concentration and temperature profiles in the cell/stack, and thereby
identify trouble areas such as hotspots or areas with low S/C ratio. single sell models can
to some extent incorporate a micro structure model [17, 27, 29, 33, 46, 49, 66]
System Models describe the performance of a complete stack, they are highly simplified and
are normally focused on the interaction of the stack with the surroundings. These mod-
els are zero- or 1-dimensional and intended to be incorporated in flow sheets in order to
74
79

evaluate and optimize complete systems which includes an SOFC. [15, 16, 18, 21, 44, 52, 64]
Since SOFC technology is approaching maturity [31, 39, 60], a special emphasis should be placed
on system models. A particularly strong approach for future work in obtaining a simple stack
model for flow sheeting, would be to start from an extensive stack model, as the one presented
in this section, and then gradually remove or simplify the different effects in the model, while
evaluating the influence of each effect on the model results.
75
80

Chapter 6
Summary and Conclusion
During the experimental rate measurements, it was discovered that the Ni-YSZ catalyst showed
a previously unreported dynamic behavior with respect to steam reforming activity. First of all,
the anode material has very high catalytic activity but this activity is reduced with a factor 5-10
during the initial deactivation period which takes several days at high temperature (800oC) and
up to two weeks at low temperature (600oC). It has recently been reported that Ni nano particles
are produced during the reduction of NiO [34, 38]. Such nano particles are also observed in the
TEM measurements in Section 3.2.2 and this explains the high initial activity of the catalyst.
The subsequent deactivation is most likely caused by sintering of the nano particles, this is also
supported by TEM, see Section 3.1.
After the initial deactivation, changes in temperature or hydrogen partial pressure resulted in an
approach to steady state over several days. Such slow response indicates that structural changes
are taking place and since the effect is completely reversible, it is suspected that it is caused
by the individual Ni particles changing structure, i.e. the sphericity of the particles is changed.
Such a change will affect the Ni surface area, but more importantly, it will affect the amount of
the Ni step sites, which has been shown by in-situ spectroscopy to be the most active sites for
steam reforming [28, 65]. Density functional theory calculations have further shown that these
step sites are approximately 100 times more active than terrace sites [5], so it is plausible that
this can effect the overall reaction rate. In a SOFC stack under normal operation, temperature,
and especially hydrogen concentration will vary with position in the stack. Meaning that the
micro structure of the anode material will not necessarily be the same throughout the stack.
It was also discovered that exposing the Ni-YSZ anode material to H2O/H2 for longer periods
(16 hours) results in a reactivation of the catalyst up to the initial activity. Examination of a
reactivated sample with TEM indicated that a redispersion of the Ni particles had taken place,
i.e. a lowering of the average Ni particle size. A mechanism for such a redispersion has been
reported by Ruckenstein and Hu [63] involving extension of films from the crystallites, followed
by coalescence of the films.
It should be emphasized that the characterization of the samples did not unanimously show redis-
76
81
persion of Ni particles, and other possibilities should still be considered, for example poisoning of
the active sites or other surface effects. The YSZ particles were also observed to change structure,
but this was not investigated further.
A practical conclusion from these observations is that initial operation of a new stack should be
done with a low methane content in order to avoid steep temperature gradients due to the high
initial reforming rate. After deactivation has taken place, the methane content can be increased
to the intended operating level. Furthermore, it is important to be aware of possible reactivation
of catalyst activity after operation without methane, in this case a new deactivation with low
methane content should be conducted, before normal operation is resumed.
Kinetic measurements were also made on anode samples from two stacks, which have been op-
erated with current production, one for a few days and the other for 5500 hours. The results
indicate that the catalytic activity of Ni-YSZ anode material changes significantly when first
subjected to a current, but it remains relatively constant over time afterwards.
A model of a SOFC stack element with internal steam reforming was made, and implemented in
gPROMS. It was found that gPROMS is not suited for this type of model because the number
of generated equations become to large to handle. More work is needed on this model before it
can be used for practical applications.
The catalytic steam reforming activity of Ni-YSZ anode material was measured both in a packed
bed setup and in a stack configuration, with good repeatiblity in both setups. The packed
bed measurements were designed to measure intrinsic, i.e. no mass transport limitations. Four
different samples were tested in this setup, a model anode material, a fresh sample of an industrial
anode, and two samples from stacks that have been in use. It was found that the observed
rates were best described by a kinetic expression derived by assuming CH4 dissociation as the
rate determining step, and with CO being the most abundant species on the catalyst surface.
Equation 6.1 shows the rate expression found for the model anode material, and this expression
is also valid for the fresh industrial anode, since the observed rates on these two catalysts were
nearly identical.
r =110 mole
gsPaexp(−198kJ/mole
RT
)PCH4
(1 − Qsr
Ksr
)(1 + 1.7 ∗ 10−6Pa−1exp
(26kJ/mole
RT
)PCO
)2 (6.1)
Stack measurements were made on a half cell stack and a quarter cell stack, and the obtained
rate expression is shown in 6.2.
r = 2 · 104 mole
sm2Paexp(
−166.1 kJmoleRg
T)P 0.7
CH4(6.2)
Finally a simple model was made to try and predict the activity in a stack from the intrinsic
rate expression obtained in the packed bed measurements. The model describes the activity in
the stack by the design equation for a fixed bed reactor and includes mass transport limitations
77
82

via an estimation of the efficiency factor. The model had an surprisingly good fit to the stack
measurements with an average deviation comparable to that of the rate expression that was
fitted to the measurements, Equation 6.2. The combination of simplicity and good accuracy in
predicted reaction rate makes this model ideal for use in stack models for flow sheeting.
78
83

Chapter 7
Outlook
There is still more work to be done before steam reforming over Ni-YSZ SOFC anode material is
completely understood. The most important experimental work for future investigations is the
observed reactivation of the catalyst when exposed to H2O/H2 without methane. Examinations in
this thesis indicate that the reactivation was caused by a redispersion and/or restructuring of the
Ni particles. An in-situ investigation of this effect would be very interesting, but is complicated
by the long time-frame of the Ni particle changes. An increase in steam reforming rate with a
factor of 5-10 can be critical to an SOFC stack, so it would also be highly useful to examine more
thoroughly which conditions may cause a reactivation.
Another observation that could be examined more closely is the effect of H2 content on the rate.
In short term it does not influence the rate, but in long term it seems to have an effect, possibly
by changing the sphericity of the Ni particles. Since hydrogen partial pressures change greatly
across an SOFC, it would by interesting to investigate this further, especially, at high H2 content,
which has not been examined in this thesis.
Observations also indicated that the structure of the YSZ support material can be subject to
change. Similar observations have been reported in literature, but the phenomena has not been
subject to an actual investigation.
The results presented in this thesis are an excellent basis for deeper modeling. A highly detailed
stack model was developed, but for future work it is recommended to split the effort into two
separate directions: 1) A detailed model for a small part of a cell, either a small unit cell
or at most a single gas flow channel. 2) A stack model using simplified descriptions of the
cells. These simplified descriptions should preferably be made on the basis of knowledge gained
both from experimental work and detailed modeling work. Especially a simple but reasonably
accurate stack model for use in flow sheet calculation could be instrumental in the development
of optimized design and operation of SOFC systems. The dual approach is, however, preferable
since experience from detailed modeling will greatly aid in deciding which effects does not need
to be included in a simple model.
79
84

Bibliography
[1] Course material for the course 26130, ”Hydrogen Energy and Fuel Cells”, at the Technical
University of Denmark (DTU).
[2] http://data.giss.nasa.gov/gistemp/.
[3] http://www.fuelcon.com.
[4] http://www.ip3.unipg.it/FuelCells/images/fctype SOFC.jpg.
[5] F. Abild-Pedersen, J. Lytken, O.and Engbæk, G. Nielsen, I. Chorkendorff, and J. K. Nørskov.
Methane activation on ni(111): Effects of poisons and step defects. Surf. Sci., 590(2-3):127–
137, 2005.
[6] L. M. Aparicio. Transient isotopic studies and microkinetic modeling of methane reforming
over nickel catalysts. J. Catal., 165(2):262–274, 1997.
[7] A.K. Avetisov, J.R. Rostrup-Nielsen, V.L. Kuchaev, J.-H. Bak Hansen, A.G. Zyskin, and
E.N. Shapatina. Steady-state kinetics and mechanism of methane reforming with steam and
carbon dioxide over ni catalyst. Journal of Molecular Catalysis. A, Chemical, 315(2):155–
162, 2010.
[8] R. Barfod, A. Hagen, S. Ramousse, P.V. Hendriksen, and M. Mogensen. Break down of
losses in thin electrolyte sofcs. Fuel Cells, 6(2):141–145, 2006.
[9] R. Barfod, M. Mogensen, T. Klemenso, A. Hagen, Y.-L. Liu, and P.V. Hendriksen. De-
tailed characterization of anode-supported sofcs by impedance spectroscopy. Journal of the
Electrochemical Society, 154(4):B371–8, 2007.
[10] S. Bebelis, A. Zeritis, C. Tiropani, and S. G. Neophytides. Intrinsic kinetics of the in-
ternal steam reforming of ch4 over a ni-ysz-cermet catalyst-electrode. Eng. Chem. Res.,
39(12):4920–4927, 2000.
[11] H. S. Bengaard, J. K. Nørskov, J. Sehested, B. S. Clausen, L. P. Nielsen, A. M. Molenbroek,
and J. R. Rostrup-Nielsen. Steam reforming and graphite formation on ni catalysts. J.
Catal., 209(2):365–384, 2002.
80
85

[12] R.B. Bird, W.E. Stewart, and E.N. Lightfoot. Transport Phenomena. John Wiley & Sons
Inc., 2nd edition, 2002. ed., ISBN: 0-471-41077-2.
[13] D. Wayne Blaylock, Teppei Ogura, William H. Green, and Gregory J. O. Beran. Computa-
tional investigation of thermochemistry and kinetics of steam methane reforming on ni(111)
under realistic conditions. J. Phys. Chem. C, 113(12):4898–4908, 2009.
[14] M. Boder and R. Dittmeyer. Catalytic modification of conventional sofc anodes with a view
to reducing their activity for direct internal reforming of natural gas. J.Power Sources,
155(1):13–22, 2006.
[15] R. Bove, P. Lunghi, and N. M. Sammes. Sofc mathematic model for systems simulations-part
2: definition of an analytical model. Int. J. Hydrogen Energy, 30(2):189–200, 2005.
[16] R. Bove, P. Lunghi, and N. M. Sammes. Sofc mathematic model for systems simulations. part
one: from a micro-detailed to macro-black-box model. Int. J. Hydrogen Energy, 30(2):181–
187, 2005.
[17] S. Campanari and P. Iora. Comparison of finite volume sofc models for the simulation of a
planar cell geometry. Fuel Cells, 5(1):34–51, 2005.
[18] S. H. Chan, H. K. Ho, and Y. Tian. Multi-level modeling of sofc-gas turbine hybrid system.
Int. J. Hydrogen Energy, 28(8):889–900, 2003.
[19] I. Chorkendorff and J.W. Niemantsverdriet. Concepts of Modern Catalysis and Kinetics.
Wiley-VCH, Germany, 2nd edition edition, 2007.
[20] J. Christensen and B.M. Mogensen. Internal steam reforming in solid oxide fuel cells. Mas-
ter’s thesis, Technical University of Denmark, 2008.
[21] A. K. Demin, V. Alderucci, I. Ielo, G. I. Fadeev, G. Maggio, N. Giordano, and V. Antonucci.
Thermodynamic analysis of methane fueled solid oxide fuel-cell system. Int. J. Hydrogen
Energy, 17(6):451–458, 1992.
[22] Inc. EG&G Technical Services. Fuel Cell Handbook. U.S. Dep. Energy Office of Fossil Energy
Nat. Energy Technol. Lab., seventh edition, 2004.
[23] S. Fogler. Elements of Chemical Reaction Engineering. Prentice-Hall Inernational, Inc.,
1999.
[24] A. Hauch, S.D. Ebbesen, S.H. Jensen, and M. Mogensen. Solid oxide electrolysis cells:
microstructure and degradation of the ni/yttria-stabilized zirconia electrode. Journal of the
Electrochemical Society, 155(11):B1184–93, 2008.
81
86

[25] A. Hauch and M. Mogensen. Ni/ysz electrode degradation studied by impedance spec-
troscopy. Solid State Ionics, 181(16-16):745, 2010.
[26] A. Hauch, M. Mogensen, and A. Hagen. Ni/ysz next term electrode degradation studied by
impedance spectroscopy — effect of p(h2o). Solid State Ionics, article in press.
[27] E. S. Hecht, G. K. Gupta, H. Zhu, A. M. Dean, R. J. Kee, L. Maier, and O. Deutschmann.
Methane reforming kinetics within a ni-ysz sofc anode support. Appl. Catal. A, 295(1):40–51,
2005.
[28] S. Helveg, C. Lopez-Cartes, J. Sehested, P. L Hansen, B. S. Clausen, J. R. Rostrup-Nielsen,
F. Abild-Pedersen, and J. K. Nørskov. Atomic-scale imaging of carbon nanofibre growth.
Nature, 427(6973):426–429, 2004.
[29] P.V. Hendriksen. Model studies of internal steam reforming in sofc stacks. Proceedings of the
Fifth International Symposium on Solid Oxide Fuel Cells (SOFC-V), pages 1319–28, 1997.
[30] P.V. Hendriksen, S. Koch, M. Mogensen, Y. L. Liu, and P. H. Larsen. Break down of losses
in thin electrolyte sofcs. In Proceedings of the 8th International symposium on solid oxide
fuel cells (SOFC-VIII), Paris, April 27 –May 2, 2003, 2003.
[31] H. Itoh, M. Mori, N. Mori, and T. Abe. Production cost estimation of solid oxide fuel cells.
J. Power Sources, 49(1-3):315–332, 1994.
[32] J.G. Jakobsen. Noble metal catalysts for methane steam reforming. PhD thesis, DTU, 2010.
[33] V. M. Janardhanan and O. Deutschmann. Cfd analysis of a solid oxide fuel cell with internal
reforming: Coupled interactions of transport, heterogeneous catalysis and electrochemical
processes. J. Power Sources, 162(2):1192–1202, 2006.
[34] Q. Jeangros, A. Faes, J.B. Wagner, T.W. Hansen, U. Aschauer, J. Van herle, A. Hessler-
Wyser, and R.E. Dunin-Borkowski. Acta Materialia, (14):4578–4589, 2010.
[35] A. Jensen, J. E. Johnsson, and K. Dam-Johansen. Catalytic and gas-solid reactions involving
hcn over limestone. AIChE Journal, 43(11):3070–3083, 1997.
[36] G. Jones, J. G. Jakobsen, S. S. Shim, J. Kleis, M. P. Andersson, J. Rossmeisl, F. Abild-
Pedersen, T. Bligaard, S. Helveg, B. Hinnemann, J. R. Rostrup-Nielsen, I. Chorkendorff,
J. Sehested, and J. K. Nørskov. First principles calculations and experimental insight into
methane steam reforming over transition metal catalysts. J. Catal., 259(1):147–160, 2008.
[37] C. F. Keller. Global warming: a review of this mostly settled issue. Stochastic Environmental
Research and Risk Assessment, 23(5):643–676, 2009.
82
87

[38] D. L. King, J. J. Strohm, X. Wang, H.-S. Roh, C. Wang, Y.-H. Chin, Y. Wang, Y. Lin,
R. Rozmiarek, and P. Singh. Effect of nickel microstructure on methane steam-reforming
activity of ni-ysz cermet anode catalyst. J. Catal., 258(2):356–365, 2008.
[39] E. M. Leal and J. Brouwer. A thermodynamic analysis of electricity and hydrogen co-
production using a solid oxide fuel cell. J. Fuel Cell Sci. Technol., 3(2):137–143, 2006.
[40] A.L. Lee, R.F. Zabransky, and W.J. Huber. Internal reforming development for solid oxide
fuel cells. Eng. Chem. Research, 29(5):766–773, 1990.
[41] D. Mogensen. Mathematical modelling of solid oxide fuel cells. Master’s thesis, Technical
University of Denmark, 2007.
[42] D. Mogensen, J.-D. Grunwaldt, P.V. Hendriksen, K. Dam-Johansen, and J.U. Nielsen.
Methane steam reforming over ni-ysz solid oxide fuel cell anode support material: Intrinsic
kinetics and dynamic behavior. in preparation, (1).
[43] D. Mogensen, J.-D. Grunwaldt, P.V. Hendriksen, K. Dam-Johansen, and J.U. Nielsen. In-
ternal steam reforming in solid oxide fuel cells: Status and opportunities of kinetic studies
and their impact on modelling. Journal of Power Sources, 196(1):25–38, 2011.
[44] M.Sucipta, S. Kimijima, and K. Suzuki. Performance analysis of the sofc-mgt hybrid system
with gasified biomass fuel. J. Power Sources, 174(1):124–135, 2007.
[45] M. Mulder. Basic principles of Membrane Technology. Kluwer Academic Publishers, 1996.
ISBN: 0-7923-4248-8.
[46] F. P. Nagel, T.J. Schildhauer, S. M. A. Biollaz, and S. Stucki. Charge, mass and heat transfer
interactions in solid oxide fuel cells operated with different fuel gases - a sensitivity analysis.
J. Power Sources, 184(1):129–142, 2008.
[47] Nobuyoshi Nakagawa, Hitoei Sagara, and Kunio Kato. Catalytic activity of ni-ysz-ceo2
anode for the steam reforming of methane in a direct internal-reforming solid oxide fuel cell.
J. Power Sources, 92(1-2):88–94, 2001.
[48] I. S. Nashawi, A. Malallah, and M. Al-Bisharah. Forecasting world crude oil production
using multicyclic hubbert model. Energy & Fuels, 24(3):1788–1800, 2010.
[49] K. Nikooyeh, A. A. Jeje, and J. A. Hill. 3d modeling of anode-supported planar sofc with
internal reforming of methane. J. Power Sources, 171(2):601–609, 2007.
[50] R. Odegard, E. Johnsen, and H. Karoliussen. Methane reforming on ni/zirconia sofc anodes.
Proceedings of the Fourth International Symposium on Solid Oxide Fuel Cells (SOFC-IV),
pages 810–819, 1995.
83
88

[51] R. Peters, R. Dahl, U. Kluttgen, C. Palm, and D. Stolten. Internal reforming of methane in
solid oxide fuel cell systems. J. Power Sources, 106(1-2):238–244, 2002.
[52] T. F. Petersen, N. Houbak, and B. Elmegaard. A zero-dimensional model of a 2nd generation
planar sofc using calibrated parameters. Int. J. Thermodynamics, 9(4):161–169, 2006.
[53] M. Pihlatie. Stability of Ni-YSZ composites for solid oxide fuel cells during reduction and
re-oxidation. PhD thesis, Aalto University School of Science and Technology, 2010.
[54] M. Pihlatie, A. Kaiser, and M. Mogensen. Mechanical properties of nio/ni–ysz composites
depending on temperature, porosity and redox cycling. Journal of the European Ceramic
Society, 29(9):1657–1664, 2009.
[55] M. Pihlatie, A. Kaiser, and M. Mogensen. Redox stability of sofc: Thermal analysis of ni–ysz
composites. Solid State Ionics, (17-19):1100–1112, 2009.
[56] M. Pihlatie, T. Ramos, and A. Kaiser. Testing and improving the redox stability of ni-based
solid oxide fuel cells. Journal of Power Sources, 193(1):322–330, 2009.
[57] M.H. Pihlatie, H.L. Frandsen, A. Kaiser, and M. Mogensen. Continuum mechanics simula-
tions of nio/ni–ysz composites during reduction and re-oxidation. Journal of Power Sources,
(9):2677–2690, 2010.
[58] J. Palsson. Thermodynamic modelling and Performance of Combined Solid Oxide Fuel Cell
and Gas Turbine Systems. PhD thesis, Lund University, 2002.
[59] S. Primdahl. Nickel/Yttria-Stabilized Zirconia Cermet Anodes For Solid Oxide Fuel Cells.
PhD thesis, University of Twente (Nederlands) and Risø National Laboratory (Denmark).
ISBN: 87-550-2605-2.
[60] A.D. Rao and G.S. Samuelsen. A thermodynamic analysis of tubular solid oxide fuel cell
based hybrid systems. J. Eng. Gas Turbines and Power, 125(1):59–66, 2003.
[61] R.C. Reid, J.M. Prausnitz, and B.E. Poling. Properties of gases and liquids. McGraw-Hill,
1987. ISBN: 0-07-051799-1.
[62] J. R. Rostrup-Nielsen. Steam Reforming Catalysts. Danish Technical Press, Copenhagen,
1975.
[63] E. Ruckenstein and X. D. Hu. Mechanism of redispersion of supported metal catalysts in
oxidative atmospheres. Langmuir, 1(6):756–760, 1985.
[64] J. Saarinen, M. Halinen, J. Ylijoki, M. Noponen, P. Simell, and J. Kiviaho. Dynamic model
of 5 kw sofc chp test station. Transactions of the ASME. Journal of Fuel Cell Science and
Technology, 4(4):397–405, 2007.
84
89

[65] J. Sehested. Four challenges for nickel steam-reforming catalysts. Catal. Today, 111(1-
2):103–110, 2006.
[66] A. Selimovic. Solid Oxide Fuel Cell Modelling for SOFC/Gas Turbine Combined Cycle
Simulations. PhD thesis, Lund Institute of Technology, 2000.
[67] S. Shafiee and E. Topal. When will fossil fuel reserves be diminished? Energy Policy,
37(1):181–189, 2009.
[68] S. Sunde. Simulations of composite electrodes in fuel cells. J. Electroceramics, 5(2):153–182,
2000.
[69] S. Sunde and P.V. Hendriksen. A mathematical model for internal reforming at composite
anodes for solid oxide fuel cells. Proceedings of the Fifth International Symposium on Solid
Oxide Fuel Cells (SOFC-V), pages 1329–38, 1997.
[70] H. Timmermann, D. Fouquet, A. Weber, E. Ivers-Tiffee, U. Hennings, and R. Reimert.
Internal reforming of methane at ni/ysz and ni/cgo sofc cermet anodes. Fuel Cells, 6(3-
4):307–13, 2006.
[71] J. Wei and E. Iglesia. Isotopic and kinetic assessment of the mechanism of reactions of ch4
with co2 or h2o to form synthesis gas and carbon on nickel catalysts. J. Catal., 224(2):370–
383, 2004.
85
90

Appendix A
Equipment
A.1 Evaporator tests
Three different water evaporators were used in this thesis. The evaporators on the stack setup,
137-1A, and on of the packed bed setups, 137-5B, were both principally a heated bubble flask. The
evaporator on setup 137-1A was delivered as a part of the setup from FuelCon, the evaporator on
setup 137-5B was built in-house. The performance of these two evaporators is shown in Figures
A.1 and A.2
y = -0,7776x2 + 2,4207xR2 = 0,9601
0
0,5
1
1,5
2
2,5
0,0 0,5 1,0 1,5 2,0
H2O
flo
w (
Nl/m
in)
Figure A.1: Steam flow as a function of the nitrogen flow through the evaporator of the stack
setup 137-1A.
The evaporator on the second packed bed setup, 137-4A, was also built in-house. It consists of
a Nafion tube (Perma Pure, MD Gas Dryer) with a outer diameter of 0.108 inches in a heated
water bath. The Nafion tube is permeable by water gas, and the idea is that there should be no
liquid water present inside the tube but the gas should be fully saturated by water. A schematic
86
91

drawing of this evaporator is shown in Figure A.3.
This evaporator did not work well. The tube had to be replaced several times because of leaks,
and, as a result of this, the performance was highly unreliable, often the water flow had large
and rapid fluctuations. Even in the periods, where it worked relatively good, it was difficult to
predict the amount of water delivered at a certain flow. Instead a HygroFlex humidity sensor
from ROTRONIC was used to measure the water content in the inlet gas. Unfortunately, it was
later discovered that this humidity sensor was not reliable.
87
92

y = 0,1154x2 + 0,6151xR2 = 0,9932
0,0
0,5
1,0
1,5
2,0
0 0,2 0,4 0,6 0,8 1 1,2 1,4 1,6 1,8
H2O
flo
w (
Nl/m
in)
Figure A.2: Steam flow as a function of the nitrogen flow through the evaporator of the packed
bed setup 137-5B.
Figure A.3: A schematic drawing of the evaporator for the packed bed setup 137-4A.
88
93

A.2 Piping and Instrumentation Diagrams
Figure A.4: P&ID diagram for the packed bed setups [20].
89
94

Figure A.5: P&ID diagram for the stack setup.
90
95

Appendix B
Reaction Rate Order Measurements
B.1 Reaction Rate Orders in Methane for the Model Anode
0 5 10 15 20 25 30 35 400
0.5
1
1.5
2
2.5
3
3.5
4
4.5
5 x 10⁻⁵
reac
tion
rate
[mol
/s g
cat]
Partial Pressure [kPa]
PH2O
= 30 ± 0.11 kPaP
H2 = 7.46 ± 0.053 kPa
Rate order = 0.779
(a) Measured CH4 dependency at 600oC.
0 5 10 15 20 25 30 35 400
0.5
1
1.5
2
2.5
3
3.5
4
4.5
5 x 10⁻⁵
reac
tion
rate
[mol
/s g
cat]
Partial Pressure [kPa]
PH2O
= 29.9 ± 0.13 kPaP
H2 = 7.58 ± 0.054 kPa
Rate order = 0.839
(b) Measured CH4 dependency at 625oC.
0 5 10 15 20 25 30 35 400
0.5
1
1.5
2
2.5
3
3.5
4
4.5
5 x 10⁻⁵
reac
tion
rate
[mol
/s g
cat]
Partial Pressure [kPa]
PH2O
= 29.9 ± 0.19 kPaP
H2 = 7.82 ± 0.18 kPa
Rate order = 0.906
(c) Measured CH4 dependency at 650oC.
0 5 10 15 20 25 30 35 400
0.5
1
1.5
2
2.5
3
3.5
4
4.5
5 x 10⁻⁵
reac
tion
rate
[mol
/s g
cat]
Partial Pressure [kPa]
PH2O
= 29.8 ± 0.27 kPaP
H2 = 8.19 ± 0.27 kPa
Rate order = 0.906
(d) Measured CH4 dependency at 675oC.
Figure B.1: Measured CH4 dependencies over the model anode material.
91
96

0 5 10 15 20 25 30 35 400
0.5
1
1.5
2
2.5
3
3.5
4
4.5
5 x 10⁻⁵re
actio
n ra
te [m
ol/s
gca
t]
Partial Pressure [kPa]
PH2O
= 29.7 ± 0.58 kPaP
H2 = 8.11 ± 0.87 kPa
Rate order = 0.871
(a) Measured CH4 dependency at 700oC.
0 5 10 15 20 25 30 35 400
0.5
1
1.5
2
2.5
3
3.5
4
4.5
5 x 10⁻⁴
reac
tion
rate
[mol
/s g
cat]
Partial Pressure [kPa]
PH2O
= 29.6 ± 0.28 kPaP
H2 = 8.25 ± 0.32 kPa
Rate order = 0.937
(b) Measured CH4 dependency at 725oC.
0 5 10 15 20 25 30 35 400
0.5
1
1.5
2
2.5
3
3.5
4
4.5
5 x 10⁻⁴
reac
tion
rate
[mol
/s g
cat]
Partial Pressure [kPa]
PH2O
= 29.5 ± 0.24 kPaP
H2 = 9.12 ± 0.21 kPa
Rate order = 0.378
(c) Measured CH4 dependency at 750oC.
0 5 10 15 20 25 30 35 400
0.5
1
1.5
2
2.5
3
3.5
4
4.5
5 x 10⁻⁴
reac
tion
rate
[mol
/s g
cat]
Partial Pressure [kPa]
PH2O
= 29 ± 0.38 kPaP
H2 = 9.97 ± 0.77 kPa
Rate order = 0.797
(d) Measured CH4 dependency at 775oC.
0 5 10 15 20 25 30 35 400
0.5
1
1.5
2
2.5
3
3.5
4
4.5
5 x 10⁻⁴
reac
tion
rate
[mol
/s g
cat]
Partial Pressure [kPa]
PH2O
= 28.5 ± 0.62 kPaP
H2 = 11.3 ± 1.2 kPa
Rate order = 0.797
(e) Measured CH4 dependency at 800oC.
Figure B.2: Measured CH4 dependencies over the model anode material.
92
97

B.2 Reaction Rate Orders in Methane for the Industrial Anode
0 5 10 15 20 25 30 35 400
0.5
1
1.5
2
2.5
3
3.5
4
4.5
5 x 10⁻⁵re
actio
n ra
te [m
ol/s
gca
t]
Partial Pressure [kPa]
PH2O
= 29.2 ± 0.22 kPaP
H2 = 8.06 ± 0.2 kPa
Rate order = 0.751
(a) Measured CH4 dependency at 625oC.
0 5 10 15 20 25 30 35 400
0.5
1
1.5
2
2.5
3
3.5
4
4.5
5 x 10⁻⁵
reac
tion
rate
[mol
/s g
cat]
Partial Pressure [kPa]
PH2O
= 28.6 ± 1 kPaP
H2 = 8.16 ± 0.25 kPa
Rate order = 0.721
(b) Measured CH4 dependency at 650oC.
0 5 10 15 20 25 30 35 400
0.5
1
1.5
2
2.5
3
3.5
4
4.5
5 x 10⁻⁵
reac
tion
rate
[mol
/s g
cat]
Partial Pressure [kPa]
PH2O
= 28.7 ± 0.22 kPaP
H2 = 8.98 ± 0.45 kPa
Rate order = 0.684
(c) Measured CH4 dependency at 675oC.
0 5 10 15 20 25 30 35 400
0.5
1
1.5
2
2.5
3
3.5
4
4.5
5 x 10⁻⁴re
actio
n ra
te [m
ol/s
gca
t]
Partial Pressure [kPa]
PH2O
= 28.9 ± 0.68 kPaP
H2 = 8.86 ± 1.2 kPa
Rate order = 0.666
(d) Measured CH4 dependency at 700oC.
Figure B.3: Measured CH4 dependencies over the industrial anode material.
93
98
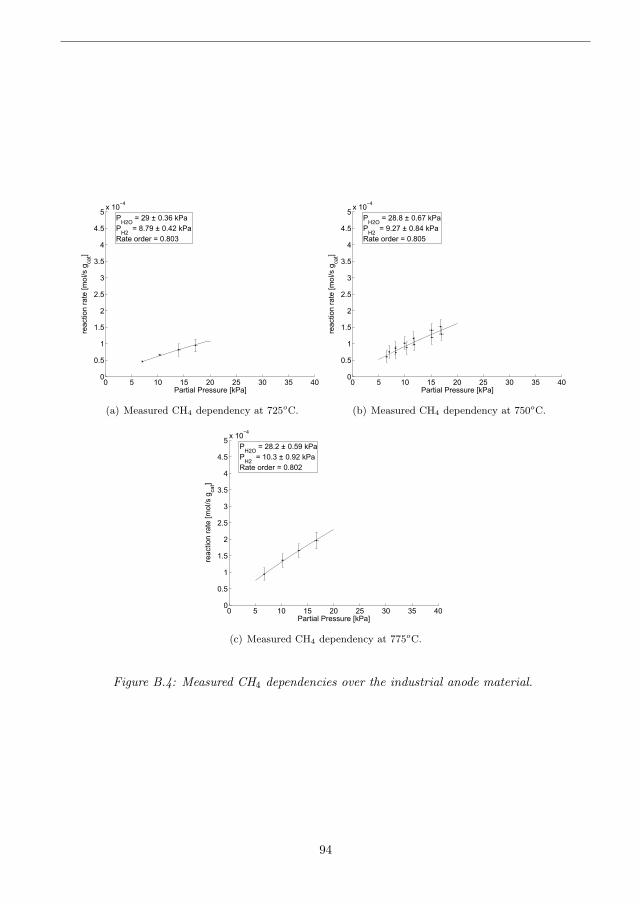
0 5 10 15 20 25 30 35 400
0.5
1
1.5
2
2.5
3
3.5
4
4.5
5 x 10⁻⁴
reac
tion
rate
[mol
/s g
cat]
Partial Pressure [kPa]
PH2O
= 29 ± 0.36 kPaP
H2 = 8.79 ± 0.42 kPa
Rate order = 0.803
(a) Measured CH4 dependency at 725oC.
0 5 10 15 20 25 30 35 400
0.5
1
1.5
2
2.5
3
3.5
4
4.5
5 x 10⁻⁴
reac
tion
rate
[mol
/s g
cat]
Partial Pressure [kPa]
PH2O
= 28.8 ± 0.67 kPaP
H2 = 9.27 ± 0.84 kPa
Rate order = 0.805
(b) Measured CH4 dependency at 750oC.
0 5 10 15 20 25 30 35 400
0.5
1
1.5
2
2.5
3
3.5
4
4.5
5 x 10⁻⁴
reac
tion
rate
[mol
/s g
cat]
Partial Pressure [kPa]
PH2O
= 28.2 ± 0.59 kPaP
H2 = 10.3 ± 0.92 kPa
Rate order = 0.802
(c) Measured CH4 dependency at 775oC.
Figure B.4: Measured CH4 dependencies over the industrial anode material.
94
99

B.3 Reaction Rate Orders in Methane for the Stack Samples
0 5 10 15 20 25 30 35 400
0.1
0.2
0.3
0.4
0.5
0.6
0.7
0.8
0.9
1 x 10⁻⁴
reac
tion
rate
[mol
/s g
cat]
Partial Pressure [kPa]
PH2O
= 29.9 ± 0.66 kPaP
H2 = 7.77 ± 0.24 kPa
Rate order = 0.89
(a) Measured CH4 dependency at 650oC.
0 5 10 15 20 25 30 35 400
0.1
0.2
0.3
0.4
0.5
0.6
0.7
0.8
0.9
1 x 10⁻⁴
reac
tion
rate
[mol
/s g
cat]
Partial Pressure [kPa]
PH2O
= 29.3 ± 0.56 kPaP
H2 = 8.6 ± 0.52 kPa
Rate order = 0.858
(b) Measured CH4 dependency at 700oC.
0 5 10 15 20 25 30 35 400
0.5
1
1.5
2
2.5
3
3.5
4
4.5
5 x 10⁻⁴
reac
tion
rate
[mol
/s g
cat]
Partial Pressure [kPa]
PH2O
= 28.3 ± 0.66 kPaP
H2 = 10.5 ± 0.9 kPa
Rate order = 0.763
(c) Measured CH4 dependency at 750oC.
0 5 10 15 20 25 30 35 400
0.5
1
1.5
2
2.5
3
3.5
4
4.5
5 x 10⁻⁴
reac
tion
rate
[mol
/s g
cat]
Partial Pressure [kPa]
PH2O
= 26.5 ± 2.2 kPaP
H2 = 14 ± 2.2 kPa
Rate order = 0.739
(d) Measured CH4 dependency at 800oC.
Figure B.5: Measured CH4 dependencies over the old stack anode sample.
95
100

0 5 10 15 20 25 30 35 400
0.1
0.2
0.3
0.4
0.5
0.6
0.7
0.8
0.9
1 x 10⁻⁵re
actio
n ra
te [m
ol/s
gca
t]
Partial Pressure [kPa]
PH2O
= 29.2 ± 0.2 kPaP
H2 = 7.26 ± 0.066 kPa
Rate order = 0.702
(a) Measured CH4 dependency at 600oC.
0 5 10 15 20 25 30 35 400
0.5
1
1.5
2
2.5
3
3.5
4
4.5
5 x 10⁻⁵
reac
tion
rate
[mol
/s g
cat]
Partial Pressure [kPa]
PH2O
= 28.5 ± 0.2 kPaP
H2 = 7.62 ± 0.17 kPa
Rate order = 0.77
(b) Measured CH4 dependency at 650oC.
0 5 10 15 20 25 30 35 400
0.1
0.2
0.3
0.4
0.5
0.6
0.7
0.8
0.9
1 x 10⁻⁴
reac
tion
rate
[mol
/s g
cat]
Partial Pressure [kPa]
PH2O
= 28.4 ± 0.49 kPaP
H2 = 9.3 ± 0.84 kPa
Rate order = 0.789
(c) Measured CH4 dependency at 700oC.
0 5 10 15 20 25 30 35 400
0.5
1
1.5
2
2.5
3
3.5
4
4.5
5 x 10⁻⁴
reac
tion
rate
[mol
/s g
cat]
Partial Pressure [kPa]
PH2O
= 26.7 ± 0.87 kPaP
H2 = 11.6 ± 1.3 kPa
Rate order = 0.765
(d) Measured CH4 dependency at 750oC.
0 5 10 15 20 25 30 35 400
0.1
0.2
0.3
0.4
0.5
0.6
0.7
0.8
0.9
1 x 10⁻³
reac
tion
rate
[mol
/s g
cat]
Partial Pressure [kPa]
PH2O
= 24.4 ± 1.5 kPaP
H2 = 16.2 ± 2.5 kPa
Rate order = 0.712
(e) Measured CH4 dependency at 800oC.
Figure B.6: Measured CH4 dependencies over the new stack anode sample.
96
101

B.4 Half Cell Stack
B.4.1 Gas Composition Changes at T = 600oC
0 5 10 15 20 25 30 35 400
0.002
0.004
0.006
0.008
0.01
0.012
0.014
0.016
0.018
0.02
reac
tion
rate
[mol
/s m
2]
Partial Pressure [kPa]
PH2
= 15 ± 0.63 kPaP
CH4 = 5.94 ± 0.33 kPa
Rate order = −0.497
(a) Measured H2= dependency at 600oC.
0 5 10 15 20 25 30 35 400
0.002
0.004
0.006
0.008
0.01
0.012
0.014
0.016
0.018
0.02
reac
tion
rate
[mol
/s m
2]Partial Pressure [kPa]
PH2O
= 19.9 ± 0.43 kPaP
CH4 = 6.07 ± 0.13 kPa
Rate order = −0.0419
(b) Measured H2 dependency at 600oC.
0 5 10 15 20 25 30 35 400
0.002
0.004
0.006
0.008
0.01
0.012
0.014
0.016
0.018
0.02
reac
tion
rate
[mol
/s m
2]
Partial Pressure [kPa]
PH2O
= 49.9 ± 2.3 kPaP
H2 = 9.1 ± 2.5 kPa
PCH4
= 2.64 ± 0.72 kPaRate order = 1.36
(c) Measured CO2 dependency at 600oC.
Figure B.7: Measured dependencies over the half cell stack at 600oC.
97
102

B.4.2 Gas Composition Changes at T = 700oC
0 5 10 15 20 25 30 35 400
0.002
0.004
0.006
0.008
0.01
0.012
0.014
0.016
0.018
0.02
reac
tion
rate
[mol
/s m
2 ]
Partial Pressure [kPa]
PH2
= 15.7 ± 1.2 kPaP
CH4 = 5.57 ± 0.09 kPa
Rate order = 0.254
(a) Measured H2= dependency at 700oC.
0 10 20 30 40 500
0.002
0.004
0.006
0.008
0.01
0.012
0.014
0.016
0.018
0.02
reac
tion
rate
[mol
/s m
2 ]
Partial Pressure [kPa]
PH2O
= 19.5 ± 0.2 kPaP
CH4 = 5.76 ± 0.052 kPa
Rate order = −0.0529
(b) Measured H2 dependency at 700oC.
0 5 10 15 20 25 30 35 400
0.002
0.004
0.006
0.008
0.01
0.012
0.014
0.016
0.018
0.02
reac
tion
rate
[mol
/s m
2 ]
Partial Pressure [kPa]
PH2O
= 50.2 ± 0.92 kPaP
H2 = 8.81 ± 1 kPa
PCH4
= 3.15 ± 0.14 kPaRate order = 0.488
(c) Measured CO dependency at 700oC.
0 5 10 15 20 25 30 35 400
0.002
0.004
0.006
0.008
0.01
0.012
0.014
0.016
0.018
0.02
reac
tion
rate
[mol
/s m
2 ]
Partial Pressure [kPa]
PH2O
= 51.3 ± 0.8 kPaP
H2 = 7.83 ± 1 kPa
PCH4
= 2.91 ± 0.29 kPaRate order = 0.902
(d) Measured CO2 dependency at 700oC.
Figure B.8: Measured dependencies over the half cell stack at 700oC.
98
103
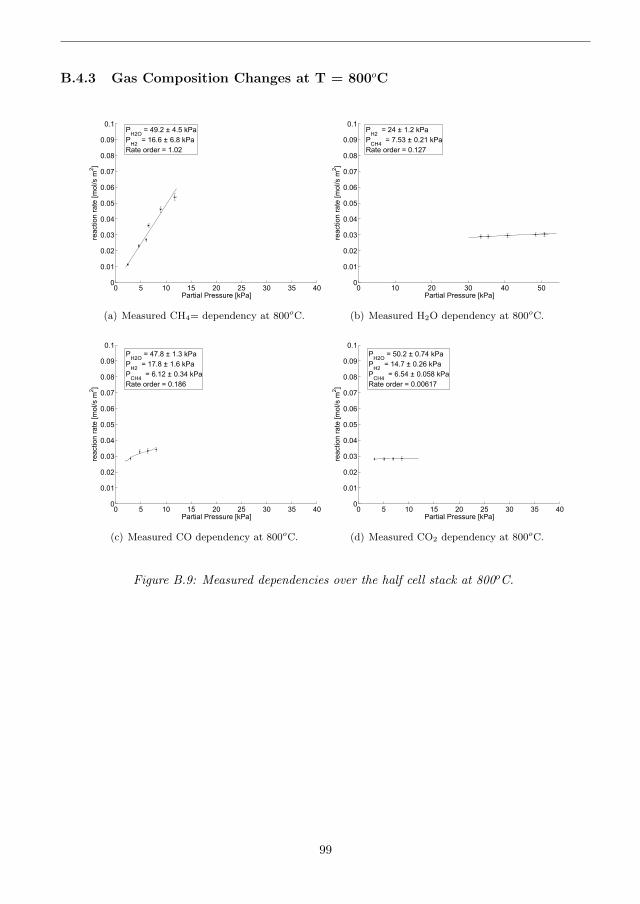
B.4.3 Gas Composition Changes at T = 800oC
0 5 10 15 20 25 30 35 400
0.01
0.02
0.03
0.04
0.05
0.06
0.07
0.08
0.09
0.1
reac
tion
rate
[mol
/s m
2 ]
Partial Pressure [kPa]
PH2O
= 49.2 ± 4.5 kPaP
H2 = 16.6 ± 6.8 kPa
Rate order = 1.02
(a) Measured CH4= dependency at 800oC.
0 10 20 30 40 500
0.01
0.02
0.03
0.04
0.05
0.06
0.07
0.08
0.09
0.1
reac
tion
rate
[mol
/s m
2 ]
Partial Pressure [kPa]
PH2
= 24 ± 1.2 kPaP
CH4 = 7.53 ± 0.21 kPa
Rate order = 0.127
(b) Measured H2O dependency at 800oC.
0 5 10 15 20 25 30 35 400
0.01
0.02
0.03
0.04
0.05
0.06
0.07
0.08
0.09
0.1
reac
tion
rate
[mol
/s m
2 ]
Partial Pressure [kPa]
PH2O
= 47.8 ± 1.3 kPaP
H2 = 17.8 ± 1.6 kPa
PCH4
= 6.12 ± 0.34 kPaRate order = 0.186
(c) Measured CO dependency at 800oC.
0 5 10 15 20 25 30 35 400
0.01
0.02
0.03
0.04
0.05
0.06
0.07
0.08
0.09
0.1re
actio
n ra
te [m
ol/s
m2 ]
Partial Pressure [kPa]
PH2O
= 50.2 ± 0.74 kPaP
H2 = 14.7 ± 0.26 kPa
PCH4
= 6.54 ± 0.058 kPaRate order = 0.00617
(d) Measured CO2 dependency at 800oC.
Figure B.9: Measured dependencies over the half cell stack at 800oC.
99
104
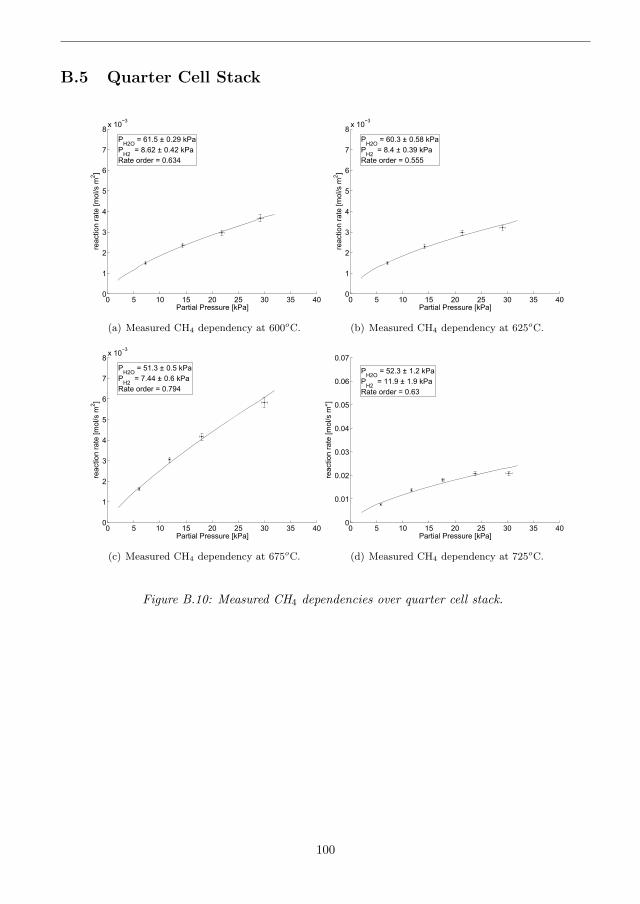
B.5 Quarter Cell Stack
0 5 10 15 20 25 30 35 400
1
2
3
4
5
6
7
8 x 10⁻³
reac
tion
rate
[mol
/s m
2 ]
Partial Pressure [kPa]
PH2O
= 61.5 ± 0.29 kPaP
H2 = 8.62 ± 0.42 kPa
Rate order = 0.634
(a) Measured CH4 dependency at 600oC.
0 5 10 15 20 25 30 35 400
1
2
3
4
5
6
7
8 x 10⁻³
reac
tion
rate
[mol
/s m
2 ]
Partial Pressure [kPa]
PH2O
= 60.3 ± 0.58 kPaP
H2 = 8.4 ± 0.39 kPa
Rate order = 0.555
(b) Measured CH4 dependency at 625oC.
0 5 10 15 20 25 30 35 400
1
2
3
4
5
6
7
8 x 10⁻³
reac
tion
rate
[mol
/s m
2 ]
Partial Pressure [kPa]
PH2O
= 51.3 ± 0.5 kPaP
H2 = 7.44 ± 0.6 kPa
Rate order = 0.794
(c) Measured CH4 dependency at 675oC.
0 5 10 15 20 25 30 35 400
0.01
0.02
0.03
0.04
0.05
0.06
0.07
reac
tion
rate
[mol
/s m
2 ]
Partial Pressure [kPa]
PH2O
= 52.3 ± 1.2 kPaP
H2 = 11.9 ± 1.9 kPa
Rate order = 0.63
(d) Measured CH4 dependency at 725oC.
Figure B.10: Measured CH4 dependencies over quarter cell stack.
100
105

0 5 10 15 20 25 30 35 400
0.01
0.02
0.03
0.04
0.05
0.06
0.07
0.08
0.09
0.1
reac
tion
rate
[mol
/s m
2 ]
Partial Pressure [kPa]
PH2O
= 48.6 ± 1.3 kPaP
H2 = 16 ± 3.9 kPa
Rate order = 0.709
(a) Measured CH4 dependency at 775oC.
0 5 10 15 20 25 30 35 400
0.01
0.02
0.03
0.04
0.05
0.06
0.07
0.08
0.09
0.1re
actio
n ra
te [m
ol/s
m2 ]
Partial Pressure [kPa]
PH2O
= 44.9 ± 3 kPaP
H2 = 18.6 ± 4.8 kPa
Rate order = 0.733
(b) Measured CH4 dependency at 800oC.
Figure B.11: Measured CH4 dependencies over quarter cell stack.
101
106
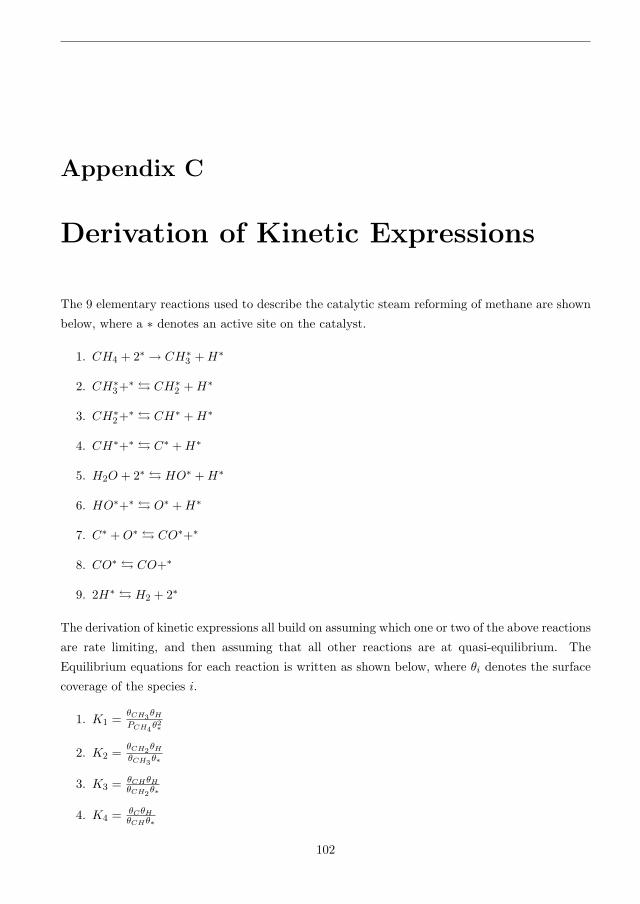
Appendix C
Derivation of Kinetic Expressions
The 9 elementary reactions used to describe the catalytic steam reforming of methane are shown
below, where a ∗ denotes an active site on the catalyst.
1. CH4 + 2∗ → CH∗3 + H∗
2. CH∗3+∗ � CH∗
2 + H∗
3. CH∗2+∗ � CH∗ + H∗
4. CH∗+∗ � C∗ + H∗
5. H2O + 2∗ � HO∗ + H∗
6. HO∗+∗ � O∗ + H∗
7. C∗ + O∗ � CO∗+∗
8. CO∗ � CO+∗
9. 2H∗ � H2 + 2∗
The derivation of kinetic expressions all build on assuming which one or two of the above reactions
are rate limiting, and then assuming that all other reactions are at quasi-equilibrium. The
Equilibrium equations for each reaction is written as shown below, where θi denotes the surface
coverage of the species i.
1. K1 = θCH3θH
PCH4θ2∗
2. K2 = θCH2θH
θCH3θ∗
3. K3 = θCHθHθCH2
θ∗
4. K4 = θCθHθCHθ∗
102
107

5. K5 = θOHθHPH2Oθ2∗
6. K6 = θOθHθOHθ∗
7. K7 = θCOθ∗θCθO
8. K8 = PCOθ∗θCO
9. K9 = PH2θ2∗
θ2H2
Assumption: Reaction 1 is RDS
The rate expression for Reaction 1 is:
r = k1+PCH4θ2∗ − k1−θCH3θH (C.1)
θH is determined from equation 9
θH =1
sqrtK9P
1/2H2
θ∗ (C.2)
θCH3 is determined from equation 2, and is then rewritten by inserting expressions for the cover-
ages of different species obtained from reactions 3-8, as shown below. Each new line is commented
with what equations has been used to obtain it from the previous line .
θH =1
K2
θH
θ∗θCH2 eq.2 (C.3)
θH =1
K2K3K4
θ3H
θ3∗θC eq.3 + 4 (C.4)
θH =1
K2K3K4K7
θ3H
θ3∗θ∗
θCO
θOeq.7 (C.5)
θH =1
K2K3K4K7K8
θ3H
θ3∗θ2∗
1θO
PCO eq.8 (C.6)
θH =1
K2K3K4K6K7K8
θ4H
θ4∗θ2∗
1θOH
PCO eq.6 (C.7)
θH =1
K2K3K4K5K6K7K8
θ5H
θ5∗θ∗
PCO
PH2Oeq.5 (C.8)
θH =1
K2K3K4K5K6K7K8K5/29
PCOP5/2H2
PH2Oθ∗ eq.9 (C.9)
(C.10)
Inserting the expressions for θCH3 and θH into Equation C.1 gives the following:
r = k1+PCH4θ2∗ −
k1−K2K3K4K5K6K7K8K3
9
PCOP 3H2
PH2Oθ2∗ (C.11)
103
108
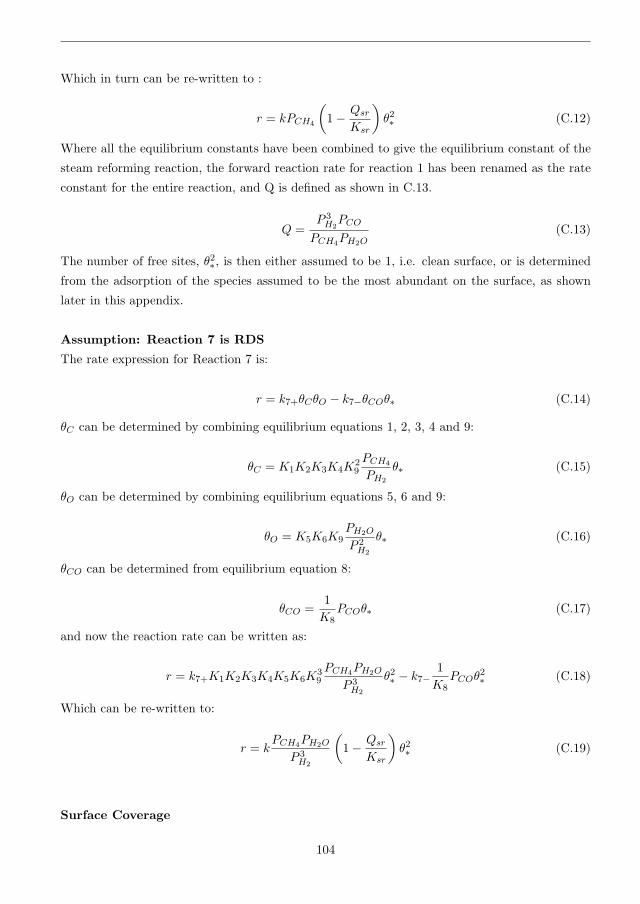
Which in turn can be re-written to :
r = kPCH4
(1 − Qsr
Ksr
)θ2∗ (C.12)
Where all the equilibrium constants have been combined to give the equilibrium constant of the
steam reforming reaction, the forward reaction rate for reaction 1 has been renamed as the rate
constant for the entire reaction, and Q is defined as shown in C.13.
Q =P 3
H2PCO
PCH4PH2O(C.13)
The number of free sites, θ2∗, is then either assumed to be 1, i.e. clean surface, or is determined
from the adsorption of the species assumed to be the most abundant on the surface, as shown
later in this appendix.
Assumption: Reaction 7 is RDS
The rate expression for Reaction 7 is:
r = k7+θCθO − k7−θCOθ∗ (C.14)
θC can be determined by combining equilibrium equations 1, 2, 3, 4 and 9:
θC = K1K2K3K4K29
PCH4
PH2
θ∗ (C.15)
θO can be determined by combining equilibrium equations 5, 6 and 9:
θO = K5K6K9PH2O
P 2H2
θ∗ (C.16)
θCO can be determined from equilibrium equation 8:
θCO =1
K8PCOθ∗ (C.17)
and now the reaction rate can be written as:
r = k7+K1K2K3K4K5K6K39
PCH4PH2O
P 3H2
θ2∗ − k7−
1K8
PCOθ2∗ (C.18)
Which can be re-written to:
r = kPCH4PH2O
P 3H2
(1 − Qsr
Ksr
)θ2∗ (C.19)
Surface Coverage
104
109

If it is assumed that the catalyst surface is free from adsorbents, then θ∗ in the rate expressions
is set to 1. This assumption is more likely to be correct as the temperature increases.
If this assumption cannot be made, then an assumption must be made instead on which adsorbent
is the most abundant species on the catalyst surface. As an example, H and CO are assumed to
be the most abundant species giving the following expression for the number of free surface sites
(θ∗)
θ∗ = 1 − θCO − θH (C.20)
Inserting Equilibrium equations 8 and 9 gives:
θ∗ = 1 − 1K8
PCOθ∗ − 1√K9
P1/2H2
θ∗ (C.21)
θ∗ =1
1 + 1K8
PCO + 1√K9
P1/2H2
(C.22)
Equation C.22 can then be inserted in the kinetic expression. Note that this is a typical Langmuir-
Hinshelwood isotherm.
105
110
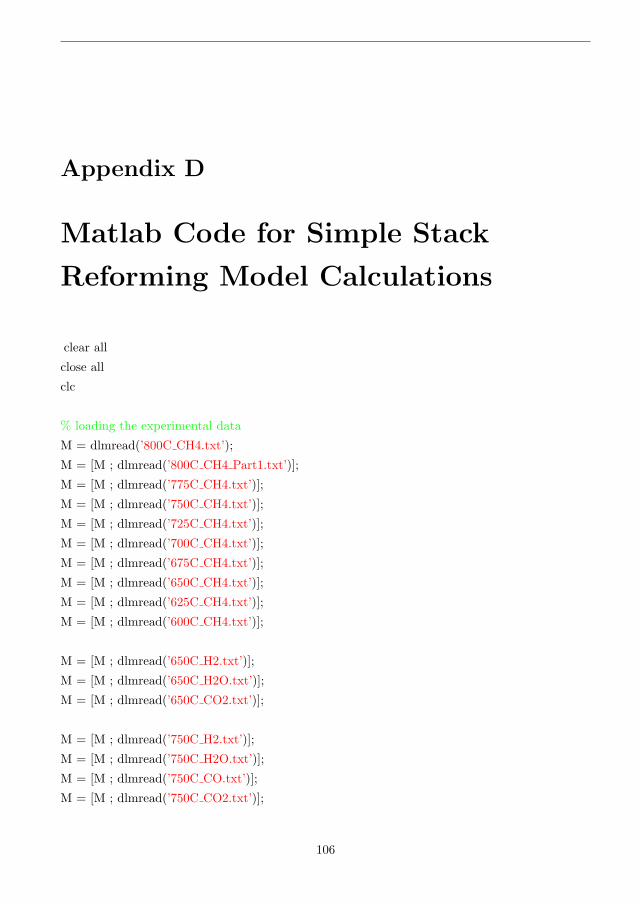
Appendix D
Matlab Code for Simple Stack
Reforming Model Calculations
clear all
close all
clc
% loading the experimental data
M = dlmread(’800C CH4.txt’);
M = [M ; dlmread(’800C CH4 Part1.txt’)];
M = [M ; dlmread(’775C CH4.txt’)];
M = [M ; dlmread(’750C CH4.txt’)];
M = [M ; dlmread(’725C CH4.txt’)];
M = [M ; dlmread(’700C CH4.txt’)];
M = [M ; dlmread(’675C CH4.txt’)];
M = [M ; dlmread(’650C CH4.txt’)];
M = [M ; dlmread(’625C CH4.txt’)];
M = [M ; dlmread(’600C CH4.txt’)];
M = [M ; dlmread(’650C H2.txt’)];
M = [M ; dlmread(’650C H2O.txt’)];
M = [M ; dlmread(’650C CO2.txt’)];
M = [M ; dlmread(’750C H2.txt’)];
M = [M ; dlmread(’750C H2O.txt’)];
M = [M ; dlmread(’750C CO.txt’)];
M = [M ; dlmread(’750C CO2.txt’)];
106
111

% dividing the loaded data into proper variables
for i = 1:6
P in(:,i) = M(:,i+8);
P out(:,i) = M(:,i+14);
end
rate measured = M(:,7);
k = M(:,8);
T all = M(:,3:6);
% taking the average of the 4 T measurements for each measurements point
for i = 1:length(k)
T(i,1) = mean(T all(i,:));
end
Ftot = 2; % Nl/min
Rg = 8.314; % J/mol K
l = length(M(:,1));
X1 = M(:,1);
X2 = M(:,2);
N in = P in*1000*Ftot/(60*1000)/(Rg*298);
% input of size of the stack
anode area = 9.6*2.4/10000; % m2
anode volume = anode area *300*10^-6; %m3 half cell
anode density = 0.52*7.7*10^6; %g/m3
anode weight = anode volume*anode density; %g
% Calculating the conversion predicted by the model using ode45 and the
% differential system in the function diffsystem rate
options = odeset(’abstol’, 1e-12, ’MaxStep’, 1/10);
for i = 1:l
Ptot(i) = sum(P in(i,:))*1000;
[W,X] = ode45(@(W,X)diffsys rate(W, X,N in(i,:),T(i),Ptot(i),X2(i)), [0 anode weight], 0,op-
107
112

tions);
X model(i) = X(length(X));
dev(i) = sqrt(((X1(i) - X model(i))/X1(i)*100)^2);
end
% calculating the average error
avg err = mean(dev)
% plotting measured conversion and model conversion against temperature
figure(1)
hold on
plot(T,X model,’or’)
plot(T,X1,’x’)
xlabel(’T [^oC]’,’fontsize’,16)
ylabel(’Conversion’,’fontsize’,16)
axis([540 775 0 0.8 ]);
legend(’Model’,’Measured’)
set(gca,’fontsize’,16);
hold off
% plotting model conversion and measured conversion against each other
figure(2)
hold on
plot(X1,X model,’xk’)
plot([0 1],[0 1],’k’)
axis([0 0.8 0 0.8]);
xlabel(’Measured conversion’,’fontsize’,16)
ylabel(’Model conversion’,’fontsize’,16)
set(gca,’fontsize’,16);
hold off
108
113

% differential equations system
function dXdW = diffsys rate(W, X1,N in,Temperature,Ptot,X2)%%, N in,Temperature,Ptot,X2)
N = [N in(1).*(1-X1),
N in(2),
N in(3)-N in(1).*X1.*(1+X2)-N in(5).*X2,
N in(4)+N in(1).*X1.*(3+X2)+N in(5).*X2,
N in(5)+N in(1).*X1.*(1-X2)-N in(5).*X2,
N in(6)+N in(1).*X1.*X2+N in(5).*X2]; % molar flows at the anode outlet
P = N/sum(N)*Ptot;
D = 10^-5; % diffusion coefficient
% calculating the reaction rate at the given conditions using the function
% func
rate = func(P,Temperature,[110 1.7*10^-6], [197000 -26000]);
k = rate/P(1)*8.314*(Temperature+273);
thiele = 300* 10^-6*(k*6*(10^-6)^-1/D)^(1/2);
eff = tanh(thiele)/thiele
% differential equations
dXdW(1,1) = N in(1)^-1* eff* rate; %mol/g s
109
114

% function for calculating k according to r = k P CH4 (1-Q/K)
function r = func(PartP,Temperature, par,Ea) % antager X2 konstant over hele reaktoren
%calculating the approach to equiblibrium of the steam reforming reaction using the function
SReq
QK SR = SReq(Temperature,PartP);
% calculating the rate
r = par(1) * exp(-Ea(1)/((Temperature+273.15)*8.314))* PartP(1).*(1-QK SR)/(1+par(2)* exp(-
Ea(2)/((Temperature+273.15)*8.314))* PartP(5))^2;
110
115

% Approach to equilibrium of Steam reforming reaction (1-Q/K)
function QK = SReq(T,P) %T in oC, P in Pa
R = 8.314; %m^3 · Pa · K-1 · mol-1
a = [8.563 379.724 -1305.0038 1925.624 -1513.266 616.624 -102.4073]; % Cp parameters
% calculating enthalpy and entropi
H = 206.170 + a(1).*(T+273.15)./1000-a(1)*298.15/1000;
S = 214.61 + a(1)*log((T+273.15)./1000) - a(1)*log(298.15/1000);
for i = 1:6
H = H + a(i+1)*((T+273.15)./1000).^(i+1)/(i+1) - a(i+1)*(298.15/1000).^(i+1)/(i+1);
S = S + a(i+1)*((T+273.15)./1000).^i/(i) - a(i+1)*(298.15/1000).^i/(i);
end
% calculating gibbs energy and the equilibrium constant
G = H*1000-(T+273.15).*S;
K = exp(-G./(R.*(T+273.15)));
P = P/10^5; % converting from Pa til bar
%calculating the approach to equilibrium
Q = P(5).*P(4)^3./(P(1).*P(3));
QK=Q/K;
111
116

Appendix E
Estimation of Effects Neglected in
Model Work
E.1 Temperature
In order to determine whether it is necessary to include the temperature change over the anode
support in the model, an order of magnitude calculation is performed. These calculations are
performed as a worst case scenario, ie. highest possible temperature difference over the anode,
which means that the following simplifying conditions are used.
• Only methane and water are supplied from the fuel gas flow channel.
• All reactions take place at the boundary between electrolyte and anode.
• Heat transfer only takes place through the YSZ part of the anode support.
• current density = 3 A/cm2, Voltage = 0.6 V
The flux of methane is calculated from Faradays law.
JCH4 =i
4F=
3A/cm2
4 · 96485C/mol= 7.8 · 10−2 mol
m2s
The heat produced inside the cell, per second and per geometric anode area (Q/tA), is calculated
as the difference between the enthalpy change and the produced electric power.
rlQ
tA= −ΔH · JCH4 − i · U
= 560.5 · 103 J
mol· 7.8 · 10−2 mol
m2s− 3
A
cm2· 0.6V
= 25.7J
m2s
112
117

Finally the temperature difference over the anode support at steady state can be calculated as
the driving force needed to transport the produced heat trough YSZ.
ΔT =(1 − ε)QL
tAk= 25.7 · 103 J
m2s· 0.6 · 300 · 10−6m
4 JmsK
= 3.2K
3oK is such a low temperature difference that it is acceptable to neglect it. When it is furthermore
kept in mind that these calculations are for a worst case scenario, it is found that it is valid
to assume isothermal conditions across the cell, in the direction perpendicular to the gas flow
channels.
E.2 Pressure
There are two causes for mass transport in gasses, concentration gradients causing diffusion, or a
total pressure gradient causing a flow. The combined diffusion and reactions taking place in the
electrodes can result in a pressure difference across the electrodes. This pressure difference will
give a total flow which might result in a change in the partial pressures with respect to a system
were diffusion is the only transport mechanism. An order of magnitude calculation of the potential
pressure induced flow is calculated for the anode support at the pressure differences observed in
the diffusion simulation. The calculations are performed by using the Hagen-Poiseuille equation,
eq. E.1 [45].
J =εr2
8ητ
ΔP
Δx(E.1)
η is the viscosity.
J =0.4 · (10−6m)2
8 · 10−5Pas · 32000Pa
300 · 10−6m= 11.1 · 10−3m/s = 0.12
mol
m2s
The last conversion is performed by using the ideal gas equation at P = 105 Pa and T = 1073
K. The result from these calculations is a flux in the same order of magnitude as that caused by
diffusion, which indicates that this effect should be included in the model.
The actual pressure difference caused by diffusion will be notably lower than calculated here,
since the flow caused by pressure difference will decrease the effect. In order to examine this
more closely, eq. E.2 can be used. This has, however, not been done in this thesis.
Ji = −Deffi
RgT
dpi
dz+
pi
Ptot|electrolyte
εr2
8ητ
dPtot
dz(E.2)
This is a combination of the Hagen-Poiseuille equation and the expression used for the gas
diffusion. If this equation is used it is no longer a good assumption that the partial pressure
profile across the electrode is a straight line. Since the efficient diffusion coefficient will also be
changing across the electrode, it is not possible to use an analytic solution to the equation, so it
will have to be solved by numerical differentiation.
113
118

Appendix F
Heat Capacity
Table F.1 lists the constants needed to calculate heat capacity from Equation F.1.
Cp,i = C1,i + C2,iT + C3,iT2 (F.1)
Gas C1 J/molK C2 J/molK2 C3 J/molK3
H2 30.12844245 -5.79294 · 10−3 6.04 · 10−6
CH4 14.77089659 -7.447162 · 10−2 -1.744 · 10−5
H2O 30.83658949 9.02285 · 10−3 1.21 · 10−6
CO 25.8874019 1.22692 · 10−2 -5.17 · 10−6
CO2 26.50982067 3.959087 · 10−2 -1.146 · 10−5
O2 23.93966885 2.066157 · 10−2 -1.022 · 10−5
H2 26.58183734 9.48178 · 10−3 -3.55 · 10−6
Table F.1: Constants for finding the heat capacity of gas species by eq. F.1 [61]
114
119

Appendix G
Binary Diffusion Coefficients
The Chapman-Enskog expression, eq. G.1, is used to determine binary diffusion coefficients (Dij).
Dij = 0.0018583
√T 3
(1
Mi+
1Mj
)1
Pσ2ijΩDij
(G.1)
M is the molar mass of the denoted species, Ω is the dimensionless collision integral, which is a
function of the dimensionless temperature, κT/εij . The parameters σ and ε/κ can be found as
tabulated values for each species, and the value for each pair of species can be estimated by eqs.
G.2 and G.3. [12]
σij =σi + σj
2(G.2)
εij =√
εiεj (G.3)
The tabulated values of σ and ε that are used in this project are shown in table G.1.
Table G.1: Constants used for determining the binary diffusion coefficients [12], [61]σ ε/k M
A K g/mol
O2 3.433 113 31.999
N2 3.667 99.8 28.013
H2 2.915 38 2.016
H2O 2.641 809.1 18.016
CO 3.590 110 28.010
CO2 3.996 190 44.010
CH4 3.780 154 16.040
115
120

In the book ”Transport Phenomena” by Bird et al. [12], ΩDij is given in a table for different
values of κT/εij . This is not a practical method for programming, so in this project, the equation
given by Reid. et al. [61] is used instead, see eq. G.4
ΩDij =A
(T ∗)B+
C
exp(DT ∗)+
E
exp(FT ∗)+
G
exp(HT ∗)(G.4)
T ∗ = κT/εij is the dimensionless temperature and the constants A-H are given below
A = 1.06036 B = 0.15610 C = 0.19300
D = 0.47635 E = 1.03587 F = 1.52996
G = 1.76474 H = 3.89411
The method described here should give the binary diffusion coefficients within 10%.
The Knudsen diffusion is calculated by eq. G.5.
Di,k =8dp
3
√RgT
2πMi(G.5)
The effective diffusion coefficient is calculated from eq. G.6, which is used for calulating both the
effective binary and Knudsen diffusion.
Deffij =
ε
τDij (G.6)
ε is the porosity and τ is the tortuosity. The values used for these parameters as well as the pore
diameter and thickness are given in table G.2. If values different from those shown here have
been used in a simulation, then it will be specifically stated.
Table G.2: The chosen standard values for ε, τ , dp and thickness. [8] [59]ε τ dp (μm) thickness (μm)
Anode support 0.5 3 1 300
Anode 0.3 8 0.4 10
Cathode 0.35 3 0.15 15
The tortuosity value that is normally used for porous media is 3, but on the basis of work by
Peter Vang Hendriksen a value of 8 is chosen for the anode [30].
121

Article I
122

Journal of Power Sources 196 (2011) 25–38
Contents lists available at ScienceDirect
Journal of Power Sources
journa l homepage: www.e lsev ier .com/ locate / jpowsour
Review
Internal steam reforming in solid oxide fuel cells: Status and opportunities of
kinetic studies and their impact on modelling
D. Mogensena, J.-D. Grunwaldtb, P.V. Hendriksenc, K. Dam-Johansena,∗, J.U. Nielsend
a Department of Chemical and Biochemical Engineering, Technical University of Denmark, Soltofts Plads Building 229, DK-2800 Kgs. Lyngby, Denmarkb Institute for Chemical Technology and Polymer Chemistry, Karlsruhe Institute of Technology (KIT), Engesserstrasse 20, D-76131 Karlsruhe, Germanyc Risoe National Laboratory for Sustainable Energy, Technical University of Denmark, Frederiksborgvej 399, DK-4000 Roskilde, Denmarkd Topsoe Fuel Cell, Nymollevej 66, DK-2800 Lyngby, Denmark
a r t i c l e i n f o
Article history:
Received 6 May 2010
Received in revised form 14 June 2010
Accepted 24 June 2010
Available online 1 July 2010
Keywords:
Internal steam reforming
Kinetics
Solid oxide fuel cells
Modeling
Ni-YSZ
a b s t r a c t
Solid oxide fuel cells (SOFC) systems with internal steam reforming have the potential to become an
economically competitive technology for cogeneration power plants, exploiting its significantly higher
electrical efficiency compared to existing technologies. Optimal design and operation of such a system
require SOFC models that include accurate description of the steam reforming rate. The objective of this
article is to review the reported kinetic expressions for the steam reforming reaction. Extensive work
has been performed on traditional catalysts for steam reforming. Because of differences in operating
conditions, catalyst support material and structure it is critical to transfer this knowledge directly to
internal reforming in SOFCs, which is discussed in further detail in this article. There are big differences
in the reported kinetic expression for steam reforming over both industrial Ni catalysts and SOFC anode
materials. Surprisingly, there is a good agreement between measured rates pr. geometric anode area at
high operating temperatures, even for very different anodes. Detailed experimental data on the intrinsic
steam reforming kinetics of Ni-YSZ are necessary for micro structure SOFC modeling, such expression
are however lacking, but it may be viable to use measurements on industrial steam reforming catalysts
instead. Nevertheless there is a further need for experimental studies on determining the exact steam
reforming kinetics for SOFC anodes.
© 2010 Elsevier B.V. All rights reserved.
Contents
1. Introduction . . . . . . . . . . . . . . . . . . . . . . . . . . . . . . . . . . . . . . . . . . . . . . . . . . . . . . . . . . . . . . . . . . . . . . . . . . . . . . . . . . . . . . . . . . . . . . . . . . . . . . . . . . . . . . . . . . . . . . . . . . . . . . . . . . . . . . . . . . 262. The structure of an SOFC . . . . . . . . . . . . . . . . . . . . . . . . . . . . . . . . . . . . . . . . . . . . . . . . . . . . . . . . . . . . . . . . . . . . . . . . . . . . . . . . . . . . . . . . . . . . . . . . . . . . . . . . . . . . . . . . . . . . . . . . . . . . . 263. Steam reforming catalyst . . . . . . . . . . . . . . . . . . . . . . . . . . . . . . . . . . . . . . . . . . . . . . . . . . . . . . . . . . . . . . . . . . . . . . . . . . . . . . . . . . . . . . . . . . . . . . . . . . . . . . . . . . . . . . . . . . . . . . . . . . . . 26
3.1. Carbon poisoning . . . . . . . . . . . . . . . . . . . . . . . . . . . . . . . . . . . . . . . . . . . . . . . . . . . . . . . . . . . . . . . . . . . . . . . . . . . . . . . . . . . . . . . . . . . . . . . . . . . . . . . . . . . . . . . . . . . . . . . . . . . . . 273.2. Effect of current . . . . . . . . . . . . . . . . . . . . . . . . . . . . . . . . . . . . . . . . . . . . . . . . . . . . . . . . . . . . . . . . . . . . . . . . . . . . . . . . . . . . . . . . . . . . . . . . . . . . . . . . . . . . . . . . . . . . . . . . . . . . . . 283.3. Finetuning of catalyst . . . . . . . . . . . . . . . . . . . . . . . . . . . . . . . . . . . . . . . . . . . . . . . . . . . . . . . . . . . . . . . . . . . . . . . . . . . . . . . . . . . . . . . . . . . . . . . . . . . . . . . . . . . . . . . . . . . . . . . . 28
3.3.1. Particle size . . . . . . . . . . . . . . . . . . . . . . . . . . . . . . . . . . . . . . . . . . . . . . . . . . . . . . . . . . . . . . . . . . . . . . . . . . . . . . . . . . . . . . . . . . . . . . . . . . . . . . . . . . . . . . . . . . . . . . . . . 293.3.2. Sulfur . . . . . . . . . . . . . . . . . . . . . . . . . . . . . . . . . . . . . . . . . . . . . . . . . . . . . . . . . . . . . . . . . . . . . . . . . . . . . . . . . . . . . . . . . . . . . . . . . . . . . . . . . . . . . . . . . . . . . . . . . . . . . . . . 293.3.3. Alkali and earth alkali metals. . . . . . . . . . . . . . . . . . . . . . . . . . . . . . . . . . . . . . . . . . . . . . . . . . . . . . . . . . . . . . . . . . . . . . . . . . . . . . . . . . . . . . . . . . . . . . . . . . . . . . . 293.3.4. Modified Ni-YSZ anodes and Ni substitution. . . . . . . . . . . . . . . . . . . . . . . . . . . . . . . . . . . . . . . . . . . . . . . . . . . . . . . . . . . . . . . . . . . . . . . . . . . . . . . . . . . . . . . 29
4. Steam reforming kinetics . . . . . . . . . . . . . . . . . . . . . . . . . . . . . . . . . . . . . . . . . . . . . . . . . . . . . . . . . . . . . . . . . . . . . . . . . . . . . . . . . . . . . . . . . . . . . . . . . . . . . . . . . . . . . . . . . . . . . . . . . . . . 304.1. Langmuir–Hinshelwood kinetics . . . . . . . . . . . . . . . . . . . . . . . . . . . . . . . . . . . . . . . . . . . . . . . . . . . . . . . . . . . . . . . . . . . . . . . . . . . . . . . . . . . . . . . . . . . . . . . . . . . . . . . . . . . . . 304.2. First order kinetics with respect to methane . . . . . . . . . . . . . . . . . . . . . . . . . . . . . . . . . . . . . . . . . . . . . . . . . . . . . . . . . . . . . . . . . . . . . . . . . . . . . . . . . . . . . . . . . . . . . . . . 314.3. Power law expressions . . . . . . . . . . . . . . . . . . . . . . . . . . . . . . . . . . . . . . . . . . . . . . . . . . . . . . . . . . . . . . . . . . . . . . . . . . . . . . . . . . . . . . . . . . . . . . . . . . . . . . . . . . . . . . . . . . . . . . . 324.4. Kinetics over Ni-YSZ anode catalysts . . . . . . . . . . . . . . . . . . . . . . . . . . . . . . . . . . . . . . . . . . . . . . . . . . . . . . . . . . . . . . . . . . . . . . . . . . . . . . . . . . . . . . . . . . . . . . . . . . . . . . . . 32
5. Water gas shift reaction . . . . . . . . . . . . . . . . . . . . . . . . . . . . . . . . . . . . . . . . . . . . . . . . . . . . . . . . . . . . . . . . . . . . . . . . . . . . . . . . . . . . . . . . . . . . . . . . . . . . . . . . . . . . . . . . . . . . . . . . . . . . . . 356. Modeling internal steam reforming . . . . . . . . . . . . . . . . . . . . . . . . . . . . . . . . . . . . . . . . . . . . . . . . . . . . . . . . . . . . . . . . . . . . . . . . . . . . . . . . . . . . . . . . . . . . . . . . . . . . . . . . . . . . . . . . . 35
6.1. Recommendations . . . . . . . . . . . . . . . . . . . . . . . . . . . . . . . . . . . . . . . . . . . . . . . . . . . . . . . . . . . . . . . . . . . . . . . . . . . . . . . . . . . . . . . . . . . . . . . . . . . . . . . . . . . . . . . . . . . . . . . . . . . . 367. Conclusion. . . . . . . . . . . . . . . . . . . . . . . . . . . . . . . . . . . . . . . . . . . . . . . . . . . . . . . . . . . . . . . . . . . . . . . . . . . . . . . . . . . . . . . . . . . . . . . . . . . . . . . . . . . . . . . . . . . . . . . . . . . . . . . . . . . . . . . . . . . . 36
References . . . . . . . . . . . . . . . . . . . . . . . . . . . . . . . . . . . . . . . . . . . . . . . . . . . . . . . . . . . . . . . . . . . . . . . . . . . . . . . . . . . . . . . . . . . . . . . . . . . . . . . . . . . . . . . . . . . . . . . . . . . . . . . . . . . . . . . . . . . 36
∗ Corresponding author. Tel.: +45 4525 2845; fax: +45 4588 2258.
E-mail address: [email protected] (K. Dam-Johansen).
0378-7753/$ – see front matter © 2010 Elsevier B.V. All rights reserved.doi:10.1016/j.jpowsour.2010.06.091
123

26 D. Mogensen et al. / Journal of Power Sources 196 (2011) 25–38
1. Introduction
Solid oxide fuel cells (SOFC) systems have a strong potential
to become economically competitive with existing technologies
for power generation, such as gas turbines in co-generation plants
[1–3]. The striking advantage of fuel cells is that they directly con-
vert fuel electrochemically to electricity and thus the efficiency is
not limited by the Carnot cycle. In addition, high efficiency can be
achieved in small units, applicable for power production for refrig-
erated trucks, mobile homes and other small scale applications [4].
Small power generation units also allow alternative fuel sources
such as gasified biomass or agricultural biogas, to be harnessed to
a greater extent, without expensive transportation [5–7].
Among the different types of fuel cells, SOFCs have attracted
strong attention [8–14] due to the higher outlet temperature (ease
of waste heat utilization), its fuel flexibility, and its resistance
to some of the poisons that affect other fuel cells [4]. The most
straightforward fuel in a fuel cell is hydrogen at present mainly pro-
duced from hydrocarbons. For low temperature fuel cell systems
this hydrocarbon to hydrogen conversion is typically achieved by
external steam reforming. In contrast, for SOFC’s, internal steam
reforming can also be applied, because the Ni containing SOFC
anode support can act as a steam reforming catalyst and the oper-
ating temperature is suitable for methane conversion [15–17].
One of the advantages of internal steam reforming is that part
of the heat generated in the cell by electrochemical reactions, and
ohmic heating is directly used for the endothermic reforming reac-
tion [3,18,19]. In consequence, less heat needs to be supplied for
the pre-reformer and less cooling of the stack is needed. Both aspect
decrease the operating costs of the system. Furthermore, the equip-
ment costs are lower since a smaller pre-reformer is needed and
finally more even temperature distributions in the SOFC, than with
pure hydrogen can potentially be achieved, if proper control of the
catalytic activity is achieved.
With the current SOFC technology, the internal steam reform-
ing is much faster than the electrochemical reactions, which means
that the temperature gradients are actually larger than for SOFC’s
running on pure hydrogen. By gradually removing heat and produc-
ing hydrogen through the cell, the temperature and concentration
gradients can be decreased which could significantly improve its
performance [20]. This requires, however, detailed knowledge of
the kinetics of the steam reforming reaction in order to tune the
conditions and the anode structure or composition.
The kinetics of the steam reforming reaction of nickel-based cat-
alysts have been studied widely in literature, especially in catalytic
reactors, because of the industrial importance of this process [21].
However, the studies have often been performed at conditions or
on materials that are far from those of SOFC anodes. Only a few suit-
able kinetic data sets on real SOFC anode materials are available in
literature.
The aim of this article is to give a present status on the available
information on the internal steam reforming reaction over fuel cell
anode catalysts. Focus is first laid on the material aspect followed in
the second part by how the steam reforming activity can be tuned
and which conditions are preferred for internal steam reforming
over Ni-based anodes. The key part of the review focuses on a com-
parison of steam reforming kinetics on catalytic materials and in
SOFCs. Finally, its impact on the modeling of solid oxide fuel cells
is briefly discussed.
2. The structure of an SOFC
An SOFC is a continuously fed electrochemical cell, where the
electrodes and electrolyte are ceramic materials. The major elec-
trochemical reaction which takes place in an SOFC is the oxidation
of fuel. A large variety of materials are used in SOFCs and novel
Fig. 1. Illustration of the structure and major processes of an anode supported SOFC.
materials are presented regularly [22–34]. Typical SOFCs use anode
supported cells with [4,22–27]:
• yttria stabilized zirconia (YSZ) electrolyte (�el ≈ 10�m).• Ni-YSZ anode (�an ≈ 10�m) and support (�sup = 300 − 1000�m).• Strontium doped lanthanum manganate (LSM) cathode
(�cat ≈ 50�m).
These thicknesses (�el, �an, �sup, �cat) are used as estimations
later in this article. A cell is illustrated schematically in Fig. 1. Typical
structural parameters for a Ni-YSZ SOFC anode support are: poros-
ity ≈ 40–50%, Ni content ≈ 40 vol.% , dp,Ni≈ 1 �m [4,22–27]. The
anode support can be manufactured by first tape casting a slurry
of NiO and YSZ powders. The active anode, electrolyte and cathode
are then sprayed or screenprinted on the anode support. The active
anode normally has a composition similar to that of the support,
but is denser. Finally, the NiO in the anode and anode support is
reduced, which significantly increases the porosity [23,26,27,35].
Note, that the nickel particle size is much larger than in traditional
steam reforming catalysts and the amount of nickel is significantly
higher in order to ensure a high conductivity.
It is convenient to use Ni-YSZ as the structural backbone of
the cell because it has desirable mechanical properties, low ohmic
resistance and it allows preparation by cofiring of the entire cell,
which decreases production costs [36].
3. Steam reforming catalyst
Steam reforming has been used for hydrogen production since
1930 and the process as well as the kinetics have been examined in
numerous studies [21,37–43]. The most commonly used catalyst in
this process is nickel on a support of ˛-Al2O3, MgO or (Mg,Al)3O4
spinel. The nickel loading is around 25% w/w, with nickel particles
that are preferably smaller than 10 nm.
CH4 + H2O � CO + 3H2 (1)
CO + H2O � CO2 + H2 (2)
The steam reforming reaction (reac. 1) is highly endothermic
(�Ho298
= 206 kJ mol−1) whereas the water gas shift reaction (reac.
2) is slightly exothermic (�Ho298
= -41 kJ mol−1), which means that
energy must be supplied for the total reaction to proceed. A num-
ber of different existing reactor designs [42,44–46] allow for such
124

D. Mogensen et al. / Journal of Power Sources 196 (2011) 25–38 27
large energy supply. In the traditional industrial process the reac-
tion takes place over catalyst particles in large number of vertical
tubes. Heat is supplied by placing the tubes in a furnace, which is
heated by combustion of natural gas [21,42]. The operating condi-
tions of a typical industrial steam reforming process are 700–1000 ◦
C with a pressure around 30 bar and a steam-to-carbon ratio (S/C)
of 2.5–4 [39,47]. Often more than one reactor will be used in series,
with different conditions. The first reactor is designed for high reac-
tion rate and the subsequent reactors to increase output by shifting
the equilibrium.
The catalyst in an SOFC is different from the commercial cata-
lyst, even though nickel is also the main catalytic component. As
described in Section 2, Ni is mixed with YSZ. Both the Ni con-
tent and particle size are significantly higher than in industrial
steam reforming catalysts, to ensure a high electrical conductivity.
Furthermore, the geometry is also different (thin plate). Operat-
ing conditions are: T = 600–1000 ◦C, S/C ≈ 1.5 and P = 1–15 bar [4].
High pressure is theoretically advantageous since it increases the
cell voltage and improves electrode kinetics, but is non-trivial to
realize in practice due to the brittle character of the cells and seal-
ing used, which do not tolerate large pressure differences. The
energy for steam reforming is supplied by the waste heat from the
electrochemical reactions and ohmic heating. The continuous con-
sumption of hydrogen in a SOFC and the requirement of high fuel
consumption lead to complete conversion of methane.
It would be highly advantageous if the extensive knowledge
gained in the industrial steam reforming process could be trans-
ferred to internal steam reforming in SOFCs. Despite nickel is the
catalyst in both processes, the above descriptions show that the
support material, catalyst structure and pressure are not similar.
This means that knowledge from the industrial steam reforming
process does not necessarily apply directly to internal reforming in
SOFCs.
One of the major issues for internal steam reforming at the
temperatures used in SOFCs today is that the reforming reaction
is much faster than the electrochemical reactions. This is mainly
due to the high nickel content, which is required for electric con-
ductivity, but also offers a high number of catalytic sites. Steam
reforming consumes energy and the electrochemical reactions pro-
duce energy and since the steam reforming is fastest, the result is
cooling at the fuel inlet and heating at the fuel outlet. This intro-
duces large temperature gradients, resulting in thermal stress and
reduced efficiency [20]. The result is that in contrast to what is nor-
mally desired when investigating catalytic reactions, the goal for
optimizing internal steam reforming is to lower the reaction rate
of steam reforming, while maintaining high electric conductivity
and high reactivity of the electrochemical reactions. The techniques
used in industrial steam reforming for altering the reaction rate
are also relevant for changing the reaction rate in SOFC. However,
the goals are opposite i.e. lowering the reaction rate. The major
challenge for industrial steam reforming is to avoid a reduction in
activity by minimizing sintering, sulfur poisoning and carbon for-
mation [38]. This is also relevant for internal steam reforming in
SOFCs to achieve long-term performance.
3.1. Carbon poisoning
The deposition of elemental carbon on the catalyst is a major
issue for both industrial steam reforming and SOFCs with internal
reforming. The carbon may be formed by the methane cracking
reactions shown below, and similar for higher hydrocarbons. It is
especially important to be aware of carbon poisoning when using
Ni-YSZ anodes, since these are vulnerable to carbon deposition [48].
CH4 → C + 2H2 (3)
2CO → C + CO2 (4)
Fig. 2. Carbon deposition region in a C–H–O phase diagram at 1 atm [51], reproduced
with permission from Elsevier.
Three different types of carbon depositions have been reported
for industrial steam reforming catalysts: pyrolytic carbon, encapsu-
lating carbon (gum) and whisker carbon. Pyrolytic and gum carbon
reduce the catalyst activity and block the pores while whisker car-
bon destroys the structure of the catalyst [38,40,49,50]. Especially
the destructive effect of whisker carbon must be avoided, both in
SOFCs and industrial reforming.
The theoretical carbon deposition region has been determined
by thermodynamic equilibrium calculations by several authors
[51–54], and is shown as the area above the equilibrium lines in the
phase diagram depicted in Fig. 2. The curvature of the low temper-
ature lines at high hydrogen content illustrates that CH4 becomes
stable under these conditions. Moreover the carbon deposition
region shrinks with increasing temperature, but the rate of car-
bon formation is reported to increase with temperature [48,49,55].
Fig. 2 shows that carbon deposition should not occur for O/C > 1 at
900–1200 ◦ C (corresponding to S/C > 1 at the inlet) and at lower
temperatures higher O/C ratios are needed. In a model study by
Hsiao et al. [56] it was reported that the most critical point for
carbon deposition occurs about one quarter down the fuel channel.
This is caused by two partly compensating effects: oxygen is moved
to the anode side in the electrochemical reactions, which shifts the
gas composition away from the carbon deposition region, and the
cooling of the cell caused by the endothermal steam reforming
reduces the temperature, which increases the carbon deposition
region. No carbon deposition was observed for S/C ratios higher
than 1.5–1.6 on Ni-YSZ in an SOFC [52,57], but higher S/C ratios
are needed to avoid carbon deposition from higher hydrocarbons
[48,51,58,59]. The lower the fuel utilisation the higher S/C ratio is
needed to avoid carbon deposition [52].
In the industrial steam reforming process carbon deposition is
normally avoided by using a relatively high S/C ratio. However, in
SOFCs the S/C ratio should be kept as low as possible since water
is a product in the electrochemical reactions, and as such a higher
steam content in the fuel will decrease the reversible cell voltage
(Urev), as seen from the Nernst equation below.
Urev = −�G
2FA+ RgT
2FAln
(P0.5
O2PH2
PH2O
)
A lowering of the S/C ratio in industrial steam reforming will
result in a reduction in equipment cost, so methods for avoiding
carbon depositions at low S/C have long been searched for [47].
In situ microscopy studies reported by Sehested [38,60] show that
step sites on the Ni catalyst particles are the most active nucleation
125

28 D. Mogensen et al. / Journal of Power Sources 196 (2011) 25–38
sites for both carbon formation and steam reforming. This is backed
up by density functional theory calculations [61,62] and is in line
with the observation that potassium, sulfur and gold reduce carbon
formation by blocking these step sites [13,14,47,63–65]. Blocking
the step sites also significantly reduces the steam reforming rate,
which makes this method one of the most promising ones for reduc-
ing carbon deposition in SOFCs with internal steam reforming. New
approaches to lowering carbon deposition by adding different pro-
moters (Sn, Mo, Li, n-butanethiol, Mg, Ca, Sr, Ce, Ru, Rh, Pd, Pt) to
the Ni-YSZ anode, are regularly reported in literature [54,66–69].
3.2. Effect of current
It has been shown that a sufficiently high cell current prevents
carbon deposition, even for a cell fueled by methane with 3 % H2O
(S/C = 0.03) [70–73]. Lin et al. [70] suggested that deposited carbon
is reoxidised by the oxygen ions passing through the electrolyte, but
another possible explanation is that backflow of steam produced in
the electrochemical reactions increases the local S/C ratio to values
were elemental carbon is not formed. The necessary minimum cell
current density is greatly dependent on temperature. At 700 ◦ C a
current of approximately 0.1 A cm−2 is needed while at 800 ◦C, 1.8
A cm−2 is needed. The minimum cell current density is, most likely,
highly dependent on the total flow, and this should also be investi-
gated (The flow used by Lin et al. [70] was 30 sccm on a anode area of
2.8 cm2 with a thickness og 0.7–1 mm). Such a high current density
will with present day state of the art cells mean that one has to oper-
ate at very low voltage unlikely to be optimal from an overall cost
point of view. It has been shown that it is possible to decrease the
necessary current with up to a factor 3 by applying an inert barrier
layer on the anode support. This is most likely caused by increased
mass transport limitations, which in turn should also decrease the
rate of the electrochemical reactions. A further investigation of the
effect of such an inert layer would be very interesting. There are,
however some fundamental difficulties, with using pure methane
fuel and relying on current to prevent carbon deposition. Natural
gas contains higher hydrocarbons, which have a much higher ten-
dency for carbon deposition, meaning that some degree of external
purification is needed. Also, it is highly problematic if a commercial
cell is not tolerant towards sudden drops in current. The possibility
of direct electrochemical oxidation of methane in SOFC has been
shown [74], however with high polarization resistance. Recently,
some groups have reported fast direct electrochemical oxidation
of methane [75–77], however, it has been debated [78] whether it
is direct electrochemical oxidation of methane or rather oxidation
via an indirect route, e.g. cracking of methane with subsequent oxi-
dation of carbon or possibly via partial steam reforming followed
by electrochemical oxidation of hydrogen and CO.
3.3. Finetuning of catalyst
In SOFC systems running on natural gas with internal steam
reforming, some degree of pre-reforming is necessary to avoid
carbon formation due to higher hydrocarbons and decrease the
methane concentration to a level that result in acceptable temper-
ature and concentration gradients in the SOFC stack [18,79]. There
is, however, potential for significant improvement of the system
efficiency by lowering the degree of pre-reforming and reducing
the temperature and concentration gradients in the stack. A possi-
ble strategy, is to lower the reforming rate to the same level as the
electrochemical reactions. In fact, the general tendency of today’s
SOFC research is to lower the operating temperature [80–82] and
since the steam reforming reaction has a high activation energy
(58–228 kJ mol−1, see Table 5), the reaction rate decreases rapidly
with temperature. The present lower temperature limit for effi-
cient operation of an SOFC is around 650–700 ◦ C [25,82]. In order
Table 1Theoretical hydrogen production rate from steam reforming in 1 cm2 of an SOFC
anode, using the kinetic expression by Wei et al. [40], details see text.
T◦C rH2,prod mol s−1cm−2 iequivalent A cm−2 �
400 4.3E-07 0.08 0.99
500 4.8E-06 0.9 0.97
600 3.1E-05 5.9 0.84
700 1.3E-04 26 0.58
800 4.5E-04 86 0.34
900 1.2E-03 233 0.21
to illustrate the temperature dependency of internal steam reform-
ing, order of magnitude calculations were made based on the
steam reforming rate by Wei et al. [40] (EA = 102 kJ mol−1), which
is later used as a reference expression. The calculations are made
for a 1 cm2 Ni-YSZ anode with thickness = 500 �m, Ni content = 50%
(w/w), Ni particle size = 1 �m and porosity = 50%, Gas composi-
tion: 50/50 methane and water and no mass transport limitation for
steam reforming. The resulting rate of hydrogen production from
steam reforming is shown in Table 1. The efficiency factor in Table 1
is calculated from Eq. (5) and describes how big a fraction of the
available catalyst material that is being fully used, i.e. an efficiency
factor = 1 corresponds to full usage of the catalyst [42].
� = Tan h(�)
�(5)
where � is the Thiele modulus:
� = L
√k
D
where L is the anode thickness, k is the rate constant (s−1) and
D is the diffusion coefficient (m2s−1). The diffusion coefficient of
methane is assumed to be 10−5 m2s−1. iequivalent is the theoretical
current that corresponds to a consumption of hydrogen in the same
rate as it is produced from the steam reforming reaction, calculated
from:
iequivalent = 2FArH2,prod
where FA is the Faraday constant.
These calculations illustrates how the rate of the steam reform-
ing reaction compares to the rate of electrochemical reactions. For
optimal operation, without hydrogen i the inlet gas, iequivalent should
probably be a little higher than the operating current. This means
that at temperatures 600–700 ◦ C the rate of steam reforming rate
is in a range where it should be possible to reduce it to the desired
level by finetuning the catalyst. It should be noted however, that
during the calculation of iequivalent it was assumed that the steam
reforming rate was not limited by diffusion. The � values show that
this assumption is only valid at low temperatures, meaning that
at high temperatures the actual rate will be lower than the one
calculated here.
Another theoretical possibility for decreasing the steam reform-
ing rate, by changing the conditions, is to have a low S/C ratio in the
fuel inlet, so that the conversion of methane will be controlled by
equilibrium and thereby the amount of water produced in the elec-
trochemical reaction. However, this will result in significant carbon
deposition in the cell as described in Section 3.1.
Up to now, alternative materials has been hampered by low elec-
tronic conduction. For example, Georges et al. [15] has presented
a strontium doped lanthanum chromite impregnated with ruthe-
nium catalyst (LSCRu), which operates at S/C ratios down to 0.08
without carbon deposition. Unfortunately, this material has very
poor anode properties, so this study can only be considered a proof
of concept, not a solution.
126

D. Mogensen et al. / Journal of Power Sources 196 (2011) 25–38 29
Rostrup-Nielsen et al. [14] conclude that the catalytic steam
reforming of methane does not take place at the same catalytic sites
as the electrochemical conversion of hydrogen. It might therefore
be possible to further decrease the steam reforming reaction rate
by selectively blocking the catalytic sites without significantly low-
ering the cell performance. Several possible methods for doing this
originating from the research on preventing poisoning of industrial
reforming catalysts are described in the following sections.
3.3.1. Particle size
The size of nickel particles in the anode support will influence
the steam reforming rate because larger particles give a smaller
surface area for the same nickel content and thereby less active
sites for catalysis. If the particle size in the active anode is also
increased it can however result in a smaller triple phase boundary
between anode, electrolyte and gas, which is the active area for the
anode reaction [83–85]. It was shown by Simwonis et al. [86] that
the nickel particle size also influences the electrical conductivity of
the anode and that the particle size increases during operation by
agglomeration, which is in fact one of the major anode degradation
mechanisms [38,86,87]. This means that an increase in Ni particle
size in order to reduce the steam reforming reaction rate may result
in a reduction in cell performance. Note however that nickel particle
size in SOFC anodes is in general much larger than in industrial
steam reforming catalysts.
3.3.2. Sulfur
Several studies on the effects of sulfur on the fuel cell perfor-
mance of NI-YSZ anodes operating in hydrogen have been reported
in literature [64,88–94]. Exposing an operating cell to ppm lev-
els of sulfur in the anode stream results in an immediate voltage
drop (few minutes up to few hours) followed by a slower decay
of the voltage occurring over the following hundred hours [89].
In hydrogen under the studied current loads (less than 1A cm−2)
the effect of the sulfur poisoning seems fully reversible—the cell
voltage returns slowly (over 10 to few hundreds hours) to its orig-
inal value after removal of the sulfur [89,90]. The effects of sulfur
on Ni catalysts and SOFC anodes has recently been reviewed by
Hansen and Nielsen [95]. The poisoning is due to adsorption of
sulfur on sites active in the electrochemical reaction [95]. Both
the temperature dependence and the dependence on sulfur con-
centration of the experimentally observed voltage losses can be
accounted for assuming that the loss scales in a linear manner with
the sulfur coverage on the Ni, the temperature and H2S partial pres-
sure dependence of which is known assuming that the adsorption
follows a Temkin-like isotherm [95].
Only few reports are available on the effects of sulfur on the elec-
trochemical processes considering operation in CO/H2/H2O/CO2;
Noponen [96] reports only a small adverse effect of sulfur (at 800 ◦C,
i = 0.5 A cm−2) and Silversand [14,97] reports in a short-term test
that there are no irreversible degradation of the electrochemical
performance of up to 50 ppm H2S at 700–800 ◦C.
Interestingly, it has been reported that the effects of sulfur on
the SOFC Ni-cermet anode performance is strongly affected by the
ceramic part of the anode: Sasaki finds that a Ni/SzSZ is more robust
toward sulfur poisoning than a similar NI-YSZ anode and that the
tolerance can be further increased by various oxide additions (e.g.
Ce-oxide, Y-oxide, La-oxide) [88].
It has clearly been demonstrated [95,97,98], that sulfur adsorp-
tion in the anode has a much stronger impact on the steam
reforming rate than it does on the electrochemical processes and
hence, slowing down of the reforming rate by controlled sulfur
poisoning is an interesting technological possibility [99,100]. How-
ever, more studies are needed to map out the span of operation
conditions and sulfur levels that will not lead to non-recoverable
loss of the electrochemical performance of the cell.
3.3.3. Alkali and earth alkali metals
Rostrup-Nielsen and Christiansen [63] reported that the rate of
catalytic steam reforming over 7–9% Ni on Mg/Al-spinel is signifi-
cantly reduced by addition of alkali metals. An explanation of this is
suggested from DFT calculations, which show that blocking of step
sites will significantly reduce catalyst activity [61,62] and alkali
metals absorb to step sites. The reduction in activity was shown
to be a factor 2–5 depending on the alkali metal. Alkali poisoning
is thus a promising method for finetuning of catalytic activity in
SOFCs.
Kikuchi and coworkers [54,58] investigated the change in
carbon deposition and steam reforming rate when adding CaO,
MgO, SrO and CeO2 to Ni-YSZ anodes in the temperature range
600–800 ◦C. CaO and SrO decreased carbon deposition with 30–50%
while Mg increased it with up to 20%, low amounts of CeO2 (0.2%,
w/w) decreased the carbon deposition (≈50%) while high amounts
(2%, w/w) increased carbon deposition (≈25%). In most cases the
addition of the alkaline earth metals to Ni-YSZ resulted in a slight
increase in steam reforming rate, with the following 3 exceptions:
A high amount of SrO almost removed the catalytic effect of nickel
(whereas low amounts increased activity), small addition of MgO
reduced reforming rate by about 40% and high amounts of CeO2
decreased reforming rate with up to 75%. From this it can be con-
cluded that MgO and CeO2 in the right amounts could possibly be
used for reducing steam reforming rate in SOFC’s, but it has to be
considered that both of these increase carbon deposition. It should
be noted that the Ni-YSZ in these investigations contained 75–80%
Ni (w/w), which is very high for an SOFC anode.
3.3.4. Modified Ni-YSZ anodes and Ni substitution
The suggestions for finetuning the anode catalyst in the previous
sections by larger particles and poisoning by sulfur or alkali met-
als have the disadvantage that the electrochemical reactions are
also influenced. Another method for lowering the steam reform-
ing rate is modification of Ni-YSZ or using entirely different anode
materials. Note, however, that other requirements also have to be
considered, such as low electric resistance, high porosity and a ther-
mal expansion coefficient similar to the active anode, electrolyte
and cathode.
A promising work on modifying the anode was presented by
Boder and Dittmeyer [79], who reported that replacing some of the
nickel in the anode with copper reduces the steam reforming rate
with a factor 4-20 without significant reduction in electrochemi-
cal performance. Further investigations into this direction could be
rewarding.
An SOFC with an anode catalyst layer consisting of Ir impreg-
nated Ceria on top an active anode of Ni-YSZ is reported by Klein et
al. [12] to operate on pure methane for almost 30 h without showing
signs of degradation, i.e. carbon deposition. The power production
during this experiment was only about 55 mW m−2, so the perfor-
mance of this type of cell has to be greatly improved in order to
be relevant. Ru and Pt additives have also been reported to prevent
carbon deposition on Ni-YSZ for internal steam reforming with S/C
as low as 0.1 [54,101].
Gorte and coworkers [102–104] report the use of Cu–CeO2–YSZ.
It is applicable for higher hydrocarbons but has lower affinity
toward hydrogen oxidation in the triple phase boundary. A fuel cell
with Ni-YSZ as the active anode and Co–Ni–SDC as support material
and steam reforming catalyst has been tested with pure methane
as the fuel with no observed carbon deposition. The cell perfor-
mances were however relatively poor, with a maximum power
density of 0.35 W cm−2, which decreased significantly with time
[105]. Finally, a Ni-YSZ anode coated with a layer of catalytically
inert YSZ was proposed to reduce the steam reforming rate due to
mass transport, but there is disagreement about the effect on the
electrical efficiency [70–72,106–108]. On a side note, these find-
127
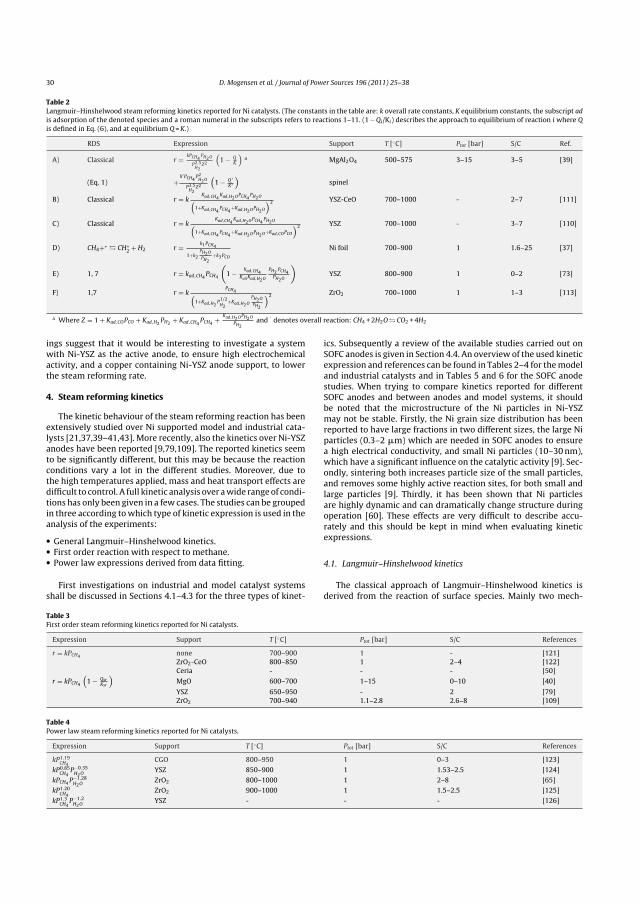
30 D. Mogensen et al. / Journal of Power Sources 196 (2011) 25–38
Table 2Langmuir–Hinshelwood steam reforming kinetics reported for Ni catalysts. (The constants in the table are: k overall rate constants, K equilibrium constants, the subscript ad
is adsorption of the denoted species and a roman numeral in the subscripts refers to reactions 1–11. (1 − Qi/Ki) describes the approach to equilibrium of reaction i where Q
is defined in Eq. (6), and at equilibrium Q = K.)
RDS Expression Support T [◦C] Ptot [bar] S/C Ref.
A) Classical r = kPCH4PH2O
P2.5H2
Z2
(1 − Q
K
)a MgAl2O4 500–575 3–15 3–5 [39]
(Eq. 1) +k′PCH4
P2H2O
P3.5H2
Z2
(1 − Q ′
K ′)
spinel
B) Classical r = kKad,CH4
Kad,H2OPCH4PH2O(
1+Kad,CH4PCH4
+Kad,H2OPH2O
)2 YSZ-CeO 700–1000 - 2–7 [111]
C) Classical r = kKad,CH4
Kad,H2OPCH4PH2O(
1+Kad,CH4PCH4
+Kad,H2OPH2O+Kad,COPCO
)2 YSZ 700–1000 - 3–7 [110]
D) CH4+∗ � CH∗2
+ H2 r = k1PCH4
1+k2
PH2O
PH2
+k3PCO
Ni foil 700–900 1 1.6–25 [37]
E) 1, 7 r = kad,CH4PCH4
(1 − kad,CH4
KviiKad,H2O
PH2PCH4
PH2O
)YSZ 800–900 1 0–2 [73]
F) 1,7 r = kPCH4(
1+Kad,H2P
1/2
H2+Kad,H2O
PH2O
PH2
)2 ZrO2 700–1000 1 1–3 [113]
a Where Z = 1 + Kad,COPCO + Kad,H2PH2
+ Kad,CH4PCH4
+ Kad,H2OPH2O
PH2
and′denotes overall reaction: CH4 + 2H2O � CO2 + 4H2
ings suggest that it would be interesting to investigate a system
with Ni-YSZ as the active anode, to ensure high electrochemical
activity, and a copper containing Ni-YSZ anode support, to lower
the steam reforming rate.
4. Steam reforming kinetics
The kinetic behaviour of the steam reforming reaction has been
extensively studied over Ni supported model and industrial cata-
lysts [21,37,39–41,43]. More recently, also the kinetics over Ni-YSZ
anodes have been reported [9,79,109]. The reported kinetics seem
to be significantly different, but this may be because the reaction
conditions vary a lot in the different studies. Moreover, due to
the high temperatures applied, mass and heat transport effects are
difficult to control. A full kinetic analysis over a wide range of condi-
tions has only been given in a few cases. The studies can be grouped
in three according to which type of kinetic expression is used in the
analysis of the experiments:
• General Langmuir–Hinshelwood kinetics.• First order reaction with respect to methane.• Power law expressions derived from data fitting.
First investigations on industrial and model catalyst systems
shall be discussed in Sections 4.1–4.3 for the three types of kinet-
ics. Subsequently a review of the available studies carried out on
SOFC anodes is given in Section 4.4. An overview of the used kinetic
expression and references can be found in Tables 2–4 for the model
and industrial catalysts and in Tables 5 and 6 for the SOFC anode
studies. When trying to compare kinetics reported for different
SOFC anodes and between anodes and model systems, it should
be noted that the microstructure of the Ni particles in Ni-YSZ
may not be stable. Firstly, the Ni grain size distribution has been
reported to have large fractions in two different sizes, the large Ni
particles (0.3–2 �m) which are needed in SOFC anodes to ensure
a high electrical conductivity, and small Ni particles (10–30 nm),
which have a significant influence on the catalytic activity [9]. Sec-
ondly, sintering both increases particle size of the small particles,
and removes some highly active reaction sites, for both small and
large particles [9]. Thirdly, it has been shown that Ni particles
are highly dynamic and can dramatically change structure during
operation [60]. These effects are very difficult to describe accu-
rately and this should be kept in mind when evaluating kinetic
expressions.
4.1. Langmuir–Hinshelwood kinetics
The classical approach of Langmuir–Hinshelwood kinetics is
derived from the reaction of surface species. Mainly two mech-
Table 3First order steam reforming kinetics reported for Ni catalysts.
Expression Support T [◦C] Ptot [bar] S/C References
r = kPCH4none 700–900 1 - [121]
ZrO2-CeO 800–850 1 2–4 [122]
Ceria - - - [50]
r = kPCH4
(1 − Qsr
Ksr
)MgO 600–700 1–15 0–10 [40]
YSZ 650–950 - 2 [79]
ZrO2 700–940 1.1–2.8 2.6–8 [109]
Table 4Power law steam reforming kinetics reported for Ni catalysts.
Expression Support T [◦C] Ptot [bar] S/C References
kP1.19CH4
CGO 800–950 1 0–3 [123]
kP0.85CH4
P−0.35H2O
YSZ 850–900 1 1.53–2.5 [124]
kPCH4P−1.28
H2OZrO2 800–1000 1 2–8 [65]
kP1.20CH4
ZrO2 900–1000 1 1.5–2.5 [125]
kP1.3CH4
P−1.2H2O
YSZ - - - [126]
128

D. Mogensen et al. / Journal of Power Sources 196 (2011) 25–38 31
anistic schemes have been considered. The classical mechanism,
presented first by Xu and Froment [39], postulates that the reac-
tion of adsorbed carbon and oxygen species is the rate determining
step (RDS) as shown below.
• CHO∗ + ∗ � CO∗ + H∗• CO∗ + O∗ � CO∗
2• CHO∗ + O∗ � CO∗2
+ H∗
From this they conclude that the reaction rate is dependent on
partial pressure of methane, water and hydrogen as shown in entry
A in Table 2. Similar kinetics (without the strong hydrogen depen-
dence) was used for Ni-YSZ, by Peters et al. [110] and Nakagawa
et al. [111] as given in entry B and C in Table 2. The positive influ-
ence of water predicted by entries A, B and C is, however, rarely
observed in literature. The value Q in expressions A, B and C is
defined by:
Q =∏
Pproducts∏Preactants
(6)
The term connected with Q, which appear in some of the kinetic
expressions accounts for the backwards reaction close to equilib-
rium. In more recent work it has been shown that dissociative
adsorption of methane is the rate limiting step (step 1). This leads
to the following model for the elementary reactions, which nowa-
days is often used to derive kinetic expressions for steam reforming
[42,112,40].
1. CH4 + 2∗ → CH∗3
+ H∗
2. CH∗3+∗ � CH∗
2+ H∗
3. CH∗2+∗ � CH∗ + H∗
4. CH∗ + ∗ � C∗ + H∗
5. H2O + 2∗ � HO∗ + H∗
6. HO∗ + ∗ � O∗ + H∗
7. C∗ + O∗ � CO∗ + ∗
8. C∗ + HO∗ � CHO∗ + ∗
9. CHO∗ + ∗ � CO∗ + H∗
10. CO∗ � CO + ∗
11. 2H∗ � H2 + 2∗
It is generally agreed that Reaction 1 is an RDS, but there is
great disagreement on whether or not reactions 5 and 7 should
also be considered as RDS. The Langmuir–Hinshelwood expres-
sions that have been reported for steam reforming over Ni-YSZ are
presented in Table 2 along with some expressions for Ni on other
support materials. Langmuir–Hinshelwood expressions are often
presented with only a few rate and equilibrium constants, which
are not connected to a specific elementary reaction, like in the last
three expressions in Table 2. When observing such expressions it
is important to remember that these constants are a combination
of rate and equilibrium constants for several different elemen-
tary steps. This is especially relevant when the activation energy
is reported without a derivation or indication of which elementary
step(s) are rate determining [110,111].
There seems to be a consensus on a reaction order of 1 for
methane. However, the expressions in entry E and F indicate
another rate-limiting step than only the dissociative adsorption of
methane. This is in line with the results of Aparicio et al. [41]. In
addition, the effect of other adsorbates are considered in D and F
as well as the reverse reaction in entry F. Expressions E and F are
Langmuir-Hishelwood expressions that can be derived from the
elementary reactions in Eqs. (1)–(11), D origins from an earlier, but
similar set of elementary reactions.
A possible explanation for the many different expressions is
given by density functional theory calculations, which show that
reactions 1 and 7 are kinetically controlling, and that reaction
1 is rate controlling at high temperature while 7 (or another
CO formation reaction) is rate controlling at low temperatures
[114,115]. Hence the kinetic expression will change with operat-
ing conditions. Furthermore, it must be kept in mind that a large
number of different plausible expressions can be derived from
Langmuir–Hinshelwood kinetics with several constants in each
expression. This means that an agreement to experimental data
is not a definite proof for a mechanism.
4.2. First order kinetics with respect to methane
The Langmuir–Hinshelwood kinetics with dissociative adsorp-
tion of methane as the only rate determining step (Reaction 1)
results in a first order expression that is only dependent on the
methane partial pressure, under the assumption that the sur-
face is not covered by other adsorbents. This assumption is valid
at high temperatures and low pressure and since these condi-
tions are normally used in experiments designed for investigating
kinetic expression, this type of expression has received much atten-
tion. Several studies reporting first order kinetics are presented in
Table 3.
A very extensive work on determining steam reforming kinet-
ics at high temperatures has been performed by Wei and Iglesia,
where steam reforming kinetics have been determined for a num-
ber of different metal-based catalysts, including Ni [40,116–120].
The experiments were conducted in packed catalyst beds. By chang-
ing the catalyst pellet size and the degree of dilution in the bed,
mass transport effects could be excluded in these studies. The
results were corrected for approach to equilibrium as shown in
Eq. (7).
rn = rf
(1 − Qsr
Ksr
)(7)
where rn is the net CH4 conversion rate, rf is the forward reaction
rate, K is the equilibrium constant of the steam reforming reaction
and Q is given by Eq. (6). The forward reaction rate was found to
be first order in CH4 and independent of the H2O and CO2 content,
resulting in the simple expression in Eq. (8) for all the examined
catalysts. The first order dependence in methane is in agreement
with the majority of the reported steam reforming kinetics, but the
independence of other gasses is less commonly reported.
rf = kPCH4(8)
Wei and Iglesia also examined the steam reforming and water
gas shift reactions by isotopic tracing of some of the elementary
steps, showing that they are in quasi-equilibrium. The results are
summarized in Fig. 3, underlining that the rate determining step is
activation of the first C–H bond (reaction 1), resulting in a first order
expression for steam reforming with water gas shift and hydrogen
formation/dissociation in quasi-equilibrium.
More recently, Hecht et al. [112] reported a combined model
and experimental study of internal steam reforming over Ni-YSZ.
They conclude that their findings on Ni-YSZ are consistent with the
result of a first order expression with activation of the first C–H
bond, found by Wei and Iglesia. However, an overall reaction rate
for the steam reforming reaction is not explicitly presented. The
model in this work is described in more detail in Section 6.
Achenbach and Riensche’s [109] study of steam reforming kinet-
ics over Ni on a zirconia support is focused on use for SOFCs and
the determined kinetic expression for the initial rate is also first
order in methane. The study takes into account the mass transport
by using Newtons law for convective mass transfer (analogue to
Fick’s law), and uses an approach to equilibrium term like the one
used by Wei and Iglesia, shown in Eqs. (7) and (6).
129

32 D. Mogensen et al. / Journal of Power Sources 196 (2011) 25–38
Fig. 3. Sequence of elementary steps for steam reforming and water gas shift reac-
tion on Ni catalysts, as found by isotopic analysis. → irreversible step, � reversible
step, ( ), quasi-equilibrated steps, ki is the rate constant and Ki is the equilibrium
constant for reaction i [40], reproduced with permission from Elsevier.
4.3. Power law expressions
The kinetic expressions presented in Section 4.1 rely on several
assumptions and simplifications (a single RDS, one dominat-
ing species on the surface, quasi equilibrium, etc.). To have a
model independent description, many of the measured kinetics
are instead given by power law expressions without tracing back
to a mechanism of elementary steps. Kinetic measurements of
the steam reforming reaction are normally fitted to the following
power law expression.
−rCH4= kP˛
CH4Pˇ
H2OP�H2
PıCO2
P�CO (9)
� , ı and � are often found to be close to zero (see Table 4). The rate
constant, k, as well as ˛ and ˇ vary between different studies. An
overview of the reported power law expressions for steam reform-
ing over Ni catalysts on either ceria or zirconia support is shown
in Table 4. The reaction order with respect to methane is close to 1
for all expressions, in agreement with the expressions presented in
Sections 4.1 and 4.2. There is, however, no agreement on the reac-
tion order with respect to water. This may be due to the different
conditions used in these studies. It is striking that many report the
order to be negative.
Unfortunately, in many of the studies that present power law
kinetics the experimental method does not follow the recom-
mended practice for measuring catalytic reaction rates as described
in “Concepts of Modern Catalysis and Kinetics” [42]. Some works
do not comment on the possible effects of mass transport [124] and
others have a high degree of conversion across the reactor (50–95%)
giving strong temperature and concentration gradients along the
reactor [65,125,123]. Temperature gradients imply that the actual
temperature in the catalyst material will differ from the measured
temperature and high concentration gradients mean that approach
to equilibrium may influence the results. These uncontrolled effects
are probably an additional cause for the disagreement on the reac-
tion order with respect to water partial pressure. When using
power law kinetics, it must be kept in mind that they are often
used to describe measurements that are specific to the setup they
are measured on, and in such cases they will probably not be rep-
resentative for another system.
4.4. Kinetics over Ni-YSZ anode catalysts
Steam reforming kinetics for SOFCs have been investigated
since the late 1980s but there is still no consensus on the kinetic
expression [50,127]. In this section a comparison of the reported
expressions is given as follows:
1. Reaction orders and experimental conditions.• Kinetic expressions (i.e. reaction orders) and activation ener-
gies are given in Table 5.• Experimental conditions of the compared expressions are
summarized in Table 6.
2. Comparison of predicted rate under specific conditions normal-
ized by:• Ni weight, Fig. 4.• Ni surface area, Fig. 5.• Geometric anode area, Fig. 6.
Besides the studies that are discussed here, additional exper-
iments exist in the literature [8,79,110,113,126,131–133]. These
studies were not included in this comparison because of insuffi-
cient information on experimental details to allow for appropriate
calculations.
As can be seen in Table 5, there is a large spread in the reported
activation energies (EA), i.e., 58–229 kJ mol−1, but the majority of
the reported EA lies just below 100 kJ mol−1, which also fits well
Table 5Steam reforming kinetics and activation energies reported for steam reforming over Ni-YSZ SOFC anode/anode-supports.
Expression EA [kJ mol−1] T [◦C] Ptot [bar] S/C References
kad,CH4PCH4
(1 − kad,CH4
K5Kad,H2O
PH2PCH4
PH2O
)228.8 800–900 1 0–2 LH1 [73]
kPCH4113–124 650–800 - 3–15 SLH1 [9]
kPCH4
(1 − Q
K
)63.3 650–950 - 2 SLH2 [79]
kPCH4
(1 − Q
K
)82 700–940 1.1–2.8 2.6-8 SLH3 [109]
kPCH4P−1.25
H2O74–98 800–1000 - 2–8 PL1 [65]
kP1.20CH4
58 900–1000 - 1.5–2.5 PL2 [125]
kP0.85CH4
P−0.35H2O
95 850–900 1 1.5–2.5 PL3 [124]
kP1.3CH4
P−1.2H2O
191 - - - [126]
k1
Kad,CH4Kad,H2OPCH4
PH2O(1+Kad,CH4
PCH4+Kad,H2OPH2O+Kad,COPCO
)2 - 700–1000 1 3–7 [110]
k+PCH4PH2O − k−PCOP3
H2- 700–950 1.5 3 [128,129]
kPCH4PH2O
(1 − Q
K
)205 600–700 - 2–3.5 [130]
130

D. Mogensen et al. / Journal of Power Sources 196 (2011) 25–38 33
Table 6Ni-YSZ properties and measuring conditions for the compared expressions.
Expression/reference Setup Preparation T [◦C] Thickness [mm] Ni content [% w/w] ANi,surf [m2 ganode−1] dpNi[�m] Porosity
LH1 [73] cermet film Precipitation 800–900 0.01 70 0.83 0.88 a -
SLH1 [9] PFR Tape Casting 650–800 0.075–0.150 b 50 0.18 10–2000 -
SLH2 [79] anode Coat mix 650–950 0.04 65 1.2 0.4 c -
SLH3 [109] anode - c 750–950 1.4 20 - - -
PL1 [65] CSTR 4 different 800–1000 2.4–4.8 b 50–80 - - 0.14–0.66
PL2 [125] anode Spray paint 900–1000 0.04 60 vol.% - - -
PL3 [124] anode Screen print 850–900 0.05 - - - -
Ref. [40] PFR - 600–700 0.25–0.45 7 1.8 0.0067 -
a Estimated value, assuming spherical Ni particles.b Particle diameter of crushed anode.c ZrO2 support.
with the value of 102 kJ mol−1 reported by Wei and Iglesia [40]
on an industrial steam reforming catalyst. There is, however, also a
large spread in the activation energies reported for industrial steam
reforming catalysts, for example the studies i Refs. [37,39,40,121]
report values in the range 102–240 kJ mol−1. In general the reported
values seems to be higher than for Ni-YSZ.
A comparison with the activation energy of the electrode reac-
tions is interesting in order to evaluate the idea of lowering the
internal steam reforming rate by lowering the operating tempera-
ture and thereby spread the reforming reaction over a larger part of
the cell, as described in Section 3.3. Barfod et al. [134] report acti-
vation energies of the anode reaction in the order EA ≈ 1 eV ≈100
kJ mol−1, meaning that it is similar to that of the steam reforming
reaction. A decrease in operating temperature of a specific cell will
therefore not have the desired effect on spreading the conversion of
methane over a larger part of the cell area. However, a lowering of
the SOFC operating temperature will only be industrially relevant
if new cells are developed, with a higher electrochemical activity
at the lower temperatures. New types of cells with improved elec-
trodes could show a better balance between the rates of the steam
reforming and the electrochemical processes if the modifications
only affect the latter.
The abbreviations that are used in both Tables 5 and 6 and
Figs. 4–6, denote classical Langmuir–Hinshelwood (LH), Simple
Langmuir–Hinshelwood (SLH, first order with respect to methane),
and Power Law (PL). Fig. 4 shows a comparison of the rates with
respect to Ni content (weight), note that the reaction rate is on a
logarithmic scale. LH1 is not included in the bottom plot, because
the expression is not valid for this gas composition. The large dif-
ference between the values in Fig. 4 may be caused by differences
in Ni particle size for the tested catalysts. The reported Ni particle
sizes for SOFC anodes are in the range 0.3–3 �m [9,35,73,79,86,83],
though Iwata et al. [83] report sintering up to 10 �m particles. The
Ni particles in the alumina supported catalyst used as the reference
have an average particle size of 6.7 nm [40]. The study by Bebelis
et al. [73] further reports small (10–20 nm) particles on top of large
particles. Hence, the rate expressions with respect to Ni content
are very system specific and as such, they should only be used in
connection with the system they have been measured on.
The reference (ref) refers to the kinetic expression reported by
Wei and Iglesia [40] over Ni on alumina support and allows com-
parison with the kinetics for catalysts related to industrial steam
reforming. In Figs. 5 and 6 the reforming rates per Ni area or per
cell area are compared, as expected, the values are much closer to
each other than those in Fig. 4, so a logarithmic scale is not suited
for comparing these values. Instead the two first plots represent the
same data, with the first plot being on a logarithmic scale to ease the
comparison with Fig. 4. The optimal comparison of catalytic reac-
tivity is with respect to active catalyst surface area. Unfortunately
only three studies on Ni-YSZ report the Ni surface area and one of
these, LH1, has an exceptionally high activation energy and is only
valid at one of the gas compositions that are used for comparison.
Fig. 4. Comparison of the reaction rate, at ambient pressure, of steam reforming over Ni-YSZ reported in literature with respect to nickel content: LH1 [73],SLH1 [9], PL1
[65], PL2 [125], Ref. [40].
131

34 D. Mogensen et al. / Journal of Power Sources 196 (2011) 25–38
Fig. 5. Comparison of the reaction rate, at ambient pressure, of steam reforming over Ni-YSZ reported in literature with respect to nickel surface area: LH1 [73],SLH1 [9],
SLH2 [79], Ref. [40].
Fig. 6. Comparison of the reaction rate, at ambient pressure, of steam reforming over Ni-YSZ reported in literature with respect to geometric anode surface area: LH1 [73],
PL2 [125], PL3 [124], SLH2 [79], SLH3 [109].
132

D. Mogensen et al. / Journal of Power Sources 196 (2011) 25–38 35
The reactivity predicted from these three expressions along with
the reference (Ni on alumina) is shown in Fig. 5. Obviously some
of the expressions that were orders of magnitudes apart in Fig. 4
are now relatively close, except for LH1 at high temperatures (note
that this anode is very thick). It is especially worth noticing that
the catalytic activity of the industrial catalyst is now very similar
to that of the anodes, in spite of the big difference in nickel parti-
cle size, i.e. the majority of the difference when comparing based
on mass is simply an effect of differences in Ni area. Only few of
the kinetic studies on catalytic steam reforming over SOFC anodes
explicitly report the Ni surface area, and if the Ni particle size is not
given either, then an estimation of the surface is also not possible.
When comparing the measurements given as activity pr. geo-
metric anode surface area as shown in Fig. 6, a surprisingly good
correspondence is seen, especially when considering that the Ni
content in these experiments range from 20 to 70 wt%. It should
be noticed that all expressions in this comparison were measured
over a planar cell structure, so it might not be valid for other con-
figurations or other anode materials very different from the ones
of the four studies.
The depth of the steam reforming reaction zone on Ni-YSZ
anodes has been reported to be in the range 0.15–0.30 mm at 900 ◦
C [129,133,135,136]. No systematic variation with anode thickness
is found in Fig. 5, there is, however, a tendency showing that thicker
anodes give higher activity. The thickest anode SLH3 (1.4 mm) gives
the highest rates pr. cell area and the thinnest anode LH1 (0.01 mm)
gives the second lowest rates, which indicates that the reaction
depth is larger than 0.01 mm. This is supported by the fact that the
thinnest anode, LH1, has the highest rate per nickel area in Fig. 5.
The rate expression that gives the lowest activity and deviates
most from the others is PL2, even though the anode used to deter-
mine this expression has a thickness of 40 �m, which is a medium
value for this comparison. The experiments underlying this rate
were conducted with a very high conversion of methane (85–96%).
This was taken into account in the data treatment by treating the
anode as an integral plug flow reactor, but because of the high con-
version the result are highly sensitive to small changes in the outlet
composition [125]. It is not reported whether or not the cooling of
the catalyst material was considered during data treatment. Note
also that the activation energy reported in this study is very low,
which could indicate that some mass transfer limitations are not
accounted for.
In future studies, the surface area of nickel should be deter-
mined, in order to both ease comparison with other experimental
studies and to increase the value of the measurements with respect
to SOFC modeling work. Until further experimental studies are
available, it is reasonable to use a kinetic expression from the gen-
eral Ni-based steam reforming or with respect to anode surface area
in a first, rough SOFC model. The relative good agreement between
rates measured on different anodes, means that these expressions
should result in reasonable results as also indicated from the model
work performed by Nagel et al. [137] where several different kinetic
expressions were used in the same model with similar results.
Hecht et al. [112] studied steam reforming kinetics over Ni-YSZ
by using a setup were the porous anode was supplied with methane,
water and carbon dioxide on one side and a mixture of water and
carbon dioxide on the other side. No dense electrolyte was present
in this setup. In this way steam reforming could be investigated
under SOFC conditions, including realistic diffusion through the
anode. The experimental results were compared to a dusty gas
model to describe diffusion and a system of 42 elementary reac-
tions to describe the reforming kinetics. The model results fitted
the measured data well indicating the suitability of the model. A
comparison of the elementary reactions and the other rate expres-
sions in Table 5 would be interesting, both with respect to the rate
and the reaction orders, but such a comparison is unfortunately
not possible. Special notice should be given to the experimental
setup used in this work, which is especially suited for measuring
steam reforming kinetics for Ni-YSZ in an anode structure. Further
experiments on this or similar setups would be valuable.
5. Water gas shift reaction
In SOFC modeling it is often assumed that the water gas shift
reaction is at equilibrium at all time. Little work has been conducted
to investigate this, but in several experimental works examining
steam reforming kinetics, it is outlined that the water gas shift
reaction was not at equilibrium [9,110,130,138,139]. Also Hecht
et al. [112] include the elementary reactions of the water gas shift
reaction in their model (see Section 4.4). Ahmed and Fger [138]
examines the approach to the equilibrium of the reverse water
gas shift reaction over a Ni/zirconia based anode. The inlet gas
contains H2 and CO2 at different concentrations representing dif-
ferent levels of fuel utilization in an SOFC, but anode size and flow
rates are not reported. The approach to equilibrium was defined as
100% · [1 − (PCO / PCO,eq − 1)] and is reported to be in the range 80-
90% for most fuel utilizations. A few works include an expression
for the water gas shift reaction rate [128,130] and the previously
described set of elementary reactions by Hecht et al. [112]. If the
water gas shift reaction is not at equilibrium, then the potentials of
the H2 oxidation and CO oxidation are not equal, which means that
the reaction with the highest potential will drive the other reac-
tion forward and thereby move the water gas shift reaction further
toward equilibrium. The resulting cell voltage will lie between the
two reaction potentials.
6. Modeling internal steam reforming
Modeling of SOFCs is being used widely, for a variety of dif-
ferent purposes. First of all there is the need for relative quick and
cheap testing of new configurations and stack designs [10,140–145]
as well as ideas for innovative system designs based on SOFCs
[146–154]. These are the classical reasons for modeling. For SOFCs
the further motivation comes from the fact that it is very diffi-
cult to measure the specific condition inside the cell or stack. Here
modeling is an invaluable tool to evaluate concentration and tem-
perature profiles and thereby to both avoid hotspots [155,156,126]
and to determine optimal operation conditions [20,113,157–160].
An equally important use of models is as a tool in research both
to interpret experimental observations [128,161,162] and to deter-
mine specific trouble areas where future research should be focused
[142,161,163].
A large number of SOFC models exist that include either partial
or complete internal steam reforming. A detailed rigorous model
of a complete SOFC stack is highly computational demanding, so
normally a SOFC model will focus on one aspect and models can
roughly be divided into three categories based on the focus of the
model.
Micromodels (electrode models) describe in great detail the cat-
alytic, electrochemical and gas phase reactions in the porous
electrodes, often taking into account mass and heat transfer effects
as well as electrical conduction. This type of model will normally
be one-dimensional and describes the performance of a cell in a
single point with known bulk concentrations, this can be used to
determine key issues for material research and micro structural
optimization [112,163,161].
Cell/stack models examine the changes in composition and tem-
perature in the gas channels of an SOFC and they will often
have a simplified description of the electrodes and electrolyte in
order to avoid excessive computations. These models are two- or
three-dimensional and can be used to evaluate concentration and
temperature profiles in the cell/stack, and thereby identify trou-
133

36 D. Mogensen et al. / Journal of Power Sources 196 (2011) 25–38
ble areas such as hotspots or areas with low S/C ratio. single sell
models can to some extent incorporate a micro structure model
[20,112,137,154,164–166].
System models describe the performance of a complete stack,
they are highly simplified and are normally focused on the interac-
tion of the stack with the surroundings. These models are zero- or
one-dimensional and intended to be incorporated in flow sheets in
order to evaluate and optimize complete systems which includes
an SOFC [167–172,7].
When modeling an SOFC with a significant amount of methane
in the inlet, the steam reforming kinetics will have a deciding influ-
ence on both the gas composition and the temperature profile both
of which are major parameters in determining both the local and
overall performance of the cell or stack. This means that micro
structure and cell/stack models need to have an accurate descrip-
tion of steam reforming in order to be accurate. System models will
often use a thermodynamic description, instead of kinetic expres-
sions to describe the effect of internal reforming [171,172].
Some models describe the reforming reaction by using assump-
tions such as: equilibrium at all time, or 75% of the remaining CH4 is
converted in each finite element [172–178]. This approach should
only be used for initial calculations for a new system or as an alter-
native to the thermodynamic description in system models.
The most widely used rate expression in SOFC modeling is
the one found by Achenbach and Riensche [109] (SLH3 in Fig. 6)
[7,20,137,154,161,163,165,166,179]. The Ni content was smaller
than typical in SOFCs (20% w/w on ZrO2), did not match the elec-
trochemical specifications of an SOFC anode and was rather thick.
From the comparison in Fig. 6 it can be seen that this expression
gives a reaction rate a bit higher than average, but it is a valid choice
for flow models.
Another rate expression, often used in modelling, is that found
by Lehnert et al. [128] given in entry 10, Table 5, for example in
modeling studies in Refs. [142–145,180–182]. It corresponds to the
expression by Xu and Froment [39] on industrial catalyst. It assumes
first order dependence both on methane and water. The latter is
rarely observed experimentally, especially at conditions relevant
for steam reforming in SOFCs (see Section 4).
In recent literature, several micro structural model works have
used a complete set of elementary reactions (42 reactions), with
separate kinetic expressions, to describe the catalyzed steam
reforming and water gas shift reactions [112,141,159,164,183]. The
accuracy of this type of models will primarily depend on how well
the gas diffusion and micro structure of the anode are described.
This method requires high computer power and since the kinetic
data sets are taken from different studies, a comparison with the
experimental data would be highly rewarding.
6.1. Recommendations
Until a consensus on the steam reforming kinetics is reached,
the best choice for a steam reforming rate expression for use in a
model is the use of a kinetic expression measured on the specific
cell under the reaction conditions that are relevant for the model,
as done by several research groups [112,126,135,162]. If this is not
possible, we recommend an expression with a reaction order of
methane close to 1, and EA around 100 kJ mol−1, possibly a bit lower.
The dependency of water is disputed, but it seems that if there is a
dependency it is slightly negative.
In micro structure models it is necessary to use a steam reform-
ing rate with respect to Ni surface area. Only few experimental
works report this for Ni-YSZ. There seems to be a close correlation
to industrial steam reforming for these kinetics and the thoroughly
examined expression reported by Wei and Iglesia [40] appears to
be a valid choice for this type of model, even though the study was
not performed on Ni-YSZ.
7. Conclusion
Optimal operation of SOFCs with internal steam reforming
requires that the steam reforming reaction and the electrochemical
reactions progress at similar rates. Order of magnitude calculations
show that at the temperatures targeted in SOFCs today (≈ 700 ◦C),
the difference between the rates are now so small that it should be
possible to lower the reforming rate to the same level as the electro-
chemical. Much work is being done on finetuning the SOFC anode
material in order to achieve this, and an elegant solution would be
to use the sulfur that is already present in the natural gas, to reduce
the internal reforming rate by blocking the active nickel step sites.
Unfortunately, sulfur increases the long-term degradation of the
cell voltage and therefore it may be more viable to block the step
sites with alkali metals. A completely different approach that also
seems promising is to replace some of the nickel with copper. This
seems to lower the catalytic activity, without having a significant
influence on cell performance and, furthermore, it increases the
resistance toward carbon poisoning. When considering this type of
work, it is important to keep in mind that the operating tempera-
ture of SOFCs is generally being lowered, so the finetuning of the
catalyst must be done with consideration to the intended operating
temperature.
Another approach for optimizing internal steam reforming uti-
lization is to carefully control the operating conditions so that
existing stacks can withstand the temperature gradients that arise.
This requires precise modeling, and therefore an overview of steam
reforming kinetics on SOFCs was given and discussed. There are
large differences in the reported steam reforming kinetics, which
is reflected by the number of kinetic expressions that exist for
both industrial steam reforming catalysts and on Ni-YSZ for SOFCs.
Recent improved understanding of the elementary steps by surface
science studies, in situ electron microscopy and DFT calculations
have given the possibility to give an atomic level view and to
develop micro structure models. These verify a strong positive
dependence on the partial pressure of methane and a negative
influence of water under conditions that are relevant for internal
steam reforming in SOFCs.
SOFC models incorporating internal steam reforming have only
recently been developed. Even though their number is rapidly
increasing they only use a few experimental data sets. Five stud-
ies were compared with respect to the geometric surface area of
the anode (Fig. 6). It is worth noticing that these anodes showed
similar overall reaction rates, in spite of relatively large structural
differences. Only three studies on Ni-YSZ could be compared with
respect to the surface area of nickel (Fig. 5). The comparison showed
a relatively good agreement, but nothing conclusive.
There is a surprising lack of detailed investigations of the cat-
alytic activity of Ni-YSZ with respect to steam reforming, where the
nickel surface area and particle size are reported and the common
practice for measuring catalytic activity is followed. Such thorough
experimental studies are needed to increase the precision of SOFC
models with internal steam reforming.
References
[1] A.D. Rao, G.S. Samuelsen, J. Eng. Gas Turbines Power 125 (2003) 59–66.[2] H. Itoh, M. Mori, N. Mori, T. Abe, J. Power Sources 49 (1994) 315–332.[3] E.M. Leal, J. Brouwer, J. Fuel Cell Sci. Technol. 3 (2006) 137–143.[4] I. EG&G Technical Services, Fuel Cell Handbook, seventh ed., U.S. Dep. Energy
Office of Fossil Energy Nat. Energy Technol. Lab., 2004.[5] J.V. Herle, Y. Membrez, O. Bucheli, J. Power Sources 127 (2004) 300–312.[6] C. Athanasiou, F. Coutelieris, E. Vakouftsi, V. Skoulou, E. Antonakou, G. Mar-
nellos, A. Zabaniotou, Int. J. Hydrogen Energy 32 (2007) 337–342.[7] M. Sucipta, S. Kimijima, K. Suzuki, J. Power Sources 174 (2007) 124–135.[8] N.F.P. Ribeiro, M.M.V.M. Souza, O.R.M. Neto, S.M.R. Vasconcelos, M. Schmal,
Appl. Catal. A 353 (2009) 305–309.[9] D.L. King, J.J. Strohm, X. Wang, H.-S. Roh, C. Wang, Y.-H. Chin, Y. Wang, Y. Lin,
R. Rozmiarek, P. Singh, J. Catal. 258 (2008) 356–365.
134

D. Mogensen et al. / Journal of Power Sources 196 (2011) 25–38 37
[10] H. Yong, D. Goodwin, J. Electrochem. Soc. 155 (2008) 666–674.[11] E. Nikolla, J.W. Schwank, S. Linic, Catal. Today 136 (2008) 243–248.[12] J.-M. Klein, M. Henault, P. Gelin, Y. Bultel, S. Georges, Electrochem. Solid-State
Lett. 11 (2008) 144.[13] I. Gavrielatos, V. Drakopoulos, S.G. Neophytides, J. Catal. 259 (2008) 75–84.[14] J. Rostrup-Nielsen, J. Hansen, S. Helveg, N. Christiansen, A.-K. Jannasch, Appl.
Phys. A 85 (2006) 427–430.[15] S. Georges, G. Parrour, M. Henault, J. Fouletier, Solid State Ionics 177 (2006)
2109–2112.[16] S. Douvartzides, F. Coutelieris, A. Demin, P. Tsiakaras, AIChE J. 49 (2003)
248–257.[17] J. Meusinger, Fuel Energy Abstr. 38 (1997) 408.[18] R. Peters, E. Riensche, P. Cremer, J. Power Sources 86 (2000) 432–441.[19] S. Douvartzides, P. Tsiakaras, Thermodyn. Energy Sources 24 (2002) 365–373.[20] P. Hendriksen, Proceedings of the Fifth International Symposium on Solid
Oxide Fuel Cells (SOFC-V), 1997, pp. 1319–1328.[21] J.R. Rostrup-Nielsen, Catal. Sci. Technol. 5 (1984) 1–117.[22] E. Ivers-Tiffe, A. Weber, D. Herbstritt, J. Eur. Ceram. Soc. 21 (2001) 1805–1811.[23] F. Tietz, Q. Fu, V. Haanappel, A. Mai, N. Menzler, S. Uhlenbruck, Int. J. Appl.
Ceram. Technol. 4 (2007) 436–445.[24] C. Sun, U. Stimming, J. Power Sources 171 (2007) 247–260.[25] F. Tietz, H.-P. Buchkremer, D. Stver, J. Electroceram. 17 (2006) 701–707.[26] W. Zhu, S. Deevi, Mater. Sci. Eng. A 362 (2003) 228–239.[27] S.P. Jiang, S.H. Chan, J. Mater. Sci. 39 (2004) 4405–4439.[28] P. Vernoux, M. Guillodo, J. Fouletier, A. Hammou, Solid State Ionics 135 (2000)
425–431.[29] I.V. Yentekakis, J. Power Sources 160 (2006) 422–425.[30] M. Kawano, T. Matsui, R. Kikuchi, H. Yoshida, T. Inagaki, K. Eguchi, J. Power
Sources 182 (2008) 496–502.[31] R. Kikuchi, N. Koashi, T. Matsui, K. Eguchi, T. Norby, J. Alloys Compd. (2006)
622–627.[32] B.C. Steele, A. Heinzel, Nature 414 (2001) 345–352.[33] F. Baumann, J. Fleig, G. Cristiani, B. Stuhlhofer, H. Habermeier, J. Maier, J.
Electrochem. Soc. 154 (2007) 931–941.[34] P. Gannon, S. Sofie, M. Deibert, R. Smith, V. Gorokhovsky, J. Appl. Electrochem.
39 (2009) 497–502.[35] M. Brown, S. Primdahl, M. Mogensen, J. Electrochem. Soc. 147 (2000) 475–
485.[36] J. Van herle, R. Ihringer, R. Vasquez Cavieres, L. Constantin, O. Bucheli, J. Eur.
Ceram. Soc. 21 (2001) 1855–1859.[37] N. Bodrov, L. Apel’Baum, M. Temkin, Kinet. Catal. 5 (1964) 614–622.[38] J. Sehested, Catal. Today 111 (2006) 103–110.[39] J. Xu, G.F. Froment, AIChE J. 35 (1989) 88–96.[40] J. Wei, E. Iglesia, J. Catal. 224 (2004) 370–383.[41] L.M. Aparicio, J. Catal. 165 (1997) 262–274.[42] I. Chorkendorff, J. Niemantsverdriet, Concepts of Modern Catalysis and Kinet-
ics, 2nd ed., Wiley-VCH, Germany, 2007.[43] A. Avetisov, J. Rostrup-Nielsen, V. Kuchaev, J.-H. Bak Hansen, A. Zyskin, E.
Shapatina, J. Mol. Catal. A: Chem. 315 (2010) 155–162.[44] I. Dybkjr, Fuel Process. Technol. 42 (1995) 85–107.[45] S.H. Lee, D.V. Applegate, S. Ahmed, S.G. Calderone, T.L. Harvey, Int. J. Hydrogen
Energy 30 (2005) 829–842.[46] D.-J. Liu, T.D. Kaun, H.-K. Liao, S. Ahmed, Int. J. Hydrogen Energy 29 (2004)
1035–1046.[47] J.R. Rostrup-Nielsen, J. Catal. 11 (1968) 220–227.[48] T. Iida, M. Kawano, T. Matsui, R. Kikuchi, K. Eguchi, J. Electrochem. Soc. 154
(2007) B234–B241.[49] R. Cunningham, C. Finnerty, R. Ormerod, Proceedings of the Fifth International
Symposium on Solid Oxide Fuel Cells (SOFC-V), 1997, pp. 973–982.[50] S.H. Clarke, A.L. Dicks, K. Pointon, T.A. Smith, A. Swann, Catal. Today 38 (1997)
411–423.[51] K. Eguchi, H. Kojo, T. Takeguchi, R. Kikuchi, K. Sasaki, Solid State Ionics 152-153
(2002) 411–416.[52] W. Sangtongkitcharoen, S. Assabumrungrat, V. Pavarajarn, N. Laosiripojana,
P. Praserthdam, J. Power Sources 142 (2005) 75–80.[53] K. Sasaki, Y. Teraoka, J. Electrochem. Soc. 150 (2003) 885–888.[54] R. Kikuchi, K. Eguchi, J. Jpn. Petrol. Inst. 47 (2004) 225–238.[55] K. Ke, A. Gunji, H. Mori, S. Tsuchida, H. Takahashi, K. Ukai, Y. Mizutani, H. Sumi,
M. Yokoyama, K. Waki, Solid State Ionics 177 (2006) 541–547.[56] Y. Hsiao, J. Selman, Proceedings of the Third International Symposium on Solid
Oxide Fuel Cells, 1993, pp. 895–903.[57] G. Janssen, J. de Jong, J. Huijsmans, Second European Solid Oxide Fuel Cell
Forum. Proceedings, vol. 1, 1996, pp. 163–172.[58] T. Takeguchi, Y. Kani, T. Yano, R. Kikuchi, K. Eguchi, K. Tsujimoto, Y. Uchida,
A. Ueno, K. Omoshiki, M. Aizawa, J. Power Sources 112 (2002) 588–595.[59] N. Laosiripojana, S. Assabumrungrat, J. Power Sources 163 (2007) 943–951.[60] S. Helveg, C. Lpez-Cartes, J. Sehested, P.L. Hansen, B.S. Clausen, J.R. Rostrup-
Nielsen, F. Abild-Pedersen, J.K. Norskov, Nature 427 (2004) 426–429.[61] H.S. Bengaard, J.K. Norskov, J. Sehested, B.S. Clausen, L.P. Nielsen, A.M. Molen-
broek, J.R. Rostrup-Nielsen, J. Catal. 209 (2002) 365–384.[62] O. Abild-Pedersen, F. Lytken, J. Engbk, G. Nielsen, I. Chorkendorff, J.K. Norskov,
Surf. Sci. 590 (2005) 127–137.[63] J. Rostrup-Nielsen, L. Christiansen, Appl. Catal. A 126 (1995) 381–390.[64] J.N. Kuhn, N. Lakshminarayanan, U.S. Ozkan, J. Mol. Catal. A 282 (2008) 9–21.[65] A. Lee, R. Zabransky, W. Huber, Eng. Chem. Res. 29 (1990) 766–773.[66] E. Nikolla, J. Schwank, S. Linic, J. Catal. 250 (2007) 85–93.
[67] C.M. Finnerty, R.H. Cunningham, R.M. Ormerod, Radiat. Eff. Def. Solids 151(1999) 77–81.
[68] H. Oudghiri-Hassani, S. Rakass, N. Abatzoglou, P. Rowntree, J. Power Sources171 (2007) 850–855.
[69] N.J. Coe, R.H. Cunningham, R.M. Ormerod, Catal. Lett. 49 (1997) 189–192.[70] Y. Lin, Z. Zhan, J. Liu, S.A. Barnett, Solid State Ionics 176 (2005) 1827–1835.[71] Y. Lin, Z. Zhan, S.A. Barnett, J. Power Sources 158 (2006) 1313–1316.[72] H. Zhu, A.M. Colclasure, R.J. Kee, Y. Lin, S.A. Barnett, J. Power Sources 161
(2006) 413–419.[73] S. Bebelis, A. Zeritis, C. Tiropani, S.G. Neophytides, Eng. Chem. Res. 39 (2000)
4920–4927.[74] B. Steele, I. Kelly, H. Middleton, R. Rudkin, Solid State Ionics 28-30 (1988)
1547–1552.[75] E. Perry Murray, T. Tsai, S. Barnett, Nature 400 (1999) 649–651.[76] E. Putna, J. Stubenrauch, J. Vohs, R. Gerte, Langmuir 11 (1995) 4832–4837.[77] Park, Vohs, Gorte, Nature 404 (2000) 265–267.[78] M. Mogensen, K. Kammer, Ann. Rev. Mater. Res. 33 (2003) 321–331.[79] M. Boder, R. Dittmeyer, J. Power Sources 155 (2006) 13–22.[80] D.J.L. Brett, A. Atkinson, N.P. Brandon, S.J. Skinner, Chem. Soc. Rev. 37 (2008)
1568–1578.[81] B. Zhu, Ionics 4 (1998) 435–443.[82] J. Akikusa, K. Adachi, K. Hoshino, T. Ishihara, Y. Takita, J. Electrochem. Soc. 148
(2001) A1275–A1278.[83] T. Iwata, J. Electrochem. Soc. 143 (1996) 1521–1525.[84] T. Kawada, N. Sakai, H. Yokokawa, M. Dokiya, M. Mori, T. Iwata, J. Electrochem.
Soc. 137 (1990) 3042–3047.[85] H. Itoh, T. Yamamoto, M. Mori, I. Horifa, N. Sakai, H. Yokokawa, M. Dokiya, J.
Electrochem. Soc. 144 (1997) 641–646.[86] D. Simwonis, F. Tietz, D. Stver, Solid State Ionics 132 (2000) 241–251.[87] H. Yokokawa, H. Tu, B. Iwanschitz, A. Mai, J. Power Sources 182 (2008)
400–412.[88] K. Sasaki, K. Susuki, A. Iyoshi, M. Uchimura, N. Imamura, H. Kusaba, Y. Teraoka,
H. Fuchino, K. Tsujimoto, Y. Uchida, N. Jingo, J. Electrochem. Soc. 153 (2006)2023–2029.
[89] S. Zha, Z. Cheng, M. Liu, J. Electrochem. Soc. 154 (2007) 201–206.[90] J.F. Rasmussen, A. Hagen, J. Power Sources 191 (2009) 534–541.[91] Z. Cheng, M. Liu, Solid State Ionics 178 (2007) 925–935.[92] J. Dong, Z. Cheng, S. Zha, M. Liu, J. Power Sources 156 (2006) 461–465.[93] Z. Cheng, S. Zha, M. Liu, J. Power Sources 172 (2007) 688–693.[94] Y. Matsuzaki, I. Yasuda, Solid State Ionics 132 (2000) 261–269.[95] J.B. Hansen, J. Rostrup-Nielsen, Handbook of Fuel Cells Vol. 6, John Wiley and
Sons Ltd, 2009.[96] M. Noponen, M. Halinen, J. Kiviaho, J. Saarinen, J. Fuel Cell Sci. Technol. 3
(2006) 438–444.[97] F. Silversand, J.B. Hansen, P.J. Jannasch, A.-K, The impact of sulphur, Fuel Cell
Seminar, Honululu Poster 111, 2000.[98] J. Rasmussen, A. Hagen, The effect of H2S on the performance of sofcs using
methane containing fuel, 2010.[99] K. Ledjeff, T. Rohrback, G. Schaumberg, Proc. 2nd Int. Symp. Solid Oxide Fuel
Cells, 1991, p. 323.[100] B. Ong, D. Mason, Fuel Cell Seminar Tuscon, 1986.[101] P. Vernoux, J. Guindet, E. Gehain, M. Kleitz, Proceedings of the Fifth Interna-
tional Symposium on Solid Oxide Fuel Cells (SOFC-V), 1997, pp. 219–227.[102] R. Gorte, P. Seungdoo, J. Vohs, W. Conghua, Adv. Mater. 12 (2000) 1465–1469.[103] O. Costa-Nunes, R.J. Gorte, J.M. Vohs, J. Power Sources 141 (2005) 241–249.[104] V.V. Krishnan, S. McIntosh, R.J. Gorte, J.M. Vohs, Solid State Ionics 166 (2004)
191–197.[105] S. Li, S. Wang, H. Nie, T.L. Wen, J. Solid State Electrochem. 11 (2007) 59–64.[106] U. Flesch, J. Meusinger, A. Naoumidis, D. Stover, Mater. Sci. Forum 308-311
(1999) 788–793.[107] H. Zhu, R.J. Kee, M.R. Pillai, S.A. Barnett, J. Power Sources 183 (2008) 143–150.[108] P. Aguiar, N. Lapena-Rey, D. Chadwick, L. Kershenbaum, Chem. Eng. Sci. 56
(2001) 651–658.[109] E. Achenbach, E. Riensche, J. Power Sources 52 (1994) 283–288.[110] R. Peters, R. Dahl, U. Klttgen, C. Palm, D. Stolten, J. Power Sources 106 (2002)
238–244.[111] N. Nakagawa, H. Sagara, K. Kato, J. Power Sources 92 (2001) 88–94.[112] E.S. Hecht, G.K. Gupta, H. Zhu, A.M. Dean, R.J. Kee, L. Maier, O. Deutschmann,
Appl. Catal. A 295 (2005) 40–51.[113] A. Dicks, K. Pointon, A. Siddle, J. Power Sources 86 (2000) 523–530.[114] G. Jones, J.G. Jakobsen, S.S. Shim, J. Kleis, M.P. Andersson, J. Rossmeisl, F.
Abild-Pedersen, T. Bligaard, S. Helveg, B. Hinnemann, J.R. Rostrup-Nielsen,I. Chorkendorff, J. Sehested, J.K. Norskov, J. Catal. 259 (2008) 147–160.
[115] D.W. Blaylock, T. Ogura, W.H. Green, G.J.O. Beran, J. Phys. Chem. C 113 (2009)4898–4908.
[116] J. Wei, E. Iglesia, Phys. Chem. Chem. Phys. 6 (2004) 3754–3759.[117] J. Wei, E. Iglesia, J. Phys. Chem. B 108 (2004) 7253–7262.[118] J. Wei, E. Iglesia, Angew. Chem. 116 (2004) 3771.[119] J. Wei, E. Iglesia, J. Catal. 225 (2004) 116–127.[120] J. Wei, E. Iglesia, J. Phys. Chem. B 108 (2004) 40944103.[121] P. Mnster, H. Grabke, J. Catal. 72 (1981) 279–287.[122] V.D. Belyaev, T.I. Politova, O.A. Mar’ina, V.A. Sobyanin, Appl. Catal. A 133
(1995) 47.[123] H. Timmermann, D. Fouquet, A. Weber, E. Ivers-Tiffee, U. Hennings, R. Reimert,
Fuel Cells 6 (2006) 307–313.[124] K. Ahmed, K. Foger, Catal. Today 63 (2000) 479–487.
135

38 D. Mogensen et al. / Journal of Power Sources 196 (2011) 25–38
[125] R. Odegard, E. Johnsen, H. Karoliussen, Proceedings of the Fourth InternationalSymposium on Solid Oxide Fuel Cells (SOFC-IV), 1995, pp. 810–819.
[126] H. Yakabe, T. Ogiwara, M. Hishinuma, I. Yasuda, J. Power Sources 102 (2001)144–154.
[127] A. Dicks, J. Power Sources 71 (1998) 111–122.[128] W. Lehnert, J. Meusinger, F. Thom, J. Power Sources 87 (2000) 57–63.[129] I. Drescher, W. Lehnert, J. Meusinger, Electrochim. Acta 43 (1998) 3059–3068.[130] R. Leinfelder, Reaktionskinetische untersuchung zur methan-
dampf-reformierung und shift-reaktion an anoden oxidkeramischerbrennstoffzellen, Ph.D. Thesis, Der Technischen Fakultät der UniversittErlangen-Nürnberg, 2004.
[131] Z. Yu, S.S.C. Chuang, Appl. Catal. A 327 (2007) 147–156.[132] I. Yentekakis, S. Neophytides, A. Kaloyiannis, C. Vayenas, Proceedings of the
Third International Symposium on Solid Oxide Fuel Cells, 1993, pp. 904–912.[133] J. Meusinger, E. Riensche, U. Stimming, J. Power Sources 71 (1998) 315–320.[134] R. Barfod, A. Hagen, S. Ramousse, P. Hendriksen, M. Mogensen, Fuel Cells 6
(2006) 141–145.[135] W. Lehnert, J. Meusinger, E. Riensche, U. Stimming, Second European Solid
Oxide Fuel Cell Forum. Proceedings, vol.1, 1996, pp. 143–152.[136] J. Divisek, W. Lehnert, J. Meusinger, U. Stimming, Electrochem. Proc., 97-40,
1997, pp. 993–1002.[137] F.P. Nagel, T.J. Schildhauer, S.M.A. Biollaz, S. Stucki, J. Power Sources 184
(2008) 129–142.[138] K. Ahmed, K. Fger, J. Power Sources 103 (2001) 150–153.[139] M. Poppinger, H. Landes, Ionics 7 (2001) 7–15.[140] P. Costamagna, A. Selimovic, M. Del Borghi, G. Agnew, Chem. Eng. J. 102 (2004)
61–69.[141] Y. Hao, D. Goodwin, J. Electrochem. Soc. 154 (2007) 207–217.[142] B. Morel, J. Laurencin, Y. Bultel, F. Lefebvre-Joud, J. Electrochem. Soc. 152
(2005) A1382–A1389.[143] B.A. Haberman, J.B. Young, Int. J. Heat Mass Transf. 47 (2004) 3617–3629.[144] J.-M. Klein, Y. Bultel, S. Georges, M. Pons, Chem. Eng. Sci. 62 (2007) 1636–1649.[145] J.M. Klein, S. Georges, Y. Bultel, J. Electrochem. Soc. 155 (2008) B333–B339.[146] H. Ringel, J. Schule, D. Grunwald, Proceedings of the Fifth International Sym-
posium on Solid Oxide Fuel Cells (SOFC-V), 1997, pp. 124–132.[147] E. Riensche, J. Meusinger, U. Stimming, G. Unverzagt, J. Power Sources 73
(1998) 251–256.[148] E. Riensche, J. Meusinger, U. Stimming, G. Unverzagt, J. Power Sources 71
(1998) 306–314.[149] J. Palsson, A. Selimovic, L. Sjunnesson, J. Power Sources 86 (2000) 442–448.[150] A. Selimovic, J. Palsson, J. Power Sources 106 (2002) 76–82.[151] P. Nehter, J. Power Sources 157 (2006) 325–334.[152] S. Chan, H. Ho, O. Ding, Fuel Cells 5 (2005) 25–33.[153] S. Chan, O. Ding, Int. J. Hydrogen Energy 30 (2005) 167–179.[154] K. Nikooyeh, A.A. Jeje, J.A. Hill, J. Power Sources 171 (2007) 601–609.
[155] A. Selimovic, Y. Jinliang, M. Rokni, B. Sunden, J. Palsson, T. Torisson, L. Sjunnes-son, Fourth European Solid Oxide Fuel Cell Forum. Proceedings, vol.1, 2000,pp. 403–412.
[156] A. Selimovic, M. Kemm, T. Torisson, M. Assadi, J. Power Sources 145 (2005)463–469.
[157] C. Bleise, J. Divisek, B. Steffen, U. Konig, J. Schultze, Proceedings of the ThirdInternational Symposium on Solid Oxide Fuel Cells, 1993, pp. 861–867.
[158] E. Achenbach, J. Power Sources 57 (1995) 105–109.[159] H. Zhu, R.J. Kee, V.M. Janardhanan, O. Deutschmann, D.G. Goodwin, J. Elec-
trochem. Soc. 152 (2005) A2427–A2440.[160] H. Karoliussen, K. Nisancioglu, A. Solheim, R. Odegard, Proceedings of the
Third International Symposium on Solid Oxide Fuel Cells, 1993, pp. 868–877.[161] S. Sunde, P. Hendriksen, Proceedings of the Fifth International Symposium on
Solid Oxide Fuel Cells (SOFC-V), 1997, pp. 1329–1338.[162] E. Edwin, H. Karoliussen, R. Odegard, Proceedings of the Fifth International
Symposium on Solid Oxide Fuel Cells (SOFC-V), 1997, pp. 833–843.[163] S. Sunde, J. Electroceram. 5 (2000) 153–182.[164] V.M. Janardhanan, O. Deutschmann, J. Power Sources 162 (2006) 1192–1202.[165] A. Selimovic, Solid oxide Fuel Cell Modelling for sofc/gas Turbine Combined
Cycle Simulations, Ph.D. Thesis, Lund Institute of Technology, 2000.[166] S. Campanari, P. Iora, Fuel Cells 5 (2005) 34–51.[167] R. Bove, P. Lunghi, N.M. Sammes, Int. J. Hydrogen Energy 30 (2005) 181–187.[168] R. Bove, P. Lunghi, N.M. Sammes, Int. J. Hydrogen Energy 30 (2005) 189–200.[169] J. Saarinen, M. Halinen, J. Ylijoki, M. Noponen, P. Simell, J. Kiviaho, J. Fuel Cell
Sci. Technol. 4 (2007) 397–405.[170] T.F. Petersen, N. Houbak, B. Elmegaard, Int. J. Thermodyn. 9 (2006) 161–169.[171] A.K. Demin, V. Alderucci, I. Ielo, G.I. Fadeev, G. Maggio, N. Giordano, V.
Antonucci, Int. J. Hydrogen Energy 17 (1992) 451–458.[172] S.H. Chan, H.K. Ho, Y. Tian, Int. J. Hydrogen Energy 28 (2003) 889–900.[173] H. Apfel, M. Rzepka, H. Tu, U. Stimming, J. Power Sources 154 (2006) 370–378.[174] R.W. Sidwell, W.G. Coors, J. Power Sources 143 (2005) 166–172.[175] M. Pfafferodt, P. Heidebrecht, M. Stelter, K. Sundmacher, J. Power Sources 149
(2005) 53–62.[176] K. Ahmed, Y. Ramprakash, K. Foger, Fourth Eur. Solid Oxide Fuel Cell Forum.
Proc vol.1, 2000, pp. 315–324.[177] V. Antonucci, N. Giordano, P. Antonucci, E. Arato, P. Costamagna, G. Rocchini,
A. Demin, Proc. Fourth Int. Symp. Solid Oxide Fuel Cells (SOFC-IV), 1995, pp.820–828.
[178] P. Costamagna, E. Arato, P. Antonucci, V. Antonucci, Chem. Eng. Sci. 51 (1996)3013–3018.
[179] E. Achenbach, J. Power Sources 49 (1994) 333–348.[180] R.S. Gemmen, J. Trembly, J. Power Sources 161 (2006) 1084–1095.[181] M. Ni, D.Y.C. Leung, M.K.H. Leung, J. Power Sources 183 (2008) 133–142.[182] M. Ni, D.Y.C. Leung, M.K.H. Leung, J. Power Sources 183 (2008) 668–673.[183] H. Zhu, R.J. Kee, J. Power Sources 169 (2007) 315–326.
136

Article II
Article in preparation
137

Methane Steam Reforming over Ni-YSZ Solid Oxide Fuel Cell Anode SupportMaterial: Intrinsic Kinetics and Dynamic Behavior
D. Mogensena,∗, J-D. Grunwaldta,b, P. V. Hendriksenc, J. U. Nielsend, K. Dam-Johansena
aDepartment of Chemical and Biochemical Engineering, Technical University of Denmark, Søltofts Plads Building 229, DK-2800 Kgs. Lyngby,Denmark
bPresent adress: Institute for Chemical Technology and Polymer Chemistry, Karlsruhe Institute of Technology (KIT), Engesserstrasse 20,D-76131 Karlsruhe, Germany
cRisoe National Laboratory for Sustainable Energy, Technical University of Denmark, Frederiksborgvej 399, DK-4000 Roskilde, DenmarkdTopsoe Fuel Cell, Nymøllevej 66, DK-2800 Lyngby, Denmark
Abstract
The reaction rate of methane steam reforming over Ni-YSZ anode material for SOFCs has been investigated in apacked bed reactor on two different Ni-YSZ samples. The measurements were performed in the temperature range600-800◦C and variations in the partial pressure of all reactants and products were studied. In agreement with otherkinetic measurements reported in literature, it was found that the steam reforming rate was mostly first order inmethane concentration. Hence, the methane dissociation is the rate limiting step. Slight dependencies of other gaseswere also observed, all other than CO were described adequately by an approach to equilibrium. The CO dependencywas described by an adsorption term, which does only have a significant effect at low temperatures.
Furthermore, a previously unreported dynamic behavior of the reaction rate was observed. In particular, a slowdeactivation over several days after startup, and a complete regain of the original activity after operation withoutmethane. These dynamic effects did not only effect the reaction rate, but also the activation energy. The extent of thisbehavior has been examined closer and samples of Ni-YSZ were subjected to different defined reaction conditionsand examined with several characterization techniques. The investigations did not give a conclusive explanation forthe dynamic behavior of the catalyst. It is tentatively ascribed to changes in the catalyst structure.
Keywords: Steam reforming, Kinetics, SOFC, Ni-YSZ, TEM, XRD, EXAFS, HT-22970
1. Introduction
The steam reforming reaction (Reaction 1) is highlyendothermic with a reaction enthalpy of 206 kJ/mol at25◦C, whereas the water gas shift reaction (Reaction 2)occurring simultaneously is slightly exothermic with areaction enthalpy of -41 kJ/mol at 25 ◦C [1].
CH4 + H2O � 3H2 +CO (1)
CO + H2O � CO2 + H2 (2)
When having partial internal steam reforming in anSOFC, the waste heat from the electrochemical reac-tions is used to supply the energy for the endothermic
∗Corresponding author, Tel.: +45 4525 2845, fax: +45 4588 2258,
Email address: [email protected] (K. Dam-Johansen)
reforming reaction. This also decreases the need forcooling of the SOFC stack, which is normally obtainedthrough a high air flow at the cathode side. Reducing therequired air flow and using waste heat for the steam re-forming significantly increase the overall efficiency ofthe SOFC system and thereby reduces cost, of opera-tion.
A literature review of studies of internal steam re-forming in SOFCs has been published recently [2].With the present SOFC technology and operating tem-peratures, the steam reforming reaction is much fasterthan the electrochemical reactions. This means that in-ternal steam reforming causes rapid cooling at the anodeinlet, resulting in large temperature gradients, reducedefficiency and even, in some cases, physical destructionof the cell due to mechanical stress caused by the largetemperature gradient.
Preprint submitted to Journal of Power Sources May 1, 2011
138
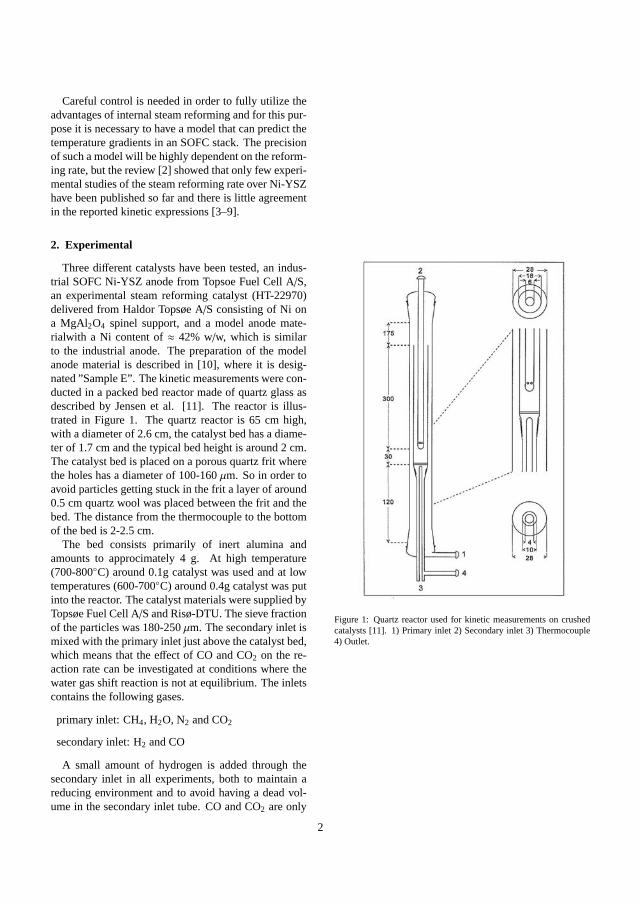
Careful control is needed in order to fully utilize theadvantages of internal steam reforming and for this pur-pose it is necessary to have a model that can predict thetemperature gradients in an SOFC stack. The precisionof such a model will be highly dependent on the reform-ing rate, but the review [2] showed that only few experi-mental studies of the steam reforming rate over Ni-YSZhave been published so far and there is little agreementin the reported kinetic expressions [3–9].
2. Experimental
Three different catalysts have been tested, an indus-trial SOFC Ni-YSZ anode from Topsoe Fuel Cell A/S,an experimental steam reforming catalyst (HT-22970)delivered from Haldor Topsøe A/S consisting of Ni ona MgAl2O4 spinel support, and a model anode mate-rialwith a Ni content of ≈ 42% w/w, which is similarto the industrial anode. The preparation of the modelanode material is described in [10], where it is desig-nated ”Sample E”. The kinetic measurements were con-ducted in a packed bed reactor made of quartz glass asdescribed by Jensen et al. [11]. The reactor is illus-trated in Figure 1. The quartz reactor is 65 cm high,with a diameter of 2.6 cm, the catalyst bed has a diame-ter of 1.7 cm and the typical bed height is around 2 cm.The catalyst bed is placed on a porous quartz frit wherethe holes has a diameter of 100-160 μm. So in order toavoid particles getting stuck in the frit a layer of around0.5 cm quartz wool was placed between the frit and thebed. The distance from the thermocouple to the bottomof the bed is 2-2.5 cm.
The bed consists primarily of inert alumina andamounts to approcimately 4 g. At high temperature(700-800◦C) around 0.1g catalyst was used and at lowtemperatures (600-700◦C) around 0.4g catalyst was putinto the reactor. The catalyst materials were supplied byTopsøe Fuel Cell A/S and Risø-DTU. The sieve fractionof the particles was 180-250 μm. The secondary inlet ismixed with the primary inlet just above the catalyst bed,which means that the effect of CO and CO2 on the re-action rate can be investigated at conditions where thewater gas shift reaction is not at equilibrium. The inletscontains the following gases.
primary inlet: CH4, H2O, N2 and CO2
secondary inlet: H2 and CO
A small amount of hydrogen is added through thesecondary inlet in all experiments, both to maintain areducing environment and to avoid having a dead vol-ume in the secondary inlet tube. CO and CO2 are only
Figure 1: Quartz reactor used for kinetic measurements on crushedcatalysts [11]. 1) Primary inlet 2) Secondary inlet 3) Thermocouple4) Outlet.
2
139

added in the experiments that investigate the influenceof these species. The water is supplied by leading ni-trogen through a heated bubble flask which is kept at80◦C.
Gas flows are controlled with Mass Flow Controllers(MFC) of the type ”LOW ΔP FLOW” and ”EL-FLOW”from Bronkhorst HI-TEC. The MFCs has analogue con-trol and are controlled with a Gilibrator 2 soap bub-ble flow meter from Gilian with a specified measuringrange of 20-6000 ml/min Temperature measurementswere made with K-type thermo couples.
Two IR-analyzers of the type NGA 2000 MLT An-alyzer from Fisher-Rosemount, were used interchange-ably for gas analysis. The analyzers only measure COand CO2 contents, the contents of the other species werecalculated from a mass balance. The accuracy of thismethod was tested by measuring all gas concentrationsin an offline gas chromatograph and the deviation wasfound to be less than 3% relative error. The analyzershave a measurement error of 1% of the given measuringlimit.
All samples were reduced by the same procedure:Heating to 860◦C in N2. At 860◦C the gas was changedto 20% H2 in N2 for at least 4 hours, hereafter the sam-ple was cooled to the test temperature and catalytic mea-surements were started. The standard flow in the experi-ments was 2 Nl/min and Table 1 shows the standard gascomposition as well as the range in which each gas isvaried.
Table 1: Overview of the gas composition at standard conditions andthe range each gas is varied in.
Gas Standard rangekPa kPa
CH4 16 8-20H2O 33 24-39H2 8 8-24CO 0 0-8CO2 0 0-8
In order to test for mass transport effects, both parti-cle size and total gas flow was varied, neither of thesechanges had a significant effect on the reactivity, andmass transport limitations is therefore assumed to benegligible. The efficiency of the heat transfer was es-timated by comparing the measured temperature at sim-ilar conditions with and without steam reforming takingplace, and it is estimated that the temperature gradientover the bed is < 5oC. The majority of the measure-ments had a methane conversion between 5 and 10%mole/mole and all were in the range 4-15% and during
data treatment it was assumed that the partial pressureswere constant in the bed, using an average value of theinlet and outlet concentrations. A blind test was madewhere the reactor was loaded with quartz wool and thealumina powder used to dilute the catalyst material. Theinert material was treated according to the standard pro-cedure, including reduction procedure, and no activitywas observed.
The oxidation state and average coordination num-ber of the Ni particles was determined by X-ray absorp-tion spectroscopy (XAS) in transmission mode at theANKA-XAS beamline at Karlsruhe Institute of Tech-nology (KIT). The spectra were recorded around theNi K-edge between 8.2 keV and 9.4 keV. The raw datawere energy-calibrated, background corrected, and nor-malised using the WinXAS 3.0 software [12]. Furtherthe data were Fourier-transformed in k-space between3 and 15 Å−1. Data fitting was performed in R-spaceon the Fourier transformed k3-weighted EXAFS func-tions (Fourier transform in the range 3.0 - 15 Å−1, S2
0= 0.825). Theoretical scattering amplitudes and phaseshifts of the Ni-Ni and the Ni-O shell (only first shell)were calculated using the FEFF code [13].
3. Dynamic Behavior
During the kinetic measurements, it was observedthat the catalytic steam reforming activity of Ni-YSZexhibits a long term dynamic behavior under differentoperating conditions.
At 750◦C and low methane concentrations an initialrapid activation of the catalyst was followed by a shortdeactivation period, see Figure 2(a), which is normalcatalyst behavior. However, after a few hours of appar-ent steady state, the catalyst was slowly reactivated overa period of several days as shown in Figure 2(b).
In his thesis work, J.G. Jakobsen [14] reported a sim-ilar behavior for steam reforming over 5% Rhodium ona MgAlO4 support although this occured significantlyfaster and was seen at 500-600◦C during a temperaturecycle instead of stable operation.
Figure 3 shows two startups similar to those in Fig-ures 2(a) and 2(b), but at high methane concentrationand T = 640◦C and 750◦C, respectively. Here it is seenthat there is a long deactivation period (just over oneweek at low temperature) and no subsequent reactiva-tion was observed.
A slow approach to steady state was also observed af-ter a change in hydrogen concentration. For all gases ex-cept hydrogen, a new steady state was achieved rapidlyafter a concentration change. After a change in hydro-
3
140

Figure 2: Approach to steady state after startup over crushed anodematerial in the packed bed reactor at T = 750oC and low methaneconcentration ≈ 7.3 kPa. (a) The first 4 hours, (b) on a longer timescale.
Figure 3: Approach to steady state after startup over crushed anodematerial in the packed bed reactor at two different temperatures andhigh methane concentration.(a) 640◦C (b) 740◦C
4
141

gen concentration it took several hours, or even days toachieve a new steady state, depending on temperature.
Similar tests were made with the experimental steamreforming catalyst (HT-22970) from Haldor Topsøe A/Sand no long term dynamic effect was observed. First ofall this shows that the observed dynamic effects is anactual property of the catalyst, not an effect from thesetup or experimental method. Secondly it means thatthe dynamic effect is either caused by the support mate-rial, Yttria stabilized Zirconia, interactions between thesupport and catalyst, or by the fact that the SOFC anodecontains very large Ni-particles with diameters up to 2um.
Furthermore, it was found that the activity that islost during the stabilization period could be regained bypassing a water rich gas (including H2) through the cat-alyst bed with no methane in the gas. In Figure 4 it isshown that 1 hour exposure to a water rich gas did nothave any effect, but 16 hours exposure resulted in morethan a doubling of the catalytic activity.
0 10 20 30 40 50 60 700
1
2
3
4
5
6
7
8
Time [min]
Con
cent
ratio
n [m
ole%
]
start1 hour without CH416 hours without CH4
Figure 4: A test of the reactivation of catalytic activity of Ni-YSZin the packed bed reactor with crushed anode material. T = 790◦C,PCH4 =15 kPa, PH2O = 30 kPa, PH2 = 7 kPa. The three plots show thesum of CO and CO2 in the outlet for the catalyst after rate determina-tion experiments, and after respectively 1 hour and 16 hours with nomethane in a water rich environment.
Three explanations for the long-term dynamic behav-ior exhibited by Ni-YSZ when used as a steam reform-ing catalyst were considered on the basis of literature: 1)Poisoning of the catalyst surface [15–17]. 2) Changes inNi particle size, by formation of Ni nano particles andsubsequent sintering [5, 18]. 3) Changes in Ni particlesphericity resulting in a change in the number of stepsites, which has been shown to account for the majorityof the catalytic activity [17, 19–21].
4. Characterization of Ni-YSZ Model catalyst
In order to examine the different possible explana-tions for the catalyst behavior, four samples of themodel Ni-YSZ catalyst were prepared for characteriza-tion. The first was an as-sintered sample. The secondsample was reduced. The third sample was reduced,and then run at standard gas conditions at 800◦C untilthe activity was stable. The fourth sample was reduced,stabilized as the second sample and then subject to a gasconsisting of 7.6% H2, 31.5% H2O and balance N2 at atotal pressure of 1.1 bar for 16 hours at 800◦C in or-der to achieve the regain of activity shown in Figure 4.These samples were not diluted by inert material duringoperation.
The samples were first examined with Scanning Elec-tron Microscopy (SEM), which indicated that the sam-ples had different particle size distributions, but the re-sults were not conclusive. Because of this, further ex-aminations were made with Transmission Electron Mi-croscopy (TEM), as described in Section 4.1. It shouldbe noted that it was necessary to crush the samples fur-ther down prior to investigation with TEM. The sam-ples were also studied with low-voltage scanning elec-tron microscopy, by courtesy of Karl Thyden from Risø-DTU, the method for this technique has preciously beendescribed by Thyden et al. [22]. The overall structureof the samples were found to be very similar both toeach other and to a standard SOFC anode from Risø-DTU, meaning that any structural differences betweenthe samples must be found on the nano scale. Clusters ofnano scale particles were also observed, in accordancewith the trends found in the TEM images as describedin Section 4.1.
Because of the large span in Ni particle size (2 nm to>1 μm) it is impractical to determine the particle sizedistribution from microscopy. It was instead attemptedto obtain an average crystallite size from X-Ray Diffrac-tion (XRD) by using the Scherrer formula. The averageNi crystallite size were found to be in the range 200-300nm. Within the experimental uncertainty no differencein the Ni crystallite size could be detected in the differ-ent samples. The XRD patterns did however show thatthere as expected was no crystalline NiO present in anyof the reduced samples.
4.1. Transmission Electron MicroscopyIn addition to the TEM images, dark field imaging
was used to ease the observation of small particles.Some of the particles were also investigated by Energy-dispersive X-ray spectroscopy (EDX), in order to distin-guish between Ni (or NiO) and YSZ particles. The areas
5
142
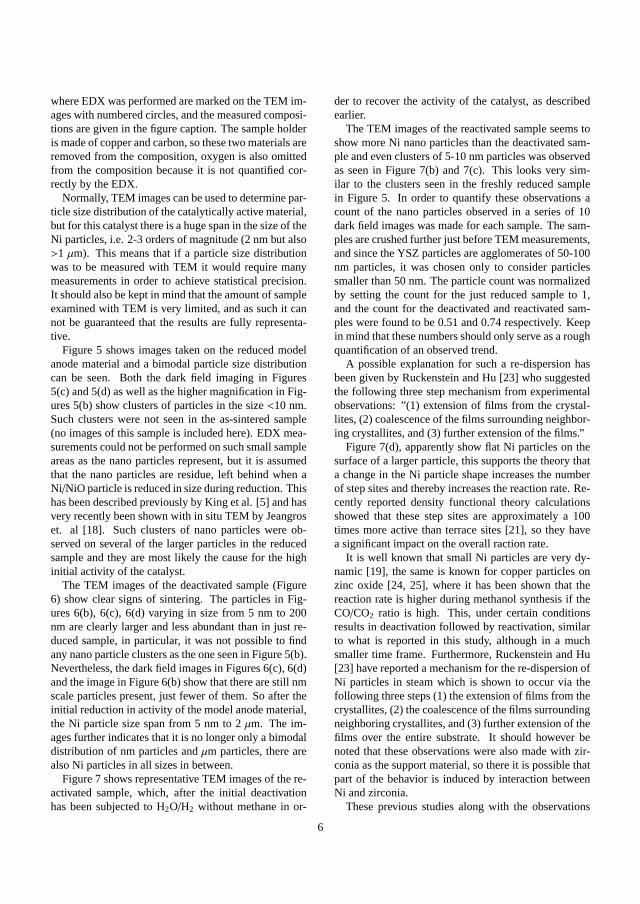
where EDX was performed are marked on the TEM im-ages with numbered circles, and the measured composi-tions are given in the figure caption. The sample holderis made of copper and carbon, so these two materials areremoved from the composition, oxygen is also omittedfrom the composition because it is not quantified cor-rectly by the EDX.
Normally, TEM images can be used to determine par-ticle size distribution of the catalytically active material,but for this catalyst there is a huge span in the size of theNi particles, i.e. 2-3 orders of magnitude (2 nm but also>1 μm). This means that if a particle size distributionwas to be measured with TEM it would require manymeasurements in order to achieve statistical precision.It should also be kept in mind that the amount of sampleexamined with TEM is very limited, and as such it cannot be guaranteed that the results are fully representa-tive.
Figure 5 shows images taken on the reduced modelanode material and a bimodal particle size distributioncan be seen. Both the dark field imaging in Figures5(c) and 5(d) as well as the higher magnification in Fig-ures 5(b) show clusters of particles in the size <10 nm.Such clusters were not seen in the as-sintered sample(no images of this sample is included here). EDX mea-surements could not be performed on such small sampleareas as the nano particles represent, but it is assumedthat the nano particles are residue, left behind when aNi/NiO particle is reduced in size during reduction. Thishas been described previously by King et al. [5] and hasvery recently been shown with in situ TEM by Jeangroset. al [18]. Such clusters of nano particles were ob-served on several of the larger particles in the reducedsample and they are most likely the cause for the highinitial activity of the catalyst.
The TEM images of the deactivated sample (Figure6) show clear signs of sintering. The particles in Fig-ures 6(b), 6(c), 6(d) varying in size from 5 nm to 200nm are clearly larger and less abundant than in just re-duced sample, in particular, it was not possible to findany nano particle clusters as the one seen in Figure 5(b).Nevertheless, the dark field images in Figures 6(c), 6(d)and the image in Figure 6(b) show that there are still nmscale particles present, just fewer of them. So after theinitial reduction in activity of the model anode material,the Ni particle size span from 5 nm to 2 μm. The im-ages further indicates that it is no longer only a bimodaldistribution of nm particles and μm particles, there arealso Ni particles in all sizes in between.
Figure 7 shows representative TEM images of the re-activated sample, which, after the initial deactivationhas been subjected to H2O/H2 without methane in or-
der to recover the activity of the catalyst, as describedearlier.
The TEM images of the reactivated sample seems toshow more Ni nano particles than the deactivated sam-ple and even clusters of 5-10 nm particles was observedas seen in Figure 7(b) and 7(c). This looks very sim-ilar to the clusters seen in the freshly reduced samplein Figure 5. In order to quantify these observations acount of the nano particles observed in a series of 10dark field images was made for each sample. The sam-ples are crushed further just before TEM measurements,and since the YSZ particles are agglomerates of 50-100nm particles, it was chosen only to consider particlessmaller than 50 nm. The particle count was normalizedby setting the count for the just reduced sample to 1,and the count for the deactivated and reactivated sam-ples were found to be 0.51 and 0.74 respectively. Keepin mind that these numbers should only serve as a roughquantification of an observed trend.
A possible explanation for such a re-dispersion hasbeen given by Ruckenstein and Hu [23] who suggestedthe following three step mechanism from experimentalobservations: ”(1) extension of films from the crystal-lites, (2) coalescence of the films surrounding neighbor-ing crystallites, and (3) further extension of the films.”
Figure 7(d), apparently show flat Ni particles on thesurface of a larger particle, this supports the theory thata change in the Ni particle shape increases the numberof step sites and thereby increases the reaction rate. Re-cently reported density functional theory calculationsshowed that these step sites are approximately a 100times more active than terrace sites [21], so they havea significant impact on the overall raction rate.
It is well known that small Ni particles are very dy-namic [19], the same is known for copper particles onzinc oxide [24, 25], where it has been shown that thereaction rate is higher during methanol synthesis if theCO/CO2 ratio is high. This, under certain conditionsresults in deactivation followed by reactivation, similarto what is reported in this study, although in a muchsmaller time frame. Furthermore, Ruckenstein and Hu[23] have reported a mechanism for the re-dispersion ofNi particles in steam which is shown to occur via thefollowing three steps (1) the extension of films from thecrystallites, (2) the coalescence of the films surroundingneighboring crystallites, and (3) further extension of thefilms over the entire substrate. It should however benoted that these observations were also made with zir-conia as the support material, so there it is possible thatpart of the behavior is induced by interaction betweenNi and zirconia.
These previous studies along with the observations
6
143

(a) 10) 7.2% Y, 92.8% Zr 11) 6.61% Y, 93.4% Zr 12) 17.6%Ni, 5.5% Y 76.9% Zr 13) 34.1% Ni, 3.8% Y, 62.1% Zr.
(b) Zoom of particle 11 in Figure 5(a).
(c) dark field imaging of particle 11 in Figure 5(a). (d) Dark field image of reduced Ni-YSZ particle.
Figure 5: TEM images of a reduced sample of the model anode material.
made in the TEM images shown here, leads to the con-clusion that the dynamic behavior of Ni-YSZ is mostlikely caused by a combination of three types of restruc-turing, i.e. sintering, re-dispersion and changes in parti-cle shape, changing the amount of the highly active stepsites.
4.2. X-ray Absorption SpectroscopyThe X-ray absorption near edge spectroscopy
(XANES) data are given in Figure 8. They show that thespectrum of the Ni-YSZ fuel cell anodes is very similarto nickel foil and even after exposure to air most of the
nickel is in reduced state ( >97%). Also the wiggly part(EXAFS region) is very similar to the pure nickel foilindicating large nickel particles as observed in transmis-sion electron microscopy. However, Figure 8(b) showsthat the backscattering is smaller in the Fourier trans-formed EXAFS spectra, which is especially fine for thereactivated catalyst.
This is also reflected in the Fourier transformed EX-AFS data, see Figure 8(b), where not only first shell butalso the high Ni shells are well observed. The backscat-tering is highest in the reduced and the deactivated Ni-YSZ sample. This supports that restructuring occurs
7
144

(a) 7) 94.0% Ni, 5.6% Zr 0.4% Y 8) 65.5% Ni, 31.9% Zr2.6% Y 9) 10.2% Ni, 84.1% Zr 5.7% Y
(b) Zoom of the top part of EDX measurement 7 in Figure6(a).
(c) dark field image of the particle in Figure 6(a). (d) dark field image of deactivated Ni-YSZ particle.
Figure 6: TEM images of a deactivated sample of the model anode material.
Table 2: Fit of the EXAFS data at the Ni K-edge. CN: coordinationnumber; R: interatomic distance; σ2: Debye Waller factor; ΔE0: en-ergy shift.
sample CN R σ2 ΔE0 ResidualÅ Å2 eV %
Ni foil 12 2.849 0.0055 7.6 -reduced 10.9 2.483 0.0065 6.4 1.8
deactivated 9.8 2.481 0.0055 6.3 1.0reactivated 7.0 2.484 0.0055 7.0 1.8
during the reactivation process.
Data fitting of the first shell gives a similar picture in-dicating that most Nickel neighbors are found for the re-duced Ni-YSZ. This is surprising if considering the con-clusions from electron microscopy. Note that there areseveral effects that may influence the number of near-est Ni neighbors: small particle sizes, disorder but alsopartial oxidation / dissolution of oxygen/carbon maydecrease the coordination number. It seems that thereduced sample is the one which is most defined andtherefore gives a coordination number closer to 12 withan average particle size >5 nm. The reactivated sample
8
145
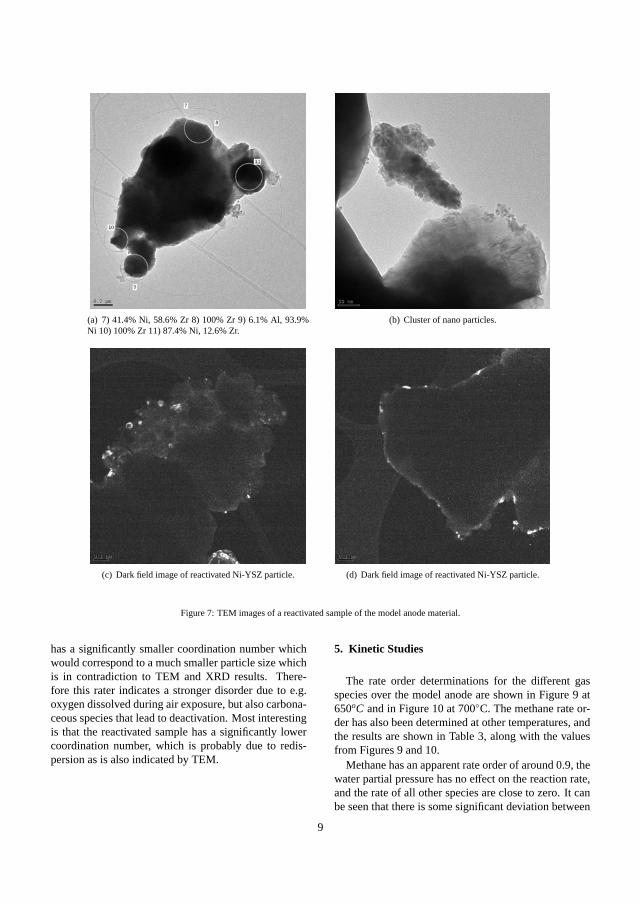
(a) 7) 41.4% Ni, 58.6% Zr 8) 100% Zr 9) 6.1% Al, 93.9%Ni 10) 100% Zr 11) 87.4% Ni, 12.6% Zr.
(b) Cluster of nano particles.
(c) Dark field image of reactivated Ni-YSZ particle. (d) Dark field image of reactivated Ni-YSZ particle.
Figure 7: TEM images of a reactivated sample of the model anode material.
has a significantly smaller coordination number whichwould correspond to a much smaller particle size whichis in contradiction to TEM and XRD results. There-fore this rater indicates a stronger disorder due to e.g.oxygen dissolved during air exposure, but also carbona-ceous species that lead to deactivation. Most interestingis that the reactivated sample has a significantly lowercoordination number, which is probably due to redis-persion as is also indicated by TEM.
5. Kinetic Studies
The rate order determinations for the different gasspecies over the model anode are shown in Figure 9 at650oC and in Figure 10 at 700◦C. The methane rate or-der has also been determined at other temperatures, andthe results are shown in Table 3, along with the valuesfrom Figures 9 and 10.
Methane has an apparent rate order of around 0.9, thewater partial pressure has no effect on the reaction rate,and the rate of all other species are close to zero. It canbe seen that there is some significant deviation between
9
146

Figure 8: (a) XANES data at the Ni K-edge (b) Radial distributionfunction (Fourier transformed EXAFS spectra at the Ni K-edge). Ni-foil is included as reference.
Table 3: Measured rate order of methane at different temperatures
T [◦C] reaction order600 0.78625 0.84650 0.91675 0.91700 0.87725 0.94775 0.80800 0.80
the measured data points in some of the data series, es-pecially at 700◦C. It is, however, still worth noticingthat the reaction order for CO is measured as -0.14 at650◦C and 0.10 at 700◦C,. This change with tempera-ture supports the recent result from first principle calcu-lations, showing that the dominant elementary reactionchange with temperature [29]. There are however alsoother possible explanations, such as an increase in thespecies adsorbed on the catalyst at lower temperaturesor a change in the approach to equilibrium. For the sakeof the power law expression, the rate order is set as amean of the observed rates, i.e. 0 for CO and the re-sulting power law expression is shown in Equation 3.In section 6 a more thorough discussion of such effectsis made while determining the reaction mechanism andthe corresponding kinetic expression.
r = kP0.9CH4
P−0.2H2
P0.2CO2 (3)
Figure 11 shows an Arrhenius plot for the kinetic con-stant obtained with the power law expression, giving anactivation energy of 185 kJ/mol and a pre-exponentialfactor of 139 mol/(s g Pa0.9).
5.1. Temperature Dependence at Non-Steady StateThere is a large span in the observed activation en-
ergies, 58-229 kJ/mol, reported for methane steam re-forming in literature [2]. Possible reasons for these largedifferences, are for example transport limitations, differ-ences in catalyst structure, lack of an approach to equi-librium term, rate determining step changes with tem-perature or species covering the surface resulting in dif-ferent observed kinetic expressions at different condi-tions.
The long term dynamic behavior presented in this pa-per presents a new possible explanation for these largedeviations. Lacking knowledge of a slow approach tosteady state can have a large influence on the observed
10
147

activation energy. In order to illustrate this, measure-ments were made with fast changes of temperature. Amodel anode sample was reduced, and then operatedwith standard gas conditions at 800◦C until the activ-ity has stabilized. After this, three series of tempera-ture changes were made, with different holding time ateach temperature before the activity measurement wastaken. One with 60 min waiting period, one with 30min waiting period and one where the reactor was con-tinuously cooled from 800◦C to 650◦C with a rate ofapproximately 5◦C/min. After each series, the tempera-ture was kept at 800◦C until stability had been reachedagain.
Figure 12 shows the Arrhenius plot for the three mea-surement series for the reaction constant with respect tothe power law expression in Equation 3.
The observed activation energy of the three measure-ment series are close to each other. This is because theapproach to steady state after a change in temperature isso slow that the change in activity after an hour is notsignificant, meaning that only the initial jump in activ-ity is effecting these three series. This initial jump inactivity takes approximately 5 minutes, and this smalltime delay is most likely causing the curvature seen inthe series with no holding time. The observed activationenergies in these fast measurement series are 76 kJ/molwith no holding time, 73 kJ/mol with 30 min holdingtime, and 72 kJ/mol with 60 min holding time. This isless than half of the 185 kJ/mole obtained when waitingfor stability at each temperature. It is likely that the acti-vation energy found with fast temperature changes is theactivation energy of the reaction, and the increased acti-vation energy found when waiting for stability is causedby reversible structural changes in the catalyst. It is,however, surprising that the activation energy found inthese measurements are lower at longer holding time.
These two different activation energies for the reac-tivity, combined with the dynamic behavior described insection 3, may very well be the reason for the large vari-ations in the activation energy values reported in litera-ture. The measurements made here with fast tempera-ture changes were made after the initial deactivation hadbeen completed at 800◦C. If measurements are carriedout while the deactivation is taking place, the observedactivation energy will depend on whether temperaturechanges are performed by increasing or decreasing tem-perature, as well as how fast the temperature changesare made.
0.95 1 1.05 1.1 1.15x 10⁻³
−22
−21
−20
−19
−18
−17
−16
−15
1/T [1/K]ln
(k)
A = 139 mol/s g Pa0.9
Ea = 185kJ/mol
Figure 11: Arrhenius plot for measured rate constants on the modelanode material with respect to a power law expression.The reactionconstant, k, has the unit mol
sgcatPa0.9 .
0.9 1 1.1 1.2x 10⁻³
−19
−18.5
−18
−17.5
−17
−16.5
−16
−15.5
−15
1/T [1/K]
ln(k
)
no holding time
30 min holding time
60 min holding time
Figure 12: Arrhenius plots for the reaction measured without waitingfor stability at each temperature
11
148

0 5 10 15 20 25 30 35 400
0.5
1
1.5
2
2.5
3
3.5
4
4.5
5 x 10⁻⁵
reac
tion
rate
[mol
/s g
cat]
Partial Pressure [kPa]
PH2O
= 29.9 ± 0.19 kPaP
H2 = 7.82 ± 0.18 kPa
Rate order = 0.906
(a) Reaction rate order of CH4
0 5 10 15 20 25 30 35 400
0.5
1
1.5
2
2.5
3
3.5
4
4.5
5 x 10⁻⁵
reac
tion
rate
[mol
/s g
cat]
Partial Pressure [kPa]
PH2
= 7.97 ± 0.077 kPaP
CH4 = 14.4 ± 0.17 kPa
Rate order = −0.0598
(b) Reaction rate order of H2O
0 5 10 15 20 25 30 35 400
0.5
1
1.5
2
2.5
3
3.5
4
4.5
5 x 10⁻⁵
reac
tion
rate
[mol
/s g
cat]
Partial Pressure [kPa]
PH2O
= 29.8 ± 0.17 kPaP
CH4 = 14.1 ± 0.034 kPa
Rate order = −0.29
(c) Reaction rate order of H2
0 5 10 15 20 25 30 35 400
0.5
1
1.5
2
2.5
3
3.5
4
4.5
5 x 10⁻⁵re
actio
n ra
te [m
ol/s
gca
t]
Partial Pressure [kPa]
PH2O
= 29.5 ± 0.39 kPaP
H2 = 8.18 ± 0.28 kPa
PCH4
= 14.2 ± 0.027 kPaRate order = −0.144
(d) Reaction rate order of CO
0 5 10 15 20 25 30 35 400
0.5
1
1.5
2
2.5
3
3.5
4
4.5
5 x 10⁻⁵
reac
tion
rate
[mol
/s g
cat]
Partial Pressure [kPa]
PH2O
= 29.7 ± 0.15 kPaP
H2 = 8.02 ± 0.097 kPa
PCH4
= 14.1 ± 0.079 kPaRate order = 0.183
(e) Reaction rate order of CO2
Figure 9: Measured dependencies of the different gas species over the model Ni-YSZ catalyst at 650◦C. The corresponding fit data are given in thetext in each of the graphs.
12
149

0 5 10 15 20 25 30 35 400
0.5
1
1.5
2
2.5
3
3.5
4
4.5
5 x 10⁻⁵
reac
tion
rate
[mol
/s g
cat]
Partial Pressure [kPa]
PH2O
= 29.7 ± 0.58 kPaP
H2 = 8.11 ± 0.87 kPa
Rate order = 0.871
(a) Reaction rate order of CH4
0 5 10 15 20 25 30 35 400
0.5
1
1.5
2
2.5
3
3.5
4
4.5
5 x 10⁻⁵
reac
tion
rate
[mol
/s g
cat]
Partial Pressure [kPa]
PH2
= 7.99 ± 0.052 kPaP
CH4 = 14.3 ± 0.1 kPa
Rate order = −0.0363
(b) Reaction rate order of H2O
0 5 10 15 20 25 30 35 400
0.5
1
1.5
2
2.5
3
3.5
4
4.5
5 x 10⁻⁵
reac
tion
rate
[mol
/s g
cat]
Partial Pressure [kPa]
PH2O
= 29.5 ± 0.21 kPaP
CH4 = 14.1 ± 0.13 kPa
Rate order = −0.13
(c) Reaction rate order of H2
0 5 10 15 20 25 30 35 400
0.5
1
1.5
2
2.5
3
3.5
4
4.5
5 x 10⁻⁵re
actio
n ra
te [m
ol/s
gca
t]
Partial Pressure [kPa]
PH2O
= 29.5 ± 0.53 kPaP
H2 = 8.1 ± 0.44 kPa
PCH4
= 14.4 ± 0.098 kPaRate order = 0.101
(d) Reaction rate order of CO
0 5 10 15 20 25 30 35 400
0.5
1
1.5
2
2.5
3
3.5
4
4.5
5 x 10⁻⁵
reac
tion
rate
[mol
/s g
cat]
Partial Pressure [kPa]
PH2O
= 29.7 ± 0.22 kPaP
H2 = 7.94 ± 0.2 kPa
PCH4
= 14.2 ± 0.16 kPaRate order = 0.241
(e) Reaction rate order of CO2
Figure 10: Measured dependencies of the different gas species over the model Ni-YSZ catalyst at 700◦C. The corresponding fit data are given inthe text in each of the graphs.
13
150

6. Kinetic Expressions
A great number of elementary reactions are known totake place during catalytic steam reforming of methane[26, 27]. It is however often estimated that the 9 ele-mentary reactions shown below are sufficient to give acomplete understanding of the mechanism [14, 28, 29].
1. CH4 + 2∗ → CH∗3 + H∗
2. CH∗3+∗ � CH∗2 + H∗
3. CH∗2+∗ � CH∗ + H∗
4. CH∗+∗ � C∗ + H∗
5. H2O + 2∗ � HO∗ + H∗
6. HO∗+∗ � O∗ + H∗
7. C∗ + O∗ � CO∗+∗
8. CO∗ � CO+∗
9. 2H∗ � H2 + 2∗
It is generally agreed, that Reaction 1 is a rate limitingstep. Both experimental studies and Density FunctionalTheory (DFT) calculations have shown that there is tworate determining steps, Reaction 7 being the second one[3, 29]. Furthermore, the dissociation of water, Reaction5, has also been proposed as a rate determining step [30,31].
Assuming that the surface is clean from adsorbentsand Reaction 7 is the rate limiting step, results in thekinetic expression shown in Equation 4.
r = kPCH4 PH2O
P3H2
(1 − Qsr
Ksr
)θ2∗ (4)
Where Ksr is the equilibrium constant for the steamreforming reaction and Q is defined as shown in Equa-tion 5. The term (1-Q/K) is referred to as the approachto equilibrium term and when equilibrium is reached therate becomes 0 because Q = K. θ∗ is the fraction of freesurface sites, which is equal to 1 according to the as-sumption of clean surface.
Q =P3
H2PCO
PCH4 PH2O(5)
Equation 4 shows a negative third order dependencyon hydrogen, coming from the assumption that equa-tion 1-6 is in quasi-equilibrium. There are no experi-mental observations showing a negative third order de-pendency on hydrogen, neither in litterature nor in thisstudy, therefore Reaction 7 is not considered a rate lim-iting step.
Assuming a clean catalyst surface and that Reaction1 is the the only rate limiting step, results in the the fol-lowing kinetic expression.
r = kPCH4
(1 − Qsr
Ksr
)(6)
If the dissociation of water is also assumed to be ratelimiting, the resulting kinetic expression will also havea first order dependence on the partial pressure of water.Even though a few studies report such a dependence [7,31, 32], most experimental studies of steam reformingkinetics, including the measurements in this paper, donot observe any dependence of water partial pressure.In this work Reaction 5 is therefore not considered arate limiting step.
The assumption that the catalyst surface is com-pletely clean and available for reaction is not alwaysvalid, meaning that the free surface area, θ∗ is not equalto 1. Even though the temperatures used in this studyare rather high, it is observed that the reaction rate has alow order dependency on both H2, CO and CO2, whichcould be an indication of some degree of surface cover-age, especially at lower temperature. Equation 7 showsthe kinetic expression where CO is the most abundantspecies on the surface area.
r =kCH4 PCH4
(1 − Qsr
Ksr
)(1 + kCOPCO)2 (7)
6.1. Intrinsic KineticsKinetic expressions with clean surface and with ei-
ther H, CO or H+CO as most abundant species has beenfitted to the reaction rates measured over the model an-ode. It was found, however that several different setsof parameter values could give similar fit to the exper-imental data, a summary of some different best fits isgiven in Table 4. The deviation values given in the tableis an average of the deviation between each measure-ment point and the corresponding model point, calcu-lated from Equation 8
err =∣∣∣∣∣ rmeasured − rmodel
rmeasured∗ 100%
∣∣∣∣∣ (8)
A comparison of the power law and clean surface ex-pressions in Table 4 show that the approach to equilib-rium term accounts for a large part of the deviations inthe power law expression, introducing this term givesmuch better quality of the fit. Especially the deviationof the measurements with CO2 changes, get a better rep-resentation when the approach to equilibrium term is in-cluded, going from 97.1% to 19.6% average deviation.
14
151

Table 4: Summary of the different kinetic expressions fitted to the experimental data, the first four columns show the values of the pre-exponentialfactor and activation energy for respectively, methane dissociation and CO adsorption . The last five columns show the average deviation betweenthe kinetic expression and the experimental data for all data points and data with varying H2O content, H2 content, CO content and CO2 content,respectively.
most abundant Parameter values Deviationspecies ACH4 EaCH4 ACO EaCO overall H2O H2 CO CO2
mol/g s Pa kJ/mol Pa−1 kJ/mol % % % % %power law 139 185 - - 43.7 20.7 39.5 111.2 97.1
clean surface 227 205 - - 18.9 10.2 16.9 58 19.6CO 100 197 4.60E-07 -41 15 11.1 18.9 28 18.8CO 110 198 1.70E-06 -26 14.7 11.8 18.7 23.8 19.3CO 103 197 8.40E-05 0 14.6 11 19.4 23.8 17.7CO 110 198 5.50E-04 18 14.4 12 19 21.4 19.4
The majority of this improve comes from the fact thatthe observed CO2 dependency change with temperature,which is described poorly by the power law expression.Apparently only the CO dependence is not completelydescribed by the clean surface expression, i.e. a devia-tion of 58% compared to 16.9% and 19.6% for H2 andCO2 and 18.9% overall deviation. This could indicatethat CO covers a significant part of the catalyst surface.
Even though the approach to equilibrium term seemsto account for the dependency on H2 and CO2, expres-sions with adsorption of both species has been tested,since the three species are connected through the watergas shift reaction. The expression with CO2 and He ad-sorption are not included in Table 4, since none of themgave a noteworthy improved fit to the data.
The different parameter values found for the expres-sion assuming CO as the most abundant surface speciesin table 4, exemplifies an inherent weakness in micro ki-netic models. Several different sets of parameter valueswas found which all give a good fit to the experimentaldata, illustrating that the large number of model parame-ters enables a fit, event though the underlying assump-tions may not be correct. The best fit was obtained witha small negative or positive activation energy. Even afit with EaCO = 0 (i.e. temperature independent) gavea good fit. It is expected that the activation energy ofadsorption of gasses is negative, since adsorption is nor-mally reported to decrease with increasing temperature.On this basis, the expression shown in Equation 9 waschosen. In litterature, the activation energy of CO ad-sorption is reported to be around -115 kJ/mol [26, 33],but this does no fit with the data presented in this paper.It has, however, also been shown that Ea,CO is highly
dependent on the support material [34].
r =110 mole
gsPa exp(−198kJ/mole
RT
)PCH4
(1 − Qsr
Ksr
)(1 + 1.7 ∗ 10−6Pa−1exp
(26kJ/mole
RT
)PCO)2 (9)
This expression was also determined fitted to the ki-netic measurements for the industrial anode material, asshown in Equation 10, with an overall deviation fromexperimental data of 19%.
r =100 mole
gsPa exp(−195kJ/mole
RT
)PCH4
(1 − Qsr
Ksr
)(1 + 4.6 ∗ 10−7Pa−1exp
(32kJ/mole
RT
)PCO)2 (10)
The deviation for the power law expression deter-mined from the industrial anode measurements is 41.4%and for the clean surface expression it is 21%. The aver-age deviation for the final expression over the industrialanode is 4 percentage points higher than that over themodel anode.
Assuming an average Ni particle size of 250 nm andthat all Ni particles are spherical and only have singlepoint contact with other particles, the Ni surface areaof the model anode and industrial anode material is esti-mated to be 0.16 m2/g. From this estimate a comparisonis made of the expressions obtained in this study withexpressions found in literature, see Figure 13. A morethorough comparison of the rate expressions reportedin literature is given in [2]. The rate expression mea-sured by Wei and Iglesia [35] is measured over a classi-cal steam reforming catalyst, and is included in Figure13 as a reference. It is seen that the rates obtained in thispaper is in the same range as those previously reportedin literature, though in the high end of the range, espe-cially at high temperatures. Furthermore, it is seen thatthe rate measured for the industrial anode and the modelanode are almost identical.
15
152

600 620 640 660 680 700 720 740 760 780 8000
0.005
0.01
yCH4
= 40%, yH2O = 60%
Temperature [oC]
Rat
e [m
ol/s
m2 N
i] BoderKingWeiModel anodeIndustrial anode
600 620 640 660 680 700 720 740 760 780 800
−4
−3
−2yCH
4
= 40%, yH2O = 60%
Temperature [oC]
Log(
Rat
e)
600 620 640 660 680 700 720 740 760 780 8000
0.5
1
1.5x 10⁻³
yCH4
= 10%, yH2O = 35%, yH
2
= 35%, yCO = 10%, yCO2
= 10%
Temperature [oC]
Rat
e [m
ol/s
m2 N
i]
Figure 13: Comparison of obtained rate expressions with expressions from literature: Bebelis [3], Boder [4], King [5], and Wei [35].
7. Conclusion
A long term dynamic behavior of Ni-YSZ, when usedas a steam reforming catalyst has been discovered. Thisincludes an initial deactivation over days or even weeksdepending on conditions. This initial loss of activ-ity was completely recovered by prolonged exposureto H2O/H2 without methane. Furthermore, a slow ap-proach to steady state (3-30 hours) after changes in tem-perature and hydrogen content was observed.
Characterization of the catalyst indicated that the dy-namic behavior is caused by changes in Ni particlestructure through the following mechanisms: During re-duction, the shrinking NiO/Ni particles deposits Ni nanoparticles, which gives a high initial activity but gives aslow deactivation because of sintering. The regain ofcatalytic activity caused by exposure to H2O/H2 with-out methane is most likely caused by a re-dispersion ofthe Ni nano particles or removal of poisons, such as car-bonaceous species. The slow approach to steady-stateafter changes in temperature and hydrogen content wastentatively ascribed to changes in Ni particle spheric-ity. These explanations are, however, not satisfactorilyproven, so further investigations are needed, preferablywith in-situ techniques, since the Ni particle structure
are likely to change during cooling of the samples.The activation energy was measured both with and
without waiting for steady state at each temperature,giving 195-198 kJ/mol and 71-76 kJ/mol, respectively.This was done in order to illustrate that the dynamic be-havior reported in this article may very well explain thelarge differences in the activation energies reported inliterature.
Finally, the steam reforming rate was measured overboth an industrial Ni-YSZ anode and a model anode ma-terial. The activity of the two samples were near iden-tical and was best described by assuming methane dis-sociation as the rate limiting step and CO as the mostabundant species on the catalyst surface.
8. Acknowledgment
This work is financed by the Technical Universityof Denmark, Topsøe Fuel Cell A/S, and the graduateschool in Chemical Engineering: MP2T. The catalystmaterials was provided by Haldor Topsøe A/S, Top-soe Fuel Cell A/S and Mikko Pihlatie from Risø-DTU.We acknowledge Dr. Stefan Mangold (ANKA-XAS,Forschungszentrum Karlsruhe, Germany) for help at theEXAFS beamline, and ANKA for providing beamtime
16
153

for this work. Further, financial support by the Euro-pean Community - Research Infrastructure Action un-der the FP6: ”Structuring the European Research Area”(”Integrating Activity on Synchrotron and Free Elec-tron Laser Science” (IA-SFS) RII3-CT-2004-506008)and by DANSCATT is gratefully acknowledged. Wealso acknowledge Jakob Birkedal Wagner at Center forElectron Nanoscopy, DTU, for his aid in electron mi-croscopy measurements.
References
[1] J. R. Rostrup-Nielsen, J. Sehested, J. K. Norskov, Hydrogen andsynthesis gas by steam- and co2 reforming, Advances in Catal-ysis 47 (2002) 65–139.
[2] D. Mogensen, J.-D. Grunwaldt, P. Hendriksen, K. Dam-Johansen, J. Nielsen, Internal steam reforming in solid oxidefuel cells: Status and opportunities of kinetic studies and theirimpact on modelling, Journal of Power Sources 196 (1) (2011)25–38.
[3] S. Bebelis, A. Zeritis, C. Tiropani, S. G. Neophytides, Intrin-sic kinetics of the internal steam reforming of ch4 over a ni-ysz-cermet catalyst-electrode, Eng. Chem. Res. 39 (12) (2000)4920–4927.
[4] M. Boder, R. Dittmeyer, Catalytic modification of conventionalsofc anodes with a view to reducing their activity for direct in-ternal reforming of natural gas, J.Power Sources 155 (1) (2006)13–22.
[5] D. L. King, J. J. Strohm, X. Wang, H.-S. Roh, C. Wang, Y.-H.Chin, Y. Wang, Y. Lin, R. Rozmiarek, P. Singh, Effect of nickelmicrostructure on methane steam-reforming activity of ni-yszcermet anode catalyst, J. Catal. 258 (2) (2008) 356–365.
[6] E. Achenbach, E. Riensche, Methane/steam reforming kineticsfor solid oxide fuel cells, J.Power Sources 52 (2) (1994) 283–288.
[7] A. Lee, R. Zabransky, W. Huber, Internal reforming develop-ment for solid oxide fuel cells, Eng. Chem. Research 29 (5)(1990) 766–773.
[8] R. Odegard, E. Johnsen, H. Karoliussen, Methane reforming onni/zirconia sofc anodes, Proceedings of the Fourth InternationalSymposium on Solid Oxide Fuel Cells (SOFC-IV) (1995) 810–819.
[9] K. Ahmed, K. Foger, Kinetics of internal steam reforming ofmethane on ni/ysz-based anodes for solid oxide fuel cells, Catal.Today 63 (2-4) (2000) 479–487.
[10] M. Pihlatie, T. Ramos, A. Kaiser, Testing and improving the re-dox stability of ni-based solid oxide fuel cells, Journal of PowerSources 193 (1) (2009) 322–330.
[11] A. Jensen, J. E. Johnsson, K. Dam-Johansen, Catalytic and gas-solid reactions involving hcn over limestone, AIChE Journal43 (11) (1997) 3070–3083.
[12] T. Ressler, Winxas: A program for x-ray absorption spec-troscopy data analysis under ms-windows, J. Synchr. Rad. 5 (2)(1998) 118.
[13] Zabinsky, Rehr, Ankudinov, Albers, Eller, Multiple-scatteringcalculations of x-ray-absorption spectra, Phys. Rev. B (Con-densed Matter) 52 (4) (1995) 2995–3009.
[14] J. Jakobsen, Noble metal catalysts for methane steam reforming,Ph.D. thesis, Technical University of Denmark (2010).
[15] A. Hauch, M. Mogensen, Ni/ysz electrode degradation stud-ied by impedance spectroscopy, Solid State Ionics 181 (16-16)(2010) 745.
[16] A. Hauch, M. Mogensen, A. Hagen, Ni/ysz next term elec-trode degradation studied by impedance spectroscopy — effectof p(h2o), Solid State Ionics, article in press.
[17] J. Sehested, Four challenges for nickel steam-reforming cata-lysts, Catal. Today 111 (1-2) (2006) 103–110.
[18] Q. Jeangros, A. Faes, J. Wagner, T. Hansen, U. Aschauer,J. Van herle, A. Hessler-Wyser, R. Dunin-Borkowski, Acta Ma-terialia (14) (2010) 4578–4589.
[19] S. Helveg, C. Lopez-Cartes, J. Sehested, P. L. Hansen, B. S.Clausen, J. R. Rostrup-Nielsen, F. Abild-Pedersen, J. K.Nørskov, Atomic-scale imaging of carbon nanofibre growth.,Nature 427 (6973) (2004) 426–429.
[20] H. S. Bengaard, J. K. Nørskov, J. Sehested, B. S. Clausen, L. P.Nielsen, A. M. Molenbroek, J. R. Rostrup-Nielsen, Steam re-forming and graphite formation on ni catalysts, J. Catal. 209 (2)(2002) 365–384.
[21] F. Abild-Pedersen, O. Lytken, J. Engbæk, G. Nielsen, I. Chork-endorff, J. K. Nørskov, Methane activation on ni(111): Effectsof poisons and step defects, Surf. Sci. 590 (2-3) (2005) 127–137.
[22] K. Thyden, Y. Liu, J. Bilde-Sørensen, Microstructural charac-terization of sofc ni–ysz anode composites by low-voltage scan-ning electron microscopy, Solid State Ionics 178 (2008) 1984–1989.
[23] E. Ruckenstein, X. D. Hu, Mechanism of redispersion of sup-ported metal catalysts in oxidative atmospheres., Langmuir 1 (6)(1985) 756–760.
[24] J.-D. Grunwaldt, A. Molenbroek, N.-Y. Topsøe, H. Topsøe,B. Clausen, In situ investigations of structural changes in cu/znocatalysts, Journal of Catalysis 194 (2) (2000) 452–460.
[25] C. V. Ovesen, B. S. Clausen, J. Schiøtz, P. Stoltze, H. Topsøe,J. K. Nørskov, Kinetic implications of dynamical changes in cat-alyst morphology during methanol synthesis over cu/zno cata-lysts, Journal of Catalysis 168 (2) (1997) 133–142.
[26] E. S. Hecht, G. K. Gupta, H. Zhu, A. M. Dean, R. J. Kee,L. Maier, O. Deutschmann, Methane reforming kinetics within ani-ysz sofc anode support, Appl. Catal. A 295 (1) (2005) 40–51.
[27] D. W. Blaylock, T. Ogura, W. H. Green, G. J. O. Beran, Compu-tational investigation of thermochemistry and kinetics of steammethane reforming on ni(111) under realistic conditions, J.Phys. Chem. C 113 (12) (2009) 4898–4908.
[28] I. Chorkendorff, J. Niemantsverdriet, Concepts of ModernCatalysis and Kinetics, 2nd Edition, Wiley-VCH, Germany,2007.
[29] G. Jones, J. G. Jakobsen, S. S. Shim, J. Kleis, M. P. Andersson,J. Rossmeisl, F. Abild-Pedersen, T. Bligaard, S. Helveg, B. Hin-nemann, J. R. Rostrup-Nielsen, I. Chorkendorff, J. Sehested,J. K. Nørskov, First principles calculations and experimental in-sight into methane steam reforming over transition metal cata-lysts, J. Catal. 259 (1) (2008) 147–160.
[30] N. Nakagawa, H. Sagara, K. Kato, Catalytic activity of ni-ysz-ceo2 anode for the steam reforming of methane in a directinternal-reforming solid oxide fuel cell, J. Power Sources 92 (1-2) (2001) 88–94.
[31] R. Peters, R. Dahl, U. Kluttgen, C. Palm, D. Stolten, Internalreforming of methane in solid oxide fuel cell systems, J. PowerSources 106 (1-2) (2002) 238–244.
[32] W. Lehnert, J. Meusinger, F. Thom, Modelling of gas transportphenomena in sofc anodes, J. Power Sources 87 (1-2) (2000)57–63.
[33] L. M. Aparicio, Transient isotopic studies and microkineticmodeling of methane reforming over nickel catalysts, J. Catal.165 (2) (1997) 262–274.
[34] A. Boisen, T. Janssens, N. Schumacher, I. Chorkendorff,S. Dahl, Support effects and catalytic trends for water gas shiftactivity of transition metals, Journal of Molecular Catalysis. A,
17
154

Chemical 315 (2) (2010) 163–170.[35] J. Wei, E. Iglesia, Isotopic and kinetic assessment of the mech-
anism of reactions of ch4 with co2 or h2o to form synthesis gasand carbon on nickel catalysts, J. Catal. 224 (2) (2004) 370–383.
18
155

Article III
Article in preparation
156
Methane Steam Reforming over Ni-YSZ Solid Oxide Fuel Cell Anode in StackConfiguration
D. Mogensena,∗, J-D. Grunwaldta,b, P. V. Hendriksenc, J. U. Nielsend, K. Dam-Johansena
aDepartment of Chemical and Biochemical Engineering, Technical University of Denmark, Soltofts Plads Building 229, DK-2800 Kgs. Lyngby,Denmark
bPresent adress: Institute for Chemical Technology and Polymer Chemistry, Karlsruhe Institute of Technology (KIT), Engesserstrasse 20,D-76131 Karlsruhe, Germany
cRisoe National Laboratory for Sustainable Energy, Technical University of Denmark, Frederiksborgvej 399, DK-4000 Roskilde, DenmarkdTopsoe Fuel Cell, Nymøllevej 66, DK-2800 Lyngby, Denmark
Abstract
The kinetics of catalytic steam reforming of methane over a Ni-YSZ anode for Solid Oxide Fuel Cells (SOFC) havebeen measured in a stack configuration. In order to decrease the degree of conversion, a single cell stack with reducedarea was used. Measurements were performed in the temperature range 600-800oC and with variations in the partialpressure of all reactants and products. The obtained rate measurements have been fitted to a power law expression. Asimple model is used to predict methane conversion in a stack configuration from intrinsic kinetics. These predictionsare compared with the stack measurements presented here, and a very good correspondence is obtained.
Keywords: steam reforming, Kinetics, Solid oxide fuel cells, Ni-YSZ
1. Introduction
The major advantage of partial internal steam reform-ing in an SOFC is that the waste heat from the electro-chemical reactions is used to supply the energy for theendothermic reforming reaction (Reaction 1) with a re-action enthalpy of 206 kJ/mol at 25 oC. The overall re-action is still endothermic when taking into account theexothermic water gas shift reaction (Reaction 2) havinga reaction enthalpy of -41 kJ/mol at 25 oC [1].
CH4 + H2O� 3H2 +CO (1)
CO + H2O� CO2 + H2 (2)
A further advantage of internal reforming is the de-creased need for cooling via air flow at the cathode side,which can significantly increase system efficiency.
The rate of catalytic steam reforming of methane overan industrial SOFC anode is very high [2]. This iscaused by the combined effect of high operating tem-perature, a highly active catalyst material, and a high
∗Corresponding author, Tel.: +45 4525 2845, fax: +45 4588 2258,
Email address: [email protected] (K. Dam-Johansen)
catalyst content. The result is a rapid cooling, due to thereaction enthalpy, at the anode inlet giving large tem-perature gradients which decreases the stack efficiencyand in the worst case can result in cell cracking, due tothermal stress. So in order to achieve optimal operationof SOFC systems with internal steam reforming, it isnecessary to have a good understanding and control ofthe amount reforming taking place in the cell, this re-quires a good model representation of the stack, whichhas also received much attention lately [3–10]. The ac-curacy of such models depend on the accuracy of thekinetic expression used to predict the steam reformingrate and the purpose of this work is to obtain such anexpression measured directly in a stack configuration.Furthermore, it would be highly advantageous to be ableto predict the reforming rate in different stack configu-rations. In rigorous models describing both the flow inthe gas channels and the diffusion through the anode theobserved reforming rate can be predicted by using anintrinsic kinetic expression. Such a model will howeverrequire heavy computations if used as a stack model. InSection 4 a simple method for predicting reforming ratein a stack is presented and validated.
Preprint submitted to Journal of Power Sources May 1, 2011
157

2. Experimental
The setup is an ”Evaluator C50” from FuelCon [11],which has undergone some modifications to fit the pur-pose of these experiments. Dry gas flows are con-trolled with Mass Flow Controllers (MFC) of the type”LOW ΔP FLOW” and ”EL-FLOW” from BronkhorstHI-TEC, which are calibrated using a Gilibrator 2 soapbubble flow meter from Gilian with a specified measur-ing range of 20-6000 ml/min. Water vapour is added bybubbling nitrogen through a bubble flask at 90oC. Tem-perature measurements were made with K-type thermocouples for the temperature range -40 to 850oC
Two IR-analyzer of the type NGA 2000 Analyzerfrom Fisher-Rosemount, were used interchangeably.The analyzers only measure CO and CO2 contents, thecontents of the other species were calculated from amass balance, as verified by full gas analysis by GC.The analyzers have a measurement error of 1% of thegiven measuring limit.
The stacks were reduced by the following procedure:Heating to 860oC in N2. At 860oC the gas was changedto 20% H2 in N2 for at least 4 hours, hereafter the sam-ple was cooled to the test temperature and measure-ments were started.
The first attempt of measuring the steam reformingkinetics were made on a 5-cell SOFC 10cmx10cm stan-dard stack from Topsøe Fuel Cell A/S. It was found thatthe methane was completely converted, even at the high-est flows that the setup could deliver.
Therefore a special stack was made, also by TopsøeFuel Cell A/S, with only a single crossflow cell. threequarters of the cell was cut away so that number of thecathode flow channels were removed, and the length ofthe anode flow channels were shortened, as illustratedin Figure 1.
A further decrease in cell area would have been pre-ferred, but removing part of the cell significantly re-duced the robustness of the cells, and several modifiedcells cracked under conditions that a normal stack couldeasily withstand. Furthermore, removing more than 3/4of the cell could result in a gas flow pattern significantlydifferent from that of full cell.
Four thermocouples were placed in the gas distribu-tion plates close to the flow channels, in order to monitorthe temperature gradient. One at each of corner of thefuel inlet side and one at the corner with fuel outlet andair inlet, and finally one at the fuel outlet and halfwaythrough the air channel. The temperature used in latercalculations is an average of these four measurements.The cathode side was only fed with nitrogen, both inorder to avoid mixing of air with the anode gas, and to
Figure 1: Illustration of the orientation of the quartercell with respectto flow directions.
avoid electrochemical reactions in the cell. It is desiredto avoid the electrochemical reactions, since the steamreforming reaction can be studied better, when no otherreactions are taking place.
The rate measurements on this cell was performed atflows, much higher than what is used during normal op-eration of an SOFC, Ftot ≈ 2 Nl/min. This was done inorder to decrease the degree of conversion of methane.The pressure and temperature were, T = 600-700oC, P= 1.1-1.25 atm.
Table 1 shows the standard gas composition as wellas the range each gas species is varied in at the inlet.
Gas Standard rangekPa kPa
CH4 12 12-30H2O 56 45-70H2 7 7-18CO 0 0-6CO2 0 0-9
Table 1: Overview of the gas composition at standard conditions andthe range each gas is varied in.
3. Results
During the rate measurements on the quartercell stackit was observed that the catalytic activity had a slow ap-proach to equilibrium after start-up and after changes intemperature or hydrogen partial pressure. This behav-ior has also been found during kinetic measurementson a Ni-YSZ anode catalyst in a flow reactor [12],with the only difference being that the response time islonger in the stack measurements. The reason for this
2
158

is that changes in the catalytic activity at the anode in-let will effect the temperature profile and gas compo-sition, and thereby the catalytic activity further downthe anode flow channels. An important note on this dy-namic behavior is that if the activation energy is exam-ined without waiting for steady state after each temper-ature change, the value will be underestimated with afactor 2-3 [12]. All measurements reported in this paperare obtained after steady-state has been achieved at therelevant temperature. Figures 2 and 3 show the the in-fluence on the flow rate by varying the gas compositionat respectively 650oC and 750oC. The measurements ofthe rate order of CO at 650oC where subject to experi-mental problems and is not included.
The observed reaction order of all species exceptmethane is seen to be close to zero, in agreement withthe majority of the expressions reported in literature[2, 13–15]. There is also seen a weak dependence onH2, -0.2 at 650oC and 0.1 at 750oC, this could be dueto restructuring of the catalyst [12]. The influence ofmethane partial pressure has been tested at several tem-peratures, and the observed rate orders are shown in Ta-ble 2. A power law expression is fit to the measured datausing a methane rate order of 0.7. It should be notedthat this rate expression is only intended as a direct de-scription of the observed conversions and as such, masstransport limitations and temperature gradients have notbeen taken into account. Such effects will be accountedfor in the next section. i.e. the rate constant is calculatedfrom Equation 3. The change in methane concentrationthrough the cell is taken into account by using a loga-rithmic mean of the the inlet and outlet concentrations,even though this is only accurate when there is a firstorder dependency.
k =robs
Aano ∗ logmean(PCH4 )0.7 (3)
robs is the observed rate and Aano is the geometric an-ode area (≈ 23cm2). An Arrhenius plot of the rate con-stant for this kinetic expression is shown in Figure 4,resulting in the rate expression in Equation 4.
r = 2 · 104 moles m2Pa
exp(−166.1 kJ
mole Rg
T)P0.7
CH4(4)
The average deviation between the model and themeasurement points is 20.6%.
4. Predicting Rate from Intrinsic Kinetics
Kinetic measurements in a stack configuration aresubject to mass transport limitations and temperature
T [oC] reaction order600 0.63625 0.56650 0.75675 0.80725 0.63750 0.65775 0.71800 0.73
Table 2: Measured rate order of CH4 at different temperatures
0.9 1 1.1 1.2x 10⁻³
−15
−14
−13
−12
−11
−10
−9
−8
1/T [1/K]
ln(k
)
A = 1.99e+004 mol/s m2 Pa0.7
Ea = 166.1kJ/mol
Figure 4: Arrhenius plot for measured rate constants on the quartercell stack.
3
159

0 5 10 15 20 25 30 35 400
0.5
1
1.5
2
2.5
3
3.5
4
4.5
5 x 10⁻³
reac
tion
rate
[mol
/s m
2 ]
Partial Pressure [kPa]
PH2O
= 51.2 ± 0.41 kPaP
H2 = 6.93 ± 0.35 kPa
Rate order = 0.75
(a) dependency on of CH4
0 10 20 30 40 500
0.5
1
1.5
2
2.5
3
3.5
4
4.5
5 x 10⁻³
reac
tion
rate
[mol
/s m
2 ]
Partial Pressure [kPa]
PH2
= 6.75 ± 0.16 kPaP
CH4 = 12 ± 0.29 kPa
Rate order = −0.0577
(b) dependency on of H2O
0 5 10 15 20 25 30 35 400
0.5
1
1.5
2
2.5
3
3.5
4
4.5
5 x 10⁻³
reac
tion
rate
[mol
/s m
2 ]
Partial Pressure [kPa]
PH2O
= 51.2 ± 0.098 kPaP
CH4 = 12 ± 0.038 kPa
Rate order = −0.207
(c) dependency on H2
0 5 10 15 20 25 30 35 400
0.5
1
1.5
2
2.5
3
3.5
4
4.5
5 x 10⁻³
reac
tion
rate
[mol
/s m
2 ]
Partial Pressure [kPa]
PH2O
= 51.1 ± 0.23 kPaP
H2 = 7.14 ± 0.1 kPa
PCH4
= 11.9 ± 0.063 kPaRate order = −0.0547
(d) dependency on CO2
Figure 2: Measured dependencies of the different gas species over the quarter cell stack at 650oC
4
160

0 5 10 15 20 25 30 35 400
0.01
0.02
0.03
0.04
0.05
0.06
0.07
reac
tion
rate
[mol
/s m
2 ]
Partial Pressure [kPa]
PH2O
= 48.2 ± 2.1 kPaP
H2 = 14 ± 3.1 kPa
Rate order = 0.649
(a) dependency on of CH4
0 10 20 30 40 500
0.01
0.02
0.03
0.04
0.05
0.06
0.07
reac
tion
rate
[mol
/s m
2 ]
Partial Pressure [kPa]
PH2
= 12.9 ± 0.36 kPaP
CH4 = 10.3 ± 0.19 kPa
Rate order = −0.0248
(b) dependency on of H2O
0 5 10 15 20 25 30 35 400
0.01
0.02
0.03
0.04
0.05
0.06
0.07
reac
tion
rate
[mol
/s m
2 ]
Partial Pressure [kPa]
PH2O
= 48.9 ± 0.21 kPaP
CH4 = 10.3 ± 0.086 kPa
Rate order = 0.0104
(c) dependency on H2
0 5 10 15 20 25 30 35 400
0.01
0.02
0.03
0.04
0.05
0.06
0.07
reac
tion
rate
[mol
/s m
2 ]
Partial Pressure [kPa]
PH2O
= 48.3 ± 0.31 kPaP
H2 = 13.3 ± 0.22 kPa
PCH4
= 10.4 ± 0.14 kPaRate order = −0.0619
(d) dependency on CO
0 5 10 15 20 25 30 35 400
0.01
0.02
0.03
0.04
0.05
0.06
0.07
reac
tion
rate
[mol
/s m
2 ]
Partial Pressure [kPa]
PH2O
= 48.9 ± 0.41 kPaP
H2 = 12.9 ± 0.36 kPa
PCH4
= 10.2 ± 0.091 kPaRate order = −0.0298
(e) dependency on CO2
Figure 3: Measured dependencies of the different gas species over the quarter cell stack at 750oC
5
161

gradients. This means that a rate expression obtained ona stack is not necessarily valid for a stack with a differ-ent configuration. In detailed models with a completedescription of mass and energy transport this problemcan be avoided by using intrinsic kinetics. This typeof model requires massive computations, and as suchare not viable for flow sheet models. Here a simple ap-proach to predicting steam reforming kinetics in a stackfrom intrinsic kinetics is presented and validated againstthe stack measurements. The cell/stack is described bythe design equation for a packed bed reactor as shownin Equation 5 [16] and the differential equation is solvedusing ode45 in matlab.
dXCH4
Wcat=
re f f
NCH4,in(5)
XCH4 is the conversion of methane, Wcat is the catalystweight, NCH4,in is the molar inlet flow of methane andre f f is the effective reaction rate described by Equation6.
re f f = η ∗ rint (6)
η is the efficiency factor, calculated from Equation 7.η describes how big a fraction of the available catalystmaterial that is being fully used, i.e. an efficiency factor= 1 corresponds to full usage of the catalyst [17].
η =Tanh(φ)φ
(7)
Where φ is the Thiele modulus:
φ = L√
kD
(8)
L is the anode thickness, k is the rate constant (s−1)and D is the effective diffusion coefficient (m2s−1) ofmethane.The diffusion coefficient is assumed to be tem-perature independent and set to 10−5m2s−1. This estima-tions is based on calculations of both the knudsen diffu-sion and the binary diffusion coeffients as described byReid et al. [18]. It should be noted that the model re-sults are rather sensitive to the estimate of the diffusioncoefficient, so if a more sophisticated model is made, adescription of the diffusion as a function of temperatureand gas composition should be included.
The intrinsic rate (rint) is calculated from an expres-sion obtained in a plug-flow reactor under differentialconversion and without mass transfer limitations [12].The expression is shown in Equation 9.
rint =
100 molegsPa exp
(−195 kJmole
RT
)PCH4
(1 − Qsr
Ksr
)(1 + 4.6 · 10−7Pa−1exp
(32 kJ
moleRT
)PCO
)2 (9)
The majority of the kinetic expression reported in lit-erature for steam reforming over Ni-YSZ report an acti-vation energy in the range 58-135 kJ/mol [3, 13–15, 19–21], and only a few report values around 200 kJ/mol[22–24].
The high activation energy both in Equation 9 and 4is a result of waiting for the slow approach to steadystate at each temperature, which has not been reportedin the previous studies. The expressions presented here,is consequently not a good representation of the steamreforming rate in a stack just after startup or a temper-ature change. Instead they describe the reforming ratein a stack operating at steady state for long periods oftime.
Figure 5 shows a comparison of the measured conver-sion and the conversion predicted by the model. Figure5(a) show the entire range of obtained values, while Fig-ure 5(b) show a zoom at low conversion.
(a) Results with measured temperature.
(b) representation of the data in Figure 5(a) only at low conversion.
Figure 5: Comparison of measured conversion and the conversion pre-dicted by the model using data from a plug-flow reactor.
6
162

Considering the simplicity of the model, it gives asurprisingly good prediction of the conversion in thestack, with an average deviation between model dataand measurements of 44.6%. With the only inputs be-ing the inlet gas composition, the efficiency factor cal-culated from the structure of the anode, the temperature,and an intrinsic rate expression. It can furthermore beseen from the figures that the major deviations are atlow conversion while higher conversions have a betterfit. The measurements that deviate most from the modelin Figure 5(b) is with methane concentration changes at675oC (four points overestimated by model) and 625oC(four points underestimated by model). It is also thesemeasurements that deviate from the trend in the Arrhe-nius plot in Figure 4. The error does not seem to besystematic and is ascribed to experimental uncertainty.
The major strength of the results reported here, isthat they are part of a study where the reaction rate hasbeen measured under similar conditions, both in a stacksetup with realistic mass transport limitations, and ina plug-flow reactor with no mass transport limitations[12]. The results are given high credibility from thefact that the two series of measurements can be corre-lated through a simple description of the expected masstransport in the stack.
5. Conclusion
The rate of methane steam reforming over an SOFCNi-YSZ anode has been measured in the temperaturerange 600-800oC and with variations in the partial pres-sure of all reactants and products. The activity wasobserved to have a long-term dynamic behavior simi-lar to that found for packed bed measurements of thesame catalyst [12]. Furthermore, a simple method forpredicting methane conversion in a stack from an in-trinsic expression was presented. the method was val-idated against the quarter stack measurements and wasfound to give a surprisingly good representation of theobserved methane conversion. The simplicity of thismethod makes it ideal for simple SOFC stack models,for flow sheeting purposes.
References
[1] J. R. Rostrup-Nielsen, J. Sehested, J. K. Norskov, Hydrogen andsynthesis gas by steam- and co2 reforming, Advances in Catal-ysis 47 (2002) 65–139.
[2] D. Mogensen, J.-D. Grunwaldt, P. Hendriksen, K. Dam-Johansen, J. Nielsen, Internal steam reforming in solid oxidefuel cells: Status and opportunities of kinetic studies and theirimpact on modelling, Journal of Power Sources 196 (1) (2011)25–38.
[3] H. Timmermann, W. Sawady, R. Reimert, E. Ivers-Tiffee, Kinet-ics of (reversible) internal reforming of methane in solid oxidefuel cells under stationary and apu conditions, Journal of PowerSources 195 (1) (2010) 214–222.
[4] T. X. Ho, P. Kosinski, A. C. Hoffmann, A. Vik, Effects of heatsources on the performance of a planar solid oxide fuel cell,International Journal of Hydrogen Energy 35 (9) (2010) 4276–4284.
[5] N. Akhtar, S. Decent, K. Kendall, Numerical modelling ofmethane-powered micro-tubular, single-chamber solid oxidefuel cell, Journal of Power Sources 195 (23) (2010) 7796–7807.
[6] T. F. Petersen, N. Houbak, B. Elmegaard, A zero-dimensionalmodel of a 2nd generation planar sofc using calibrated parame-ters, Int. J. Thermodynamics 9 (4) (2006) 161–169.
[7] S. H. Chan, H. K. Ho, Y. Tian, Multi-level modeling of sofc-gasturbine hybrid system, Int. J. Hydrogen Energy 28 (8) (2003)889–900.
[8] M. Sucipta, S. Kimijima, K. Suzuki, Performance analysis ofthe sofc-mgt hybrid system with gasified biomass fuel, J. PowerSources 174 (1) (2007) 124–135.
[9] K. Nikooyeh, A. A. Jeje, J. A. Hill, 3d modeling of anode-supported planar sofc with internal reforming of methane, J.Power Sources 171 (2) (2007) 601–609.
[10] F. P. Nagel, T. J. Schildhauer, S. M. A. Biollaz, S. Stucki,Charge, mass and heat transfer interactions in solid oxide fuelcells operated with different fuel gases - a sensitivity analysis, J.Power Sources 184 (1) (2008) 129–142.
[11] http://www.fuelcon.com.[12] D. Mogensen, J.-D. Grunwaldt, P. Hendriksen, K. Dam-
Johansen, J. Nielsen, Methane steam reforming over ni-ysz solidoxide fuel cell anode support material: Intrinsic kinetics and dy-namic behavior, in preparation (1).
[13] D. L. King, J. J. Strohm, X. Wang, H.-S. Roh, C. Wang, Y.-H.Chin, Y. Wang, Y. Lin, R. Rozmiarek, P. Singh, Effect of nickelmicrostructure on methane steam-reforming activity of ni-yszcermet anode catalyst, J. Catal. 258 (2) (2008) 356–365.
[14] M. Boder, R. Dittmeyer, Catalytic modification of conventionalsofc anodes with a view to reducing their activity for direct in-ternal reforming of natural gas, J.Power Sources 155 (1) (2006)13–22.
[15] E. Achenbach, E. Riensche, Methane/steam reforming kineticsfor solid oxide fuel cells, J.Power Sources 52 (2) (1994) 283–288.
[16] S. Fogler, Elements of Chemical Reaction Engineering,Prentice-Hall Inernational, Inc., 1999.
[17] I. Chorkendorff, J. Niemantsverdriet, Concepts of modern catal-ysis and kinetics.
[18] R. Reid, J. Prausnitz, B. Poling, Properties of gases and liquid-sISBN: 0-07-051799-1.
[19] A. Lee, R. Zabransky, W. Huber, Internal reforming develop-ment for solid oxide fuel cells, Eng. Chem. Research 29 (5)(1990) 766–773.
[20] R. Odegard, E. Johnsen, H. Karoliussen, Methane reforming onni/zirconia sofc anodes, Proceedings of the Fourth InternationalSymposium on Solid Oxide Fuel Cells (SOFC-IV) (1995) 810–819.
[21] K. Ahmed, K. Foger, Kinetics of internal steam reforming ofmethane on ni/ysz-based anodes for solid oxide fuel cells, Catal.Today 63 (2-4) (2000) 479–487.
[22] S. Bebelis, A. Zeritis, C. Tiropani, S. G. Neophytides, Intrin-sic kinetics of the internal steam reforming of ch4 over a ni-ysz-cermet catalyst-electrode, Eng. Chem. Res. 39 (12) (2000)4920–4927.
[23] H. Yakabe, T. Ogiwara, M. Hishinuma, I. Yasuda, 3-d modelcalculation for planar sofc, J.Power Sources 102 (1-2) (2001)
7
163

144–154.[24] R. Leinfelder, Reaktionskinetische untersuchung zur methan-
dampf-reformierung und shift-reaktion an anoden oxidkeramis-cher brennstoffzellen.
8
164

165

Center for Energy Resources Engineering
Department of Chemical and
Biochemical Engineering
Technical University of Denmark
Søltofts Plads, Building 229
DK-2800 Kgs. Lyngby
Denmark
Phone: +45 4525 2800
Fax: +45 4525 4588
Web: www.cere.dtu.dk
ISBN : 978-87-92481-59-7


![Abschlussbericht DFG-Re 2653/1-2€¦ · the monoclinic phase, with resulting micro- and macro-cracking [15] t-YSZ + H2O → m-YSZ (iv) Sulfur from the substrate or the gas environment](https://img.dokumen.tips/doc/110x75/605cf0e20b70ce48a9615098/abschlussbericht-dfg-re-26531-2-the-monoclinic-phase-with-resulting-micro-and.jpg)