Embed Size (px)
Citation preview

Arsenic Water Technology Partnership
Metal (Fe, Ti) Impregnated Granular Activated Carbon for Removing Arsenic and Co-Occurring Contaminants (PhaseII)

ii

iii
Metal (Fe, Ti) Impregnated Granular Activated Carbon for Removing Arsenic and Co-Occurring Contaminants (PhaseII) Prepared by: Paul Westerhoff Department of Civil and Environmental Engineering, Arizona State University Tempe, AZ 85287-5306 Paul Sylvester Solmetex Inc. 50 Bearfoot Road Northborough, MA 01532 And Kiril Hristovski Department of Civil and Environmental Engineering, Arizona State University Tempe, AZ 85287-5306 Jointly Sponsored by: Awwa Research Foundation U.S. Department of Energy 6666 West Quincy Avenue Washington, D.C. 20585-1290 Denver CO 80235-3098 Published by: WERC, a Consortium for Awwa Research Foundation Environmental Education and Technology Development at New Mexico State University

iv
About the Awwa Research Foundation The Awwa Research Foundation (AwwaRF) is a member-supported, international, nonprofit organization that sponsors research to enable water utilities, public health agencies, and other professionals to provide safe and affordable drinking water to consumers. The Foundation’s mission is to advance the science of water to improve the quality of life. To achieve this mission, the Foundation sponsors studies on all aspects of drinking water, including supply and resources, treatment, monitoring and analysis, distribution, management, and health effects. Funding for research is provided primarily by subscription payments from approximately 1,000 utilities, consulting firms, and manufacturers in North America and abroad. Additional funding comes from collaborative partnerships with other national and international organizations, allowing for resources to be leveraged, expertise to be shared, and broad-based knowledge to be developed and disseminated. Government funding serves as a third source of research dollars. From its headquarters in Denver, Colorado, the Foundation’s staff directs and supports the efforts of more than 800 volunteers who serve on the board of trustees and various committees. These volunteers represent many facets of the water industry, and contribute their expertise to select and monitor research studies that benefit the entire drinking water community. The results of research are disseminated through a number of channels, including reports, the Web site, conferences, and periodicals. For subscribers, the Foundation serves as a cooperative program in which water suppliers unite to pool their resources. By applying Foundation research findings, these water suppliers can save substantial costs and stay on the leading edge of drinking water science and technology. Since its inception, AwwaRF has supplied the water community with more than $300 million in applied research. More information about the Foundation and how to become a subscriber is available on the Web at www.awwarf.org.

v
DISCLAIMER
This study was jointly funded by the Awwa Research Foundation (AwwaRF) and the U.S. Department of Energy (DOE) under Grant No. DE-FG02-03ER63619 through the Arsenic Water Technology Partnership. The comments and views detailed herein may not necessarily reflect the views of the Awwa Research Foundation, its officers, directors, affiliates or agents, or the views of the U.S. Federal Government and the Arsenic Water Technology Partnership. The mention of trade names for commercial products does not represent or imply the approval or endorsement of AwwaRF or DOE. This report is presented solely for informational purposes.
Copyright 2008 By Awwa Research Foundation
and Arsenic Water Technology Partnership
All Rights Reserved
Printed in the U.S.A.
vi
FOREWORD The Awwa Research Foundation is a nonprofit corporation that is dedicated to the implementation of a research effort to help utilities respond to regulatory requirements and traditional high-priority concerns of the drinking water community. The Arsenic Water Technology Partnership (AWTP) program is a partnership between AwwaRF, Sandia National Laboratories (SNL) and WERC, a Consortium for Environmental Education and Technology Development at New Mexico State University that is funded by DOE and the Awwa Research Foundation. The goal of the program is to provide drinking water utilities, particularly those serving small and rural communities, with cost-effective solutions for complying with the new 10 ppb arsenic MCL. This goal is being met by accomplishing three tasks: 1) bench-scale research to minimize operating, energy and waste disposal costs; 2) demonstration of technologies in a range of water chemistries, geographic locales, and system sizes; and 3) cost effectiveness evaluations of these technologies and education, training, and technology transfer. The AWTP program is designed to bring new and innovative technologies developed at the laboratory and bench-scale to full-scale implementation and to provide performance and economic information under actual operating conditions. Technology transfer of research and demonstration results will provide stakeholders with the information necessary to make sound decisions on cost-effective arsenic treatment. AwwaRF participates in the overall management of the program, helps to facilitate the program’s oversight committees, and administer the laboratory/bench-scale studies. SNL conducts the pilot-scale demonstrations and WERC oversees the education, training, economic analysis, and outreach activities associated with this program. Walter J. Bishop Robert Renner Chair, Board of Trustees Executive Director Awwa Research Foundation Awwa Research Foundation

vii
ACKNOWLEDGEMENTS
This report is the product of a collaborative effort between the members of the Arsenic Water Technology Partnership and was made possible by funds from congress and the drinking water community. A special thanks to U.S. Senator Pete Domenici for his support and assistance in helping to bring low-cost, energy efficient solutions for the removal of arsenic from drinking water. Much of the laboratory work was conducted by HanhPhuc Nguyen at Arizona State University, who plans to receive her Masters of Science in Engineering degree in May 2008. Further assistance from Pedram Shafieian and Troy Benn, graduate students at ASU is appreciated. Teresia Moller and Owen Boyd from Solmetex Inc. provided extensive assistance in preparation of iron-GAC materials and conducted the pilot tests in Massachusetts. Their goal has been to produce a marketable Fe-GAC product. Malynda Aragon and her team from Sandia National Laboratories conducted pilot tests in New Mexico. John Crittenden is a professor in the Department of Civil and Environmental Engineering at Arizona Statement University (Tempe-campus) and provided technical assistance on synthesis of titanium impregnated GAC and pore surface diffusion modeling. His input was greatly appreciated. Tanju Karanfil is a professor in the Department of Environmental Engineering and Science at Clemson University and provided technical assistance in characterizing the Fe-GAC material for this Phase II project, and was instrumental in Phase I for investigating different methods of impregnating iron into GAC. Technical advice and guidance of the AwwaRF project officer, Albert Ilges, is appreciated.
viii
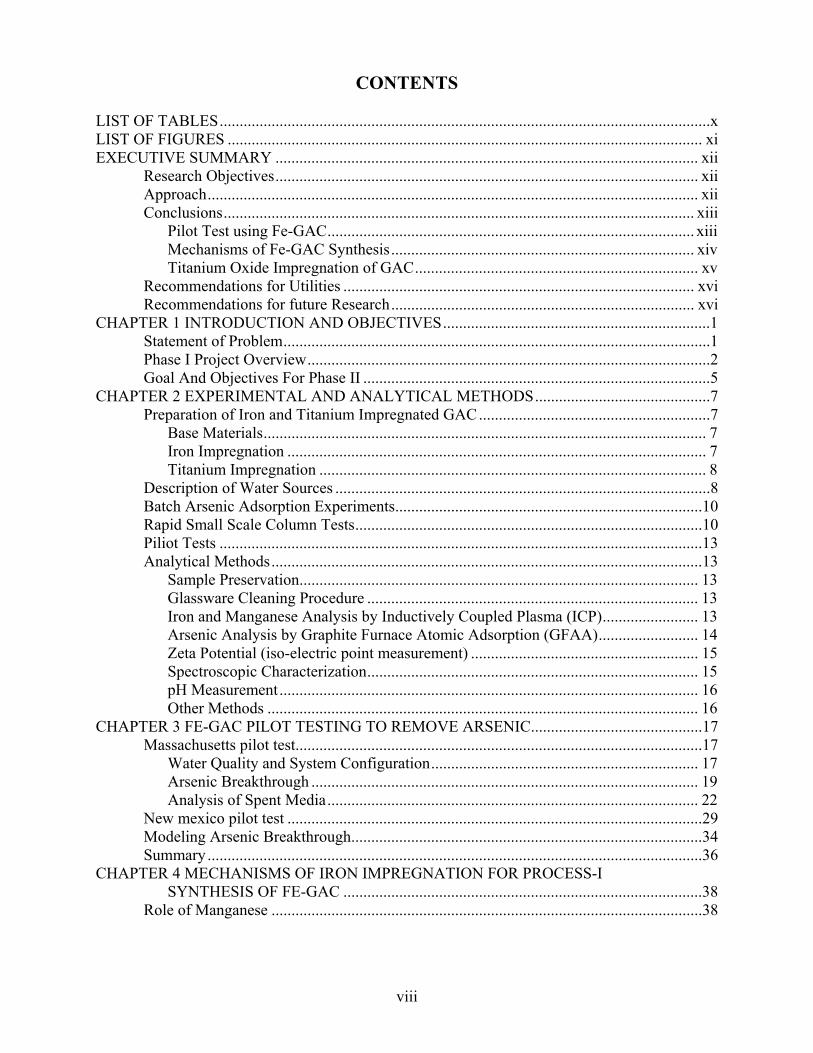
CONTENTS LIST OF TABLES ...........................................................................................................................x LIST OF FIGURES ....................................................................................................................... xi EXECUTIVE SUMMARY .......................................................................................................... xii Research Objectives .......................................................................................................... xii Approach ........................................................................................................................... xii Conclusions ...................................................................................................................... xiii
Pilot Test using Fe-GAC ............................................................................................ xiii Mechanisms of Fe-GAC Synthesis ............................................................................ xiv Titanium Oxide Impregnation of GAC ....................................................................... xv
Recommendations for Utilities ........................................................................................ xvi Recommendations for future Research ............................................................................ xvi CHAPTER 1 INTRODUCTION AND OBJECTIVES ...................................................................1 Statement of Problem ...........................................................................................................1 Phase I Project Overview .....................................................................................................2 Goal And Objectives For Phase II .......................................................................................5 CHAPTER 2 EXPERIMENTAL AND ANALYTICAL METHODS ............................................7 Preparation of Iron and Titanium Impregnated GAC ..........................................................7
Base Materials ............................................................................................................... 7 Iron Impregnation ......................................................................................................... 7 Titanium Impregnation ................................................................................................. 8
Description of Water Sources ..............................................................................................8 Batch Arsenic Adsorption Experiments .............................................................................10 Rapid Small Scale Column Tests .......................................................................................10 Piliot Tests .........................................................................................................................13 Analytical Methods ............................................................................................................13
Sample Preservation .................................................................................................... 13 Glassware Cleaning Procedure ................................................................................... 13 Iron and Manganese Analysis by Inductively Coupled Plasma (ICP) ........................ 13 Arsenic Analysis by Graphite Furnace Atomic Adsorption (GFAA) ......................... 14 Zeta Potential (iso-electric point measurement) ......................................................... 15 Spectroscopic Characterization ................................................................................... 15 pH Measurement ......................................................................................................... 16 Other Methods ............................................................................................................ 16
CHAPTER 3 FE-GAC PILOT TESTING TO REMOVE ARSENIC ...........................................17 Massachusetts pilot test......................................................................................................17
Water Quality and System Configuration ................................................................... 17 Arsenic Breakthrough ................................................................................................. 19 Analysis of Spent Media ............................................................................................. 22
New mexico pilot test ........................................................................................................29 Modeling Arsenic Breakthrough ........................................................................................34 Summary ............................................................................................................................36 CHAPTER 4 MECHANISMS OF IRON IMPREGNATION FOR PROCESS-I
SYNTHESIS OF FE-GAC ..........................................................................................38 Role of Manganese ............................................................................................................38
ix
Permanganate Oxidation Step ..................................................................................... 38 Addition of Ferrous Iron After Permanganate Oxidation Step ................................... 40 Experiments with Norit HD3000 ................................................................................ 41
Arsenic Adsorption with Fe-GAC Created via Different Processes ..................................44 Summary ............................................................................................................................49 CHAPTER 5 MECHANISMS OF IRON IMPREGNATION FOR PROCESS II
SYNTHESIS OF FE-GAC ..........................................................................................51 Characterization of Fe-GAC Synthesized by Process II ....................................................51 Arsenic Adsorption by Fe-GAC Synthesized by Process II ..............................................52 Comparison of Fe-GAC To Remove Arsenic by Process I and Process II .......................55 Summary ............................................................................................................................56 CHAPTER 6 : IMPREGNATE NON-FERROUS METALS (TI) ONTO GAC (TI-GAC) .........58 Preliminary Experiments ...................................................................................................58 Ti-GAC Optimization Experiments ...................................................................................60 Comparison of Ti-GAC Against Fe-GAC .........................................................................61 Summary ............................................................................................................................62 CHAPTER 7 RECOMMENDATIONS FOR UTILITIES AND FUTURE RESEARCH ............63 Conclusions ........................................................................................................................63
Pilot Test using Fe-GAC ............................................................................................. 63 Mechanisms of Fe-GAC Synthesis ............................................................................. 64 Titanium Oxide Impregnation of GAC ....................................................................... 65
Recommendations for Utilities ..........................................................................................66 Recommendations for future Research ..............................................................................66 REFERENCES ..............................................................................................................................69 ABBREVIATIONS .......................................................................................................................73

x
List of Tables
2.1 Modified NSFI-53 challenge water formulation .................................................................9 2.2 RSSCT scaling equations ...................................................................................................12 3.1 Water Quality for Pilot Tests with Fe-GAC ......................................................................18 3.2 Pilot system design ............................................................................................................18 3.3 Calculated arsenic adsorption capacity from pilot and RSSCT column
experiments .......................................................................................................................20 3.4 Quality control, acceptable limits from TCLP test for spent material for the
Massachusetts pilot test......................................................................................................23 3.5 Concentration of distinctive elements found on spent materials located at different
ports from the Massachusetts pilot test column ................................................................24 3.6 Weight percent (wt%) of elements on the surface of spent material used at
Massachusetts Pilot Test ....................................................................................................24 3.7 Surface area and pore volume analysis for unused and spent Fe-GAC material ...............25 3.8 Distribution of pore volume and surface areas in different sized pores for unused
and spent Fe-GAC material ...............................................................................................25 3.9 Column design parameters for Massachusetts pilot test and CD-RSSCT and PD-
RSSCT ...............................................................................................................................31 3.10 Column design parameters for New Mexico pilot test RSSCTs........................................33 4.2 Zeta potential comparison of three media at pH 6 after permanganate treatment ............40 4.3 Manganese content and iron content for Jacobi AquaSorb 1500 for different
dosages of KMnO4, MnCl2 x 4 H2O, and FeSO4 x 7 H2O .................................................41 4.4 Eight different types of carbon which were tested for optimization of Fe-
impregnated GAC using FeSO4×7H2O ..............................................................................44 4.5 Final Mn and Fe content, Freundlich parameters (K, 1/n) and goodness of fit (R2)
for arsenic adsorption and predicted sorption density (q) for an equivalent final arsenic concentration of 10 ppb .........................................................................................45
6.1 Experimental design for Ti-GAC synthesized for preliminary test ...................................58 6.2 pH, phosphorous (P) concentrations, silica concentrations and conductivities of
the water matrices used in the screening experiments .......................................................59 6.3 Synthesis conditions for Ti-GAC ......................................................................................60 6.4 Fitted Freundlich Isotherm parameters for Ti-GAC samples in modified NSF 53
challenge water and predicted arsenic sorption capacity (q) for a Ce value of 10 ppb......................................................................................................................................61

xi
LIST OF FIGURES
2.1 Schematic and photograph of a RSSCT set-up ..................................................................12 3.1 Massachusetts pilot test system and location of sampling ports ........................................19 3.2 Arsenic breakthrough for Massachusetts pilot column for different ports located at
depth in the column ............................................................................................................21 3.3 Arsenic breakthrough for Massachusetts pilot column for different ports located at
depth in the column normalized to bed volumes treated at each port ................................22 3.4 SEM & EDAX image of the surface for spent material located on top of column
(the location where the influent is located) at Massachusetts Pilot Test site ....................26 3.5 SEM & EDAX image of the surface for spent material located in the middle of
the column (at a column depth of 61.2 cm) at Massachusetts Pilot Test site ...................27 3.6 SEM & EDAX image of the surface spent material located at the bottom of the
column at a depth of 135 cm at Massachusetts Pilot Test site ..........................................28 3.7 SEM images of virgin Norit HD 3000 at two different levels of magnification ...............29 3.8 Arsenic breakthrough curve of pilot test using Fe-GAC for Socorro Springs, NM ..........30 3.9 Comparison of normalized arsenic breakthrough curves with water from the
Massachusetts pilot system and CD & PD RSSCTs ..........................................................32 3.10 Arsenic breakthrough curve for CD and PD test at pH 6.8 in comparison with the
New Mexico pilot system ..................................................................................................33 3.11 PSDM prediction and experimental data from the SBA tests for Fe-GAC
adsorbent synthesized by Process I.. ..................................................................................36 4.1 Distribution of iron in Fe-GAC as analyzed with EDAX ..................................................43 4.2 Effect size of coal based material (Jacobi AquaSorb 1500) and other types of
carbon fibers (activated carbon fiber and carbon fiber) on As(V) removal .......................45 4.3 Effect of Fe-GAC oxidized with MnO4
-, pretreated with Mn, and oxidized with ClO- on As(V) removal using ultrapure water spiked with ~ 100 ug/L As(V) ..................46
4.4 Effect of pore size between coal based material (Jacobi AquaSorb 1500) and different types of coconut shell base material on As(V) removal using ultrapure water spiked with ~100ug/L As(V) ...................................................................................47
4.5 Arsenic adsorption experiments at multiple pH levels for Fe-GAC synthesized via the Process I. (%As(V) removed by 1 g/L dry M-GAC at different pH values. ...............48
4.6 Digital image of activated carbon fiber obtained from Kynol Inc. website.. .....................49 5.1 Distribution of iron in Fe-GAC produced by Process II.. ..................................................53 5.2 Iron (hydr)oxide (a) aggregates formed in the large pores of Fe-GAC by Process
II (b) and their nanoparticle structure ...............................................................................54 5.3 Iron (hydr)oxide sharp-ended cylindrical deposits in Fe-GAC formed by Process I ........55 6.1 Arsenic removal using Ti-GAC from screening experiments in four different
water matrices (1 g/L of Ti-GAC added) ...........................................................................59

xii
EXECUTIVE SUMMARY
RESEARCH OBJECTIVES
This is the second phase of research focusing on developing new adsorbents capable of removing arsenic from drinking water. Phase I was a “proof-of-concept” for using Fe-GAC composites as adsorbents for arsenic removal and organic contaminants. This report is for Phase II of the project, where the primary goal was to demonstrate the ability of Fe-GAC to be used in pilot-scale drinking water treatment applications. A secondary goal was to understand the mechanisms of Fe-GAC synthesis in order to more cost effectively produce commercially viable materials. Specific objectives for Phase II include the following:
1. Conduct pilot tests with Fe-GAC at multiple field sites 2. Verify the efficacy of using laboratory rapid small scale columns to simulate pilot-scale
arsenic removal using Fe-GAC 3. Study the mechanisms of iron precipitate formation in GAC in an attempt to reduce
commercial scale production costs, handling of aggressive chemicals and production of hazardous products.
4. Impregnate non-ferrous metals (titanium) onto GAC and compare their performance in removing arsenic against Fe-GAC
5. Develop recommendations for water utilities regarding potential applications for Fe-GAC
APPROACH
Pilot testing was conducted at two field sites from different parts of the country: 1) Massachusetts and 2) New Mexico. Solmetex Inc. conducted pilot tests in Massachusetts as part of its in-kind cost-sharing. Sandia National Laboratories conducted pilot tests in Socorro, NM as part of the Arsenic Water Technology Program. The pilot tests used Fe-GAC produced by Solmetex Inc, which was synthesized using a larger-scale process than used in Phase I. Lessons learned during this larger scale process provided insights into the ability to scale-up production of Fe-GAC. Arsenic breakthrough was monitored at both field sites for a Fe-GAC packed bed with an empty bed contact time (EBCT) of 5 minutes. Multi-depth sampling of the packed-bed was conducted at the Massachusetts pilot site, along with significant characterization of spent media after nearly eight months of successful operation. Groundwater from the pilot sites was shipped to a central laboratory for use in rapid small scale column tests (RSSCTs). In addition to pilot testing, detailed laboratory investigations to understand the mechanisms of iron impregnation into activated carbon. Two processes of iron impregnation were studied. Process I uses potassium permanganate to oxide GAC and impregnate oxidized forms of manganese, which upon addition of reduced iron results in in-situ oxidation of ferrous to ferric iron and formation of iron (hydr)oxide precipitates. Process I was used to prepare Fe-GAC for pilot tests, and to synthesize Fe-GAC on a number of additional base substrate materials (different types of granular and fibrous activated carbon). Another process (Process II) for synthesizing Fe-GAC was also developed and studied because it uses ferric iron in a reusable alcohol solution. Process II was conceived to reduce wastestream volumes and production costs. A third process used titanium isopropoxide (TIP), acid and alcohol solutions to impregnate GAC with titanium (Ti-GAC). Synthesized Fe-GAC and Ti-GAC were characterized and evaluated for their ability to remove arsenic in batch tests.

xiii
CONCLUSIONS
Pilot Test using Fe-GAC
• The pilot tests supported a major goal of this project. Pilot tests demonstrated the viability of using Fe-GAC for arsenic removal in the field. There were no pressure drop, attrition or other operational problems observed at the two pilot sites conducted by different staff in two different parts of the country. Pilot test results with EBCTs of 4 to 5 minutes from both sites (Massachusetts and New Mexico) demonstrated arsenic removal for a reasonable number of bed volumes (>20,000 to over 75,000 bed volumes) at pH levels of 6.5 to 7.6. Complete breakthrough for an intermediate sample port with an EBCT of 3.6 minutes was reached after approximately 125,000 bed volumes of operation.
• Complete arsenic breakthrough was never achieved during the pilot tests, suggesting that residual arsenic adsorption capacity remained at the end of the pilot tests. This was supported by forensic analysis of spent media from different depths in the pilot column which shows a gradient of high to low arsenic content of the media from the top to the bottom of the packed bed.
• Silica did not appear to accumulate on the Fe-GAC, although some calcium-based solids were present.
• TCLP tests conducted at one pilot site confirmed that the media passed the TCLP test and could be disposed to conventional landfills as a non-hazardous waste.
• Short-bed adsorption tests using full-sized (not crushed) Fe-GAC concluded that mass transfer of arsenic in Fe-GAC packed bed applications is controlled by intraparticle diffusion. Modeling of Fe-GAC packed beds is feasible using the pore surface diffusion model, and calculated estimates of mass transfer parameters are valid for predicting arsenic removal.
• Proportional or constant diffusivity based designs for RSSCTs were not able to predict the pilot test performance for arsenic breakthrough. In all cases, the RSSCT broke through earlier than observed at the pilot tests.
• The reasons for a poor correlation between RSSCT and pilot plant performance may be related to the distribution of iron with depth into (radial coordinate) the Fe-GAC. The Fe-GAC used in the pilot tests were synthesized using Process I, which produces a non-homogenous media with higher iron content near the exterior of the GAC than near its core. The lack of homogeneity opposes a critical assumption for the use of RSSCTs and is probably the central reason why RSSCTs may not be viable for predicting full-scale performance of Fe-GAC produced by Process I.
• Process II of synthesizing Fe-GAC appears to create a more homogeneous distribution of iron within the GAC, and RSSCTs should be suitable for predicting the pilot performance for these system. However, Process II was not optimized until later in the study and pilot tests had already been concluded by that point. This is a point for future research.

xiv
Mechanisms of Fe-GAC Synthesis
• Experiments demonstrated that permanganate is critical to the production of iron-impregnated GAC (Fe-GAC) that is capable of removing arsenic.
• Process I involves the following steps: o Permanganate diffuses into GAC and reacts with the surface, resulting in surface-
bound manganese o Surface-bound manganese reacts with ferrous iron that eventually produces iron
(hydr)oxide, and dissolved manganese diffuses out of the GAC and back into solution
• Most of the iron in the Fe-GAC material is near the outer edges of particle (i.e., minimal depth penetration) for Process I. Process I involves the use of potassium permanganate (KMnO4) to pretreat GAC before addition of ferrous iron, which eventually leads to iron (hydr)oxide impregnated GAC (Fe-GAC). There are some large pores which appear to convey some iron deeper into the GAC particle interior. The distribution of iron in Fe-GAC is non-homogeneous. Other conclusions included:
o Increasing KMnO4 solution concentrations prior to introduction of ferrous iron leads to higher Fe content in Fe-GAC. Iron content of up to 16% by weight of Fe-GAC was obtained.
o MnO4- is a more effective oxidant than chlorine in the Fe impregnation process.
GAC that were pretreated by ClO- did not contain as much Fe and had a lower arsenic adsorption capacity than GAC treated with MnO4
-. o Using Mn2+ instead of MnO4
- lead to very low final iron content for Fe-GAC, indicating the important role of MnO4
- as an oxidant. o Acid washed macro-porous coconut shell Fe-GAC had better arsenic adsorption
capacity than non-acid washed coconut shell Fe-GAC o GAC pore size did not appear to influence the final iron content of Fe-GAC
material. Decreasing the GAC size from 0.83 mm diameter to 0.39 mm diameter prior to Fe-GAC synthesis has little effect on iron content (~10% Fe) but has a dramatic improvement in arsenic adsorption (i.e., higher q for smaller diameter Fe-GAC). This may be due to 1) faster kinetics of arsenic adsorption for smaller diameter Fe-GAC, or 2) less pore blockage for smaller diameter Fe-GAC (i.e., iron is not blocking pores).
o Iron impregnated activated carbon fibers exhibited the highest overall arsenic adsorption capacity and future research should explore their potential use in water treatment process to a larger extent.
• Process II uses different chemicals than Process I, which would make the synthesis of Fe-GAC cheaper and produce less hazardous waste. Process II treats GAC using a ferric/alcohol solution to eventually produce Fe-GAC. However, it appears that despite achieving comparable iron contents in Fe-GAC, Process II has lower arsenic adsorption potential under the conditions tested than Fe-GAC produced by Process I. The following is a summary of other key points:
o The iron content of Fe-GAC increases by using higher ferric/alcohol concentrations during the synthesis process.
xv
o Contact time between ferric/alcohol solutions and GAC did not affect final iron content of the Fe-GAC, suggesting that shorter contact times can be used which would reduce manufacturing costs.
o Process II yielded Fe-GAC with a good distribution of iron throughout the media. The impregnated iron was composed of spherical 20 to 100 nm diameter iron nanoparticles. In contrast, Fe-GAC synthesized using Process I had most of the iron distributed near the outer edges of the activated carbon grains and the iron was composed of sharp-ended cylindrical deposits.
o Fe-GAC synthesized by Process II has significantly lower arsenic adsorption capacity in batch tests compared to Fe-GAC synthesized by Process I. Additional research evaluated with Fe-GAC synthesized by both methods has also been compared in column tests (Chapter 3). Those results confirm the batch adsorption conclusions that Process I yields Fe-GAC with higher arsenic adsorption capacity than Process II.
o Differences in arsenic removal by Fe-GAC synthesized by the two methods is probably due to higher surface area of iron (hydr)oxides produced using Process I, which form sharp-ended cylindrical iron deposits (Process I) instead of aggregated spherical iron nanoparticles (Process II). The spherical iron nanoparticle aggregates may “block” pores, limiting diffusion of arsenic.
Titanium Oxide Impregnation of GAC
• Ti-GAC can adsorb arsenic from solution. • Titanium impregnated GAC (Ti-GAC) can be synthesized using techniques amendable to
large scale production. • Ti-GAC is synthesized using titanium isopropoxide (TIP) in an acidic solution that is
applied to GAC. • Synthesis conditions (contact time, TIP solution concentration and composition) affect
the titanium content of Ti-GAC, which ranged from 0.5% to 6% titanium by weight of Ti-GAC.
• For arsenic removal, Ti-GAC performed comparably with Fe-GAC synthesized by Process I (Fe-GAC sample from the Massachusetts Pilot Test)
• Titanium may be easier to commercially produce Ti-GAC than Fe-GAC if titanium chloride can be used instead of titanium isopropoxide
• Characterization of Ti-GAC continues, but one hypothesis being evaluated is whether or not titanium precipitates are more evenly distributed within the activated carbon grains, compared against iron precipitates in Fe-GAC. During synthesis it appears that diffusion and precipitation conditions for Ti-GAC can be well controlled.
• Pilot tests should be conducted using Ti-GAC, along with RSSCTs, to evaluate the performance of this media on a continuous flow basis.

xvi
RECOMMENDATIONS FOR UTILITIES
Metal impregnated granular activated carbons, such as Fe-GAC or Ti-GAC, offer the ability to remove arsenic and other heavy metals simultaneously while removing pollutants (e.g., neutral organic chemicals, radionuclides, taste and odor compounds) that adsorb onto activated carbon. There will be some competition from other anions in water, just as with any metal-oxide based arsenic adsorbent. Fe-GAC and Ti-GAC may also be applicable for point of use devices. Thus, a multi-purpose system can be applied using Fe-GAC. There is no leaching of the impregnated metal (iron or titanium), or any precursors used during their synthesis (e.g., manganese), during use of the materials. The same processes used to regenerate GAC (i.e., thermal regeneration) will not remove arsenic. It may be possible to regenerate Fe-GAC using acid or base washing cycles, although this has not yet been specifically evaluated. Thus, currently Fe-GAC should be viewed as a disposable adsorbent material. Based upon pilot testing, Fe-GAC will pass TLCP tests which means it can be disposed to ordinary landfills.
RECOMMENDATIONS FOR FUTURE RESEARCH
• Phase I and II demonstrated the viability of Fe-GAC and Ti-GAC to remove arsenic from model waters, surface waters and groundwaters. Only one form of Fe-GAC (Process I) was evaluated at the pilot scale (2 sites). Future work by the manufacturer should conduct parallel pilot testing using: 1) Fe-GAC synthesized by Process I, 2) Fe-GAC synthesized by Process II, 3) Ti-GAC, and 4) a reference media (e.g., Severn Trent E33 or US Filter GFH media). Companion RSSCTs should be conducted to determine if they are suitable for Fe-GAC synthesized by Process II, but not Process I, and Ti-GAC.
• Experimentation with variable carbon-based substrates suggested that activated carbon fibers impregnated with iron were highly efficient at adsorbing arsenic. While activated carbon fibers are more expensive than traditional GAC, future research is needed to fully synthesize a wider variety of iron impregnated activated carbon fibers and evaluate them for arsenic removal. These may be especially amendable to iron impregnation by Process I because of their small diameter, allowing permanganate (and iron) to become uniformly impregnated throughout the substrate.
• The ability of Fe-GAC and Ti-GAC to remove other pollutants as point of entry or point of use applications should be investigated in field-scale applications, now that the materials have been demonstrated effective at the lab-scale.

xvii
CHAPTER 1 INTRODUCTION AND OBJECTIVES
STATEMENT OF PROBLEM
Arsenic is a ubiquitous metalloid that naturally occurs in surface and groundwater. The speciation of arsenic depends on the pH and redox potential (e.g., Eh) of the water body. Arsenic usually occurs as arsenate [As(V)] or arsenite [As(III)] in potable water supplies. Arsenate (H3AsO4, H2AsO4
-, HAsO42-, or AsO4
3-) is typically present in the mono- and divalent anionic forms in oxygenated waters while arsenite (H3AsO3, H2AsO3
-, and HAsO3
2-) occurs primarily in the neutral and in lower Eh waters. Arsenic is classified as a human carcinogen (prone to cancer of the bladder, lungs, skin, kidney, liver, and prostate) by the International Agency for Research on Cancer and the National Research Council (NRC, 1999, 2002; Pontius et al., 1994). In 2002, the USEPA lowered the maximum contaminant level (MCL) for arsenic in drinking water from 50 μg/L to 10 μg/L, and the new MCL became effective in January 2006. The WHO, the European Union, and several countries recently lowered the recommended or required arsenic limit to 10 μg/L. Because of the lower MCL, potable water suppliers have an increased need for arsenic removal processes suitable for treating water sources with low ambient arsenic concentrations (10 to 50 μg/L). Arsenic can be removed from surface and groundwater supplies by iron or alum coagulation with filtration, reduced Fe/Mn oxidation systems, and lime softening (Cheng, Wang et al. 1994; McNeill and Edwards 1995; Scott, Green et al. 1995; Hering, Chen et al. 1997; McNeill and Edwards 1997; Chen, Fields et al. 2002). Anion-exchange resin and activated alumina packed-bed systems are traditionally used for wellhead or point-of-entry groundwater treatment systems (Lin and Wu 2001; Wang, Chen et al. 2002). In recent years, several iron-based adsorbents have been developed that typically require less chemical pretreatment and/or can treat a greater number of bed volumes than anion exchange resins or activated alumina. Porous iron oxide or hydroxide (GFH, Bayoxide E33) packed-bed adsorbent systems are used in Europe for arsenic treatment (Jekel and Seith 2000). Zero valent iron (ZVI) systems are used for in-situ and above ground arsenic mitigation (Lackovic, Nikolaidis et al. 2000; Farrell, Wang et al. 2001; Su and Puls 2001; Bang, Meng et al. 2002; Manning, Hunt et al. 2002; Meng, Bang et al. 2002). The porous nature of the iron oxides/hydroxides presumably results in arsenic adsorption at internal iron complexation sites, whereas ZVI relies on iron corrosion, reprecipitation, and arsenic adsorption on the external surface of the adsorbent. Bench-scale comparisons of porous and non-porous iron, sulfur-modified iron, and activated alumina adsorbents for arsenic removal suggest a large number of newly developed adsorbents may be economically feasible in achieving the new arsenic MCL (Sinha, Lee et al. 2002). Iron has a high affinity for arsenic and forms strong inner-sphere complexes. Based on the literature, iron (hydr)oxides have pKa1 and pKa2 values of ~7.3 and 8.9, respectively, resulting a pHZPC on the order of 8.1. Coulombic forces favor association of anionic arsenate with positive surface sites (e.g., MeOH2
+). Arsenic adsorption onto TiO2 has not

2
yet been modeled, but probably mirrors other inner-sphere metal (hydr)oxide surface site (SOH) complexes with arsenic:
≡FeOH2+ ≡FeOH + H+ pKa1 (1.1)
≡FeOH ≡FeO- + H+ pKa2 (1.2)
SOH + H3AsO4 SAsO42- + H2O + 2H+ (1.3)
SOH + H3AsO3 SAsO3- + H2O + H+ (1.4)
In addition to this electrostatic bonding between arsenic species and mineral surfaces, arsenic will also form covalent bonds with some surfaces. These include monomolecular monodentate and monomolecular bidentate bonds. Whereas electrostatic bonds form rapidly (seconds) and depend on the charge difference between the arsenic and the surface, covalent bonds depend on their respective molecular structure and form less rapidly. Covalent bonds are stronger (i.e., irreversible) than electrostatic attractions. As covalent bonds form, surface sites can become available for electrostatic bonding again. The kinetics of bond formation may affect the optimal contact time required for a specific media in a column operation. Overall, media taking advantage of the strong affinity between arsenic and iron will lead to good treatment strategies. This project involves a new array of granular activated carbon (GAC) based adsorbents that contain iron or titanium metal (hydr)oxides for arsenic removal. GAC has low capacity for arsenic, but provides a porous substrate to which metals can be added. Metal-impregnated GAC would remove both arsenic and organics (VOCs, SOCs, DOC). By combining the benefits of GAC and iron (hydr)oxides a new class of arsenic adsorption media can be developed using a base product (GAC) that is already well established in the drinking water industry. This is the second phase of research focusing on developing new adsorbents capable of removing arsenic from drinking water. Phase I was a “proof-of-concept” for using Fe-GAC composites as adsorbents for arsenic removal and organic contaminants. This report is for Phase II of the project, where the primary goal was to demonstrate the ability of Fe-GAC to be used in pilot-scale drinking water treatment applications. A secondary goal was to understand the mechanisms of Fe-GAC synthesis in order to more cost effectively produce commercially viable materials.
PHASE I PROJECT OVERVIEW
The goal of the Phase I was to validate proof-of-concept testing for iron enriched GAC composites (aerogel-GAC or iron-oxide impregnated) as a viable adsorbent for removing arsenic from groundwater. A one-year intensive cooperative project was conducted by ASU, LLNL, and Clemson University with cooperation from City of Scottsdale, AZ. Specific project objectives included:
• Conduct batch experiments for aerogel-GAC and Fe-oxide impregnated GAC composites to evaluate their performance removing arsenic.
3
• Evaluate Fe-GAC media performance in rapid small scale column tests (RSSCTs) to assess arsenic removal in a more dynamic treatment system.
• Evaluate Fe-GAC potential for removal of other contaminants (e.g., methyl tertiary butyl ether, dissolved organic carbon).
• Characterize Fe-GAC media. • Correlate performance and media characterization for possible selection of
two media for Phase II of this project. Three different techniques to impregnate iron onto GAC were evaluated: 1) iron containing aerogel impregnation of GAC (Lawrence Livermore National Laboratory); 2) four methods of impregnating iron oxides or zero valent iron onto GAC (Clemson University); 3) impregnating iron hydroxide onto GAC (Solmetex Inc. & Arizona State University). Iron content of each sample was determined before conducting batch adsorption experiments and/or column tests. Effects of water chemistry (pH, competing ions) and operating conditions (empty bed contact times) were evaluated. Co-removal of arsenic and synthetic organic chemicals (MTBE and benzene) were evaluated. Phase I drew the following conclusions:
• Fe-GAC composite media contained <1% to 15% iron by dry weight. There were no friability issues during use of the media, nor did iron appear to “flake” off of the composite media. Thus Fe-GAC media appear suitable for batch or packed-bed use during water treatment.
• Arsenic removal by Fe-GAC composites depended highly upon the process used to impregnate iron. Iron-aerogel materials had the lowest iron content and exhibited the lowest arsenic adsorption capacities. Roughly six other techniques to impregnate iron into GAC were successful and were the focus of the study. For these materials iron impregnation did not alter the surface area significantly (<15% change), as measured by nitrogen deposition. However, arsenic adsorption varied significantly based upon the technique to impregnate iron.
• Arsenic adsorption was not a function of the iron content (i.e., mgFe/mgGAC). This implies that the technique to impregnate Fe-GAC composites and the resulting mineralogy and structure is probably more important than the iron content.
• The best performing Fe-GAC composite for As(V) from Clemson University (C-II4 and C-II4B) was produced via an iron hydroxide precipitation process. This was superior to iron impregnated via ion exchange, organic-ligand based, or zero valent iron based techniques. The zero valent iron based technique result achieved comparable or slightly better As(III) removal than other Clemson University Fe-GAC composites.
• The best overall performing Fe-GAC composite was synthesized by Arizona State University and Solmetex Inc. using a patented process. Generally, this process involves in-situ precipitation of iron (hydr)oxide using an oxidant and reduced iron species.

4
• Extensive media characterization was undertaken (surface area, pore size distributions, zeta potential, and various spectroscopy measurements). These proved valuable in assessing differences between iron deposition techniques.
• Batch kinetic experiments indicated that 100x140 mesh Fe-GAC composites reached pseudo-equilibrium for As(V) adsorption within 7 days of contact time. Adsorption isotherms were fit well by the Freundlich Isotherm model (q = KCe
1/N). • In batch experiments with Fe-GAC composites, As(V) adsorption improved as
solution pH decreased. For example, the adsorptive capacity constant (K) decreased by a factor of ten for each full pH unit increase, between pH 5 and 9.
• In batch experiments with Fe-GAC composites and silicate (20 ppm) at pH 6.5 and 8.5, addition of silicate decreased As(V) adsorption at both pH levels. All Fe-GAC composites evaluated exhibited similar pH, silicate, vanadate and other competing ion effects.
• In batch and column experiments with Fe-GAC composites, As(V) adsorption was lower in groundwaters or NSFI-53 challenge water compared model solutions prepared from nanopure water at an equivalent pH as the groundwater. Thus, ions present in these more complex water matrices compete for arsenic adsorption sites on the Fe-GAC composite. Addition of 100 ppb vanadate to the NSFI-53 challenge water had almost no effect on As(V) removal. Addition of 20 ppm silicate to the NSFI-53 challenge water decreased As(V) adsorption at both pH 6.5 and 8.5, compared against the NSFI-53 challenge water prepared without silicate added. Thus silicate appears to be a major foulant/competitor for As(V) adsorption sites on Fe-GAC.
• In batch and column tests, decreasing the ionic strength of a groundwater through blending with nanopure water resulted in improved As(V) adsorption. These experiments maintained the same ratio of ions, but demonstrate that the concentration of competing ions affect As(V) adsorption.
• Rapid small scale column tests (RSSCTs) were conducted in continuous flow operation with empty bed contact times (EBCTs) of 2.5 to 10 minutes. Fe-GAC composites that performed best in batch testing, also had the best performance in RSSCTs. The ASU and Solmetex Inc. Fe-GAC composites achieved the longest run length (i.e., bed volumes treated). Lengthening the EBCT resulted in a larger number of bed volumes treated. The minimum EBCT recommended EBCT is 4 minutes; at 2.5 minute EBCT the mass transfer zone was not captured within the column.
• RSSCTs operated for 50,000 to over 100,000 bed volumes before complete As(V) breakthrough.
• RSSCTs were also conducted with a surface water containing dissolved organic carbon (DOC) and model groundwaters spiked with MTBE and benzene. Both waters also contained As(V). As(V) was removed effectively, and did not seem to be impacted by the presence of DOC, MTBE or benzene. Fe-GAC removed not only the As(V), presumably due to adsorption onto iron (hydr)oxides, but also removed the DOC and synthetic organic chemicals (MTBE and benzene).
5
Organics were presumably removed by adsorption onto the GAC. Therefore, iron impregnation does not appear to hinder organic removal by GAC, but adds the capability to remove arsenic.
• GAC is a relatively inexpensive substrate to impregnate with iron. For water treatment situations were co-removal of arsenic and other contaminants suitable for removal by GAC is desired (e.g., SOCs, radionuclides, DOC) Fe-GAC composites are a feasible option.
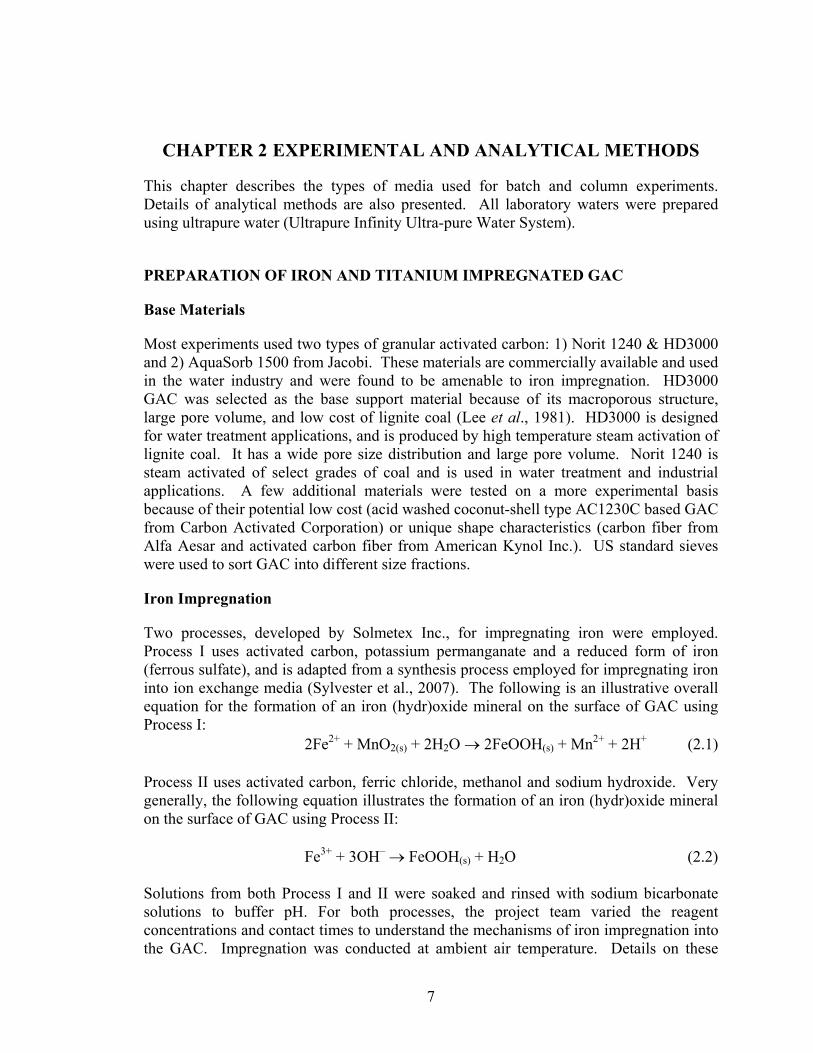
GOAL AND OBJECTIVES FOR PHASE II
The primary goal of this Phase II project was to demonstrate the ability of Fe-GAC to be used in pilot-scale drinking water treatment applications. A secondary goal was to understand the mechanisms of Fe-GAC synthesis in order to more cost effectively produce commercially viable materials. Specific objectives for Phase II include the following:
• Conduct pilot tests with Fe-GAC at multiple field sites. • Verify the efficacy of using laboratory rapid small scale columns to simulate
pilot-scale arsenic removal using Fe-GAC. • Study the mechanisms of iron precipitate formation in GAC in an attempt to
reduce commercial scale production costs, handling of aggressive chemicals and production of hazardous products.
• Impregnate non-ferrous metals (titanium) onto GAC and compare their performance in removing arsenic against Fe-GAC.
• Develop recommendations for water utilities regarding potential applications for Fe-GAC.

6
7
CHAPTER 2 EXPERIMENTAL AND ANALYTICAL METHODS
This chapter describes the types of media used for batch and column experiments. Details of analytical methods are also presented. All laboratory waters were prepared using ultrapure water (Ultrapure Infinity Ultra-pure Water System).
PREPARATION OF IRON AND TITANIUM IMPREGNATED GAC
Base Materials
Most experiments used two types of granular activated carbon: 1) Norit 1240 & HD3000 and 2) AquaSorb 1500 from Jacobi. These materials are commercially available and used in the water industry and were found to be amenable to iron impregnation. HD3000 GAC was selected as the base support material because of its macroporous structure, large pore volume, and low cost of lignite coal (Lee et al., 1981). HD3000 is designed for water treatment applications, and is produced by high temperature steam activation of lignite coal. It has a wide pore size distribution and large pore volume. Norit 1240 is steam activated of select grades of coal and is used in water treatment and industrial applications. A few additional materials were tested on a more experimental basis because of their potential low cost (acid washed coconut-shell type AC1230C based GAC from Carbon Activated Corporation) or unique shape characteristics (carbon fiber from Alfa Aesar and activated carbon fiber from American Kynol Inc.). US standard sieves were used to sort GAC into different size fractions.
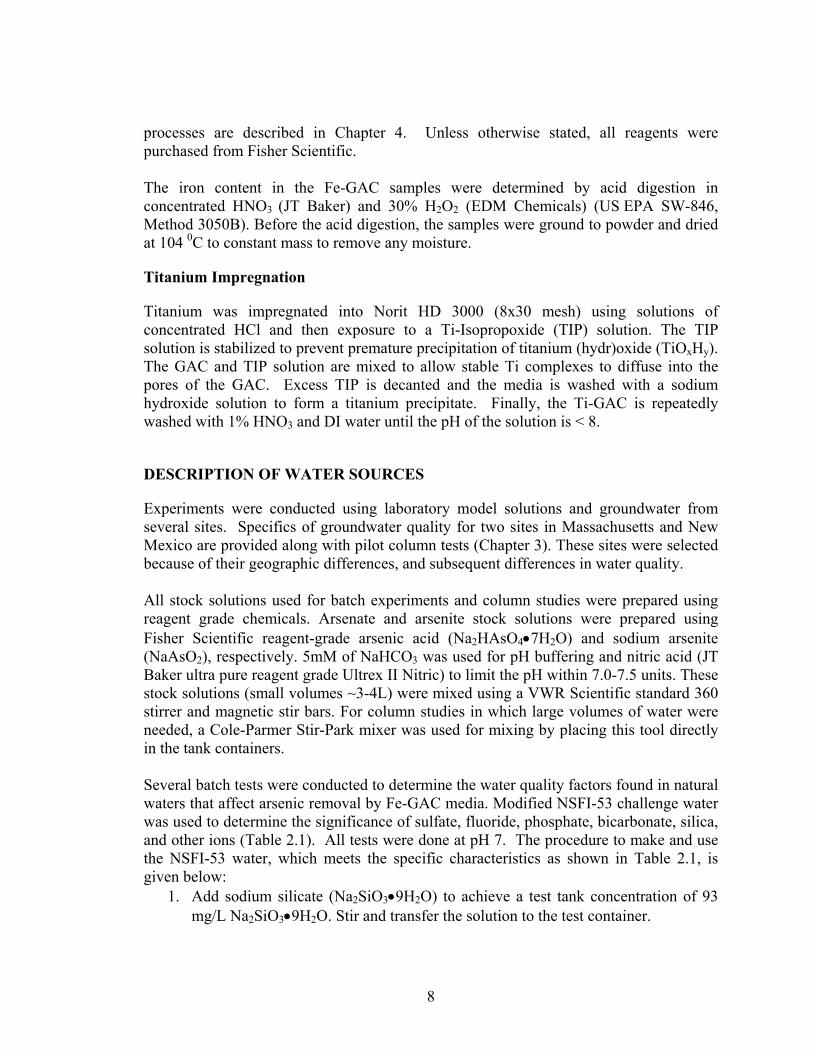
Iron Impregnation
Two processes, developed by Solmetex Inc., for impregnating iron were employed. Process I uses activated carbon, potassium permanganate and a reduced form of iron (ferrous sulfate), and is adapted from a synthesis process employed for impregnating iron into ion exchange media (Sylvester et al., 2007). The following is an illustrative overall equation for the formation of an iron (hydr)oxide mineral on the surface of GAC using Process I:
2Fe2+ + MnO2(s) + 2H2O → 2FeOOH(s) + Mn2+ + 2H+ (2.1)
Process II uses activated carbon, ferric chloride, methanol and sodium hydroxide. Very generally, the following equation illustrates the formation of an iron (hydr)oxide mineral on the surface of GAC using Process II:
Fe3+ + 3OH– → FeOOH(s) + H2O (2.2) Solutions from both Process I and II were soaked and rinsed with sodium bicarbonate solutions to buffer pH. For both processes, the project team varied the reagent concentrations and contact times to understand the mechanisms of iron impregnation into the GAC. Impregnation was conducted at ambient air temperature. Details on these
8
processes are described in Chapter 4. Unless otherwise stated, all reagents were purchased from Fisher Scientific. The iron content in the Fe-GAC samples were determined by acid digestion in concentrated HNO3 (JT Baker) and 30% H2O2 (EDM Chemicals) (US EPA SW-846, Method 3050B). Before the acid digestion, the samples were ground to powder and dried at 104 0C to constant mass to remove any moisture.
Titanium Impregnation
Titanium was impregnated into Norit HD 3000 (8x30 mesh) using solutions of concentrated HCl and then exposure to a Ti-Isopropoxide (TIP) solution. The TIP solution is stabilized to prevent premature precipitation of titanium (hydr)oxide (TiOxHy). The GAC and TIP solution are mixed to allow stable Ti complexes to diffuse into the pores of the GAC. Excess TIP is decanted and the media is washed with a sodium hydroxide solution to form a titanium precipitate. Finally, the Ti-GAC is repeatedly washed with 1% HNO3 and DI water until the pH of the solution is < 8.
DESCRIPTION OF WATER SOURCES
Experiments were conducted using laboratory model solutions and groundwater from several sites. Specifics of groundwater quality for two sites in Massachusetts and New Mexico are provided along with pilot column tests (Chapter 3). These sites were selected because of their geographic differences, and subsequent differences in water quality. All stock solutions used for batch experiments and column studies were prepared using reagent grade chemicals. Arsenate and arsenite stock solutions were prepared using Fisher Scientific reagent-grade arsenic acid (Na2HAsO4•7H2O) and sodium arsenite (NaAsO2), respectively. 5mM of NaHCO3 was used for pH buffering and nitric acid (JT Baker ultra pure reagent grade Ultrex II Nitric) to limit the pH within 7.0-7.5 units. These stock solutions (small volumes ~3-4L) were mixed using a VWR Scientific standard 360 stirrer and magnetic stir bars. For column studies in which large volumes of water were needed, a Cole-Parmer Stir-Park mixer was used for mixing by placing this tool directly in the tank containers. Several batch tests were conducted to determine the water quality factors found in natural waters that affect arsenic removal by Fe-GAC media. Modified NSFI-53 challenge water was used to determine the significance of sulfate, fluoride, phosphate, bicarbonate, silica, and other ions (Table 2.1). All tests were done at pH 7. The procedure to make and use the NSFI-53 water, which meets the specific characteristics as shown in Table 2.1, is given below:
1. Add sodium silicate (Na2SiO3•9H2O) to achieve a test tank concentration of 93 mg/L Na2SiO3•9H2O. Stir and transfer the solution to the test container.

9
2. Add sodium bicarbonate (NaHCO3) to achieve a test concentration of 250 mg/L NaHCO3. Stir and transfer to the test container.
3. Separately add magnesium sulfate (MgSO4•7H2O), sodium nitrate (NaNO3) and sodium fluoride (NaF) to achieve test concentrations of 128mg/L, 12mg/L and 2.2 mg/L, respectively.
4. Add sodium phosphate (NaH2PO4•H2O) to achieve a test concentration of 0.18 mg/L NaH2PO4•H2O. Stir and transfer to the test container.
5. Add calcium chloride (CaCl2) to achieve a test concentration of 111mg/L CaCl2. Stir and transfer to the test container.
6. Adjust the pH of the solution using HCl or NaOH to 6.5±0.25 for the low pH test and to pH 8.5±0.25 for the high pH test.
7. Add arsenic solution in the test container, depending on the desired concentration of arsenate in the water. For these experiments enough arsenic solution was added to reach a concentration of 100 µg/L of As(V).
8. Mix and measure the final pH and adjust as needed. 9. For vanadium tests, instead of adding sodium silicate in step 2, sodium vanadium
(Na3VO4) is added to achieve 0.36 mg/L Na3VO4. Table 2.1 Modified NSFI-53 challenge water formulation (only modification was pH
levels other than 6.5 or 8.5)
Parameter Target Value Mg+2 12 mg/L SO4
-2 50 mg/L NO3
-1-N 2.0 mg/L
F-1 1 mg/L SiO2 20 mg/L
PO4
-3-P 0.04 mg/L Ca+2 40 mg/L
As(V) 100 µg/L
Temperature 20oC±2.5oC Turbidity < 1 NTU pH 6.5±0.25 or 8.5±0.25
And other levels

10
BATCH ARSENIC ADSORPTION EXPERIMENTS
All Fe-GAC was hydrated in water prior to use in batch experiments. Water was decanted and Fe-GAC masses were measured wet on a balance. Linear correlations were developed between wet and dry masses. All data is reported on dry-mass basis. Fixed masses (4 to >1000 mg dry weight) of Fe-GAC were measured and added to HDPE Nalgene bottles (250-mL, 500-mL, or 1-L) containing the test solution with arsenic. The sample bottles were placed in a mechanical shaker at low speed for approximately 24 to 72 hours. Then the samples were filtered (0.45µm Whatman) to remove the Fe-GAC media. Filtered samples were stored in clean Nalgene bottles, acidified with high purity nitric acid (for metals) and analyzed for arsenic or other parameters. Experiments with arsenic were conducted in 100-mL amber glass serum bottles (Fisher Scientific) with gas-tight septa lids were used. Adsorption data were fit using the Freundlich adsorption isotherm model, which had equivalent fits as other isotherm model formulations:
)/1( nECKq ×= (2.3)
Where
q = adsorption capacity; (μg Adsorbate/g adsorbent) K = the Freundlich adsorption capacity parameter; [(μg adsorbate/g adsorbent) x (L/μg adsorbate)1/n] CE = the equilibrium concentration of adsorbate in solution; (μg adsorbate/L) 1/n = Freundlich adsorption intensity parameter; (unitless)
RAPID SMALL SCALE COLUMN TESTS
Rapid Small Scale Column Tests (RSSCTs) were developed in the 1980’s to evaluate removal of organics by GAC in hydrodynamically-scaled laboratory columns based upon pilot- and full-scale operational parameters (GAC media size, loading rates, EBCT, etc.). This concept was extended for arsenic testing using porous metal oxide (Badruzzaman 2002). Scaling can be based either upon proportional (PD) or constant (CD) diffusivity assumptions (Table 2.2). For arsenic removal by porous metal oxides (e.g., GFH, E33, AAFS50, etc) it was concluded that PD scaling was most appropriate (Badruzzaman 2002). Both PD and CD designs were applied for comparing RSSCT performance for arsenic removal against pilot-scale performance. Figure 2.1 shows the main components for the RSSCT and a schematic of a typical set up. The list of parts and procedure to pack a glass column is described as follows: 1. Material and Components:
• Small glass column with diameter of 1.1 cm and a length of 30 cm (Ace Glass)
• Inlet endcaps with filter ring and outlet endcaps with o-ring (Spectrum Chromatography)

11
• Glass wool • 5 mm diameter-borosilicate glass beads (VWR) • Teflon tubing of 3.2 mm diameter (Spectrum Chromatography) • QG150 piston pumps (Fluid Metering Incorporated, FMI) • Influent HDPE Nalgene storage containers (50 to 150 gallons) for the
groundwater • Pumps (FMI QG150 piston pumps with Q2CSC pump heads) delivered
water from the influent storage tanks to the RSSCT influent.
2. Operational Procedure: • A clean glass column with the outlet endcap is filled with ultrapure water
and glass wool added. • 5 mm diameter glass beads are added to disperse the influent flow. • Approximately 1 cm of glass wool is added at the top of glass beads to
support the media. • The Fe-GAC media (100x140 mesh) is added using ultrapure water to
flush the material down until reaching the required length or mass. • After packing the media, it was backwashed to remove the fines at a low
flow rate (~10-mL/min) in up flow mode with ultrapure water until the effluent looked clear.
• Once the media is backwashed, 1 cm of glass wool is added followed by glass beads.
• The endcaps are connected to the Teflon tubing (inlets to the pumps and raw outlets to sample waste/collection points). It is critical to maintain the sample waste/collection tube elevation at an elevation above the inlet end-cap of the RSSCT column to prevent air bubbles from entering the packed bed.
• RSSCT effluent water samples were collected from a constant head location approximately 10 cm above the column. Effluent samples were collected directly from the outlet Teflon tubing line into 60-mL HDPE HDPE Nalgene bottles, and then acidified with high purity nitric acid.

12
Table 2.2 RSSCT scaling equations
Item Specific Relationships
Constant Diffusivity (CD: X=0) LC
SC
X
LCp
SCp
LC
SC
tt
dd
EBCTEBCT
=⎥⎥⎦
⎤
⎢⎢⎣
⎡=
−2
,
, ⎥⎥⎦
⎤
⎢⎢⎣
⎡=
LCp
SCp
LC
SC
dd
VV
,
,
Proportional Diffusivity (PD; X=1) LC
SC
LCp
SCp
LC
SC
tt
dd
EBCTEBCT
=⎥⎥⎦
⎤
⎢⎢⎣
⎡=
,
, X
LCp
SCp
LC
SC
dd
DD
⎥⎥⎦
⎤
⎢⎢⎣
⎡=
,
,
General Relationships Sc
Scdd
VV
LC
SC
LCp
SCp
LC
SC
××
×⎥⎥⎦
⎤
⎢⎢⎣
⎡=
ReRe
,
,
μρ dV pL ××
=Re LLD
Scρ
μ×
=
Figure 2.1 Schematic and photograph of a RSSCT set-up
OUTLET ENDCAP
O-RING
GLASS BEAD
TEFLON SLEEVE, 1.0 cm LONG
100 MESH S.S SCREENTEFLON SLEEVE, 0.3 cm LONG
WHITE SAND
GRANULAR ACTIVATED CARBON (GAC)
GLASS BEAD
GLASS WOOL
O-RING
INLET ENDCAP
1.1 X 60 cm GLASS COLUMN1.5 cm
10.0 cm
3.0 cm
23.4 cm
0.5 cm1.0 cm0.1 cm
3.0 cm
19.0 cm
1.5 cm

13
PILIOT TESTS
Two pilot tests were conducted using Fe-GAC synthesized by Solmetex Inc. in 4 to 8 L batch modes using Process I for iron impregnation. One test was conducted by Solmetex Inc. near Leicester, MA. The second test was conducted by Sandia National Laboratories as part of the Arsenic Partnership at Socorro Springs, NM. Details on the pilot test facilities and operations are presented in Chapter 3.
ANALYTICAL METHODS
Sample Preservation
Samples that were collected for trace metals analysis or for arsenic measurements were preserved with nitric acid (JT Baker ultra pure reagent grade Ultrex II Nitric). 0.15% total volume of nitric acid was added to the 250-mL and 60-mL sample bottles for a result of approximately 350 µL and 90 µL of acid, respectively. All samples acidified achieved a pH of around 2.0 units. Samples were stored in the dark at 4oC until the time of analysis.
Glassware Cleaning Procedure
All glassware, bottles and glass RSSCT were rinsed with ultrapure water before being submerged in a 10 % nitric acid bath for 24 hours prior to their use. Then equipment was immediately rinsed with ultrapure water at least three times and allowed to air dry. Clean bottles were stored and placed in ziplock plastic bags before their use to prevent contamination.
Iron and Manganese Analysis by Inductively Coupled Plasma (ICP)
The instrument used for the manganese and iron analysis is a thermo iCAP 6300 ICP-OES (inductively coupled plasma). This particular inductively coupled plasma (ICP) allows analysis of multiple elements simultaneously. All samples were acidified with nitric acid before analysis. The iCAP 6300 ICP-OES allows one to set up a method to analyze element(s) of interest. All samples were run 3 times and then the result is averaged. For the analysis of iron, three different wavelengths (238.2, 204.4, and 259.9) were used and the result from each wavelength was then averaged for the final concentration and for manganese, two different wavelengths were used (257.6 and 279.4). These wavelengths were chosen to make sure that the result was not interfered by any other elements that are in the solution. This instrument was calibrated using freshly prepared iron and manganese standards using an atomic spectral standard from VHG labs. The manganese solution and the iron solution contain 999.9 µg/L and 1000 µg/L, respectively, in a matrix of 5% HNO3 which were blended to reach the operating range for the instrument (1, 10, 50, and 100 ug/L).
14
10% nitric acid was also added to reach the same characteristics of the water samples. A blank was also used containing only 15% nitric acid. A five-point calibration curve was developed. The 50 µg/L was also used as the quality control sample (QC). QC was run for every 5 samples. All glassware used for the standards preparation was cleaned following the same procedure described in the Glassware Cleaning Procedure prior to use. For samples requiring dilution, ultrapure water were added using an auto pipette was used to dispense the required ultrapure solution into the desired volume (up to 20 mL) depending on the dilution factor. The solution are then mixed by covering the tube with parafilm and shaken. All samples were acid digested prior to analysis on the ICP. Wet Fe-GAC resin were weighed and placed in a 104oC oven for 24 hours to remove any moisture and is then weighed again (dry weight). Dry Fe-GAC resins are then digested in a concentrated HNO3 and 30% H2O2 (USEPA SWA 846, Method 3050B). Digested solution is then filtered using a particle retention >11 μm (Whatman grade 1) purchased from Fisher Scientific. Samples are then stored in a HDPE Nalgene bottle and refrigerated at 4oC until further analysis.
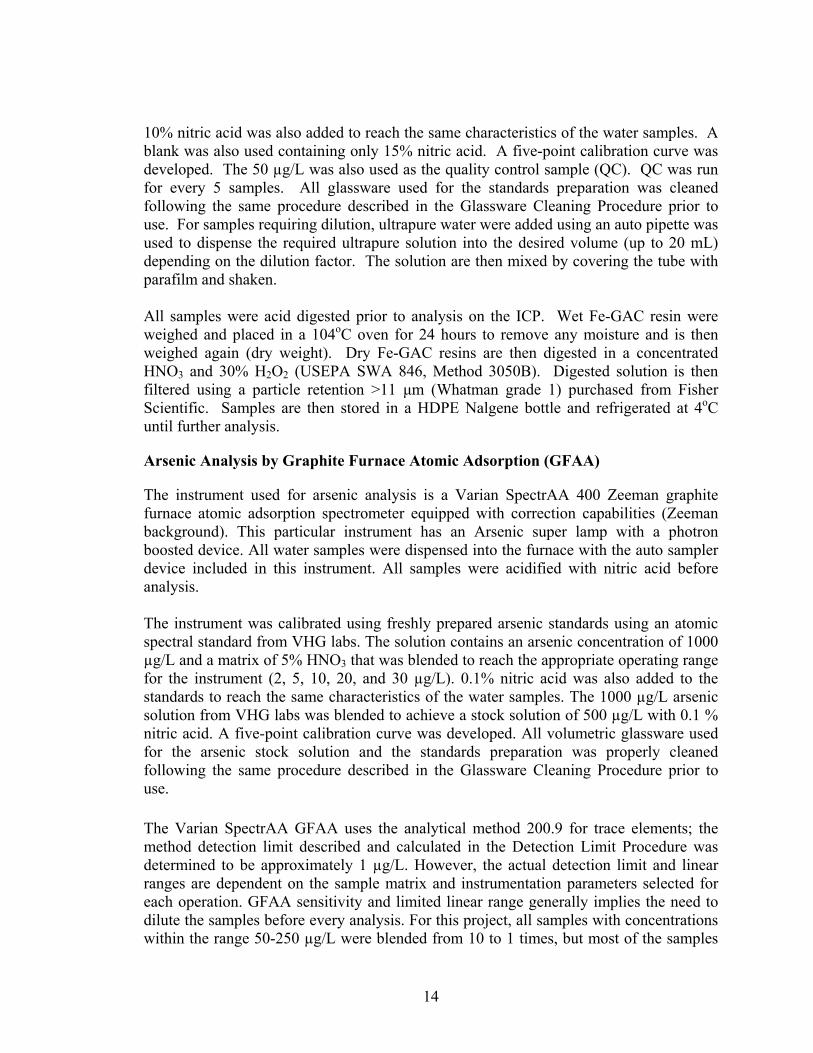
Arsenic Analysis by Graphite Furnace Atomic Adsorption (GFAA)
The instrument used for arsenic analysis is a Varian SpectrAA 400 Zeeman graphite furnace atomic adsorption spectrometer equipped with correction capabilities (Zeeman background). This particular instrument has an Arsenic super lamp with a photron boosted device. All water samples were dispensed into the furnace with the auto sampler device included in this instrument. All samples were acidified with nitric acid before analysis. The instrument was calibrated using freshly prepared arsenic standards using an atomic spectral standard from VHG labs. The solution contains an arsenic concentration of 1000 µg/L and a matrix of 5% HNO3 that was blended to reach the appropriate operating range for the instrument (2, 5, 10, 20, and 30 µg/L). 0.1% nitric acid was also added to the standards to reach the same characteristics of the water samples. The 1000 µg/L arsenic solution from VHG labs was blended to achieve a stock solution of 500 µg/L with 0.1 % nitric acid. A five-point calibration curve was developed. All volumetric glassware used for the arsenic stock solution and the standards preparation was properly cleaned following the same procedure described in the Glassware Cleaning Procedure prior to use. The Varian SpectrAA GFAA uses the analytical method 200.9 for trace elements; the method detection limit described and calculated in the Detection Limit Procedure was determined to be approximately 1 µg/L. However, the actual detection limit and linear ranges are dependent on the sample matrix and instrumentation parameters selected for each operation. GFAA sensitivity and limited linear range generally implies the need to dilute the samples before every analysis. For this project, all samples with concentrations within the range 50-250 µg/L were blended from 10 to 1 times, but most of the samples
15
fell within the range of the standard curve calibration of 2-30 µg/L. For the sample dilution preparation, a stock of ultrapure water solution with 0.1% nitric acid was made every time. An auto pipette was then used to dispense the required ultrapure solution in the 2-mL disposable cups used for the samples analysis; the second step was to add (with a different clean pipette) the required amount of the water sample depending of the dilution factor. Then the total volume of the sample in the cup was mixed using the auto pipette to remove approximately one-third of the volume and then re-dispensed again into the cup several times to allow a complete and efficient dilution of the water sample. The procedure was repeated for each sample using clean pipettes every time.
Water samples were analyzed by GFAA with the use of a standard calibration curve with a range of 2-30µg/L. An external Quality Control (QC) Check Standard was purchased from VHG Labs and prepared for an arsenic concentration of 10µg/L following the proper instructions to compare and verify the accuracy of the calibration standards. This verification with the quality control sample was realized every nine samples through the complete analysis. In every analysis the standard deviation of these external quality control samples was calculated and the variation was always less than 10%. The variability of this sample fluctuated between 8 to 11 ppb.
The determination of the Method Detection Limit (MDL) was followed in accordance to the guidelines described in Appendix B of the Federal Register. Seven aliquots of the estimated MDL value were prepared at five times the desired detection limit, in this case of 1 µg/L. The MDL was determined to be 0.57 μg/L.
Zeta Potential (iso-electric point measurement)
The ZetaPALS instrument by Brookhaven Instrument Corporation, Hotsville, NY (Brookhaven Instrument Corporation, 2004) equipped with the Phase Analysis Light Scattering (PALS) was used to determine zeta potential. Wet resins are ground in a mortar and wet sieved through a 170 x 200 mesh size USA Standard Test Sieve ASTM E-11 stainless steel sieve and air dried for at least 24 hours. Samples (~10mg of dried material) was added to 500 mL 10 mM KNO3 and allowed to set over night at a desired pH (0.1 M KOH and 0.1 M HNO3).
Spectroscopic Characterization
X-ray diffraction (XRD) analysis and X-ray photoelectron spectroscopy (XPS) analysis were performed on Fe-impregnated GAC samples for characterization of the materials. The XPS and XRD tests were helped to measure the critical parameters of each different composite and were preformed after each modification. A scanning auger microprobe surface analysis system (XRA TOS XSAM 800, XL30 by FEI), focused ion beam (Nova 200 NanoLab) and a high resolution X-ray diffract meter (Micro photonics, Allenton, PA) equipped with Cu Kα radiation (40KV, 25mA) was used.
16
pH Measurement
For water samples required for temperature and pH measurements, a φ240 Beckman basic meter which includes a pH indicating electrode, an automatic temperature probe and a different range of pH buffers (1.68, 4.00, 7.00, 10.01, and 12.45) was used. This instrument is equipped with selectable resolution, automatic temperature compensation (ATC), Auto-FindTM that automatically recognizes stored buffers, and Auto-ReadTM to lock onto stable readings. The electrode and automatic temperature compensator probe were rinsed with deionized water and the excess blotted free using KimwipesTM. Then the electrodes were stirred briefly in the samples and the readings recorded. The same procedure was followed for each sample.
Other Methods
The metal content of Fe-GAC media were determined by acid digestion of the dry Fe-GAC media in concentrated HNO3 and 30% H2O2 (US EPA SW-846, Method 3050B) followed by flame-atomic absorption spectroscopy (Varian Spectra 50B) (US EPA, 1996). Before the acid digestion, Fe-GAC media was powdered and dried at 104oC to constant mass to remove any moisture present. Permanganate concentration was measured using UV/VIS spectrophotometer (Jenway 6405, Barloworld Scientific Ltd., UK) according to Analytical Method 102 (Carus Chemical Company, 2004). Adsorbent media density and porosity were evaluated following a procedure described in Sontheimer et al. (1988).
17
CHAPTER 3 FE-GAC PILOT TESTING TO REMOVE ARSENIC
Evaluation of Fe-GAC at the pilot scale was a major objective for Phase II. Pilot tests were conducted using down-flow packed-bed configurations. Breakthrough curves for arsenic and other elements were monitored over time. Spent media was recovered and analyzed (leaching potential and surface spectroscopic analysis) after the pilot test. Water from each pilot site was shipped to ASU where RSSCTs were performed, so that data from the two experimental scales could be compared. Water quality, pilot configurations and results for each site are described separately, and then the outcome from the two pilot tests are summarized at the end of this chapter.
Solmetex synthesized, using Process I (see Chapter 4), two batches of Fe-GAC using Norit HD3000 base material for the two pilot tests (Massachusetts and New Mexico). The first batch of Fe synthesized at this slightly larger scale (4 to 8 liters of media) resulted in a slightly lower iron content compared to batch synthesis of < 50 mL. The iron content of the Fe-GAC was 6.5% and 7.8% for the Massachusetts and New Mexico pilot tests, respectively. Batch isotherms were conducted with both media in a modified NSFI-53 water (pH 7.0; As(V) = 70 ppb). Because of the differences in iron content, Fe-GAC used at the New Mexico site (q = 0.32Ce
0.81; R2=0.97; q has units of μgAs per mg dry Fe-GAC) had approximately a 25% greater capacity for arsenic in this modified NSF53 water, compared with the Fe-GAC used at the Massachusetts site.
MASSACHUSETTS PILOT TEST
Water Quality and System Configuration
The pilot test ran from June 2006 through February 6, 2007. Table 3.1 summarizes the water quality of this site. Phosphorous was not routinely measured, but was present at over 50 ppb in some samples. Table 3.2 summarizes the pilot system design. Figure 3.1 is a photograph of the pilot system. The pilot system is designed with an empty bed contact time (EBCT) of 5 minutes. Five sampling ports are located at different depth of the column (S1, S2, S3, S4 and S5) for sampling at different location to be taken and compared. S1 is the first station located at the top of the packed Fe-GAC column (the influent point) where As are first introduced, S2 is the second sampling point below S1 at a column depth of 24.2 cm, S3 is the third sampling station located below S1 and S2 at a column depth of 61.2 cm, S4 is the fourth sampling station located below S1, S2, and S3 at a column depth of 98.1 cm, and S5 is the last sampling station located at the bottom of the column (where the effluent takes place) at a depth of 135 cm. The EBCT at S1, S2, S3, S4, and S5 were 0 min, 0.9 min, 2.27 min., 3.64 min., and 5 min., respectively. 2.7 L of Fe-GAC media was loaded into the column with an iron content of 6.5%.

18
Table 3.1 – Water Quality for Pilot Tests with Fe-GAC Parameter Massachusetts Pilot New Mexico Pilot
pH 6.8 8.0 Temperature (oC) varied seasonally 30
Total Arsenic (ppb) 21± 2.5 42 Iron (ppm) 0.03 0.038
Hardness (ppm CaCO3) 89 60 Conductivity (uS/cm) 376 360
TDS (ppm) 220 NA Silica (ppm) 13.1 25
Total organic carbon (ppm) 0.44 NA Chloride (ppm) 55.3 11.5
Alkalinity (ppm CaCO3) 48 123 Sulfate (ppm) 21 29
Fluoride (ppm) 0.2 0.6 Free chlorine (mgCl2/L) Non-chlorinated 0.5 to 0.8
Table 3.2 - Pilot system design Design Parameters Massachusetts Pilot New Mexico Pilot Iron content of Fe-GAC 6.5% 7.8% Column Diameter (cm) 5.08 7.62 Column Height (cm) 93.3 87.08 Flow Rate (mL/min) 378 945 EBCT (min) 5 4.2 Media Size Mesh Size 8x30 8x30 Mean Diam. (cm) 1.49 1.49

19
Figure 3.1 – Massachusetts pilot test system and location of sampling ports
Arsenic Breakthrough
The initial As (V) concentration is 21 ppb (ug/L). Figure 3.2 shows arsenic concentration taken at different station (S1-S5). Arsenic was removed throughout the test. Arsenic breakthrough first at port S1 and then was detected later at deeper ports, representing longer EBCTs. At port S1 arsenic concentrations were quite variable, and may have been maintenance activities that impacted the upper part of the packed bed, which included: 1) shaking the column to get bubbles out, 2) relocation of columns from outside to indoor location, 3) accidentially increasing flowrate for short durations. Two of the three spikes at S1 were associated with backwashing or moving of the column. No such variations were observed at the other ports. The gradual breakthrough of arsenic occurred moving down the column (S1→S5).
Figure 3.3 illustrates data from the same pilot data plotted as a function of bed volumes treated to each port, instead of time of operation (Figure 3.2). Between June 6, 2006 and February 6, 2007 the pilot system operated for 75,500 bed volumes at an EBCT of 5 minutes. The Fe-GAC material lasted longer than initially thought, and only reached 50% breakthrough after 75,000 bed volumes (Figure 3.3). The shape of the breakthrough curve was almost independent of EBCT (Figure 3.3) based upon the EBCT to sample
S1 (Influent)
S5 (Effluent) EBCT = 5 min
S2 EBCT = 0.9 min
S3 EBCT = 2.3 min
S4 EBCT = 3.6 min

20
port 2(0.9 min), sample port 3 (2.3 min) and sample port 4 (3.6 min) and the effluent from the entire column at sample point 5 (5 min). Based upon the breakthrough curve for S3 it is reasonable to conclude that the Fe-GAC would not reach complete breakthrough until ~125,000 bed volumes. Table 3.3 summarizes the calculated adsorption capacity for arsenic from the pilot and RSSCT breakthrough curves and the mass of Fe-GAC in the columns. Following from the discussion above the RSSCTs underestimated the arsenic adsorption capacity observed in the pilot system Table 3.3 Calculated arsenic adsorption capacity (μgAs/mgFe-GAC) from pilot and
RSSCT column experiments at the point when the effluent arsenic concentration (Ce) equals 10 ppb
Location Arsenic adsorption capacity (q)
(μgAs/mgFe-GAC) Massachusetts water source Pilot system PD-RSSCT (pH 6.8) PD-RSSCT (pH 8.0) CD-RSSCT (pH 8.0)
0.59 0.16 0.13 0.05
New Mexico Water Source Pilot PD-RSSCT CD-RSSCT
0.65 0.25 0.02
Air bubbles where observed in the packed bed column in mid-September 2006, which suggested actual EBCTs may be lower than reported (i.e., more bed volumes treated). On October 6, 2006 the columns were moved indoors because cold weather posed a potential freeze concern issue. The system was periodically backwashed, but routinely operated with only a 1 to 3 psi pressure drop across the column. No other operational problems were encountered.

21
0
5
10
15
20
25
30
35
40
45
50
Jun-06 Jul-06 Jul-06 Aug-06 Sep-06 Oct-06 Nov-06 Dec-06 Jan-07
Ars
enic
Con
cent
ratio
n (p
pb) .
Effluent (S5)S4S3S2Influent (S1)
Figure 3.2 – Arsenic breakthrough for Massachusetts pilot column for different ports located at depth in the column

22
0
10
20
0 20000 40000 60000 80000 100000 120000 140000
Bed Volumes Treated to Sampling Port
Ars
enic
Con
cent
ratio
n (p
pb) .
Effluent (S5)S4S3S2
Figure 3.3 – Arsenic breakthrough for Massachusetts pilot column for different ports located at depth in the column normalized to bed volumes treated at each port
Analysis of Spent Media
TCLP Analysis
Spent samples from the top of the column, with the highest arsenic load, were sent to GZA Environmental Inc. for toxicity characteristic leaching procedure (TCLP) testing. TCLP test classify whether the As-loaded product is hazardous or non-hazardous. This test follows the EPA 1311/6010 and EPA 1311/7470A analytical method. Table 3.4 shows the concentration (mg/L) of each metal tested and the allowable limits the EPA allows. The components of concern are: silver (Ag), arsenic (As), cadmium (Cd), chromium (Cr), lead (Pb), selenium (Se), and mercury (Hg). The maximum contaminant level (MCL) or allowable concentration permitted by the EPA are 0.1 mg/L, 0.01 mg/L, 2 mg/L, 0.005 mg/L, 0.1 mg/L, 0.002 mg/L, 0.015 mg/L, and 0.05 mg/L for Ag, As, Ba, Cd, Cr, Hg, Pb, and Se, respectively, which are below the acceptable levels. This concludes that the spent Fe-GAC in the column is non-hazardous under current RCRA regulations.

23
Table 3.4 - Quality control, acceptable limits from TCLP test for spent material for the Massachusetts pilot test
Analyte Allowable Level
(mg/L) Observed Concentration for
spent Fe-GAC (mg/L) Silver (Ag) 0.1 < 0.010
Arsenic (As) 0.01 < 0.01 Barium (Ba) 2 < 1.0
Cadmium (Cd) 0.005 < 0.0050 Chromium (Cr) 0.1 < 0.0050 Mercury (Hg) 0.002 < 0.0004
Lead (Pb) 0.015 < 0.015 Selenium (Se) 0.05 < 0.05
Complete Acid Digestion
To determine what other factors (elements) affect Fe-GACs ability to remove As (V), spent materials collected at five different locations (S1 (top), S2-S4 (middle), and S5 (bottom) of the Massachusetts pilot test packed-bed column, as well as the virgin material (virgin Norit HD 3000) and virgin Fe-GAC treated material were analyzed. Samples were acid digested and analyzed using the inductively coupled plasma mass spectrometry (ICPMS). Table 3.5 lists the elements with highest concentration compared to other elements tested (sodium, aluminum, calcium, titanium, manganese, iron, and arsenic) for spent material at different sampling station, virgin material, and virgin Fe-GAC. The concentration was reported as ppm or mg/kg of dry solid. The numbers may be slightly lower than expected due to incomplete digestion. Comparing the virgin Norit HD 3000, Fe-GAC contained more sodium, aluminum, manganese and iron. These mostly come from the reagents used to synthesize the Fe-GAC. The spent media (S1 through S5) exhibited a gradient of arsenic content in the media, with highest As concentration near the top. Therefore, a mass transfer zone for arsenic appears to exist within the Fe-GAC adsorbent packed bed system operated at the pilot scale. There was more iron and calcium in the spent media than un-used Fe-GAC, which implies slight removal of these elements by the packed bed pilot system.

24
Table 3.5 - Concentration of distinctive elements found on spent materials located at different ports from the Massachusetts pilot test column in comparison to the virgin material (Norit HD 3000) and the virgin Fe-GAC (ppm, mg/kg dry solid)
Sample Name Na
(ppm) Al
(ppm) Ca
(ppm) Ti
(ppm) Mn
(ppm) Fe
(ppm) As
(ppm) S1 2130 10100 6100 1900 1230 72800 2080 S2 2300 7700 6700 1460 1800 89200 2370 S3 2240 8850 6700 1900 960 87000 1940 S4 2210 8640 5960 1690 737 79600 1270 S5 2910 13200 6700 1790 661 76000 1140 Virgin HD3000 5970 8400 3350 1630 20.3 1440 10 Fe GAC 7640 11090 3150 1600 970 45460 6.1
Spectroscopy Analysis
Scanning electron microscopy (SEM) and energy dispersive x-ray (EDX) analysis was conducted on un-used and spent Fe-GAC. The major components found in the virgin material were: carbon (C), oxygen (O), Silica (Si), and sulfur (S) (Table 3.6). As for the spent material, the major components were C, O, Si, calcium (Ca), and iron (Fe). All of the components summed up to 100 wt %. The results confirm show that the near surface of the Fe-GAC (beam penetrates about 1 micron into sample) is enriched in iron and depleted in carbon, relative to virgin GAC, because iron oxides coat the surface of the GAC. Oxygen content decreases with depth in the Fe-GAC column (S1-S3-S5). Oxygen is present in the iron (hydr)oxide. With use, other minerals are bonding with the oxygen and forming coatings on the Fe-GAC. Table 3.6 - Weight percent (wt%) of elements on the surface of spent material used at Massachusetts Pilot Test at different location of the column and virgin Norit HD
3000 from SEM/EDX analysis Sample ID Carbon Oxygen Silica Calcium Sulfur Iron
Top 32.6 11.2 3.3 2.0 NA 50.9 Middle
(near S3) 52.1 16.8 3.3 1.1 NA 26.7 Bottom 56.1 20.4 3.1 1.0 NA 19.4
Virgin HD 3000 91.6 4.6 3.2 <0.1 0.6 <0.1
Figure 3.4 through 3.7 show the SEM and EDX traces of the spent material from the top, middle, bottom, and virgin Norit HD 3000, respectively. The solid line through the SEM pictures corresponds to the normalized distance on the graph below each EDX image. The graph gives the normalized counts, which is proportional to the percent of the each element that was detected at a specific location. EDX images show the elements that

25
were found in the GAC pores. These images resulted from a beam of electrons hitting the surface of the media, and are refracted back. The electrons penetrate about 1 µm below the surface. The refracted electrons are collected with a detector, and based on their energy it can be determined from what kind of element they come from. The puff-like clouds resulted from the charging when electrons hit nonconductive element such as Si. The virgin material is comprised mainly of carbon (91.6%), a small amount of oxygen (4.6%), silica (3.2%), and very little sulfur (0.6%) (EDX is not shown). The surface EDX analysis indicates most of the iron is irregularly distributed on the Fe-GAC grain.
Pore and Surface Area Analysis
Tables 3.7 and 3.8 summarize analysis conducted by Clemson University on unused and spent Fe-GAC from the Massachusetts pilot test. There is a slight reduction in the total surface area and pore volume after use in the field. This appears to be the result of inaccessible smaller sized pores, which presumably are being blocked by precipitates.
Table 3.7 – Surface area and pore volume analysis for unused and spent Fe-GAC material
Sample Name SBET Vt Vmicro Vmeso+macro
(m2/g) (cm3/g) (cm3/g) (cm3/g) Virgin Fe-GAC 602 0.465 0.219 0.246 Virgin Fe-GAC (duplicate) 606 0.478 0.219 0.259 Spent Fe-GAC 532 0.434 0.189 0.245 Spent Fe-GAC (duplicate) 543 0.439 0.194 0.245
Table 3.8 – Distribution of pore volume and surface areas in different sized pores
for unused and spent Fe-GAC material
Sample Name DFT Pore Volume Distribution (cm3/g) <100nm <1 nm >1 nm 1-2 nm 2-3 nm >3 nm
Virgin Fe-GAC 0.409 0.122 0.287 0.04 0.03 0.217 Virgin Fe-GAC (duplicate) 0.424 0.11 0.314 0.048 0.032 0.234 Spent Fe-GAC 0.386 0.088 0.298 0.047 0.033 0.218 Spent Fe-GAC (duplicate) 0.353 0.096 0.257 0.042 0.03 0.185
DFT Surface Area Distribution (m2/g) <100nm <1 nm >1 nm 1-2 nm 2-3 nm >3 nm
Virgin Fe-GAC 437 305 132 54 23 55 Virgin Fe-GAC (duplicate) 448 296 152 65 25 62 Spent Fe-GAC 383 237 146 64 26 82 Spent Fe-GAC (duplicate) 377 245 132 58 23 51
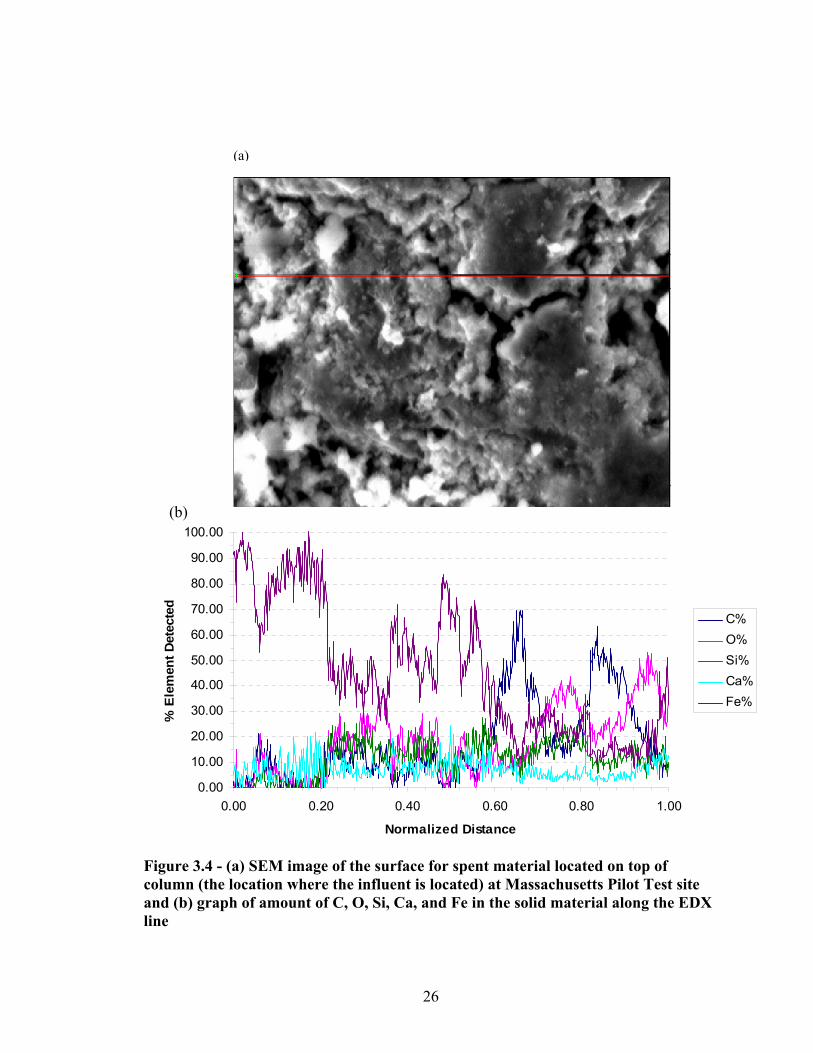
26
Figure 3.4 - (a) SEM image of the surface for spent material located on top of column (the location where the influent is located) at Massachusetts Pilot Test site and (b) graph of amount of C, O, Si, Ca, and Fe in the solid material along the EDX line
0.00
10.00
20.00
30.00
40.00
50.00
60.00
70.00
80.00
90.00
100.00
0.00 0.20 0.40 0.60 0.80 1.00
Normalized Distance
% E
lem
ent D
etec
ted
C%O%Si%Ca%Fe%
(b)
(a)

27
Figure 3.5 - (a) SEM image of the surface for spent material located in the middle of the column (at a column depth of 61.2 cm) at Massachusetts Pilot Test site and (b) graph of amount of C, O, Si, Ca, and Fe in the solid material along the EDX line
0.00
10.00
20.00
30.00
40.00
50.00
60.00
70.00
80.00
90.00
100.00
0.00 0.20 0.40 0.60 0.80 1.00
Normalized Distance
% E
lem
ent D
etec
ted
C%O%Si%Ca%Fe%
(b)
(a)
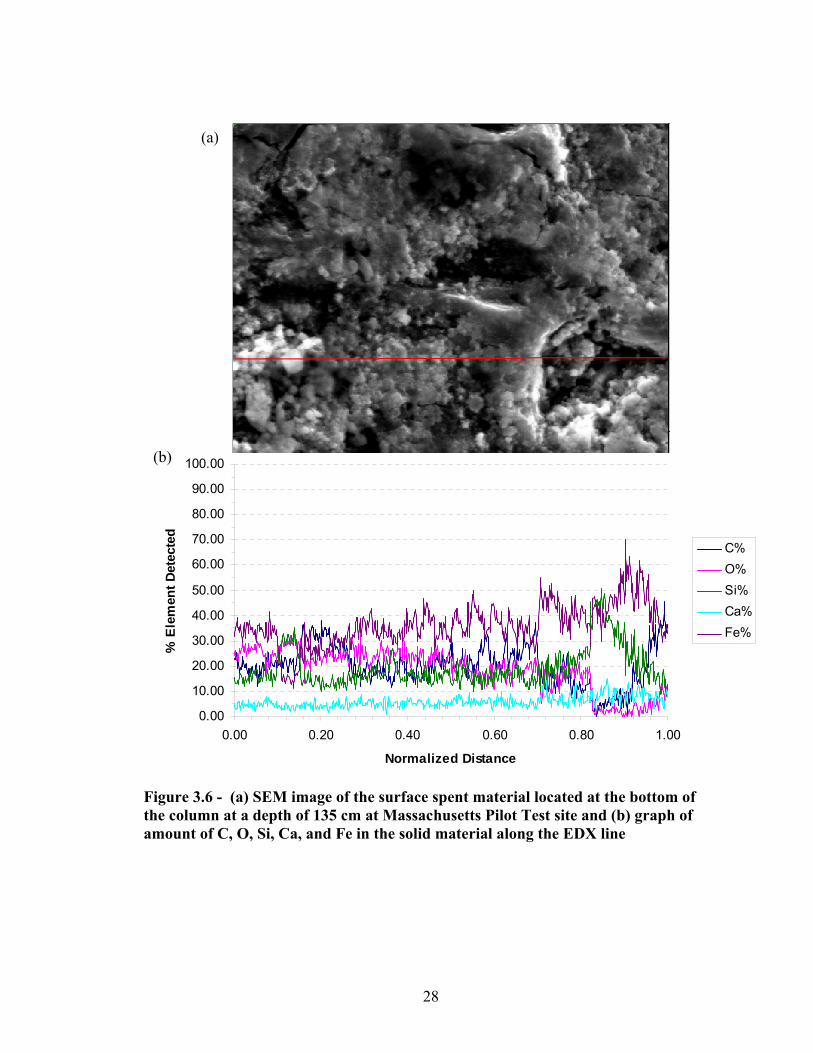
28
Figure 3.6 - (a) SEM image of the surface spent material located at the bottom of the column at a depth of 135 cm at Massachusetts Pilot Test site and (b) graph of amount of C, O, Si, Ca, and Fe in the solid material along the EDX line
0.00
10.00
20.00
30.00
40.00
50.00
60.00
70.00
80.00
90.00
100.00
0.00 0.20 0.40 0.60 0.80 1.00
Normalized Distance
% E
lem
ent D
etec
ted
C%O%Si%Ca%Fe%
(b)
(a)

29
Figure 3.7 - SEM images of virgin Norit HD 3000 at two different levels of magnification
NEW MEXICO PILOT TEST
The New Mexico pilot test was set up at Socorro Spring, New Mexico. Water quality and pilot plant system design is presented in Tables 3.1 and 3.2. This pilot site also used Norit Fe-GAC provided by Solmetex. The pilot system is designed with an empty bed contact time (EBCT) of 4.2 minutes. Full-sized Fe-GAC media was loaded into the column with an iron content of 7.05 wt %. The test operated October of 2006 through February 2007. Carbon dioxide was used to control the pH for this Fe-GAC column, and other pilot columns running simultaneously at the site. The influent arsenic concentration is 45 ppb (ug/L) where the influent pH ranged from 6.45 to 7.27 and the effluent pH ranged from 6.45 to 7.57. The data for arsenic breakthrough of the New Mexico pilot test is presented in Figure 3.8. A gradual breakthrough was observed until roughly 25,000 bed volumes when effluent arsenic exceeded the influent arsenic. The sudden spike was due to a broken acid feed. During this period, the acid feed was lost and the pH increased to pH > 9 which represented the natural water pH. After repair, the Fe-GAC removed nearly 30 ppb of arsenic, although effluent arsenic levels remained above the MCL of 10 ppb. Analysis of spent media was not provided from Sandia.

30
0
10
20
30
40
50
60
0 5000 10000 15000 20000 25000 30000 35000 40000
Bed Volumes Treated
Arse
nic
Con
cent
ratio
n (p
pb)
.
Influent As
As MCL
System restarted
Temporary shut-down
Short-term increase of influent pH excursion; increased to pH 9
Figure 3.8 - Arsenic breakthrough curve of pilot test using Fe-GAC for Socorro Springs in New Mexico Rapid Small Scale Column Tests Water samples collected at the Massachusetts pilot test and New Mexico pilot test were sent to ASU along with the Fe-GAC media for small scale column test (RSSCT). The purpose was to compare the performance of pilot scale systems to laboratory RSSCTs. Three RSSCTs were conducted using the crushed and wet sieved (100x140 mesh size; diameter of 0.0128 cm) Fe-GAC used at the Massachusetts pilot test using the water collected at the Massachusetts well site. Two were PD RSSCT, one at pH 8 and the other at pH 6.8, and the third is the CD test at pH 8. The influent arsenic concentration was 16 ppb. RSSCT columns had an inside diameter of 1.1 cm, media depth of 11.7 cm, a flow of 17.81 mL/min for PD RSSCT and 142.07 mL/min for CD RSSCT. The temperature of the water used for the RSSCTs at ASU was 22oC to 23oC. Other design parameters for the column test using water from the Massachusetts pilot site are reported in Table 3.9. For PD RSSCT at pH 6.8, CO2 gas was used to depress and maintain the pH. A comparison of the arsenic breakthrough curves for the pilot tests and RSSCTs with Massachusetts water is illustrated in Figure 3.9. The CD RSSCT breaks through almost

31
immediately. After approximately 38,000 bed volumes, the CD RSSCT was turned off for one week and then restarted. Initially arsenic removal is very good after the off-on cycle, but rapidly returns to the previous effluent arsenic level. CD RSSCTs are not a good representation of the pilot system. The PD RSSCT conducted at pH 8.0 breaks through in fewer bed volumes than the pilot test conducted at a reduced pH. The field pH was 6.7 (no acid addition). However, the groundwater apparently degassed and the pH rose to 8.0; the difference between field and lab pH was not noticed until after the experiment was complete. However, the RSSCT did match the general shape of the pilot breakthrough curve, but the RSSCT treated approximately 50% of the bed volumes as the pilot system to reach an equivalent effluent arsenic level. The pH of water is a critical parameter for arsenic removal, and a one pH unit difference (pH 8.0 versus 6.8) may explain some of the discrepancy between RSSCT and pilot breakthrough curves. A third RSSCT (PD) was attempted at pH 6.8, but during the first few thousand bed volumes the pH could not be controlled well. After control of the pH, the PD RSSCT and pilot test agreed moderately well. However, overall for this water, the RSSCTs did not adequately reflect the initial number of bed volumes to breakthrough or the “plateau” of arsenic removal observed during the pilot test. Table 3.9 - Column design parameters for Massachusetts pilot test and CD-RSSCT
and PD-RSSCT
Pilot column CD
RSSCT PD #1
RSSCT PD #2
RSSCT Temperature (oC) <10 to 25 oC 22-23 22-23 22-23 pH 6.67 8 8 6.8 Media Diameter (cm) 0.1026 0.0128 0.0128 0.0128 Media Depth (cm) 93.3 11.64 11.7 11.7 Flow rate (mL/min) 378 142 17.81 17.81 EBCT (min) 5 0.08 0.62 0.62 Column Diameter (cm) 5.08 1.1 1.1 1.1 Area (cm2) 20.26 0.95 0.95 0.95 Volume (cm3) 1890 2.77 11.12 11.12

32
0
2
4
6
8
10
12
14
16
18
0 10000 20000 30000 40000 50000 60000 70000 80000 90000 100000
Bed Volume
Efflu
ent A
s C
onc.
(ppb
)
Pilot- pH 6.8
CD RSSCT- pH 8
PD RSSCT- pH 8
PD RSSCT- pH 6.8
System shutdown
System back on
Figure 3.9 – Comparison of normalized arsenic breakthrough curves with water from the Massachusetts pilot system (pH 6.8 to 7.0), CD & PD RSSCTs (pH 8.0) and one PD RSSCT at pH 6.8 (background arsenic level was 45.6 ppb) Both CD and PD RSSCTs were also performed on water collected at New Mexico pilot site at pH 6.8 and an influent arsenic concentration of 45.6 ppb (ug/L) using Fe-GAC sent by the pilot site that was crushed and wet sieved to a 100x140 mesh size. CO2 was used to depress and maintain pH 6.8 for all RSSCTs. The column used for the RSSCTs is 1.1 cm in diameter, a media depth of 2.45 cm for CD RSSCT and 9.8 cm for PD RSSCT, a flow rate of 35.62 mL/min for CD RSSCT and 17.81 mL/min for PD RSSCT. Although the pH of the water at Socorro Spring in New Mexico has a pH 8, the pilot test uses an acid feed to maintain the influent water to a pH ranged from 6.45 to 7.27 and the measured effluent pH ranged from 6.45 to 7.57. The arsenic breakthrough result for CD, PD, and pilot test are shown in Figure 3.10. The CD RSSCT breakthrough occurred almost immediately after starting the column, while the PD RSSCT breakthrough curve is between that of the CD RSSCT and pilot column. Calculated arsenic adsorption capacities from the pilot tests are summarized in Table 3.3. Neither RSSCTs represented the pilot system well. The reasons for a poor correlation between RSSCT and pilot plant performance may be related to the distribution of iron with depth into (radial coordinate) the Fe-GAC. Chapters 4 and 5 will show that for Process I iron is deposited preferentially near the outer edges of a GAC particle. This is also evident in Figures 3.4 through 3.6 that show high iron content on the surface of Fe-GAC. Thus, the media is non-homogeneous.

33
When the media is crushed for RSSCTs both higher and lower iron bearing surfaces are exposed. The lack of homogeneity opposes a critical assumption for the use of RSSCTs and is probably the central reason why RSSCTs may be not viable for predicting full-scale performance of Fe-GAC produced by Process I. Process II of synthesizing Fe-GAC appears to create a more homogeneous distribution of iron within the GAC, and RSSCTs should be suitable for predicting the pilot performance for these system. However, Process II was not optimized until later in the study and pilot tests had already been concluded by that point. This is a point for future research.
Table 3.10 - Column design parameters for New Mexico pilot test RSSCTs
Pilot CD RSSCT PD RSSCT Temperature (oC) 30.1-30.5 22-23 22-23 pH 8 6.8 6.8 Media Diameter (cm) 0.1026 0.0128 0.0128 Media Depth (cm) 87.08 2.45 9.8 Flow rate (mL/min) 945 35.62 17.81 EBCT (min) 4.2 0.07 0.52 Column Diameter (cm) 7.62 1.1 1.1 Area (cm2) 45.58 0.95 0.95 Volume (cm3) 3969 2.33 9.3
0
10
20
30
40
50
60
0 5000 10000 15000 20000 25000 30000
Bed Volume
Efflu
ent A
rsen
ic (p
pb)
Pilot- pH 6.45-7.27
PD RSSC- pH 6.8
CD RSSCT- pH 6.8
.
pH increase to
9
system shutdow n
system turned
back on
Figure 3.10 - Arsenic breakthrough curve for CD and PD test at pH 6.8 in comparison with the New Mexico pilot system using the water from the New Mexico pilot test site and the same Fe-GAC

34
MODELING ARSENIC BREAKTHROUGH
Extensive research was conducted to understand potential reasons why RSSCTs did not adequate simulate pilot-scale arsenic breakthrough. One fruitful area of study was to model arsenic breakthrough in short bed adsorbers, which are continuously flowing packed beds that contain only 2.8 cm deep sieved, but not crushed Fe-GAC (0.6 mm diameter), in a 1.1 cm diameter glass column operated at a loading rate representative of field conditions (~5 gpm/ft2). Details of this work are presented elsewhere Hristovski (2007). Initial estimates for the external mass transport coefficient were based on the Gnielinski correlation (Sontheimer et al., 1988) (Constraints: ScRe× > 500; 0.6 ≤ Sc ≤ 104; 1 ≤ Re < 100; 0.26 < ε < 0.935; Re = Reynolds Number and Sc = Schmidt Number):
[ ] ( )3/12/1 ScRe644.02)1(5.11
××+××−+
=p
lf d
Dk
ε (3.1)
l
lpl vdμε
ρ×
××Φ×=Re (3.2)
ll
l
D×=ρμ
Sc (3.3)
kf is the external mass transport coefficient (calculated kf ≈ 6.2 x 10⁻³ cm s–1 and 5.5 x 10–
3 cm s–1 for Fe-GAC produced by Process I and Process II, respectively); Re is the Reynolds number (unitless); Sc is the Schmidt number (unitless); dp is the adsorbent particle diameter (dp = 0.6 x 10⁻³ m); Dl is the free liquid diffusivity for arsenate (Dl = 9.05 x 10⁻¹⁰ m2 s–1) (Lide, 2006); ε is the bed void fraction (ε ≈ 0.384 for M-3-15 Fe-GAC; and ε ≈ 0.308 for Mn-0.5-15 Fe-GAC); μl is the dynamic viscosity of water at 20 oC (1.002 x 10⁻³ N s m–2); ρl is the density of water at 20 oC (ρl = 998.2 kg m–3); Φ is the particle shape factor (Φ = 1.2); vl is the liquid superficial velocity (vl ≈ 3.45 x 10⁻³ m s–
1). Because Fe-GAC is very porous (the particle porosity εP ≈ 0.78), pore diffusion was the assumed dominant intraparticle mass transport over the surface diffusion, and the impact of surface diffusion was assumed negligible. As suggested by Sontheimer et al. (1988), the pore diffusion coefficient was estimated using Equation 3.4:
τε lP
PD
D×
= (3.4)
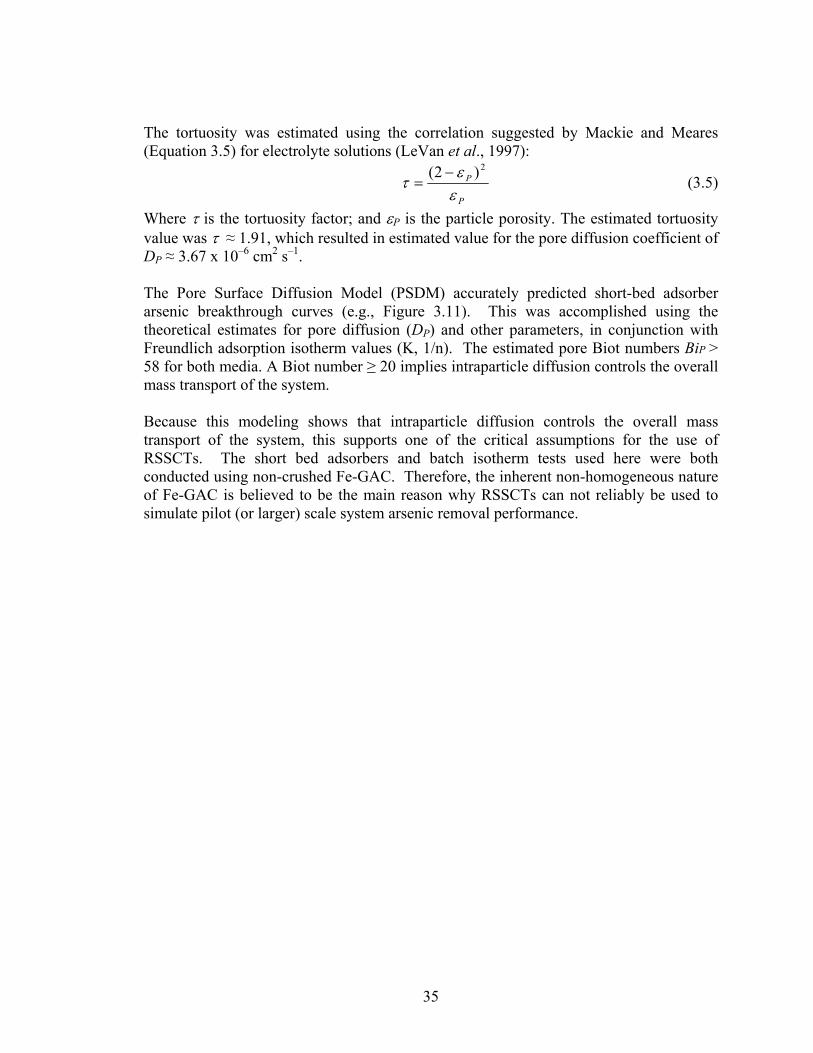
35
The tortuosity was estimated using the correlation suggested by Mackie and Meares (Equation 3.5) for electrolyte solutions (LeVan et al., 1997):
P
P
εε
τ2)2( −
= (3.5)
Where τ is the tortuosity factor; and εP is the particle porosity. The estimated tortuosity value was τ ≈ 1.91, which resulted in estimated value for the pore diffusion coefficient of DP ≈ 3.67 x 10⁻⁶ cm2 s–1. The Pore Surface Diffusion Model (PSDM) accurately predicted short-bed adsorber arsenic breakthrough curves (e.g., Figure 3.11). This was accomplished using the theoretical estimates for pore diffusion (DP) and other parameters, in conjunction with Freundlich adsorption isotherm values (K, 1/n). The estimated pore Biot numbers BiP > 58 for both media. A Biot number ≥ 20 implies intraparticle diffusion controls the overall mass transport of the system. Because this modeling shows that intraparticle diffusion controls the overall mass transport of the system, this supports one of the critical assumptions for the use of RSSCTs. The short bed adsorbers and batch isotherm tests used here were both conducted using non-crushed Fe-GAC. Therefore, the inherent non-homogeneous nature of Fe-GAC is believed to be the main reason why RSSCTs can not reliably be used to simulate pilot (or larger) scale system arsenic removal performance.
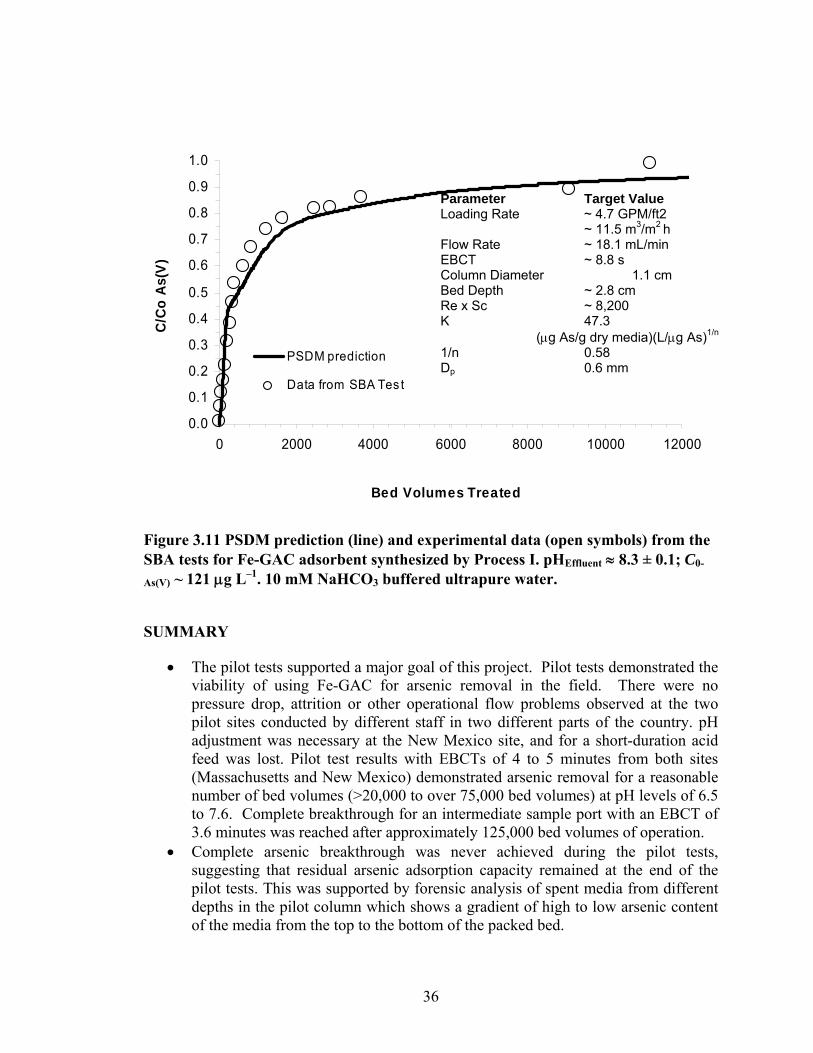
36
0.0
0.1
0.2
0.3
0.4
0.5
0.6
0.7
0.8
0.9
1.0
0 2000 4000 6000 8000 10000 12000
Bed Volumes Treated
C/Co
As(
V)
PSDM prediction
Data from SBA Tes t
Figure 3.11 PSDM prediction (line) and experimental data (open symbols) from the SBA tests for Fe-GAC adsorbent synthesized by Process I. pHEffluent ≈ 8.3 ± 0.1; C0-
As(V) ~ 121 μg L–1. 10 mM NaHCO3 buffered ultrapure water.
SUMMARY
• The pilot tests supported a major goal of this project. Pilot tests demonstrated the viability of using Fe-GAC for arsenic removal in the field. There were no pressure drop, attrition or other operational flow problems observed at the two pilot sites conducted by different staff in two different parts of the country. pH adjustment was necessary at the New Mexico site, and for a short-duration acid feed was lost. Pilot test results with EBCTs of 4 to 5 minutes from both sites (Massachusetts and New Mexico) demonstrated arsenic removal for a reasonable number of bed volumes (>20,000 to over 75,000 bed volumes) at pH levels of 6.5 to 7.6. Complete breakthrough for an intermediate sample port with an EBCT of 3.6 minutes was reached after approximately 125,000 bed volumes of operation.
• Complete arsenic breakthrough was never achieved during the pilot tests, suggesting that residual arsenic adsorption capacity remained at the end of the pilot tests. This was supported by forensic analysis of spent media from different depths in the pilot column which shows a gradient of high to low arsenic content of the media from the top to the bottom of the packed bed.
Parameter Target Value Loading Rate ~ 4.7 GPM/ft2 ~ 11.5 m3/m2 h Flow Rate ~ 18.1 mL/min EBCT ~ 8.8 s Column Diameter 1.1 cm Bed Depth ~ 2.8 cm Re x Sc ~ 8,200 K 47.3
(μg As/g dry media)(L/μg As)1/n
1/n 0.58 Dp 0.6 mm

37
• Silica did not appear to accumulate on the Fe-GAC, although some calcium was present.
• TCLP tests conducted at one pilot site confirmed that the media passed the TCLP test and could be disposed to conventional landfills as a non-hazardous waste.
• Proportional or constant diffusivity based designs for RSSCTs were not able to predict the pilot test performance for arsenic breakthrough. In all cases, the RSSCT broke through earlier than observed at the pilot tests.
• Short-bed adsorption tests using full-sized (not crushed) Fe-GAC concluded that mass transfer of arsenic in Fe-GAC packed bed applications is controlled by intraparticle diffusion. Modeling of Fe-GAC packed beds is feasible using the pore surface diffusion model, and calculated estimates of mass transfer parameters are valid for predicting arsenic removal.
• The reasons for a poor correlation between RSSCT and pilot plant performance may be related to the distribution of iron with depth into (radial coordinate) the Fe-GAC. The Fe-GAC used in the pilot tests were synthesized using Process I, which produces a non-homogenous media with higher iron content near the exterior of the GAC than near its core. The lack of homogeneity opposes a critical assumption for the use of RSSCTs and is probably the central reason why RSSCTs may be not viable for predicting full-scale performance of Fe-GAC produced by Process I.
• Process II of synthesizing Fe-GAC appears to create a more homogeneous distribution of iron within the GAC (Chapter 5), and RSSCTs should be suitable for predicting the pilot performance for these system. However, Process II was not optimized until later in the study and pilot tests had already been concluded by that point. This is a point for future research.

38
CHAPTER 4 MECHANISMS OF IRON IMPREGNATION FOR PROCESS-I SYNTHESIS OF FE-GAC
Process I for synthesizing Fe-GAC can be optimized by gaining a fundamental understand for the role of manganese, GAC size, and base GAC type on the ability to produce iron (hydr)oxides on the surface of GAC. This builds upon the similar work by others (e.g., Sengupta and Cumbal, 2005; Sylvester et al., 2007a, b; Hristovski, et al, in-press). The principle of Process I is that 1) potassium permanganate (KMnO4) oxidizes GAC to produce surface-bound oxidized forms of manganese within the GAC (i.e., Mn7+ is reduced to Mn4+) and then 2) subsequent exposure to and diffusion of ferrous iron into the GAC reacts with surface-bound oxidized manganese to produce surface-bound ferric ion which 3) forms iron (hydr)oxides within the GAC under proper pH conditions. These reactions are illustrated by the following reactions:
MnO4- + GAC → GAC≡MnOx(s) + OH- (4.1)
GAC≡MnOx(s) + Fe2+ → GAC≡ FeOOH(s) + Mn2+ + nH+ (4.2) Making a few assumptions, the overall reaction can be written as follows which is thermodynamically feasible: 2Fe2+ + MnO2(s) + 2H2O → 2FeOOH(s) + Mn2+ + 2H+ 0
Mn(II)Mn(IV)→ΔE = 0.453 (4.3)
Where FeOOH(s) represents the formation of an amorphous ferric (hydr)oxide precipitate. To remove the excess protons and iron (hydr)oxide precipitate, the product must be repeatedly rinsed with well buffered biocarbonate solutions. This chapter evaluates individual steps that may influence the formation of FeOOH(s) within GAC to create Fe-GAC for arsenic removal applications.
ROLE OF MANGANESE
Permanganate Oxidation Step
Manganese Uptake
Experiments investigated uptake of manganese (Mn) upon exposure of potassium permanganate (KMnO4) to three different types of activated carbon: Jacobi AquaSorb 1500 (J), Norit 1240 (N), and Carbon Activated Corporation (CAC). All of the above GAC are coal base materials. All were sieved to a common mean diameter of 0.83 mm (30 x 60 mesh size). Solutions of KMnO4 (0.5%, 2 %, 3.5% and 5%) were prepared in ultrapure water. These solutions were deep purple colored, which was monitored spectrophotometrically. KMnO4 solutions were applied to the activated carbon for a prescribed time (15 minutes), and then decanted multiple times with ultrapure water until
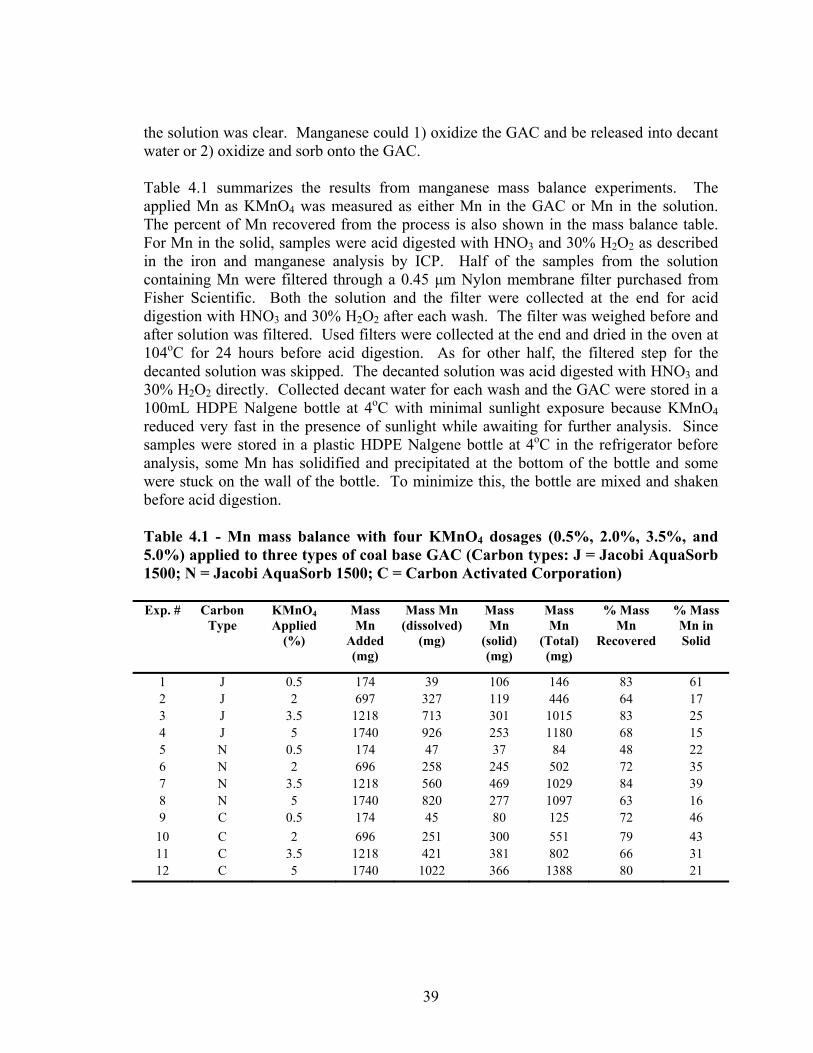
39
the solution was clear. Manganese could 1) oxidize the GAC and be released into decant water or 2) oxidize and sorb onto the GAC. Table 4.1 summarizes the results from manganese mass balance experiments. The applied Mn as KMnO4 was measured as either Mn in the GAC or Mn in the solution. The percent of Mn recovered from the process is also shown in the mass balance table. For Mn in the solid, samples were acid digested with HNO3 and 30% H2O2 as described in the iron and manganese analysis by ICP. Half of the samples from the solution containing Mn were filtered through a 0.45 μm Nylon membrane filter purchased from Fisher Scientific. Both the solution and the filter were collected at the end for acid digestion with HNO3 and 30% H2O2 after each wash. The filter was weighed before and after solution was filtered. Used filters were collected at the end and dried in the oven at 104oC for 24 hours before acid digestion. As for other half, the filtered step for the decanted solution was skipped. The decanted solution was acid digested with HNO3 and 30% H2O2 directly. Collected decant water for each wash and the GAC were stored in a 100mL HDPE Nalgene bottle at 4oC with minimal sunlight exposure because KMnO4 reduced very fast in the presence of sunlight while awaiting for further analysis. Since samples were stored in a plastic HDPE Nalgene bottle at 4oC in the refrigerator before analysis, some Mn has solidified and precipitated at the bottom of the bottle and some were stuck on the wall of the bottle. To minimize this, the bottle are mixed and shaken before acid digestion. Table 4.1 - Mn mass balance with four KMnO4 dosages (0.5%, 2.0%, 3.5%, and 5.0%) applied to three types of coal base GAC (Carbon types: J = Jacobi AquaSorb 1500; N = Jacobi AquaSorb 1500; C = Carbon Activated Corporation) Exp. # Carbon
Type KMnO4 Applied
(%)
Mass Mn
Added (mg)
Mass Mn (dissolved)
(mg)
Mass Mn
(solid) (mg)
Mass Mn
(Total) (mg)
% Mass Mn
Recovered
% Mass Mn in Solid
1 J 0.5 174 39 106 146 83 61 2 J 2 697 327 119 446 64 17 3 J 3.5 1218 713 301 1015 83 25 4 J 5 1740 926 253 1180 68 15 5 N 0.5 174 47 37 84 48 22 6 N 2 696 258 245 502 72 35 7 N 3.5 1218 560 469 1029 84 39 8 N 5 1740 820 277 1097 63 16 9 C 0.5 174 45 80 125 72 46
10 C 2 696 251 300 551 79 43 11 C 3.5 1218 421 381 802 66 31 12 C 5 1740 1022 366 1388 80 21
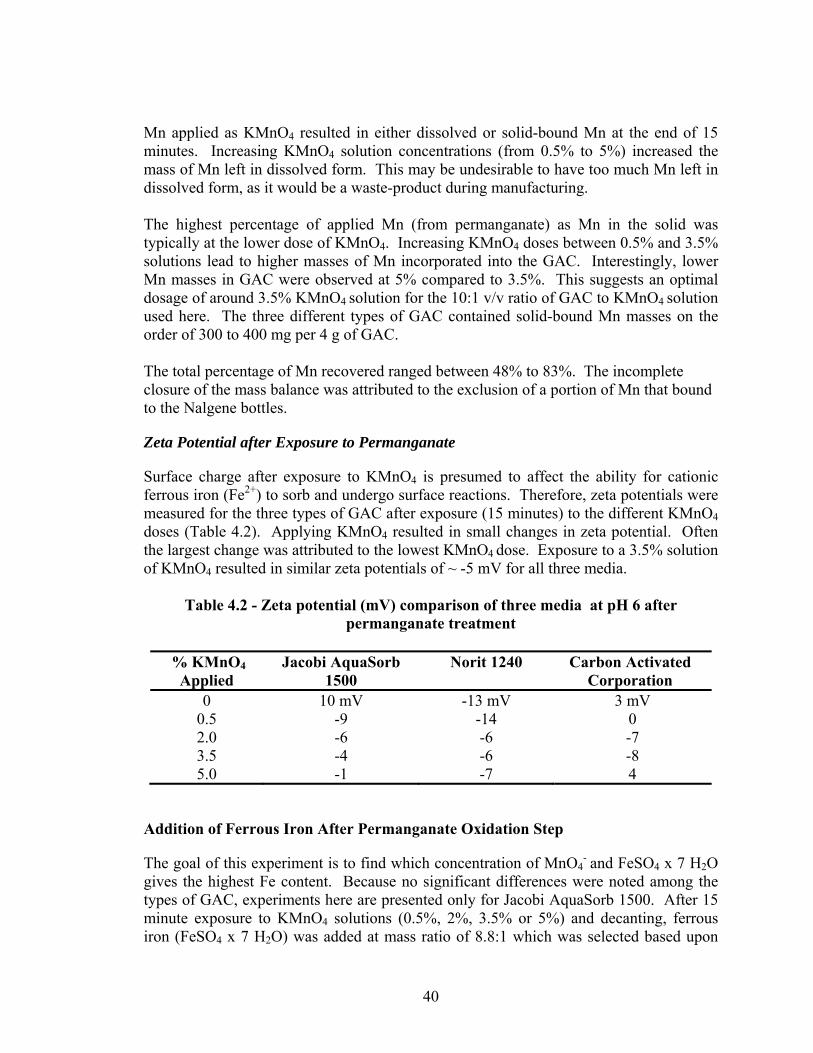
40
Mn applied as KMnO4 resulted in either dissolved or solid-bound Mn at the end of 15 minutes. Increasing KMnO4 solution concentrations (from 0.5% to 5%) increased the mass of Mn left in dissolved form. This may be undesirable to have too much Mn left in dissolved form, as it would be a waste-product during manufacturing. The highest percentage of applied Mn (from permanganate) as Mn in the solid was typically at the lower dose of KMnO4. Increasing KMnO4 doses between 0.5% and 3.5% solutions lead to higher masses of Mn incorporated into the GAC. Interestingly, lower Mn masses in GAC were observed at 5% compared to 3.5%. This suggests an optimal dosage of around 3.5% KMnO4 solution for the 10:1 v/v ratio of GAC to KMnO4 solution used here. The three different types of GAC contained solid-bound Mn masses on the order of 300 to 400 mg per 4 g of GAC. The total percentage of Mn recovered ranged between 48% to 83%. The incomplete closure of the mass balance was attributed to the exclusion of a portion of Mn that bound to the Nalgene bottles.
Zeta Potential after Exposure to Permanganate
Surface charge after exposure to KMnO4 is presumed to affect the ability for cationic ferrous iron (Fe2+) to sorb and undergo surface reactions. Therefore, zeta potentials were measured for the three types of GAC after exposure (15 minutes) to the different KMnO4 doses (Table 4.2). Applying KMnO4 resulted in small changes in zeta potential. Often the largest change was attributed to the lowest KMnO4 dose. Exposure to a 3.5% solution of KMnO4 resulted in similar zeta potentials of ~ -5 mV for all three media.
Table 4.2 - Zeta potential (mV) comparison of three media at pH 6 after permanganate treatment
% KMnO4
Applied Jacobi AquaSorb
1500 Norit 1240 Carbon Activated
Corporation 0 10 mV -13 mV 3 mV
0.5 -9 -14 0 2.0 -6 -6 -7 3.5 -4 -6 -8 5.0 -1 -7 4
Addition of Ferrous Iron After Permanganate Oxidation Step
The goal of this experiment is to find which concentration of MnO4- and FeSO4 x 7 H2O
gives the highest Fe content. Because no significant differences were noted among the types of GAC, experiments here are presented only for Jacobi AquaSorb 1500. After 15 minute exposure to KMnO4 solutions (0.5%, 2%, 3.5% or 5%) and decanting, ferrous iron (FeSO4 x 7 H2O) was added at mass ratio of 8.8:1 which was selected based upon
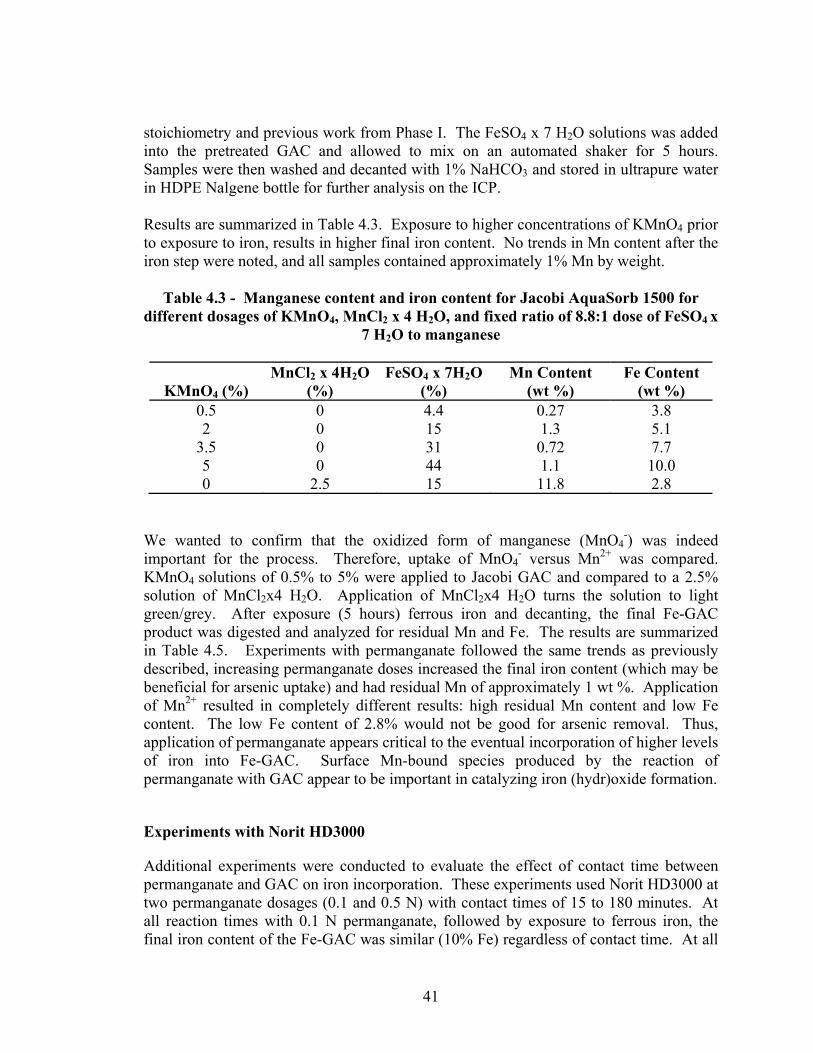
41
stoichiometry and previous work from Phase I. The FeSO4 x 7 H2O solutions was added into the pretreated GAC and allowed to mix on an automated shaker for 5 hours. Samples were then washed and decanted with 1% NaHCO3 and stored in ultrapure water in HDPE Nalgene bottle for further analysis on the ICP. Results are summarized in Table 4.3. Exposure to higher concentrations of KMnO4 prior to exposure to iron, results in higher final iron content. No trends in Mn content after the iron step were noted, and all samples contained approximately 1% Mn by weight.
Table 4.3 - Manganese content and iron content for Jacobi AquaSorb 1500 for different dosages of KMnO4, MnCl2 x 4 H2O, and fixed ratio of 8.8:1 dose of FeSO4 x
7 H2O to manganese
KMnO4 (%) MnCl2 x 4H2O
(%) FeSO4 x 7H2O
(%) Mn Content
(wt %) Fe Content
(wt %) 0.5 0 4.4 0.27 3.8 2 0 15 1.3 5.1
3.5 0 31 0.72 7.7 5 0 44 1.1 10.0 0 2.5 15 11.8 2.8
We wanted to confirm that the oxidized form of manganese (MnO4
-) was indeed important for the process. Therefore, uptake of MnO4
- versus Mn2+ was compared. KMnO4
solutions of 0.5% to 5% were applied to Jacobi GAC and compared to a 2.5% solution of MnCl2x4 H2O. Application of MnCl2x4 H2O turns the solution to light green/grey. After exposure (5 hours) ferrous iron and decanting, the final Fe-GAC product was digested and analyzed for residual Mn and Fe. The results are summarized in Table 4.5. Experiments with permanganate followed the same trends as previously described, increasing permanganate doses increased the final iron content (which may be beneficial for arsenic uptake) and had residual Mn of approximately 1 wt %. Application of Mn2+ resulted in completely different results: high residual Mn content and low Fe content. The low Fe content of 2.8% would not be good for arsenic removal. Thus, application of permanganate appears critical to the eventual incorporation of higher levels of iron into Fe-GAC. Surface Mn-bound species produced by the reaction of permanganate with GAC appear to be important in catalyzing iron (hydr)oxide formation.
Experiments with Norit HD3000
Additional experiments were conducted to evaluate the effect of contact time between permanganate and GAC on iron incorporation. These experiments used Norit HD3000 at two permanganate dosages (0.1 and 0.5 N) with contact times of 15 to 180 minutes. At all reaction times with 0.1 N permanganate, followed by exposure to ferrous iron, the final iron content of the Fe-GAC was similar (10% Fe) regardless of contact time. At all

42
reaction times with 0.5 N permanganate, followed by exposure to ferrous iron, the final iron content of the Fe-GAC was similar (16% Fe) regardless of contact time. Without permanganate, Fe-GAC only contains 2.8% Fe by weight. Detailed mass balances were conducted on Mn during this process, and 90% to 100% Mn recovery was obtained. In most cases >70% of the Mn was in to GAC after permanganate treatment, but after subsequent exposure to ferrous iron less than 1% of the applied Mn was present. This indicates that Mn is important in the oxidation of ferrous iron and as a consequence of the reaction dissolve manganese diffuses back out of the GAC into solution. Cross-section SEM and EDX were conducted on the Fe-GAC materials. These samples are prepared by fixation in a polymer and then cutting through the GAC with a diamond cutter. Figure 4.1 illustrates that most of the iron is located near the outer radial parts of the GAC grain. Occasionally across the cross-section of the GAC slightly elevated areas of iron are present, and these tend to be co-located with large pores. Therefore, it appears that iron is not homogeneously distributed throughout Fe-GAC when synthesized using Process I. Similar types of SED/EDX cross-sections (not shown) were obtained after exposure to permanganate, but before exposure to ferrous iron. These showed elevated Mn concentrations near the edges (up to 50% wt% by EDX) and spikes along the cross-section in a similar pattern as observed for iron in Figure 4.1. The above information permits development of an initial hypothesis for iron formation. During the initial GAC pretreatment with KMnO4, manganese may be partially reduced from Mn7+ to more stable manganese forms (e.g. Mn4+) during the contact with the carbon. The partially reduced manganese is deposited inside the pores of the pretreated GAC probably as insoluble MnOx. The addition of Fe (II) further reduces the MnOx to probably Mn2+, which is soluble and the most stable form of manganese. The oxidized Fe (II) then precipitates as iron (hydr)oxide. These reactions are illustrated by Equations 4.1 through 4.3.
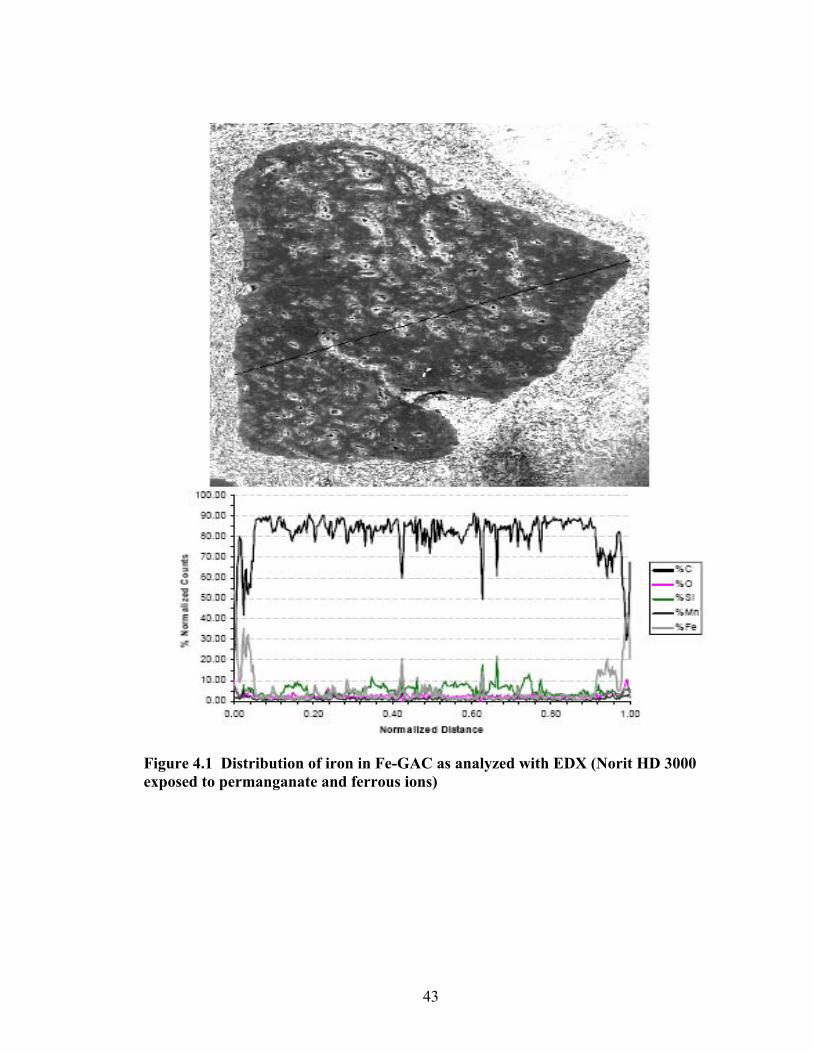
43
Figure 4.1 Distribution of iron in Fe-GAC as analyzed with EDX (Norit HD 3000 exposed to permanganate and ferrous ions)

44
ARSENIC ADSORPTION WITH FE-GAC CREATED VIA DIFFERENT PROCESSES
Batch arsenic adsorption experiments were performed to evaluate the GAC arsenic adsorption capacity for several different types of materials (Table 4.4). As outlined in Table 4.4 a representative material (baseline) was selected and used to compare against for evaluating the effect of GAC size, type of preoxidant, type of activated carbon material and pore size within activated carbon. MnO4
- was chosen to be the primary oxidant for the batch isotherm experiments because it yielded the highest Fe content in terms of weight percent. All Fe-GAC was synthesized using 5% KMnO4, unless otherwise noted, and an 8.8:1 ratio of Fe to Mn using FeSO4 x7H2O. A modified NSFI-53 water was used for these tests. Table 4.4 - Eight different types of carbon which were tested for optimization of Fe-
impregnated GAC using FeSO4×7H2O (“d” represents an arthimetic mean of particle diameter)
Exp # Varied parameter Material Type Oxidant
13 Baseline Jacobi AquaSorb 1500 d = 0.83 mm MnO4-
14 Effect of GAC size Jacobi AquaSorb 1500 d = 0.39 mm MnO4-
15 Effect of MnO4-vs ClO- Jacobi AquaSorb 1500 d = 0.83 mm ClO-
16 Effect of Activated carbon
material
Activated Carbon Fiber MnO4-
17 Carbon Fiber MnO4-
18 Coconut Shell CAC MnO4-
19 Effect of variable pore size Coconut Shell AC1230C MnO4-
Table 4.5 compares the results of these experiments and Figures 4.2 through 4.4 contain corresponding arsenic adsorption isotherms. Decreasing the GAC size (exp #13 vs. 14) from 0.83 mm diameter to 0.39 mm diameter prior to Fe-GAC synthesis has little effect on iron content (~10% Fe) but has a dramatic improvement in arsenic adsorption (i.e., higher q for smaller diameter Fe-GAC). This may be due to 1) faster kinetics of arsenic adsorption for smaller diameter Fe-GAC, or 2) less pore blockage for smaller diameter Fe-GAC (i.e., iron is not blocking pores). Changing the oxidant from permanganate (exp #13) to hypochlorous acid (exp #15) has a dramatic influence on iron content and the ability of the Fe-GAC to remove arsenic (Table 4.5 and Figure 4.3). Preoxidation with chlorine results in Fe-GAC which contains only 1.8% iron and has a much lower arsenic adsorption capacity compared to Fe-GAC prepared using permanganate preoxidation. Clearly, permanganate preoxidation is preferred.

45
Table 4.5 - Final Mn and Fe content, Freundlich parameters (K, 1/n) and goodness of fit (R2) for arsenic adsorption and predicted sorption density (q) for an equivalent
final arsenic concentration of 10 ppb (contact time = 1 day at pH 7.5 in modified NSF 53 water)
Exp. #
Mn Content (wt %)
Fe Content (wt %)
Initial As
Conc. (µg/L) K 1/n R2
q @ Ce=10 μg/L (ug
As/mgGAC) Dry basis
13 1.05 10 128 0.06 0.47 0.90 0.18 14 3.69 9.2 114 0.19 0.52 0.81 0.61 15 0.009 1.8 114 0.03 0.32 0.78 0.07 16 1.43 5.7 114 0.40 0.38 0.80 0.97 17 0.004 1.6 116 0.08 0.19 0.93 0.13 18 0.9 6.9 107 0.08 0.22 0.84 0.13 19 0.09 6.0 107 0.10 0.32 0.97 0.20
q = 0.19Ce0.52;R2 = 0.81
q = 0.40Ce0.38;R2 = 0.80
q = 0.06Ce0.47;R2 = 0.90
q = 0.08Ce0.24;R2 = 0.850.01
0.10
1.00
10.00
0.1 1.0 10.0 100.0Ce (µg/L)
q (u
g A
s/m
g dr
y G
AC)
Jacobi d=.83mmJacobi d=.39mm
Activated Carbon FiberCarbon Fiber
As (V) Solution ~ 100 ug/LpH = 7.5 (5 mM NaHCO3)Contact time = 1 day
Figure 4.2 - Effect size of coal based material (Jacobi AquaSorb 1500) and other types of carbon fibers (activated carbon fiber and carbon fiber) on As(V) removal using ultrapure water spiked with ~ 100 μg/L As(V) (contact time = 1 day)

46
q = 0.06Ce0.47;R2 = 0.90
q = 0.03Ce0.32;R2 = 0.78
0.01
0.10
1.00
1.0 10.0 100.0
Ce (ug/L)
q (u
g A
s/ m
g dr
y G
AC
)
Jacobi d=.83mm with KMnO4
Jacobi with ClO-
As (V) Solution ~ 100 ug/LpH = 7.5 (5 mM NaHCO3)Geometric diameter = 0.83 mmContact time = 1 day
Figure 4.3 Effect of Fe-GAC oxidized with MnO4
-, pretreated with Mn, and oxidized with ClO- on As(V) removal using ultrapure water spiked with ~ 100 ug/L As(V) (contact time = 1 day) It was hypothesized that macroporous coconut shell material may allow deeper penetration of iron compared against microporous coal base material (Jacobi) and in turn a better arsenate removal adsorbate. Therefore, coal base material (Jacobi AquaSorb 1500) was compared with the coconut shell base material (type CAC and type AC1230C). Coconut shell type AC1230C is acid washed were as coconut shell type CAC is not. The coconut shell Fe-GAC contained less iron than the baseline (coal based – Jacobi) and the acid washed GAC removed more arsenic than the non-acid washed coconut shell GAC. However, there was not a large difference in arsenic performance among the samples, although the non-acid washed coconut shell Fe-GAC removed the least amount of arsenic. This implies that there is not a large advantage of changing different types of GAC, instead there may be multiple factors that influence the overall arsenic removal capability of Fe-GAC.

47
q = 0.06Ce0.47;R2 = 0.90
q = 0.10Ce0.32;R2 = 0.97
q = 0.08Ce0.22;R2 = 0.84
0.01
0.10
1.00
1 10 100
Ce (ug/L)
q (u
g A
s/m
g dr
y G
AC
)
Jacobi d=.83mm with KMnO4
Coconut Shell type CAC
Coconut Shell type AC1230C
As (V) Solution ~ 100 ug/LpH = 7.5 (5 mM NaHCO3)Geometric diameter = 0.83 mmContact time = 1 day
Figure 4.4 - Effect of pore size between coal based material (Jacobi AquaSorb 1500) and different types of coconut shell base material on As(V) removal using ultrapure water spiked with ~100ug/L As(V) (contact time = 1 day) Two non-spherical forms of carbon (carbon fiber and activated carbon fiber) were also treated by Process I to make a “Fe-AC” material. The results are illustrated in Figure 4.2 and Table 4.5. The carbon fiber contained < 2% iron by weight and did a poor job at adsorbing arsenic. In contrast, the activated carbon fiber contained 5.7% iron but had the highest arsenic capacity among any of the Fe-GAC materials. Figure 4.6 shows a digital image of the activated carbon fiber at x3000 magnification. Currently, cost information on the activated carbon fibers is not available. Future work should consider how to develop adsorbents using activated carbon fibers, including those impregnated with iron. Finally, arsenic adsorption experiments at multiple pH levels were conducted using Norit HD3000 as a base material. A single dose of Fe-GAC was used (1 g/L) (Figure 4.5). Three types of Fe-GAC are included: 1) Fe-GAC exposed only to ferrous solution (no permanganate) which contains a final iron content of 2.8%, 2) two Fe-GAC materials exposed to permanganate (2 different dosages) and then ferrous solution. The low iron content Fe-GAC removed arsenic effectively only at the lowest pH. At higher pH levels arsenic removal depended upon the use of permanganate during the synthesis method. At the high adsorbent dosage used here, appreciable arsenic removal occurred even at elevated pH levels.
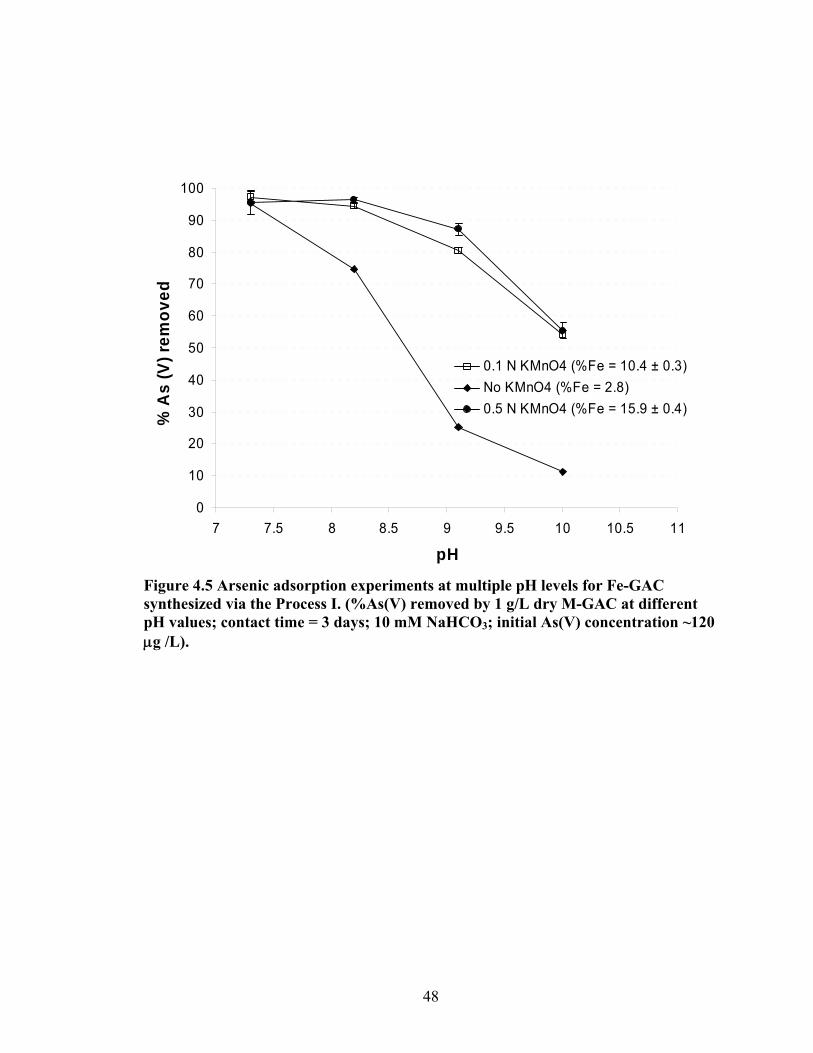
48
Figure 4.5 Arsenic adsorption experiments at multiple pH levels for Fe-GAC synthesized via the Process I. (%As(V) removed by 1 g/L dry M-GAC at different pH values; contact time = 3 days; 10 mM NaHCO3; initial As(V) concentration ~120 μg /L).
0
10
20
30
40
50
60
70
80
90
100
7 7.5 8 8.5 9 9.5 10 10.5 11
pH
% A
s (V
) rem
oved
0.1 N KMnO4 (%Fe = 10.4 ± 0.3)No KMnO4 (%Fe = 2.8)0.5 N KMnO4 (%Fe = 15.9 ± 0.4)
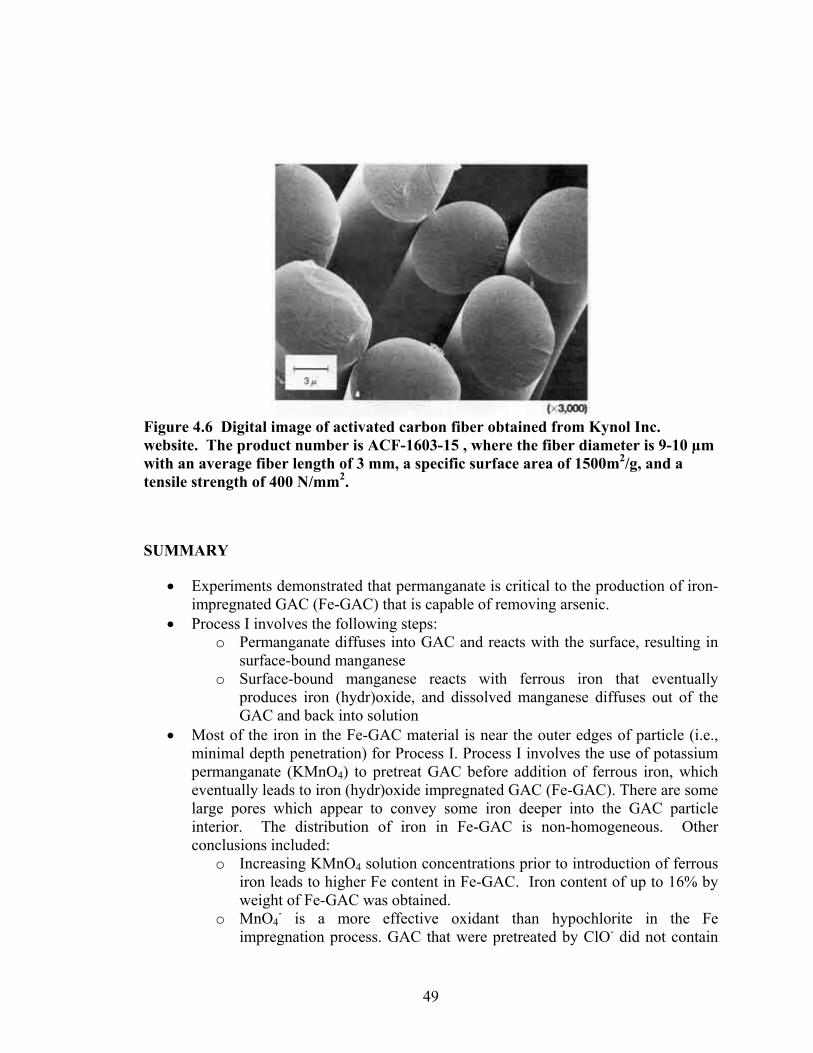
49
Figure 4.6 Digital image of activated carbon fiber obtained from Kynol Inc. website. The product number is ACF-1603-15 , where the fiber diameter is 9-10 µm with an average fiber length of 3 mm, a specific surface area of 1500m2/g, and a tensile strength of 400 N/mm2.
SUMMARY
• Experiments demonstrated that permanganate is critical to the production of iron-impregnated GAC (Fe-GAC) that is capable of removing arsenic.
• Process I involves the following steps: o Permanganate diffuses into GAC and reacts with the surface, resulting in
surface-bound manganese o Surface-bound manganese reacts with ferrous iron that eventually
produces iron (hydr)oxide, and dissolved manganese diffuses out of the GAC and back into solution
• Most of the iron in the Fe-GAC material is near the outer edges of particle (i.e., minimal depth penetration) for Process I. Process I involves the use of potassium permanganate (KMnO4) to pretreat GAC before addition of ferrous iron, which eventually leads to iron (hydr)oxide impregnated GAC (Fe-GAC). There are some large pores which appear to convey some iron deeper into the GAC particle interior. The distribution of iron in Fe-GAC is non-homogeneous. Other conclusions included:
o Increasing KMnO4 solution concentrations prior to introduction of ferrous iron leads to higher Fe content in Fe-GAC. Iron content of up to 16% by weight of Fe-GAC was obtained.
o MnO4- is a more effective oxidant than hypochlorite in the Fe
impregnation process. GAC that were pretreated by ClO- did not contain

50
as much Fe and had a lower arsenic adsorption capacity than GAC treated with MnO4
-. o Using Mn2+ instead of MnO4
- lead to very low final iron content, indicating the important role of MnO4
- as an oxidant. o Acid washed macro-porous coconut shell Fe-GAC had better arsenic
adsorption capacity than non-acid washed coconut shell Fe-GAC o GAC pore size did not appear to influence the final iron content of Fe-
GAC material. Decreasing the GAC size from 0.83 mm diameter to 0.39 mm diameter prior to Fe-GAC synthesis has little effect on iron content (~10% Fe) but has a dramatic improvement in arsenic adsorption (i.e., higher q for smaller diameter Fe-GAC). This may be due to 1) faster kinetics of arsenic adsorption for smaller diameter Fe-GAC, or 2) less pore blockage for smaller diameter Fe-GAC (i.e., iron is not blocking pores).
• Iron impregnated activated carbon fibers exhibited the highest overall arsenic adsorption capacity and future research should explore their potential use in water treatment process to a larger extent.

51
CHAPTER 5 MECHANISMS OF IRON IMPREGNATION FOR PROCESS II SYNTHESIS OF FE-GAC
Process I (Chapter 4) for synthesizing Fe-GAC consumes large quantities of permanganate and iron which end up as eventual waste products. In an effort to reduce the volume of wasteproducts and decrease the likely production costs of Fe-GAC it was desirable to look at reusable and less corrosion-aggressive solutions than permanganate and ferrous iron. Solmetex Inc. developed a concept of using ferric iron in an organic solvent to impregnate GAC, instead of permanganate and ferrous iron. This new process, termed Process II uses a Fe(III)/alcohol solution to contact with GAC, which is reusable after decanting from the GAC. The decanted GAC is then exposed to concentrated sodium hydroxide solution (pH ~ 13.6) to precipitate iron (hydr)oxide within the pores of the GAC (i.e. Fe-GAC or GAC≡FeOOH(s)) :
GAC + Fe3+ + 3OH– → GAC≡FeOOH(s) + H2O (5.1) The product is repeatedly rinsed to reduce the pH to below 8 and remove excess precipitate. The purpose of this chapter is to report on research at ASU focused at validating this technique and optimizing conditions for making Fe-GAC by Process II. Specific details of the method are described elsewhere Hristovski et al. (2007). All research in this chapter employed on type of activated carbon (lignite based GAC (HD-3000, US mesh 8x30, NORIT Americas Inc., USA). Synthesized Fe-GAC was air dried, crushed and sieved using US mesh 40x60 (arithmetic mean diameter of 0.34 mm), and stored wet prior to use in arsenic adsorption experiments.
CHARACTERIZATION OF FE-GAC SYNTHESIZED BY PROCESS II
Ferric concentrations in alcohol varied from 0.03 N to 6 N. Increasing ferric concentrations lead to higher final iron content in the Fe-GAC by Process II. Iron concentrations in the final Fe-GAC were 0.5%, 2.2%, 9.2% and 12.5% for ferric concentrations in alcohol of 0.03 N, 0.3 N, 3 N and 6 N, respectively, using a contact time of 45 minutes between the solution and GAC. Contact times ranged from 15 minutes to 180 minutes, but the final iron content of Fe-GAC was independent of this contact time. The distribution of iron within the synthesized Fe-GAC was determined by fixing the material in resin, cutting the material in half using a diamond cutter and then conducting SEM with EDX through the material (similar to Chapter 4 for Process I). Figure 5.1 shows the results, and indicates that iron impregnated via Process II is impregnated throughout the Fe-GAC. A backscatter detector was used to differentiate the iron from the carbon inside the Fe-GAC. The backscatter detector used during the FIB/SEM

52
analysis differentiated between heavier elements such as iron, which are manifested as whiter areas, and lighter elements such as carbon, nitrogen, oxygen and hydrogen which are manifested as darker areas. Several regions of high iron concentration correspond with locations of larger pores in the GAC. Increased magnification of iron in these pores detects the presence of spherical-shaped nanoparticles with diameters on the order of 20 to 100 nm (Figure 5.2). In contrast, the shape of iron deposits produced by Process I are more sharp-ended cylindrical in shape (Figure 5.3). Additionally, Process II appears to have better iron distribution throughout the Fe-GAC compared against material produced via Process I.
ARSENIC ADSORPTION BY FE-GAC SYNTHESIZED BY PROCESS II
Arsenic adsorption was evaluated using 40x60 crushed Fe-GAC with an initial concentration of ~ 120 μg/L arsenic in the presence of 10 mM NaHCO3 and at target final pH levels of 6.3 ± 0.2 or 8.3 ± 0.1. Fe-GAC dosages of 10 mg to 1.2 g dry weight were placed into 500 mL Nalgene bottles. Samples were continuously agitated for 3 days prior to filtering the M-GAC media through 0.8 μm acetate membrane filter. Arsenic was removed using Fe-GAC produced by Process II. Arsenate removal was always higher at lower pH levels. For an Fe-GAC dose of 1 g/L dry M-GAC at pH 6.3 the percentage of initial arsenate (120 μg/L) removed was 95%, 95%, 72% and 33% using Fe-GAC (Process II) containing 12.1%, 9.1, 2.5% and 0.5% iron by weight, respectively. For the same Fe-GAC sample, arsenate removal was 78%, 72%, 29% and 4%, respectively, at pH 7.5. These results show that increasing the iron content of Fe-GAC will increase arsenic adsorption.

53
Figure 5.1 Distribution of iron in Fe-GAC produced by Process II. Top image is a cross-section of the Fe-GAC analyzed by scanning electron microscopy. The line across the top image was analyzed (bottom image) by Electron dispersion X-ray microanalysis (EDX) to generate the distribution of iron through the Fe-GAC.
01020
3040506070
8090
100
0.00 0.20 0.40 0.60 0.80 1.00Normalized Distance
% N
orm
aliz
ed C
ount
s
C%O%Si%Fe%
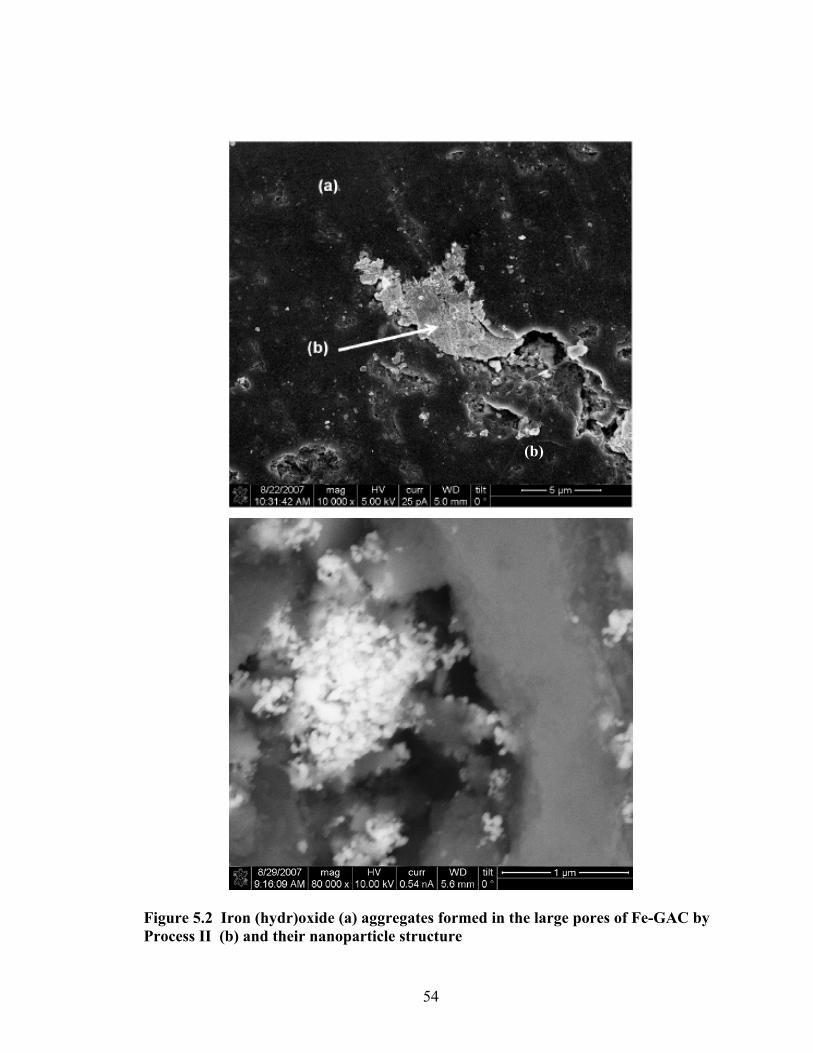
54
Figure 5.2 Iron (hydr)oxide (a) aggregates formed in the large pores of Fe-GAC by Process II (b) and their nanoparticle structure
(b)

55
Figure 5.3 Iron (hydr)oxide sharp-ended cylindrical deposits in Fe-GAC formed by Process I
COMPARISON OF FE-GAC TO REMOVE ARSENIC BY PROCESS I AND PROCESS II
Four different Fe-GAC media (two from each synthesis method) were selected for the experiments. The selected media exhibited greatest arsenic removal during the single-dose adsorption experiments. Multi-point isotherms were developed for each media at pH 6.4 and 8.3. Data were fit by the Freundlich isotherm model. Model fits were all very good (R2 > 0.95). Among the two samples for a given synthesis process, the results were comparable. Process I exhibits K values approximately an order of magnitude greater than determined for Fe-GAC synthesis by Process II. For reference, another study observed a K value of 200 (µg As(V)/g dry media)(L/µg)1/n at pH 6 for iron impregnated GAC using bituminous GAC Chen et al. (2007). The 1/n values were

56
between 0.4 and 0.6 for most conditions, except Process II synthesized Fe-GAC at pH 8.4 where 1/n values were significantly above 1.0. 1/n values above unity indicate unfavorable adsorption potential. The results clearly suggest that Fe-GAC synthesized by Process I has higher arsenic adsorption capacity than by Process II under the conditions tested. This observation is not due to the slightly different iron contents of the Fe-GAC. Separate analysis of Freundlich isotherms determine K normalized to iron content of each media to still be greater than ten times greater for Process I than Process II synthesized Fe-GAC. Table 5.1 - Fitted Freundlich Isotherm parameters for Fe-GAC synthesized from Process I and Process II at two different pH levels (Conditions: contact time = 3 days; 10 mM NaHCO3 buffered ultrapure water; initial As(V) concentration ~120 μg/L)
pH = 6.4 ± 0.1 pH = 8.3 ± 0.1
Fe-GAC Fe Content of Fe-GAC
K (μg AS/g dry M-
GAC) / (μg As/L)1/n
1/n R2 K (μg AS/g dry M-
GAC) / (μg As/L)1/n
1/n R2
Process I Sample 1 Sample 2
10% 16%
264 247
0.41 0.48
0.99 0.98
32 47
0.62 0.58
0.99 0.97
Process II
Sample 3 Sample 5
9.1%
12.4%
38 49
0.49 0.55
0.95 0.97
0.0005 0.05
2.6 1.7
0.98 0.97
SUMMARY
Process II uses different chemicals than Process I, which would make the synthesis of Fe-GAC cheaper and produce less hazardous waste. Process II treats GAC using a ferric/alcohol solution to eventually produce Fe-GAC. However, it appears that despite achieving comparable iron contents in Fe-GAC, Process II has lower arsenic adsorption potential under the conditions tested than Fe-GAC produced by Process I. Other key points include the following:
• The iron content of Fe-GAC increases by using higher ferric/alcohol concentrations during the synthesis process.
• Contact time between ferric/alcohol solutions and GAC did not affect final iron content of the Fe-GAC, suggesting that shorter contact times can be used which would reduce manufacturing costs.

57
• Process II yielded Fe-GAC with a good distribution of iron throughout the media. The impregnated iron was composed of spherical 20 to 100 nm diameter iron nanoparticles. In contrast, Fe-GAC synthesized using Process I had most of the iron distributed near the outer edges of the activated carbon grains and the iron was composed of sharp-ended cylindrical deposits.
• Fe-GAC synthesized by Process II has significantly lower arsenic adsorption capacity in batch tests compared to Fe-GAC synthesized by Process I. Additional research evaluated with Fe-GAC synthesized by both methods has also been compared in column tests (Chapter 3). Those results confirm the batch adsorption conclusions that Process I yields Fe-GAC with higher arsenic adsorption capacity than Process II.
• Differences in arsenic removal by Fe-GAC synthesized by the two methods is probably due to higher surface area of iron (hydr)oxides produced using Process I, which form sharp-ended cylindrical iron deposits (Process I) instead of aggregated spherical iron nanoparticles (Process II). The spherical iron nanoparticle aggregates may “block” pores, limiting diffusion of arsenic.

58
CHAPTER 6 : IMPREGNATE NON-FERROUS METALS (TITANIUM) ONTO GAC (TI-GAC)
Both iron- and titanium-based adsorbents are commercially available for arsenic removal from drinking water. While this current study focuses primarily on iron impregnated GAC, because of its commercial potential research into the synthesis and evaluation of titanium based GAC (Ti-GAC) was also undertaken. This chapter describes a synthesis procedure for producing Ti-GAC and its ability to remove arsenic. An iterative approach was conducted with preliminary experiments leading to more directed optimization experiments.
PRELIMINARY EXPERIMENTS
The synthesis method is described in Chapter 2 and uses titanium isopropoxide (TIP, Ti{OCH(CH3)2}4) and Norit HD3000 GAC. Three Ti-GAC samples were synthesized using 5.1 to 6.3 mgTi/L and ~ 42 mg of GAC in 100 mL of solution (Table 6.1). Ti-GACs were then washed with 1% NaHCO3 where the pH is increased due to the precipitation of H+. Titanium content of the samples were 1.21, 1.41, and 1.52% of the dry weight, showing little variation despite significantly differing synthesis conditions.
Table 6.1 - Experimental design for Ti-GAC synthesized for preliminary test
Experiment # TIP Ethanol Ti Conc. (mg/L)
GAC added (mg)
Ti content (wt %)
Ti1 80% 20% 6.26 41.2 1.52 Ti2 5% 95% 5.10 42.1 1.21 Ti3 20% 80% 5.92 42 1.41
The arsenate adsorption capacity of the Ti-GAC was evaluated with a “single-dose” screening batch adsorption experiments. Synthesized Ti-GAC samples and a pure GAC sample were then applied to four different water matrices (Table 6.2). Approximately 1 g/L of Ti-GAC were added to the water suspension. Samples were mixed on an automated shaker for 3 days. Figure 6.1 shows the arsenic remaining for the samples. The highest arsenic removal occurred in the surface water. Ti2 had significantly better arsenic removal than Ti1 or Ti3, despite having the lowest titanium content. This implies that the synthesis conditions are important to prevent pore blockage with titanium material, or other factors that may affect arsenic access to titanium oxide surfaces.

59
Table 6.2 - pH, phosphorous (P) concentrations, silica concentrations and conductivities of the water matrices used in the screening experiments
Water pH Total P
(μg/L) Silica
(mg/L) Conductivity
(uS/cm) 10 mM NaHCO3 buffered ultrapure water
8.4 ± 0.2 0 0 ~900
Tap water (East Mesa, AZ) 8.1 NA NA ~330 Groundwater (Well 4E, Scottsdale, AZ)
8.0 ± 0.2 <0.1 ~25 ~720
Surface water (CAP, AZ) 7.8 <0.1 ~9 ~950
1
10
100
1000
Ti1 Ti2 Ti3 UntreatedGAC
Control
Ars
enic
Rem
aini
ng (u
g/L)
10 mMNaHCO3Tap Water
SurfaceWaterGroundWater
Figure 6.1 Arsenic removal using Ti-GAC from screening experiments in four different water matrices (1 g/L of Ti-GAC added)
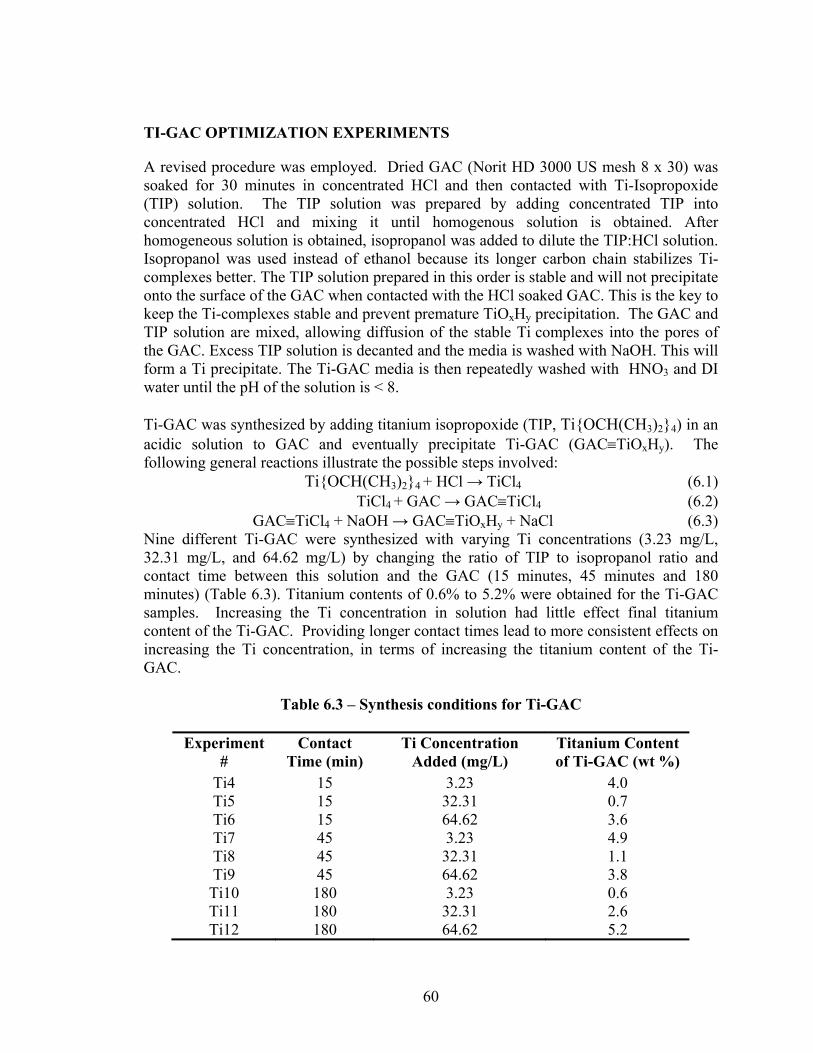
60
TI-GAC OPTIMIZATION EXPERIMENTS
A revised procedure was employed. Dried GAC (Norit HD 3000 US mesh 8 x 30) was soaked for 30 minutes in concentrated HCl and then contacted with Ti-Isopropoxide (TIP) solution. The TIP solution was prepared by adding concentrated TIP into concentrated HCl and mixing it until homogenous solution is obtained. After homogeneous solution is obtained, isopropanol was added to dilute the TIP:HCl solution. Isopropanol was used instead of ethanol because its longer carbon chain stabilizes Ti-complexes better. The TIP solution prepared in this order is stable and will not precipitate onto the surface of the GAC when contacted with the HCl soaked GAC. This is the key to keep the Ti-complexes stable and prevent premature TiOxHy precipitation. The GAC and TIP solution are mixed, allowing diffusion of the stable Ti complexes into the pores of the GAC. Excess TIP solution is decanted and the media is washed with NaOH. This will form a Ti precipitate. The Ti-GAC media is then repeatedly washed with HNO3 and DI water until the pH of the solution is < 8. Ti-GAC was synthesized by adding titanium isopropoxide (TIP, Ti{OCH(CH3)2}4) in an acidic solution to GAC and eventually precipitate Ti-GAC (GAC≡TiOxHy). The following general reactions illustrate the possible steps involved:
Ti{OCH(CH3)2}4 + HCl → TiCl4 (6.1) TiCl4 + GAC → GAC≡TiCl4 (6.2)
GAC≡TiCl4 + NaOH → GAC≡TiOxHy + NaCl (6.3) Nine different Ti-GAC were synthesized with varying Ti concentrations (3.23 mg/L, 32.31 mg/L, and 64.62 mg/L) by changing the ratio of TIP to isopropanol ratio and contact time between this solution and the GAC (15 minutes, 45 minutes and 180 minutes) (Table 6.3). Titanium contents of 0.6% to 5.2% were obtained for the Ti-GAC samples. Increasing the Ti concentration in solution had little effect final titanium content of the Ti-GAC. Providing longer contact times lead to more consistent effects on increasing the Ti concentration, in terms of increasing the titanium content of the Ti-GAC.
Table 6.3 – Synthesis conditions for Ti-GAC
Experiment #
Contact Time (min)
Ti Concentration Added (mg/L)
Titanium Content of Ti-GAC (wt %)
Ti4 15 3.23 4.0 Ti5 15 32.31 0.7 Ti6 15 64.62 3.6 Ti7 45 3.23 4.9 Ti8 45 32.31 1.1 Ti9 45 64.62 3.8 Ti10 180 3.23 0.6 Ti11 180 32.31 2.6 Ti12 180 64.62 5.2
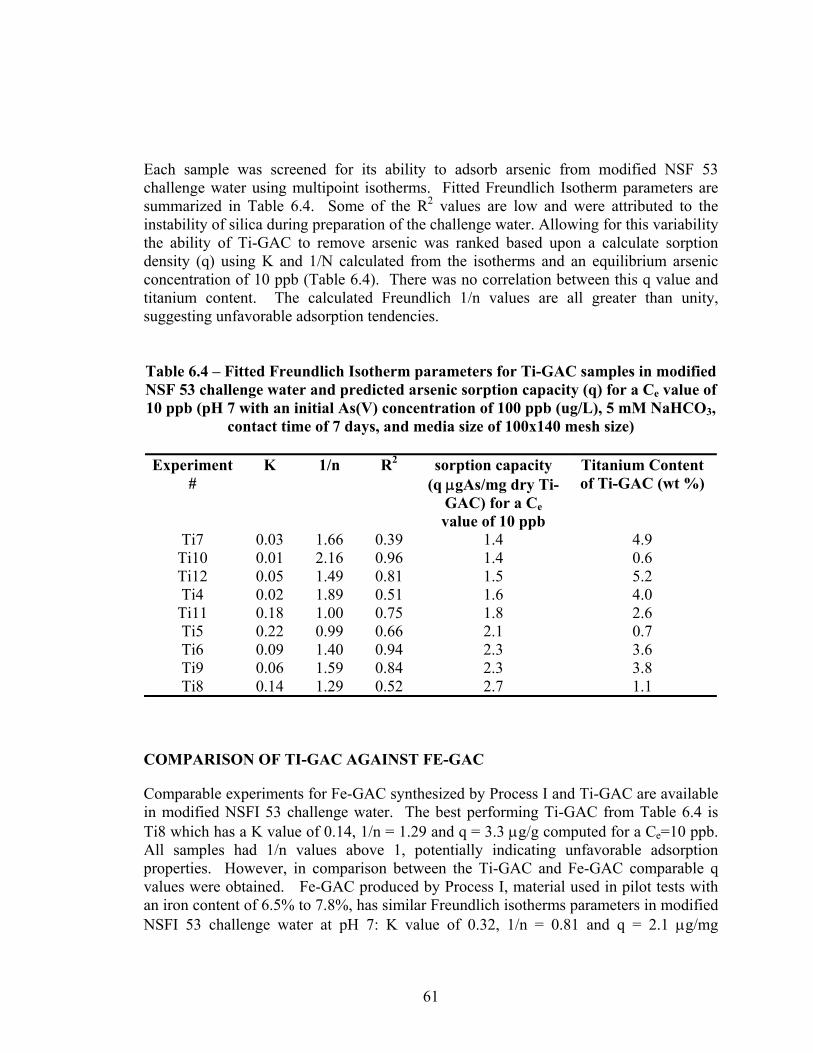
61
Each sample was screened for its ability to adsorb arsenic from modified NSF 53 challenge water using multipoint isotherms. Fitted Freundlich Isotherm parameters are summarized in Table 6.4. Some of the R2 values are low and were attributed to the instability of silica during preparation of the challenge water. Allowing for this variability the ability of Ti-GAC to remove arsenic was ranked based upon a calculate sorption density (q) using K and 1/N calculated from the isotherms and an equilibrium arsenic concentration of 10 ppb (Table 6.4). There was no correlation between this q value and titanium content. The calculated Freundlich 1/n values are all greater than unity, suggesting unfavorable adsorption tendencies. Table 6.4 – Fitted Freundlich Isotherm parameters for Ti-GAC samples in modified NSF 53 challenge water and predicted arsenic sorption capacity (q) for a Ce value of 10 ppb (pH 7 with an initial As(V) concentration of 100 ppb (ug/L), 5 mM NaHCO3,
contact time of 7 days, and media size of 100x140 mesh size)
Experiment #
K 1/n R2 sorption capacity (q μgAs/mg dry Ti-
GAC) for a Ce value of 10 ppb
Titanium Content of Ti-GAC (wt %)
Ti7 0.03 1.66 0.39 1.4 4.9 Ti10 0.01 2.16 0.96 1.4 0.6 Ti12 0.05 1.49 0.81 1.5 5.2 Ti4 0.02 1.89 0.51 1.6 4.0 Ti11 0.18 1.00 0.75 1.8 2.6 Ti5 0.22 0.99 0.66 2.1 0.7 Ti6 0.09 1.40 0.94 2.3 3.6 Ti9 0.06 1.59 0.84 2.3 3.8 Ti8 0.14 1.29 0.52 2.7 1.1
COMPARISON OF TI-GAC AGAINST FE-GAC
Comparable experiments for Fe-GAC synthesized by Process I and Ti-GAC are available in modified NSFI 53 challenge water. The best performing Ti-GAC from Table 6.4 is Ti8 which has a K value of 0.14, 1/n = 1.29 and q = 3.3 μg/g computed for a Ce=10 ppb. All samples had 1/n values above 1, potentially indicating unfavorable adsorption properties. However, in comparison between the Ti-GAC and Fe-GAC comparable q values were obtained. Fe-GAC produced by Process I, material used in pilot tests with an iron content of 6.5% to 7.8%, has similar Freundlich isotherms parameters in modified NSFI 53 challenge water at pH 7: K value of 0.32, 1/n = 0.81 and q = 2.1 μg/mg

62
computed for a Ce=10 ppb. Thus the q value for Ti-GAC is slightly greater than the q value for Fe-GAC at Ce=10 ppb, based upon the isotherm data.
SUMMARY
Ti-GAC can adsorb arsenic from solution. Specific findings include the following: • Titanium impregnated GAC (Ti-GAC) can be synthesized using techniques
amendable to large scale production. • Ti-GAC is synthesized using titanium isopropoxide (TIP) in an acidic solution
that is applied to GAC. • Synthesis conditions (contact time, TIP solution concentration and composition)
affect the titanium content of Ti-GAC, which ranged from 0.5% to 6% titanium by weight of Ti-GAC.
• For arsenic removal, Ti-GAC performed comparably with Fe-GAC synthesized by Process I (Fe-GAC sample from the Massachusetts Pilot Test)
• Titanium may be easier to commercially produce Ti-GAC than Fe-GAC if titanium chloride (less expensive) can be used instead of titanium isopropoxide
• Characterization of Ti-GAC continues, but one hypothesis being evaluated is whether or not titanium precipitates are more evenly distributed within the activated carbon grains, compared against iron precipitates in Fe-GAC. During synthesis it appears that diffusion and precipitation conditions for Ti-GAC can be well controlled.
• Pilot tests should be conducted using Ti-GAC, along with RSSCTs, to evaluate the performance of this media on a continuous flow basis.
63
CHAPTER 7 RECOMMENDATIONS FOR UTILITIES AND FUTURE RESEARCH
Whereas Phase I was a “proof-of-concept” for using Fe-GAC composites as adsorbents for arsenic removal and organic contaminants, this Phase II projects primary goal was to demonstrate the ability of Fe-GAC to be used in pilot-scale drinking water treatment applications. A secondary goal was to understand the mechanisms of Fe-GAC synthesis in order to more cost effectively produce commercially viable materials. These and other specific project objectives were achieved. Solmetex Inc. is in the process of certifying a Fe-GAC product for use in drinking water applications.
CONCLUSIONS
Pilot Test using Fe-GAC
• The pilot tests supported a major goal of this project. Pilot tests demonstrated the viability of using Fe-GAC for arsenic removal in the field. There were no pressure drop, attrition or other operational problems observed at the two pilot sites conducted by different staff in two different parts of the country. Pilot test results with EBCTs of 4 to 5 minutes from both sites (Massachusetts and New Mexico) demonstrated arsenic removal for a reasonable number of bed volumes (>20,000 to over 75,000 bed volumes) at pH levels of 6.5 to 7.6. Complete breakthrough for an intermediate sample port with an EBCT of 3.6 minutes was reached after approximately 125,000 bed volumes of operation.
• Complete arsenic breakthrough was never achieved during the pilot tests, suggesting that residual arsenic adsorption capacity remained at the end of the pilot tests. This was supported by forensic analysis of spent media from different depths in the pilot column which shows a gradient of high to low arsenic content of the media from the top to the bottom of the packed bed.
• Silica did not appear to accumulate on the Fe-GAC, although some calcium was present.
• TCLP tests conducted at one pilot site confirmed that the media passed the TCLP test and could be disposed to conventional landfills as a non-hazardous waste.
• Short-bed adsorption tests using full-sized (not crushed) Fe-GAC concluded that mass transfer of arsenic in Fe-GAC packed bed applications is controlled by intraparticle diffusion. Modeling of Fe-GAC packed beds is feasible using the pore surface diffusion model, and calculated estimates of mass transfer parameters are valid for predicting arsenic removal.
• Proportional or constant diffusivity based designs for RSSCTs were not able to predict the pilot test performance for arsenic breakthrough. In all cases, the RSSCT broke through earlier than observed at the pilot tests.
• The reasons for a poor correlation between RSSCT and pilot plant performance may be related to the distribution of iron with depth into (radial coordinate) the

64
Fe-GAC. The Fe-GAC used in the pilot tests were synthesized using Process I, which produces a non-homogenous media with higher iron content near the exterior of the GAC than near its core. The lack of homogeneity opposes a critical assumption for the use of RSSCTs and is probably the central reason why RSSCTs may not be viable for predicting full-scale performance of Fe-GAC produced by Process I.
• Process II of synthesizing Fe-GAC appears to create a more homogeneous distribution of iron within the GAC, and RSSCTs should be suitable for predicting the pilot performance for these system. However, Process II was not optimized until later in the study and pilot tests had already been concluded by that point. This is a point for future research.
Mechanisms of Fe-GAC Synthesis
• Experiments demonstrated that permanganate is critical to the production of iron-impregnated GAC (Fe-GAC) that is capable of removing arsenic.
• Process I involves the following steps: o Permanganate diffuses into GAC and reacts with the surface, resulting in
surface-bound manganese o Surface-bound manganese reacts with ferrous iron that eventually
produces iron (hydr)oxide, and dissolved manganese diffuses out of the GAC and back into solution
• Most of the iron in the Fe-GAC material is near the outer edges of particle (i.e., minimal depth penetration) for Process I. Process I involves the use of potassium permanganate (KMnO4) to pretreat GAC before addition of ferrous iron, which eventually leads to iron (hydr)oxide impregnated GAC (Fe-GAC). There are some large pores which appear to convey some iron deeper into the GAC particle interior. The distribution of iron in Fe-GAC is non-homogeneous. Other conclusions included:
o Increasing KMnO4 solution concentrations prior to introduction of ferrous iron leads to higher Fe content in Fe-GAC. Iron content of up to 16% by weight of Fe-GAC was obtained.
o MnO4- is a more effective oxidant than chlorine in the Fe impregnation
process. GAC that were pretreated by ClO- did not contain as much Fe and had a lower arsenic adsorption capacity than GAC treated with MnO4
-. o Using Mn2+ instead of MnO4
- lead to very low final iron content, indicating the important role of MnO4
- as an oxidant. o Acid washed macro-porous coconut shell Fe-GAC had better arsenic
adsorption capacity than non-acid washed coconut shell Fe-GAC o GAC pore size did not appear to influence the final iron content of Fe-
GAC material. Decreasing the GAC size from 0.83 mm diameter to 0.39 mm diameter prior to Fe-GAC synthesis has little effect on iron content (~10% Fe) but has a dramatic improvement in arsenic adsorption (i.e., higher q for smaller diameter Fe-GAC). This may be due to 1) faster
65
kinetics of arsenic adsorption for smaller diameter Fe-GAC, or 2) less pore blockage for smaller diameter Fe-GAC (i.e., iron is not blocking pores).
o Iron impregnated activated carbon fibers exhibited the highest overall arsenic adsorption capacity and future research should explore their potential use in water treatment process to a larger extent.
• Process II uses different chemicals than Process I, which would make the synthesis of Fe-GAC cheaper and produce less hazardous waste. Process II treats GAC using a ferric/alcohol solution to eventually produce Fe-GAC. However, it appears that despite achieving comparable iron contents in Fe-GAC, Process II has lower arsenic adsorption potential under the conditions tested than Fe-GAC produced by Process I. The following is a summary of other key points:
o The iron content of Fe-GAC increases by using higher ferric/alcohol concentrations during the synthesis process.
o Contact time between ferric/alcohol solutions and GAC did not affect final iron content of the Fe-GAC, suggesting that shorter contact times can be used which would reduce manufacturing costs.
o Process II yielded Fe-GAC with a good distribution of iron throughout the media. The impregnated iron was composed of spherical 20 to 100 nm diameter iron nanoparticles. In contrast, Fe-GAC synthesized using Process I had most of the iron distributed near the outer edges of the activated carbon grains and the iron was composed of sharp-ended cylindrical deposits.
o Fe-GAC synthesized by Process II has significantly lower arsenic adsorption capacity in batch tests compared to Fe-GAC synthesized by Process I. Additional research evaluated with Fe-GAC synthesized by both methods has also been compared in column tests (Chapter 3). Those results confirm the batch adsorption conclusions that Process I yields Fe-GAC with higher arsenic adsorption capacity than Process II.
o Differences in arsenic removal by Fe-GAC synthesized by the two methods is probably due to higher surface area of iron (hydr)oxides produced using Process I, which form sharp-ended cylindrical iron deposits (Process I) instead of aggregated spherical iron nanoparticles (Process II). The spherical iron nanoparticle aggregates may “block” pores, limiting diffusion of arsenic.
Titanium Oxide Impregnation of GAC
• Ti-GAC can adsorb arsenic from solution. • Titanium impregnated GAC (Ti-GAC) can be synthesized using techniques
amendable to large scale production. • Ti-GAC is synthesized using titanium isopropoxide (TIP) in an acidic solution
that is applied to GAC.

66
• Synthesis conditions (contact time, TIP solution concentration and composition) affect the titanium content of Ti-GAC, which ranged from 0.5% to 6% titanium by weight of Ti-GAC.
• For arsenic removal, Ti-GAC performed comparably with Fe-GAC synthesized by Process I (Fe-GAC sample from the Massachusetts Pilot Test)
• Titanium may be easier to commercially produce Ti-GAC than Fe-GAC if titanium chloride (less expensive) can be used instead of titanium isopropoxide
• Characterization of Ti-GAC continues, but one hypothesis being evaluated is whether or not titanium precipitates are more evenly distributed within the activated carbon grains, compared against iron precipitates in Fe-GAC. During synthesis it appears that diffusion and precipitation conditions for Ti-GAC can be well controlled.
• Pilot tests should be conducted using Ti-GAC, along with RSSCTs, to evaluate the performance of this media on a continuous flow basis.
RECOMMENDATIONS FOR UTILITIES
Metal impregnated granular activated carbons, such as Fe-GAC or Ti-GAC, offer the ability to remove arsenic and other heavy metals simultaneously while removing pollutants (e.g., neutral organic chemicals, radionuclides, taste and odor compounds) that adsorb onto activated carbon. Fe-GAC and Ti-GAC may also be applicable for point of use devices. Thus, a multi-purpose system can be applied using Fe-GAC. There is no leaching of the impregnated metal (iron or titanium), or any precursors used during their synthesis (e.g., manganese), during use of the materials. The same processes used to regenerate GAC (i.e., thermal regeneration) will not remove arsenic. It may be possible to regenerate Fe-GAC using acid or base washing cycles, although this has not yet been specifically evaluated. Thus, currently Fe-GAC should be viewed as a disposable adsorbent material. Based upon pilot testing, Fe-GAC will pass TLCP tests which means it can be disposed to ordinary landfills.
RECOMMENDATIONS FOR FUTURE RESEARCH
• Phase I and II demonstrated the viability of Fe-GAC and Ti-GAC to remove arsenic from model waters, surface waters and groundwaters. Only one form of Fe-GAC (Process I) was evaluated at the pilot scale (2 sites). Future work by the manufacturer should conduct parallel pilot testing using: 1) Fe-GAC synthesized by Process I, 2) Fe-GAC synthesized by Process II, 3) Ti-GAC, and 4) a reference media (e.g., Severn Trent E33 or US Filter GFH media). Companion RSSCTs should be conducted to determine if they are suitable for Fe-GAC synthesized by Process II, but not Process I, and Ti-GAC.
• Experimentation with variable carbon-based substrates suggested that activated carbon fibers impregnated with iron were highly efficient at adsorbing arsenic. While activated carbon fibers are more expensive than traditional GAC, future

67
research is needed to fully synthesize a wider variety of iron impregnated activated carbon fibers and evaluate them for arsenic removal. These may be especially amendable to iron impregnation by Process I because of their small diameter, allowing permanganate (and iron) to become uniformly impregnated throughout the substrate.
• The ability of Fe-GAC and Ti-GAC to remove other pollutants as point of entry or point of use applications should be investigated in field-scale applications, now that the materials have been demonstrated effective at the lab-scale.

68
69
REFERENCES
American Kynol, Inc. KynolTM Activated Carbon Fibers. < http://www.kynol.com/NewFiles/kynol%20frameset.html>. 9 Sept. 2007.
Badruzzaman, M. (2002). Scaling laboratory arsenic removal data for porous sorbents to
the pilot scale. Civil and Environmental Engineering. Tempe, AZ, Arizona State University: 146.
Badruzzaman, M., P. Westerhoff, et al. (2004). “Intraparticle diffusion and adsorption of
arsenate onto Granular Ferric Hydroxide (GFH).” Water Research 38(18): 4002-4012.
Bang, S., X. Meng, et al. (2002). “Removal of arsenic from water by zero-valent iron.”
Abstracts of Papers of the American Chemical Society 224: 129-ENVR. Brookshaven Instruments Corporation (2004). Zeta Potential (ZetaPALS).
<http://www.bic.com/ZetaPALS.html>. 1 Nov. 2006. Carus Chemical Company. (2004). Analytical method 102: Determination of potassium
permanganate residual for drinking water treatment. Peru, Illinois, USA: Carus Chemical Company.
Chen, A. S. C., K. A. Fields, et al. (2002). “Field evaluation of As removal by
conventional plants.” Journal American Water Works Association 94(9): 64-77. Chen, W., Parette, R., Zou, J., Cannon, F. S., & Dempsey, B. A., (2007). Arsenic removal
by iron modified activated carbon. Water research, in press. Cheng, R. C., H. C. Wang, et al. (1994). “Enhanced Coagulation For Arsenic Removal.”
Journal American Water Works Association 86(9): 79-90. Coleman, S. J., P. R. Coronado, et al. (2003). “Granular Activated Carbon Modified with
Hydrophobic Silica Aerogel - Potential Composite Materials for the Removal of Uranium from Aqueous Solutions.” Environmental Science & Technology 37(10): 2286-2290.
Driehaus, W., M. Jekel, et al. (1998). “Granular ferric hydroxide - a new adsorbent for
the removal of arsenic from natural water.” Journal of Water Services Research and Technology-AQUA 47(1): 30-35.
Farrell, J., J. P. Wang, et al. (2001). “Electrochemical and spectroscopic study of arsenate
removal from water using zero-valent iron media.” Environmental Science & Technology 35(10): 2026-2032.
70
Faust, S. D. and O. M. Aly (1987). Adsorption Processes for Water Treatment.
Stoneham, Butterworth Publishers. Hem, J. (1992). Study and Interpretation of the chemical characteristics of natural water
(Third edition). Washington, DC, US Geological Society: 263. Hering, J. G., P. Y. Chen, et al. (1997). “Arsenic removal from drinking water during
coagulation.” Journal of Environmental Engineering-ASCE 123(8): 800-807. Highfield, D. E. (2002). Arsenic occurrence in metro Phoenix groundwater and treatment
by Granular Ferric Hydroxide. Civil and Environmental Eng. Arizona State University. Tempe, ASU.
Hristovski, K. D. (2007) Applications of Nanotechnology in Environmental Engineering:
Arsenic Removal, PhD dissertation, Civil and Environmental Eng. Arizona State University. Tempe.
Hristovski, K. D., P. Westerhoff, T. Möller, P. Sylvester, W. Condit, H. Mash,
“Simultaneous Removal of Perchlorate and Arsenate by Ion Exchange Media Modified with Nanostructured Iron (Hydr)Oxide” Journal of Hazardous Materials (in-press)
Jekel, M. and R. Seith (2000). Comparison of Conventional and New Techniques for the
Removal of Arsenic in a Full Scale Water Treatment Plant. AWWA Inorganics Conference (Feb. 28-29), Albuquerque, NM.
Lackovic, J. A., N. P. Nikolaidis, et al. (2000). “Inorganic arsenic removal by zero-valent
iron.” Environmental Engineering Science 17(1): 29-39. Lee, M. C., Snoeyink, V. L., & Crittenden, J. C. (1981). Activated carbon adsorption of
humic substances. Journal AWWA, 73 (8), 440-460. LeVan, D. M., Carta, G., & Yon, C. M. (1997). Adsorption and Ion Exchange, Chapter
16, in R. D. Perry, D. W. Green (eds), Perry;s Chemical Engineers’ Handbook (7th ed.), New York, USA: McGraw-Hill, 1997.
Lide, D.(ed). (2006). CRC Handbook of chemistry and physics (87th ed). Boca Raton,
Florida: Talor and Francis Group. Lin, T. F. and J. K. Wu (2001). “Adsorption of arsenite and arsenate within activated
alumina grains: Equilibrium and kinetics.” Water Research 35(8): 2049-2057.

71
Manning, B. A., M. L. Hunt, et al. (2002). “Arsenic(III) and Arsenic(V) reactions with zero-valent iron corrosion products.” Environmental Science & Technology 36(24): 5455-5461.
Matis, K. A., A. L. Zouboulis, et al. (1997). “Flotation removal of As(V) onto goethite.”
Environmental Pollution 97: 239-245. McNeill, L. S. and M. Edwards (1995). “Soluble Arsenic Removal At Water-Treatment
Plants.” Journal American Water Works Association 87(4): 105-113. McNeill, L. S. and M. Edwards (1997). “Arsenic removal during precipitate softening.”
Journal of Environmental Engineering-ASCE 123(5): 453-460. Meng, X. G., S. Bang, et al. (2002). “Chemical reactions between arsenic and zero-valent
iron in water.” Abstracts of Papers of the American Chemical Society 224: 052-ENVR.
Nriagu, J. O. and J. S. Lee (2002). Arsenic carbonate complexes in aqueous systems.
Biogeochemistry of Environmentally Important Trace Elements, American Chemical Society.
Pierce, M. L. and C. B. Moore (1982). “Adsorption of arsenite and arsenate on
amorphous iron hydroxide.” Water Research 16: 1247-1253. Pontius, F. W., K. G. Brown, et al. (1994). “Health Implications of Arsenic in Drinking-
Water.” Journal of American Water Works Association 86(9): 52-63. Raven, K. P., A. Jain, et al. (1998). “Arsenite and arsenate adsorption on ferrihydrite:
Kinetics, equilibrium, and adsorption envelopes.” Environmental Science & Technology 32(3): 344-349.
Reed, B., E., R. Vaughan, et al. (2000). “As(III), As(V), Hg, and Pb removal by Fe-oxide
impregnated activated carbon.” Journal of Environmental Engineering - ASCE 126(9): 869-873.
Reynolds, T. D. and P. A. Richards (1996). Unit Operations and Processes in
Environmental Engineering. Boston, PWS Publishing Company Rook, J. J. (1976). “Haloforms in drinking water.” Journal of American Water Works
Association 68(3): 168. Scott, K. N., J. F. Green, et al. (1995). “Arsenic Removal By Coagulation.” Journal
American Water Works Association 87(4): 114-126.

72
Sengupta, A.K., & Cumbal, L. H. (2005). Method of manufacture and use of hybrid anion exchanger for selective removal of contaminating fluids. US Patent Application 20050156136, July 21, 2005.
Selvin, N., G. Messham, et al. (2000). The Development of Granular Ferric Media-
Arsenic Removal and Additional Uses in Water Treatment. AWWA Water Quality Technology Conference, Salt Lake City.
Sinha, S., N. Lee, et al. (2002). Innovative technologies for arsenic removal. WQTC. Smedley, P. L. and D. G. Kinniburgh (2002). “A review of the source, behaviour and
distribution of arsenic in natural waters.” Applied Geochemistry 17(5): 517-568. Sontheimer, H., Crittenden, J. C., & Summers, S. (1988). Activated carbon for water
treatment (2nd ed.). Karlsruhe, Germany: DVGW-Forschungsstelle, Engler-Bunte Institut, Universitat Karlsruhe: 1988.
Su, C. M. and R. W. Puls (2001). “Arsenate and arsenite removal by zerovalent iron:
Kinetics, redox transformation, and implications for in situ groundwater remediation.” Environmental Science & Technology 35(7): 1487-1492.
Sylvester, P., P. Westerhoff, T. Moller, M. Badruzzaman and O. Boyd, "A hybrid sorbent
utilizing nanoparticles of hydrous iron oxide for arsenic removal from drinking water", P. Sylvester, Environmental Engineering Science, 24(1), 104-112 (2007a)
Sylvester, P. Sorbent for removal of contaminant from fluids, US Patent Application
20070080115, April 12, 2007b Wang, L., A. S. C. Chen, et al. (2002). “Field evaluation of As removal by IX and AA.”
Journal American Water Works Association 94(4): 161-173.

73
ABBREVIATIONS
As(III) Arsenite As(V) Arsenate ASU Arizona State University AZ Arizona BV Bed volume EBCTLC Empty bed contact time of large scale column EBCTSC Empty bed contact time of RSSCT column EDX Energy dispersive x-ray Fe Iron Fe-GAC Iron (hydr)oxide impregnated granular activated carbon ft Foot g gram GAC Granular activated carbon GC Gas chromatography GFAA Graphite furnace atomic absorption spectroscopy gpm Gallons per minute GW Groundwater K Freundlich isotherm adsorption coefficient L Liter LLNL Lawerence Livermore National Lab M Meter mL Milliliter MTBE Methyl tert-butyl ether NSFI National Sanitation Foundation International pHZPC pH of zero point of charge ppb parts per billion ppm parts per million q Adsorption capacity RSSCT Rapid small scale column test SEM Scanning electron microscopy

74
Si Silica TM Trademark Ti-GAC Titanium impregnated GAC TIP Titanium isopropoxide UVA254 Ultraviolet absorbance at 254 nm VOC Volatile organic chemical