Embed Size (px)
Citation preview
Submitted 1 May 2015Accepted 10 June 2015Published 2 July 2015
Corresponding authorEvgeni Mekov, dr [email protected]
Academic editorTeresa Seccia
Additional Information andDeclarations can be found onpage 13
DOI 10.7717/peerj.1068
Copyright2015 Mekov et al.
Distributed underCreative Commons CC-BY 4.0
OPEN ACCESS
Metabolic syndrome in hospitalizedpatients with chronic obstructivepulmonary diseaseEvgeni Mekov1, Yanina Slavova1, Adelina Tsakova2, Marianka Genova2,Dimitar Kostadinov1, Delcho Minchev1 and Dora Marinova1
1 Clinical Center for Pulmonary Diseases, Medical University—Sofia, Sofia, Bulgaria2 Central Clinical Laboratory, Medical University—Sofia, Sofia, Bulgaria
ABSTRACTIntroduction. The metabolic syndrome (MS) affects 21–53% of patients withchronic obstructive pulmonary disease (COPD) with a higher prevalence in theearly stages of COPD, with results being highly variable between studies. MS may alsoaffect natural course of COPD—number of exacerbations, quality of life and lungfunction.Aim. To examine the prevalence of MS and its correlation with comorbidities andCOPD characteristics in patients with COPD admitted for exacerbation.Material and methods. 152 patients with COPD admitted for exacerbation werestudied for presence of MS. All of them were also assessed for vitamin D statusand diabetes mellitus type 2 (DM). Data were gathered for smoking status andexacerbations during the last year. All patients completed CAT (COPD assessmenttest) and mMRC (Modified Medical Research Council Dyspnea scale) questionnairesand underwent spirometry. Duration of current hospital stay was recorded.Results. 25% of patients have MS. 23.1% of the male and 29.5% of the female patientshave MS (p > 0.05). The prevalence of MS in this study is significantly lower whencompared to a national representative study (44.6% in subjects over 45 years).69.1% of all patients and 97.4% from MS patients have arterial hypertension. Thepresence of MS is associated with significantly worse cough and sleep (1st and 7thCAT questions; p = 0.002 and p = 0.001 respectively) and higher total CAT score(p = 0.017). Average BMI is 27.31. None of the patients have MS and BMI <25.There is a correlation between the presence of MS and DM (p = 0.008) and with thenumber of exacerbations in the last year (p = 0.015). There is no correlation betweenthe presence of MS and the pulmonary function.Conclusion. This study among hospitalized COPD patients finds comparable butrelatively low prevalence of MS (25%) compared to previously published data(21–53%) and lower prevalence compared to general population (44.6%). MS mayimpact quality of life and the number of exacerbations of COPD. Having in mindthat MS is more common in the early stages and decreases with COPD progression,the COPD patients admitted for exacerbation may be considered as having advancedCOPD.
Subjects Diabetes and Endocrinology, Epidemiology, Internal Medicine, Respiratory MedicineKeywords Metabolic syndrome, COPD, Prevalence, Exacerbations, Quality of life
How to cite this article Mekov et al. (2015), Metabolic syndrome in hospitalized patients with chronic obstructive pulmonary disease.PeerJ 3:e1068; DOI 10.7717/peerj.1068
INTRODUCTIONChronic Obstructive Pulmonary Disease (COPD) is a preventable and treatable disease
with significant extrapulmonary effects that may contribute to the severity in individual
patients. By 2030, COPD will be the fourth cause of mortality worldwide. The extrapul-
monary comorbidities influence the prognosis of the patients with COPD (Global Initiative
for Chronic Obstructive Lung Disease , 2014).
Metabolic syndrome (MS) is common in patients with COPD. According to the
available studies the prevalence of MS in COPD patients varies between 21–53%
(Mekov & Slavova, 2013). The prevalence of MS in COPD patients is increased when
compared to a control group (Funakoshi et al., 2010; Lam et al., 2010; Marquis et al., 2002;
Park et al., 2012).
Available studies suggest that MS may have impact on quality of life (Ford & Li, 2008),
lung function (Fimognari et al., 2007; Leone et al., 2009; Lin et al., 2006; Nakajima et al.,
2008; Yeh et al., 2011), natural course of COPD (number of exacerbations) (Kupeli et al.,
2010; Abdelghaffar et al., 2012) as well as to affect comorbidities in COPD patients (Mekov
& Slavova, 2014).
Many studies examine prevalence of MS in COPD patients (Funakoshi et al., 2010;
Lam et al., 2010; Park et al., 2012; Kupeli et al., 2010; Akpinar et al., 2012; Marquis et al.,
2005; Minas et al., 2011; Ozgen Alpaydin et al., 2013; Poulain et al., 2008; Watz et al., 2009)
with results being highly variable between studies. The prevalence of MS in an unselected
Bulgarian population aged 20–80 years is 30.8%. The prevalence of MS for participants
over 45 years (the most common age group for the COPD patients) is higher, 44.6%
(Borissova et al., 2007). An epidemiological study conducted in Bulgaria in 3,598 COPD
patients showed that metabolic syndrome is found in 13.8% of the patients (Pavlov et al.,
2010). A more recent study indicates that the prevalence of metabolic syndrome is 41.8%
in 141 patients with COPD compared to 39% in the control group of 103 subjects (Stratev
et al., 2012). The prevalence of MS in COPD patients, hospitalized for exacerbation is
hard to predict because MS tends to be more prevalent in early stages of COPD while
patients experiencing severe exacerbation often have advanced disease. On the other side,
MS may impact natural course of COPD and predispose to exacerbation which will lead to
increased prevalence of MS in this group.
There is not enough data to determine whether the results from these studies are
applicable to specific subgroups of patients, such as COPD patients admitted for
exacerbation. COPD is increasingly divided in subgroups or phenotypes based on specific
features and association with prognosis or response to therapy, the most notable being
the feature of frequent exacerbations (Vestbo, 2014). The presence of MS may also have
distinctive characteristics for this subgroup (‘severe’ exacerbator phenotype). The aim
of this study is to find out the prevalence of MS in patients with COPD admitted for
exacerbation and the correlations of presence of MS with comorbidities and COPD
characteristics.
Mekov et al. (2015), PeerJ, DOI 10.7717/peerj.1068 2/17
MATERIAL AND METHODSA total of 152 COPD patients hospitalized for exacerbation were studied for the presence of
MS, DM, and vitamin D deficiency and insufficiency using well-established criteria for:
• Presence of MS: at least 3 of the following: 1. Elevated waist circumference >102 cm
in males, >88 cm in females; 2. Triglycerides >1.7 mmol/L (or on therapy); 3. HDL
<1.0 mmol/L in males, <1.3 mmol/L in females (or on therapy); 4. Elevated blood
pressure: systolic ≥130 and/or diastolic ≥85 mm Hg (or on therapy); 5. Fasting glucose
>5.5 mmol/L (or on therapy) (Alberti et al., 2009).
• Presence of DM: fasting plasma glucose ≥7.0 mmol/L OR 2-h plasma glucose
≥11.1 mmol/L during an oral glucose tolerance test (OGTT) OR HbA1c≥6.5% OR
on therapy (American Diabetes Association, 2012);
• Presence of prediabetes: fasting plasma glucose 5.6–6.9 mmol/L OR 2-h plasma
glucose 7.8–11.0 mmol/L during an OGTT OR HbA1c 5.7–6.4% (American Diabetes
Association, 2012);
• Presence of vitamin D deficiency: 25(OH)D <25 nmol/L; vitamin D insufficiency:
25(OH)D 25–50 nmol/L; vitamin D sufficiency: >50 nmol/L (Borissova et al., 2012).
The diagnosis of COPD was made according to GOLD (Global Initiative for Chronic
Obstructive Lung Disease) criteria (DM1). Data were gathered for age, sex, smoking status
and number of pack-years, number of bone fractures, therapy for arterial hypertension,
therapy for DM, COPD therapy and number of exacerbations in the last year. The
patients completed CAT and mMRC questionnaires and underwent pre- and post
bronchodilatatory spirometry. Blood pressure was obtained according to the American
Heart Association Guidelines (Pickering et al., 2005). A patient was considered as having
arterial hypertension if taking antihypertensives.
The inclusion criteria were post bronchodilator spirometry obstruction defined as
FEV1/FVC<0.70. All participants in this study signed informed consent.
The exclusion criteria were failure to comply with study procedures (no completed
questionnaires, no medical and demographic information, no spirometry, no lab tests) or
FEV1/FVC ratio >0.70 after administration of bronchodilator.
Smoking statusEvery participant was classified according to smoking status (Schoenborn & Adams, 2010):
Never smoker—never smoked a cigarette or who smoked fewer than 100 cigarettes in
their entire lifetime.
Former smoker—smoked at least 100 cigarettes in their entire life but were not currently
smoking.
Current smoker—had smoked at least 100 cigarettes in their entire life and were still
smoking.
Numbers of pack-years were calculated using the formula:
Number of pack-years = years of smoking × number of daily smoked cigarettes/20.
Mekov et al. (2015), PeerJ, DOI 10.7717/peerj.1068 3/17
Anthropometric indicesBody weight and height were measured and the body mass index (BMI) was calculated by
dividing weight by height squared (kg/m2). According to BMI all patients were classified
as underweight (<18.5), normal (18.5–24.99), overweight (25–29.99) and obese (>30).
Waist circumference was measured at the approximate midpoint between the lower margin
of the last palpable rib and the top of the iliac crest according to the WHO STEPS protocol
(WHO, 2008). Hip circumference was measured around the widest portion of the buttocks
(WHO, 2008). Body adiposity index (BAI) was calculated as:
Hip circumference (in cm)/ (Height (in m) X√
Height) − 18.
COPD exacerbations and duration of hospital stayData were gathered for number of severe exacerbations (hospitalizations) and moderate
exacerbations (antibiotic or/and systemic steroid treatment without hospitalization due to
worsening of pulmonary symptoms) (Global Initiative for Chronic Obstructive Lung Disease
, 2014) in the previous year. The duration of the current hospital stay was recorded.
Quality of lifeQuality of life was assessed with the mMRC scale and CAT questionnaire. Patients were in-
structed that there were no right or wrong answers. All patients’ questions were answered.
Patients were classified according to GOLD as having less symptoms (CAT < 10) and
breathlessness (mMRC grade 0–1) and more symptoms (CAT ≥ 10) and breathlessness
(mMRC grade ≥ 2). Because all patients were hospitalized due to exacerbation there were
only group C (high risk, less symptoms) and group D (high risk, more symptoms) patients
according to GOLD (Global Initiative for Chronic Obstructive Lung Disease , 2014).
Pulmonary function testing
The spirometry was performed using Minispir® New spirometer (MIR—Medical Interna-
tional Research, Rome, Italy). Patients were instructed to withdraw using short-acting
β2-agonists at least 6 h, long-acting β2-agonist at least 12 h, long acting muscarinic
antagonist 24 h and short acting muscarinic antagonist 12 h before the spirometry
(Miller et al., 2005). Post bronchodilator spirometry testing was performed 15–30 min
after inhalation of 400mcg Salbutamol according to ERS/ATS recommendations (Miller
et al., 2005). Pre- and post- values were obtained for: FVC, FEV1, FEV1/FVC, FEV6,
FEV1/FEV6, PEF, FEF2575, FEV3, FEV3/FVC as well as the difference between post/pre
values (delta values). GLI (Global Lungs Initiative) predicted values were used (GLI-2012).
Patient’s obstruction was classified according to the severity of airflow limitation based
on post-bronchodilator FEV1 as follows: mild (≥80% predicted); moderate (80>FEV1
≥ 50% predicted); severe (50%>FEV1≥30% predicted); very severe (<30% predicted)
(Global Initiative for Chronic Obstructive Lung Disease , 2014).
Mekov et al. (2015), PeerJ, DOI 10.7717/peerj.1068 4/17
Blood samples and analysesA venous blood sample was collected from each subject after a 12-h fasting. Blood samples
were taken as late as possible before discharging (usually on 6th or 7th day). Plasma
glucose, triglyceride (TG), high density lipoprotein (HDL), low density lipoprotein (LDL),
and total cholesterol (tChol) were measured with a Roche COBAS INTEGRA® 400 plus
analyzer and an enzymatic colorimetric assay and blood glucose was measured with an
enzymatic reference method with hexokinase. Vitamin D was measured with Elecsys
2010 (Roche, Basel, Switzerland) and Electro-chemiluminescence immunoassay (ECLIA).
Glycated hemoglobin (HbA1c) was measured with a NycoCard device and boronate
affinity assay. For patients without established DM a 75 g OGTT was performed with
blood samples for glucose taken on first and second hour.
Statistical analysisStatistical analysis was performed with the SPSS for Windows software, version 22.0
(SPSS Inc., Chicago, Illinois, USA). Continuous variables were presented as mean
± standard deviation and 95 Confidence intervals (95%CI) and categorical variables—as
percentages. Chi-square test was used to determine the associations between categorical
variables. Continuous variables were examined for normality by Shapiro–Wilk test.
For normally distributed variables, differences between the groups were determined by
independent-samples T test for two samples and analysis of variance (ANOVA) for more
than 2 samples. Mann–Whitney U test was used for abnormally distributed variables with
2 samples and Kruskal-Wallis test for variables with more than 2 samples. Regression
analyses were used to determine risk factors for presence of MS or the consequences of
having MS. Significance value (p-value) was set at 0.05.
All patients signed informed consent. Medical University-Sofia Research Ethics
Commission approved the study (#2976/2014).
RESULTSSample characteristicsA total of 152 COPD patients admitted for exacerbation were recruited from University
Specialized Hospital for Active Treatment of Pulmonary Diseases ‘Saint Sofia,’ Sofia,
Bulgaria. Mean age of patients in this study was 65 ± 10 years. 71.1% (108/152) were males,
28.9% (44/152) were females; mean post-bronchodilator FEV1 was 55.3 ± 19.5%. 15.8%
from the patients were never smokers, 57.9%—former smokers and 26.3%—current
smokers. 127 patients (83.6%) were receiving inhalatory corticosteroids.
Prevalence of MS25.0% (38/152) of the patients have MS. 23.1% (25/108) of males have MS vs. 29.5%
(13/44) of females but this difference is not statistically significant (Table 1). Mean age does
not differ between the patients with and without MS.
Fulfilled criteria for MS (in all and in MS patients) are shown in Table 2. Virtually all
(37/38) patients with MS in this study have arterial hypertension, followed by elevated
Mekov et al. (2015), PeerJ, DOI 10.7717/peerj.1068 5/17
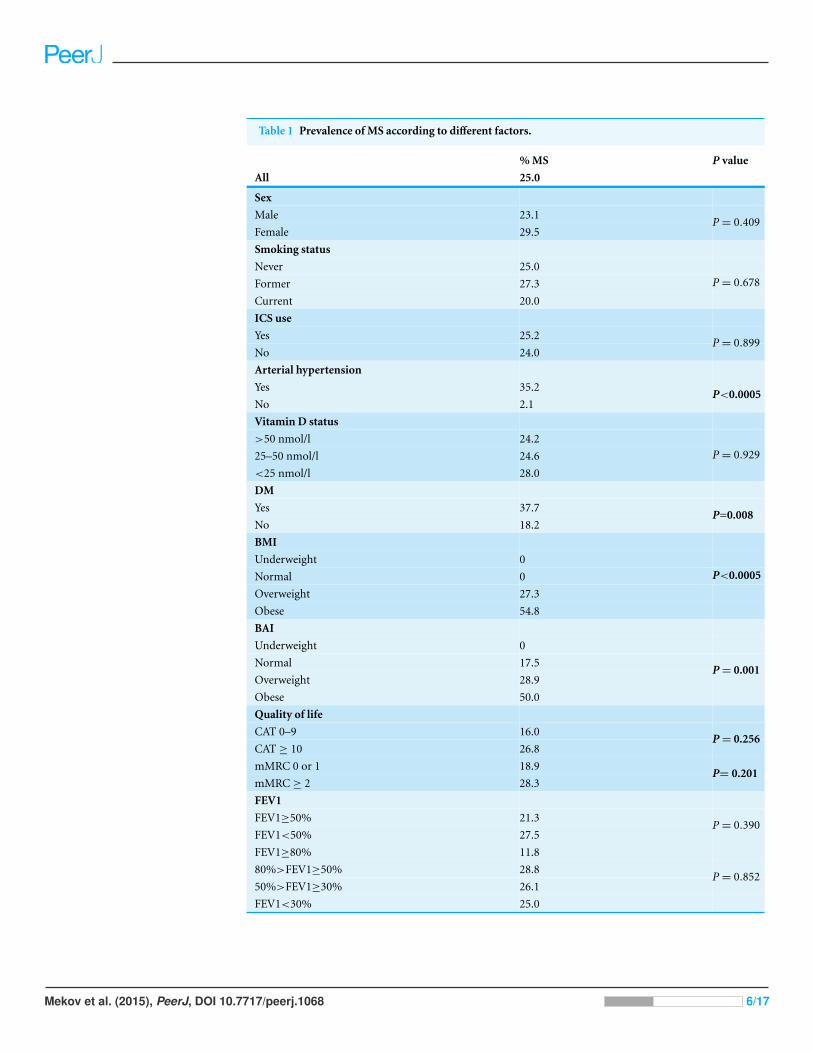
Table 1 Prevalence of MS according to different factors.
% MS P value
All 25.0
Sex
Male 23.1
Female 29.5P = 0.409
Smoking status
Never 25.0
Former 27.3
Current 20.0
P = 0.678
ICS use
Yes 25.2
No 24.0P = 0.899
Arterial hypertension
Yes 35.2
No 2.1P<0.0005
Vitamin D status
>50 nmol/l 24.2
25–50 nmol/l 24.6
<25 nmol/l 28.0
P = 0.929
DM
Yes 37.7
No 18.2P=0.008
BMI
Underweight 0
Normal 0
Overweight 27.3
P<0.0005
Obese 54.8
BAI
Underweight 0
Normal 17.5
Overweight 28.9
Obese 50.0
P = 0.001
Quality of life
CAT 0–9 16.0
CAT ≥ 10 26.8P = 0.256
mMRC 0 or 1 18.9
mMRC ≥ 2 28.3P= 0.201
FEV1
FEV1≥50% 21.3
FEV1<50% 27.5P = 0.390
FEV1≥80% 11.8
80%>FEV1≥50% 28.8
50%>FEV1≥30% 26.1
FEV1<30% 25.0
P = 0.852
Mekov et al. (2015), PeerJ, DOI 10.7717/peerj.1068 6/17
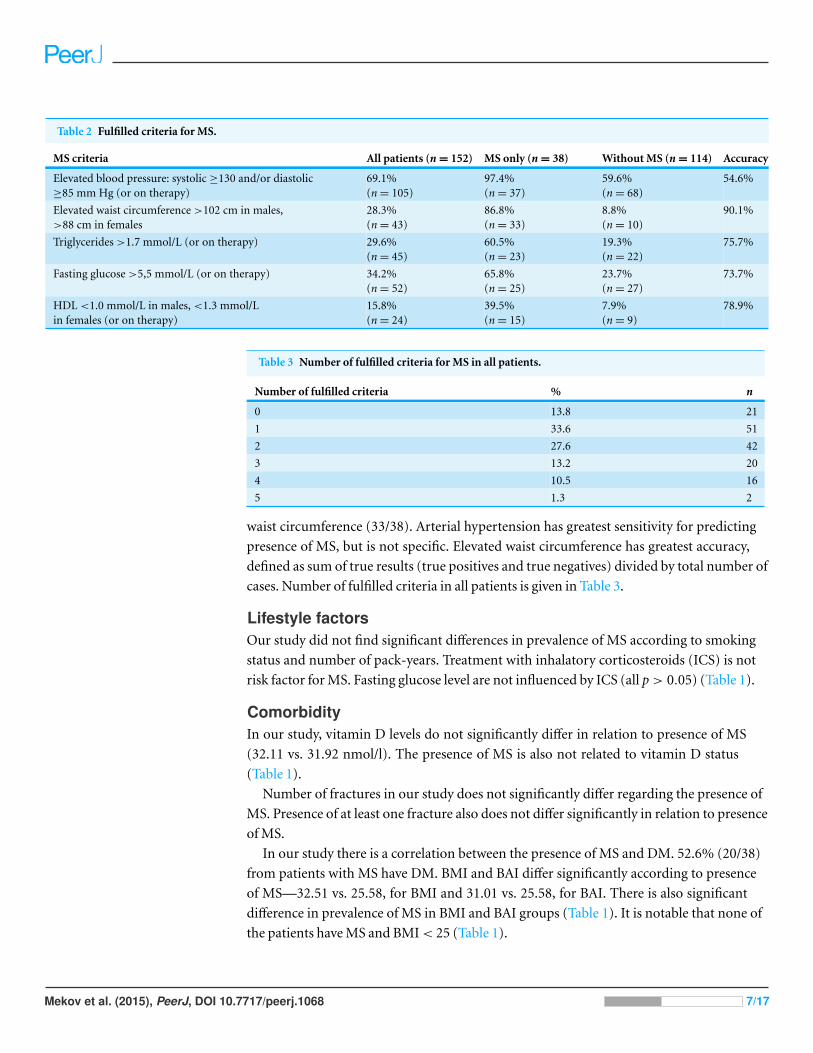
Table 2 Fulfilled criteria for MS.
MS criteria All patients (n = 152) MS only (n = 38) Without MS (n = 114) Accuracy
Elevated blood pressure: systolic ≥130 and/or diastolic≥85 mm Hg (or on therapy)
69.1%(n = 105)
97.4%(n = 37)
59.6%(n = 68)
54.6%
Elevated waist circumference >102 cm in males,>88 cm in females
28.3%(n = 43)
86.8%(n = 33)
8.8%(n = 10)
90.1%
Triglycerides >1.7 mmol/L (or on therapy) 29.6%(n = 45)
60.5%(n = 23)
19.3%(n = 22)
75.7%
Fasting glucose >5,5 mmol/L (or on therapy) 34.2%(n = 52)
65.8%(n = 25)
23.7%(n = 27)
73.7%
HDL <1.0 mmol/L in males, <1.3 mmol/Lin females (or on therapy)
15.8%(n = 24)
39.5%(n = 15)
7.9%(n = 9)
78.9%
Table 3 Number of fulfilled criteria for MS in all patients.
Number of fulfilled criteria % n
0 13.8 21
1 33.6 51
2 27.6 42
3 13.2 20
4 10.5 16
5 1.3 2
waist circumference (33/38). Arterial hypertension has greatest sensitivity for predicting
presence of MS, but is not specific. Elevated waist circumference has greatest accuracy,
defined as sum of true results (true positives and true negatives) divided by total number of
cases. Number of fulfilled criteria in all patients is given in Table 3.
Lifestyle factorsOur study did not find significant differences in prevalence of MS according to smoking
status and number of pack-years. Treatment with inhalatory corticosteroids (ICS) is not
risk factor for MS. Fasting glucose level are not influenced by ICS (all p > 0.05) (Table 1).
ComorbidityIn our study, vitamin D levels do not significantly differ in relation to presence of MS
(32.11 vs. 31.92 nmol/l). The presence of MS is also not related to vitamin D status
(Table 1).
Number of fractures in our study does not significantly differ regarding the presence of
MS. Presence of at least one fracture also does not differ significantly in relation to presence
of MS.
In our study there is a correlation between the presence of MS and DM. 52.6% (20/38)
from patients with MS have DM. BMI and BAI differ significantly according to presence
of MS—32.51 vs. 25.58, for BMI and 31.01 vs. 25.58, for BAI. There is also significant
difference in prevalence of MS in BMI and BAI groups (Table 1). It is notable that none of
the patients have MS and BMI < 25 (Table 1).
Mekov et al. (2015), PeerJ, DOI 10.7717/peerj.1068 7/17
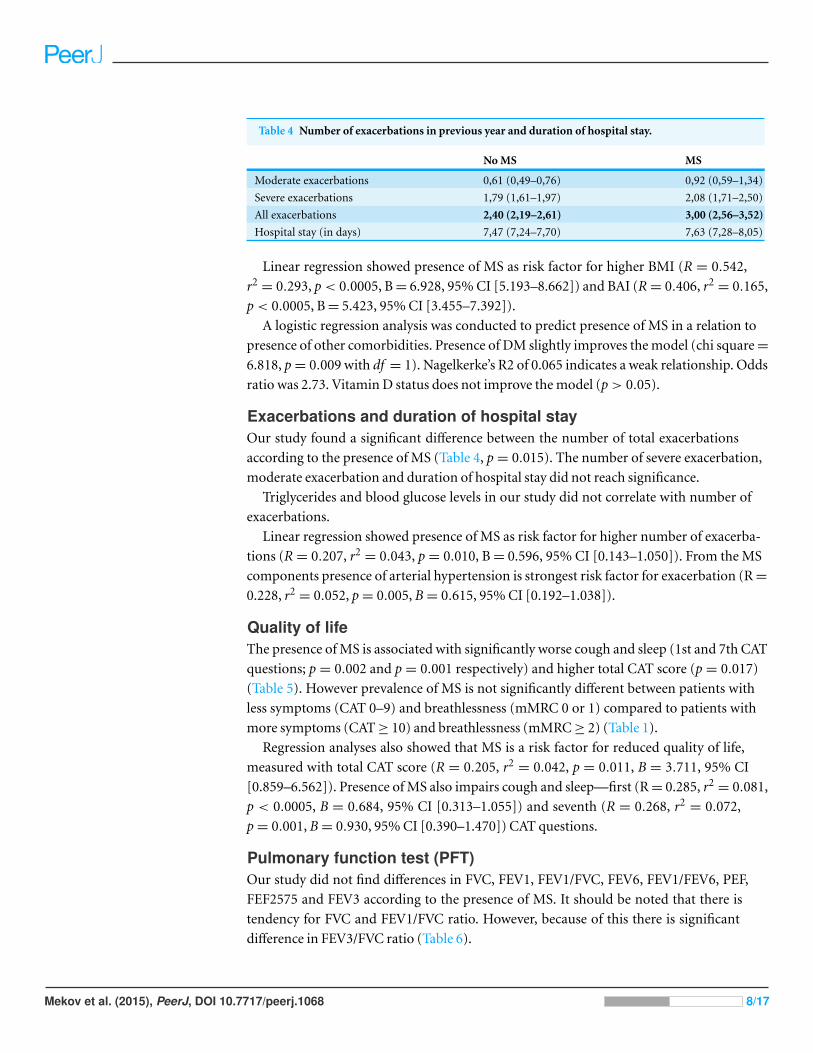
Table 4 Number of exacerbations in previous year and duration of hospital stay.
No MS MS
Moderate exacerbations 0,61 (0,49–0,76) 0,92 (0,59–1,34)
Severe exacerbations 1,79 (1,61–1,97) 2,08 (1,71–2,50)
All exacerbations 2,40 (2,19–2,61) 3,00 (2,56–3,52)
Hospital stay (in days) 7,47 (7,24–7,70) 7,63 (7,28–8,05)
Linear regression showed presence of MS as risk factor for higher BMI (R = 0.542,
r2= 0.293, p < 0.0005, B = 6.928, 95% CI [5.193–8.662]) and BAI (R = 0.406, r2
= 0.165,
p < 0.0005, B = 5.423, 95% CI [3.455–7.392]).
A logistic regression analysis was conducted to predict presence of MS in a relation to
presence of other comorbidities. Presence of DM slightly improves the model (chi square =
6.818, p = 0.009 with df = 1). Nagelkerke’s R2 of 0.065 indicates a weak relationship. Odds
ratio was 2.73. Vitamin D status does not improve the model (p > 0.05).
Exacerbations and duration of hospital stayOur study found a significant difference between the number of total exacerbations
according to the presence of MS (Table 4, p = 0.015). The number of severe exacerbation,
moderate exacerbation and duration of hospital stay did not reach significance.
Triglycerides and blood glucose levels in our study did not correlate with number of
exacerbations.
Linear regression showed presence of MS as risk factor for higher number of exacerba-
tions (R = 0.207, r2= 0.043, p = 0.010, B = 0.596, 95% CI [0.143–1.050]). From the MS
components presence of arterial hypertension is strongest risk factor for exacerbation (R =
0.228, r2= 0.052, p = 0.005, B = 0.615, 95% CI [0.192–1.038]).
Quality of lifeThe presence of MS is associated with significantly worse cough and sleep (1st and 7th CAT
questions; p = 0.002 and p = 0.001 respectively) and higher total CAT score (p = 0.017)
(Table 5). However prevalence of MS is not significantly different between patients with
less symptoms (CAT 0–9) and breathlessness (mMRC 0 or 1) compared to patients with
more symptoms (CAT ≥ 10) and breathlessness (mMRC ≥ 2) (Table 1).
Regression analyses also showed that MS is a risk factor for reduced quality of life,
measured with total CAT score (R = 0.205, r2= 0.042, p = 0.011, B = 3.711, 95% CI
[0.859–6.562]). Presence of MS also impairs cough and sleep—first (R = 0.285, r2= 0.081,
p < 0.0005, B = 0.684, 95% CI [0.313–1.055]) and seventh (R = 0.268, r2= 0.072,
p = 0.001, B = 0.930, 95% CI [0.390–1.470]) CAT questions.
Pulmonary function test (PFT)Our study did not find differences in FVC, FEV1, FEV1/FVC, FEV6, FEV1/FEV6, PEF,
FEF2575 and FEV3 according to the presence of MS. It should be noted that there is
tendency for FVC and FEV1/FVC ratio. However, because of this there is significant
difference in FEV3/FVC ratio (Table 6).
Mekov et al. (2015), PeerJ, DOI 10.7717/peerj.1068 8/17
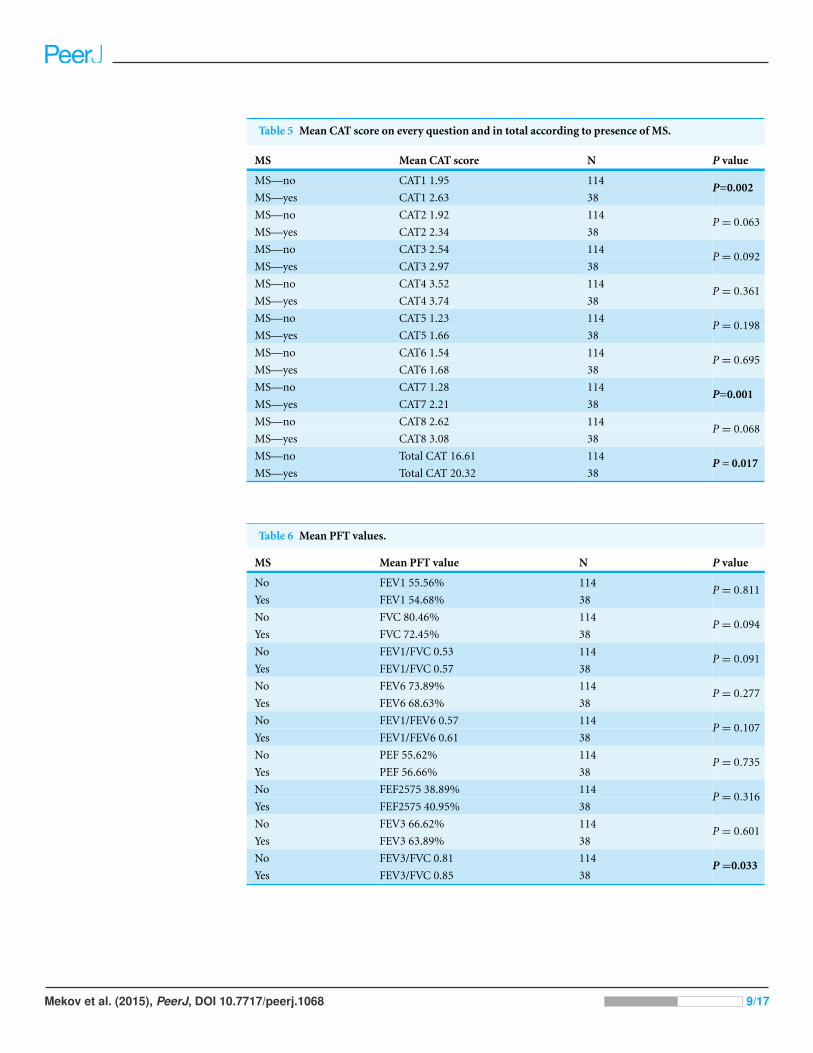
Table 5 Mean CAT score on every question and in total according to presence of MS.
MS Mean CAT score N P value
MS—no CAT1 1.95 114
MS—yes CAT1 2.63 38P=0.002
MS—no CAT2 1.92 114
MS—yes CAT2 2.34 38P = 0.063
MS—no CAT3 2.54 114
MS—yes CAT3 2.97 38P = 0.092
MS—no CAT4 3.52 114
MS—yes CAT4 3.74 38P = 0.361
MS—no CAT5 1.23 114
MS—yes CAT5 1.66 38P = 0.198
MS—no CAT6 1.54 114
MS—yes CAT6 1.68 38P = 0.695
MS—no CAT7 1.28 114
MS—yes CAT7 2.21 38P=0.001
MS—no CAT8 2.62 114
MS—yes CAT8 3.08 38P = 0.068
MS—no Total CAT 16.61 114
MS—yes Total CAT 20.32 38P = 0.017
Table 6 Mean PFT values.
MS Mean PFT value N P value
No FEV1 55.56% 114
Yes FEV1 54.68% 38P = 0.811
No FVC 80.46% 114
Yes FVC 72.45% 38P = 0.094
No FEV1/FVC 0.53 114
Yes FEV1/FVC 0.57 38P = 0.091
No FEV6 73.89% 114
Yes FEV6 68.63% 38P = 0.277
No FEV1/FEV6 0.57 114
Yes FEV1/FEV6 0.61 38P = 0.107
No PEF 55.62% 114
Yes PEF 56.66% 38P = 0.735
No FEF2575 38.89% 114
Yes FEF2575 40.95% 38P = 0.316
No FEV3 66.62% 114
Yes FEV3 63.89% 38P = 0.601
No FEV3/FVC 0.81 114
Yes FEV3/FVC 0.85 38P =0.033
Mekov et al. (2015), PeerJ, DOI 10.7717/peerj.1068 9/17
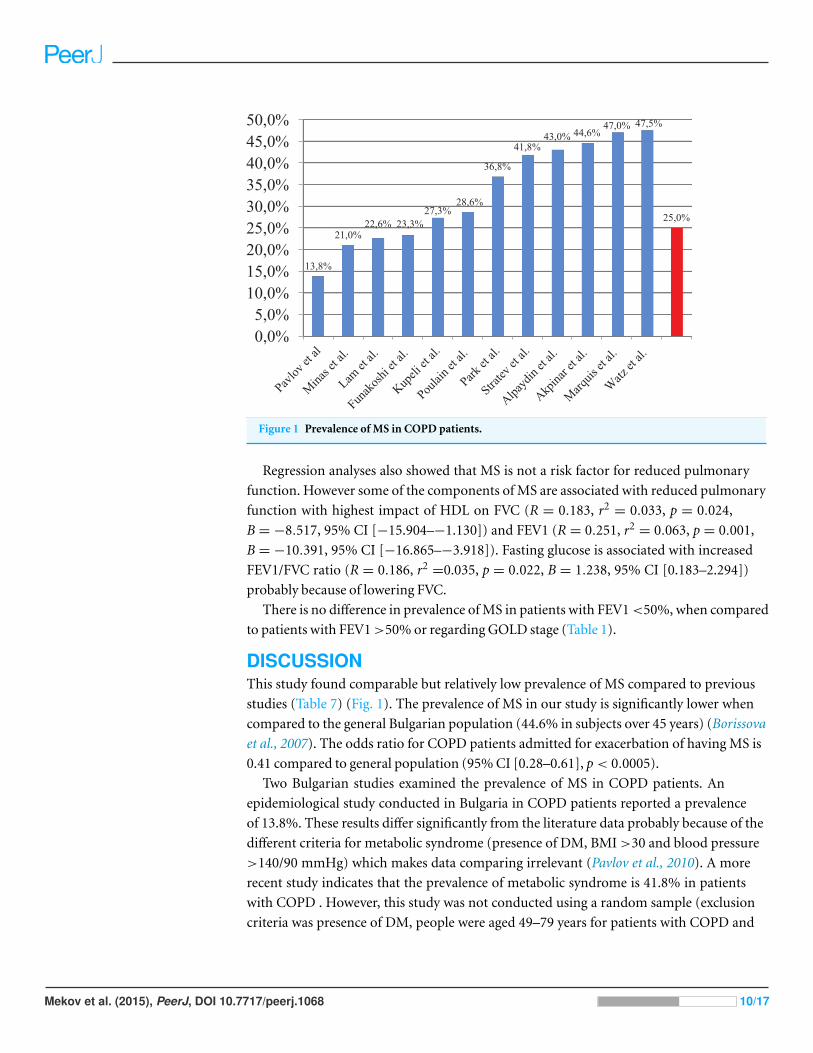
Figure 1 Prevalence of MS in COPD patients.
Regression analyses also showed that MS is not a risk factor for reduced pulmonary
function. However some of the components of MS are associated with reduced pulmonary
function with highest impact of HDL on FVC (R = 0.183, r2= 0.033, p = 0.024,
B = −8.517, 95% CI [−15.904–−1.130]) and FEV1 (R = 0.251, r2= 0.063, p = 0.001,
B = −10.391, 95% CI [−16.865–−3.918]). Fasting glucose is associated with increased
FEV1/FVC ratio (R = 0.186, r2=0.035, p = 0.022, B = 1.238, 95% CI [0.183–2.294])
probably because of lowering FVC.
There is no difference in prevalence of MS in patients with FEV1 <50%, when compared
to patients with FEV1 >50% or regarding GOLD stage (Table 1).
DISCUSSIONThis study found comparable but relatively low prevalence of MS compared to previous
studies (Table 7) (Fig. 1). The prevalence of MS in our study is significantly lower when
compared to the general Bulgarian population (44.6% in subjects over 45 years) (Borissova
et al., 2007). The odds ratio for COPD patients admitted for exacerbation of having MS is
0.41 compared to general population (95% CI [0.28–0.61], p < 0.0005).
Two Bulgarian studies examined the prevalence of MS in COPD patients. An
epidemiological study conducted in Bulgaria in COPD patients reported a prevalence
of 13.8%. These results differ significantly from the literature data probably because of the
different criteria for metabolic syndrome (presence of DM, BMI >30 and blood pressure
>140/90 mmHg) which makes data comparing irrelevant (Pavlov et al., 2010). A more
recent study indicates that the prevalence of metabolic syndrome is 41.8% in patients
with COPD . However, this study was not conducted using a random sample (exclusion
criteria was presence of DM, people were aged 49–79 years for patients with COPD and
Mekov et al. (2015), PeerJ, DOI 10.7717/peerj.1068 10/17

Table 7 Prevalence of MS in patients with COPD.
Authors N Studied population Prevalence of MS
Akpinar et al., 2012 133 Patients with COPD and controls 44.6%
Funakoshi et al., 2010 7.189 Men aged 45–88 years 16.8%, OR 0.72 (95% CI [0.51–1.02]) in GOLD I;28.7%, OR 1.33 (95% CI [1.01–1.76]) in GOLDII–IV
Kupeli et al., 2010 106 Hospitalized patients with COPD 27.3%
Lam et al., 2010 7.358 General population >50 years 22.6%; OR 1.47 (95% CI [1.12–1.92])
Marquis et al., 2005 72 Patients with COPD and controls 47%
Minas et al., 2011 114 Men with COPD 21%
Ozgen Alpaydin et al., 2013 90 Patients with COPD and controls 43%
Park et al., 2012 1.215 Patients with COPD and controls >40 years 33% vs. 22.2% for men; 48.5% vs. 29.6% for womenOR 2.03 (95% CI [1.08–3.80])
Poulain et al., 2008 28 Patients with COPD Overweight—50%; Normal weight—0%.
Watz et al., 2009 200 Patients with COPD and chronic bronchitis GOLD I—50%; GOLD II—53%; GOLD III—37%;GOLD IV—44%; Chronic bronchitis—53%
35–65 years for controls) (Stratev et al., 2012). Nonetheless it uses similar criteria for MS
and when comparing the results our study finds lower prevalence of MS.
The prevalence results could be explained with differences between the populations in
different studies (physical activity, diet, lifestyle etc.). For example, Bulgaria is low-income
country, which may impact diet preferences and treatment choices. Furthermore, patients
in this study had been hospitalized due to exacerbation, which represents the most severe
group of COPD patients. Having in mind that MS is more common in the early stages
and decreases with COPD progression (Watz et al., 2009), COPD patients hospitalized for
exacerbation may be considered as having advanced COPD.
According to the NHANES III study, smokers are more likely to develop MS than
nonsmokers in general population, and the risk increases with the number of pack-years
even after adjusting for covariates (Park et al., 2003). Our study did not find significant
differences in prevalence of MS according to smoking status and number of pack-years.
These results could be explained with smoke being the biggest factor in developing COPD
and effect of developing MS could be reduced. Moreover nicotine may be an appetite
suppressant and lower the weight thus decreasing prevalence of metabolic syndrome
(Chiolero et al., 2008). Third, hospitalized COPD patients are patients with predominantly
advanced disease and prone to cachexia and wasting. Also, lifestyle changes (quiting
smoking) in the presence of the two diseases should be considered which may change
the prevalence of MS.
Treatment with inhalatory corticosteroids (ICS) is not risk factor for MS similar to
findings for DM (O’Byrne et al., 2012) and fasting glucose level are not influenced by ICS.
COPD is a disease that affects mainly the lungs, but is characterized by systemic
inflammation and a number of extrapulmonary manifestations. Only 1/3 of patients with
COPD die due to respiratory failure. Main cause of death is lung cancer and cardiovascular
complications (Calverley et al., 2007).
Mekov et al. (2015), PeerJ, DOI 10.7717/peerj.1068 11/17
The vast majority of patients with COPD have a vitamin D deficiency (Romme et al.,
2013). Aside from its role in the metabolism of calcium and phosphorus, vitamin D is
involved in the pathogenesis of multiple diseases, including MS, mainly because it affects
the secretion and the function of insulin (Ju, Jeong & Kim, 2014). However, in our study
vitamin D levels do not significantly differ in relation to presence of MS. Presence of MS is
also not related to vitamin D status.
There are no studies that examine the relationship between osteoporosis and MS in
patients with COPD. However, both diseases share common risk factors such as smoking,
lack of physical activity, and treatment with corticosteroids. Some of the components of the
metabolic syndrome (arterial hypertension, elevated triglycerides, reduced HDL choles-
terol) are risk factors for low bone density. Systemic inflammation in MS plays a role in
the pathogenesis of osteoporosis (McFarlane, 2006). On the other hand, studies examining
the relationship between MS and osteoporosis showed inconsistent results, probably due
to the protective effect of obesity (Zhou et al., 2013). However, the number of fractures in
our study does not significantly differ regarding the presence of MS. The presence of at least
one fracture also does not differ significantly in relation to presence of MS.
Most patients with DM have MS, but the opposite is not necessarily true (Ginsberg &
Stalenhoef, 2003). The presence of MS in this study is associated with presence of DM,
higher BMI and BAI.
Hyperglycemia is associated with elevated glucose concentrations in tissues and
bronchial aspirates where it may stimulate infection by enhancing bacterial growth and
by promoting bacterial interaction with the airway epithelium (Brennan et al., 2007).
Hyperglycemia also impairs both innate and adaptive immunity, suppressing the host
response to infection.
The presence of MS in patients with COPD increases the frequency of exacerbations (2.4
vs. 0.7) and their duration–(7.5 vs. 5.0 days) according to Kupeli et al. (2010), and 8 versus
5.5 days, according to Abdelghaffar et al. (2012). Our study found a significant difference
between the number of total exacerbations according to the presence of MS. However, the
number of severe exacerbation, moderate exacerbation and duration of hospital stay did
not differ significantly. Triglycerides and blood glucose levels in our study did not correlate
with number of exacerbations as reported by other authors (Kupeli et al., 2010).
The presence of MS is associated with significantly worse cough and sleep and higher
total CAT score. This confirms the data about reduced quality of life in patients with MS
(Ford & Li, 2008). However, the prevalence of MS is not significantly different between
patients with less symptoms (CAT 0–9) and breathlessness (mMRC 0 or 1) compared to
patients with more symptoms (CAT ≥10) and breathlessness (mMRC ≥2). These mixed
results may be explained with COPD having higher negative impact on quality of life than
MS (physical limitation due to shortness of breath) as suggested for DM (Arne, Janson &
Janson, 2009), and ameliorating the effect in patients having both diseases.
COPD is characterized by airflow obstruction, which is not fully reversible. MS is
associated with a reduction of lung volumes (Fimognari et al., 2007; Leone et al., 2009;
Lin et al., 2006; Nakajima et al., 2008; Yeh et al., 2011). It should be noted that some studies
Mekov et al. (2015), PeerJ, DOI 10.7717/peerj.1068 12/17

found no association between lung function and the presence of MS (Yamamoto et al.,
2014). MS in our study is not associated with worsen pulmonary function. There is also no
difference in prevalence of MS in patients with FEV1 <50%, when compared to patients
with FEV1 >50% or regarding GOLD stage.
CONCLUSIONSThis study finds a 25% prevalence of MS in COPD patients admitted for exacerbation,
which is significantly lower than the general population. MS is more prevalent in females,
but the gender difference is not statistically significant. In this study, most of the patients
are former smokers, and the prevalence of MS does not differ regarding smoking status and
treatment with ICS.
The presence of MS is associated with the presence of DM, higher BMI and BAI, more
exacerbations during the previous year and lower quality of life. MS is not associated with
increased hospital stay and lower pulmonary function.
This study finds comparable but relatively low prevalence of MS compared to previously
published data (21–53%). As MS is more common in the early stages and decreases with
COPD progression, the COPD patients admitted for exacerbation may be considered as
having advanced COPD.
ADDITIONAL INFORMATION AND DECLARATIONS
FundingThis manuscript is part of a PhD project, which is partially funded by Medical University—
Sofia, Sofia, Bulgaria (grant number 15-D/2014, project number 22-D/2014). The
funders had no role in study design, data collection and analysis, decision to publish, or
preparation of the manuscript.
Grant DisclosuresThe following grant information was disclosed by the authors:
Medical University—Sofia: 15-D/2014.
Competing InterestsThe authors declare there are no competing interests.
Author Contributions• Evgeni Mekov conceived and designed the experiments, performed the experiments,
analyzed the data, contributed reagents/materials/analysis tools, wrote the paper,
prepared figures and/or tables, reviewed drafts of the paper.
• Yanina Slavova conceived and designed the experiments, contributed
reagents/materials/analysis tools, wrote the paper, reviewed drafts of the paper.
• Adelina Tsakova and Marianka Genova performed the experiments, contributed
reagents/materials/analysis tools, reviewed drafts of the paper.
Mekov et al. (2015), PeerJ, DOI 10.7717/peerj.1068 13/17
• Dimitar Kostadinov and Delcho Minchev contributed reagents/materials/analysis tools,
reviewed drafts of the paper.
• Dora Marinova contributed reagents/materials/analysis tools, wrote the paper, reviewed
drafts of the paper.
Human EthicsThe following information was supplied relating to ethical approvals (i.e., approving body
and any reference numbers):
Medical University-Sofia Research Ethics Commission approved the study
(#2976/2014).
Data DepositionThe following information was supplied regarding the deposition of related data:
http://figshare.com/articles/MS in COPD/1439301.
REFERENCESAbdelghaffar H, Tangour E, Fenniche S, Fekih L, Greb D, Akrout I, Hassene H, Ben
Hamad W, Kammoun H, Belhabib D, Megdiche M. 2012. Relation between metabolicsyndrome and acute exacerbation of COPD. European Respiratory Journal 40(Suppl.56):886s. DOI 10.1183/09031936.00197511.
Akpinar EE, Akpinar S, Ertek S, Sayin E, Gulhan M. 2012. Systemic inflammation and metabolicsyndrome in stable COPD patients. Tuberk Toraks 60(3):230–237 DOI 10.5578/tt.4018.
Alberti KGMM, Eckel RH, Grundy SM, Zimmet PZ, Cleeman JI, Donato KA, Fruchart J-C,James PT, Loria CM, Smith Jr SC. 2009. Harmonizing the metabolic syndrome: a jointinterim statement of the International Diabetes Federation Task Force on Epidemiology andPrevention; National Heart, Lung, and Blood Institute; American Heart Association; WorldHeart Federation; International Atherosclerosis Society; and International Association for theStudy of Obesity. Circulation 120:1640–1645 DOI 10.1161/CIRCULATIONAHA.109.192644.
American Diabetes Association. 2012. Diagnosis and classification of diabetes mellitus. DiabetesCare 35:S64–S71 DOI 10.2337/dc12-s064.
Arne M, Janson C, Janson S. 2009. Physical activity and quality of life in subjects withchronic disease: chronic obstructive pulmonary disease compared with rheumatoidarthritis and diabetes mellitus. Scandinavian Journal of Primary Health Care 27(3):141–147DOI 10.1080/02813430902808643.
Borissova A-M, Kovatcheva R, Shinkov A, Atanassova I, Vukov M, Aslanova N, Vlahov J,Dakovska L. 2007. Prevalence and features of the metabolic syndrome in unselected Bulgarianpopulation. Endocrinologia 12(2):68–77.
Borissova A-M, Shinkov A, Vlahov J, Dakovska L, Todorov L, Svinarov D, Kasabova L. 2012.Determination of the optimal level of 25(OH)D in the Bulgarian population. Endocrinologia17(3):135–142.
Brennan AL, Gyi KM, Wood DM, Johnson J, Holliman R, Baines DL, Philips BJ, Geddes DM,Hodson ME, Baker EH. 2007. Airway glucose concentrations and effect on growthof respiratory pathogens in cystic fibrosis. Journal of Cystic Fibrosis 6:101–109DOI 10.1016/j.jcf.2006.03.009.
Mekov et al. (2015), PeerJ, DOI 10.7717/peerj.1068 14/17
Calverley PM, Anderson JA, Celli B, Ferguson G, Jenkins C, Jones P, Yates J, Vestbo J. 2007.Salmeterol and fluticasone propionate and survival in chronic obstructive pulmonary disease.New England Journal of Medicine 356:775–789 DOI 10.1056/NEJMoa063070.
Chiolero A, Faeh D, Paccaud F, Cornuz J. 2008. Consequences of smoking for body weight,body fat distribution, and insulin resistance. The American Journal of Clinical Nutrition87(4):801–809.
Fimognari FL, Pasqualetti P, Moro L, Franco A, Piccirillo G, Pastorelli R, Rossini PM,Incalzi RA. 2007. The association between metabolic syndrome and restrictive ventilatorydysfunction in older persons. The Journals of Gerontology Series A: Biological Sciences andMedical Sciences 62:760–765 DOI 10.1093/gerona/62.7.760.
Ford E, Li C. 2008. Metabolic syndrome and health-related quality of life among U.S. adults.Annals of Epidemiology 18(3):165–171 DOI 10.1016/j.annepidem.2007.10.009.
Funakoshi Y, Omori H, Mihara S, Marubayashi T, Katoh T. 2010. Association between airflowobstruction and the metabolic syndrome or its components in Japanese men. Internal Medicine49:2093–2099 DOI 10.2169/internalmedicine.49.3882.
Ginsberg HN, Stalenhoef AF. 2003. The metabolic syndrome: targeting dyslipidaemia to reducecoronary risk. Journal of Cardiovascular Risk 10:121–128DOI 10.1097/00043798-200304000-00007.
Global Initiative for Chronic Obstructive Lung Disease (GOLD). 2014. Available at http://www.goldcopd.org/ (accessed 20 April 2015).
Ju S, Jeong H, Kim H. 2014. Blood vitamin D status and metabolic syndrome in the general adultpopulation: a dose–response meta-analysis. Journal of Clinical Endocrinology and Metabolism99(3):1053–1063 DOI 10.1210/jc.2013-3577.
Kupeli E, Ulubay G, Ulasli SS, Sahin T, Erayman Z, Gursoy A. 2010. Metabolic syndrome isassociated with increased risk of acute exacerbation of COPD: a preliminary study. Endocrine38:76–82 DOI 10.1007/s12020-010-9351-3.
Lam KB, Jordan RE, Jiang CQ, Thomas GN, Miller MR, Zhang WS, Lam TH, Cheng KK,Adab P. 2010. Airflow obstruction and metabolic syndrome: the Guangzhou Biobank CohortStudy. European Respiratory Journal 35:317–323 DOI 10.1183/09031936.00024709.
Leone N, Courbon D, Thomas F, Bean K, Jego B, Leynaert B, Guize L, Zureik M. 2009.Lung function impairment and metabolic syndrome: the critical role of abdominalobesity. American Journal of Respiratory and Critical Care Medicine 179:509–516DOI 10.1164/rccm.200807-1195OC.
Lin WY, Yao CA, Wang HC, Huang KC. 2006. Impaired lung function is associated with obesityand metabolic syndrome in adults. Obesity 14:1654–1661 DOI 10.1038/oby.2006.190.
Marquis K, Debigare R, Lacasse Y, LeBlanc P, Jobin J, Carrier G, Maltais F. 2002. Midthighmuscle cross-sectional area is a better predictor of mortality than body mass index in patientswith chronic obstructive pulmonary disease. American Journal of Respiratory and Critical CareMedicine 166:809–813 DOI 10.1164/rccm.2107031.
Marquis K, Maltais F, Duguay V, Bezeau AM, LeBlanc P, Jobin J, Poirier P. 2005. The metabolicsyndrome in patients with chronic obstructive pulmonary disease. Journal of CardiopulmonaryRehabilitation 25:226–232 DOI 10.1097/00008483-200507000-00010.
McFarlane SI. 2006. Bone metabolism and the cardiometabolic syndrome: pathophysiologicinsights. Journal of the CardioMetabolic Syndrome 1:53–57DOI 10.1111/j.0197-3118.2006.05457.x.
Mekov E, Slavova Y. 2013. Diabetes mellitus and metabolic syndrome in COPD—part 1:introduction and epidemiology. Thoracic Medicine 5(4):6–18.
Mekov et al. (2015), PeerJ, DOI 10.7717/peerj.1068 15/17

Mekov E, Slavova Y. 2014. Diabetes mellitus and metabolic syndrome in COPD—part 3:consequences. Thoracic Medicine 6(4):23–36.
Miller MR, Hankinson J, Brusasco V, Burgos F, Casaburi R, Coates A, Crapo R, Enright P,Van der Grinten C, Gustafsson P, Jensen R, Johnson D, MacIntyre N, McKay R, Navajas D,Pedersen O, Pellegrino R, Viegi G, Wanger J. 2005. Standardisation of spirometry. EuropeanRespiratory Journal 26:319–338 DOI 10.1183/09031936.05.00034805.
Minas M, Kostikas K, Papaioannou AI, Mystridou P, Karetsi E, Georgoulias P, Liakos N,Pournaras S, Gourgoulianis KI. 2011. The association of metabolic syndrome withadipose tissue hormones and insulin resistance in patients with COPD withoutco-morbidities. COPD: Journal of Chronic Obstructive Pulmonary Disease 8:414–420DOI 10.3109/15412555.2011.619600.
Nakajima K, Kubouchi Y, Muneyuki T, Ebata M, Eguchi S, Munakata H. 2008. A possibleassociation between suspected restrictive pattern as assessed by ordinary pulmonary functiontest and the metabolic syndrome. Chest 134:712–718 DOI 10.1378/chest.07-3003.
O’Byrne PM, Rennard S, Gerstein H, Radner F, Peterson S, Lindberg B, Carlsson LG, Sin DD.2012. Risk of new onset diabetes mellitus in patients with asthma or COPD taking inhaledcorticosteroids. Respiratory Medicine 106(11):1487–1493 DOI 10.1016/j.rmed.2012.07.011.
Ozgen Alpaydin A, Konyar Arslan I, Serter S, Sakar Coskun A, Celik P, Taneli F, Yorgancioglu A.2013. Metabolic syndrome and carotid intima-media thickness in chronic obstructive pul-monary disease. Multidisciplinary Respiratory Medicine 8(1):61 DOI 10.1186/2049-6958-8-61.
Park BH, Park MS, Chang J, Kim SK, Kang YA, Jung JY, Kim YS, Kim C. 2012. Chronicobstructive pulmonary disease and metabolic syndrome: a nationwide survey in Korea.International Journal of Tuberculosis and Lung Disease 16:694–700 DOI 10.5588/ijtld.11.0180.
Park Y-W, Zhu S, Palaniappan L, Heshka S, Carnethon M, Heymsfield S. 2003. The metabolicsyndrome prevalence and associated risk factor findings in the US population from the thirdnational health and nutrition examination survey, 1988–1994. Archives of Internal Medicine163(4):427–436 DOI 10.1001/archinte.163.4.427.
Pavlov P, Ivanov Y, Glogovska P, Popova T, Borissova E, Hristova P. 2010. Metabolic syndromeand COPD. European Respiratory Journal 36(Suppl. 54):66s.
Pickering TG, Hall JE, Appel LJ, Falkner BE, Graves J, Hill MN, Jones DW, Kurtz T, Sheps SG,Roccella EJ. 2005. Subcommittee of Professional and Public Education of the American HeartAssociation Council on High Blood Pressure Research. Recommendations for blood pressuremeasurement in humans and experimental animals. Part 1: blood pressure measurement inhumans. Hypertension 45:142–161 DOI 10.1161/01.HYP.0000150859.47929.8e.
Poulain M, Doucet M, Drapeau V, Fournier G, Tremblay A, Poirier P, Maltais F. 2008. Metabolicand inflammatory profile in obese patients with chronic obstructive pulmonary disease. ChronicRespiratory Disease 5:35–41 DOI 10.1177/1479972307087205.
Romme EA, Rutten EP, Smeenk FW, Spruit MA, Menheere PP, Wouters EF. 2013. VitaminD status is associated with bone mineral density and functional exercise capacity inpatients with chronic obstructive pulmonary disease. Annals of Medicine 45(1):91–96DOI 10.3109/07853890.2012.671536.
Schoenborn CA, Adams PF. 2010. Health behaviors of adults: United States, 2005–2007. NationalCenter for Health Statistics. Vital Health Statistics 10(245):79–80. Available at http://www.cdc.gov/nchs/data/series/sr 10/sr10 245.pdf.
Stratev V, Petev J, Galcheva S, Peneva M. 2012. Chronic inflammation and metabolic syndrome(MS) in patients with chronic obstructive pulmonary disease (COPD). Thoracic Medicine4(3):50–57.
Mekov et al. (2015), PeerJ, DOI 10.7717/peerj.1068 16/17

Vestbo J. 2014. COPD: definition and phenotypes. Clinics in Chest Medicine 35(1):1–6DOI 10.1016/j.ccm.2013.10.010.
Watz H, Waschki B, Kirsten A, Muller KC, Kretschmar G, Meyer T, Holz O, Magnussen H.2009. The metabolic syndrome in patients with chronic bronchitis and COPD: frequencyand associated consequences for systemic inflammation and physical inactivity. Chest136:1039–1046 DOI 10.1378/chest.09-0393.
WHO. 2008. WHO STEPwise approach to surveillance (STEPS). Geneva: World HealthOrganization (WHO). Available at http://www.who.int/chp/steps/en/.
Yamamoto Y, Oya J, Nakagami T, Uchigata Y. 2014. Association between lung function andmetabolic syndrome independent of insulin in Japanese men and women. Japanese ClinicalMedicine 5:1–8 DOI 10.4137/JCM.S13564.
Yeh F, Dixon AE, Marion S, Schaefer C, Zhang Y, Best LG, Calhoun D, Rhoades ER, Lee ET.2011. Obesity in adults is associated with reduced lung function in metabolic syndrome anddiabetes: the strong heart study. Diabetes Care 34:2306–2313 DOI 10.2337/dc11-0682.
Zhou J, Zhang Q, Yuan X, Wang J, Li C, Sheng H, Qu S, Li H. 2013. Associationbetween metabolic syndrome and osteoporosis: a meta-analysis. Bone 57(1):30–35DOI 10.1016/j.bone.2013.07.013.
Mekov et al. (2015), PeerJ, DOI 10.7717/peerj.1068 17/17