Embed Size (px)
Citation preview

Menu Analysis & Engineering
HRT383
Dinner Winter 09

04/18/23 HRT383 2
References
Mill, Robert Christie (1998) Restaurant Management: Customers, operations, and employees / Menu Scoring & Menu Engineering, pp 114-116. Upper Saddle River, N.J. : Prentice Hall.
Drysdale, John A. & Jennifer Adams Aldrich (2002). Profitable menu planning / Chapter 5: Menu Analysis, pp. 101-115. 3rd ed. Upper Saddle River, N.J. : Prentice Hall, TX911.3.M45 D79 2002
CD-ROM TX911.3.M45 D79 2002

04/18/23 HRT383 3
Objectives
By the completion of this presentation you should be able to: Analyze a menu for profitability Apply menu engineering to menu analysis
04/18/23 HRT383 4
Important Terms
Menu engineering Plowhorses Puzzles Stars Dogs

04/18/23 HRT383 5
Introduction
This presentation explains how to evaluate a menu
When measuring a menu to see if it is successful 2 criteria must be met to declare it a winner:
1. Must be profitable in terms of individual item profitability
2. Most profitable item must be selling the best.

04/18/23 HRT383 6
Stars, Plowhorses, Puzzles, & Dogs
Method, called menu engineering, developed by Donald Smith Ph.D., Westin Hotels Distinguished Professor at Washington State University
This method rates the menu by measuring each entrée as to its profitability (gross profit) and its sales. It then combines these measurements and places each menu item into one of four classifications.
Plow Horse
Dog
PuzzleStar
04/18/23 HRT383 7
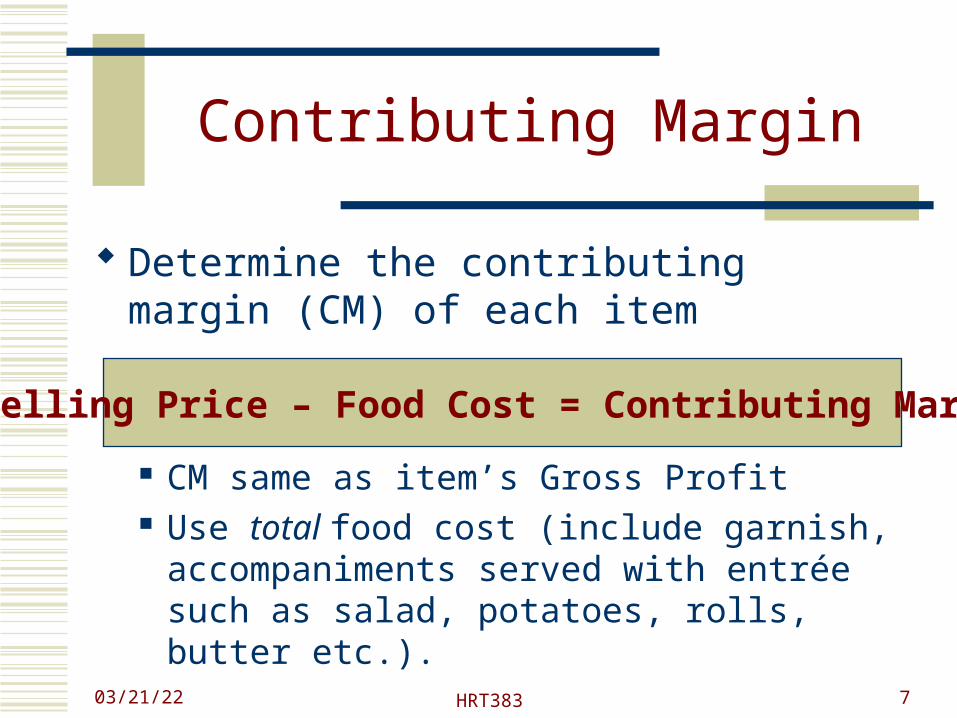
Contributing Margin
Determine the contributing margin (CM) of each item
CM same as item’s Gross Profit Use total food cost (include garnish,
accompaniments served with entrée such as salad, potatoes, rolls, butter etc.).
Selling Price – Food Cost = Contributing Margin

04/18/23 HRT383 8
Contribution MarginDollars vs. Food Cost Percentage
Steak Salmon Coffee
Selling Price $33.00 $23.00 $2.00
Cost $20.96 $7.12 $0.19
Food Cost % 63.52% 30.69% 9.5%
Cont. Margin $ $12.04 $15.88 $1.81

04/18/23 HRT383 9
Contribution MarginDollars vs. Food Cost Percentage
Which one will/should your server sell ?Steak Salmon Coffee
Selling Price $33.00 $23.00 $2.00
Cost $20.96 $7.12 $0.19
Food Cost % 63.52% 30.69% 9.5%
Cont. Margin $ $12.04 $15.88 $1.81

04/18/23 HRT383 10
Contribution MarginDollars vs. Food Cost Percentage
Which one will/should your server sell ?Steak Salmon Coffee
Selling Price $33.00 $23.00 $2.00
Cost $20.96 $7.12 $0.19
Food Cost % 63.52% 30.69% 9.5%
Cont. Margin $ $12.04 $15.88 $1.81

04/18/23 HRT383 11
Example

04/18/23 HRT383 12
Appetizers
Menu Plate
Contribu
tionQuantit
y Net Total
MENU ITEM Price Cost % Margin Sold Income Cost
Crab Cake 10.00 2.46 24.60% 7.54 54 540.00 132.84
Ravioli 7.00 1.95 27.86% 5.05 38 266.00 74.10
Duck 8.00 2.25 28.13% 5.75 22 176.00 49.50
En Croute 10.00 2.99 29.90% 7.01 27 270.00 80.73
Cheese 8.00 1.72 21.50% 6.28 15 120.00 25.80
SUBTOTAL APPETIZERS 43.00 11.3726.44
% 1171372.0
0 362.97

04/18/23 HRT383 13
Popularity
Average Popularity
80% of the average item sales per appetizer:
100 / 5 X 80% = 16%
Popularity of each menu item:
Number of portions sold divided by total number of meals sold
Crab Cake : 54 / 117 = 34.62%

04/18/23 HRT383 14
Popularity
Menu Plate
Contributio
nQuantit
y Net TotalPopulari
ty
MENU ITEM Price Cost % Margin SoldIncom
e Cost
Crab Cake 10.00 2.46 24.60% 7.54 54 540.00132.8
4 34.62%
Ravioli 7.00 1.95 27.86% 5.05 38 266.00 74.10 24.36%
Duck 8.00 2.25 28.13% 5.75 22 176.00 49.50 14.10%
En Croute 10.00 2.99 29.90% 7.01 27 270.00 80.73 17.31%
Cheese 8.00 1.72 21.50% 6.28 15 120.00 25.80 9.62%
SUBTOTAL APPETIZERS 43.00 11.37 26.44% $6.47 1561372.0
0362.9
7 16%

04/18/23 HRT383 15
HRT383 Dinner AppetizersPlowhorse
Star
*Crab Cake$7.75/34.62%
Dog Puzzle
100%
16%
Popularity
0 Contribution Margin $6.47

04/18/23 HRT383 16
HRT383 Dinner AppetizersPlowhorse
Star
*Crab Cake$7.75/34.62%
Dog Puzzle
100%
16%
Popularity
0 Contribution Margin $6.47
*Ravioli$5.05/24.36%
* Duck $5.75/14.10%
* En Croute$7.01/17.31%
*Cheese$6.28/9.62%

04/18/23 HRT383 17
Menu Engineering
Men
u Plate
Contri-
butionQuantit
y Net TotalPopularity Menu
MENU ITEMPric
e Cost %Margi
n SoldIncom
e Cost Engineering
Crab Cake10.0
0 2.4624.60
% 7.54 54540.0
0 132.84 34.62% STAR
Ravioli 7.00 1.9527.86
% 5.05 38266.0
0 74.10 24.36% Plow Horse
Duck 8.00 2.2528.13
% 5.75 22176.0
0 49.50 14.10% DOG
En Croute10.0
0 2.9929.90
% 7.01 27270.0
0 80.73 17.31% STAR
Cheese 8.00 1.7221.50
% 6.28 15120.0
0 25.80 9.62% DOG
SUBTOTAL APPETIZERS
43.00 11.37
26.44% $6.47 156
1372.00 362.97 16%

04/18/23 HRT383 18
The Four Key Menu Categories
Plowhorses are items that are relatively popular but have a high contribution margin. Items in this category can have their menu prices increased or the portion size cut in a attempt to increase CM. If market is price resistant
Stars have both high popularity and high CM Puzzles have relatively low popularity and high
margins; lower price. Dogs are both low in popularity and CM; eliminate

04/18/23 HRT383 19
HRT383 Dinner AppetizersPlowhorse
Star
*Crab Cake$7.75/34.62%
Dog Puzzle
100%
16%
Popularity
0 Contribution Margin $6.47
*Ravioli$5.05/24.36%
* Duck $5.75/14.10%
* En Croute$7.01/17.31%
*Cheese$6.28/9.62%
Increase $ $8 - ?Cut Portion ?
ELIMINATE ?
ELIMINATE ?

04/18/23 HRT383 20
Data Trap Winter 09
See Dinner Hand Out for Main Courses
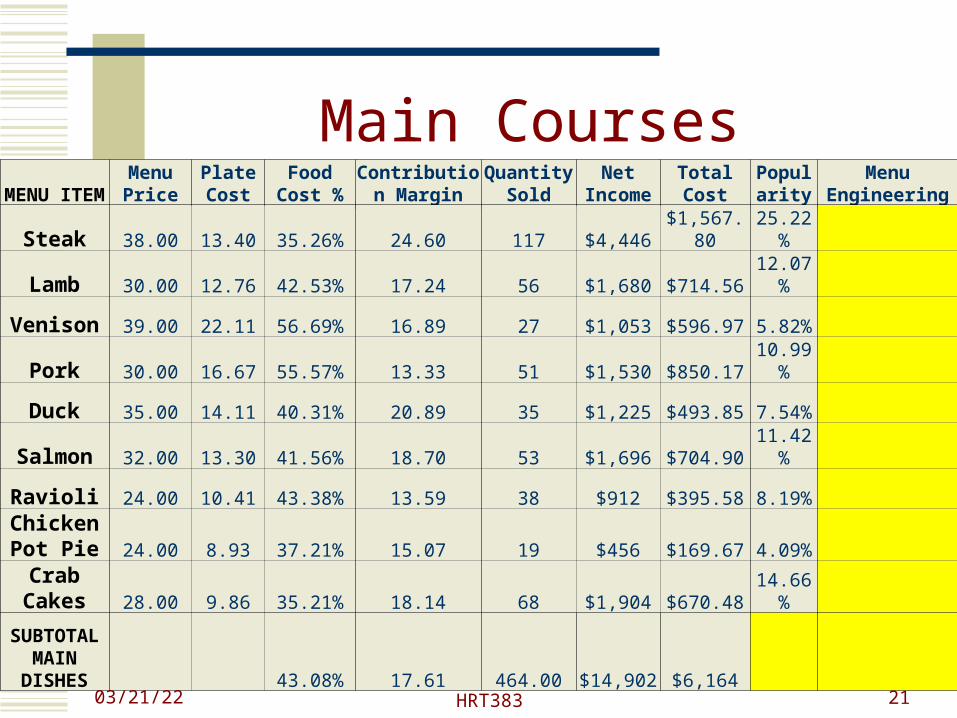
Main CoursesMENU ITEM
Menu Price
Plate Cost
Food Cost %
Contribution Margin
Quantity Sold
Net Income
Total Cost
Popularity
Menu Engineering
Steak 38.00 13.40 35.26% 24.60 117 $4,446$1,567.8
025.22
%
Lamb 30.00 12.76 42.53% 17.24 56 $1,680 $714.5612.07
% Venison 39.00 22.11 56.69% 16.89 27 $1,053 $596.97 5.82%
Pork 30.00 16.67 55.57% 13.33 51 $1,530 $850.1710.99
% Duck 35.00 14.11 40.31% 20.89 35 $1,225 $493.85 7.54%
Salmon 32.00 13.30 41.56% 18.70 53 $1,696 $704.9011.42
% Ravioli 24.00 10.41 43.38% 13.59 38 $912 $395.58 8.19%
Chicken Pot Pie 24.00 8.93 37.21% 15.07 19 $456 $169.67 4.09%
Crab Cakes 28.00 9.86 35.21% 18.14 68 $1,904 $670.48
14.66%
SUBTOTAL MAIN
DISHES 43.08% 17.61 464.00 $14,902 $6,164
04/18/23 HRT383 21

04/18/23 HRT383 22
Popularity
Average Popularity
80% of the average item sales per appetizer:
100 / 9 X 80% = 8.88%
Popularity of each menu item:
Number of portions sold divided by total number of meals sold
Steak:59 / 464= 25.22%

Main CoursesMENU ITEM
Menu Price
Plate Cost
Food Cost %
Contribution Margin
Quantity Sold
Net Income
Total Cost
Popularity
Menu Engineering
Steak 38.00 13.40 35.26% 24.60 117 $4,446$1,567.8
025.22
%
Lamb 30.00 12.76 42.53% 17.24 56 $1,680 $714.5612.07
% Venison 39.00 22.11 56.69% 16.89 27 $1,053 $596.97 5.82%
Pork 30.00 16.67 55.57% 13.33 51 $1,530 $850.1710.99
% Duck 35.00 14.11 40.31% 20.89 35 $1,225 $493.85 7.54%
Salmon 32.00 13.30 41.56% 18.70 53 $1,696 $704.9011.42
% Ravioli 24.00 10.41 43.38% 13.59 38 $912 $395.58 8.19%
Chicken Pot Pie 24.00 8.93 37.21% 15.07 19 $456 $169.67 4.09%
Crab Cakes 28.00 9.86 35.21% 18.14 68 $1,904 $670.48
14.66%
SUBTOTAL MAIN
DISHES 43.08% 17.61 464.00 $14,902 $6,164 8.88%
04/18/23 HRT383 23

04/18/23 HRT383 24
Exercise
Please work with your fellow students and come up with suggestions/decisions.

04/18/23 HRT383 25
HRT383 Dinner M/CPlowhorse
Star
Dog
Puzzle
100%
8.88%
Popularity
0 Contribution Margin $17.61

Main CoursesMENU ITEM
Menu Price
Plate Cost
Food Cost %
Contribution Margin
Quantity Sold
Net Income
Total Cost
Popularity
Menu Engineering
Steak 38.00 13.40 35.26% 24.60 117 $4,446$1,567.8
025.22
%
Lamb 30.00 12.76 42.53% 17.24 56 $1,680 $714.5612.07
% Venison 39.00 22.11 56.69% 16.89 27 $1,053 $596.97 5.82%
Pork 30.00 16.67 55.57% 13.33 51 $1,530 $850.1710.99
% Duck 35.00 14.11 40.31% 20.89 35 $1,225 $493.85 7.54%
Salmon 32.00 13.30 41.56% 18.70 53 $1,696 $704.9011.42
% Ravioli 24.00 10.41 43.38% 13.59 38 $912 $395.58 8.19%
Chicken Pot Pie 24.00 8.93 37.21% 15.07 19 $456 $169.67 4.09%
Crab Cakes 28.00 9.86 35.21% 18.14 68 $1,904 $670.48
14.66%
SUBTOTAL MAIN
DISHES 43.08% 17.61 464.00 $14,902 $6,1648.88
%
04/18/23 HRT383 26

Main CoursesMENU ITEM
Menu Price
Plate Cost
Food Cost %
Contribution Margin
Quantity Sold
Net Income
Total Cost
Popularity
Menu Engineering
Steak 38.00 13.40 35.26% 24.60 117 $4,446$1,567.8
025.22
%
Lamb 30.00 12.76 42.53% 17.24 56 $1,680 $714.5612.07
% Venison 39.00 22.11 56.69% 16.89 27 $1,053 $596.97 5.82%
Pork 30.00 16.67 55.57% 13.33 51 $1,530 $850.1710.99
% Duck 35.00 14.11 40.31% 20.89 35 $1,225 $493.85 7.54%
Salmon 32.00 13.30 41.56% 18.70 53 $1,696 $704.9011.42
% Ravioli 24.00 10.41 43.38% 13.59 38 $912 $395.58 8.19%
Chicken Pot Pie 24.00 8.93 37.21% 15.07 19 $456 $169.67 4.09%
Crab Cakes 28.00 9.86 35.21% 18.14 68 $1,904 $670.48
14.66%
SUBTOTAL MAIN
DISHES 43.08% 17.61 464.00 $14,902 $6,1648.88
%
04/18/23 HRT383 27

04/18/23 HRT383 28
Main Courses
MENU ITEMMenu Price
Plate Cost
Food Cost %
Contribution
MarginQuantity Sold
Net Income
Total Cost
Popularity
Menu Engineering
Loin Steak 45.00 23.00 51.11% 22.00 59 $2,655$1,357.0
013.50
% STAR
Lamb 32.00 16.26 50.81% 15.74 64 $2,048$1,040.6
414.65
% STAR
Chicken 26.00 13.14 50.54% 12.86 42 $1,092 $551.88 9.61%PLOW
HORSE
Halibut 35.00 17.71 50.60% 17.29 57 $1,995$1,009.4
713.04
% STAR
Pork 30.00 15.00 50.00% 15.00 73 $2,190$1,095.0
016.70
% STAR
Ravioli 24.00 17.33 72.21% 6.67 32 $768 $554.56 7.32% DOG
Rabbit 28.00 14.85 53.04% 13.15 22 $616 $326.70 5.03% DOG
Paella 30.00 13.32 44.40% 16.68 35 $1,050 $466.20 8.01% PUZZLE
Duck 32.00 17.51 54.72% 14.49 53 $1,696 $928.0312.13
% PLOW HORSE
SUBTOTAL MAIN DISHES 53.05% 14.88 437.00 $14,110 $7,329 8.88%

Main CoursesMENU ITEM
Menu Price
Plate Cost
Food Cost %
Contribution Margin
Quantity Sold
Net Income
Total Cost
Popularity
Menu Engineering
Steak 38.00 13.40 35.26% 24.60 117 $4,446$1,567.8
025.22
% STAR
Lamb 30.00 12.76 42.53% 17.24 56 $1,680 $714.5612.07
%
Plow Horse
Venison 39.00 22.11 56.69% 16.89 27 $1,053 $596.97 5.82% DOG
Pork 30.00 16.67 55.57% 13.33 51 $1,530 $850.1710.99
%
Plow Horse
Duck 35.00 14.11 40.31% 20.89 35 $1,225 $493.85 7.54% PUZZLE
Salmon 32.00 13.30 41.56% 18.70 53 $1,696 $704.9011.42
% STARRavioli 24.00 10.41 43.38% 13.59 38 $912 $395.58 8.19% DOG
Chicken Pot Pie 24.00 8.93 37.21% 15.07 19 $456 $169.67 4.09% DOG
Crab Cakes 28.00 9.86 35.21% 18.14 68 $1,904 $670.48
14.66% STAR
SUBTOTAL MAIN
DISHES 43.08% 17.61 464.00 $14,902 $6,1648.88
% 04/18/23 HRT383 29

04/18/23 HRT383 30
The Four Key Menu Categories
Plowhorses are items that are relatively popular but have a high contribution margin. Items in this category can have their menu prices increased or the portion size cut in a attempt to increase CM. If market is price resistant
Stars have both high popularity and high CM Puzzles have relatively low popularity and high
margins; lower price. Dogs are both low in popularity and CM; eliminate

Main CoursesMENU ITEM Menu Price
Plate Cost
Food Cost
%Contribution Margin
Quantity Sold
Net Income
Total Cost
Popularity
Menu Engineering
Steak 38.00 13.4035.26
% 24.60 117 $4,446$1,567.8
025.22
% STAR
Lamb
Increase $Reduce size?
30.00 12.7642.53
% 17.24 56 $1,680 $714.5612.07
%
Plow Horse
VenisonEliminate?
39.00 22.1156.69
% 16.89 27 $1,053 $596.97 5.82% DOG
Pork
Increase $Reduce size?
30.00 16.6755.57
% 13.33 51 $1,530 $850.1710.99
%
Plow Horse
DuckLower $?
35.00 14.1140.31
% 20.89 35 $1,225 $493.85 7.54% PUZZLE
Salmon 32.00 13.3041.56
% 18.70 53 $1,696 $704.9011.42
% STAR
RavioliEliminate?
24.00 10.4143.38
% 13.59 38 $912 $395.58 8.19% DOG Chicken Pot Pie
Eliminate?24.00 8.93
37.21% 15.07 19 $456 $169.67 4.09% DOG
Crab Cakes 28.00 9.86
35.21% 18.14 68 $1,904 $670.48
14.66% STAR
SUBTOTAL MAIN
DISHES 43.08
% 17.61464.0
0 $14,902 $6,1648.88
% 31

04/18/23 HRT383 32
Up Selling
Your Favorite

04/18/23 HRT383 33
Placement
Two Schools of thought
1. Menu Sequence Menu should follow progression of meal
2. Focal Points Use focal points on the menu to push certain
menu items

04/18/23 HRT383 34
Focal Points
Focal Point
Focal Point
Single Sheet Menu Twofold Menu

04/18/23 HRT383 35
Focal Points
2
3
4
5
Focal Point
Threefold Menu
04/18/23 HRT383 36
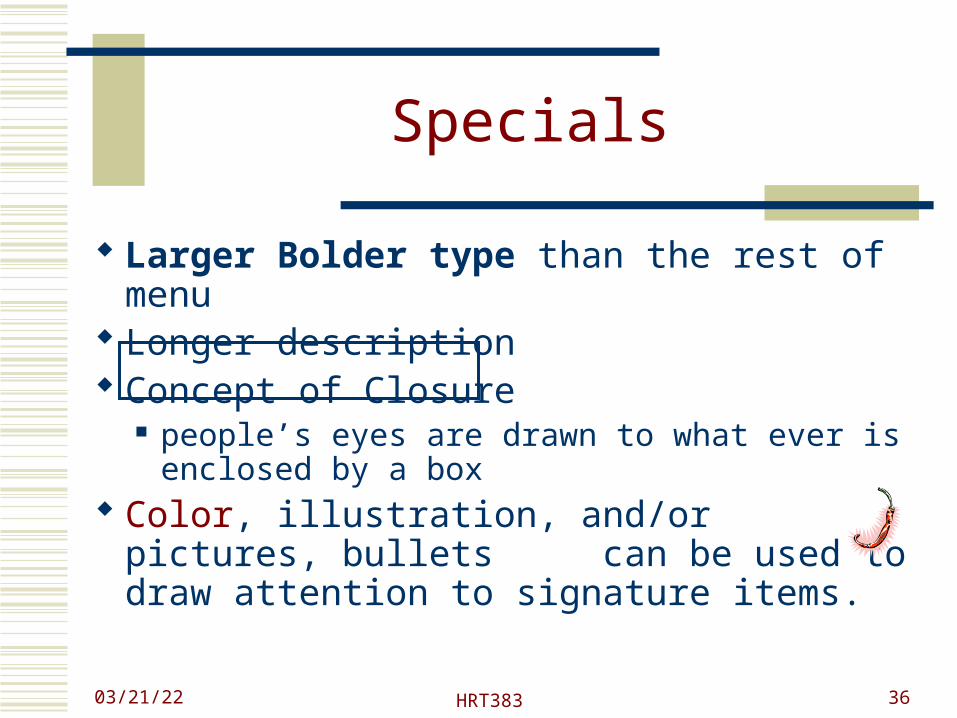
Specials
Larger Bolder type than the rest of menu Longer description Concept of Closure
people’s eyes are drawn to what ever is enclosed by a box
Color, illustration, and/or pictures, bullets can be used to draw attention to signature items.

04/18/23 HRT383 37
Branding
Fast food Coke / Pepsi TGIF Jack Daniels

04/18/23 HRT383 38
Menu Pricing
Odd-Cents pricing Majority of prices end in either a “5” or a “9”
Price rounding. Within certain price bands, price increases have
little negative impact on customers
Placement

04/18/23 HRT383 39
Price Placement
Baked Chicken……….$8.99
Lemon Sole………….$11.99
Lamb Steak………….$12.99
Swordfish Steak…..…$14.99
BAKED CHICKENTender pieces of chicken breast
$8.99
LEMON SOLEFresh filets sautéed with lemon caper sauce
$11.99
LAMB STEAK Center cut of lamb served on a bed of rice
$12.99
SWORDFISH STEAKCharcoal grilled served with beurre blanc
$14.99

04/18/23 HRT383 40
Price Placement
BAKED CHICKENTender pieces of chicken breast
Eight dollars and ninety nine cents
LEMON SOLEFresh filets sautéed with lemon caper sauce
Eleven dollars and ninety nine cents
LAMB STEAK Center cut of lamb served on a bed of rice
Twelve dollars and ninety nine cents
SWORDFISH STEAKCharcoal grilled served with beurre blanc
Fourteen dollars and ninety nine cents
04/18/23 HRT383 41
Conclusion
Menu analysis is important If demographic studies, internal capacities, cost cards, and
markups have been executed correctly, the score should be a good one
Analysis should be done using either the Smith or the Hurst methods to ascertain the profitability of the menu
If the analysis shows a poor menu, make improvements Good menu: first step has been taken toward running a
profitable operation. It’s just that simple

04/18/23 HRT383 42
Where to Get More Information
Mill, Robert Christie (1998) Restaurant Management: Customers, operations, and employees / Menu Scoring & Menu Engineering, pp 114-116. Upper Saddle River, N.J. : Prentice Hall.
Drysdale, John A. & Jennifer Adams Aldrich (2002). Profitable menu planning / Chapter 5: Menu Analysis, pp. 101-115. 3rd ed. Upper Saddle River, N.J. : Prentice Hall, TX911.3.M45 D79 2002
CD-ROM TX911.3.M45 D79 2002 Most Menu & F&B Management Books