Embed Size (px)
Citation preview

Memory ForensicsTHE THEORY

Forensics
Forensic science is the scientific method of gathering and examining information about the past.

Computer Forensics Is to examine digital media in a forensically sound manner with the aim of Identifying
Preserving
Recovering
Analyzing
And presenting Facts
and Opinions
about the digital information

Analysis ProcessPreparation
Acquisition
Identification
Extraction
Analysis
Reporting

Analysis Types
Storage Analysis
Volume Analysis
File system Analysis
Application Analysis
Database Analysis
Swap Analysis
Memory Analysis Network
Analysis

Analysis Types
Storage Analysis
Volume Analysis
File system Analysis
Application Analysis
Database Analysis
Swap Analysis
Memory Analysis Network
Analysis

Forensic TechniquesCross-drive Analysis
Live Analysis
File Recovery
Stochastic Analysis
Stegnograpy

SourcesPhysical Disks
Packet Capture
Swap/Pagefile
Hibernation File
Firmware
Volatile Memory

SourcesPhysical Disks
Packet Capture
Swap/Pagefile
Hibernation File
Firmware
Volatile Memory

MemoryStorage
Volatile
Temporary Data
Fast Access
RAMSwap/Pagefile

Memory AcquisitionAcquisition of Volatile Memory Contents (RAM) bit-by-bit to a Non-Volatile Storage (Image File).
Hardware Based ToolsWindowsSCOPE CaptureGUARD PCIe
Goldfish (Firewire/ Mac)
Software Based ToolsMemoryze
KntDD
FTKImager
LiME
OSXPMem
…
Requires Kernel Mode/Physical Access
Real(Physical) MemoryActual RAM Hardware
Shared◦ Devices
◦ Kernel
◦ Drivers
◦ Processes
System wide address space◦ Defined by H/W capability
Managed by OS Memory Manager

Virtual Memory An abstraction of Real Memory
Per-process Isolation Shared if required
Shared by processCode
Data
Per-process address spaceUser Mode
Kernel Mode
Managed by Process

Virtual Real MappingConversion of Virtual Address to Read Address
◦ RAM
◦ Swap/Pagefile
Page : Fixed size allocation unit◦ Virtual Memory
◦ Real Memory
Page Table◦ A table to convert virtual page to real page
Page Directory◦ A list of page tables
◦ Level2 Pages

32bit Address Space

Forensic Tools0th Generation
◦ Before 2004
◦ ‘strings’
◦ ‘grep’
1st Generation◦ 2004-2005
◦ Tools for structured analysis◦ Parsing OS structures
◦ Crash dump analysis

Forensic Tools2nd Generation
◦ 2005-2010
◦ Generic, automated tools
◦ Multiple OS support
◦ Volatality
◦ Rekall
3rd Generation◦ 2010 & Later
◦ Emphasis on Visualization
◦ Cloud/VM based
◦ MoonSols LiveCloudKd
◦ Microsoft LiveKd
VolatilityA advanced memory forensics framework.
Written in python.
Follows modular plug-in architecture.
Supports many systems and architectures.
Open source.
Current release 2.4.1
Community plugins to automate volatility.

Dump formatsAlso known as AddressSpaces in volatility
Define organization of memory content from H/W perspective◦ Virtual Real Mapping
◦ Location of PDE
Supported◦ intel (x86)
◦ amd64(x64)
◦ Crashbmp (Window Kernel Crash Dump)
◦ elfcoredump(Linux Core Dump)
◦ MachO (Mac OSX)
◦ vmem (VMWare/Vbox)

ProfilesOrganization/Location of memory content from Operating System perspective.
Locations of important Objects◦ KDBG
◦ _KPROCESS
◦ _EPROCESS
◦ PTE
◦ SSDT
◦ IDT
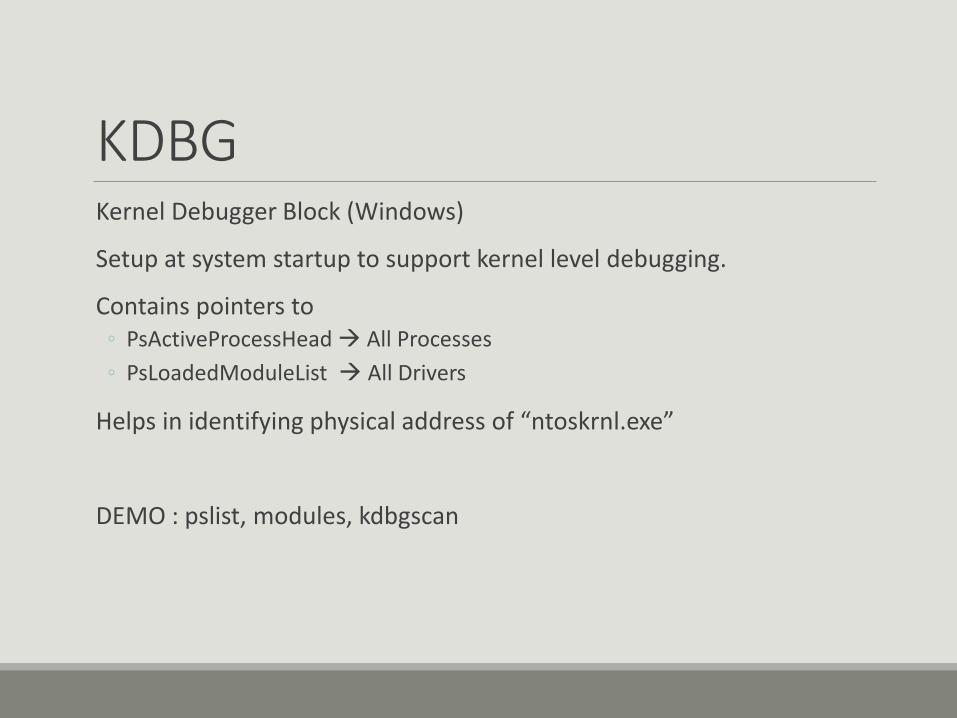
KDBGKernel Debugger Block (Windows)
Setup at system startup to support kernel level debugging.
Contains pointers to◦ PsActiveProcessHead All Processes
◦ PsLoadedModuleList All Drivers
Helps in identifying physical address of “ntoskrnl.exe”
DEMO : pslist, modules, kdbgscan

_EPROCESSExecutive Process Structure
Links to◦ PEB (User Mode Structure)
◦ _KPROCESS (Kernel Mode Structure)
KDBG->PsActiveProcessHead points to a list (LIST_ENTRY) of _EPROCESS structures
pslist traversed this list to discover all processes.

PEBProcess Environment Block
User mode part of _EPROCESS
Exclusive process access.
Pointers for◦ Ldr
◦ InInitializationOrderModuleList
◦ InLoadOrderModuleList
◦ InMemoryOrderModuleList
DEMO: “dlllist –p” traversed these lists to discover loaded modules.
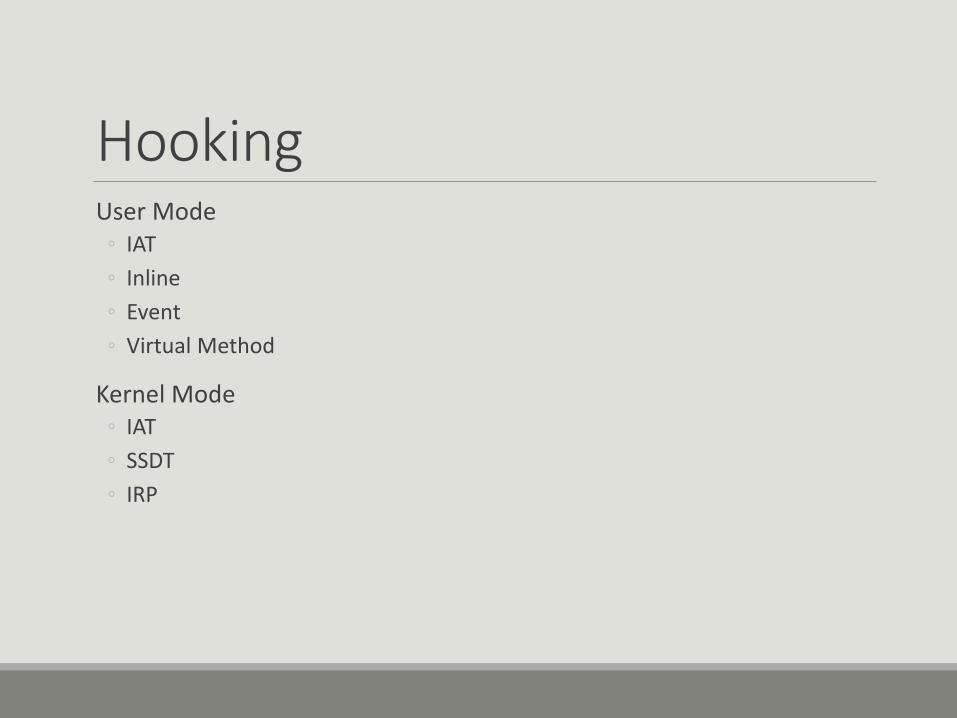
HookingUser Mode
◦ IAT
◦ Inline
◦ Event
◦ Virtual Method
Kernel Mode◦ IAT
◦ SSDT
◦ IRP

SSDTSystem Service Dispatcher Table
◦ Handling System Calls
SysemCall◦ A request to kernel for executing privileged code.◦ EAX System Call Number
SSDT ◦ Pointers to System Call handler routines◦ SystemCall Index in the table
Malware hooks(Overwrites) handler to hide itself.◦ Files◦ Registry Keys
_KTHREAD/_ETHREAD points to SST
DEMO: ssdt, theads

IDTInterrupt Descriptor Table
◦ List of interrupt handlers
◦ Interrupt number index
User Callable interrupts◦ Int3
◦ Int4
◦ …
Malwares hook(overwrite) to handle interrupts themselves◦ Intercept debugger breakpoints
DEMO: idt

Anti ForensicsUnlinking PEB->Ldr.* listsHide selected DLL from Loaded Modules List.
ldrmodules indicates dlls missing from lists
Unlinking _EPROCESS listUnlink _EPROCESS to hide selected process from taskmanager.
Defeated by correlating from Active Threads list.
Unlinking PsLoadedModuleListCan hide Drivers from showing up in list

ChallengesMalwares running is kernel mode can interfere with dumping process
◦ Omit selected pages
◦ Omit selected structures
◦ Corrupt output
Footprints of dumping process.
Unavailability of Swap/Pagefile.

THATSITFORNOW